Monitoring of ecological responses to the delivery of ...
124
Monitoring of ecological responses to the delivery of Commonwealth environmental water in the lower River Murray, during 2011-12 Final report prepared by the South Australian Research and Development Institute, Aquatic Sciences, for Commonwealth Environmental Water Office June 2015
Transcript of Monitoring of ecological responses to the delivery of ...

Monitoring of ecological responses to the
delivery of Commonwealth
environmental water in the lower River
Murray, during 2011-12
Final report prepared by the South Australian Research and Development
Institute, Aquatic Sciences, for Commonwealth Environmental Water Office
June 2015
II
Ye, Q.1, Aldridge, K.2, Bucater, L.1, Bice, C.1, Busch, B.2, Cheshire, K.J.M1, Fleer,
D.1, Hipsey, M.3, Leigh, S.J.1, Livore, J.P.1,Nicol, J.1, Wilson, P.J. 1 and Zampatti,
B.P. 1(2015). Monitoring of ecological responses to the delivery of
Commonwealth environmental water in the lower River Murray, during 2011-
12. Final report prepared for Commonwealth Environmental Water Office.
South Australian Research and Development Institute, Aquatic Sciences.
1 SARDI Aquatics Sciences 2 The University of Adelaide 3 The University of Western Australia
This monitoring project was commissioned by the Commonwealth
Environmental Water Office to the South Australian Research and
Development Institute (SARDI), Aquatic Sciences. The component of ‘salt and
nutrient transport’ monitoring and modelling was sub-contracted to the
University of Adelaide and the University of Western Australia. The project was
funded by the Commonwealth Environmental Water Office with in kind
contribution from the South Australian Environmental Protection Authority
(EPA) and the Department of Environment, Water and Natural Resources
(DEWNR).
Copyright
© Copyright Commonwealth of Australia, 2015
‘Monitoring of ecological responses to the delivery of Commonwealth
environmental water in the lower River Murray, during 2011-12’ is licensed by
the Commonwealth of Australia for use under a Creative Commons By
Attribution 3.0 Australia licence with the exception of the Coat of Arms of the
Commonwealth of Australia, the logo of the agency responsible for publishing
the report, content supplied by third parties, and any images depicting
people. For licence conditions see:
http://creativecommons.org/licenses/by/3.0/au/

III
This report should be attributed as ‘Monitoring of ecological responses to the
delivery of Commonwealth environmental water in the lower River Murray,
during 2011-12, Commonwealth of Australia 2015’.
The Commonwealth of Australia has made all reasonable efforts to identify
content supplied by third parties.
Disclaimer
The views and opinions expressed in this publication are those of the authors
and do not necessarily reflect those of the Australian Government or the
Minister for the Environment.
While reasonable efforts have been made to ensure that the contents of this
publication are factually correct, the Commonwealth does not accept
responsibility for the accuracy or completeness of the contents, and shall not
be liable for any loss or damage that may be occasioned directly or indirectly
through the use of, or reliance on, the contents of this publication.
Cover Images:
Source of the photo of the lower River Murray: DEWNR
Source of the photos of larval fishes and research vessel Tandanus: SARDI

Ye, Q. et al. (2015) Monitoring of ecological responses to the delivery of CEW in the
lower River Murray during 2011-12
IV SARDI Aquatic Sciences
ACKNOWLEDGEMENTS
This study was funded by the Commonwealth Environmental Water
Office (CEWO) in 2011-12 with in kind contribution from the Environment
Protection Authority (EPA) South Australia.
For the salt and nutrient transport study, data for the Lower Lakes was
provided by the South Australian Department of Environment, Water
and Natural Resources (DEWNR) and EPA as part of the South
Australian Government's $610 million Murray Futures program funded
by the Australian Government's Water for the Future initiative. The
model used has previously been developed and validated for Land
and Water Australia, SA Water, DEWNR and EPA.
For the larval fish assemblage study, previous years’ data (2005-06 to
2008-09 and 2010-11) were collected with funding provided through
the Centre for Natural Resources Management, the Murray–Darling
Basin Authority’s (MDBA) The Living Murray Program, the South
Australian Murray–Darling Basin Natural Resource Management Board,
DEWNR and the Goyder Institute for Water Research.
Special thanks to Paul Searle and Tim Branford (DEWNR) for
undertaking the ADCP transects and providing data. Thanks to Charles
James (SARDI) for assistance with data collation and analysis for the
hydraulic diversity study. Thanks to Ian Magraith, Arron Strawbridge, Neil
Wellman, Thiago Vasques Mari, Hanru Wang and David Short (SARDI),
for assistance in the field or laboratory work for the larval fish
assemblage and golden perch recruitment studies. David Crook
(Charles Darwin University) and Jed McDonald (SARDI) processed
otoliths using LA-ICPMS and provided invaluable advice and assistance
interpreting 87Sr/86Sr data. We also appreciate the assistance of SA
Water staff from Locks 1, 6 and 9 in collecting water samples for Sr
analysis. Thanks also to Ryan Breen (CEWO), Jarod Eaton (DEWNR) and
John Waterworth (MDBA) for assistance in trying to decipher

Ye, Q. et al. (2015) Monitoring of ecological responses to the delivery of CEW in the
lower River Murray during 2011-12
V SARDI Aquatic Sciences
environmental water delivery as a component of daily flow in the lower
River Murray.
Ye, Q. et al. (2015) Monitoring of ecological responses to the delivery of CEW in the
lower River Murray during 2011-12
1 SARDI Aquatic Sciences
TABLE OF CONTENTS
ACKNOWLEDGEMENTS ................................................................................................................. IV
LIST OF FIGURES .............................................................................................................................. 3
LIST OF TABLES ................................................................................................................................. 5
EXECUTIVE SUMMARY .................................................................................................................... 6
1 INTRODUCTION .................................................................................................................... 15
1.1 LOWER RIVER MURRAY, HYDROLOGY AND ENVIRONMENTAL WATERING IN 2011-12 ................ 15
1.2 INTERVENTION MONITORING - BACKGROUND, AIMS AND HYPOTHESES FOR ECOLOGICAL
COMPONENTS ..................................................................................................................................... 18
2 METHODS .............................................................................................................................. 28
2.1 STUDY SITES ................................................................................................................................ 28
2.2 HYDRAULIC DIVERSITY ................................................................................................................ 30
2.3 GOLDEN PERCH LARVAE AND LARVAL FISH ASSEMBLAGE ........................................................... 32
2.4 RECRUITMENT AND NATAL ORIGIN OF GOLDEN PERCH ............................................................... 35
2.5 SALT AND NUTRIENT TRANSPORT ................................................................................................. 39
3 RESULTS .................................................................................................................................. 42
3.1 HYDRAULIC DIVERSITY ................................................................................................................ 42
3.2 GOLDEN PERCH LARVAE AND LARVAL FISH ASSEMBLAGE ........................................................... 49
3.3 RECRUITMENT AND NATAL ORIGIN OF GOLDEN PERCH ............................................................... 61
3.4 SALT AND NUTRIENT TRANSPORT ................................................................................................. 68
4 DISCUSSION ......................................................................................................................... 78
4.1 HYDRAULIC DIVERSITY ................................................................................................................ 78
4.2 GOLDEN PERCH LARVAE AND LARVAL FISH ASSEMBLAGE ........................................................... 80
4.3 RECRUITMENT AND NATAL ORIGIN OF GOLDEN PERCH ............................................................... 86
4.4 SALT AND NUTRIENT TRANSPORT ................................................................................................. 88
5 MANAGEMENT IMPLICATIONS AND RECOMMENDATIONS .......................................... 91
5.1 HYDRAULIC DIVERSITY ................................................................................................................ 92
5.2 GOLDEN PERCH LARVAE AND LARVAL FISH ASSEMBLAGE ........................................................... 93
5.3 RECRUITMENT AND NATAL ORIGIN OF GOLDEN PERCH ............................................................... 95
5.4 SALT AND NUTRIENT TRANSPORT: LOCK 1 TO THE SOUTHERN OCEAN .......................................... 96
REFERENCES ................................................................................................................................... 99

Ye, Q. et al. (2015) Monitoring of ecological responses to the delivery of CEW in the
lower River Murray during 2011-12
2 SARDI Aquatic Sciences
APPENDICES ................................................................................................................................ 113
Ye, Q. et al. (2015) Monitoring of ecological responses to the delivery of CEW in the
lower River Murray during 2011-12
3 SARDI Aquatic Sciences
LIST OF FIGURES
Figure 1. River Murray flow (ML d-1) at the South Australian border from 1980–
2012. .................................................................................................................... 16
Figure 2. Study sites for hydraulic diversity, larval fish assemblages, recruitment
and natal origin of golden perch and salt and nutrient transport in the
lower River Murray, Lower Lakes and Coorong in South Australia. Blue dots
represent water collection sites for salt and nutrient transport; red squares
larval fish sampling sites and yellow lines hydraulic diversity sites. ............. 28
Figure 3. Schematic representation of a river reach and the hydraulic metrics
investigated . ...................................................................................................... 31
Figure 4. Developmental stages of golden perch larvae: a) and b) pre-flexion
larvae; c) and d) post-flexion larvae. Scale bar 1mm. ................................ 34
Figure 5. Daily river flow (ML d-1) at a) Lock 6 and QSA and at b) Lock 1 from
November 2011–April 2012. .............................................................................. 42
Figure 6. Horizontal current velocity (m.s-1) and circulation (i.e. M3, curl.s-1)
profiles generated for the Lock 1–2 weir pool upper location in January (a
& b) and March 2012 (c & d). ........................................................................ 44
Figure 7. Mean cross-transect velocity at the upper, mid and lower weir pool
location transects of a) the Lock 1–2 reach and b) the Lock 5–6 reach in
January and March 2012. ................................................................................ 46
Figure 8. Comparison of mean measured velocities against WaterTech
modelled and DEWNR modelled mean velocities in the upper weir pool ,
mid weir pool and lower weir pool of a) the Lock 5–6 reach and b) the
Lock 1–2 reach under varying discharge (QSA; ML d-1). ............................. 48
Figure 9. Relative abundance of pre-flexion golden perch larvae sampled in
each trip during 2011-12 at Sites 1 (a) and 2 (b) in the lower River Murray.
.............................................................................................................................. 55
Figure 10. Length frequency distributions of golden perch larvae from October
2011 to March 2012 samples collected at Sites 1 and 2 in the lower River
Murray. ................................................................................................................ 56
Figure 11. Relative abundance of pre-flexion golden perch larvae sampled in
each trip at Sites 1 and 2 in the lower River Murray between 2005-06 and
2011-12 ................................................................................................................ 57
Ye, Q. et al. (2015) Monitoring of ecological responses to the delivery of CEW in the
lower River Murray during 2011-12
4 SARDI Aquatic Sciences
Figure 12. PCO of larval fish assemblage data from 2005 to 2011 in the lower
River Murray ........................................................................................................ 59
Figure 13. dbRDA ordination of the fitted model of larval fish assemblage data
versus the environmental predictor variables in the lower River Murray. .. 60
Figure 14 Discharge (ML d-1) in the River Murray at the South Australian border
(solid black line) and Euston (dotted black line), Darling River at Burtundy
(dashed black line), Frenchman’s Creek (Lake Victoria inlet, solid red line)
and Rufus River (Lake Victoria outlet, solid blue line). .................................. 62
Figure 15 Length (left column) and age (right column) frequency distribution
of golden perch collected by boat electrofishing from the (a) floodplain,
(b) gorge and (c) swamplands and lakes geomorphic regions of the
River Murray in March/April 2012. .................................................................... 63
Figure 16 Mean daily discharge in the River Murray at the South Australian
border (solid blue line) and Euston (dashed blue line), and Darling River
at Burtundy (dotted blue line). 87Sr/86Sr ratios in water samples collected
from mid-January to mid-April 2012 in the River Murray at Lock 9 (solid red
triangles), Lock 6 (open red circles) and Lock 1 (solid red circles), and
early-January in the Darling River (open red triangle). Closed black
squares represent spawn date and otolith core 87Sr/86Sr ratio of golden
perch (n = 15) collected in the lower River Murray from December 2011
to February 2012. ............................................................................................... 65
Figure 17 Individual life history profiles based on otolith Sr isotope transects
(core to edge) for three juvenile golden perch aged 52 (GP 243), 66 (GP
231) and 67 (GP 227) days. Solid blue lines denote 87Sr/86Sr ratio for Darling
River water. ......................................................................................................... 66
Figure 18. Observed and modelled (with and without environmental water
provisions) electrical conductivity data for selected sites. ......................... 70
Figure 19. Modelled salt exports with and without environmental flow
provisions. . ......................................................................................................... 71
Figure 20. Observed and modelled (with and without environmental water
provisions) phosphate (PO4) ammonium (NH4) and silica (SiO2)
concentrations at selected sites. .................................................................... 74
Figure 21. Observed and modelled (with and without environmental water
provisions) particulate organic phosphorus and nitrogen concentrations
at selected sites. ................................................................................................ 75

Ye, Q. et al. (2015) Monitoring of ecological responses to the delivery of CEW in the
lower River Murray during 2011-12
5 SARDI Aquatic Sciences
Figure 22. Modelled phosphate (PO4) ammonium (NH4) and silica (SiO2)
exports with and without environmental flow provisions. . .......................... 76
Figure 23. Modelled particulate organic phosphorus (POPL) and nitrogen
(PONL) exports with and without environmental flow provisions. . ............ 77
LIST OF TABLES
Table 1a. Summary of key ecological outcomes associated with
Commonwealth environmental water releases to the lower River Murray
and associated watering during 2011-12. ....................................................... 7
Table 1b. Summary of larval fish reponses to high flow years including 2011-12
watering year....................................………………………………………………9
Table 2. Sampling dates of sites in the three areas of study of salt and nutrient
transport. ............................................................................................................. 40
Table 3. Hydraulic habitat metrics calculated from ADCP generated data
from the upper, mid and lower weirpool locations within the Lock 1–2 and
Lock 5–6 reaches in January and March 2012. ............................................ 43
Table 4. Summary of species and total number of larval fish sampled at Sites 1
and 2 in the lower River Murray in 2011-12 and previous years . ................ 52
Table 5. Otolith core 87Sr/86Sr measured in 34 young-of-year golden perch
collected from the floodplain, gorge and swamplands/lower lakes
geomorphic regions of the lower River Murray. ............................................ 67

Ye, Q. et al. (2015) Monitoring of ecological responses to the delivery of CEW in the
lower River Murray during 2011-12
6 SARDI Aquatic Sciences
EXECUTIVE SUMMARY
This project focuses on the intervention monitoring of the ecological
responses to Commonwealth environmental water releases to the
lower River Murray in 2011-12. The lower River Murray encompasses a
wide range of aquatic habitats that support diverse species of native
flora and fauna. This complex ecosystem is strongly influenced by
variation in riverine flow regime. During the prolonged drought that
affected the Murray–Darling Basin (2001–2010), the ecological
community in the lower River Murray suffered severe stress. Since then,
Commonwealth environmental water has been delivered alongside
natural flows in order to contribute to the recovery of water-dependent
ecosystems and build resilience against future stress.
During 2011-12, 329 gigalitres of Commonwealth environmental water
was delivered to the lower River Murray to seek a number of ecological
outcomes including enhancing spawning and recruitment of large-
bodied native fish, such as golden perch (Macquaria ambigua
ambigua). Environmental water delivery during December 2011 and
January 2012 enhanced a within-channel natural flow pulse up to
26,000 megalitres per day (ML d-1)(at the South Australian border) and
extended the flow recession during summer. The watering action
supported enhanced hydrological variability in the lower River Murray
and maintained flows above ~15,000 ML d-1 at the South Australian
border during this period.
The current project investigated four key components of ecological
responses during 2011-12 in relation to key objectives of environmental
watering actions for the lower River Murray, including
(1) hydraulic diversity in the river channel,
(2) golden perch larvae and larval fish assemblage,
(3) golden perch recruitment and natal origin, and
Ye, Q. et al. (2015) Monitoring of ecological responses to the delivery of CEW in the
lower River Murray during 2011-12
7 SARDI Aquatic Sciences
(4) salt and nutrient transport.
Hypotheses were proposed based on our conceptual understanding of
the life histories of relevant biota and ecological processes, and what
responses might be expected from the flow scenarios and
environmental water delivery in 2011-12. The four components are
addressed as four studies. This report is a synthesis of these studies. More
detailed information can be found in specific technical reports
(Aldridge et al. 2013; Bice et al. 2013; Ye et al. 2013).
Key ecological outcomes
Monitoring in 2011-12 identified a number of ecological responses
associated with the delivery of Commonwealth environmental water in
the lower River Murray. Key outcomes are summarised in Table 1a.
Reponses of large-bodied fish larvae in high flow years are also
summarised in Table 1b.
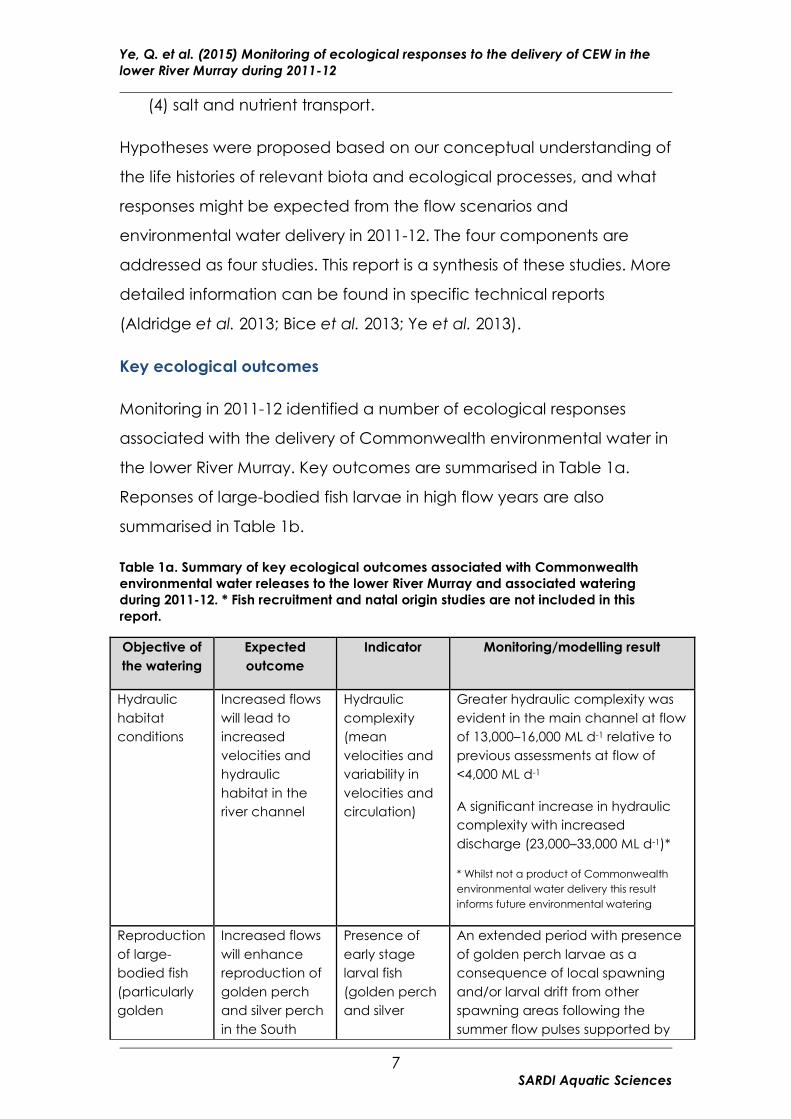
Table 1a. Summary of key ecological outcomes associated with Commonwealth
environmental water releases to the lower River Murray and associated watering
during 2011-12. * Fish recruitment and natal origin studies are not included in this
report.
Objective of
the watering
Expected
outcome
Indicator Monitoring/modelling result
Hydraulic
habitat
conditions
Increased flows
will lead to
increased
velocities and
hydraulic
habitat in the
river channel
Hydraulic
complexity
(mean
velocities and
variability in
velocities and
circulation)
Greater hydraulic complexity was
evident in the main channel at flow
of 13,000–16,000 ML d-1 relative to
previous assessments at flow of
<4,000 ML d-1
A significant increase in hydraulic
complexity with increased
discharge (23,000–33,000 ML d-1)*
* Whilst not a product of Commonwealth
environmental water delivery this result
informs future environmental watering
Reproduction
of large-
bodied fish
(particularly
golden
Increased flows
will enhance
reproduction of
golden perch
and silver perch
in the South
Presence of
early stage
larval fish
(golden perch
and silver
An extended period with presence
of golden perch larvae as a
consequence of local spawning
and/or larval drift from other
spawning areas following the
summer flow pulses supported by
Ye, Q. et al. (2015) Monitoring of ecological responses to the delivery of CEW in the
lower River Murray during 2011-12
8 SARDI Aquatic Sciences
Objective of
the watering
Expected
outcome
Indicator Monitoring/modelling result
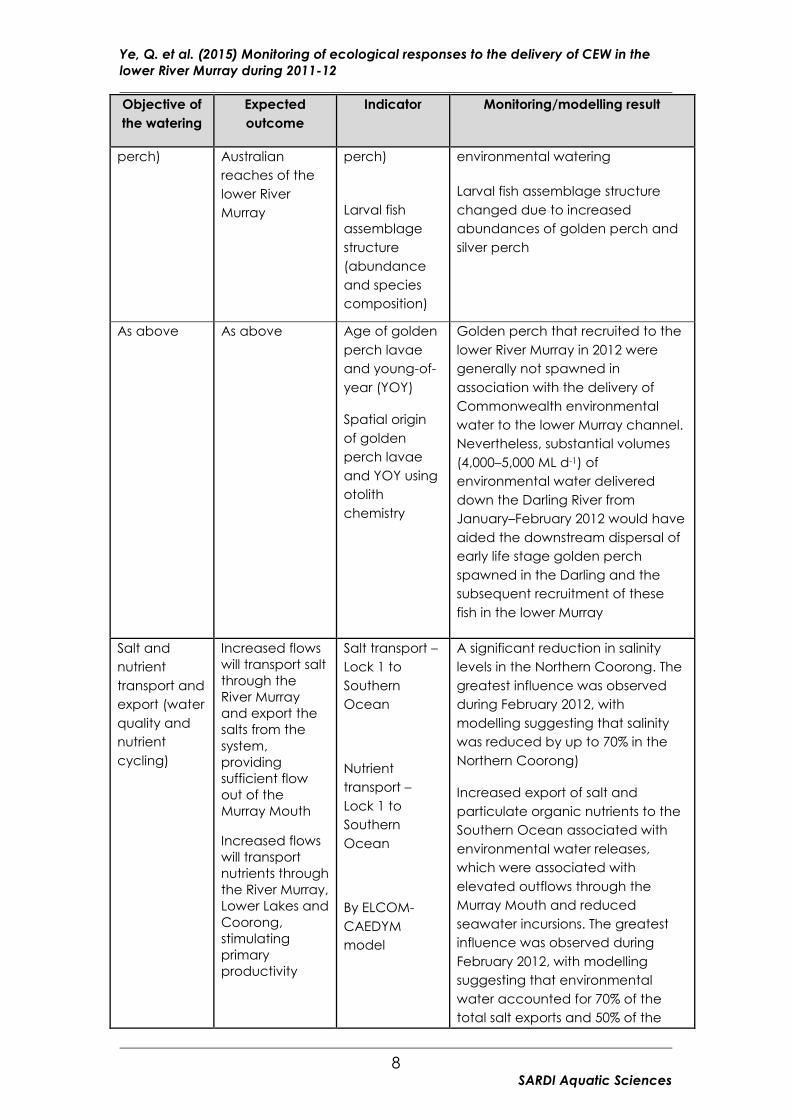
perch) Australian
reaches of the
lower River
Murray
perch)
Larval fish
assemblage
structure
(abundance
and species
composition)
environmental watering
Larval fish assemblage structure
changed due to increased
abundances of golden perch and
silver perch
As above As above Age of golden
perch lavae
and young-of-
year (YOY)
Spatial origin
of golden
perch lavae
and YOY using
otolith
chemistry
Golden perch that recruited to the
lower River Murray in 2012 were
generally not spawned in
association with the delivery of
Commonwealth environmental
water to the lower Murray channel.
Nevertheless, substantial volumes
(4,000–5,000 ML d-1) of
environmental water delivered
down the Darling River from
January–February 2012 would have
aided the downstream dispersal of
early life stage golden perch
spawned in the Darling and the
subsequent recruitment of these
fish in the lower Murray
Salt and
nutrient
transport and
export (water
quality and
nutrient
cycling)
Increased flows
will transport salt
through the
River Murray
and export the
salts from the
system,
providing
sufficient flow
out of the
Murray Mouth
Increased flows
will transport
nutrients through
the River Murray,
Lower Lakes and
Coorong,
stimulating
primary
productivity
Salt transport –
Lock 1 to
Southern
Ocean
Nutrient
transport –
Lock 1 to
Southern
Ocean
By ELCOM-
CAEDYM
model
A significant reduction in salinity
levels in the Northern Coorong. The
greatest influence was observed
during February 2012, with
modelling suggesting that salinity
was reduced by up to 70% in the
Northern Coorong)
Increased export of salt and
particulate organic nutrients to the
Southern Ocean associated with
environmental water releases,
which were associated with
elevated outflows through the
Murray Mouth and reduced
seawater incursions. The greatest
influence was observed during
February 2012, with modelling
suggesting that environmental
water accounted for 70% of the
total salt exports and 50% of the
Ye, Q. et al. (2015) Monitoring of ecological responses to the delivery of CEW in the
lower River Murray during 2011-12
9 SARDI Aquatic Sciences
Objective of
the watering
Expected
outcome
Indicator Monitoring/modelling result
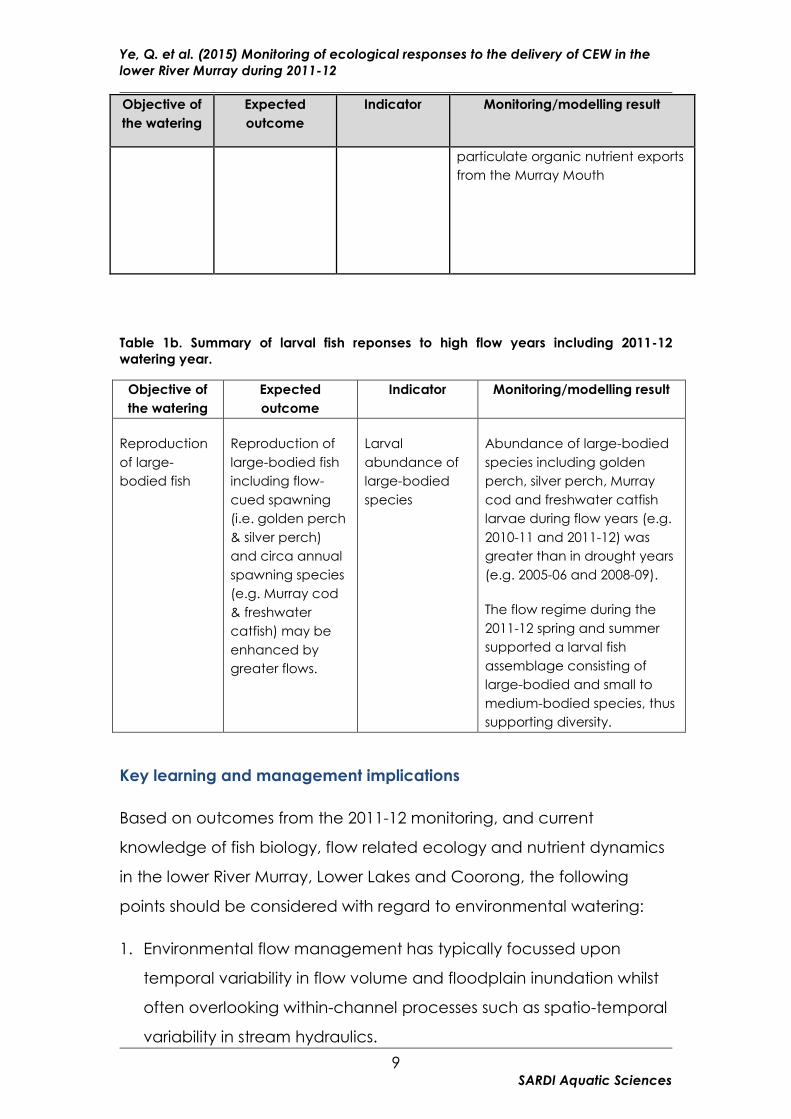
particulate organic nutrient exports
from the Murray Mouth
Table 1b. Summary of larval fish reponses to high flow years including 2011-12
watering year.
Objective of
the watering
Expected
outcome
Indicator Monitoring/modelling result
Reproduction
of large-
bodied fish
Reproduction of
large-bodied fish
including flow-
cued spawning
(i.e. golden perch
& silver perch)
and circa annual
spawning species
(e.g. Murray cod
& freshwater
catfish) may be
enhanced by
greater flows.
Larval
abundance of
large-bodied
species
Abundance of large-bodied
species including golden
perch, silver perch, Murray
cod and freshwater catfish
larvae during flow years (e.g.
2010-11 and 2011-12) was
greater than in drought years
(e.g. 2005-06 and 2008-09).
The flow regime during the
2011-12 spring and summer
supported a larval fish
assemblage consisting of
large-bodied and small to
medium-bodied species, thus
supporting diversity.
Key learning and management implications
Based on outcomes from the 2011-12 monitoring, and current
knowledge of fish biology, flow related ecology and nutrient dynamics
in the lower River Murray, Lower Lakes and Coorong, the following
points should be considered with regard to environmental watering:
1. Environmental flow management has typically focussed upon
temporal variability in flow volume and floodplain inundation whilst
often overlooking within-channel processes such as spatio-temporal
variability in stream hydraulics.

Ye, Q. et al. (2015) Monitoring of ecological responses to the delivery of CEW in the
lower River Murray during 2011-12
10 SARDI Aquatic Sciences
2. Hydraulic complexity is an integral part of the habitat diversity in
riverine systems and often strongly influences the life history cycles of
aquatic biota and affects biodiversity and community structure.
3. Restoration of hydraulic diversity to the main channel of the lower
River Murray is likely to be important for restoring key ecological
processes and functions, given prior to regulation it was a flowing
system with complex hydraulic conditions over a range of spatial
scales, even at low flows (Mallen-Cooper et al. 2011).
4. Environmental flows can be managed to improve hydraulic diversity
which could contribute to diversity in fish assemblages and facilitate
life-history processes such as spawning and recruitment.
5. This study developed a quantitative relationship between the level
of hydraulic complexity and discharge for flows between 13,000
and 33,000 ML d-1 and will thus inform future environmental flow
delivery of similar volumes.
6. There was an increase in hydraulic complexity in the main channel
with increased discharge (23,000–33,000 ML d-1 at the South
Australian border), suggesting that a greater diversity of hydraulic
microhabitats may be provided at flows of this magnitude,
potentially resulting in a greater ecological response.
7. Some level of hydraulic complexity was present even at 13,000–
16,000 ML d-1 but virtually absent at flows <4,000 ML d-1 (Lock 4-5
reaches, Kilsby 2008), suggesting the benefit of environmental water
releases even to maintain flow at >15,000 ML d-1. Whilst flows of
~15,000 ML d-1 may initiate local spawning of flow-cued species
(golden perch and silver perch, Bidyanus bidyanus), they may also
facilitate larval drift/dispersion from upstream and enhance
recruitment of golden perch to the lower River Murray (see Ye et al.
2008, Zampatti and Leigh 2013a).
8. Fish spawning and larval assemblage structure were strongly
influenced by flow. This study supports the notion that the two flow-
cued spawning species, golden perch and silver perch, will spawn

Ye, Q. et al. (2015) Monitoring of ecological responses to the delivery of CEW in the
lower River Murray during 2011-12
11 SARDI Aquatic Sciences
in conjunction with overbank flows and increased within-channel
flows. The relative abundance of the annual spawning species
Murray cod (Maccullochella peelii) and freshwater catfish
(Tandanus tandanus) larvae was also greater during higher flow
years. Consequently, environmental watering that promotes within-
channel and overbank increases in flow will enhance the spawning
and recruitment, and improve the resilience of native fish
populations.
9. Larval and juvenile golden perch collected in the lower River Murray
may be the progeny of spawning events that occur in the Murray
and/or Darling rivers over an extended period from October–
January. Larval golden perch were generally only collected in the
lower River Murray when flows exceed ~10,000 ML d-1 and relative
abundance increases at flows >20,000 ML d-1, thus, flows of this
magnitude could be targeted during the reproductive season (mid
spring–summer) of flow cued spawning fishes (i.e. golden and silver
perch).
10. Whilst overbank flows (floods) are ecologically important, within-
channel flow management presents an opportunity to enhance
populations of golden perch and other native fish.
11. Variability in flows contained within the river channel will support
reproduction (spawning and recruitment) of a range of species
from different flow guilds (e.g. large-bodied flow-cued spawning
species and small to medium-bodied ‘flow independent’ species)
and thus, can contribute to promoting a diverse fish community in
the lower River Murray.
12. Based on insights provided by this study and knowledge of nutrient
dynamics in the Lower Murray, the following points could be used to
help guide future environmental water use:
Environmental watering during moderate-high flow periods (e.g.
>40,000 ML d-1) are likely to have greater impacts on salt and
nutrient exports from the Murray Mouth than during low flow

Ye, Q. et al. (2015) Monitoring of ecological responses to the delivery of CEW in the
lower River Murray during 2011-12
12 SARDI Aquatic Sciences
periods (e.g. <10,000 ML d-1) when the Murray Mouth outflows are
small. In contrast, environmental watering during low flow periods
is likely to have greater impacts on salt and nutrient
concentrations than during moderate-high flow periods.
Maximum exports of salt and nutrients from the Murray Mouth are
likely to be achieved by delivering environmental water during
periods of low oceanic water levels (summer). However, whilst
this may have short-term benefits, reduced water delivery at
other times is likely to increase the import of material from the
Southern Ocean. In contrast, delivery of environmental water to
the region at times of high oceanic water levels is likely to
increase the exchange of water and associated nutrients and
salt through the Coorong, rather than predominately through the
Murray Mouth.
Environmental watering which result in floodplain inundation will
likely result in increased nutrient concentrations (mobilisation)
and export. This may be achieved by moderate-large flows (e.g.
>40,000 ML d-1) that inundate previously dry floodplain and
wetlands.
Environmental watering during winter may result in limited
assimilation of nutrients by biota (slower growth rates), whilst
releases during summer could increase the risk of blackwater
events and cyanobacterial blooms, depending on hydrological
conditions and the degree of wetland connectivity.
Environmental watering during spring is likely to minimise these
risks, but also maximise the benefits of nutrient inputs (e.g.
stimulate productivity to support larval survival).
Multiple watering events in a single year could jointly target
several objectives. For example, providing one event in spring to
increase nutrient assimilation, followed by a subsequent event to
export material from the system may provide multiple benefits.

Ye, Q. et al. (2015) Monitoring of ecological responses to the delivery of CEW in the
lower River Murray during 2011-12
13 SARDI Aquatic Sciences
Recommendations for future research and monitoring
1. Understanding biological responses to flows (both hydrology and
hydraulics) and identifying ecologically important components of
flow regimes are important to guide environmental flow
management at appropriate spatial and temporal scales.
2. Long-term research and monitoring that builds on key long-term
datasets will enable stronger inference and comparison through
time and across different flow scenarios and regimes.
3. The knowledge of flow related ecology should be analysed in the
context of environmental flow management, which will not only
best inform the optimisation of flow delivery to maximise ecological
outcomes but also help set sound ecological objectives/targets that
could be realistically achieved with improved watering regimes.
4. Flow related ecological research could be conducted through
monitoring biotic and environmental responses to natural flows or in
conjunction with environmental water releases.
5. An improved understanding of how hydrodynamics vary with
discharge will inform environmental flow delivery in regards to
volumes likely to facilitate hydraulic complexity and biotic
responses. Future monitoring could investigate water velocity data
at flows of 4,000–13,000 ML d-1 to determine potential threshold flow
rates beyond which hydraulic complexity begins to increase.
6. Research is required to understand the association of native fish
species with hydraulic habitats (at biologically relevant scales) and
the explicit link between hydraulics and ecological processes (e.g.
spawning and recruitment).
7. Understanding the causal link between hydraulics and vital life-
history processes, and determining the best hydraulic metrics to do
so, will provide a tool to inform future environmental water delivery.
8. Environmental water requirements could be specified as the
provision of particular hydraulic conditions and the flow, and
Ye, Q. et al. (2015) Monitoring of ecological responses to the delivery of CEW in the
lower River Murray during 2011-12
14 SARDI Aquatic Sciences
delivery strategies, required to create such conditions rather than a
sole reliance on hydrological metrics.
9. Continued refinement of the ELCOM-CAEDYM model will further
improve its capacity to assess the response of salt and nutrient
dynamics to environmental watering in the hydrologically complex
system of the Lower Murray. In future, it could also be used to assess
various watering actions in both forecasting and retrospective
analysis.
Ye, Q. et al. (2015) Monitoring of ecological responses to the delivery of CEW in the
lower River Murray during 2011-12
15 SARDI Aquatic Sciences
1 INTRODUCTION
River regulation and changes to the natural flow regimes have severely
impacted riverine ecosystems throughout the world (Kingsford 2000;
Bunn and Arthington 2002; Tockner and Stanford 2002). It is widely
recognised that flow plays a pivotal role in maintaining the ecological
integrity of riverine systems (Junk et al. 1989; Poff et al. 1997; Puckridge
et al. 1998; Lytle and Poff 2004). Over the last decade, environmental
flows have been increasingly applied worldwide for ecological
restoration in river systems (Poff et al. 1997; Arthington et al. 2006). In
Australia, over 2,400 GL of Commonwealth environmental water has
been delivered, along with other environmental flows, since 2008-09 to
protect or restore water dependent ecosystem condition in the
Murray–Darling Basin (MDB) (www.environment.gov.au/ewater/).
Understanding biological and ecological responses to flow variability is
essential for environmental flow management to achieve the best
ecological outcomes (Walker et al. 1995; Arthington et al. 2006).
1.1 Lower River Murray, hydrology and environmental
watering in 2011-12
River regulation and water extraction have substantially altered the
natural flow regimes in the MDB, leading to significantly reduced
hydrological variability and increased water level stability (Maheshwari
et al. 1995; Richter et al. 1996). The impact is most pronounced in the
lower River Murray, where the installation of levies, five tidal barrages
and 11 low level (<3 m) weirs and a high level of upstream extraction
have changed a historically dynamic flowing river into a series of weir
pools (Maheshwari et al. 1995; Walker 2006). The average annual flow
discharge to the sea has declined by 61% (from 12,333 GL y-1 to 4,733
GL y-1) and the probability of cease to flow through the Murray Mouth
increased from 1% to 40% (CSIRO 2008). Such modification has had a
profound impact on the ecological processes and communities in the

Ye, Q. et al. (2015) Monitoring of ecological responses to the delivery of CEW in the
lower River Murray during 2011-12
16 SARDI Aquatic Sciences
lower River Murray, Lakes and the Coorong (Walker 1985; Walker and
Thoms 1993; Brookes et al. 2009).
From 2001 to 2010, the MDB experienced its most severe drought on
record (Potter et al. 2010), during which flow discharge into the lower
River Murray remained low (i.e. <15,000 ML d-1 at the South Australian
border) and highly regulated (Figure 1). The drought was broken in late
2010 following a significant increase in flow and extensive flooding in
the lower River Murray. The overbank flow was the largest discharge (at
the South Australian border) since 1993, reaching a peak at 93,000 ML
d-1 in February 2011. Discharge remained high in 2011-12 although it
was substantially less than in the previous flood year, with water limited
to within-channel flows.
Figure 1. River Murray flow (ML d-1) at the South Australian border from 1980–2012.
Dashed line represents approximate bank-full flow in the lower River Murray.
82
84
86
88
92
94
96
98
02
04
06
08
12
1980
1990
2000
2010
ML.
da
y-1
0
20
40
60
80
100
120
Flow to South Australia
-1

Ye, Q. et al. (2015) Monitoring of ecological responses to the delivery of CEW in the
lower River Murray during 2011-12
17 SARDI Aquatic Sciences
During 2011-12, 329 GL of Commonwealth environmental water was
delivered to the lower River Murray to complement natural river flows
and provide additional freshes to the Lower Lakes and Coorong. This
volume of environmental water was delivered from a combination of
sources, specifically the Goulburn River and lower Broken Creek, the
River Murray and lower Darling River, to achieve multiple benefits
across the southern connected basin.
The environmental watering action in the lower River Murray aimed to
enhance the magnitude and duration of natural flow pulses and
reduce the rate of recession of natural flows. A number of expected
outcomes were targeted by the watering action, including enhancing
spawning and recruitment of large-bodied native fish, such as golden
perch (Macquaria ambigua ambigua).
Environmental water use commenced during November 2011 following
a period of high natural flows and continued to the end of January
2012. Environmental water use ceased on 3rd February 2012 due to high
natural inflows from the Darling River. A large portion of environmental
water was used between December 2011 and January 2012 to
enhance a within-channel natural fresh up to 26,000 ML d-1(at the
South Australian border) and extended the flow recession during
summer. The watering action contributed to improved hydrological
variability in the lower River Murray and maintained flows above
approximately 15,000 ML d-1 (at the South Australian border) during this
period.
From February to June 2012, small volumes of additional environmental
water were used to complement South Australian Entitlement Flow
(Entitlement Flow is a perpetual and exclusive right to a seasonal
allocation of a minimum of 3,000 ML d-1 during winter to 7,000 ML d-1
during summer). These volumes contributed to barrage releases into
the Coorong and the transport of salt and nutrients from the River
Murray system.
Ye, Q. et al. (2015) Monitoring of ecological responses to the delivery of CEW in the
lower River Murray during 2011-12
18 SARDI Aquatic Sciences
Throughout 2011-12, environmental water was also used to meet
objectives in upstream catchments. Environmental water from other
watering actions, including those in the Murrumbidgee River and mid-
Murray region, contributed to sustaining flows in the lower River Murray
and provided additional inflows to the Lower Lakes and Coorong
(www.environment.gov.au/ewater/).
1.2 Intervention monitoring - background, aims and
hypotheses for ecological components
This project focused on the intervention monitoring of key ecological
responses during the delivery of environmental water to the lower River
Murray (including the Lakes and Coorong) in 2011-12. The overall
purpose of the monitoring program was to understand the ecological
responses to environmental watering and contribute to the adaptive
management of environmental flow regimes.
Aligning with relevant environmental watering objectives for 2011-12,
the following four components of environmental and ecological
outcomes were considered for the 2011-12 monitoring: (1) habitat,
through hydraulic diversity in the river channel, (2) native fish
reproduction through golden perch spawning and larval fish
assemblage, (3) recruitment and natal origin of golden perch, and (4)
water quality through salt and nutrient transport. These four
components were investigated as distinct studies including the testing
of hypotheses, which were proposed based on our understanding of
the life histories of relevant biota and ecological processes, and what
responses might be expected from the flow scenarios and
environmental water delivery in 2011-12. The four ecological outcomes
are addressed separately throughout this report.
1.2.1 Hydraulic diversity
Contemporary management and flow restoration in regulated rivers
typically subscribes to the ‘natural flow paradigm’ (Poff et al. 1997),
with the objective of restoring aspects of the natural flow regime.

Ye, Q. et al. (2015) Monitoring of ecological responses to the delivery of CEW in the
lower River Murray during 2011-12
19 SARDI Aquatic Sciences
Nonetheless, the delivery of environmental flows in the MDB has
predominantly focused upon temporal variability in flow volumes and
floodplain inundation. Hydrological variability also results in spatio-
temporal variability in the physical characteristics of flow (i.e.
hydraulics: depth, velocity and turbulence) within river channels, and
the importance of such variability has, in the past, been an often
overlooked objective of flow restoration. The hydraulic conditions
experienced within a river are a function of discharge and physical
features such as channel morphology, sediment type, woody debris
and man-made structures (e.g. weirs), and hydraulic variability may
directly influence river geomorphology and the diversity, distribution
and abundance of aquatic biota (Statzner and Higler 1986; de Nooij
et al. 2006).
Spatial complexity in flow hydraulics provides habitat heterogeneity
across multiple scales. Several studies, both internationally and in
Australia, have indicated the preference of different fish species,
including salmonids, cyprinids, gobiids and galaxiids for ‘patches’ (i.e.
micro-habitats) and ‘reaches’ (i.e. meso-habitats) with particular
hydraulic conditions (Freeman and Grossman 1993; Henderson and
Johnston 2010; Kilsby and Walker 2012). Thus, it stands to reason that a
high diversity of hydraulic patches may result in high levels of biological
diversity (de Nooij et al. 2006; Dyer and Thoms 2006). Additionally, the
presence of microhabitats with particular hydraulic characteristics
have been shown to influence the foraging efficiency of fish, including
juveniles of some species (e.g. Atlantic salmon, Salmo sala), and is
subsequently integral to fish retention in streams and potentially
recruitment (Nislow et al. 1999). Furthermore, larval drift is an important
process in the life cycle of many riverine fish species (e.g. golden
perch) and the provision of particular hydraulic conditions is important
in facilitating the downstream drift and dispersal of larval and juvenile
fish (Brown and Armstrong 1985).

Ye, Q. et al. (2015) Monitoring of ecological responses to the delivery of CEW in the
lower River Murray during 2011-12
20 SARDI Aquatic Sciences
Prior to regulation, the lower River Murray was a flowing system,
exhibiting heterogeneous hydraulic conditions over a range of spatial
scales, even at low flows (Mallen-Cooper et al. 2011). Following
regulation, the lower River Murray was transformed into a series of
contiguous, predominantly still weir pools (Walker and Thoms 1993);
variability in the flow regime was diminished and water levels are now
relatively stable (Maheshwari et al. 1995, Blanch et al. 2000). Under low-
volume regulated flows (<7,000 ML d-1), which predominate, the lower
River Murray is now hydraulically homogenous compared to
unregulated reaches further upstream (Kilsby 2008) and this has likely
had a profound impact on ecological character. Indeed, permanently
flowing and hydraulically diverse habitats now only exist in selected off-
channel anabranches of the lower River Murray (e.g. Chowilla
Anabranch system) and subsequently, now represent the core habitat
areas for species associated with flowing habitats (e.g. Murray cod) in
the region (Zampatti et al. 2011).
Large floods in the lower Murray are little affected by river regulation,
however, smaller floods and within-channel flow pulses are the
component of the flow regime that has been most significantly altered
by river regulation (Maheshwari et al. 1995). Paradoxically, flows of this
magnitude (e.g. 15,000–50,000 ML d-1) could practically be restored
with the delivery of environmental water, within the current constraints
of system operation. Hydraulic modelling indicates that as flows
approach 15,000–20,000 ML d-1, the river begins to regain its flowing
nature (Mallen-Cooper et al. 2011), thus increasing hydraulic
complexity and potentially promoting diversity in fish assemblages and
facilitating life history processes such as spawning and recruitment.
Nevertheless, changes in the hydraulic character of the river channel
within this range of flows have not previously been verified in the field,
yet these data are imperative to supporting the delivery of
environmental water. Ultimately, the successful restoration of hydraulic

Ye, Q. et al. (2015) Monitoring of ecological responses to the delivery of CEW in the
lower River Murray during 2011-12
21 SARDI Aquatic Sciences
complexity will be paramount in restoring the ecological integrity of the
lower River Murray.
The objective of this study was to investigate variability in hydraulic
complexity in the lower River Murray between entitlement flows (3,000–
7,000 ML d-1) and flows of ~15,000 ML d-1, resulting from environmental
water delivery during 2011-12. Elevated natural flows were experienced
over the study period meaning the original objective could not be met.
Nevertheless, this provided the opportunity to investigate the same
parameters at higher flow bands and inform future environmental
water delivery at similar flow volumes. Specifically the aims were to 1)
characterise hydraulic complexity (i.e. water velocities and circulation)
under variable flow (i.e. 13,000–16,000 ML d-1 and 23,000–33,000 ML d-1)
by collecting real-time data and utilising various metrics, 2) use these
data to ‘ground truth’ existing hydraulic models, and 3) integrate these
data to inform the future delivery of environmental water in the lower
River Murray in regards to flows required to reinstate hydraulic diversity.
1.2.2 Golden perch larvae and larval fish assemblage
River regulation and changes to the natural flow regime have a
profound impact on ecosystem processes and aquatic biota, including
fish populations (e.g. Gehrke et al. 1995; Freeman et al. 2001; Agostinho
et al. 2004). Flow affects fish assemblages directly, by influencing
critical life history processes including spawning, larval and juvenile
survival, dispersion, movement/migration and subsequent recruitment
(Welcomme 1985; Junk et al. 1989; Humphries et al. 1999; King et al.
2009). Fish assemblages are also affected by flow indirectly, by
influencing floodplain inundation, productivity, channel morphology,
hydraulic conditions, distribution of aquatic vegetation, diversity of
structural elements, and habitat availability and selectivity (Nestler et
al. 2012). In the MDB, there has been a significant decline in the
abundance and distribution of native fish populations following

Ye, Q. et al. (2015) Monitoring of ecological responses to the delivery of CEW in the
lower River Murray during 2011-12
22 SARDI Aquatic Sciences
extensive modification of the river system and natural flow regimes
(Walker 1985; Gehrke et al. 1995; Humphries et al. 2002; MDBC 2004).
To mitigate the adverse effects of river regulation on fish communities
and aquatic food webs, environmental water has been used through
manipulative flow releases to restore key elements of the natural
hydrological regime that are deemed important for ecological
processes and functions (Weisberg and Burton 1993; Travnichek et al.
1995; Cambray et al. 1997; Molles et al. 1998). These flow elements are
also usually linked to the critical aspects of life history strategies of
riverine fishes (Junk et al. 1989; Humphries et al. 1999; Lytle and Poff
2004). In Australia, environmental flows have been broadly applied as
a ‘restoration tool’, particularly in the last five to ten years, and fish
responses are often targeted among ecological outcomes with flows
delivered to maintain critical habitats, improve connectivity, and/or
facilitate spawning and recruitment (King et al. 2009; Watts et al. 2012).
However, the lack of general relationships and good understanding of
ecological responses to the various components of the flow regime
sometimes restricts the ability to effectively manage environmental
flows for specific rivers (Naiman et al. 2002; King et al. 2009; Poff and
Zimmerman 2010).
In recent years, there has been some improvement of our knowledge
of the role of flows and flooding in the life history cycles of many of the
MDB fish (e.g. Humphries et al. 1999; King et al. 2003, 2009; Mallen-
Cooper and Stuart 2003; Graham and Harris 2005; Ebner et al. 2009;
Cheshire 2010; Cheshire et al. 2012). However, there are significant
knowledge gaps on the specific environmental conditions required for
successful fish spawning and recruitment and the complex
mechanisms of how flow or other environmental factors affect fish (King
et al. 2009). Such knowledge is critical for the restoration of ecologically
important components of the flow regime in order to rehabilitate
native fish populations through environmental flow management

Ye, Q. et al. (2015) Monitoring of ecological responses to the delivery of CEW in the
lower River Murray during 2011-12
23 SARDI Aquatic Sciences
(Walker et al. 1995; Arthington et al. 2006). Further eco-hydrological
research is required, and investigations could be conducted through
monitoring biotic responses to natural flows or in conjunction with
environmental water releases.
This study focused on monitoring larval fish assemblage responses to
the delivery of environmental water to the lower River Murray during
2011-12. Specific investigation was conducted on pre-flexion larvae of
golden perch, a flow-cued spawning species, to provide insights on its
spawning response to a summer within-channel flow pulse associated
with the environmental watering during 2011-12. The data collected in
the current year were compared with previous studies of larval fish
assemblages (2005–2010) in the lower River Murray under different
hydrological conditions (i.e. Cheshire and Ye 2008; Bucater et al. 2009;
Cheshire et al. 2012). For the 2011-12 intervention monitoring, it was
hypothesised that:
following the summer within-channel flow pulse enhanced by the
release of environmental water, golden perch larvae would be
present in the lower River Murray for an extended period of time
into late summer.
increased flow with within-channel pulses would lead to changes
in larval fish assemblage structure in the lower River Murray during
2011-12, compared to previous drought years (<10,000 ML d-1),
due to the presence and increased abundance of flow-cued
spawning species (i.e. golden perch, silver perch) and a
reduction in common small to medium-bodied species; larval
assemblages in 2011-12 would be more similar to those in 2010-
11.
annual variation in larval fish assemblages would be correlated
to changes in hydrology.

Ye, Q. et al. (2015) Monitoring of ecological responses to the delivery of CEW in the
lower River Murray during 2011-12
24 SARDI Aquatic Sciences
1.2.3 Recruitment and natal origin of golden perch
Restoring flow regimes to benefit aquatic ecosystems, including fish,
requires an understanding of relationships between hydrology, life
history and population dynamics (Arthington et al. 2006). Golden perch
is one of only two native fish species in the River Murray, along with
silver perch (Bidyanus bidyanus), considered to require increased
discharge to initiate spawning (Humphries et al. 1999). Spawning and
recruitment of golden perch in the River Murray corresponds with over
bank flooding and increases in flow contained within the river channel
(Mallen-Cooper and Stuart 2003; King et al. 2009; Zampatti and Leigh
2013a). In the lower River Murray (downstream of the Darling River
junction) flows and water temperature nominally >15,000 ML d-1 and
>20 °C, respectively, are considered to facilitate spawning and
recruitment resulting in strong year-classes of golden perch (Zampatti
and Leigh 2013b).
To understand the hydrological requirements of flow-cued spawning
fish there is a need to be able to accurately determine the
hydrological conditions at the time and place of spawning. This can
be achieved by collecting fish in the act of spawning, collecting eggs,
or determining the spatio-temporal provenance (i.e. when and where
a fish was spawned) of early life stages (e.g. larvae), juveniles or adults.
Larval size/stage may be used as an indicator of daily age but age-at-
size can be variable (Tonkin et al. 2006). To accurately determine the
spawn date of golden perch, daily increments in otolith microstructure
provide a validated method of determining daily age and hence
back-calculating a spawn date (Brown and Wooden 2007).
Retrospectively determining where a fish was spawned can also be
achieved by investigating otolith microstructure. The geochemical
composition of otoliths reflects the chemistry of ambient waters at the
time of deposition, although the uptake of some trace elements may
be physiologically altered (Campana 1999). Elemental stable isotope

Ye, Q. et al. (2015) Monitoring of ecological responses to the delivery of CEW in the
lower River Murray during 2011-12
25 SARDI Aquatic Sciences
ratios, however, remain unaltered following incorporation into the
otolith and directly reflect ratios in surrounding waters (Hobbs et al.
2005). Integration of otolith biochronolgy and geochemistry can
potentially be used to retrospectively determine where a fish has been
and when it was there, if locations have chemically distinct isotopic
signatures (Gillanders 2005).
Following the unexpected occurrence of a strong cohort of golden
perch in the lower River Murray spawned in 2009-10, a year when flow
at the South Australian border did not exceed ~10,000 ML d-1, Zampatti
and Leigh (2013b), proposed a Darling River origin for these fish and
that Strontium (Sr) isotopic ratios in otoliths could potentially be used to
verify this hypothesis. Strontium isotope ratios in water are an artefact of
catchment geology, and the Murray and Darling River systems have
different Strontium isotope (87Sr/86Sr) signatures due to differences in the
composition and age of rocks in their catchments (Douglas et al. 1995).
Preliminary data indicate that the 2009-10 spawned cohort of golden
perch originated in the Darling River and that otolith 87Sr/86Sr may prove
a useful tool for determining the provenance of all life stages of golden
perch (SARDI’s unpublished data).
From July 2011 to June 2012 the CEWO delivered 329 GL of
environmental water to the lower River Murray for a range of
ecological objectives. The present study forms part of a broader
monitoring program that aimed to assess the hydrological and
ecological responses and benefits of this water and is concerned with
the CEWO objective of stimulating and maintaining fish breeding and
recruitment, particularly large-bodied native species, throughout the
lower River Murray channel (CEWO 2012).
The aim of this study was to investigate golden perch recruitment in the
lower River Murray in relation to flow, and determine the provenance
of age 0+ recruits. We hypothesised that flows >15,000 ML d-1 during
summer would result in recruitment (to age 0+) of golden perch in the

Ye, Q. et al. (2015) Monitoring of ecological responses to the delivery of CEW in the
lower River Murray during 2011-12
26 SARDI Aquatic Sciences
South Australian reaches of the River Murray, but that these young-of-
year (YOY) fish would not necessarily have been spawned in the lower
River Murray.
1.2.4 Salt and nutrient transport: Lock 1 to the Southern Ocean
Within aquatic ecosystems, flow provides habitat for aquatic organisms
through the alteration of the physical and chemical environment.
Salinity is an important parameter that governs the distribution and
abundance of aquatic biota and is strongly influenced by flow
(Williams 1987; Hart et al. 1991; Nielsen et al. 2003). Flow also results in
the mobilisation and transport of nutrients, which allow organisms to
grow (Poff et al. 1997). Nitrogen, phosphorus and silica are important
nutrients because they often control the productivity of aquatic biota.
These nutrients occur in various inorganic, organic, particulate and
dissolved forms. For the purpose of this study we focused on:
dissolved inorganic nutrients, including phosphate, ammonium
(nitrogen) and silica, which are considered readily available to
primary producers; and
particulate organic phosphorus and nitrogen, which are
associated with the biomass of living and dead (detritus)
organisms.
Altering the flow regime of riverine systems has had significant
consequences for salt and nutrient concentrations and transport. For
example, extended periods of low flow can result in the accumulation
of salts within aquatic ecosystems. In addition, extended periods of low
flow with a lack of floodplain inundation can result in productivity being
limited by the low availability of nutrients. Such observations have been
made in the lower Murray, including the lower River Murray, Lower
Lakes and Coorong (Brookes et al. 2009; Aldridge et al. 2011, 2012;
Mosley et al. 2012). Environmental flow provisions may be used to
reinstate some of the natural processes that control salt and nutrient
concentrations and transport. In doing so, these flows provide
Ye, Q. et al. (2015) Monitoring of ecological responses to the delivery of CEW in the
lower River Murray during 2011-12
27 SARDI Aquatic Sciences
ecological benefits through the provision of habitat and resources to
allow the growth and survival of biota. This study aimed to assess the
changes in the salt and nutrient concentrations and transport in the
lower River Murray (below Lock 1), Lower Lakes and Northern Coorong
(Figure 2) associated with the delivery of Commonwealth
environmental water between November 2011 and June 2012.
Ye, Q. et al. (2015) Monitoring of ecological responses to the delivery of CEW in the
lower River Murray during 2011-12
28 SARDI Aquatic Sciences
2 METHODS
2.1 Study sites
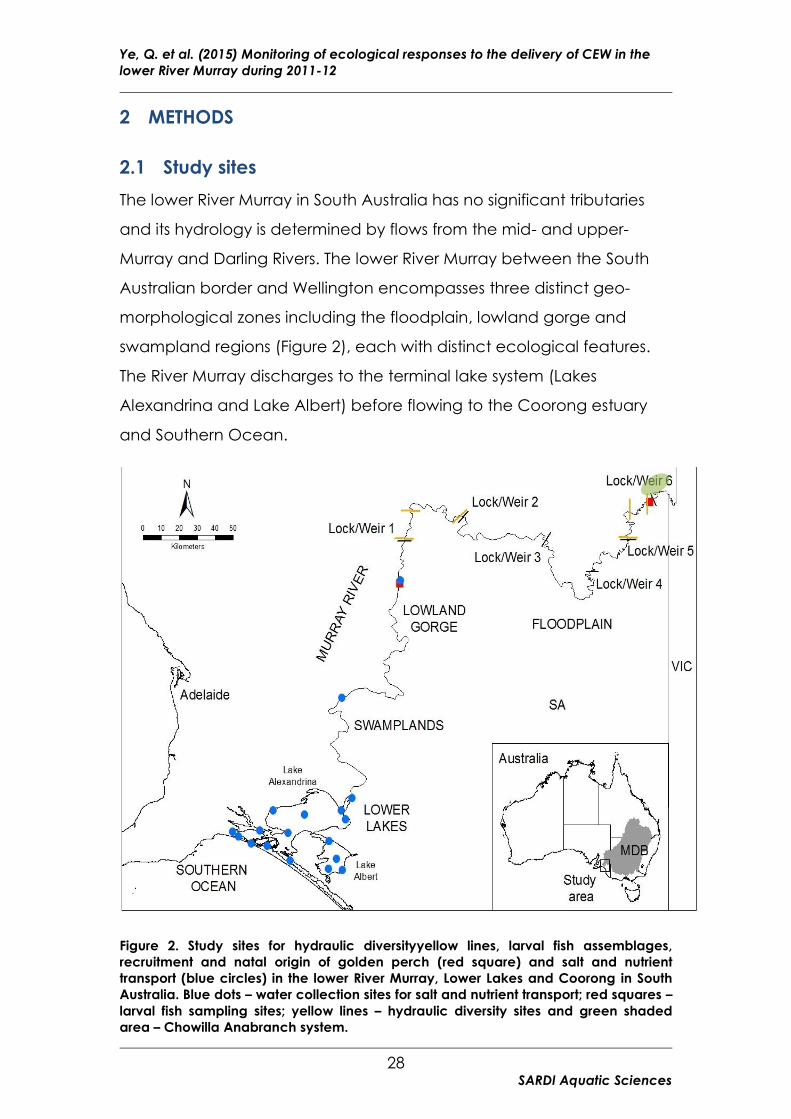
The lower River Murray in South Australia has no significant tributaries
and its hydrology is determined by flows from the mid- and upper-
Murray and Darling Rivers. The lower River Murray between the South
Australian border and Wellington encompasses three distinct geo-
morphological zones including the floodplain, lowland gorge and
swampland regions (Figure 2), each with distinct ecological features.
The River Murray discharges to the terminal lake system (Lakes
Alexandrina and Lake Albert) before flowing to the Coorong estuary
and Southern Ocean.
Figure 2. Study sites for hydraulic diversityyellow lines, larval fish assemblages,
recruitment and natal origin of golden perch (red square) and salt and nutrient
transport (blue circles) in the lower River Murray, Lower Lakes and Coorong in South
Australia. Blue dots – water collection sites for salt and nutrient transport; red squares –
larval fish sampling sites; yellow lines – hydraulic diversity sites and green shaded
area – Chowilla Anabranch system.

Ye, Q. et al. (2015) Monitoring of ecological responses to the delivery of CEW in the
lower River Murray during 2011-12
29 SARDI Aquatic Sciences
2.1.1 Hydraulic diversity
Velocity profiles were measured across transects in two reaches (weir
pools) in the main channel of the lower River Murray, one in the
floodplain region, between Lock 5 and Lock 6 and the other in the
gorge region, between Lock 1 and Lock 2 (Figure 2). Within each weir
pool, cross-sectional velocity profiles were generated for three
locations, 1) the upper weir pool (in the vicinity of the upstream weir),
2) the mid weir pool (approximately mid-way between the two weirs)
and 3) the lower weir pool (within the vicinity of the downstream weir)
(Figure 2).
2.1.2 Golden perch larvae and larval fish assemblages
Larval fish sampling occurred in the main channel of the lower River
Murray in South Australia (Figure 2). Sampling was conducted at two
sites in the tailwaters approximately 5 km downstream of Lock 1 (i.e.
Site 1) and Lock 6 (i.e. Site 2) (Figure 2). The area surrounding Lock 1 is
the gorge region, and the area surrounding Lock 6 is the floodplain
region. Despite the surrounding floodplains being different, the main
channel habitat is generally similar with wide, deep, slow flowing pool
habitats.
2.1.3 Recruitment and natal origin of golden perch
To investigate the association between flow, golden perch recruitment
(to at least YOY, age 0+) and natal origin we surveyed a total of 105
sites in the main channel of the lower River Murray in South Australia,
the Chowilla Anabranch system and the littoral zones of Lake
Alexandrina (Figure 2). Sites were sampled in the three distinct
geomorphic regions of the lower River Murray (Walker and Thoms
1993): 1) swamplands and lakes (downstream of Mannum) (n = 29), 2)
gorge (Mannum–Lock 3) (n = 29), and 3) floodplain (Lock 3–Lock 6) (n =
47) (Figure 2).

Ye, Q. et al. (2015) Monitoring of ecological responses to the delivery of CEW in the
lower River Murray during 2011-12
30 SARDI Aquatic Sciences
2.1.4 Salt and nutrient transport
This study considers the area between Lock 1 and the Southern Ocean.
Water quality was assessed at numerous sites in the lower River Murray
(below Lock 1), Lower Lakes (Lake Albert and Lake Alexandrina) and
Northern Coorong (Figure 2). Data from the Lower Lakes were provided
by the South Australian Environment Protection Authority through the
Murray Futures funding program.
2.2 Hydraulic diversity
2.2.1 Survey technique
Cross-sectional velocity profiles were collected by DEWNR using a
vessel mounted SonTek River Surveyor M9 Acoustic Doppler Current
Profiler (ADCP). For specific details on the operation of ADCP units see
Shields and Rigby (2005). Velocities were measured at two different
flow bands, firstly during January 2012 at flows to SA (calculated River
Murray discharge entering SA, i.e. QSA) of 16,214–16,898 ML d-1 and in
March 2012 during flows of 33,241–38,627 ML d-1. Velocities could not
be measured during typical summer/autumn entitlement flows (3,000–
7,000 ML d-1) due to persistent high flows over the study period.
2.2.2 Data analysis
Data that were generated from ADCP transects were exported to
MATLAB (The Mathworks Inc. 2010) and interpolated across grids with
equal cell sizes (0.5 m long x 0.25 m high) using the Delaney
triangulation scattered data function. Water velocities for each cell
were generated in three planes; perpendicular or cross-transect (i.e.
upstream to downstream), parallel to or along a transect (i.e. from
bank to bank) and vertical velocity (i.e. up or down).
Analysis of variance (ANOVA) was used to determine significant
differences in mean cross-transect velocities (U; Figure 3) between
velocity profiles from the different locations (upper, mid and lower) and
flow bands within each reach. Variability in U within cross-sections was

Ye, Q. et al. (2015) Monitoring of ecological responses to the delivery of CEW in the
lower River Murray during 2011-12
31 SARDI Aquatic Sciences
investigated by determining velocity ranges, standard deviation and
the coefficient of variation. Mean velocities in the other planes,
horizontally along transect (i.e. from bank to bank, W) and vertically
(i.e. up or down, V) were also determined.
Figure 3. Schematic representation of a river reach and the hydraulic metrics
investigated (after Shields and Rigby 2005), including variation in cross transect
velocities (U) between transects and the modified circulation metric (M3), which
represents the area averaged frequency and strength of eddies or flow rotation within
a cross-section.
We also adopt a spatial hydraulic metric developed by Crowder and
Diplas (2000) known as the modified circulation metric to quantify flow
complexity over a defined area, in this case, river cross-sections as
measured during ADCP transects. The modified circulation metric (M3;
after Shields and Rigby 2005) represents a weighted average of flow
rotation in the vertical plane per unit area (Figure 3). Calculation of M3
is explained by Equation 1, where w represents velocity in the vertical
plane z and v represents velocity in the lateral plane y. Higher values of
M3 indicate greater frequency and strength of eddies or greater levels
of circulation (i.e. flow rotation) within a cross-section.
Equation 1 M3 = ∑|(
∆𝒘
∆𝒚−
∆𝒗
∆𝒛)|∗∆𝒚∗∆𝒛
∑ ∆𝒚∗∆𝒛
U
M3

Ye, Q. et al. (2015) Monitoring of ecological responses to the delivery of CEW in the
lower River Murray during 2011-12
32 SARDI Aquatic Sciences
2.2.3 Ground-truthing existing hydraulic models
‘Measured’ mean velocities were compared with ‘modelled’ mean
velocities for the same sites using two modelling approaches. Firstly,
hydrodynamic modelling has been undertaken in the Lock 6 region by
Water Technology as part of a project investigating the risks posed to
fish by the operation of the Chowilla regulator (Mallen-Cooper et al.
2011) utilising a one-dimensional Mike11 model. Mean velocities were
modelled at flows (QSA) of 15,000 , 20,000 and 40,000 ML d-1, at the
Lock 5–6 upper weir pool site and are compared against velocities
measured in the current study. The second set of hydrodynamic
modelling was undertaken by DEWNR using MIKE FLOOD software
(DEWNR unpublished). This model generated mean water velocity
outputs for the lower, middle and upper weir pool sites of the Lock 1–2
and Lock 5–6 reaches at flows (QSA) of 13,000 ML d-1 and 24,000 ML d-1
2.3 Golden perch larvae and larval fish assemblage
2.3.1 Sampling regime, larvae collection and processing
Larval fish sampling was conducted at two sites using plankton tows
approximately fortnightly between October and March, covering the
period of environmental water delivery in the 2011-12 water year. This
method is consistent with previous larval fish studies in the lower River
Murray (Cheshire and Ye 2008; Cheshire et al. 2012), with the difference
being that the sampling period was extended to measure response to
environmental flow release. Each site was sampled with three
replications during the day-time and at night-time, of the same day,
and both sites were sampled within a three-day period. Day-time and
night samples were taken to gain a representative picture of the whole
larval assemblage (Cheshire 2010).
Plankton tows were conducted using a set of paired square-framed
bongo nets with 500 µm mesh; each net was 0.5 x 0.5 m and 3 m long.
Nets were equipped with a pneumatic float in the centre of the frame,
which allowed the frame to sit ~15 cm below the water surface. The

Ye, Q. et al. (2015) Monitoring of ecological responses to the delivery of CEW in the
lower River Murray during 2011-12
33 SARDI Aquatic Sciences
net was towed in a circle, astern for 15-minute intervals using a 20 m
rope. The volume of water (m3) filtered through each net was
determined using a calibrated flow meter placed in the centre of the
mouth openings.
Samples were preserved in 95% ethanol in situ and returned to the
laboratory for sorting. All larvae were identified to species level where
possible, with the aid of published descriptions, with the exception of
carp gudgeon (Hypseleotris spp.), hardyhead (Craterocephalus spp.)
and flatheaded gudgeon (Philypnodon spp.). Each of these three
genera was treated as a species complex due to their close
phylogenetic relationships and very similar morphologies making clear
identifications difficult (Bertozzi et al. 2000; Serafini and Humphries
2004). In 2010-11, newly hatched larvae (free embryos) were collected,
which were confirmed to be either golden perch or silver perch;
however, due to very similar morphologies, they were subsequently
grouped as ‘perch free embryos’ for data analysis. In both 2010-11 and
2011-12, at least two different types of eggs were sampled (likely to be
Australian smelt, Retropinna semoni, and perch eggs); however, due to
uncertainty, these were not included in data analysis.
Total length (TL) measurements of golden perch larvae collected in
2011-12 were taken using a dissecting microscope with different
magnifications (x 6.5 – 40) depending on the size of the larvae (Figure
4). Since golden perch flexion occurs between 4.9–7.3 mm TL (Serafini
and Humphries 2004), the mean 6.1 mm TL was used as a cut-off for the
classification of larvae as pre-flexion in this study.

Ye, Q. et al. (2015) Monitoring of ecological responses to the delivery of CEW in the
lower River Murray during 2011-12
34 SARDI Aquatic Sciences
Figure 4. Developmental stages of golden perch larvae: a) and b) pre-flexion larvae;
c) and d) post-flexion larvae. Scale bar 1 mm.
2.3.2 Environmental variables and data analysis
Data for flow (discharge in ML d-1), water level (metres AHD, level
relative to Australian Height Datum), water temperature (°C), and
conductivity (μS.cm-1 @ 25 °C) were obtained for both sites, throughout
the study, from the DEWNR Surface Water Archive
(www.waterconnect.sa.gov.au; accessed on 10/08/2012). Water level
data were transformed to relative water levels by measuring their
deviation from ‘normal’ pool height (Site 1: 0.75 m, Site 2: 16.3 m).
The volume of water filtered through each plankton net was used to
calculate the standardised abundance of fish per m3. Six plankton tows
generated six replicates for each site during each sampling trip. To
account for the dispersion or concentration of larval fish under the
extremely variable flow conditions, the standardised abundance of fish
per m3 was multiplied by the discharge volume at the time of sampling
day to provide the relative abundance, as a flow corrected
abundance indicator which was used for all analyses. Fish assemblage
structure was characterised by the species composition and the
relative abundance of each species.
c d
a b
Ye, Q. et al. (2015) Monitoring of ecological responses to the delivery of CEW in the
lower River Murray during 2011-12
35 SARDI Aquatic Sciences
Statistical analysis was conducted on the relative abundance of pre-
flexion golden perch larvae to detect the difference between years
(2011-12 vs previous years) and two sampling sites. Only samples from
October to mid January were included in the statistical analysis
because larval sampling was not conducted from late January to
March in years prior to 2011-12. The temporal change in relative
abundance of pre-flexion golden perch larvae during spring and
summer was plotted against the flow discharge to South Australia for
each year. Multivariate statistical analyses were undertaken on larval
fish assemblages to investigate the difference in assemblage structure
between 2011-12 and previous years. Detailed statistical analyses are
described in Ye et al. (2013).
2.4 Recruitment and natal origin of golden perch
2.4.1 Hydrology
Daily mean flow (ML d-1) and water temperature (°C) during the period
July 2011 to July 2012 for the River Murray at the South Australian
border, Euston, Frenchman’s Creek (Lake Victoria inlet), Rufus River
(Lake Victoria outlet) and the Darling River at Burtundy (Appendix I)
were obtained from the South Australian Department of Environment,
Water and Natural Resources (DEWNR, unpublished data) and the
Murray–Darling Basin Authority (MDBA).
2.4.2 Water samples
To determine temporal variation in water 87Sr/86Sr over the period of
environmental water delivery to the lower Murray, water samples were
collected fortnightly from 19 January 2012 to 18 April 2012 at Locks 1, 6
and 9. One-off samples were also collected from the Darling River,
River Murray (upstream and downstream of the Goulburn River), and
Goulburn and Murrumbidgee Rivers (Appendix I).

Ye, Q. et al. (2015) Monitoring of ecological responses to the delivery of CEW in the
lower River Murray during 2011-12
36 SARDI Aquatic Sciences
2.4.3 Fish sampling
Adult and juvenile golden perch were sampled primarily by vessel
electrofishing using a 7.5 kW Smith Root Model GPP 7.5 electrofishing
unit. Sites throughout the main channel of the lower River Murray in
South Australia were sampled in autumn (March/April) and spring
(October/November) 2012 to maximise the chance of collecting YOY
golden perch spawned in the spring–summer 2011-12 spawning
season. Electrofishing was conducted during daylight hours and all
available littoral habitats were fished. All fish were measured to the
nearest mm (total length, TL) and a subsample (n = 7–104 fish)
proportionally representing the length-frequency of golden perch
collected from each geomorphic region was retained for ageing.
Additional juvenile fish were obtained from plankton tows conducted
as part of the larval fish sampling component (Section 2.3) in
December–February 2012 and from ad hoc fyke net sampling in the
lower lakes of the River Murray (swamplands and lakes geomorphic
region) in early November 2012.
2.4.4 Ageing
Annual ageing
Golden perch exhibit considerable variation in length-at-age in the
MDB (Anderson et al. 1992). Therefore, to accurately assess the age
structure and year-class strength of golden perch, we investigated
both length and age-frequency distributions. Fish retained for ageing
were euthanized using AQUI-S® (Aqui-s, Lower Hutt, New Zealand) and
sagittal otoliths were removed. Whole sagittae were embedded in
clear casting resin and a single 400 to 600 m transverse section was
prepared. Sections of sagittae were examined using a dissecting
microscope (x 25) under transmitted light. Estimates of age were
determined independently by three readers by counting the number
of discernible opaque zones (annuli) from the primordium to the otolith
Ye, Q. et al. (2015) Monitoring of ecological responses to the delivery of CEW in the
lower River Murray during 2011-12
37 SARDI Aquatic Sciences
edge. YOY (< 1 year old) fish were defined as individuals lacking clearly
discernible annuli.
Daily ageing
To estimate the spawn date of larval and juvenile golden perch, daily
variation in otolith microstructure was examined in a subsample of fish
(n = 15). Golden perch larvae/juveniles were measured to the nearest
mm and sagittal otoliths were removed. Transverse sections were
prepared by embedding sagittae in Crystal BondTM and grinding with 9
µm imperial lapping film from both anterior and posterior surfaces to
the primordium. Sagittae were then polished using 0.3 µm alumina
slurry to produce sections between 50 and 100 µm thick.
Sections were examined using a compound microscope (x 600) fitted
with a digital camera and Optimas image analysis software (version
6.5, Media Cybernetics, Maryland, USA). Increments were counted
blind with respect to fish length and capture date. Estimates of age
were determined by counting the number of increments from the
primordium to the otolith edge. Three successive counts were made
by one reader for one otolith from each fish. If these differed by more
than 5% the otolith was rejected, but if not the mean was used as an
estimate of the number of increments. Increment counts were
considered to represent true age of larval and juvenile golden perch
and spawn dates were determined by subtracting the estimated age
from the capture date (Zampatti and Leigh 2013b).
2.4.5 Water 87Sr/86Sr analysis
Twenty ml aliquots of each water sample were filtered through a 0.2
µm Acrodisc syringe-mounted filter into a clean polystyrene beaker
and dried overnight in a HEPA-filtered fume cupboard. Previous
analyses have shown that filtering after transfer to the laboratory, rather
than after sample collection in the field, has no influence on
measurement of 87Sr/86Sr (e.g. Palmer and Edmond 1989).

Ye, Q. et al. (2015) Monitoring of ecological responses to the delivery of CEW in the
lower River Murray during 2011-12
38 SARDI Aquatic Sciences
Strontium was extracted using a single pass over 0.15 ml (4 x 12 mm)
beds of EICHROMTM Sr resin (50-100 µm). Following Pin et al. (1994),
matrix elements were washed off the resin with 2 M and 7 M nitric acid,
followed by elution of clean Sr in 0.05 M nitric acid. The total blank,
including syringe-filtering, is ≤0.1 ng, implying sample to blank ratios of
≥4000; no blank corrections were therefore deemed necessary.
Strontium isotope analyses were carried out on a “Nu Plasma” multi-
collector ICPMS (Nu Instruments, Wrexham, UK) interfaced with an
ARIDUS desolvating nebulizer, operated at an uptake rate of ~40 µL
min-1. Mass bias was corrected by normalizing to 88Sr/86Sr = 8.37521 and
results reported relative to a value of 0.710230 for the SRM987 Sr isotope
standard. Internal precisions (2SE) based on at least 30 ten-second
integrations averaged ± 0.00002 and average reproducibility (2SD) was
± 0.00004.
2.4.6 Otolith preparation and 87Sr/86Sr analysis
Sagittal otoliths were dissected and mounted individually in
CrystalbondTM, proximal surface downwards, on an acid-washed glass
slide and polished down to the primordium using a graded series of
wetted lapping films (9, 5, 3 μm) and alumina slurry (0.5 μm). The slide
was then reheated and the polished otolith transferred to a ‘master’
slide, on which otoliths from all collection sites were combined and
arranged randomly to remove any systematic bias during analysis. The
samples were rinsed in Milli-Q water (Millipore) and air dried overnight in
a class 100 laminar flow cabinet at room temperature.
Laser ablation – inductively coupled plasma mass spectrometry (LA-
ICPMS) was used to measure 87Sr/86Sr in the otoliths. The experimental
system consisted of a ‘‘Nu Plasma’’ multi-collector LA-ICPMS (Nu
Instruments, Wrexham, UK), coupled to a HelEx laser ablation system
(Laurin Technic, Canberra, Australia, and the Australian National
University) constructed around a Compex 110 excimer laser (Lambda
Physik, Gottingen, Germany) operating at 193 nm. Otolith mounts were
Ye, Q. et al. (2015) Monitoring of ecological responses to the delivery of CEW in the
lower River Murray during 2011-12
39 SARDI Aquatic Sciences
placed in the sample cell and the primordium of each otolith was
located visually with a 400× objective and video imaging system. The
intended ablation path on each sample was then digitally plotted
using GeoStar v6.14 software (Resonetics, USA). Each otolith was
ablated along a transect from the primordium to the dorsal margin at
the widest radius using a 6 ×100 μm rectangular laser slit. The laser was
operated at 90 mJ, pulsed at 10 Hz and scanned at 3 μm sec-1 across
the sample. Ablation was performed under pure He to minimise the re-
deposition of ablated material, and the sample was then rapidly
entrained into the Ar carrier gas flow. A pre-ablation step using
reduced energy (50 mJ) was conducted along each transect to
remove any surface contaminants and a 20-30 sec background was
measured prior to acquiring data for each sample. Corrections for Kr
and 87Rb interferences were made following closely the procedures of
Woodhead et al. (2005) and mass bias was then corrected by
reference to an 86Sr/88Sr ratio of 0.1194. Iolite Version 2.13 (Paton et al.
2011) that operates within IGOR Pro Version 6.2.2.2 (WaveMetrics, Inc.,
Oregon) was used to process data offline, with data corrected for
potential Ca argide/dimer interferences.
A modern marine carbonate standard composed of mollusc shells
(87Sr/86Sr value of 0.70916 according to long-term laboratory
measurements, identical to the accepted modern seawater value of
0.709160 - MacArthur and Howarth 2004) was analysed after every 10
otolith samples to allow for calculation of external precision. Mean (±1
SD) values of 87Sr/86Sr values in the modern marine carbonate standard
(n = 24) run throughout the analyses were 0.70918 ± 0.00017, with
external precision (expressed as ± 2 SE) calculated as ± 0.00006. Mean
within-run precision, measured as ± 2 SE, was ± 0.00005.
2.5 Salt and nutrient transport
Water quality was assessed between November 2011 and June 2012
(Table 2). At each sampling site, measurements of water temperature,
Ye, Q. et al. (2015) Monitoring of ecological responses to the delivery of CEW in the
lower River Murray during 2011-12
40 SARDI Aquatic Sciences
electrical conductivity, dissolved oxygen, pH and turbidity were taken.
In addition, water samples were collected and sent to the Australian
Water Quality Centre, an accredited laboratory of the National
Association of Testing Authorities, for analysis of nutrient concentrations.
Table 2. Sampling dates of sites in the three areas of study of salt and nutrient
transport.
Sites Sampling dates
Lower River
Murray
01/02/12, 16/02/12, 29/02/12, 15/03/12, 29/03/12, 17/04/12,
3/05/12, 17/05/12, 8/06/12, 28/06/12
Lower Lakes 15/11/11, 13/12/11, 12/01/12, 16/02/12, 14/03/12, 12/04/2012,
15/05/12, 27/06/12
Coorong 02/02/12, 15/02/12, 28/02/12, 14/03/12, 28/03/12, 16/04/12,
2/05/12, 16/05/12, 7/06/12, 27/06/12
The physico-chemical information was incorporated into a three-
dimensional hydrodynamic-biogeochemical model, ELCOM-CAEDYM,
which has been used extensively within the region (Hipsey and Busch
2012). For this study, two simulations were run and compared for
1 October 2011 to 1 July 2012 – with and without environmental water
provisions. The model was initialised with data from a range of sources,
including Lock 1 inflows with and without environmental water
provisions (provided by the MDBA). The flow data were treated as
indicative due to complexities around interstate water accounting,
which are likely to have resulted in an underestimation of
environmental flow volumes and thus an underestimation of the
influence of environmental flows on salt and nutrient transport.
Although assumptions such as these result in uncertainty in the model
outputs (refer to Aldridge et al. 2013 for more detail), the model proved
to be useful in assessing the general water quality response. The
differences in salt and nutrient concentrations between the three
water-bodies studied were captured in the model outputs. However,
temporal differences at individual sites were not captured particularly

Ye, Q. et al. (2015) Monitoring of ecological responses to the delivery of CEW in the
lower River Murray during 2011-12
41 SARDI Aquatic Sciences
well in the model outputs. When assessing the relative differences
between the two scenarios the uncertainties influence the accuracy of
both equally. Consequently, modelled concentrations and loads
should not be treated as absolute values, but instead as an indication
of the general response to environmental water provisions in the region.
For detailed information on the modelling approach refer to Aldridge
et al. (2013) and Hipsey and Busch (2012).
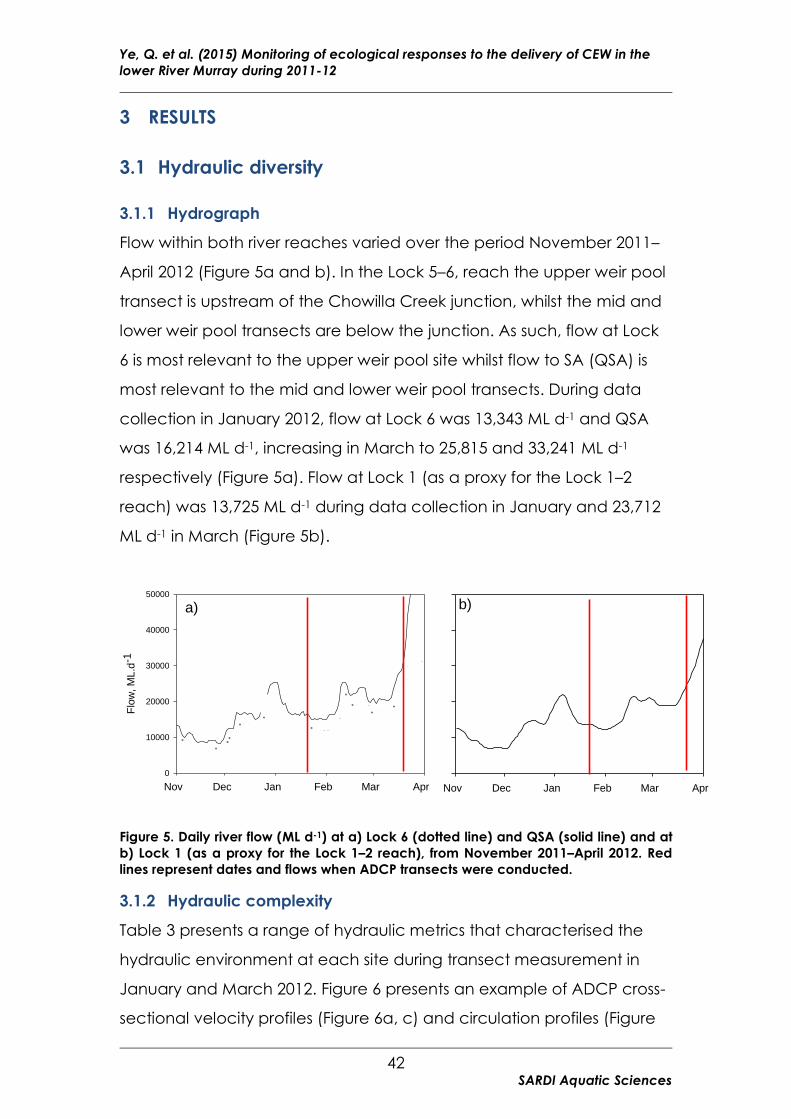
Ye, Q. et al. (2015) Monitoring of ecological responses to the delivery of CEW in the
lower River Murray during 2011-12
42 SARDI Aquatic Sciences
3 RESULTS
3.1 Hydraulic diversity
3.1.1 Hydrograph
Flow within both river reaches varied over the period November 2011–
April 2012 (Figure 5a and b). In the Lock 5–6, reach the upper weir pool
transect is upstream of the Chowilla Creek junction, whilst the mid and
lower weir pool transects are below the junction. As such, flow at Lock
6 is most relevant to the upper weir pool site whilst flow to SA (QSA) is
most relevant to the mid and lower weir pool transects. During data
collection in January 2012, flow at Lock 6 was 13,343 ML d-1 and QSA
was 16,214 ML d-1, increasing in March to 25,815 and 33,241 ML d-1
respectively (Figure 5a). Flow at Lock 1 (as a proxy for the Lock 1–2
reach) was 13,725 ML d-1 during data collection in January and 23,712
ML d-1 in March (Figure 5b).
Figure 5. Daily river flow (ML d-1) at a) Lock 6 (dotted line) and QSA (solid line) and at
b) Lock 1 (as a proxy for the Lock 1–2 reach), from November 2011–April 2012. Red
lines represent dates and flows when ADCP transects were conducted.
3.1.2 Hydraulic complexity
Table 3 presents a range of hydraulic metrics that characterised the
hydraulic environment at each site during transect measurement in
January and March 2012. Figure 6 presents an example of ADCP cross-
sectional velocity profiles (Figure 6a, c) and circulation profiles (Figure
Nov Dec Jan Feb Mar Apr Nov Dec Jan Feb Mar Apr
Flo
w, M
L.d
-1
0
10000
20000
30000
40000
50000
a) b)
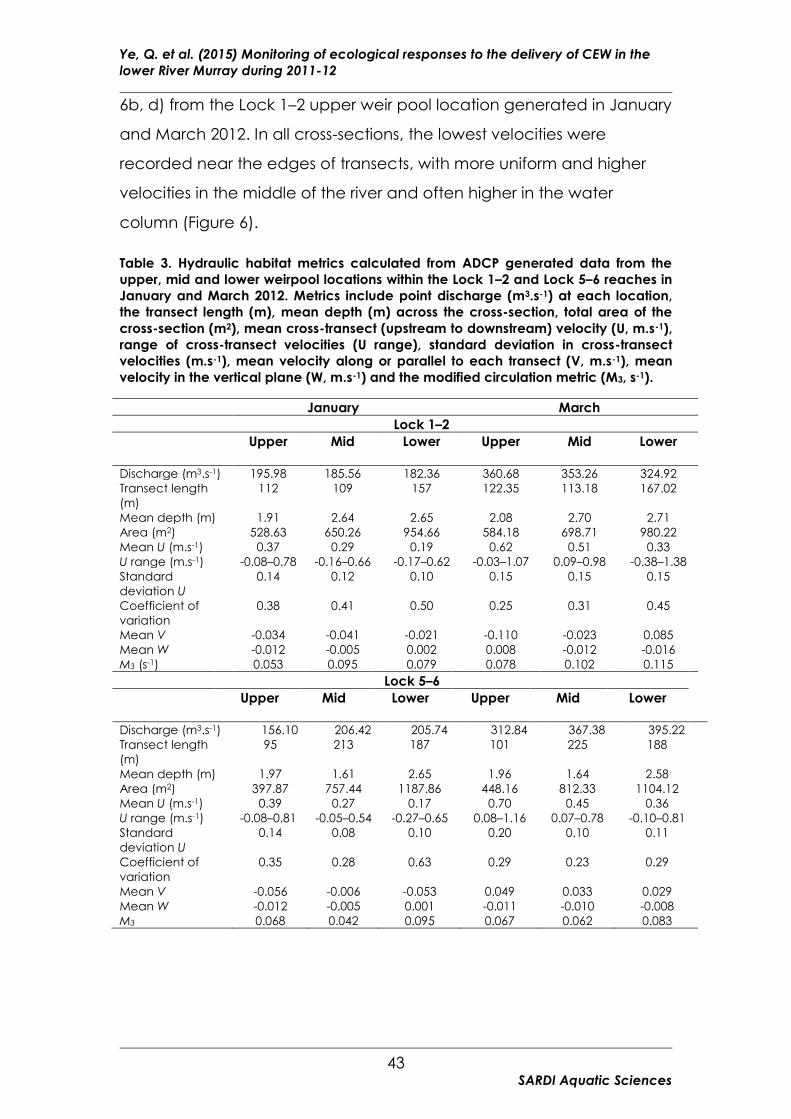
Ye, Q. et al. (2015) Monitoring of ecological responses to the delivery of CEW in the
lower River Murray during 2011-12
43 SARDI Aquatic Sciences
6b, d) from the Lock 1–2 upper weir pool location generated in January
and March 2012. In all cross-sections, the lowest velocities were
recorded near the edges of transects, with more uniform and higher
velocities in the middle of the river and often higher in the water
column (Figure 6).
Table 3. Hydraulic habitat metrics calculated from ADCP generated data from the
upper, mid and lower weirpool locations within the Lock 1–2 and Lock 5–6 reaches in
January and March 2012. Metrics include point discharge (m3.s-1) at each location,
the transect length (m), mean depth (m) across the cross-section, total area of the
cross-section (m2), mean cross-transect (upstream to downstream) velocity (U, m.s-1),
range of cross-transect velocities (U range), standard deviation in cross-transect
velocities (m.s-1), mean velocity along or parallel to each transect (V, m.s-1), mean
velocity in the vertical plane (W, m.s-1) and the modified circulation metric (M3, s-1).
January March
Lock 1–2
Upper Mid Lower Upper Mid Lower
Discharge (m3.s-1) 195.98 185.56 182.36 360.68 353.26 324.92
Transect length
(m)
112 109 157 122.35 113.18 167.02
Mean depth (m) 1.91 2.64 2.65 2.08 2.70 2.71
Area (m2) 528.63 650.26 954.66 584.18 698.71 980.22
Mean U (m.s-1) 0.37 0.29 0.19 0.62 0.51 0.33
U range (m.s-1) -0.08–0.78 -0.16–0.66 -0.17–0.62 -0.03–1.07 0.09–0.98 -0.38–1.38
Standard
deviation U
0.14 0.12 0.10 0.15 0.15 0.15
Coefficient of
variation
0.38 0.41 0.50 0.25 0.31 0.45
Mean V -0.034 -0.041 -0.021 -0.110 -0.023 0.085
Mean W -0.012 -0.005 0.002 0.008 -0.012 -0.016
M3 (s-1) 0.053 0.095 0.079 0.078 0.102 0.115
Lock 5–6
Upper Mid Lower Upper Mid Lower
Discharge (m3.s-1) 156.10 206.42 205.74 312.84 367.38 395.22
Transect length
(m)
95 213 187 101 225 188
Mean depth (m) 1.97 1.61 2.65 1.96 1.64 2.58
Area (m2) 397.87 757.44 1187.86 448.16 812.33 1104.12
Mean U (m.s-1) 0.39 0.27 0.17 0.70 0.45 0.36
U range (m.s-1) -0.08–0.81 -0.05–0.54 -0.27–0.65 0.08–1.16 0.07–0.78 -0.10–0.81
Standard
deviation U
0.14 0.08 0.10 0.20 0.10 0.11
Coefficient of
variation
0.35 0.28 0.63 0.29 0.23 0.29
Mean V -0.056 -0.006 -0.053 0.049 0.033 0.029
Mean W -0.012 -0.005 0.001 -0.011 -0.010 -0.008
M3 0.068 0.042 0.095 0.067 0.062 0.083

Ye, Q. et al. (2015) Monitoring of ecological responses to the delivery of CEW in the lower River Murray during 2011-12
44 SARDI Aquatic Sciences
Figure 6. Horizontal current velocity (m.s-1) and circulation (i.e. M3, curl.s-1) profiles generated for the Lock 1–2 weir pool upper location in January (a
& b) and March 2012 (c & d). Current velocity plots (a & c) present cross-transect velocities (U) in cells 0.5 m in width x 0.25 m in height. Circulation
plots (b & d) present a combination of velocities in the vertical and horizontal planes (i.e. along-transect, W, and vertically, V), transverse to the
banks, with vectors representing the direction of rotation.

Ye, Q. et al. (2015) Monitoring of ecological responses to the delivery of CEW in the
lower River Murray during 2011-12
45 SARDI Aquatic Sciences
Lock 1–2
Mean cross-transect velocities (U) differed significantly between both
weir pool location (i.e. upper, middle, lower) (ANOVA; F2, 24864 =
5468.39, p < 0.001) and months (i.e. different flow bands, F1, 24864 =
12,171.40, p < 0.001) and there was a significant interaction (F2, 24864 =
5.93, p < 0.001). This indicates that the change in mean velocity
between months across weir pool locations were of significantly
different magnitudes. Mean velocity was greatest in the upper weir
pool and decreased to be least in the lower weir pool location during
both flow bands (Figure 7a). Cross-transect velocity ranges increased
and mean velocity increased significantly at each weir pool location
with increasing flow between January and March (Table 3; Figure 7a).
Standard deviation, as a measure of variation in the cross-sectional
velocities increased marginally at all locations, however, the
coefficient of variation decreased slightly at all sites (Table 3).
Additionally, the modified circulation metric (M3) increased at each
location between January and March (Table 3) indicating that the
strength and frequency of eddies in river cross-sections was greater
under higher flow conditions.

Ye, Q. et al. (2015) Monitoring of ecological responses to the delivery of CEW in the
lower River Murray during 2011-12
46 SARDI Aquatic Sciences
Figure 7. Mean cross-transect velocity (U, m.s-1) ± standard deviation at the upper,
mid and lower weir pool location transects of a) the Lock 1–2 reach and b) the Lock
5–6 reach in January and March 2012.
Lock 5–6
Cross-transect velocities differed significantly between both weir pool
location (i.e. upper, middle, lower) (ANOVA; F2, 25096 = 8517.79, p <
0.001) and month (i.e. different flow bands, F1, 25096 = 17,580.17, p <
0.001) and there was a significant interaction (F2, 25096 = 6.62, p <
0.001), indicating that the change in mean velocity between months
across weir pool locations were of different magnitudes. Similar to the
Lock 1–2 reach, mean velocity was greatest in the upper weir pool and
decreased gradually to be lowest in the lower weir pool during both
flow bands (Figure 7b). Cross-transect velocity ranges increased and
mean velocity increased significantly at each weir pool location with
increasing flow (Table 3; Figure 7b). Standard deviation, as a measure
of variation in the cross-sectional velocities increased at all locations
Mean c
ross-t
ransect
velo
city (
m.s
-1)
0.0
0.2
0.4
0.6
0.8
1.0
January
March
a)
Upper Mid Lower
0.0
0.2
0.4
0.6
0.8
1.0
b)

Ye, Q. et al. (2015) Monitoring of ecological responses to the delivery of CEW in the
lower River Murray during 2011-12
47 SARDI Aquatic Sciences
but only marginally in the mid and lower weir pool, whilst the
coefficient of variation decreased at all sites (Table 3). The modified
circulation metric (M3) did not increase between January and March in
the upper weir pool but increased substantially in the mid weir pool
(Table 3). M3 also appeared to decrease in the lower weir pool location
between January and March but this was due to erroneous readings in
the January transect at this site which likely elevated the value of M3.
3.1.3 Comparison of measured vs modelled average velocity
In the Lock 5–6 weir pool, mean velocities derived from DEWNR
modelling at QSA of 13,000 and 24,000 ML d-1, and the Water
Technology modelling at QSA of 15,000 and 20,000 ML d-1, appeared
quite accurate when compared to measured mean velocities at QSA
of 16,214 and 33,241 ML d-1 (Figure 8a). Water Technology modelling for
the upper weir pool at 40,000 ML d-1, however, appeared to
underestimate mean velocity, being considerably lower than
measured mean velocity at QSA of 33,241 ML d-1 (Figure 8a). At QSA of
~13,000 ML d-1, measured and modelled mean velocities were
comparable throughout the Lock 1–2 reach (Figure 8b). At the higher
discharge of ~24,000 ML d-1, there was greater variation between
measured and modelled mean velocities with DEWNR modelling
underestimating velocity, particularly in the upper weir pool (Figure 8b).

Ye, Q. et al. (2015) Monitoring of ecological responses to the delivery of CEW in the
lower River Murray during 2011-12
48 SARDI Aquatic Sciences
Figure 8. Comparison of mean measured velocities (black symbols) against
WaterTech modelled (red symbols; Lock 5–6 upper weir pool only) and DEWNR
modelled mean velocities (white symbols) in the upper weir pool (circles), mid weir
pool (squares) and lower weir pool (triangles) of a) the Lock 5–6 reach and b) the
Lock 1–2 reach under varying discharge (QSA; ML d-1). For the Lock 5–6 reach, QSA is
used for simplicity despite the upper weir pool transect being above the Chowilla
Creek junction, typically resulting in a lower discharge at this location compared to
the mid and lower weir pool, which are downstream of the Chowilla Creek junction.
10000 15000 20000 25000 30000 35000 40000 45000
Mean v
elo
city (
m.s
-1)
0.0
0.1
0.2
0.3
0.4
0.5
0.6
0.7
0.8Upper actual
Mid actual
Lower actual
Upper - Water Tech
Upper - DEWNR
Mid - DEWNR
Lower - DEWNR
a)
Discharge (ML.d-1)
10000 12000 14000 16000 18000 20000 22000 24000 26000
Mean v
elo
city (
m.s
-1)
0.0
0.1
0.2
0.3
0.4
0.5
0.6
0.7Upper actual
Mid actual
Lower actual
Upper - DEWNR
Mid - DEWNR
Lower - DEWNR
b)

Ye, Q. et al. (2015) Monitoring of ecological responses to the delivery of CEW in the
lower River Murray during 2011-12
49 SARDI Aquatic Sciences
3.2 Golden perch larvae and larval fish assemblage
3.2.1 Environmental variables
During 2011-12, water discharge mostly remained within-channel
(<50,000 ML d-1) in the lower River Murray with flow pulses occurring in
early spring and summer (Appendix II). The natural summer flow pulse
peaked at ~21,000 ML d-1 at both sites (~26,000 ML d-1 at the South
Australian border) and was supported with the release of a
considerable volume of Commonwealth environmental water to the
lower River Murray. Discharge in 2011-12 was lower than the previous
flood year (i.e. 2010-11) but was much greater than those during 2005-
2008. Discharge in 2005-06 exceeded the summer Entitlement Flow
(~7,000 ML d-1) but remained within-channel; flow pulses occurred from
October to December at both sites with a maximum discharge of
~13,500 ML d-1 in November at Site 1 (~15,100 ML d-1 at the South
Australian border) in the lower River Murray (Appendix II). Due to
continuous drought conditions, discharge in 2006, 2007 and 2008
reduced to below Entitlement Flow (Appendix II). In late 2010, a
dramatic increase in discharge of natural flows led to overbank flows
and extensive flooding in the lower River Murray with flow peaking at
>80,000 ML d-1 at both sites (~93,000 ML d-1 at the South Australian
border) in February 2011 (Appendix II).
Water level in 2011-12 largely remained above pool level and the
variation pattern was similar to daily discharge at both sites (Appendix
III). In previous years, relative water level also generally reflected
discharge, particularly at Site 2. At Site 1, relative water level showed a
steady decrease from 2006-07 to 2009-10, reaching -1.8 m in July 2009;
whilst at Site 2, it remained relatively stable at pool level (Appendix III).
In 2010-11, a return to above pool height was recorded for both sites.
The increase in discharge in 2010-11 caused a considerable rise in the
water level at both sites, resulting in the overbank flood around late
November 2011.
Ye, Q. et al. (2015) Monitoring of ecological responses to the delivery of CEW in the
lower River Murray during 2011-12
50 SARDI Aquatic Sciences
Mean daily conductivity varied from 168 to 455 μS cm-1 at Site 1 and
141 to 413 μS cm-1 at Site 2 during the larval sampling period (October
to March) in 2011-12 (Appendix IV). Conductivity was consistently
higher at Site 1 than Site 2, with the difference between sites being
more pronounced during the low flow yeas (2005-06–2009-10) than
high flow/flood years (2010-11 and 2011-12). At Site 1, there was a
general trend of increase in conductivity from 2005-06 to 2009-10
followed by a noticeable reduction in 2010-11 and 2011-12 when
discharge increased. At Site 2, conductivity mostly varied between
100–300 μS cm-1 with a few highs close to 400 μS cm-1 in 2007-08, 2008-
09 and 2011-12.
Mean daily water temperature ranged between 16 and 27 °C at both
sites during the study period from October to March in 2011-12
(Appendix V). Over the last seven years, changes in water temperature
reflected seasonal variation. There was little difference between the
sites and the seasonal pattern was generally consistent, with
temperature increasing steadily from spring to summer.
3.2.2 Catch summary
Ten fish species (nine native and one exotic) were collected in 2011-12
(Table 4). The number of native species was the same as those in 2010-
11 and 2005-06, but greater than during the drought years (2006-07 to
2008-09). The number of native species sampled at Site 1 was the
highest in 2011-12 compared to the previous five study years.
In 2011-12, the most abundant species collected were the small to
medium-bodied native species, Australian smelt, bony herring
(Nematalosa erebi), carp gudgeon (Hypseleotris spp.) and flathead
gudgeons (Philypnodon spp.), and a large-bodied flow-cued spawning
species, golden perch. Less abundant native species collected
included hardyhead (Craterocephalus spp.), Murray cod
(Maccullochella peelii), freshwater catfish (Tandanus tandanus) and
silver perch. For the exotic species, carp (Cyprinus carpio) were
Ye, Q. et al. (2015) Monitoring of ecological responses to the delivery of CEW in the
lower River Murray during 2011-12
51 SARDI Aquatic Sciences
sampled in low numbers but no redfin perch (Perca fluviatilis) were
collected in 2011-12.

Ye, Q. et al. (2015) Monitoring of ecological responses to the delivery of CEW in the lower River Murray during 2011-12
52 SARDI Aquatic Sciences
Table 4. Summary of species and total number of larval fish sampled at Sites 1 and 2 in the lower River Murray in 2011-12 (shaded) and previous years (2005-06–2010-11 except 2009-10).
Species Site 1 (D/S Lock 1) Site 2 (D/S Lock 6) Total Common name Scientific name 2005-06 2006-07 2007-08 2008-09 2010-11 2011-12 2005-06 2006-07 2007-08 2008-09 2010-11 2011-12 2005-06 2006-07 2007-08 2008-09 2010-11 2011-12
Australian smelt Retropina semoni 1,426 6,833 8,951 630 4 407 280 2,763 7,797 3,421 27 66 1,706 9,596 16,748 4,051 31 473
Bony herring Nematalosa erebi 1,045 2,253 117 348 4 865 355 1,002 3,530 357 21 117 1,400 3,255 3,647 705 25 982
Carp gudgeon Hypseleotris spp. 1,487 1,960 4,885 1,991 44 183 589 505 2,486 350 18 102 2,076 2,465 7,371 2,341 62 285
Flathead gudgeon Philypnodon grandiceps 251 3,209 6,674 6,931 74 321 493 1,034 2,336 489 37 159 744 4,243 9,010 7,420 111 480
Hardyhead Craterocephalus spp. 4 - 14 34 - 1 1 20 10 1 1 2 5 20 24 35 1 3
Freshwater catfish Tandanus tandanus 1 - - - 1 1 10 4 - 4 1 6 11 4 - 4 2 7
Golden perch Macquaria ambigua ambigua - - - - 69 530 39 - - - 63 105 39 - - - 132 635
Murray cod Maccullochella peelii 3 - - - 14 1 3 4 2 - 10 1 6 4 2 - 24 2
Silver perch Bidyanus bidyanus - - - - 5 12 13 - - - 1 5 13 - - - 6 17
Carp Cyprinuns carpio 3 - 9 109 27 1 15 2 4 3 66 5 18 2 13 112 93 6
Redfin Perca fluviatilis - - 5 - 74 - 1 18 - - - - 1 18 5 - 74 -
Eggs 1,955 839 695 81 - - - - 2,650 920
Free embryos 84 9 - - - - 93 -
Total 4,220 14,255 20,655 10,043 2,355 3,161 1,799 5,352 16,165 4,625 949 649 6,019 19,607 36,820 14,668 3,304 3,810
Yearly Catch (%) 70.1 72.7 56.1 68.5 71.3 83.0 29.9 27.3 43.9 31.5 28.7 17.0
Number of Trips 7 7 6 6 7 11 7 7 6 6 7 11 7 7 6 6 7 11
No. of fish per trip 603 2,036 3,442 1,674 336 287 257 765 2,694 771 136 59 860 2,801 6,137 2,445 472 346
No. of species 8 4 7 6 10 10 11 9 7 7 10 10 11 9 8 7 11 10
No. of native species 7 4 5 5 8 9 9 7 6 6 9 9 9 7 6 6 9 9

Ye, Q. et al. (2015) Monitoring of ecological responses to the delivery of CEW in the
lower River Murray during 2011-12
53 SARDI Aquatic Sciences
3.2.3 Golden perch larval abundance in response to flows
As a flow-cued spawning species, golden perch pre-flexion larvae
were identified and used as an indicator of local spawning events or
newly spawned drifters from other areas close by. In 2011-12, there was
a peak in pre-flexion larvae abundance in October and November at
both Site 1 and Site 2, suggesting a major spawning event in spring
(Figure 9). This coincided with the falling phase of a natural spring flow
of ~35,000 ML d-1 and a temperature rise to >18 °C (Figure 9). The
discharge of natural flow declined to <10,000 ML d-1 in November
although some environmental water was released to reduce the rate
of recession. Between December 2011 and January 2012, a substantial
volume of environmental water was delivered, which enhanced a
within-channel natural flow pulse up to 26,000 ML d-1 (at the South
Australian border) and extended the flow recession during summer
(Figure 9). In February, small volumes of additional environmental water
delivered to the lower River Murray added to a natural flow increase
from ~15,000 to 25,000 ML d-1 (at the South Australian border).
Additional pre-flexion larvae were sampled in moderate abundance,
particularly at Site 1, between late January and early March 2012
(Figure 9). This increased presence of golden perch larvae during
summer followed the within-channel flow pulses enhanced by
environmental flows (Figure 9).
The size compositions of all golden perch larvae caught each month
from Site 1 and Site 2 during the 2011-12 water year are presented in
Figure 10, including the late stage larvae (i.e. post-flexion larvae). There
were pre- and post-flexion larvae found at both sites with size ranging
from 2–14 mm (TL), which probably comprised larvae from locally
spawned fish as well as larvae which drifted downstream from the
upstream reaches of the Murray–Darling River. The presence of pre-
flexion golden perch larvae from October to December at Site 2 and
throughout the sampling period at Site 1 suggests spawning activities in
the lower River Murray. The numbers of larvae collected were highly

Ye, Q. et al. (2015) Monitoring of ecological responses to the delivery of CEW in the
lower River Murray during 2011-12
54 SARDI Aquatic Sciences
variable between months with November representing 82% of the total
catch (Site 1: 69% and Site 2: 13%).
The patterns of golden perch larval abundance in 2011-12 were
compared with those in previous years (2005-06 to 2010-11) under
different flow scenarios in the lower River Murray (Figure 11). Over six
study years, pre-flexion golden perch larvae were only found in the
flood and high flow years (2010-11 and 2011-12) (Figure 11); no pre-
flexion larvae were found between 2005-06 and 2008-09 when
discharge to SA was generally below 15,000 ML d-1 (at the South
Australian border) (Figure 11). Although some golden perch larvae
were collected in 2005-06, all larvae sampled were at later stages of
development and therefore not shown on Figure 11. In both 2010-11
and 2011-12, pre-flexion larvae seemed to be more abundant at Site 1,
however, no significant difference was detected between sites
(p=0.233) or years (p=0.817) for the common sampling period from
October to January, probably due to high variability in larval
abundance between trips. In both years, there was a peak in larval
abundance in late spring/early summer although it occurred slightly
earlier in 2011-12 (November) than in 2010-11 (December); pre-flexion
larvae continued to be found in January during 2011-12 but not in 2010-
11 (Figure 11). During 2011-12, ongoing sampling during the summer
following environmental flow releases collected more early stage
larvae after January, suggesting potential multiple spawning events in
the lower River Murray (Figures 9 and 10).

Ye, Q. et al. (2015) Monitoring of ecological responses to the delivery of CEW in the
lower River Murray during 2011-12
55 SARDI Aquatic Sciences
Figure 9. Relative abundance of pre-flexion golden perch larvae sampled in each trip
during 2011-12 at Sites 1 (a) and 2 (b) in the lower River Murray. Note scale difference
in left Y axis between figures a) and b). Sampling started on October 11 2011. Data
presented as the mean of the 6 replicates ± standard error. Water discharge at each
site (black line) and at the SA border (blue line) and temperature (red line) are also
presented for the sampling period. Green line represents period when
Commonwealth environmental water was delivered. Stars indicate that NO sampling
occurred during that week.
b)
a)
Trip date
02-A
ug-1
1
16-A
ug-1
1
30-A
ug-1
1
13-S
ep-1
1
27-S
ep-1
1
11-O
ct-
11
25-O
ct-
11
08-N
ov-
11
22-N
ov-
11
06-D
ec-1
1
20-D
ec-1
1
03-J
an-1
2
17-J
an-1
2
31-J
an-1
2
14-F
eb-1
2
28-F
eb-1
2
13-M
ar-
12
27-M
ar-
12
0
20
40
60
80
100
0
10000
20000
30000
40000
° C
15
19
23
27
Re
lati
ve
ab
un
da
nc
e
0
50
100
150
200
250
300D
isc
ha
rge
(ML
da
y-1
)
0
10000
20000
30000
40000° C
15
19
23
27

Ye, Q. et al. (2015) Monitoring of ecological responses to the delivery of CEW in the
lower River Murray during 2011-12
56 SARDI Aquatic Sciences
Figure 10. Length frequency distributions of golden perch larvae from October 2011 to
March 2012 samples collected at Sites 1 and 2 in the lower River Murray. Dotted line
indicates length when flexion of the notochord occurs (i.e. 6.1 mm).
March 2012
TL (mm)
2-3 3-4 4-5 5-6 6-7 7-8 8-9 9-10 10-11 11-12 12-13 13-14
0
5
10
15
20
25
120
125
Site 1 (n=20)
Site 2 (n=0)
February 2012
Nu
mb
er
of
fish
la
rva
e
0
5
10
15
20
25
120
125
Site 1 (n=39)
Site 2 (n=1)
November 2011
25
50
75
100
125
Site 1 (n=430)
Site 2 (n=83)
October 2011
25
50
75
100
125
Site 1 (n=34)
Site 2 (n=8)
January 2012
0
2
4
120
125
0
2
4
120
125
December 2011Site 1 (n=1)
Site 2 (n=5)
Site 1 (n=6)
Site 2 (n=0)

Ye, Q. et al. (2015) Monitoring of ecological responses to the delivery of CEW in the lower River Murray during 2011-12
57
SARDI Aquatic Sciences
Figure 11. Relative abundance of pre-flexion golden perch larvae sampled in each trip at Sites 1 and 2 in the lower River Murray between 2005-06
and 2011-12 (no sampling in 2009).Data presented as the mean of the 6 replicates ± standard error. Water discharge for both sites is also presented
for this period. Temporal extent of sampling season is shaded for each year.
2011/12
11
/Oct
25
/Oct
08
/No
v
22
/No
v
6/D
ec
20
/De
c
17
/Ja
n
31
/Ja
n
14
/Fe
b
28
/Fe
b
13
/Ma
r
0
20000
40000
60000
80000
2005/06
Rela
tive a
bu
nd
an
ce
0
50
100
150
200
250
300
2006/07 2007/08
Dis
ch
arg
e (M
L p
er d
ay)
0
20000
40000
60000
80000
2008/09
11
/Oct
25
/Oct
08
/No
v
22
/No
v
6/D
ec
20
/De
c
17
/Ja
n
31
/Ja
n
14
/Fe
b
28
/Fe
b
13
/Ma
r
0
50
100
150
200
250
300
2010/11
Trip date
11
/Oct
25
/Oct
08
/No
v
22
/No
v
6/D
ec
20
/De
c
17
/Ja
n
31
/Ja
n
14
/Fe
b
28
/Fe
b
13
/Ma
r
Site 1
Site 2Discharge - Site 2
Discharge - Site 1
Ye, Q. et al. (2015) Monitoring of ecological responses to the delivery of CEW in the
lower River Murray during 2011-12
58 SARDI Aquatic Sciences
3.2.4 Larval fish assemblages
Principal component analysis indicated that the larval fish assemblage
in 2011-12 showed a distinct separation from the drought (2006-07 to
2008-09) years (Figure 12, Appendix VI). Assemblage structure in 2011-
12 was more similar to the flood year (2010-11). Interestingly, samples
from 2005-06, a low within-channel flow year, interspersed among the
samples from drought years (2006-07 to 2008-09) and those from 2011-
12. The total variation in larval fish assemblages was well captured by
PCO1 and PCO2 (55%)(Figure 12). The four small to medium-bodied
species (Australian smelt, carp gudgeon, flathead gudgeon and bony
herring) appeared to strongly characterise fish assemblages during the
drought years; whereas large-bodied species (golden perch, silver
perch, perch free embryos, carp, Murray cod and freshwater catfish)
appeared to be more correlated to samples in high within-channel
flow and flood years (2010-11 and 2011-12).
In 2011-12, although larval fish assemblages did not differ significantly
between Site 1 and Site 2, the pattern of variation compared to
previous years differed between the two sites. At Site 1, the difference
in the larval assemblage of 2011-12 compared to 2010-11 (the previous
flood year) was mainly attributed to the greater abundances of golden
perch and the four small to medium-bodied species and the absence
of perch hatchlings; whereas at Site 2, it was explained by a substantial
reduction in carp, a moderate decline in golden perch and increased
abundances of flathead gudgeon, bony herring and carp gudgeon
(Appendix VII). Comparing larval fish assemblages between 2011-12
and previous low flow/drought years (2005-06 to 2008-09), the
difference was mainly attributed to reduced abundance of the small-
bodied species and variation in bony herring abundance at both Site 1
and Site 2 (Appendix VII). However, at Site 2, increased abundance in
golden perch in 2011-12 was also an important contributor to the
assemblage difference from 2005-06.
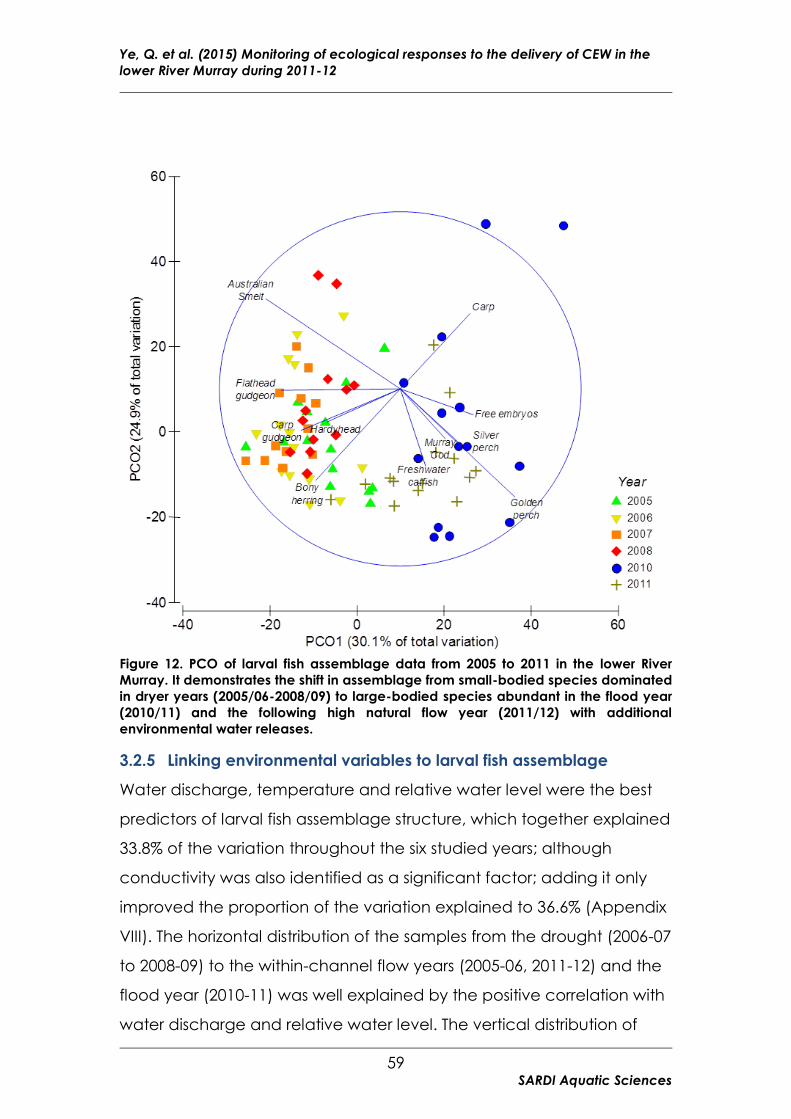
Ye, Q. et al. (2015) Monitoring of ecological responses to the delivery of CEW in the
lower River Murray during 2011-12
59 SARDI Aquatic Sciences
Figure 12. PCO of larval fish assemblage data from 2005 to 2011 in the lower River
Murray. It demonstrates the shift in assemblage from small-bodied species dominated
in dryer years (2005/06-2008/09) to large-bodied species abundant in the flood year
(2010/11) and the following high natural flow year (2011/12) with additional
environmental water releases.
3.2.5 Linking environmental variables to larval fish assemblage
Water discharge, temperature and relative water level were the best
predictors of larval fish assemblage structure, which together explained
33.8% of the variation throughout the six studied years; although
conductivity was also identified as a significant factor; adding it only
improved the proportion of the variation explained to 36.6% (Appendix
VIII). The horizontal distribution of the samples from the drought (2006-07
to 2008-09) to the within-channel flow years (2005-06, 2011-12) and the
flood year (2010-11) was well explained by the positive correlation with
water discharge and relative water level. The vertical distribution of

Ye, Q. et al. (2015) Monitoring of ecological responses to the delivery of CEW in the
lower River Murray during 2011-12
60 SARDI Aquatic Sciences
samples from all years was primarily driven by temperature and
reflected the seasonal variation of the samples (Figure 13).
Figure 13. dbRDA ordination of the fitted model of larval fish assemblage data versus
the environmental predictor variables, water discharge, relative water level,
temperature and conductivity in the lower River Murray. It demonstrates that the
horizontal separation of larval assemblages in 2011/12 and 2010/11 from those of the
drought years (2006/07-2008/09) was well explained by the increases in discharge
and relative water level.

Ye, Q. et al. (2015) Monitoring of ecological responses to the delivery of CEW in the
lower River Murray during 2011-12
61 SARDI Aquatic Sciences
3.3 Recruitment and natal origin of golden perch
3.3.1 Hydrology
From July to October 2011, flow in the lower River Murray (discharge at
the South Australian border, QSA) generally reflected flow in the mid-
reaches of the Murray at Euston. In both reaches, an extended
(~3 months) within-channel bank-full flow event peaked at
approximately 40,000 ML d-1 in August/September 2011 before
receding to approximately 10,000 ML d-1 in November 2011. Flow in the
Darling River was <1,000 ML d-1 throughout this period (Figure 14).
Between December 2011 and March 2012, flow in the River Murray at
Euston decreased to approximately 5,000 ML d-1 while flow in the
Darling at Burtundy increased to 15,000 ML d-1 and flow in the lower
Murray ranged 15–25,000 ML d-1 as a result of flow from the Darling and
water released from Lake Victoria (Figure 14).
From mid November 2011 to February 2012 the Commonwealth
Environmental Water Holder and the MDBA traded environmental
water from Goulburn, Murrumbidgee and Campaspe catchments to
the lower River Murray. From November 2011 to January 2012, 131 GL
of Commonwealth environmental water was delivered to the River
Murray in South Australia at a rate of ~1,000–5,000 ML d-1, this water was
traded from the Goulburn and Campaspe rivers but sourced from Lake
Victoria (Figure 14). From January to February 2012, 152 GL of
Commonwealth environmental water was delivered primarily from the
Darling River at a rate of approximately 4,000–5,000 ML d-1 (CEWO, pers
comm).

Ye, Q. et al. (2015) Monitoring of ecological responses to the delivery of CEW in the
lower River Murray during 2011-12
62 SARDI Aquatic Sciences
Figure 14. Discharge (ML d-1) in the River Murray at the South Australian border (solid
black line) and Euston (dotted black line), Darling River at Burtundy (dashed black
line), Frenchman’s Creek (Lake Victoria inlet, solid red line) and Rufus River (Lake
Victoria outlet, solid blue line).
3.3.2 Golden perch length and age structure
In 2012, golden perch populations sampled in the floodplain, gorge,
swamplands and lakes geomorphic regions of the lower River Murray
were dominated by 1 and 2 year old fish spawned in 2010-11 and 2009-
10 respectively (Figure 15). Proportions of these age-classes were
highest in the floodplain region where age 1+ and 2+ fish contributed
to 89% of the sampled population.
In the floodplain and gorge regions, YOY (age 0+) fish, spawned in
2011-12, comprised 9% and 6% respectively, of the sampled
populations and this age class was absent from the lower lakes and
swamplands (although only 7 golden perch in total were collected
from this region). The remainder of the sampled populations were
comprised of 6, 11 and 15 year old fish fish, spawned in 2005, 2000 and
1996 respectively and these cohorts generally represented <15% of the
sampled populations (Figure 15).
Jul 11 Aug 11 Sep 11 Oct 11 Nov 11 Dec 11 Jan 12 Feb 12 Mar 12 Apr 12 May 12 Jun 12 Jul 12
Dis
charg
e (
ML d
ay
-1)
0
10000
20000
30000
40000
50000
60000
70000
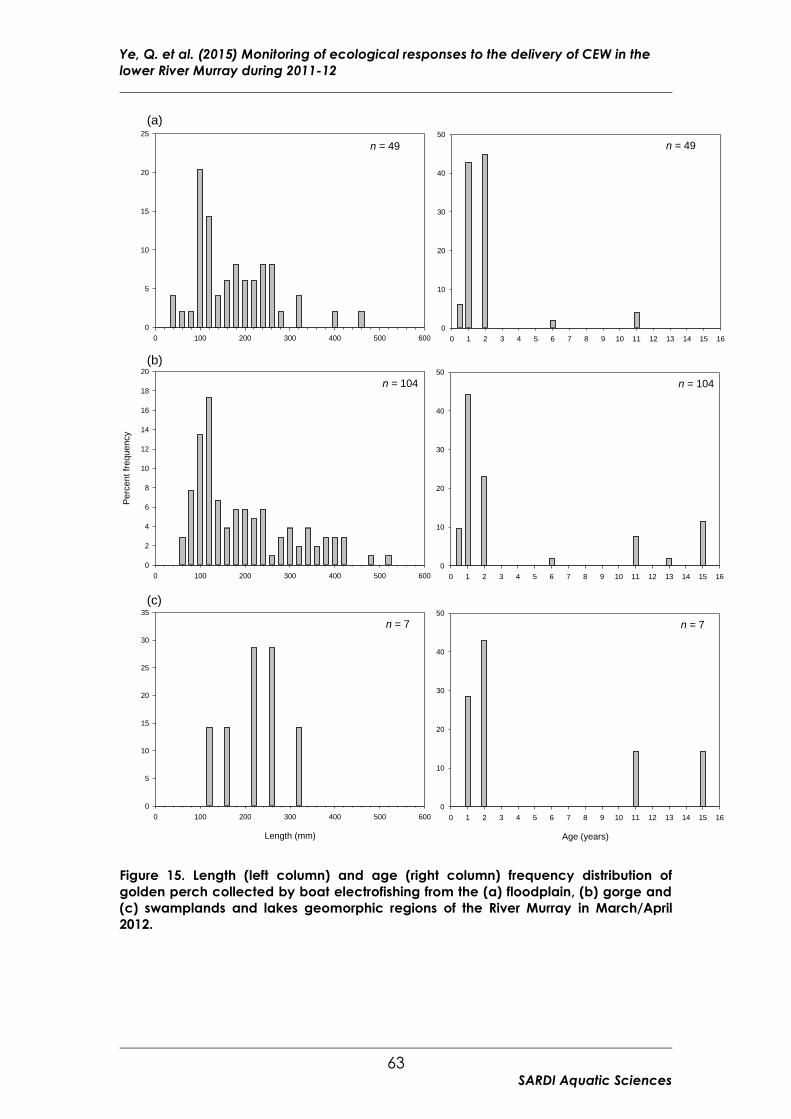
Ye, Q. et al. (2015) Monitoring of ecological responses to the delivery of CEW in the
lower River Murray during 2011-12
63 SARDI Aquatic Sciences
Figure 15. Length (left column) and age (right column) frequency distribution of
golden perch collected by boat electrofishing from the (a) floodplain, (b) gorge and
(c) swamplands and lakes geomorphic regions of the River Murray in March/April
2012.
0 100 200 300 400 500 600
0
5
10
15
20
25
n = 49
0 1 2 3 4 5 6 7 8 9 10 11 12 13 14 15 16
0
10
20
30
40
50
n = 49
0 100 200 300 400 500 600
Perc
ent
frequency
0
2
4
6
8
10
12
14
16
18
20
n = 104
0 1 2 3 4 5 6 7 8 9 10 11 12 13 14 15 16
0
10
20
30
40
50
n = 104
Length (mm)
0 100 200 300 400 500 600
0
5
10
15
20
25
30
35
n = 7
Age (years)
0 1 2 3 4 5 6 7 8 9 10 11 12 13 14 15 16
0
10
20
30
40
50
n = 7
(a)
(b)
(c)

Ye, Q. et al. (2015) Monitoring of ecological responses to the delivery of CEW in the
lower River Murray during 2011-12
64 SARDI Aquatic Sciences
3.3.3 Water and otolith 87Sr/86Sr signatures and spawn dates of YOY
golden perch
Water 87Sr/86Sr
When water sample collection began in mid-January 2012 a
substantial proportion of flow in the lower River Murray at the South
Australian border (QSA) was derived from the Darling River and 87Sr/86Sr
at Lock 9 and Lock 6 decreased towards the Darling River value
(nominally a temporally stable 0.7075), with a time lag at Lock 1 (Figure
16). As flows in the mid Murray significantly increased in March 2012,
87Sr/86Sr values again increased, exhibiting a mixed Murray and Darling
signature (Figure 16).
Spawn dates and otolith 87Sr/86Sr
Back-calculated spawn dates of fifteen YOY golden perch indicated
spawning between mid-October 2011 and early January 2012 (Figure
16). Four fish, spawned between 16 October and 11 November 2011,
had otolith core 87Sr/86Sr values indicative of the River Murray (Figure 16)
but in the absence of water samples from this period we cannot
establish if the spawning location was upstream or downstream of the
Darling River junction. A further 11 fish were spawned between the 27
November 2011 and 1 January 2012, with ten fish having otolith core
87Sr/86Sr values indicative of the Darling River and one fish exhibiting a
distinctly different 87Sr/86Sr value (0.7116), most likely a mixed Murray
and Darling signature, indicative of being spawned in the River Murray
downstream of the Darling junction (Figure 16).

Ye, Q. et al. (2015) Monitoring of ecological responses to the delivery of CEW in the
lower River Murray during 2011-12
65 SARDI Aquatic Sciences
Figure 16. Mean daily discharge in the River Murray at the South Australian border
(solid blue line) and Euston (dashed blue line), and Darling River at Burtundy (dotted
blue line). 87Sr/86Sr ratios in water samples collected from mid-January to mid-April
2012 in the River Murray at Lock 9 (solid red triangles), Lock 6 (open red circles) and
Lock 1 (solid red circles), and early-January in the Darling River (open red triangle).
Closed black squares represent spawn date and otolith core 87Sr/86Sr ratio of golden
perch (n = 15) collected in the lower River Murray from December 2011 to February
2012.
Life-history profiles for three YOY golden perch, based on transects of
87Sr/86Sr from the otolith core to edge, show that two fish spawned in
the Darling River (GP 243 and GP 231) exhibit modulation of 87Sr/86Sr
only mid-late in the fish’s lives thus potentially indicating that these fish
spent a substantial proportion of their early life in the Darling River
before entering the River Murray (Figure 17). These fish were 52 (GP 243)
and 66 (GP 231) days old when collected in the gorge and floodplain
geomorphic regions of the lower Murray respectively. A third fish (GP
227) exhibits a life-history 87Sr/86Sr profile characteristic of being
spawned in the River Murray and remaining in this environment as it
moves (passively and/or actively) downstream with 87Sr/86Sr reflecting
the spatio-temporal variability that would be expected in the lower
Oct11 Nov11 Dec11 Jan12 Feb12 Mar12 Apr12 May12
87S
r/8
6S
r
0.706
0.708
0.710
0.712
0.714
0.716
Dis
charg
e (
ML d
ay-1
)
0
10000
20000
30000
40000
50000
60000
70000

Ye, Q. et al. (2015) Monitoring of ecological responses to the delivery of CEW in the
lower River Murray during 2011-12
66 SARDI Aquatic Sciences
River Murray (Figure 17). This fish was 67 days old when collected in the
gorge geomorphic region of the lower Murray.
Figure 17. Individual life history profiles based on otolith Sr isotope transects (core to
edge) for three juvenile golden perch aged 52 (GP 243), 66 (GP 231) and 67 (GP 227)
days. Solid blue lines denote 87Sr/86Sr ratio for Darling River water.
0.706
0.707
0.708
0.709
0.710
0.711
0.712
0.713
0.714
0.715
0.716
GP 243
87S
r\8
6S
r
0.706
0.707
0.708
0.709
0.710
0.711
0.712
0.713
0.714
0.715
0.716
GP 231
Distance from core (um)
0 50 100 150 200 250 300 350 400
0.706
0.707
0.708
0.709
0.710
0.711
0.712
0.713
0.714
0.715
0.716GP 227

Ye, Q. et al. (2015) Monitoring of ecological responses to the delivery of CEW in the
lower River Murray during 2011-12
67 SARDI Aquatic Sciences
Otolith core 87Sr/86Sr was also measured in 34 YOY fish that were
collected from the floodplain (n = 13), gorge (n = 16), and
swamplands/lower lakes (n = 5) geomorphic regions of the lower
Murray in 2012 for which no spawn date was determined (Table 5). In
total, 22 (65%) of the fish had core 87Sr/86Sr values indicative of a Darling
River origin and 12 (35%) a River Murray origin. The ratios of Darling to
Murray spawned fish were similar in the floodplain and gorge
geomorphic regions, 9:4 and 12:4, respectively, but River Murray
spawned fish dominated (1:4) the small sample of YOY fish from the
swamplands/Lower Lakes region.
Table 5. Otolith core 87Sr/86Sr measured in 34 young-of-year golden perch collected
from the floodplain, gorge and swamplands/lower lakes geomorphic regions of the
lower River Murray.
Geomorphic region Capture date 87Sr/86Sr
Floodplain
Floodplain
Floodplain
Floodplain
Floodplain
Floodplain
Floodplain
Floodplain
Floodplain
Floodplain
Floodplain
Floodplain
Floodplain
5/03/2012
6/03/2012
6/03/2012
6/03/2012
14/03/2012
2/04/2012
2/04/2012
6/11/2012
6/11/2012
6/11/2012
6/11/2012
7/11/2012
7/11/2012
0.70716
0.70725
0.70738
0.71403
0.70756
0.71349
0.71389
0.70730
0.70748
0.70751
0.71200
0.70732
0.70749
Gorge
Gorge
Gorge
Gorge
Gorge
11/04/2012
17/05/2012
22/10/2012
22/10/2012
24/10/2012
0.71241
0.71259
0.70724
0.70725
0.70727

Ye, Q. et al. (2015) Monitoring of ecological responses to the delivery of CEW in the
lower River Murray during 2011-12
68 SARDI Aquatic Sciences
Gorge
Gorge
Gorge
Gorge
Gorge
Gorge
Gorge
Gorge
Gorge
Gorge
Gorge
24/10/2012
24/10/2012
24/10/2012
24/10/2012
24/10/2012
19/11/2012
19/11/2012
19/11/2012
20/11/2012
20/11/2012
21/11/2012
0.70728
0.70732
0.70743
0.70746
0.70761
0.70714
0.71203
0.71222
0.70721
0.70730
0.70747
Swampland/Lower Lakes
Swampland/Lower Lakes
Swampland/Lower Lakes
Swampland/Lower Lakes
Swampland/Lower Lakes
7/11/2012
8/11/2012
8/11/2012
8/11/2012
9/11/2012
0.71166
0.70753
0.71173
0.71220
0.71232
3.4 Salt and nutrient transport
3.4.1 Impact of environmental flows on salinity concentrations
Owing to the existing low salinity levels and moderate flows in the lower
River Murray during the study period, the modelling suggests that
environmental water provisions had little effect on salinity levels in the
lower River Murray (Figure 18). However, further downstream (Lower
Lakes and Coorong) salinity was reduced. This was particularly evident
at the Murray Mouth and Northern Coorong, with modelling suggesting
that electrical conductivity was up to approximately 18,000 μS/cm
lower with environmental water provisions during February 2012
(equivalent to reduction in electrical conductivity of up to
approximately 70%). This appeared to be a result of increased flows (of
lower salinity water) through the Murray Mouth and a reduction in
seawater incursions. These findings suggest that environmental water

Ye, Q. et al. (2015) Monitoring of ecological responses to the delivery of CEW in the
lower River Murray during 2011-12
69 SARDI Aquatic Sciences
can be used to reduce seawater incursions and in doing so reduce
salinity concentrations in the Northern Coorong. Although
environmental water provisions only decreased salinity levels slightly
elsewhere, this was most likely due to the antecedent high flow
conditions that had already flushed salt from the system. If
environmental water was provided during periods of low river flow,
when salt tends to accumulate in the system (see Mosley et al. 2012
and Aldridge et al. 2012), it is likely that the impacts of environmental
water provisions on salinity levels would be much greater in the Lower
Lakes and lower River Murray than were observed in this study.
3.4.2 Impact of environmental flows on salt transport
Based on modelling outputs, environmental water provisions increased
salt exports from the River Murray, Lower Lakes and Murray Mouth, with
the greatest effect occurring in February 2012 (Figure 19). The
modelling suggests that in February 2012, environmental water
accounted for approximately 25%, 25% and 70% of the total salt
exports from the River Murray, Lower Lakes and Murray Mouth,
respectively. These findings suggest that if sufficient environmental flows
are provided, the impact on salt export from the system can be
significant. Salt export is a function of the salt concentrations and
discharge and because the influence on salinity concentration was
only small, much of the difference in cumulative loads associated with
environmental flow provisions was attributed to increased discharge
through the system.

Ye, Q. et al. (2015) Monitoring of ecological responses to the delivery of CEW in the
lower River Murray during 2011-12
70 SARDI Aquatic Sciences
Figure 18. Observed and modelled (with and without environmental water provisions)
electrical conductivity data for selected sites.

Ye, Q. et al. (2015) Monitoring of ecological responses to the delivery of CEW in the
lower River Murray during 2011-12
71 SARDI Aquatic Sciences
Figure 19. Modelled salt exports with and without environmental flow provisions.
Positive values are exports from the River Murray to Lake Alexandrina (Wellington);
from the Lower Lakes to the Coorong (Barrage Total); and from the Murray Mouth to
the Southern Ocean (Murray Mouth).

Ye, Q. et al. (2015) Monitoring of ecological responses to the delivery of CEW in the
lower River Murray during 2011-12
72 SARDI Aquatic Sciences
3.4.3 Impact of environmental flows on nutrient concentrations
There were only small differences in the modelled dissolved nutrient
concentrations with and without environmental water (Figure 20). This
was also the case for particulate organic nutrient concentrations
upstream of the barrages (Figure 21). However, in the Coorong,
particulate organic nutrient concentrations were predicted to be
higher with environmental water than without. During the period of
environmental water, in the Murray Mouth organic nitrogen
concentrations were approximately 0.5 mg/L greater with
environmental water provisions than without (concentrations without
were between 1 and 2 mg/L). Similarly, organic phosphorus
concentrations were approximately 0.05 mg/L greater with
environmental water provisions than without (concentrations without
were between 0.8 and 1.5 mg/L). This was most likely associated with
reduced inputs of seawater (low concentrations) and increased inputs
of water from the Lower Lakes (high concentrations). In the Lower
Lakes, dissolved nutrients are readily incorporated into the biomass of
organisms, resulting in the transport of organic nutrients to the Coorong
(Cook et al. 2010). The findings of this study suggest that environmental
water provisions can be used to export water with elevated organic
concentrations from the system to the Southern Ocean, which may
increase the productivity of the near-shore environment.
3.4.4 Impact of environmental flows on nutrient transport
Based on modelling outputs, environmental water provisions were
predicted to increase exports of dissolved nutrients from the River
Murray to the Lower Lakes, but further downstream there was little
influence (Figure 22). This was due to the apparent transformation of
dissolved nutrients (including incorporation into organic material) within
the Lower Lakes and Coorong. This transformation meant that
environmental water provisions resulted in increased export of
particulate organic nutrients into the Southern Ocean (Figure 23). This
conversion will have important implications for the productivity of

Ye, Q. et al. (2015) Monitoring of ecological responses to the delivery of CEW in the
lower River Murray during 2011-12
73 SARDI Aquatic Sciences
downstream ecosystems, as described by Cook et al. (2010), but this
was not assessed in this study. As observed with salinity, the greatest
effect of the environmental water provisions on nutrient transport
occurred in February 2012. The modelling suggests that in February
2012, environmental water accounted for approximately 30%, 25% and
50% of the particulate organic nutrient exports from the River Murray,
Lower Lakes and Murray Mouth, respectively.

Ye, Q. et al. (2015) Monitoring of ecological responses to the delivery of CEW in the lower River Murray during 2011-12
74 SARDI Aquatic Sciences
Figure 20. Observed and modelled (with and without environmental water provisions) phosphate (PO4) ammonium (NH4) and silica (SiO2)
concentrations at selected sites.

Ye, Q. et al. (2015) Monitoring of ecological responses to the delivery of CEW in the lower River Murray during 2011-12
75 SARDI Aquatic Sciences
Figure 21. Observed and modelled (with and without environmental water provisions) particulate organic phosphorus and nitrogen concentrations
at selected sites.

Ye, Q. et al. (2015) Monitoring of ecological responses to the delivery of CEW in the lower River Murray during 2011-12
76 SARDI Aquatic Sciences
Figure 22. Modelled phosphate (PO4) ammonium (NH4) and silica (SiO2) exports with and without environmental flow provisions. Positive loads are
exports passed a designated boundary, including Wellington (from the River Murray to Lake Alexandrina); Barrage Total (from Lower Lakes to
Coorong); Murray Mouth (from the Murray Mouth to the Southern Ocean).

Ye, Q. et al. (2015) Monitoring of ecological responses to the delivery of CEW in the lower River Murray during 2011-12
77 SARDI Aquatic Sciences
Figure 23. Modelled particulate organic phosphorus (POPL) and nitrogen (PONL) exports with and without environmental flow provisions. Positive
loads are exports passed a designated boundary, including Wellington (from the River Murray to Lake Alexandrina); Barrage Total (from Lower Lakes
to Coorong); Murray Mouth (from the Murray Mouth to the Southern Ocean).
Ye, Q. et al. (2015) Monitoring of ecological responses to the delivery of CEW in the
lower River Murray during 2011-12
78 SARDI Aquatic Sciences
4 DISCUSSION
4.1 Hydraulic diversity
Whilst total flow volumes, timing and floodplain inundation are
important parameters and outcomes of environmental water delivery,
within-channel patterns and processes, such as spatio-temporal
variability in stream hydraulics, must also be considered. Indeed within-
channel hydraulic complexity supports high levels of biodiversity
(Statzner and Higler 1986; de Nooij et al. 2006), and may influence life
history processes in fish (e.g. spawning) (Moir and Pasternack 2008). The
current study aimed to characterise the hydraulic complexity of the
lower River Murray in two reaches (Lock 1–2 and Lock 5–6), under
entitlement flow and a flow of ~15,000 ML d-1 as a result of
Commonwealth environmental water delivery. Nonetheless, higher
volume flows were experienced throughout the study period, due to a
combination of natural inflows and environmental water delivery. Thus,
we investigated variability in hydraulic complexity at flows of ~13,000–
16,000 ML d-1 and 23,000–33,000 ML d-1. Additionally, these data were
used to ‘ground truth’ existing predictive hydraulic models developed
by Water Technology and DEWNR. Ultimately, these data will inform
future environmental flow delivery in the lower River Murray in regards
to likely changes in hydraulic diversity under different flow scenarios.
4.1.1 Variability in hydraulic complexity under variable flow
In general, as discharge increased, mean cross-transect velocities
increased, velocity range increased, and often, but not in all cases,
variability in cross-transect velocities and circulation also increased,
indicating greater hydraulic complexity at flows of 23,000–33,000 ML d-1
relative to flows of ~13,000–16,000 ML d-1. Whilst in the current study we
were unable to characterise hydraulic complexity at low or entitlement
flows, water velocities were measured by ADCP in the Lock 4–5 reach
in 2006 and 2007 by Kilsby (2008), during very low flows of 3,150–3,670
ML d-1 and 724–1,345 ML d-1, respectively. Compared to the current

Ye, Q. et al. (2015) Monitoring of ecological responses to the delivery of CEW in the
lower River Murray during 2011-12
79 SARDI Aquatic Sciences
flow events monitored, low flows resulted in hydraulically homogenous
cross-sections, narrow velocity ranges and low mean depth-averaged
velocities. At a flow of 3,150 ML d-1, depth averaged velocity ranged
0.05–0.33 m.s-1, with a mean of 0.014 m.s-1 downstream of Lock 5,
compared to a range of -0.01–0.80 m.s-1 and a mean of 0.39 m.s-1
downstream of Lock 6 at a flow of 13,343 ML d-1 in the current study.
Kilsby (2008) also found little difference in these parameters between
flows of 3,150–3,670 ML d-1 and 724–1,345 ML d-1 in the Lock 4–5 reach
indicating that variability in flow below 4,000 ML d-1 produces little
variation in hydraulic conditions.
4.1.2 Ground-truthing existing hydraulic models
Mean water velocities calculated from modelled outputs by both
Water Technology and DEWNR were generally similar to measured
mean velocities, except during higher flows. Mean velocities modelled
for the Lock 5–6 reach at flows (QSA) of 13,000, 15,000, 20,000 and
24,000 ML d-1 by Water Technology and DEWNR appear accurate
when compared to actual mean velocities measured at 16,214 ML d-1
(QSA). The Water Technology modelled mean velocity for the upper
weir pool location at 40,000 ML d-1 (QSA), however, was considerably
less than the actual mean velocity at QSA 33,241 ML d-1. This could in
part be due to the complex nature of flow provisioning between the
River Murray and Chowilla Anabranch system or potentially greater
inundation at 40,000 ML d-1 and its subsequent impact on within-
channel velocities. In the Lock 1–2 reach at flows of ~13,000 ML d-1,
DEWNR modelled and actual mean velocities were similar but at flows
of ~24,000 ML d-1 the modelling underestimated mean velocities across
the reach and particularly in the upper weir pool location. These results
highlight potential errors in the current hydraulic models at discharges
of >20,000 ML d-1.

Ye, Q. et al. (2015) Monitoring of ecological responses to the delivery of CEW in the
lower River Murray during 2011-12
80 SARDI Aquatic Sciences
4.2 Golden perch larvae and larval fish assemblage
Flow regulation has a profound impact on riverine ecosystem processes
and associated biological responses. Changes to the natural flow
regime, as a direct result of anthropogenic impacts, have been
implicated worldwide in the decline of riverine fish communities (e.g.
Walker et al. 1995; De Leeuw et al. 2007). Such ecological impacts are
severe throughout the MDB (Gehrke et al. 1995), particularly in the
lower River Murray (Lloyd and Walker 1986). In recent years, there has
been a growing interest in environmental water provision for ecological
restoration in riverine systems (Arthington et al. 2006). Given fish are
recognised as an important ecological asset and provide effective
indicators of ecosystem health (Davies et al. 2008), they are often
targeted for environmental watering actions with specific requirements
of hydrological variability considered in flow management
(Baumgartner et al. 2013). The influence on the success of fish
spawning and recruitment are most considered, as these life history
processes are critical in maintaining the viability of populations (Trippel
and Chambers 1997). This study primarily aimed to investigate the
spawning response of golden perch, a flow-cued spawning species, to
environmental flow releases to the lower River Murray during spring and
summer in 2011-12. In addition, larval fish assemblages in 2011-12 were
compared with previous years’ data (2005-06 to 2010-11) collected
under different flow conditions in the lower River Murray to assess how
assemblage structure changes during this within-channel high flow year
(2011-12) with releases of Commonwealth environmental water to
enhance flow pulses; and if the changes correlate to key
environmental variables (i.e. water discharge, relative water level,
temperature, conductivity).
4.2.1 Golden perch larvae
Golden perch are known to spawn during spring and summer
(Battaglene and Prokop 1987) with extended spawning periods
(autumn, winter and spring) also possible (Ebner et al. 2009). As flow-
Ye, Q. et al. (2015) Monitoring of ecological responses to the delivery of CEW in the
lower River Murray during 2011-12
81 SARDI Aquatic Sciences
cued spawning species, golden perch and silver perch are the only
two native fish species in the MDB that are considered to require
increased flow to initiate spawning (Humphries et al. 1999); significant
recruitment of golden perch typically corresponds to years of
increased within-channel flows or overbank floods in the lower River
Murray (Ye et al. 2008; Leigh et al. 2010; Zampatti and Leigh 2013a).
Recent (2004-2010) investigations in the lower River Murray also suggest
that flows below 10,000 ML d-1 are insufficient to induce spawning or
support recruitment of golden perch (Ye et al. 2008; Leigh et al. 2010;
Cheshire et al. 2012; Zampatti and Leigh 2013a). Given early stage
larvae were only collected during flood (2010-11) and within-channel
high flow (2011-12) years this study provides further support for the
notion that in the lower River Murray, golden perch is a flow-cued
spawning species. Collecting early stage larvae (i.e. pre-flexion) that
are probably <8 days old, in late summer supports the notion that these
fish were spawned recently and likely in the lower River Murray.
Whilst in 2010-11 the substantial increases in discharge and overbank
flow conditions seem to have triggered a significant spawning event in
late spring, no further larvae were observed later during summer. This
may suggest either very low larval abundances that were not
detected due to a dilution effect by high overbank flows during
summer (>50,000 ML d-1) or the absence of an extended spawning
period during the flood. In contrast, in 2011-12, a protracted spawning
season (i.e. spring to late summer) was identified for golden perch
under within-channel flow conditions with spring/summer discharges
ranging between 8,200 and 37,000 ML d-1 (at the South Australian
border) (Figure 9). A histological study found that female golden perch
shed all eggs in a single spawning, and in the absence of suitable
stimuli, they would undergo ovarian involution and resorb the eggs
(Mackay 1973). However, it was also suggested that multiple spawning
events could occur under favourable conditions (Battaglene and
Prokop 1987) and may have occured during 2011-12.

Ye, Q. et al. (2015) Monitoring of ecological responses to the delivery of CEW in the
lower River Murray during 2011-12
82 SARDI Aquatic Sciences
In spring 2011-12, there was a major spawning event that seemed to
have occurred during the falling phase of the flow pulse coinciding
with a temperature rise to >18 °C (Figure 9). In 2012, additional early
stage larvae were collected between January and early March,
suggesting an extended period of reproductive activities and/or larval
drifting from nearby upstream areas. These were likely associated with
a summer flow pulse, peaking at ~26,000 ML d-1 (at the South Australian
border) in early January, and a subsequent increase in discharge from
~15,000 to 25,000 ML d-1 (at the South Australian border) in February.
These variable within-channel flows may have provided the
appropriate conditions to trigger spawning in golden perch, therefore
extending its reproductive season well into late summer as
hypothesised. The summer flow pulse was enhanced by substantial
releases of Commonwealth environmental water in December and
January to the lower River Murray. The use of environmental water also
helped to slow the rate of recession and maintain discharge at >15,000
ML d-1 throughout January, which might have supported the survival
and dispersion of golden perch larvae and contributed to recruitment,
as suggested by previous studies in the lower River Murray (Cheshire
and Ye 2008; Ye et al. 2008). A recent study suggested that the
elevated flow conditions (>15,000 ML d-1) would favour the productivity
of diatoms rather than cyanobacteria and thus better support the
aquatic food web (Aldridge et al. 2012), including larval fish food
resources that are critical for larval survival, growth and subsequent
recruitment success.
This study suggests that within-channel flows with natural or
environmental flow pulses at appropriate temporal scales may have
the potential for generating conditions that favour a protracted
reproductive season in this species. The timing of the flow pulses may
be of particular relevance to fish spawning, not only because they
need to coincide with temperature thresholds but also due to the
recovery time required for gonad development between spawning

Ye, Q. et al. (2015) Monitoring of ecological responses to the delivery of CEW in the
lower River Murray during 2011-12
83 SARDI Aquatic Sciences
events. Previous studies suggest that flooding may not always coincide
with warm temperatures, and fish are therefore unable to exploit high
zooplankton abundances that characterise flood conditions
(Humphries et al. 1999).
Nutrients, dissolved organic carbon concentrations and phytoplankton
abundances in the lower Murray region can be largely driven by
upstream inputs (Aldridge et al. 2012). During high flow years water
from the Darling River appeared to have a disproportionate effect on
water quality in the lower Murray (Aldridge et al. 2012). Therefore, the
origin of the water utilised for environmental watering may also be of
importance. Recent studies also show that recruitment of golden perch
in the lower River Murray in 2010-11 may have been driven in part by
fish spawned in the Darling River (Zampatti and Leigh 2013a). The
physical-chemical and biological properties of water likely differ
according to their origin therefore changing the potential impact that
delivery of water may have on the entire community including the
larval fish assemblage.
4.2.2 Larval fish assemblages and flow effects
During 2011-12, a total of ten species were collected as larvae in the
main channel of the lower River Murray, comprising nine native and
one exotic species. Native species richness in the floodplain region (Site
2) was comparable to the previous flood year (2010-11) and 2005-06,
when there was a small flow pulse up to ~15,000 ML d-1. In the gorge
region (Site 1), native species richness was the greatest in 2011-12.
Increased species richness in the gorge section in 2011-12 was due to
the presence of both flow-cued spawning species (golden perch and
silver perch) and small-bodied species (hardyhead spp.). During 2011-
12, the number of carp collected was substantially lower than in 2010-
11 (flood year), and no redfin perch were sampled; as carp is a flood
opportunistic spawner (King et al. 2003), their spawning activity would
have increased during the extensive overbank flood in 2010-11.
Ye, Q. et al. (2015) Monitoring of ecological responses to the delivery of CEW in the
lower River Murray during 2011-12
84 SARDI Aquatic Sciences
Prior to 2010, the small to medium-bodied native species (i.e. Australian
smelt, bony herring, carp gudgeon and flathead gudgeon) were the
most abundant under the low flow and drought conditions (2005-06 to
2008-09). In 2010-11 and 2011-12, there was an environmental change
following high flows and extensive flooding; abundance of small to
medium-bodied native species decreased whilst larval golden perch
were abundant being sampled for the first time since 2005-06. Golden
perch and silver perch larvae were only collected during the flood
(2010-11), high flow (2011-12) or a small within-channel flow (2005-06),
noting that 2005-06 larvae were only collected below Lock 6 (Site 2) in
later stages which suggests they may not have been spawned within
the lower River Murray in South Australia.
Murray cod and freshwater catfish larvae were collected in greater
abundances and distribution during the within-channel flow pulse and
high flow/flood years. Both species are known to utilise nests, exhibit
parental care of eggs and early stages of larval development (Lake
1967; Allen et al. 2002) and spawn annually, irrespective of changes in
river flow or level (Davis 1977a, b; Humphries et al. 2002; King et al. 2003;
Gilligan and Schiller 2004; Humphries 2005; Koehn and Harrington 2006,
King et al. 2009). Despite annual spawning events, years of higher flows
and overbank floods in the lower River Murray have been correlated
with enhanced recruitment of Murray cod (see Ye and Zampatti 2007).
It has been suggested that hydraulically diverse habitats may increase
the survival of larval Murray cod and therefore recruitment (Humphries
2005). More recently, environmental flow delivery has been
recommended to maximise breeding opportunities for Murray cod by
inundating a large number of spawning and nesting sites on a regular
basis and to improve connectivity between main channel and off-
channel nursery habitat and facilitate movement and dispersion
(Baumgartner et al. 2013).

Ye, Q. et al. (2015) Monitoring of ecological responses to the delivery of CEW in the
lower River Murray during 2011-12
85 SARDI Aquatic Sciences
The significant change in larval fish assemblage structure in 2011-12
(within-channel high flow), compared to 2005-06 (within-channel low
flow) and 2006-07 to 2008-09 (drought years), was mainly due to the
presence and increased abundance of the flow-cued spawning
species (i.e. golden perch, silver perch) and a reduction in the relative
abundance of small to medium-bodied species. The assemblage was
more similar to that of the flood year (2010-11), although small-bodied
fish larvae were more abundant and carp abundance was lower
during the within-channel flows of 2011-12. The results support the
hypothesis in regard to the shift of the larval fish assemblage
subsequent to the high flows/flood. This shift in larval assemblage
reflects the spawning response of large-bodied flow-cued spawning
species such as golden perch and silver perch, and also the diminished
spawning and/or survival of larvae from small to medium-bodied
species that dominated the assemblages in low flow and drought years
(i.e. 2005-06 to 2008-09).
The reproduction (spawning and recruitment) of small to medium-
bodied fish (carp gudgeon, flathead gudgeon, Australian smelt and
bony herring) generally conform with the low flow recruitment
hypothesis (LFRH) developed by Humphries et al. (1999). These species
exhibit an opportunistic life history strategy and are generally resilient to
prolonged low flow conditions (Gilligan et al. 2009; Cheshire 2010).
Studies suggest that under the low flow conditions, the combination of
lower velocities and increased prey availability in the river channel may
provide suitable conditions for the growth and survival of larvae for
small-bodied species (Gehrke 1992; King et al. 2003; King 2005; Zeug
and Miller 2008). In this study, there was a significant decline in
abundances of small to medium-bodied fish during the flood (2010-11)
to between 3-20% of that of previous years, suggesting a reduced
reproductive performance. A recent fish assemblage study indicates
that changes in habitat (a loss of submerged macrophytes) due to
increased flow/flood render the main channel of the lower River Murray

Ye, Q. et al. (2015) Monitoring of ecological responses to the delivery of CEW in the
lower River Murray during 2011-12
86 SARDI Aquatic Sciences
less desirable to small-bodied species compared to low-flow periods
(Bice et al. 2014), supporting the results from the current study.
However, in 2011-12 under within-channel flows (up to 26,000 ML d-1),
the spawning success of small to medium- bodied species was greater
than in the previous flood year, with larval abundance increasing more
than sixfold in some cases although still well below those observed in
drought years. It is interesting to note that species richness increased in
the gorge section of the lower Murray during 2011-12 (when compared
to drought years), a within channel high flow year with environmental
water releases. This implies that variable within-channel flows may
provide an opportunity to meet the different needs of the diverse fish
species/guilds. The importance of managing hydrological variability in
environmental water use has been demonstrated, considering
individual species’ contrasting habitat, spawning and feeding
requirements and specific life history strategies adapted to different
flow regimes. The use of flow guilds of freshwater fish has been
suggested as a tool to inform adaptive management of environmental
watering in semi-arid riverine systems (Baumgartner et al. 2013).
4.3 Recruitment and natal origin of golden perch
In 2012, golden perch populations in the floodplain and gorge
geomorphic regions of the lower River Murray were dominated by 1
and 2 year old fish with lower proportions (≤10%) of 0, 6, 11 and 15 year
old fish. Overall, our data show episodic recruitment of golden perch
during the period of the Millennium drought (2001–2009) but more
consistent recruitment from 2009 onwards. Consecutive year-classes
from 2010–2012 were spawned in association with in-channel and
overbank increases in flow in the lower River Murray and the Darling
River, which have improved the resilience and hence health of golden
perch populations in the lower River Murray.
Age 0+ (YOY) fish, spawned in spring/summer 2011-12, represented 5%
and 10% of fish collected in the gorge and floodplain geomorphic

Ye, Q. et al. (2015) Monitoring of ecological responses to the delivery of CEW in the
lower River Murray during 2011-12
87 SARDI Aquatic Sciences
regions, respectively. Otolith microstructure and geochemistry indicate
that these YOY recruits originated from two distinct spawning periods in
two different geographic locations. Of the fish for which we
calculated approximate spawn dates and have corresponding otolith
core Sr isotope ratios (n = 15), five fish were most likely spawned in the
River Murray (four from 16/10/2011–13/11/2011, and one on 20/12/11)
and ten fish spawned in the Darling River from the 27/11/2011–1/1/2012.
For the remainder of YOY fish (no specific spawn date) 12 individuals
(35%) were spawned in the Murray and 22 (65%) were spawned in the
Darling.
Life history profiles of otolith 87Sr/86Sr for a 52 and 66 day old golden
perch spawned in the Darling indicated that both fish potentially spent
over half their lives in the Darling before moving into the River Murray.
Given an approximate transit time of 13 days for within-channel flows
from Menindee Lakes on the Darling River to the River Murray (Crabb
1997) there is potential that golden perch collected as YOY in the lower
Murray in 2012 were spawned many hundreds of kilometres up the
Darling. The exact spawning location, however, is unknown and
warrants further investigation, potentially using a mixed elemental and
isotopic approach (Walther et al. 2008).
Ambient 87Sr/86Sr ratios in water are dependent on catchment lithology
therefore we expect values in the Darling River to be temporally stable
(Douglas et al. 1995; Gingele and De Deckker 2005). In the River
Murray, however, 87Sr/86Sr ratios are temporally variable due to multiple
sources of water, this is particularly so in the lower River Murray
downstream of the Darling River junction. Understanding the true
source and delivery rates of environmental water is imperative to
determining fish origin. In 2011-12, environmental water was delivered
to the lower River Murray directly from source (e.g. Darling River) or
traded from upstream sources (e.g. Goulburn and Campaspe rivers)
and delivered from Lake Victoria. Given the lack of clarity in the true

Ye, Q. et al. (2015) Monitoring of ecological responses to the delivery of CEW in the
lower River Murray during 2011-12
88 SARDI Aquatic Sciences
source and delivery rates for all components of River Murray discharge
into SA, creating a spatio-temporal isotoptic map of water 87Sr/86Sr
across the southern MDB during each spawning season of golden
perch (approximately October–February) would provide the most
reliable template from which to determine potential spawning location
(Muhlfeld et al. 2012).
Given that a significant proportion of the golden perch population in
South Australia may result from spawning in the Darling River (or
potentially the mid-upper River Murray) maintaining longitudinal
connectivity of flow is vital. This is potentially at odds with current water
management practices in the lower River Murray where Lake Victoria is
used to store and reregulate flows (including environmental flows) from
the Murray and Darling Rivers and to moderate salinity in the lower
Murray (MDBC 2002). Disruption of hydrologic connectivity by river
regulation is considered to be a primary cause of ecological
degradation in rivers worldwide (Kondolf et al. 2006). In the lower
Murray, operation of Lake Victoria disconnects the river continuum. For
example, higher salinity water flowing down the Darling River and into
the lower Murray may be diverted and substituted or diluted with Lake
Victoria water.
Unfortunately, water that is considered ‘poor quality’ for consumptive
use (i.e. irrigation and domestic supply) may be ‘biologically’ rich and
integral to ecosystem function in the lower River Murray. Furthermore,
delivering environmental water in a hydrologically disconnected
manner potentially mitigates the restorative value of these flows for
aquatic ecosystems in the lower Murray.
4.4 Salt and nutrient transport
The approach used in this study proved to be useful for indicating the
general response of salt and nutrient dynamics in the Lower Murray to
environmental water, although outputs should not be treated as
absolute values. The findings suggest that environmental water

Ye, Q. et al. (2015) Monitoring of ecological responses to the delivery of CEW in the
lower River Murray during 2011-12
89 SARDI Aquatic Sciences
provisions in the Lower Murray can influence processes that are
essential for providing habitat and resources for aquatic biota. In
particular, provisions of environmental water into the Lower Murray
appear to have capacity to influence both salt and nutrient
concentrations and transport through the lower River Murray, Lower
Lakes and Coorong. The study suggests that the provision of
environmental water during the study period contributed significantly
to the export of salt and particulate nutrients downstream. There was
an apparent increase in the export of salt and particulate organic
nutrients to the Southern Ocean associated with environmental water,
which were associated with elevated outflows through the Murray
Mouth and reduced seawater incursions. It is likely that these
predictions underestimate salt and nutrient export since not all
environmental water provisions could be accounted for and included
in the modelling. Since the mass of exported material is a function of
both water discharge and concentrations, the provision of additional
flows during the study period would be expected to have increased
the mass of exported material.
Whilst there was little influence of environmental water on dissolved
nutrient concentrations in the model outputs, the elevated loads of
dissolved nutrients from the lower River Murray appeared to result in
elevated transformation of dissolved nutrients to particulate organic
forms. Consequently, elevated particulate organic nutrient
concentrations were observed at the Murray Mouth, due to increased
inputs from the Lower Lakes (high concentrations) and reduced inputs
from the Southern Ocean (low concentrations). At the same time this
acted to reduce salinity levels in the Northern Coorong and Murray
Mouth due to increased inputs from the Lower Lakes (low salinity levels)
and reduced inputs from the Southern Ocean (high salinity levels). The
responses observed during the study are largely a function of the
antecedent hydrological conditions and underlying hydrological
conditions, including the timing, magnitude and source of water used

Ye, Q. et al. (2015) Monitoring of ecological responses to the delivery of CEW in the
lower River Murray during 2011-12
90 SARDI Aquatic Sciences
for environmental flow. Provisions of environmental water during
periods of low inflows, in which salts and nutrients tend to accumulate,
are likely to have a larger influence on concentrations than were
observed during the current study. However, the influence on exports is
likely to be smaller if there are insufficient volumes of water to export
material. Conversely, when flow is above threshold levels whereby
there are exports of water, salt and nutrient exports will largely be
proportional to flow and so increased volumes of environmental flow
will increase the exported loads. These threshold flow levels will differ
between the lower River Murray, Lower Lakes and Murray Mouth and
will be influenced by downstream water levels.

Ye, Q. et al. (2015) Monitoring of ecological responses to the delivery of CEW in the
lower River Murray during 2011-12
91 SARDI Aquatic Sciences
5 MANAGEMENT IMPLICATIONS AND RECOMMENDATIONS
This monitoring project assessed key ecological responses during the
delivery of Commonwealth environmental water to the South
Australian lower River Murray (including the Lower Lakes and Coorong)
in 2011-12. These include (1) hydraulic diversity in the river channel, (2)
golden perch larvae and larval fish assemblage, (3) recruitment and
natal origin of golden perch, and (4) salt and nutrient transport. During
the prolonged drought from 2001–2010, the ecological communities in
the lower River Murray were severely impacted, many native species
suffered a substantial decline and habitat degradation occurred
throughout the freshwater and estuarine systems. The significant flood
and high flows in 2010–2012 have led to signs of ecological
improvement. Importantly, responses to environmental watering need
to be considered in the context of ecosystem recovery in the lower
River Murray over recent years.
There were a number of ecological outcomes associated with the high
flows supported by the releases of Commonwealth environmental
water to the lower River Murray during 2011-12. These include a
significant increase in hydraulic complexity in the main channel with
increased discharge (23,000–33,000 ML d-1 QSA); an extended
presence of golden perch larvae; increased larval fish abundances of
large-bodied species (compared to drought/low flow years); increased
species diversity and richness of larval fish particularly in the gorge
section of the lower River Murray; aiding the downstream dispersal of
early life stage golden perch spawned in the Darling and the
subsequent recruitment of these fish in the lower Murray; and a
significant contribution to the export of salt and particulate nutrients
downstream. The management implications and recommendations
are provided for the four components of ecological responses.

Ye, Q. et al. (2015) Monitoring of ecological responses to the delivery of CEW in the
lower River Murray during 2011-12
92 SARDI Aquatic Sciences
5.1 Hydraulic diversity
Whilst we were unable to meet the original objectives of the project
due to elevated natural flows, investigating variability in hydraulic
complexity between entitlement flows (3,000–7,000 ML d-1) and flows of
~15,000 ML d-1, the current study was able to characterise hydraulic
complexity at flows between 13,000 and 34,000 ML d-1 and will thus
inform future environmental flow delivery of similar volumes. Typically,
there was an increase in hydraulic complexity in regards to mean flow
velocity, velocity ranges, within location variability in flow velocity and
circulation, with increased discharge (23,000–33,000 ML d-1 QSA). This
suggests that a greater diversity of hydraulic microhabitats may be
provided at flows of this magnitude, potentially resulting in a greater
ecological response. The positive response to such flow pulses was
evident by increased abundances of flow-cued spawning species
(golden perch and silver perch) during 2011-12. Therefore,
environmental flows of >23,000 ML d-1 are preferred to flows of 13,000–
16,000 ML d-1. Nevertheless, given that some level of hydraulic
complexity was present at 13,000–16,000 ML d-1 but virtually absent in
the Lock 4–5 reach at flows <4,000 ML d-1, as presented by Kilsby (2008),
a priority for future monitoring should be the collection of velocity data
at flows of 4,000–13,000 ML d-1 to determine potential threshold flow
rates beyond which hydraulic complexity begins to increase. It should
be noted that whilst within-channel flows at the magnitude of ~15,000
ML d-1 may initiate local spawning of flow-cued spawning species (e.g.
golden perch), they are also likely to facilitate larval dispersion (i.e.
drift) from upstream and thus, enhance recruitment of golden perch in
the lower River Murray (Ye et al. 2008).
Of considerable importance for future research is developing an
understanding of the association of native fish species with hydraulic
habitats (at biologically relevant scales) and the explicit link between
hydraulics and ecological processes (e.g. spawning and recruitment).
Golden perch and silver perch are cued to spawn by increases in

Ye, Q. et al. (2015) Monitoring of ecological responses to the delivery of CEW in the
lower River Murray during 2011-12
93 SARDI Aquatic Sciences
within-channel flows and floods (Lake 1967; Mallen-Cooper and Stuart
2003). Given that variability in hydraulics is how fish perceive changes in
flow volumes, in concert with other cues such as temperature (Lake
1967), specific hydraulic conditions may provide the cue for
reproductive activity in these species. Additionally, these species
together with Murray cod, undergo downstream larval drift (Humphries
2005; Tonkin et al. 2007), likely for the purpose of dispersal (reducing
competition and predation) and potentially compensation for
upstream adult spawning migrations. Thus, hydraulic conditions that
facilitate downstream drift and transportation to favourable nursery
habitats are likely integral to the recruitment success of these species.
Understanding the causal link between hydraulics and vital life history
events, and determining the best hydraulic metrics to do so, will
provide a powerful tool to inform future environmental water delivery.
Ultimately, environmental water requirements could be specified as the
provision of particular hydraulic conditions and the flow, and delivery
strategies, required to create such conditions rather than a sole
reliance on hydrological metrics.
5.2 Golden perch larvae and larval fish assemblage
During 2011-12, summer flow pulses of ~26,000 ML d-1 (at the South
Australian border) led to an extended reproductive period of golden
perch into late summer in the lower River Murray. Importantly, a
substantial volume of environmental water was released to enhance
the summer flow pulses and reduce the rate of recession in the lower
River Murray, which may have contributed to the ecological outcomes
of an extended reproductive season and potentially improved larval
survival in golden perch. The investigation of golden perch spawning
suggests that this species has a flexible reproductive strategy; multiple
spawning events could occur when suitable flow conditions were
provided. In addition, flow regimes supported by environmental water
releases in 2011-12 may have provided suitable conditions to support

Ye, Q. et al. (2015) Monitoring of ecological responses to the delivery of CEW in the
lower River Murray during 2011-12
94 SARDI Aquatic Sciences
spawning and larval survival of fish species from different flow guilds
(e.g. flow-cued spawning species, low flow spawners).
Different fish species/guilds often have different requirements of flow
and environmental conditions associated with their life history
strategies. Fish spawning and larval fish assemblage structure were
strongly influenced by hydrological and environmental conditions in
the lower River Murray. Three types of larval fish responses were
evident: species whose larval abundances were 1) positively
correlated to increased discharge, 2) negatively correlated to the
increased discharge and 3) correlated to temperature. In this study,
small to medium-bodied native species (e.g. Australian smelt, flathead
gudgeon, carp gudgeon and bony herring) were related to low flows;
whereas, the large-bodied Murray cod, golden perch, silver perch and
freshwater catfish were considered to be related to high flows (e.g.
overbank and within-channel flows). The correlation between
temperature and changes in larval fish assemblage most likely reflects
within season differences in spawning of individual species (King et al.
2003; Cheshire 2010).
Under prolonged drought conditions, extended periods of low flow and
floodplain isolation have negatively impacted on the spawning and
recruitment of some of the large-bodied species (Ye et al. 2008; King et
al. 2009; Cheshire 2010; Leigh and Zampatti 2011). Although large-
bodied, longer-lived species are likely to be able to withstand
unfavourable spawning and recruitment conditions for longer, many of
these species are adapted to hydrological variability, which has strong
influence on their life history processes (e.g. spawning, larval survival,
movement and migration). Subsequently, they are more threatened by
river regulation and water extraction. In addition these species tend to
be slower at recovering from population decreases (Baker et al. 2009).
This study has highlighted that the abundance and distribution of
Murray cod and freshwater catfish larvae was greater during higher

Ye, Q. et al. (2015) Monitoring of ecological responses to the delivery of CEW in the
lower River Murray during 2011-12
95 SARDI Aquatic Sciences
flow conditions; and the two flow-cued spawning species, golden
perch and silver perch, only spawned in conjunction with overbank or
increased within-channel flows in the lower River Murray. Therefore,
these species are more likely to be under threat during extended low
flow conditions (<10,000 ML d-1 at the South Australian border).
Environmental flow allocation and management should take into
account the requirements of these native species in order to improve
the resilience of the populations.
Whilst floods are important in maintaining the ecological integrity of
floodplain rivers, this study suggests that within-channel flow
management may present an opportunity to enhance the populations
of golden perch and other native fish. In the lower River Murray, within-
channel flows (e.g. 15,000–50,000 ML d-1) are currently the main focus
for environmental flow management, which could be restored within
the current constraints of system operation. If environmental flows can
be delivered in an appropriate regime (magnitude, timing, duration,
frequency) at relevant biological/ecological scales, they may facilitate
the spawning and recruitment of flow-cued spawning species and
other large-bodied native fish. Furthermore, within-channel flows should
also provide suitable conditions for the reproduction of small to
medium-bodied species, resulting in a diverse fish community. Finally,
given there are still significant knowledge gaps in environmental flow
science with regard to the restoration of native fish populations (King et
al. 2009), ecological research and adaptive monitoring are essential to
underpin environmental flow management.
5.3 Recruitment and natal origin of golden perch
Resilient populations of long-lived native fish necessitate multiple age
classes to maximise population viability in light of environmental
perturbations and anthropogenic impacts (Gunderson 2000).
Consequently, assessment of population resilience requires an
understanding of survivorship and population demographics. To date

Ye, Q. et al. (2015) Monitoring of ecological responses to the delivery of CEW in the
lower River Murray during 2011-12
96 SARDI Aquatic Sciences
in the southern MDB there has been an emphasis on short-term
monitoring of ecological responses to environmental water allocations
(CEWO 2012) that may not provide data on population structure. For
long-lived native fish, longer-term investigations of population
demographics are required to establish the status (i.e. health) of
populations and the true benefits of flow restoration.
The results of the present study support the hypothesis that flows
>15,000 ML d-1 during summer 2011-12 would result in recruitment (to
age 0+) of golden perch in the South Australian reaches of the River
Murray but that these YOY fish would not necessarily have been
spawned in the lower River Murray. Whilst we cannot determine a
precise spawning location for the 35% of YOY fish spawned in the River
Murray, we have ascertained that 65% of YOY were spawned in the
Darling River. Furthermore, when age is also considered, the sample of
larval and YOY golden perch collected in the present study, that were
recruited to the lower River Murray population in 2011-12, were
generally not spawned in association with the delivery of
Commonwealth environmental water to the lower Murray channel.
Nevertheless, substantial volumes (4,000–5,000 ML d-1) of
Commonwealth environmental water delivered down the Darling from
January–February 2012 would have aided the downstream dispersal of
early life stage golden perch spawned in the Darling and the
subsequent recruitment of these fish in the lower Murray.
5.4 Salt and nutrient transport: Lock 1 to the Southern Ocean
Continued refinement of the model used in this study will further
improve its capacity to assess the response of salt and nutrient
dynamics in the Lower Murray to environmental water. In the future it
could also be used to assess the various watering actions in both
forecasting and retrospective analysis. Without such assessments it is
difficult to reach general recommendations about optimal use of
environmental water for salt and nutrient dynamics because the Lower

Ye, Q. et al. (2015) Monitoring of ecological responses to the delivery of CEW in the
lower River Murray during 2011-12
97 SARDI Aquatic Sciences
Murray is a hydrologically complex system. However, based on insights
provided by this study and knowledge of nutrient dynamics in the
Lower Murray, the following points could be used to help guide future
environmental water provisions:
Environmental flow provisions during moderate-high flow periods (e.g.
>40,000 ML d-1) are likely to have greater impacts on salt and nutrient
exports from the Murray Mouth than during low flow periods when the
Murray Mouth outflows are small. In contrast, environmental flow
provisions during low flow periods (e.g. <10,000 ML d-1) are likely to have
greater impacts on salt and nutrient concentrations than during
moderate-high flow periods.
Maximum exports from the Murray Mouth are likely to be achieved by
delivering environmental water during periods of low oceanic water
levels (summer). However, whilst this may have short-term benefits,
reduced water provisions at other times are likely to increase the import
of material from the Southern Ocean. In contrast, delivery of
environmental water to the region at times of high oceanic water
levels is likely to increase the exchange of water and associated
nutrients and salt through the Coorong, rather than predominately
through the Murray Mouth.
Environmental water provision that results in floodplain inundation will
likely result in increased nutrient concentrations (mobilisation) and
export. This may be achieved by moderate-large floods (e.g. >40,000
ML d-1) that inundate previously dry floodplains and wetlands.
Flows during winter may result in limited assimilation of nutrients by biota
(slower growth rates), whilst provisions during summer could increase
the risk of blackwater events and cyanobacterial blooms, depending
on hydrological conditions and the degree of wetland connectivity.
Flows during spring are likely to minimise these risks, but also maximise
the benefits of nutrient inputs (e.g. stimulate productivity to support
larval survival).

Ye, Q. et al. (2015) Monitoring of ecological responses to the delivery of CEW in the
lower River Murray during 2011-12
98 SARDI Aquatic Sciences
Multiple watering events in a given year could be used to meet
different objectives. For example providing one event in spring to
increase nutrient assimilation, followed by a subsequent event to
export material from the system may provide multiple benefits.

Ye, Q. et al. (2015) Monitoring of ecological responses to the delivery of CEW in the
lower River Murray during 2011-12
99 SARDI Aquatic Sciences
REFERENCES
Agostinho, A.A., Gomes, L.C., Verissimo, S. and Okada, E.K. (2004) Flood
regime, dam regulation and fish in the upper Parana River: Effects on
assemblage attributes, reproduction and recruitment. Reviews in Fish
Biology and Fisheries 14(1), 11-19.
Aldridge, K.T., Lamontagne, S., Deegan, B.M. and Brookes, J.D. (2011) Impact
of a drought on nutrient concentrations in the Lower Lakes (Murray–
Darling Basin, Australia). Inland Waters 1, 159-176.
Aldridge, K., Lorenz, Z., Oliver, R. and Brooks, J.D. (2012) Changes in water
quality and phytoplankton communities in the lower River Murray in
response to a low flow-high flow sequence. Goyder Institute for Water
Research. Adelaide, Australia
Aldridge, K.T., Busch, B.D. and Hipsey, M.R. (2013) An assessment of the
contribution of environmental water provisions to salt and nutrient
dynamics in the lower Murray, November 2011-July 2012: Technical
report. The University of Adelaide and the University of Western
Australia, Adelaide and Perth.
Allen, G.R., Midgley, S.H. and Allen, M. (2002) Field guide to the freshwater
fishes of Australia. (Western Australian Museum: Perth)
Anderson, J. R., Morison, A. K. and Ray, D. J. (1992). Validation of the use of
thin-sectioned otoliths for determining age and growth of golden
perch, Macquaria ambigua (Perciformes: Percichthyidae), in the
Lower Murray–Darling Basin, Australia. Australian Journal of Marine and
Freshwater Research 43, 1103–1128.
Arthington, A.H., Bunn, S.E., Poff, L.N. and Naiman , R.J. (2006) The challenge
of providing environmental flow rules to sustain river ecosystems.
Ecological Applications 16, 1311-1318.
Baker, K.D., Devine, J.A. and Haedrich, R.L. (2009) Deep-sea fishes in
Canada's Atlantic: Population declines and predicted recovery times.
Environmental Biology of Fishes 85(1), 79-88.

Ye, Q. et al. (2015) Monitoring of ecological responses to the delivery of CEW in the
lower River Murray during 2011-12
100 SARDI Aquatic Sciences
Baumgartner, L.J., Conallin, J., Wooden, I., Campbell B., Gee, R., Robinson,
W.A. and Mallen-Cooper, M. (2013) Using flow guilds of freshwater fish
in an adaptive management framework to simplify environmental flow
delivery for semi-arid riverine systems. Fish and Fisheries. DOI:
10.1111/faf.12023
Battaglene, S. and Prokop, F. (1987) Golden perch. N.S.W. Department of
Agriculture No. A3.2.2, Sydney.
Bertozzi, T., Adams, M. and Walker, K.F. (2000) Species boundaries in carp
gudgeons (Eleotrididae : Hypseleotris) from the River Murray, South
Australian: Evidence for multiple species and extensive hybridization.
Marine and Freshwater Research 51(8), 805-815.
Bice, C. M., Leigh, S. J., Nicol, J. M. and Zampatti, B. P. (2013) Changes in
hydraulic complexity in the lower River Murray main channel in relation
to flow variability. South Australian Research and Development Institute
(Aquatic Sciences), Adelaide. SARDI Publication No. F2013/000214-1.
SARDI Research Report Series No. 709. 32pp.
Bice, C. M., Gehrig S. L., Zampatti B. P., Nicol J. M., Wilson P., Leigh S. L. and
Marsland K. (2014). Flow-induced alterations to fish assemblages,
habitat and fish–habitat associations in a regulated lowland river.
Hydrobiologia 722: 205-222.
Blanch, S. J., Walker, K. F. and Ganf, G. G. (2000) Water regimes and littoral
plants in four weir pools of the River Murray, Australia. Regulated Rivers:
Research & Mangement 16, 445-456.
Brookes, J.D., Lamontagne, S., Aldridge, K.T., Benger, S., Bissett, A., Bucater, L.,
Cheshire, A.C., Cook, P.L.M., Deegan, B.M., Dittmann, S., Fairweather,
P.G., Fernandes, M.B., Ford, P.W., Geddes, M.C., Gillanders, B.M., Grigg,
N.J., Haese, R.R., Krull, E., Langley, R.A., Lester, R.E., Loo, M., Munro, A.R.,
Noell, C.J., Nayar, S., Paton, D.C., Revill, A.T., Rogers, D.J., Rolston, A.,
Sharma, S.K., Short, D.A., Tanner, J.E., Webster, I.T., Wellman, N.R. and
Ye, Q. (2009) An ecosystem assessment framework to guide
management of the Coorong. CSIRO: Water for a Healthy Country
National Research Flagship, Canberra.

Ye, Q. et al. (2015) Monitoring of ecological responses to the delivery of CEW in the
lower River Murray during 2011-12
101 SARDI Aquatic Sciences
Brown, A. V. and Armstrong, M. L. (1985) Propensity to drift downstream
among various species of fish. Journal of Freshwater Ecology 3, 3-17.
Brown, P. and Wooden, I. (2007). Age at first increment formation and
validation of daily growth increments in golden perch (Macquaria
ambigua: Percicthyidae) otoliths. New Zealand Journal of Marine and
Freshwater Research 41, 157–161.
Bucater, L., Cheshire, K. and Ye, Q. (2009) Fish spawning in the lower River
Murray icon sites, South Australia: with reference to drought
intervention. South Australian Research and Development Institute
(Aquatic Sciences), No. F2009/000360-1, Adelaide.
Bunn, S. and Arthington, A.H. (2002) Basic principles and ecological
consequences of altered flow regimes for aquatic biodiversity.
Environmental management 30, 492-507.
Cambray, J.A., King, J.M. and Bruwer, C. (1997) Spawning behaviour and
early development of the Clanwilliam yellowfish (Barbus capensis;
Cyprinidae), linked to experimental dam releases in the Olifants River,
South Africa. Regulated Rivers-Research & Management 13(6), 579-
602.
Campana, S. E. (1999) Chemistry and composition of fish otoliths: pathways,
mechanisms and applications. Marine Ecology Progress Series 188, 263–
297.
Commonwealth Environmental Water Office (2012) 2011 – 2012 Outcomes
Report. Commonwealth of Australia, Canberra.
Cheshire, K.J.M. and Ye, Q. (2008) Spatial and temporal variations in larval fish
assemblages between Locks 1 and 6 in the River Murray, South
Australia: with reference to drought intervention monitoring 2007. SARDI
Aquatic Sciences Publication No. F2008/000685-1. SARDI Research
Report Series No 304.
Cheshire, K.J.M. (2010) Larval fish assemblages in the lower River Murray,
Australia: examining the influence of hydrology, habitat and food.
Ph.D. Thesis. The University of Adelaide. Australia.
Ye, Q. et al. (2015) Monitoring of ecological responses to the delivery of CEW in the
lower River Murray during 2011-12
102 SARDI Aquatic Sciences
Cheshire, K.J.M., Ye, Q., Wilson, P. and Bucater, L. (2012) From drought to
flood: Annual variation in larval fish assemblages in larval fish
assemblages in a heavily regulated lowland temperate river. Technical
Report Series No.12/6, Goyder Institute for Water Research, Adelaide.
Cook, P.L.M., Aldridge, K.T., Lamontagne, S. and Brookes, J.D. (2010) Retention
of nitrogen phosphorus and silicon in a large semi-arid riverine lake
system. Biogeochemistry 99 (1-3), 49-63.
Crabb, P. (1997) Murray–Darling Basin Resources. Murray–Darling Basin
Commission, Canberra.
Crowder, D. W. and Diplas, P. (2000) Evaluating spatially explicit metrics of
stream energy gradients using hydrodynamic model simulations.
Canadian Journal of Fisheries and Aquatic Sciences 57, 1497-1507.
CSIRO (2008) Water availability in the Murray–Darling Basin. Report to the
Australian government from the CSIRO Murray–Darling Basin
Sustainable Yields Project. CSIRO, Australia, 67pp.
Davies, .PE., Harris, J.H., Hillman, T.J. and Walker, K.F. (2008) Sustainable Rivers
Audit Report 1: A Report on the Ecological Health of Rivers in the
Murray–Darling Basin, 2004–2007. Prepared by the Independent
Sustainable Rivers Audit Group for the Murray-Darling Basin Ministerial
Council.
Davis, T.L.O. (1977a) Food habits of the freshwater catfish, Tandanus tandanus
Mitchell, in the Gwydir River, Australia, and effects associated with
impoundment of this river by the Copleton Dam. Australian Journal of
Marine and Freshwater Research 28(4), 455-465.
Davis, T.L.O. (1977b) Reproductive biology of the freshwater catfish, Tandanus
tandanus Mitchell, in the Gwydir River, Australia i. Structure of the
gonads. Australian Journal of Marine and Freshwater Research 28, 139-
158.

Ye, Q. et al. (2015) Monitoring of ecological responses to the delivery of CEW in the
lower River Murray during 2011-12
103 SARDI Aquatic Sciences
De Leeuw, J.J., Buijse, A.D., Haidvogl, G., Lapinska, M., Noble, R., Repecka, R.,
Virbickas, T., Wisniewolski, W. and Wolter, C. (2007) Challenges in
developing fish-based ecological assessment methods for large
floodplain rivers. Fisheries Management and Ecology 14(6), 483-494.
de Nooij, R. J. W., Verberk, W. C. E. P., Lenders, H. J. R., Leuven, R. S. E. W. and
Nienhuis, P. H. (2006) The importance of hydrodynamics for protected
and endangered biodiversity of lowland rivers. Hydrobiologia 565, 153-
162.
Douglas, G. B, Gray, C. M., Hart, B. T. and Beckett, R. (1995) A strontium
isotopic investigation of the origin of suspended particulate matter
(SPM) in the Murray-Darling river system, Australia. Geochimica et
Cosmochimica Acta 59, 3799–3815.
Dyer, F. J. and Thoms, M. C. (2006) Managing river flows for hydraulic diversity:
an example from an upland regulated gravel-bed river. Regulated
Rivers: Research & Mangement 22, 257-267.
Ebner, B.C., Scholz, T. and Gawne, B. (2009) Golden perch Macquaria
ambigua are flexible spawners in the Darling River, Australia. New
Zealand Journal of Marine and Freshwater Research 43(2), 571-578.
Freeman, M. C. and Grossman, G. D. (1993) Effects of habitat availability on
dispersion of a stream cyprinid. Environmental Biology of Fishes 37, 121-
130.
Freeman, M.C., Bowen, Z.H., Bovee, K.D. and Irwin, E.R. (2001) Flow and
habitat effects on juvenile fish abundance in natural and altered flow
regimes. Ecological Applications 11, 179-190.
Gehrke, P.C. (1992) Diel abundance, migration and feeding of fish larvae
(Eleotridae) in a floodplain billabong. Journal of Fish Biology 40(5), 695-
707.
Gehrke, P.C., Brown, P., Schiller, C.B., Moffatt, D.B. and Bruce, A.M. (1995)
River regulation and fish communities in the Murray-Darling river system,
Australia. Regulated Rivers: Research and Management 11, 363-375.
Ye, Q. et al. (2015) Monitoring of ecological responses to the delivery of CEW in the
lower River Murray during 2011-12
104 SARDI Aquatic Sciences
Gillanders, B. M. (2005) Otolith chemistry to determine movements of
diadromous and freshwater fish. Aquatic Living Resources 18, 291–300.
Gilligan, D. and Schiller, C. (2004) Downstream transport of the eggs, larvae
and juvenile fish in the Murray river: Impact of river regulation on
downstream dispersal. In 'Downstream movement of fish in the Murray-
Darling Basin', 3-4 June 2003, Canberra Workshop. (Eds. M Lintermans
and B Phillips), pp. 41-50
Gilligan, D.M., Vey, A. and Asmus, M. (2009) Identifying drought refuges in the
Wakool system and assessing status of fish populations and water
quality before, during and after the provision of environmental, stock
and domestic flows. 58 pp.
Gingele, F. X. and De Decker, P. (2005) Clay mineral, geochemical and Sr–Nd
isoptopic fingerprinting of sediments in the Murray–Darling fluvial
system, southeast Australia. Australian Journal of Earth Sciences 52,
965–974.
Graham, R. and Harris, J.H. (2004) Floodplain inundation and fish dynamics in
the Murray-Darling Basin. Current concepts and future research: a
scoping study. Cooperative Centre for Freshwater Ecology. Canberra.
52 pp.
Gunderson, L. H. (2000) Ecological resilience – in theory and application.
Annual Review of Ecology and Systematics 31, 425–439.
Hart, B.T., Bailey, P., Edwards, R., Hortle, K., James, K., McMahon, A., Meredith,
C. and Swadling, K. (1991) A review of salt sensitivity of the Australian
freshwater biota. Hydrobiologia 210, 105-144.
Henderson, A. R. and Johnston, C. E. (2010) Ontogenetic habitat shifts and
habitat use in an endangered minnow, Notropis mekistocholas.
Ecology of Freshwater Fish 19: 87-95.
Hipsey, M.R. and Busch, B.D. (2012) Lower lakes water quality recovery
dynamics. University of Western Australia, Perth.
Ye, Q. et al. (2015) Monitoring of ecological responses to the delivery of CEW in the
lower River Murray during 2011-12
105 SARDI Aquatic Sciences
Hobbs, J. A., Yin, Q., Burton, J. and Bennett, W. A. (2005) Retrospective
determination of natal habitats for an estuarine fish with otolith
strontium isotope ratios. Marine and Freshwater Research 56, 655–660.
Humphries, P., King, A.J. and Koehn, J.D. (1999) Fish flows and flood plains:
Links between freshwater fishes and their environment in the Murray-
Darling river system, Australia. Environmental Biology of Fishes 56, 129-
151.
Humphries, P., Serafini, L.G. and King, A.J. (2002) River regulation and fish
larvae: Variation through space and time. Freshwater Biology 47(7),
1307-1331.
Humphries, P. (2005) Spawning time and early life history of the Murray cod,
Maccullochella peelii peelii (Mitchell) in an Australian river.
Environmental Biology of Fishes 72, 393-407.
Junk, W.J., Bayley, P.B. and Sparks, R.E. (1989) The flood-pulse concept in river-
floodplain systems. In Proceedings of the international large river
symposium. 106 (Ed. DP Dodge) pp. 110-27. Canadian Special
Publication of Fisheries and Aquatic Sciences
Kilsby, N. N. (2008) Reach-scale spatial hydraulic diversity in lowland rivers:
characterisation, measurement and significance for fish. Ph.D. Thesis.
The University of Adelaide.
Kilsby, N. N. and Walker, K. F. (2012) Behaviour of two small pelagic and
demersal fish species in diverse hydraulic environments. River Research
and Applications 28, 543-553.
King, A.J., Humphries, P. and Lake, P.S. (2003) Fish recruitment on floodplains:
The roles of patterns of flooding and life history characteristics.
Canadian Journal of Fisheries and Aquatic Sciences 60(7), 773-786.
King, A.J. (2005) Ontogenetic dietary shifts of fishes in an Australian floodplain
river. Marine and Freshwater Research 56, 215-225.
King, A.J., Tonkin, Z. and Mahoney, J. (2009) Environmental flow enhances
native fish spawning and recruitment in the Murray River, Australia.
River Research and Applications 25, 1205-1218.

Ye, Q. et al. (2015) Monitoring of ecological responses to the delivery of CEW in the
lower River Murray during 2011-12
106 SARDI Aquatic Sciences
Kingsford, R.T. (2000) Ecological impacts of dams, water diversions and river
management on floodplain wetlands in Australia. Austral Ecology
25(2), 109-127.
Koehn, J.D. and Harrington, D.J. (2006) Environmental conditions and timing
for the spawning of murray cod (Maccullochella peelii peelii) and the
endangered trout cod (M. macquariensis) in southeastern Australian
rivers. River Research and Applications 22(3), 327-342.
Kondolf, G. M., Boulton, A. J., O’Daniel, S., Poole, G. C., Rahel, F. J., Stanley, E.
H., Wohl, E., Bang, A., Carlstrom, J., Cristtoni, C., Huber, H., Koljonen, S.,
Louhi, P. and Nakamure, K. (2006) Process-based ecological river
restoration: visualizing three-dimensional connectivity and dynamic
vectors to recover lost linkages. Ecology and Society 11,
Lake, J.S. (1967) Rearing experiments with five species of Australian freshwater
fishes: I. Inducement to spawning. Australian Journal of Marine and
Freshwater Research 18, 137-153.
Leigh, S., Zampatti, B. and Nichol, J.M. (2010) Chowilla icon site – fish
assemblage condition monitoring 2005 – 2010. South Australian
Research and Development Institute (Aquatic Sciences), No.
F2008/000907-2.
Leigh, S. and Zampatti, B. (2011) Movement and spawning of Murray cod
(Maccullochella peelii) and golden perch (Macquaria ambigua
ambigua) in response to a small-scale flow manipulation in the
Chowilla Anabranch. South Australian Research and Development
Institute (Aquatic Sciences), No. F2010/000646-1.
Lloyd, L.N. and Walker, K.F. (1986) Distribution and conservation status of small
freshwater fish in the River Murray, South Australia. Transactions of the
Royal Society of South Australia 110(2), 49-57.
Lytle, D.A. and Poff, N.L. (2004) Adaptation to natural flow regimes. Trends in
Ecology & Evolution 19(2), 94-100.

Ye, Q. et al. (2015) Monitoring of ecological responses to the delivery of CEW in the
lower River Murray during 2011-12
107 SARDI Aquatic Sciences
Mackay, N.J. (1973) Histological changes in the ovaries of the golden perch,
Plectroplites ambiguus, associated with the reproductive cycle.
Australian Journal of Marine and Freshwater Research 24, 95-101.
Maheshwari, B.L., Walker, K.F. and McMahon, T.A. (1995) Effect of regulation
on the flow regime of the River Murray, Australia. Regulated Rivers:
Research and Management 10, 15-38.
Mallen-Cooper, M. and Stuart, I. G. (2003) Age, growth and non-flood
recruitment of two potamodromous fishes in a large semi-
arid/temperate river system. River Research and Applications 19: 697-
719.
Mallen-Cooper, M., Zampatti, B., Hillman, T., King, A., Koehn, J., Saddlier, S.,
Sharpe, S. and Stuart, I.G. (2011) Managing the Chowilla Creek
Environmental Regulator for Fish Species at Risk, Report prepared for
the South Australian Murray-Darling Basin Natural Resources
Management Board. 128 pp.
McArthur, J.M. and Howarth, R.J. (2004). Sr-isotope stratigraphy: the
Phanerozoic 87Sr/86Sr-curve and explanatory notes. In ‘A geologic
timescale 2004’. (Eds. F. M. Gradstein, J.G. Ogg and A. G. Smith)
Cambridge University Press, Cambridge, p. 96–105.
Murray–Darling Basin Commission (2002) Lake Victoria Operating Strategy.
MDBC Technical Report No. 2002/01. Murray–Darling Basin Commission,
Canmberra.
MDBC (2004) Native fish strategy for the Murray-Darling basin 2003-2013.
Murray–Darling Basin Basin Commision, MDBC Publication No. 25/04,
Canberra, ACT.
Moir, H. J. and Pasternack, G. B. (2008) Relationships between mesoscale
morphological units, stream hydraulics and Chinook salmon
(Oncorhynchus tshawytscha) spawning habitat on the Lower Yuba
River, California. Geomorphology 100: 527-548.

Ye, Q. et al. (2015) Monitoring of ecological responses to the delivery of CEW in the
lower River Murray during 2011-12
108 SARDI Aquatic Sciences
Molles, M.C., Crawford, C.S., Ellis, L.M., Valett, H.M. and Dahm, C.N. (1998)
Managed flooding for riparian ecosystem restoration - managed
flooding reorganizes riparian forest ecosystems along the middle Rio
Grande in New Mexico. Bioscience 48(9), 749-756.
Mosley, L.M., Zammit, B., Corkhill, E., Heneker, T.M., Hipsey, M.R., Skinner, D.S.
and Aldridge, K.T. (2012) The impact of extreme low flows on the water
quality of the lower Murray River and lakes, South Australia. Water
Resources Management 26, 3923-3946.
Muhlfeld, C. C., Thorrold, S. R., McMahon, T. E. and Marotz, B. (2012) Estimating
westslope cutthroat trout (Oncorhynchus clarkia lewisi) movements in a
river network using strontium icoscapes. Canadian Journal of Fisheries
and Aquatic Sciences 69, 906–915.
Naiman, R.J., Bunn, S.E., Nilsson, C., Petts, G.E., Pinay, G. and Thompson, L.C.
(2002) Legitimizing fluvial ecosystems as users of water: An overview.
Environmental management 30(4), 455-467.
Nestler, J.M., Pompeu, P.S., Goodwin, R.A., Smith, D.L., Silva, L.G.M., Baigun,
C.R.M. and Oldani, N.O. (2012) The river machine: A template for fish
movement and habitat, fluvial geomorphology, fluid dynamics and
biogeochemical cycling. River Research and Applications 28, 490-503.
Nielsen, D.L., Brock, M.A., Rees, G.N. and Baldwin, D.S. (2003) Effects of
increasing salinity on freshwater ecosystems in Australia. Australian
Journal of Botany 51, 655-665.
Nislow, K. H., Folt, C. L. and Parrish, D. L. (1999) Favorable foraging locations for
young Atlantic salmon: application to habitat and population
restoration. Ecological Applications 9, 1085-1099.
Palmer, M.R., and Edmond, J.M. (1989) The strontium isotope budget of the
modern ocean. Earth and Planetary Science Letters 92, 11-26.
Paton, C., Hellstrom, J., Paul, B., Woodhead, J., and Hergt, J. (2011) Iolite:
Freeware for the visualisation and processing of mass spectrometric
data. Journal of Analytical Atomic Spectrometry 26, 2508–2518.

Ye, Q. et al. (2015) Monitoring of ecological responses to the delivery of CEW in the
lower River Murray during 2011-12
109 SARDI Aquatic Sciences
Pin, C., Briot, D., Bassin, C. and Poitrasson, F. (1994) Concomitant separation of
strontium and samarium-neodymium for isotopic analysis in silicate
samples, based on specific extraction chromatography. Analytica
Chimica Acta 298, 209–217.
Poff, N.L., Allan, J.D., Bain, M.B., Karr, J.R., Prestegaard, K.L., Richter, B.D.,
Sparks, R.E. and Stromberg, J.C. (1997) The natural flow regime: A
paradigm for river conservation and restoration. BioScience 47(11),
769-784.
Poff, N.L. and Zimmerman, J.K.H. (2010) Ecological responses to altered flow
regimes: A literature review to inform the science and management of
environmental flows. Freshwater Biology 55(1), 194-205.
Potter, N.J., Chiew, F.H.S. and Frost, A.J. (2010) An assessment of the severity of
recent reductions in rainfall and runoff in the Murray-Darling basin.
Journal of Hydrology 381(1-2), 52-64.
Puckridge, J.T., Sheldon, F., Walker, K.F. and Boulton, A.J. (1998) Flow variability
and the ecology of large rivers. Marine and Freshwater Research 49(1),
55-72.
Richter, B.D., Baumgartner, J.V., Powell, J. and Braun, D.P. (1996) A method for
assessing hydrologic alteration within ecosystems. Conservation Biology
10(4), 1163-1174.
Serafini, L.G. and Humphries, P. (2004) Preliminary guide to the identification of
larvae of fish, with a bibliography of their studies, from the Murray-
Darling basin. Cooperative Research Centre for Freshwater ecology,
Murray-Darling Freshwater Research Centre, Albury and Monash
University, Clayton, No. Identification and Ecology Guide No. 48.
Shields, F. D. and Rigby, J. R. (2005) River habitat quality from river velocities
measured using acoustic doppler current profiler. Environmental
Management 36, 565-575.
Statzner, B. and Higler, B. (1986) Stream hydraulics as a major determinant of
bethic invertebrate zonation patterns. Freshwater Biology 16, 127-139.

Ye, Q. et al. (2015) Monitoring of ecological responses to the delivery of CEW in the
lower River Murray during 2011-12
110 SARDI Aquatic Sciences
The MathsWorks Inc (2010). MATLAB version 7.10.0. Natick, Massachusetts
Tockner, K. and Stanford, J.A. (2002) Riverine flood plains: Present state and
future trends. Environmental Conservation 29(3), 308-330.
Tonkin, Z. D., Humphries, P. and Pridmore P. A. (2006) Ontogeny of feeding in
two native and one alien fish species from the Murray-Darling Basin,
Australia. Environmental Biology of Fishes 76, 303–315.
Tonkin, Z., King, A., Mahoney, J. and Morrongiello, J. (2007) Diel and spatial
drifting patterns of silver perch Bidyanus bidyanus eggs in an Australian
lowland river. Journal of Fish Biology 70, 313-317.
Travnichek, V.H., Bain, M.B. and Maceina, M.J. (1995) Recovery of a
warmwater fish assemblage after the initiation of a minimum-flow
release downstream from a hydroelectric dam. Transactions of the
American Fisheries Society 124(6), 836-844.
Trippel, E.A. and Chambers, R.C. (1997) The early life history of fishes and its
role in recruitment processes. In Early life history and recruitment in fish
populations. (Eds. RC Chambers and EA Trippel) pp. 21-32. Chapman
and Hall, London, UK.
Walker, K.F. (1985) A review of the ecological effects of river regulation in
Australia. Hydrobiologia 125, 111-129.
Walker, K. F. and Thoms, M. C. (1993) Environmental effects of flow regulation
on the lower River Murray, Australia. Regulated Rivers: Research &
Management 8, 103-119
Walker , K.F., Sheldon, F. and Puckridge, J.T. (1995) An ecological perspective
on dryland rivers. Regulated Rivers: Research & Management 11, 85-
104.
Walker , K.F. (2006) Serial weirs cumulative effects: The lower River Murray,
Australia. In Ecology of desert rivers. (Ed. RT Kingsford) pp. 248-279.
Cambridge University Press, Cambridge.

Ye, Q. et al. (2015) Monitoring of ecological responses to the delivery of CEW in the
lower River Murray during 2011-12
111 SARDI Aquatic Sciences
Walther, B. D., Thorrold, S. R. and Olney, J. E. (2008) Geochemical signatures in
otoliths record natal origins of American shad. Transactions of the
American Fisheries Society 137, 57–69.
Wassens, S., Watts, R.J., Spencer, J.A., Howitt, J., McCasker, N.A., Griese, V.,
Burns, A., Croft, R., Zander, A., Amos, C. and Hall, A. (2012) Monitoring
of ecosystem responses to the delivery of environmental water in the
Murrumbidgee system. Institute for Land, Water and Society, Charles
Sturt University, Report 2.
Weisberg, S.B. and Burton, W.H. (1993) Spring distribution and abundance of
ichthyoplankton in the tidal Delaware River. Fishery Bulletin 91(4), 788-
797.
Welcomme, R.L. (1985) River fisheries. United Nations, No. 262, Rome.
Williams, W.D. (1987) Salinisation of rivers and streams: An important
environmental hazard. Ambio 16, 180-185.
Woodhead, J., Swearer, S., Hergt, J. and Maas, R. (2005) In situ Sr-isotope
analysis of carbonates by LA-MC-ICP-MS: interference corrections, high
spatial resolution and an example from otolith studies. Journal of
Analytic Atomic Spectrometry 20, 22–27.
Ye, Q. and Zampatti, B.P. (2007) Murray cod stock status: The Lower River
Murray, South Australia. South Australian Research and Development
Institute (Aquatic Sciences), No. SARDI publication No. F20007-000211-
1, Adelaide, SA.
Ye, Q., Cheshire, K.J. and Fleer, D. (2008) Recruitment of golden perch and
selected large-bodied fish species following the weir pool manipulation
in the river murray, south australia. South Australian Research and
Development Institute (SARDI), Aquatic Sciences, SARDI Research
Report Series No. 303, Publication No. F2008/000606-1, Adelaide.
Ye, Q. et al. (2015) Monitoring of ecological responses to the delivery of CEW in the
lower River Murray during 2011-12
112 SARDI Aquatic Sciences
Ye, Q., Livore, J.P., Bucater, L.B., Cheshire, K.J.M. and Fleer, D. (2013) Changes
in larval fish assemblages related to Commonwealth environmental
watering in the lower River Murray in 2011/12 with emphasis on golden
perch. South Australian Research and Development Institute (Aquatic
Sciences), SARDI Publication No. F2013/000000-1. Adelaide.
Zampatti, B. P., Leigh, S. J. and Nicol, J. M. (2011) Fish and aquatic
macrophyte communities in the Chowilla Anabranch System, South
Australia: A report on investigations from 2004 – 2007. South Australia
Research and Development Institute (Aquatic Sciences), SARDI
Research Report Series No. 525, Publication No. F2010/000719-1.
Adelaide.
Zampatti, B. P. and Leigh, S. J. (2013a) Effects of flooding on recruitment and
abundance of Golden Perch (Macquaria ambigua ambigua) in the
lower River Murray. Ecological Management and Restoration 14, 135-
143.
Zampatti, B.P. and Leigh, S.J. (2013b) Within-channel flows promote spawning
and recruitment of golden perch, Macquaria ambigua ambigua:
implications for environmental flow management in the River Murray,
Australia. Marine and Freshwater Research 64(7), 618-630.
Zeug, S.C. and Winemiller, K.O. (2008) Relationships between hydrology,
spatial heterogeneity, and fish recruitment dynamics in a temperate
floodplain river. River Research and Applications 24(1), 90-102.

Ye, Q. et al. (2015) Monitoring of ecological responses to the delivery of CEW in the lower River Murray during 2011-12
113 SARDI Aquatic Sciences
APPENDICES
Appendix I. Map showing the location of the Murray–Darling Basin and the major rivers that comprise the southern Murray-Darling Basin, showing the
numbered Locks and Weirs (up to Lock 26, Torrumbarry), the Darling, Lachlan, Murrumbidgee, Edward–Wakool, Campaspe and Goulburn rivers and
Lake Victoria, an off-stream storage used to regulate flows in the lower River Murray.

Ye, Q. et al. (2015) Monitoring of ecological responses to the delivery of CEW in the
lower River Murray during 2011-12
114 SARDI Aquatic Sciences
Appendix II. Comparison of the mean daily discharge (ML d-1) from 2005-2012 at Sites
1 (red line) and 2 (blue line) in the lower River Murray. The seasonal entitlement
allocation is presented in black line.
Appendix III. Comparison of the mean daily change in water level (mAHD, AHD =
Level relative to Australian Height Datum) from ‘normal’ pool height (Site 1: 0.75 m,
Site 2: 16.3 m) from 2005 to 2012, at Sites 1 (red line) and 2 (blue line) in the lower River
Murray.
Date
1/1/
2005
1/5/
2005
1/9/
2005
1/1/
2006
1/5/
2006
1/9/
2006
1/1/
2007
1/5/
2007
1/9/
2007
1/1/
2008
1/5/
2008
1/9/
2008
1/1/
2009
1/5/
2009
1/9/
2009
1/1/
2010
1/5/
2010
1/9/
2010
1/1/
2011
1/5/
2011
1/9/
2011
1/1/
2012
1/5/
2012
Dis
char
ge (
Ml d
ay-1
)
0
20000
40000
60000
80000
100000
Date
1/1/
2005
1/5/
2005
1/9/
2005
1/1/
2006
1/5/
2006
1/9/
2006
1/1/
2007
1/5/
2007
1/9/
2007
1/1/
2008
1/5/
2008
1/9/
2008
1/1/
2009
1/5/
2009
1/9/
2009
1/1/
2010
1/5/
2010
1/9/
2010
1/1/
2011
1/5/
2011
1/9/
2011
1/1/
2012
1/5/
2012
Rel
ativ
e w
ater
leve
l (m
)
-2
-1
0
1
2
3
4

Ye, Q. et al. (2015) Monitoring of ecological responses to the delivery of CEW in the
lower River Murray during 2011-12
115 SARDI Aquatic Sciences
Appendix II. Comparison of the mean daily conductivity (μS cm-1 at 25 °C) from 2005
to 2012, at Sites 1 (red line) and 2 (blue line) in the lower River Murray.
Appendix III. Comparison of mean daily water temperature from 2005 to 2012, at Sites
1 (red line) and Site 2 (blue line) in the lower River Murray.
Date
1/1/
2005
1/5/
2005
1/9/
2005
1/1/
2006
1/5/
2006
1/9/
2006
1/1/
2007
1/5/
2007
1/9/
2007
1/1/
2008
1/5/
2008
1/9/
2008
1/1/
2009
1/5/
2009
1/9/
2009
1/1/
2010
1/5/
2010
1/9/
2010
1/1/
2011
1/5/
2011
1/9/
2011
1/1/
2012
1/5/
2012
Con
duct
ivity
(µS
cm
-1)
0
200
400
600
800
1000
Date
1/1/
2005
1/5/
2005
1/9/
2005
1/1/
2006
1/5/
2006
1/9/
2006
1/1/
2007
1/5/
2007
1/9/
2007
1/1/
2008
1/5/
2008
1/9/
2008
1/1/
2009
1/5/
2009
1/9/
2009
1/1/
2010
1/5/
2010
1/9/
2010
1/1/
2011
1/5/
2011
1/9/
2011
1/1/
2012
1/5/
2012
Tem
pera
ture
(°C
)
5
10
15
20
25
30
35

Ye, Q. et al. (2015) Monitoring of ecological responses to the delivery of CEW in the
lower River Murray during 2011-12
116 SARDI Aquatic Sciences
Appendix IVI. Pairwise comparison of larval fish assemblages in the lower River
Murray among years for each site. Significant difference (p < 0.0033) in bold
Site 1 Site 2
t p (perm) t p (perm)
2005-06 vs 2006-07 1.962 0.016 2.056 0.003
2005-06 vs 2007-08 2.920 0.001 3.432 0.001
2005-06 vs 2008-09 4.087 0.001 4.060 0.001
2005-06 vs 2010-11 6.758 0.001 5.277 0.001
2005-06 vs 2011-12 4.872 0.001 3.746 0.001
2006-07 vs 2007-08 1.777 0.033 2.106 0.005
2006-07vs 2008-09 2.766 0.001 3.233 0.001
2006-07 vs 2010-11 6.100 0.001 6.073 0.001
2006-07 vs 2011-12 4.110 0.001 3.784 0.001
2007-08 vs 2008-09 2.484 0.001 3.231 0.001
2007-08 vs 2010-11 5.863 0.001 6.581 0.001
2007-08 vs 2011-12 4.473 0.001 5.179 0.001
2008-08 vs 2010-11 6.197 0.001 6.275 0.001
2008-09 vs 2011-12 4.985 0.001 4.874 0.001
2010-11 vs 2011-12 3.421 0.001 3.672 0.001

Ye, Q. et al. (2015) Monitoring of ecological responses to the delivery of CEW in the
lower River Murray during 2011-12
117 SARDI Aquatic Sciences
Appendix VI. SIMPER analysis for larval fish assemblage comparison between 2011
and other years for a) Site1 and b) Site 2 in the lower River Murray. Results are based
on fourth root transformed data. Mean abundance is the relative abundance
corrected by flow (mean per trip). CR (consistency ratio) indicates the consistency of
differences in abundance between years (shown by PERMANOVA) attributable to
individual species. A cumulative cut-off of 75% was applied. Mean dissimilarity is
expressed as a percentage ranging between 0% (identical) and 100% (totally
dissimilar).
a)
Mean
Abundance Mean dissimilarity = 56.23
Species name 2005 2011 CR Contribution
(%)
Cumulative contribution
(%)
Australian smelt 4.14 1.50 1.37 25.26 25.26
Carp gudgeon 4.25 1.55 1.32 23.58 48.84
Bony herring 3.63 1.95 1.21 21.75 70.59
Flathead gudgeon 2.59 2.39 0.82 12.72 83.31
Mean dissimilarity = 56.95
Species name 2006 2011 CR Contribution
(%)
Cumulative contribution
(%)
Australian melt 3.86 1.50 1.04 27.96 27.96
Bony herring 3.09 1.95 1.17 21.33 49.29
Carp gudgeon 3.10 1.55 1.18 18.99 68.27
Flathead gudgeon 4.13 2.39 1.19 18.11 86.38
Mean dissimilarity = 60.00
Species name 2007 2011 CR Contribution
(%)
Cumulative contribution
(%)
Australian smelt 4.31 1.50 1.16 26.56 26.56
Flathead gudgeon 4.53 2.39 1.40 21.83 48.39
Carp gudgeon 3.71 1.55 1.26 20.42 68.81
Bony herring 1.34 1.95 1.25 13.96 82.77
Mean dissimilarity = 54.90
Species name 2008 2011 CR Contribution
(%)
Cumulative contribution
(%)
Flathead gudgeon 5.67 2.39 1.59 25.61 25.61
Carp gudgeon 3.79 1.55 1.24 19.69 45.30
Australian smelt 2.59 1.50 1.18 16.94 62.24
Bony herring 2.25 1.95 1.32 15.58 77.82
Mean dissimilarity = 72.32
Species name 2010 2011 CR Contribution
(%)
Cumulative contribution
(%)
Flatheadgudgeon 2.30 2.39 0.81 18.12 18.12
Golden perch 1.48 1.69 0.92 15.58 33.70
Carp gudgeon 1.53 1.55 0.88 14.88 48.58
Bony herring 0.31 1.95 0.85 14.44 63.02
Australian smelt 0.26 1.50 0.87 9.95 72.97
Free embryos 1.57 0.00 0.71 9.33 82.31

Ye, Q. et al. (2015) Monitoring of ecological responses to the delivery of CEW in the
lower River Murray during 2011-12
118 SARDI Aquatic Sciences
b)
Mean
Abundance Mean dissimilarity = 63.93
Species name 2005 2011 CR Contribution
(%)
Cumulative contribution
(%)
Carp gudgeon 3.27 1.24 1.27 22.67 22.67
Australian smelt 2.57 0.97 1.18 18.52 41.19
Flathead gudgeon 2.89 1.99 0.99 17.75 58.93
Bony herring 1.27 1.50 0.99 14.41 73.35
Golden perch 0.52 1.33 0.90 11.18 84.53
Mean dissimilarity = 62.86
Species name 2006 2011 CR Contribution
(%)
Cumulative contribution
(%)
Australian smelt 3.13 0.97 1.08 25.61 25.61
Bony herring 2.07 1.50 1.03 18.29 43.90
Carp gudgeon 2.51 1.24 1.18 18.28 62.18
Flathead gudgeon 2.90 1.99 1.07 16.74 78.92
Mean dissimilarity = 64.72
Species name 2007 2011 CR Contribution
(%)
Cumulative contribution
(%)
Australian smelt 4.89 0.97 1.41 30.24 30.24
Bony herring 3.52 1.50 1.25 20.13 50.36
Carp gudgeon 3.60 1.24 1.36 19.09 69.45
Flathead gudgeon 3.81 1.99 1.21 16.75 86.21
Mean dissimilarity = 67.35
Species name 2008 2011 CR Contribution
(%)
Cumulative contribution
(%)
Australian smelt 4.63 0.97 1.30 39.85 39.85
Flathead gudgeon 2.11 1.99 1.07 16.17 56.02
Bony herring 1.71 1.50 1.07 15.51 71.54
Carp gudgeon 1.43 1.24 1.08 13.27 84.81
Mean dissimilarity = 79.21
Species name 2010 2011 CR Contribution
(%)
Cumulative contribution
(%)
Carp 2.32 0.12 0.87 19.90 19.90
Flathead gudgeon 1.54 1.99 0.91 17.82 37.72
Golden perch 1.86 1.33 0.92 16.31 54.03
Bony herring 0.95 1.50 0.89 13.27 67.30
Carp gudgeon 0.77 1.24 0.79 11.09 78.40

Ye, Q. et al. (2015) Monitoring of ecological responses to the delivery of CEW in the
lower River Murray during 2011-12
119 SARDI Aquatic Sciences
Appendix VII. DistLM sequential results indicating which environmental variable
significantly contributed most to the relationship with the multivariate larval fish
assemblage data cloud (biological data). Proportion of the variation explained (Prop)
and cumulative variation explained (Cumul).
Variable R2 res.df Pseudo-F P Prop. Cumul.
Water discharge 0.190 18.32 0.001 0.190 0.190
Temperature 0.277 9.316 0.001 0.087 0.278
Relative water level 0.338 6.938 0.001 0.060 0.338
Conductivity 0.366 3.320 0.005 0.028 0.366