Monitoring living and working conditions in the European Union
41
Monitoring living and working conditions in the European Union Robert Anderson Eurofound Centre for Workforce Futures Macquarie University, Sydney 20 September 2013
-
Upload
ignatius-bates -
Category
Documents
-
view
49 -
download
0
description
Monitoring living and working conditions in the European Union. Robert Anderson Eurofound Centre for Workforce Futures Macquarie University, Sydney 20 September 2013. European Foundation for the Improvement of Living and Working Conditions. - PowerPoint PPT Presentation
Transcript of Monitoring living and working conditions in the European Union

Monitoring living and working conditions in the European Union
Robert Anderson
Eurofound
Centre for Workforce Futures
Macquarie University, Sydney
20 September 2013

• A decentralised agency of the EU established in 1975• Administered by a Governing Board
composed of national representatives of the social partners, national governments and the European Commission
• Generates policy-relevant research and findings which contribute to improving the quality of work and life in Europe, through: Comparative research and analysis of developments
affecting living and working conditions Monitoring of trends in living and working conditions Identification of emerging issues
European Foundation for the Improvement of Living and Working Conditions

3
Monitoring living and working conditions: Surveys and Network of observatories
European Company Survey (ECS)2004; 2009; 2013
European Working Conditions Survey (EWCS)
1990/91; 1995/96; 2000; 2005; 2010; 2015
European Quality of Life Survey (EQLS)
2003; 2007; 2011/12; 2016

4
Eurofound surveys: country coverage
Survey # of countries Countries
European Quality of Life Survey
34(2011/2012)
EU27 CC6: Croatia, Iceland, Macedonia, Montenegro, Serbia, Turkey;IPA: Kosovo
European Working Conditions Survey
34(2010)
EU27CC3 (Croatia, Macedonia, Turkey)IPA3 (Albania, Kosovo, Montenegro)Norway
European Company Survey
32(2013)
EU27CC (Croatia, Iceland, Macedonia, Montenegro, Turkey)

Survey implementation
• Eurofound develops questionnaires• Questionnaire translation and fieldwork tendered out• Tender specifications: balance between prescribing ‘best
practice’ and inviting contractors to outline merits of their approach
• Explicit quality assurance plan to accompany tender• Main difficulties
Limited number of potential contractors Multi-level management structure (contractor and sub-
contractors) Budgetary constraints
19/04/2023 5

1. Planning: using a systematic Quality Control Framework
developed specifically for each survey
2. Consultation: experts and users of the survey participate in the development of the questionnaire, concepts and methodology
3. Transparency: opening up the process both internally and externally
4. Documentation: keeping track of everything, making sure that interventions can be traced back
5. Assessment of the quality of the process and output: EF surveys subscribe to the quality criteria of European Statistical System. External quality assessments are carried out after each round.
19/04/2023 6
Key elements of the quality assurance strategy for Eurofound surveys

Extensive quality control
• Careful selection of sampling frames Separate enumeration in case of random route
• State-of-the-art procedures for questionnaire translation• Explicit procedures for respondent selection• Experienced, well trained field force• Systematic monitoring as well as local spot checks of fieldwork• Elaborate procedures for coding and data cleaning• External data quality assessment
19/04/2023 7

• Five waves: 1991, 1995, 2000, 2005 and 2010• 5th EWCS - 34 countries: EU27, NO, TR, HR, MK, MO, AL, XK• Employees and self-employed (15+; ILO definition)
Register based stratified random sampling
Random routes if no register available
Stratification by urbanisation and region• 43816 interviews
1000-4000 interviews per country Response rate (RR3) 44.2% (between 31.3% (ES) and 73.5% (LV))
• 40 minute ‘face to face’ interviews at peoples’ homes• 2010: 25 language versions of same questionnaire
19/04/2023 8
European Working Conditions Survey

Core surveyed aspects of working conditions
working time, pay work organisation precarious employment
work-related health risks cognitive and psychosocial factors work-life balance access to training
leadership styles worker participation
European Working Conditions Survey
EWCS 2010: 120 questions 288 items

Selected highlights fromEuropean Working Conditions Survey
19/04/2023 10

Vibrations
Noise
Breathing in smoke/ dust and/or vapours
Heavy loads
Low temperatures
High temperatures
Tobacco smoke
Standing
Chemical substances
Tiring or painful positions
Repetitive hand or arm movements
Infectious materials
Lifting or moving people
0% 10% 20% 30% 40% 50% 60% 70% 80%
Women Men
Exposure to physical risks (at least one quarter of the time)
EWCS, 2010

Exposure to physical risks, 1991-2010
Vibrations
Noise
High temperatures
Low temperatures
Breathing in smoke/ dust and/or vapours
Chemical substances
Tiring or painful posi-tions
Heavy loads
Repetitive hand or arm movements
0% 10% 20% 30% 40% 50% 60% 70%
2010 EU272005 EU272000 EU271995 EU151991 EC12

1. High demands and work intensity
2. Emotional demands
3. Lack of autonomy
4. Ethical conflicts
5. Poor social relationships
6. Job and work insecurity
19/04/2023 13
Psychosocial risks

• Work intensity is measured using three questions
The number of determinants of the pace of work Frequency of having to work at high speed Frequency of having to work to tight deadlines
• Work intensity increased over the last two decades but the increase slowed down since 2005
• 62% of workers report to be working to tight deadlines and 59% of workers report to be working at high speed (almost) all of the time
19/04/2023 14
High demands and work intensity

• Ability to change or choose
Order of tasks Speed or rate of work Method of work
• 53% of workers control all these aspects• Autonomy increases with age• On aggregate, men and women do not differ
19/04/2023 15
Lack of autonomy

19/04/2023 16
Work intensity and job autonomy by sector and occupation, EU27
25 30 35 40 45 50 5540
45
50
55
60
65
70
75
80
85
90
Other services
Health
Education Public administration
Financial services
Transport
Wholesale & retail
Construction
Industry
Agriculture
Elementary occupations
Plant and machine opera-tors
Craft and trades workers
Skilled agricultural workers
Service and sales workers
Clerical support workers
Technicians
Professionals
Managers
Work intensity
Job
auto
nom
y

Research on job quality Job level characteristics of work associated with health, well being in a positive or negative way
Indices of job quality Brief contents of the indicators used
Earnings index Hourly earnings
Prospects index Job security, career progression, contract quality
Intrinsic job quality Skills and discretion
Good social environment
Good physical environment
Work intensity
Working time quality index
Duration, scheduling, discretion, short term flexibility
See results: Eurofound (2012) Trends in job quality in Europe

19/04/2023 18
Average job quality by establishment size
Under 5 employees Between 5 & 49 employees
More than 49 employees
0
200
400
600
800
1000
1200
1400
1600
Earnings in Euros
Under 5 employees Between 5 & 49 employees
More than 49 employees
0
10
20
30
40
50
60
70
80
WTQ IJQ
Prospects

Rank lowest on earnings, intrinsic job quality and prospects but better on working time quality than cluster 3
Score highest in terms of earnings, intrinsic job quality and prospects, but lower than cluster 2 on working time quality
Have the highest level of working time quality and the second-highest levels of intrinsic job quality and prospects; they score slightly lower than cluster 3 in terms of earnings
Have the second-highest level of earnings, but rank third in terms of intrinsic job quality and prospects and lowest on working time quality
Four job quality clusters

Low-quality jobs by Member State (%)
(Eurofound, Fifth European Working Conditions Survey)

19/04/2023 21
Capacity to change: Job quality indices in EU 15 countries, 1995-2010
Skills and Discretion (T) Work Intensity(T) Good Physical Environment(T) Working Time Quality(T)0
10
20
30
40
50
60
70
80
90
1995200020052010

Working Conditions:• Physical environment has hardly improved – in spite of efforts• Increase in index for skills and discretion in some countries is positive• Working Time Quality has improved in all countries• Evidence of work intensification is confirmed• Countries/groups exposed to different trade-offs• (Approach can be narrowed to employment quality or enlarged)
One-fifth ‘at risk’ jobs: How acceptable and sustainable?This calls for a wide front of actions … in improving working conditions
Changes in:• Work organisation and HRM practices may be necessary (the quest for the win-win
practices)• As well as in developing the public authorities actions in relation to limiting
externalities, promoting good practice etc.
Monitoring is important
19/04/2023 22
To sum up, job quality over time in Europe

Selected highlights fromEuropean Quality of Life Survey
19/04/2023 23
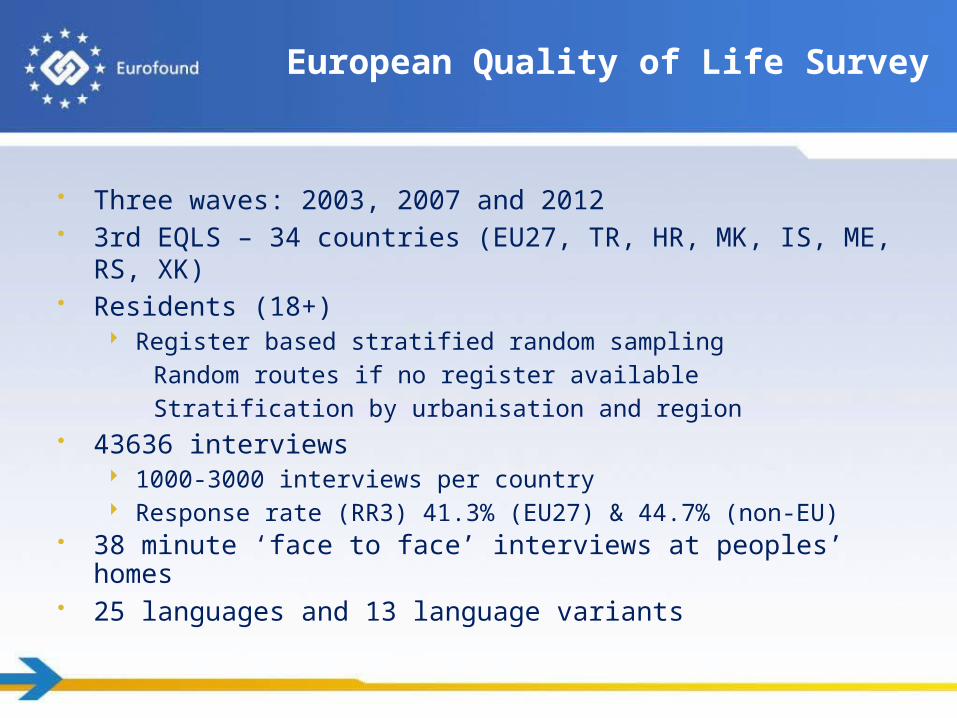
• Three waves: 2003, 2007 and 2012• 3rd EQLS – 34 countries (EU27, TR, HR, MK, IS, ME, RS, XK)• Residents (18+)
Register based stratified random sampling
Random routes if no register available
Stratification by urbanisation and region• 43636 interviews
1000-3000 interviews per country Response rate (RR3) 41.3% (EU27) & 44.7% (non-EU)
• 38 minute ‘face to face’ interviews at peoples’ homes• 25 languages and 13 language variants
19/04/2023 24
European Quality of Life Survey

Eurofound’s conceptual framework for measuring quality of life in EQLS
• Scope that people have to attain their goals. • Quality of life is measured by objective as well subjective indicators. • Quality of life as overarching frame that entails concepts at level of
individual, family, community, and society.
• EQLS is based on a multi-dimensional concept of QoL: Goes beyond focus on living conditions or resources, The survey covers broad spectrum of domains of life (employment,
housing, family, health, community, participation in society, socioeconomic (in)security);
and analyses interrelationship between domains (such as work, family, health and wellbeing);
Addresses quality of society: trust, intergroup relations, quality of public and neighbourhood services.

Core surveyed aspects of quality of life
Subjective well-beingLiving standards and deprivationHome, housing, local environment
Employment and work-life balanceFamily and social lifeSocial exclusion and community
involvement
Public services, health, healthcareQuality of society
European Quality of Life Survey
EQLS 2011: 73 questions 183 items

Monitoring change over time:Happiness
4.5
5.0
5.5
6.0
6.5
7.0
7.5
8.0
8.5
9.0
5.8
6.8
6.9 7.0
7.0 7.07.3
7.3
7.3 7.4 7.47.5 7.5 7.5 7.5
7.6
7.7 7.7 7.8 7.8 7.8 7.98.0 8.0 8.0
8.28.3 8.3
6.3 6.7
7.27.1
6.97.0 7.0
7.7
6.5
6.8
7.3 7.4 7.4
7.16.9
7.8
7.6
7.1
7.47.6 7.6
7.2
7.7 7.77.8 7.8
8.1 8.2
Happiness 2007
Happiness 2011

Consistent social inequalities: health satisfaction (scale 1-10), EU27, EQLS
Lowest quartile 2nd 3rd Highest quartile6.0
6.2
6.4
6.6
6.8
7.0
7.2
7.4
7.6
7.8
8.0
6.9
7.1
7.4
7.8
6.7
7.1
7.5
7.8

Views on the quality of long-term care services
More and Better Jobs in Home Care Services - Brussels, 12 September 2013
In general, how would you rate the quality of long-term care services in your country? (on a scale of 1-10, where 1 means very poor and 10 means very high quality)
EQLS, 2012
Bulgaria
Poland
Portugal
UK
Spain
Germany
France
Netherlands
Denmark
Austria
1 2 3 4 5 6 7 8
3.8
4.9
5.4
5.8
6.2
6.4
6.5
6.6
6.7
7.1

Difficulties in accessing long-term care (%)
More and Better Jobs in Home Care Services - Brussels, 12 September 2013

19/04/2023 31
Unpaid work
Source: EQLS 2011

Challenges for work-life balanceby working hours (% at least several times a month)
Too tired to dohousehold jobs
Family responsibilities suffer Difficult toconcentrate at work
21–34
35–40
41–47
48+
0 10 20 30 40 50 60 70 80
21–34
35–40
41–47
48+
0 10 20 30 40 50 60
Women Men
21–34
35–40
41–47
48+
0 5 10 15 20 25 30

EU27 14%
EU15 12%
EU12 21%
Men with children 15%
Women with children 17%
Involved in childcare ‘every day’ 16%
Involved in eldercare ‘every day’ 21%
19/04/2023 33
Family life and work –Pressures at home and at work

19/04/2023 34
Proportion reporting problem at least several times a month
Working carers Non-carers
Too tired to do household jobs 54% 53%
Difficult to fulfil family responsibilities
32% 29%
Difficult to concentrate at work 18% 13%
Problems at both home and work 17% 13%

19/04/2023 35
Health and well-being of carers aged 18-64
Working carers Other carers Non-carers
Bad or very bad health 4% 15% 6%
Feeling tense most of the time
14% 19% 12%
Feeling lonely most of the time
7% 10% 6%
Feeling depressed most of the time
6% 14% 5%
Global life satisfaction 7.2 6.6 7.1

19/04/2023 36
Material well-being of carers aged 18-64
Working carers
Other carers
Non-carers
Proportion:
In lowest income quartile
15% 42% 24%
Having difficulty making ends meet
45% 59% 46%

19/04/2023 37
Social exclusion among people of working age (18-64)
Proportion who "agree or strongly agree"
Working carers Other carers Non-carers
What I do in life is worthwhile 82% 76% 79%
Free to decide how I live my life 72% 67% 75%
Seldom time to do things I enjoy 46% 41% 38%
Left out of society 11% 16% 10%
Value of what I do not recognised 26% 29% 22%
Life complicated, can't find my way 20% 29% 19%
People look down on me 16% 26% 17%
Social exclusion index 2.2 2.5 2.2

19/04/2023 38
Social exclusion index
unable to work
unemployed 12 months +
unemployed <12 months
at work as an assisting relative
full-time homemaker
on leave
at work
retired
student
1.00 1.50 2.00 2.50 3.00
2.812.76
2.422.36
2.282.112.102.092.09

Overview report (2012) Quality of Life in Europe: Impacts of the crisis
EU27 analytical reports (forthcoming 2013)
Trends in quality of life 2003-2007-2011Subjective well-being and quality of lifeQuality of society and public servicesSocial inequalities in quality of life
Enlargement country reports (2013)
7 country profiles in spring 2013
Trend analysis later in 2013:
Turkey 2003-2007-2012 Croatia 2007-2012FYROM 2007-2012
39
More of EQLS

• Eurofound Survey web pages
http://www.eurofound.europa.eu/surveys/index.htm
• Technical reports http://www.eurofound.europa.eu/surveys/eqls/2011/documents/technic
alreport.pdf
• External Quality Assessment reports http://www.eurofound.europa.eu/surveys/ewcs/2010/documents/quality
assessment.pdf
• Survey mapping tool on Eurofound website http://www.eurofound.europa.eu/surveys/smt/eqls/results.htm
• Data sets freely available on the UK Data archive http://www.eurofound.europa.eu/surveys/availability/index.htm
40
Data and background information