
Monitoring in Anaesthesia and Critical Care
35
Monitoring in Anaesthesia and Critical Care Dr. Azzam F. G. Taktak Physiological Measurement System Signal Conditioning (Filtering, Modulation, etc.) ADC Display Transducer Amplifier
Transcript of Monitoring in Anaesthesia and Critical Care

1
Monitoring in Anaesthesia and Critical Care
Dr. Azzam F. G. Taktak
Physiological Measurement System
Signal Conditioning(Filtering, Modulation, etc.) ADC
Display
Transducer Amplifier

2
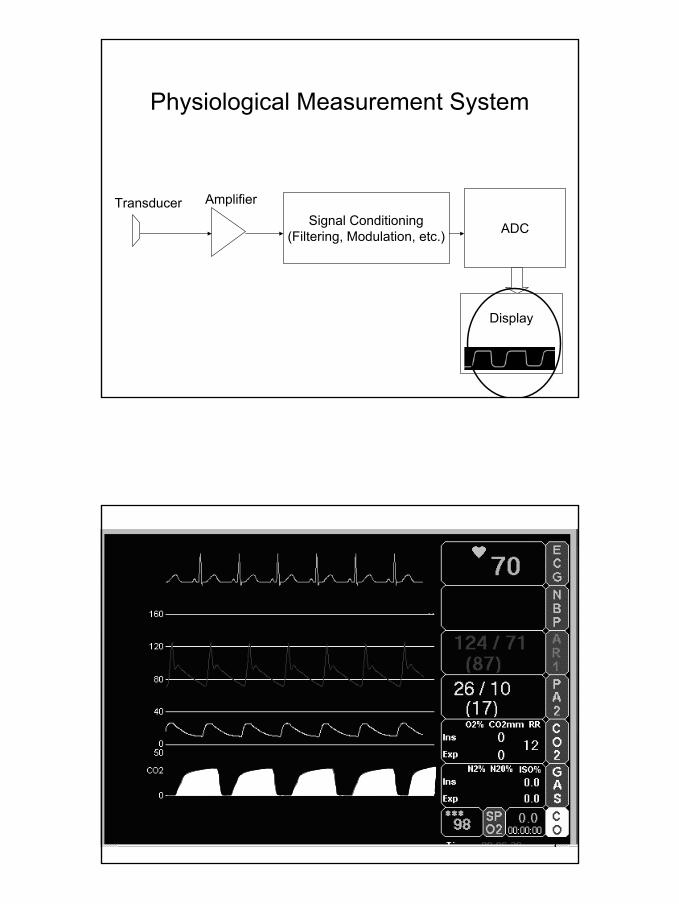
Physiological Measurement System
Signal Conditioning(Filtering, Modulation, etc.) ADC
Display
Transducer Amplifier
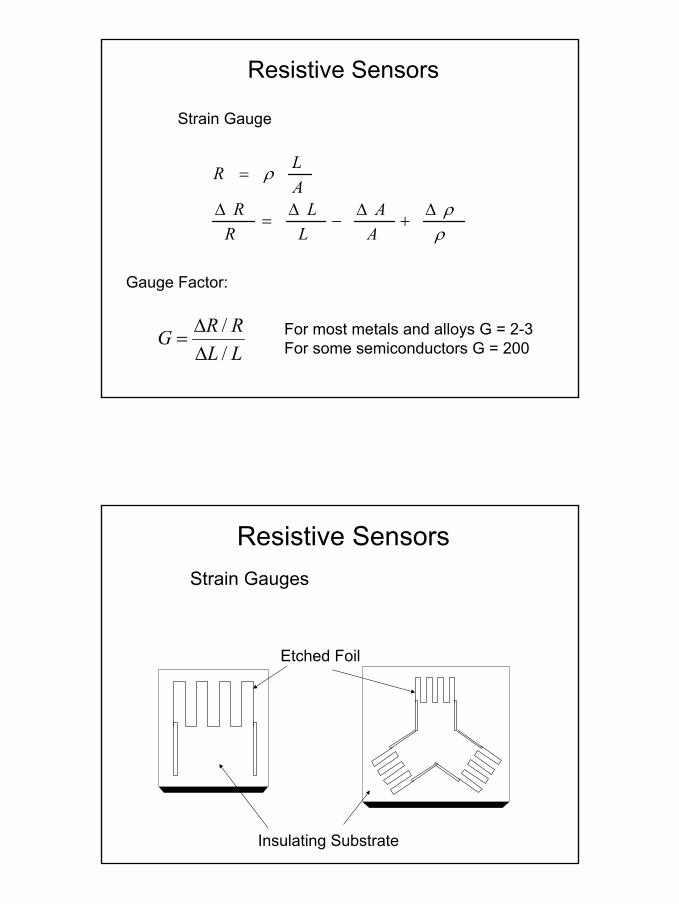
Resistive Sensors
Potentiometers
Translational
To measurement circuit
To measurement circu
Rotational
3
Resistive Sensors
Gauge Factor:
ρρ
ρ
∆+
∆−
∆=
∆
=
AA
LL
RR
ALR
Strain Gauge
LLRRG
//
∆∆
= For most metals and alloys G = 2-3 For some semiconductors G = 200
Resistive SensorsStrain Gauges
Insulating Substrate
Etched Foil

4
Measurement Circuits
R
R
R
R
V
Strain Gauge Measurement
ForceTransducer (R+δR)
R
R
R
R+δR
V

5
Strain Gauge Measurement
Force(R+δR)
R R
R+δR
V
(R-δR)
Tension
Compression R-δR
Twice the sensitivity
Inductive Sensors
µGnL 2=
n = number of turns of the coilG = geometric form factorµ = effective permeability of the medium

6
Inductive SensorsLinear Variable Differential Transformer (LVDT)
• Used in pressure, displacement and force measurements• Much higher sensitivity than for strain gauges but the processing apparatus is more complex. • Primary coil wound around a sliding metal core with a secondary winding around the two ends of the core. As the core is displaced the voltage induced in the secondary winding changes such that the output voltage increases as the core moves to each side of the centre position and the phase changes by 180 degrees as it passes through the centre. • A phase sensitive detector is required to convert the signal into a displacement..
Inductive SensorsLinear Variable Differential Transformer (LVDT)

7
Capacitive Sensors
xAC rεε 0=
ε0: dielectric constant of free spaceεr: relative dielectric constant of insulator (1 in air)
A
x
Capacitive Sensors
• Compliant plastics placed between foil layers to form capacitive mats placed under beds• Used to measure respiratory movements from the lungs and ballistographic movement from the heart• Layers of mica insulators sandwiched between corrugated metal layers• Used to measure pressure between foot and shoe

8
Piezoelectric Sensors
• Some crystals generate voltage when mechanically strained and vice versa
• q=kf where k is the piezoelectric constant• k = 2.3 pC/N for quartz and 140 pC/N for barium
Piezoelectric Sensors
9
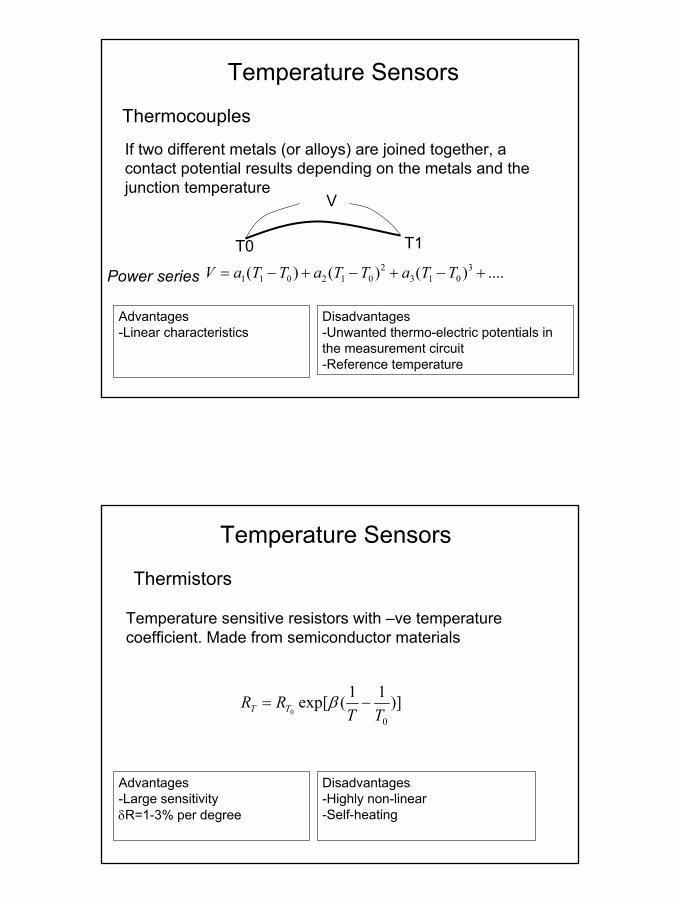
Temperature Sensors
Thermocouples
If two different metals (or alloys) are joined together, a contact potential results depending on the metals and the junction temperature
T0 T1
V
....)()()( 3013
2012011 +−+−+−= TTaTTaTTaVPower series
Advantages-Linear characteristics
Disadvantages-Unwanted thermo-electric potentials in the measurement circuit-Reference temperature
Temperature Sensors
Thermistors
Temperature sensitive resistors with –ve temperature coefficient. Made from semiconductor materials
)]11(exp[0
0 TTRR TT −= β
Advantages-Large sensitivityδR=1-3% per degree
Disadvantages-Highly non-linear-Self-heating
10
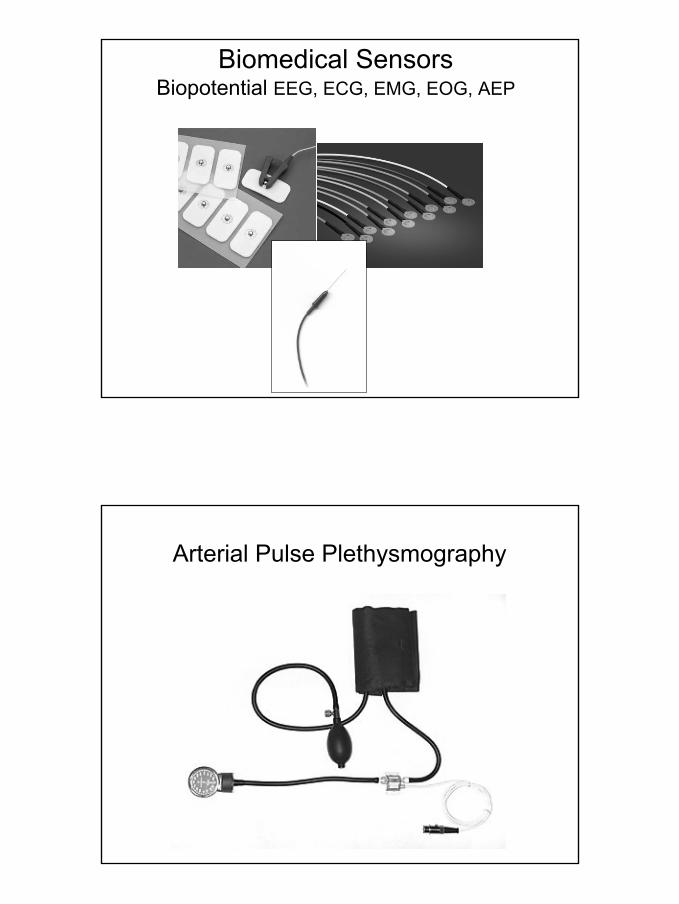
Biomedical SensorsBiopotential EEG, ECG, EMG, EOG, AEP
Arterial Pulse Plethysmography

11
Biomedical SensorsBlood Flow
Biomedical SensorsVentilation Measurement

12
Physiological Measurement System
Signal Conditioning(Filtering, Modulation, etc.) ADC
Display
Transducer Amplifier
Amplifiers
If a signal of 1 mV is to be measured, and we need signal-to-noise ratio of 60 dB (1000:1), then the output voltage when the two input terminals are joined together must be < 1mV/1000 = 1uVRi must be >> Rs. Typically Ri 1-10MΩ
Rs
Ri
13
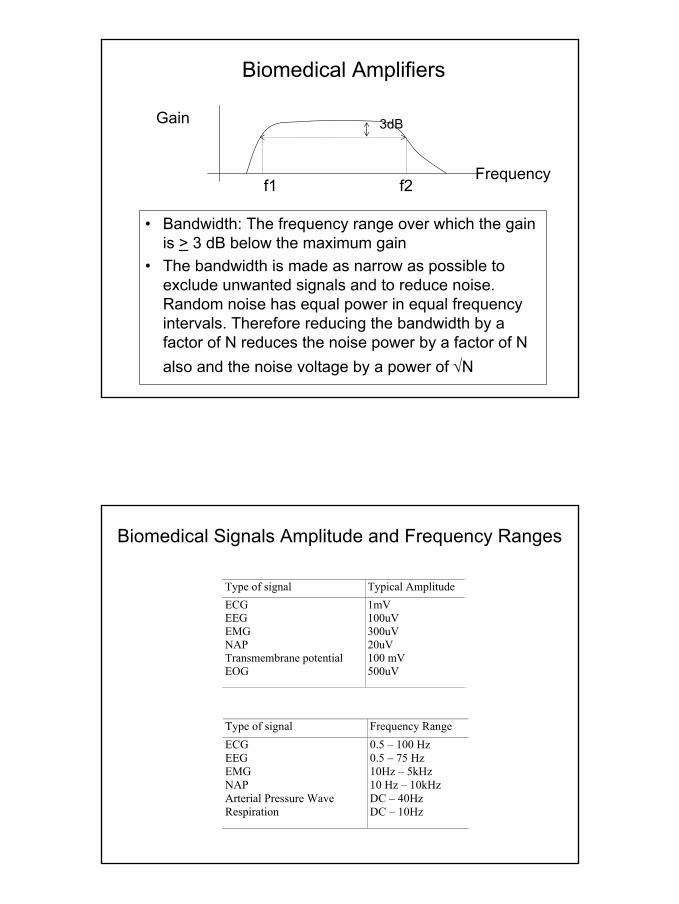
Biomedical Amplifiers
• Bandwidth: The frequency range over which the gain is > 3 dB below the maximum gain
• The bandwidth is made as narrow as possible to exclude unwanted signals and to reduce noise. Random noise has equal power in equal frequency intervals. Therefore reducing the bandwidth by a factor of N reduces the noise power by a factor of N also and the noise voltage by a power of √N
Gain
Frequencyf1 f2
3dB
Biomedical Signals Amplitude and Frequency Ranges
Type of signal Typical Amplitude ECG EEG EMG NAP Transmembrane potential EOG
1mV 100uV 300uV 20uV 100 mV 500uV
Type of signal Frequency Range ECG EEG EMG NAP Arterial Pressure Wave Respiration
0.5 – 100 Hz 0.5 – 75 Hz 10Hz – 5kHz 10 Hz – 10kHz DC – 40Hz DC – 10Hz

14
Physiological Measurement System
Signal Conditioning(Filtering, Modulation, etc.) ADC
Display
Transducer Amplifier
Filters - Passive
Vi Vo
R
C
Vo/Vi
FrequencyFc
High Pass
Vi VoR
C
Low Pass
Vo/Vi
FrequencyFc
15
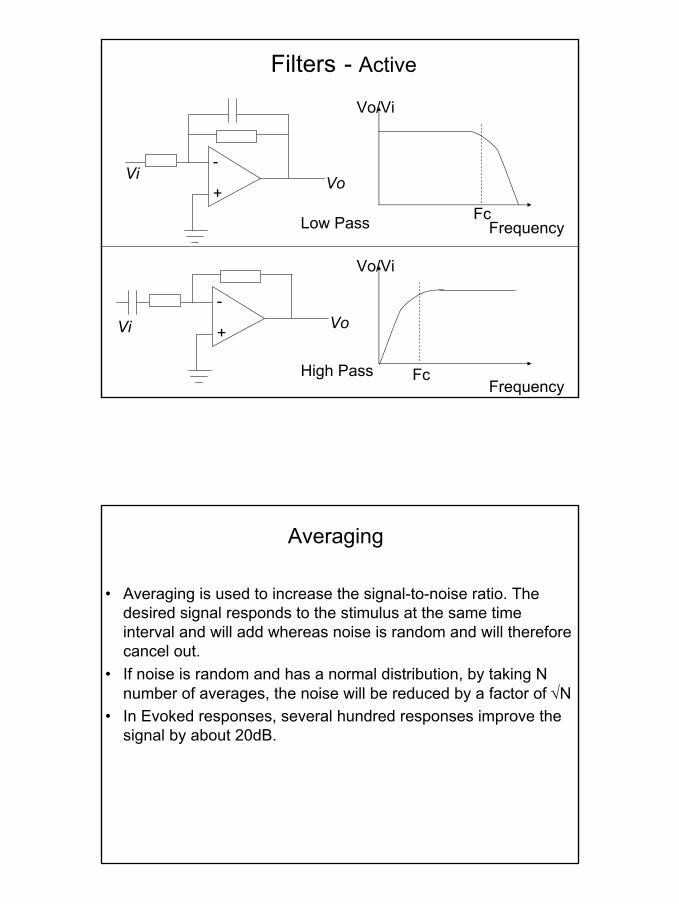
Filters - Active
-
+Vi Vo
Vo/Vi
FrequencyFcLow Pass
-
+Vi Vo
High Pass
Vo/Vi
FrequencyFc
Averaging
• Averaging is used to increase the signal-to-noise ratio. The desired signal responds to the stimulus at the same time interval and will add whereas noise is random and will thereforecancel out.
• If noise is random and has a normal distribution, by taking N number of averages, the noise will be reduced by a factor of √N
• In Evoked responses, several hundred responses improve the signal by about 20dB.

16
Physiological Measurement System
Signal Conditioning(Filtering, Modulation, etc.) ADC
Display
Transducer Amplifier
Function Signal Min Sampling Rate
Optimal Sampling Rate
Digital Resolution
Neurophysiology EEG EOG EMG
100Hz 100Hz 100Hz
200Hz 200Hz 200Hz
0.5uV/Bit 0.5uV/Bit 0.2uV/Bit
Respiratory
Oral-Nasal Airflow Resp Movement Oesoph Pressure SaO2 TcpO2/CO2
Breathing Sounds
16Hz 16Hz 16Hz 0.5Hz 0.5Hz 1Hz
25Hz 25Hz 100Hz 1Hz 1Hz 5000Hz
n.a. n.a. 0.5mmHg/Bit 1%/Bit 0.1mmHg/Bit n.a.
Cardiovascular ECG Heart Rate Blood Pressure
100Hz 1Hz 50Hz
250Hz 4Hz 100Hz
10uV/Bit 1bpm/Bit 1mmHg/ Bit
Auxiliary Body Temp Body Position
0.1Hz 0.1Hz
1Hz 1Hz
0.1oC/Bit n.a.
Digital Monitoring

17
Digital Resolution
Resolution = 2n - n is the number of bits
5169
6553616
409612
102410
2568
ResolutionBits
Example
How many bits do you need to digitise the following signals?Clue: n bits produce 2n discrete steps
1) Body temperature in the range 10 - 50oC
2) ECG in the range 0 – 2mV
18
Physiological Measurement System
Signal Conditioning(Filtering, Modulation, etc.) ADC
Display
Transducer Amplifier
19
Displays
• Fundamentals• Considerations• Types of Displays
– LCD– CRT– Plasma– LED
Fundamentals of Light Measurement
• Luminous Flux: Rate at which light energy is emitted. Expressed in lumens (lm)
• Illumination: Luminous flux per unit area. Expressed in Lux (lx)
• Luminance: Brightness. Amount of light emitted by or reflected from a surface. Expressed in candela/m2 (cd/m2)
• Reflectance: Ratio of amount of light striking a surface to amount leaving it. Unitless.
• High reflectance (Glare) reduces visual performance

20
Display Performance Considerations
• Resolution: Smallest resolvable object• Sharpness: Ratio of blurred border zone of letters
to their stroke width• Contrast: Measure of luminance difference
between an object and its background• Flicker: Detectable changes in display luminance• Critical Flicker fusion Frequency (CFF): Minimum
frequency at which flicker occurs, depends on luminance level
Considerations on Choosing a Display
• Environment: Sunlight, night• Application: Alphanumeric, video images,
graphics, combination• Task Scenario: Portability, handheld, group
viewing• System Characteristics: Weight, volume,
power, cost, etc.
21
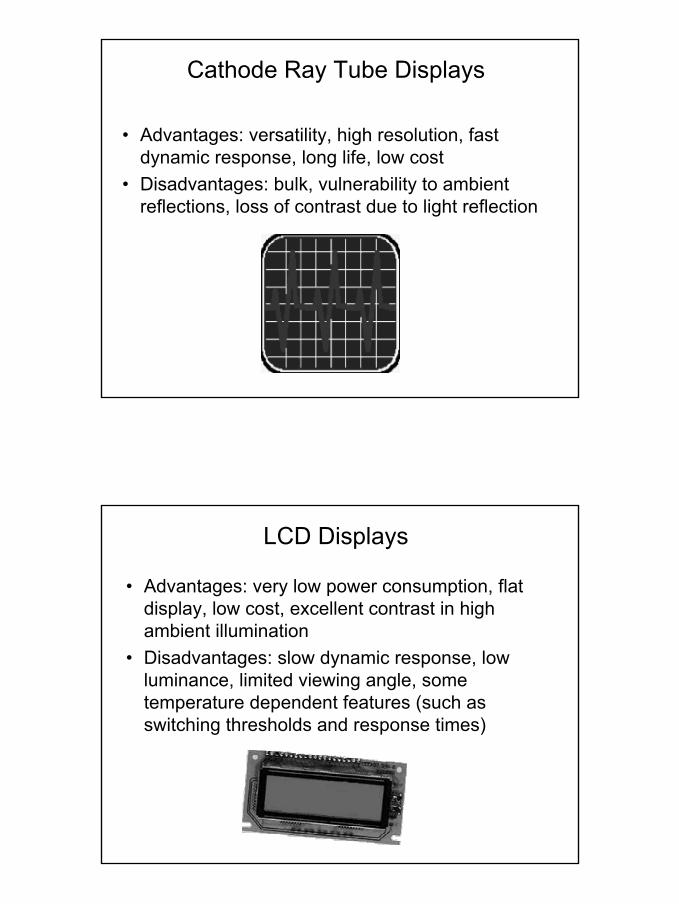
Cathode Ray Tube Displays
• Advantages: versatility, high resolution, fast dynamic response, long life, low cost
• Disadvantages: bulk, vulnerability to ambient reflections, loss of contrast due to light reflection
LCD Displays
• Advantages: very low power consumption, flat display, low cost, excellent contrast in high ambient illumination
• Disadvantages: slow dynamic response, low luminance, limited viewing angle, some temperature dependent features (such as switching thresholds and response times)

22
Plasma Displays
• Advantages: enhanced memory capability, brightness, luminous efficiency, no need for continuous refresh signals, excellent contrast ratios in high ambient illumination, long life, robustness
• Disadvantages: high cost, high power consumption
LED Displays
• Advantages: reliability, individual elements can degrade without affecting overall performance, robustness, better viewing angle than LCD, excellent brightness in sunlight
• Disadvantages: high cost, high power consumption, element cross-talk, colour range restriction

23
Capnography
Measures:End Tidal CO2 (EtCO2)Respiratory Rate
Pulse Plethysmography
Measures:Oxygen Saturation (SaO2)Heart Rate

24
Periodic Breathing
Airway Obstruction

25
Pressure Monitoring
Pressure Monitoring
Arterial Pressure Central Venous Pressure Pulmonary Arterial Pressure
The main regulatory mechanism of the cardiovascular system
An estimate of the filling characteristics of the right ventricle
An indication of left ventricular failure

26
Arterial Pressure Transducer System
Arterial Pressure Monitoring
HR
COResistance and Compliance
MyocardialContractility

27
Variables measured from BP waveform
• Cardiac output (CO): Ability of the heart to deliver blood to peripheral metabolic sites.
• Left ventricular end-diastolic pressure (LVEDP): Amount of blood in the heart before contraction begins.
• Heart rate (HR): Contraction frequency.• Myocardial contractility: The effectiveness (force) of
the heart’s contraction under a given preload.
EEG Signals
Time
Amplitude
CH1
CH2
28
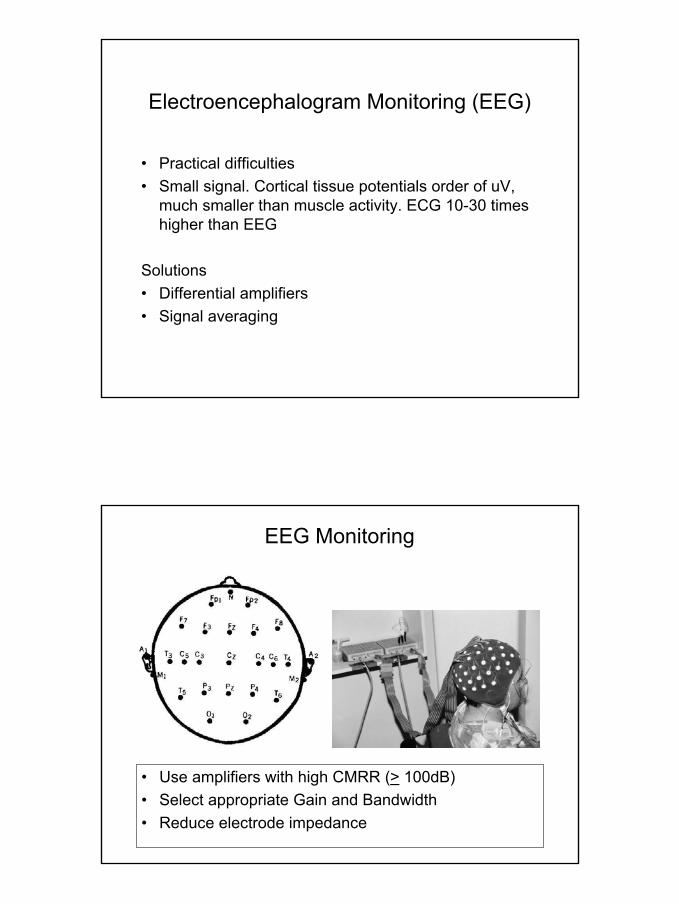
Electroencephalogram Monitoring (EEG)
• Practical difficulties• Small signal. Cortical tissue potentials order of uV,
much smaller than muscle activity. ECG 10-30 times higher than EEG
Solutions• Differential amplifiers• Signal averaging
• Use amplifiers with high CMRR (> 100dB)• Select appropriate Gain and Bandwidth• Reduce electrode impedance
EEG Monitoring

29
EEG Activity in Adults
• Normal activity: 8-13 Hz, 10-25 uV - alpha• Sensory stimulation: 10-20 Hz, 5-15uV - beta• Hyperventilation: 4-8Hz, 10-25 uV - theta• Hypoxia / ischemia: < 5Hz, 5-50uV - delta
EEG Signals in 3D

30
EEG Parameters
• Absolute δ power (power in the d frequency range)• Absolute θ power (power in the q frequency range)• Absolute α power (power in the a frequency range)• Absolute β power (power in the b frequency range)• Total power (absolute total power in the frequency range 0.5 –
30 Hz)• Spectral edge frequency SEF (frequency in which 95% of the
total power lies below it)• Median frequency MEDFREQ (frequency in which 50% of the
total power lies either side of it)
Clinical Assessment During Anaesthesia• Eye Signs (pupil size, eye movement)
Eye movement of no value with nitrous narcotic because pupils are small. Good indicator during induction but disappears when anaesthesia is achieved and may not return when decreased
• Blood PressurePossibly best indicator, however, surgery increases blood pressure, some requires lowering it eg cardiac diseases
• Pulse Rate and Heart RhythmPulse rate varies with blood pressure. Arrhythmia is more likely with halothane and less likely with ether-containing anaesthetic
• SweatingDue to increase sympathetic tone
• RespirationAll anaesthetics can depress respiration leading to apnoea. A good sign but not always available due to need to control respiration. Intercostalactivity diminish, abdomen expands and chest retracts. Watch out for airway obstruction
• Muscle Relaxation

31
Instruments to Aid Monitoring of Anaesthesia
• Oxygen Analysers– Paramagnetic: O2 attracted to magnetic field, displaces N2
filled ball in a chamber inside a magnetic field– Electrochemical: O2 binds with electrons. Number of
electrons (current) proportional to O2 concentration– Thermal: different gases have different heat conductivity.
Non specific.• Inhaled Anaesthetic Analyser
– Infra red expensive, requires calibration, N2O effects– Mass spectrometer: expensive, rapid– Chromatograph: cheap, slow, requires calibration– Quartz: sensitive, rapid, cheap, affected by N2O, water
vapour and CO2• N2O Analysers• EEG
Monitoring During Anaesthesia
Apnoea Minute Ventilation
Gas Exchange
Airway Mechanics
Cardiovascular Function
Muscle Blockade
Temp
Transthoracic Impedance, Chest / Abdomen Movement Air Flow
Spirometery
SaO2 TcpCO2 ETCO2
Dynamic Compliance Stethoscope
Cardiac Output EMG Thermistor Thermocouple

32
• Scared, tried to move but found it impossible• Heard someone say “he is awake”• Tried to get attention but was unable to move and talk• Felt pain in throat and like he was suffocating• Heard someone ask “can I cut here?” Felt manipulation but no
pain• Felt incision• Sharp pain and sense of darkness• Saw people dressed in green, saw tombstones. Thought she
was attending her own funeral. Heard voices speak slowly. Anxiety gradually disappeared after 3 weeks
Experiences of Awareness in the literatureAwareness in anaesthesia: a prospective study (2000)
R.H. Sandin et al. Lancet, 335:707-711
Monitoring Depth of Anaesthesia

33
Cerebral Monitoring
• EEG– Median frequency, spectral edge
frequency, power analysis α − β − θ − δ• Bispectral Index (BIS)
– empirical, statistically derived measurement based on a large database of EEG records
• Auditory Evoked Potential – Mid-latency response to auditory stimulus
Bispectral (BIS) Index

34
Auditory Evoked Potential
Subjective Measure
Observer Assessment of Alertness/Sedation Score (OAAS):
5 – Awake4- Slow response to questions and slurred speech3- Responds to commands2- Responds to command only after several attempts
and mild prodding1- Does not respond to commands or shaking

35
Recommended Reading• Medical Physics and Biomedical Engineering, Brown BH,
Smallwood RH, Barber DC, Lawford PV, Hose DR, ISBN 0-7503-0368-9
• Medical Instrumentation, Webster JG, ISBN 0-471-15368-0• The Measurement, Instrumentation and Sensors Handbook,
Webster JG, ISBN 0-8493-8347-1• Digital Signal Processing : a Practical Approach, Ifeachor
EC, Jervis BW ISBN 0-2015-4413-x • Introductory Digital Signal Processing, Lynn P, Feurst W,
ISBN 0-471-91564-5• The Art of Electronics, Horowitz P, Hill W, ISBN 0-521-
37095-7• Monitoring in anesthesia, L. J. Saidman, N. T. Smith; ISBN
0409950726
Example
How many bits do you need to digitise the following signals?Clue: n bits produce 2n discrete steps
1) Body temperature in the range 10 - 50oCA) Resolution = (50 – 10) / 0.1 = 400.
We therefore need 9 bits (512)
2) ECG in the range 0 – 2mVA) Resolution = (2 – 0) / 0.01 = 200.
We therefore need 8 bits (256)


