Monitoring forest biomass: an overview - Laboratorium … · 2016-05-20 · Monitoring forest...
38
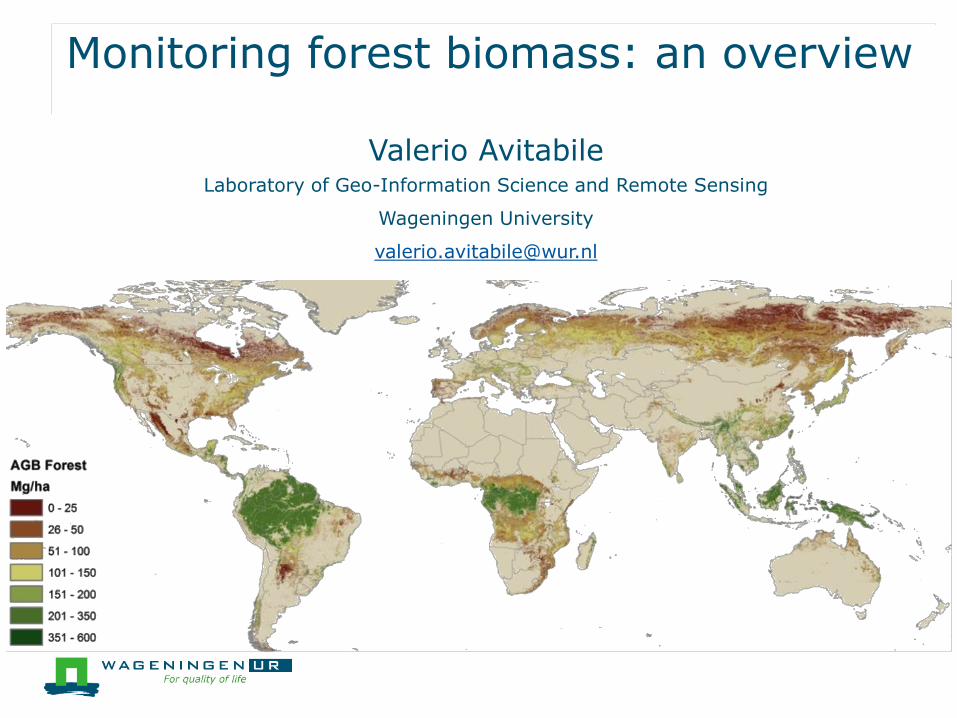
Monitoring forest biomass: an overview Valerio Avitabile Laboratory of Geo-Information Science and Remote Sensing Wageningen University [email protected]
Transcript of Monitoring forest biomass: an overview - Laboratorium … · 2016-05-20 · Monitoring forest...
Monitoring forest biomass: an overview
Valerio Avitabile Laboratory of Geo-Information Science and Remote Sensing
Wageningen University

Overview
Introduction
● What is Biomass
● Why is important
● How to quantify biomass
Monitoring systems
● Concepts
● Examples
Biomass mapping
● Current status
● A data integration approach
● Future directions

Introduction
3
• What is Biomass • Why is important • How to quantify biomass

What is (forest) biomass
Biomass: mass of organic material of vegetation measured as dry weight
Biomass density: tons/ha
Biomass pools

Biomass... Why Biomass?
Carbon = ~50% Biomass
Carbon cycle component - Global
Climate change (REDD+) - National
Natural resource - National
Ecosystem service – Sub-national

How to quantify biomass
In-situ destructive measurements
In-situ estimations (non-destructive)
Estimation from proxy (e.g., satellite images)
Models (e.g., forest growth)
6

In-situ destructive measurements
Measuring biomass:
● Cut
● Dry
● Weigh

In-situ estimation
Estimate biomass from tree parameters using allometric equations
● Biomass = f (Diameter, wood density, height)
● Biomass = Volume · wood density
FAO (1997), Forestry paper 134

Approaches to quantify biomass
1. Field Plots only
-> Statistics (non-spatial)
E.g. Forest 1: 200 T/ha,
Forest 2: 130 T/ha, etc.
2. Field Plots + Landscape map
-> spatial distribution (by class)
3. Field plots + Satellite images
-> spatial distribution (continuous)

Limitations
1. Thematic:
Few classes =High Variability
2. Spatial:
Mixed unit (MMU)
Landscape map approach
Mean Biomass x LC Class
0,00
50,00
100,00
150,00
200,00
250,00
3 4 5 6 7 9
CVs ≥ 100%

Satellite data
+
Land Cover
+
Ancillary info
High resolution
Quantitative input (DNs)
Regression model
Continuous estimates
Remote sensing approach
Fully exploit the spectral information
Landscape map approach Remote sensing approach
80 T/ha
200 T/ha
40 T/ha

Remote sensing of biomass
Existing remote sensing sensor do not measure biomass
Estimate biomass from RS signal using empirical models calibrated with ground data
Sensors:
● Optical (canopy properties)
● Lidar (vertical structure)
● Radar (canopy and structure) National
Local
Scale of monitoring
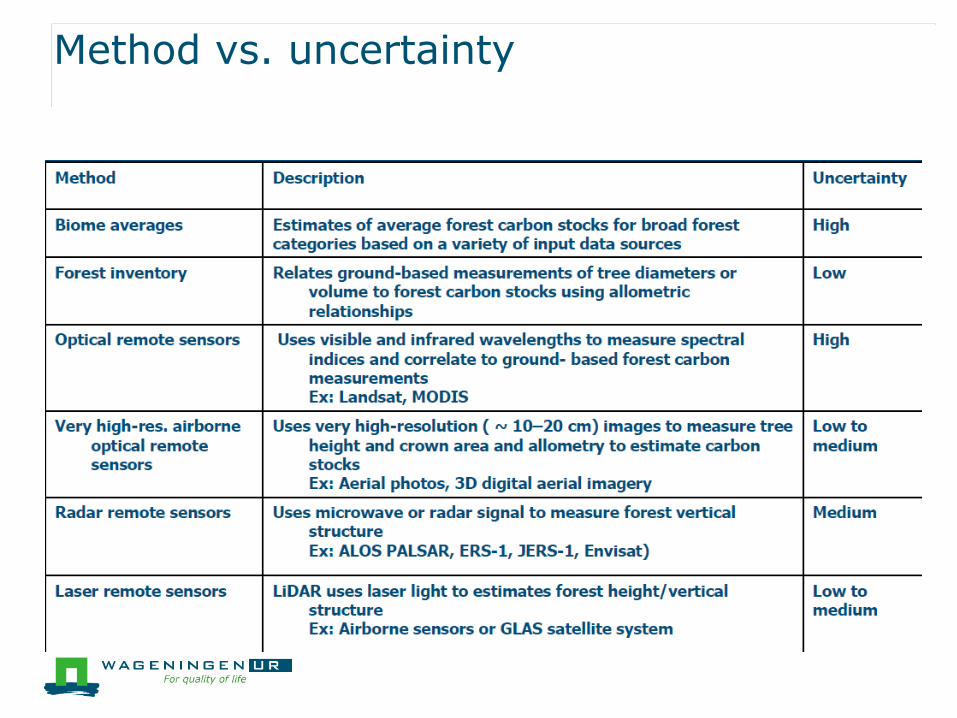
Method vs. uncertainty

Monitoring systems
● Concepts & examples
Monitoring systems
Biomass-related examples on:
Data: Acquisition strategy
Model: Estimate parameter
Validation: Assess accuracy
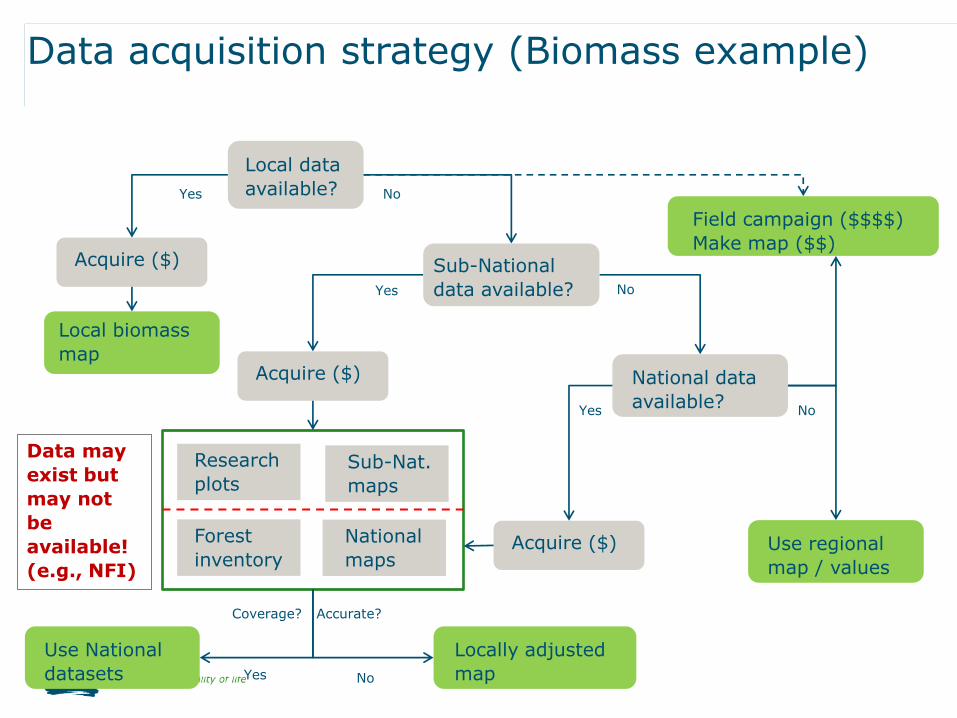
Data acquisition strategy (Biomass example)
Field campaign ($$$$)
Make map ($$)
Acquire ($)
Yes No
National data
available?
Acquire ($)
Yes No
Use regional
map / values
Research
plots Sub-Nat.
maps
Forest
inventory
National
maps
Locally adjusted
map
Local data
available?
Acquire ($)
Yes No
Sub-National
data available?
Local biomass
map
Use National
datasets Yes
Coverage? Accurate?
No
Data may
exist but
may not
be
available!
(e.g., NFI)

Integrated monitoring system (carbon emissions)
Local Ranger Data Remote sensing
time series Land cover change
Forest inventory
data
Biomass mapping
Measuring, Reporting & Verification Kafa UNESCO Biosphere reserve, Ethiopia
Credit: Ben DeVries & Arun Pratihast (WU)
C stocks and changes
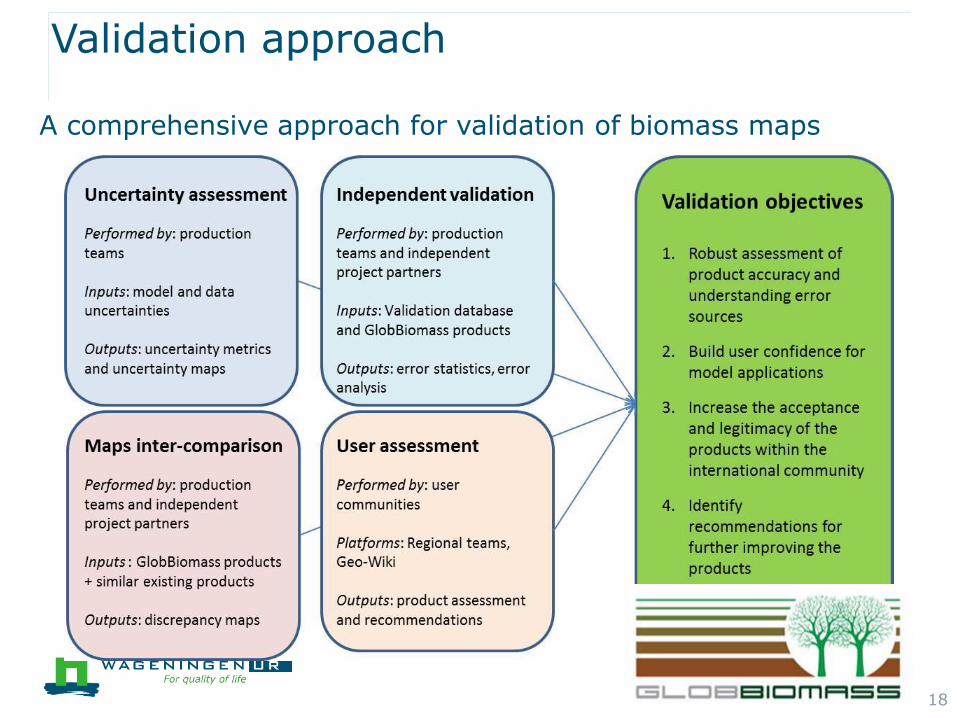
Validation approach
18
A comprehensive approach for validation of biomass maps

Monitoring systems
● Examples
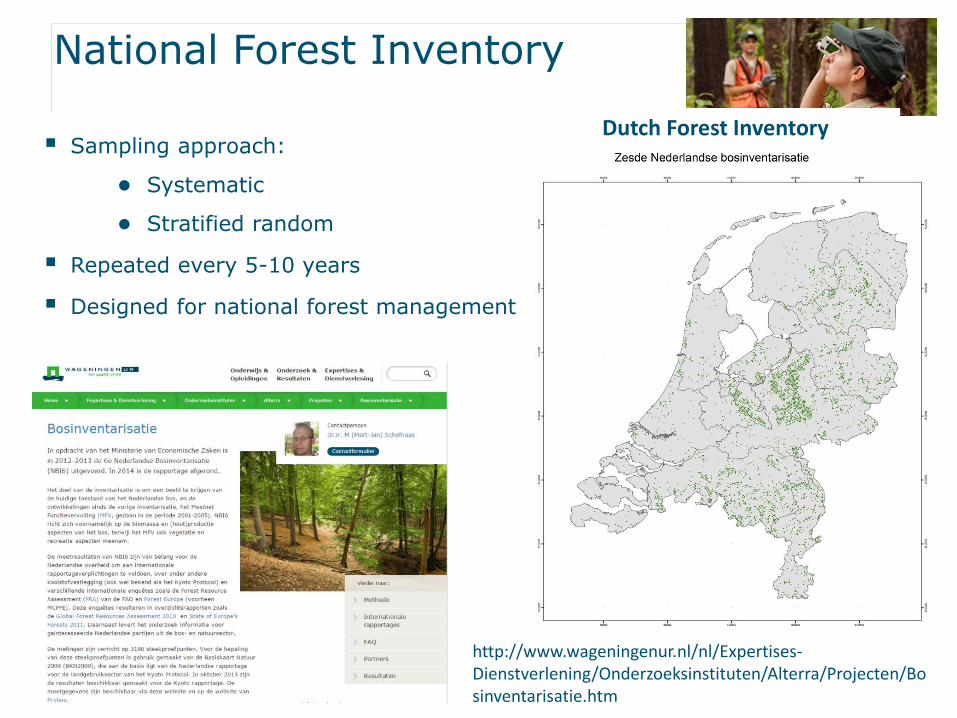
Sampling approach:
● Systematic
● Stratified random
Repeated every 5-10 years
Designed for national forest management
http://www.wageningenur.nl/nl/Expertises-Dienstverlening/Onderzoeksinstituten/Alterra/Projecten/Bosinventarisatie.htm
National Forest Inventory
Dutch Forest Inventory

Forest monitoring system: Brazil
PRODES – Amazon Deforestation
Monitoring Project (Annual)
DETER – Near real-time Deforestation
Detection with MODIS (Support for Law
Enforcement for Deforestation Control)
DEGRAD – Amazon Degradation
Monitoring Project
DETEX - Selective logging activities http://www.dpi.inpe.br/prodesdigital/prodes.php

Forest monitoring system: Global
http://www.globalforestwatch.org/

Monitoring tropical biomass
23
• Current status • A data integration approach • Future directions

• Biome average (Tier 1): IPCC Default Biomass values
high uncertainty = low carbon credits
• Pan-tropical biomass maps (Tier 1 – 2)
based on optical images (MODIS) and Lidar (GLAS) data
+ Include forest height and use consistent methodology
- Use continental allometric equations may introduce bias locally?
Status of forest biomass mapping
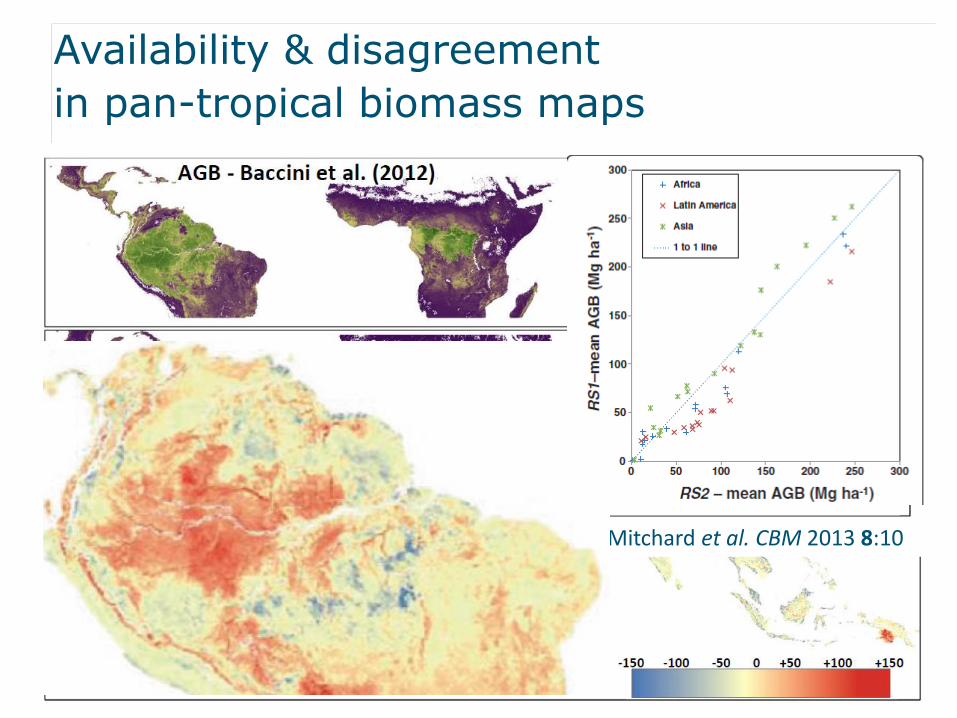
Availability & disagreement
in pan-tropical biomass maps
Mitchard et al. CBM 2013 8:10

Further disagreement: Maps vs. Plots!
The reply:
“Seeing the forest beyond the trees” (Saatchi et al., 2014):
- The fallacy of Ground Truth
- Are the primary data from Mitchard et al. (2014) superior because they are closer
to the trees? No
Baccini Saatchi From ground data
Mitchard et al., 2014

A new reference dataset
Reference data: field plots & high-res. biomass maps
Quality criteria:
1. Reliability: metadata complete, good accuracy & methodology
2. C pool: Aboveground biomass, DBH > 10 cm
3. Acquisition: after year 2000
4. Min. Resolution/Area: Maps: ≤ 100 m ; Plots: > 0.1 ha

Reference plots
X √
1. Pre-Screening Metadata analysis
2. Upscaling Visual analysis with Google Earth
3. Aggregation Average Biomass @ 1Km
Available Selected Aggregated
Plots Plots Pixels
6525 4213 1204
-35% -71%

A data integration approach
Concept:
Use independent reference data to combine regional maps
Approach:
Bias removal and Weighted average
by strata
● Weights from the error covariance of input maps
● Strata representing error patterns of input maps
Aim:
reduced bias at regional scale

A new pantropical biomass map
30
An integrated pan-tropical biomass maps using multiple reference datasets Global Change Biology (2016)
Avitabile V., Herold M., Heuvelink G.B.M., Lewis S.L., Phillips O.L., Asner G.P., Armston J., Asthon P., Banin L.F., Bayol N., Berry N., Boeckx P., de Jong B., DeVries B., Girardin C., Kearsley E., Lindsell J.A., Lopez-Gonzalez G., Lucas R., Malhi Y., Morel A., Mitchard E., Nagy L., Qie L, Quinones M., Ryan
C.M., Slik F., Sunderland, T., Vaglio Laurin G., Valentini R., Verbeeck H., Wijaya A., Willcock S.
Map and reference data online at: www.wageningenur.nl/grsbiomass
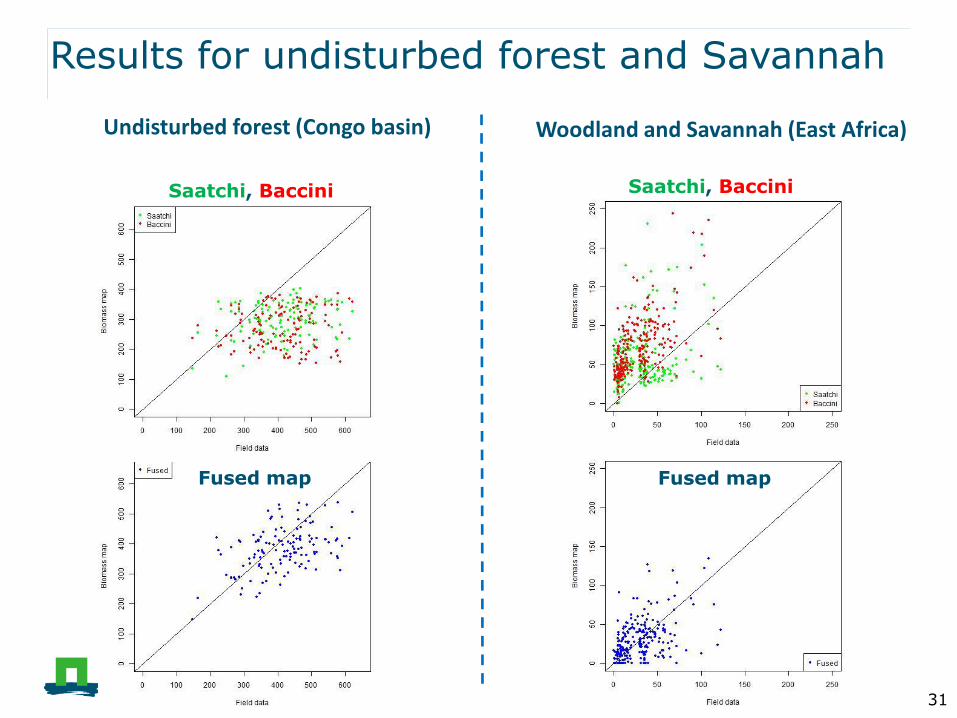
Results for undisturbed forest and Savannah
31
Undisturbed forest (Congo basin)
Woodland and Savannah (East Africa)
Saatchi, Baccini
Fused map
Saatchi, Baccini
Fused map

Monitoring tropical biomass
32
• Current and future directions

Towards a global biomass reference dataset
~ 15,000 plots in the tropics
~ 100,000 plots in Europe
14 reference biomass maps
33

Strategy for biomass reference data
1. Best use of available biomass data
2. Acquire new data
● Acquire data in under-represented areas
● Sampling design tailored to upscaling to coarser res.
3. Improve quality of reference data
● Improved allometry
● Potential of Terrestrial Laser Scanning (TLS)
34

New datasets - Global
Baccini et al. (2016): pantropical, 30m (Landsat + GLAS)
Saatchi et al. (in review): global, 100m (Landsat + GLAS +
wood density + ...?)
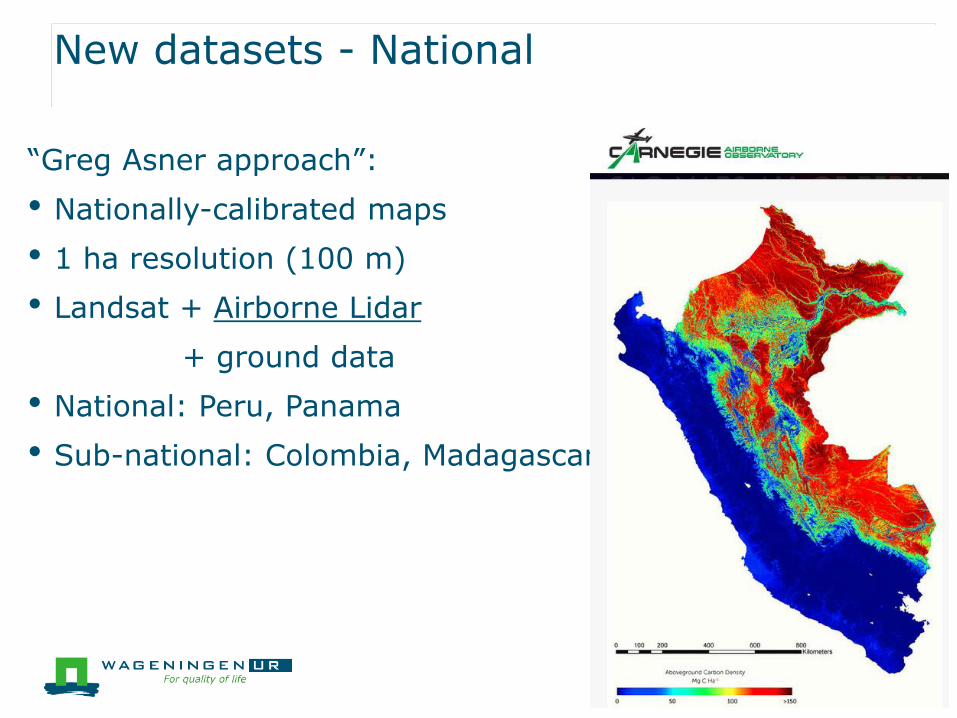
New datasets - National
“Greg Asner approach”:
• Nationally-calibrated maps
• 1 ha resolution (100 m)
• Landsat + Airborne Lidar
+ ground data
• National: Peru, Panama
• Sub-national: Colombia, Madagascar

Future directions
NASA GEDI
● GEDI: Global Ecosystem Dynamics Investigation
● Sampling Lidar on the ISS, @25 footprint
● Measure canopy height and vertical structure
● Estimate biomass and biomass change (+Landsat)
● Launch: 2018
ESA BIOMASS mission
● P-band SAR
● Biomass and height @200m
● “Globally” (ok, not really..)
● 3D by tomography
● Launch: 2020
37

Rationale of the BIOMASS monitoring system
1.Why & where: The crucial information need is in the tropics
● deforestation (~95% of the Land Use Change flux)
● regrowth (~50% of the global biomass sink)
2.Scale: Biomass measurements are needed where the changes occur
and at the effective scale of change: 4 hectares
3.Accuracy: A biomass accuracy of 20% at 4 hectares, comparable to
ground-based observations
4.Complementary information:
● Measure forest height to further constraint biomass estimates
● Detect deforestation at 0.25 ha (Biomass change)
5.Monitoring strategy: Repeated measurements over multiple years to
identify deforestation and growth