Monitoring & Evaluation Guidelines - PARK database & Evaluation Guidelines Choosing Methods and...
31
Monitoring & Evaluation Guidelines Choosing Methods and Tools for Data Collection United Nations World Food Programme Office of Evaluation • What are the Sources and Uses of Primary and Secondary Data 5 • How to assess the Secondary Data to be used 7 • Categories of Primary Data Collection Methods 9 • Sampling 13 • Characteristics, Strengths and Weaknesses of Sample Surveys 16 • What are the Key Techniques used in Qualitative Methods? 19 • Rapid versus Participatory Qualitative Methods: What are They and when should They be used? 21 • Qualitative Methods: Individual Interviews versus Group Interviews 23 • Qualitative Methods: Tools for Stimulating Dialogue and Participation 26 • What is Direct Observation and when should It be used? 28
Transcript of Monitoring & Evaluation Guidelines - PARK database & Evaluation Guidelines Choosing Methods and...

Monitoring & Evaluation Guidelines
Choosing Methods and Tools forData Collection
United Nations World Food ProgrammeOffice of Evaluation
• What are the Sources and Uses ofPrimary and Secondary Data 5
• How to assess the Secondary Data to beused 7
• Categories of Primary Data CollectionMethods 9
• Sampling 13
• Characteristics, Strengths andWeaknesses of Sample Surveys 16
• What are the Key Techniques used inQualitative Methods? 19
• Rapid versus Participatory QualitativeMethods: What are They and whenshould They be used? 21
• Qualitative Methods: Individual Interviewsversus Group Interviews 23
• Qualitative Methods: Tools forStimulating Dialogue and Participation 26
• What is Direct Observation and whenshould It be used? 28

Choosing Methods and Tools for Data Collection
Overview
Introduction. The purpose of this module is to describe a number of data collectiontools and methods appropriate for monitoring and evaluation (M&E) data collection inWFP.
Why is this Module important?
Data collection is a key activity in the implementation of an M&E strategy, and it must becarefully planned to provide information that allows WFP managers to assess achievementsand changes connected to WFP operations. This module is important because it provides anoverview of quantitative and qualitative data collection tools and methods, describing theirstrengths and weaknesses, as well as when it is appropriate to use each of them.The difference between probability and non-probability sampling is explained, and guidance onthe appropriate use of both is provided. The module also describes a number of qualitative datacollection techniques, such as key informant interviews, focus group discussions andobservation. In addition, participatory and rapid rural data collection methods are introduced,and the usefulness of these methods vis-à-vis different kinds of WFP operations is outlined.The module gives staff with responsibility for M&E design a quick review of key methods andtools for data collection.
What does this Module aim to achieve?This module has the following objectives:
• Describe 2 broad categories of data – primary and secondary - and the appropriate use ofeach in providing information for use in the M&E of WFP operations.
• Describe the procedure for assessing the availability, relevance, appropriateness, reliabilityand replicability of secondary data.
• Describe the characteristics, strengths, weaknesses and possible uses of each of the 2broad categories of data collection methods – quantitative and qualitative.
• Explain what sampling is, and describe when to use probability and when to usenon-probability sampling.
• Define 2 broad categories of sample surveys, and analyse their strengths and weaknessesin order to help determine their appropriateness for a specific operation.
• Illustrate the key techniques used in qualitative methods.• Describe the characteristics of rapid and participatory qualitative methods, and demonstrate
how to select and combine the methods in the context of WFP operations.• Describe the main types of interviews used in qualitative methods – individual and group –
and, within these main types, distinguish among different interviewing techniques,highlighting the role of the interviewer in each.
• Describe some of the communication tools that are used to stimulate dialogue and enhanceparticipation during qualitative interviews and discussions.
• Describe direct observation and when and how it can be applied as a data collectiontechnique.
What should be reviewed before starting?• What is RBM Oriented M&E
Guidelines
2

• Identifying M&E Indicators• What is Beneficiary Contact Monitoring and how is It conducted• How to design a Results-Oriented M&E Strategy for EMOPs and PRROs• How to design a Results-Oriented M&E Strategy for Development Programmes• How to Plan an Evaluation• How to plan and undertake a Self-evaluation
Section Titles and Content Headings• What are the Sources and Uses of Primary and Secondary Data
• Introduction• What are the Differences between Primary and Secondary Data• Appropriate Uses of Primary and Secondary Data• An Example of using Secondary Data in Development• An Example of a Secondary Data Source for Emergency Operations (EMOPs)• An Error to avoid
• How to assess the Secondary Data to be used
• Introduction• Steps to follow to assess Secondary Data for use in Operations
• Categories of Primary Data Collection Methods
• Introduction• Characteristics of Quantitative and Qualitative Methods• When to use Quantitative or Qualitative Methods• An Example of collecting and analysing average Yearly Income Data using
Quantitative and Qualitative Methods• Examples of how Qualitative and Quantitative Methods can be used to complement
One Another
• Sampling
• Introduction• What is Sampling• What distinguishes Probability Sampling from Non-probability Sampling• Examples of Non-probability and Probability Sampling for a Baseline Survey• An Example of an Estimate from a Probability Sample
• Characteristics, Strengths and Weaknesses of Sample Surveys
• Introduction• What is a Sample Survey• 2 Categories of Sample Surveys: Probability Sample Surveys and Non-probability
Sample Surveys• Analysing the Strengths and Weaknesses of Sample Surveys prior to planning for
Them in an Operation• An Example of Questions asked in Quantitative Sample Surveys
• What are the Key Techniques used in Qualitative Methods?
• Introduction• 6 Key Techniques used in Qualitative Methods• An Example of mixing Techniques, Community Involvement and Triangulation of
School Attendance Data
• Rapid versus Participatory Qualitative Methods: What are They and when shouldThey be used?
• Introduction
Guidelines
3

• Characteristics of Participatory and Rapid Qualitative Methods• How to choose Rapid or Participatory Methods or a combination of both• The Rapid-Participatory Methods Continuum and how It can be applied to M&E
Tasks for Operations
• Qualitative Methods: Individual Interviews versus Group Interviews
• Introduction• What are the Main Interviewing Techniques used in Individual and Group Interviews
or Discussions• Examples of when a Group Discussion is more appropriate than Individual
Interviews
• Qualitative Methods: Tools for Stimulating Dialogue and Participation
• Introduction• Why are Participatory Communication Tools used• What are some of the Participatory Communication Tools and how can They be
used• Examples of using Participatory Communication Tools
• What is Direct Observation and when should It be used?
• Introduction• What is Direct Observation?• When and how to use Direct Observation• Examples of the use of Direct Observation Techniques when applying Qualitative
and Quantitative Methods
Guidelines
4

What are the Sources and Uses of Primary and Secondary Data
Introduction. This section describes 2 broad categories of data – primary andsecondary – and the appropriate use of each in providing information for use in the M&Eof WFP operations.
What are the Differences between Primary and Secondary Data
Data sources are listed in the third column of the logical framework matrix under the heading“means of verification”. While the indicator articulates what information will be collected, themeans of verification identifies where that information will come from.
Primary DataPrimary data is data that is collected through the use of surveys, meetings, focus group discus-sions, interviews or other methods that involve direct contact with the respondents – women,men, boys and girls.
Secondary DataBy contrast, secondary data is existing data that has been, or will be, collected by WFP or oth-ers for another purpose. Secondary data may include WFP Vulnerability Analysis and Mapping(VAM) data, data from the mid-term or final evaluation of a previous phase of WFP operations,data collected by other organisations or the government of the country concerned, or datagathered by research organisations. Routine data collected by institutions participating in anactivity (e.g. schools, health centres) are exceptionally good sources of secondary data whichcould not be replicated by primary data collection without prohibitive expense.
Distinction between Primary and Secondary DataThe critical distinction between the 2 types of data is that primary data is collected by WFP orsomeone who WFP has hired specifically for the purpose for which the data are required. Sec-ondary data have been, or will be, collected for another primary purpose (e.g. all secondarydata were or are primary data for another study), but may be used for “secondary” purposes re-lated to M&E in WFP operations. Note that both primary and secondary data sources can yieldquantitative or qualitative data.
Appropriate Uses of Primary and Secondary Data
The collection of M&E data, both primary and secondary, must focus almost exclusively on theindicators and assumptions identified at each level in the logical framework for the operation.
Secondary DataThe use of secondary data represents tremendous cost and time savings to the country office,and every effort should be made to establish what secondary data exist and to assess whetheror not they may be used for the M&E of WFP operations. Primary data is often collected unne-cessarily and at great expense simply because monitors or evaluators had not been aware thatthe data were already available. It is critical to invest the initial time and resources to investigatewhat data exist, what data collection exercises are planned for the future, and how relevant theexisting data are for the M&E of WFP operations.
Guidelines
5

Primary DataHowever, primary data collection is sometimes warranted. Although a review of secondary datasources should precede any primary data collection, existing data do not always provide the ap-propriate indicators or the appropriate disaggregation of indicators needed to monitor and eval-uate WFP operations effectively. Even secondary data that provides the appropriate indicatorsand disaggregation of indicators may not be useful if the data is out of date and the situation islikely to have changed since they were collected. This varies greatly according to the indicatorfor which the data is being collected and its volatility. For example, school enrolment data that is1 year old may suffice for establishing baseline conditions prior to a school feeding programme,but acute nutritional data (wasting) that is only a month old may no longer represent an accur-ate estimate of current conditions for that indicator.
Importance of Documenting Data Collection MethodsClear documentation of the methods to be used to collect primary and secondary data must bedeveloped during the planning stage of an operation. As data is collected, any variations fromthe planned data collection methods must also be documented. This ensures that data is collec-ted in the same way at different points in time and by different people. This is critical for ensur-ing that the data is comparable, and improves the accuracy of assessing the changes over timeassociated with a WFP operation.
An Example of using Secondary Data in Development
The most common practice is to use a combination of primary and secondary data to comple-ment each other. School feeding programmes will draw extensively on school records to meetM&E data needs. Although teachers keep records of attendance and enrolment primarily forpurposes other than reporting to WFP, this information fits well with the data needed by WFP inorder to assess the outcomes and impacts of a school feeding operation, and is therefore anideal secondary data source.
An Example of a Secondary Data Source for Emergency Operations(EMOPs)
During the early stages of an emergency, the data gathered by the emergency food needs as-sessment (EFNA) should satisfy most of the immediate criteria for baseline data. Efforts shouldfocus on ensuring that the data is reliable and representative. This exemplifies how data collec-ted for 1 purpose can be used to serve another in a cost-effective way. This is especially true inthe case of using assessment data for M&E purposes during EMOPs and PRROs.
An Error to avoid
A common error when using secondary data sources or collecting primary data is to collect toomany data. This results from data collectors’ tendency to collect all the data that is related totheir own topics of interest rather than focusing on the specific data that is required for M&E.This often leads to a reduced amount of time available for data analysis and, ultimately, dilutesthe value of the information produced.
Guidelines
6

How to assess the Secondary Data to be used
Introduction. This section describes the procedure to follow for assessing theavailability, relevance, appropriateness, reliability and replicability of secondary data.
Steps to follow to assess Secondary Data for use in Operations
An operation's logical framework articulates the specific indicators selected at the activity, out-put, outcome and impact levels used to monitor and evaluate the operation's implementationand results performance. Assumptions, at each level of the logical framework, are also trackedusing indicators. A cost-effective means of obtaining the required data related to the selected in-dicators is through the use of secondary data.The following table provides 4 steps to identify and assess potential secondary data and itssources.Step Procedure
Step 1
Identify and assess the relevancy of secondary data andsecondary sources.
Identify what secondary data is available and relevant to thespecific indicators listed in the operation’s logical frameworkor M&E Plan. Review existing WFP data (such as VAM dataand M&E data from a previous phase) and data that has beencollected for other uses. Also review existing data from gov-ernments and implementing partners as well as organisationsthat operate in the same geographic area as the WFP-as-sisted operation but that are not WFP's implementing part-ners.
Step 2:
Assess the appropriateness of relevant secondary data. Assess whether or not the existing data relevant to your indic-ators is appropriate.
• Does the secondary data cover the same geographicarea and units of study that you desire? If no, is thegeographic area larger than your study area or smallerand how might this affect the estimates for your indicat-ors of interest (does it make the data unusable)?
• When was the data collected, does the data sufficientlyrepresent the point or period in time required, and howmight the situation be different now? (For volatile indic-ators, such as acute nutritional status, data that is morethan 3 months old is unlikely to be suitable.)
Step 3:
Guidelines
7

Step Procedure
Check the reliability of the secondary data and datasource.
Once secondary data has been deemed available, relevantand appropriate (Steps 1&2), the reliability of the data mustalso be assessed. Be wary of data for which sampling andmethodologies used are not described.
• How reputable is the organisation, agency, or govern-ment department that collected the data? Are their res-ults generally accepted by others in the country and aretheir results (from this and other surveys) consistentwith the findings of others?
• What quantitative and qualitative methods were used tocollect the data?
• Is there a description of measures used during thestudy to supervise the quality of the data collected aswell as validation tools (triangulation, supervision offieldwork, data cleaning)?
• Is the questionnaire available to assist in reviewing thedata and are clear definitions provided for terms withvariable meanings (e.g. households, family size, etc.)
• How large was the sample and how was it chosen?
• To what larger population does the sample purport torepresent (what is the sampling frame)?
• How was the analysis conducted (statistical methods,other analytic methods)?
• Is the raw data (pre-analysis data) available, and if so isthe analysis reproducible with the same or similar result(assess by testing a few variables/indicators)?
• Are the questions or topics in the questionnaire/discus-sion checklist consistent with the variables presented inthe analysis?
Step 4:
Check the replicability of secondary data for follow-upstudy and monitoring.
If you decide to use the data, then the ease with which it maybe replicated through monitoring or a follow-up evaluationstudy must also be assessed.
• Will the persons responsible for collecting the data ori-ginally (e.g. the primary data collectors) conduct a sub-sequent study for the same indicators at some time inthe future or was it a 1 time, cross-sectional study? Ifthere will be a follow-up, when will the follow-up be con-ducted in relation to WFP's operation timeline/cycle?Can it be used to assess mid-term or final results ofWFP's operation?
• If no follow-up is planned, are the methods and tech-niques used sufficiently described and replicable byWFP such that the secondary data can be comparableto primary data subsequently collected by WFP?
Guidelines
8

Categories of Primary Data Collection Methods
Introduction. This section describes the characteristics, strengths, weaknesses andpossible uses of each of the 2 broad categories of data collection methods - quantitativeand qualitative.
Characteristics of Quantitative and Qualitative Methods
There are 2 broad categories of data collection methods: quantitative and qualitative. The differ-ence in the 2 categories lies in the approach and the types of questions they seek to answer.There is the erroneous perception that quantitative methods are more objective and that qualit-ative methods are more subjective. Today’s researchers recognise that both methods have sub-jective and objective qualities.
Quantitative MethodsQuantitative research uses methods adopted from the physical sciences that are designed toensure objectivity, reliability and the ability to generalise. They seek to exert maximum controlover the questions and potential answers and most often incorporate probability sampling meth-ods to allow for statistical inference to the larger study population. The researcher is consideredexternal to the actual research, and results are expected to be replicable no matter who con-ducts the research.Quantitative methods help to answer questions such as who, how much, and how many. Whereprobability sampling is used, statistical analysis will provide precise estimates for study vari-ables, such as frequencies, averages, ranges, means, and percentages, at a known and quanti-fiable degree of confidence.The intent is to gather data to test a pre-determined hypothesis and only answers to thosequestions/variables included in the questionnaire are collected. Questions are not open-endedand respondents are expected to provide short ‘answers’. This eases analysis, but limits the de-gree to which respondents participate and are able to provide explanations that they perceive(causes, rationale). Rather, explanations are sought by comparing associations and potentiallycausal relationships between variables (e.g. diarrhoea prevalence is lower among childrenwhose primary drinking water source is a borehole; the lower prevalence, therefore, is ex-plained by the source of water).
StrengthsPrecise estimates, backed by statistical theory, are often invaluable for decision-making and ad-vocacy because they are robust and objectively verifiable if the data is collected and analysedcorrectly.
WeaknessesThe greatest weakness of the quantitative approach is that it can take human behaviour out ofcontext in a way that removes the event from its real world setting. Factors or variables left outof the data collection instrument are simply not considered in analysis.
Qualitative MethodsQualitative research methods are designed to provide the researcher with the perspective oftarget audience members through immersion in their culture or situation and through direct in-teraction with them. These methods help to answer questions such as how and why. The focus
Guidelines
9

is on presenting perceptions, judgments, and opinions and on explaining meanings, processesand reasons.Qualitative interviews differ from traditional structured interviews, in which formal questionnairesare used, by not being limited to a set of predetermined questions to be asked in sequence. In-stead, the interviewer uses a checklist of topics to guide the interview, pursuing avenues thatopen along the way. When applying qualitative methods, the researcher becomes the instru-ment of data collection and results may vary greatly depending upon the researcher. Hypo-theses and additional ‘follow-up’ questions are generated during data collection and analysis,and measurement tends to be subjective. Therefore, by their very nature, the methods are oftennot objectively verifiable.
StrengthsThe strengths of using qualitative methods are that they generate rich, detailed data that leavethe participants' perspectives intact and provide a context for their behaviour. Respondentsprovide their own explanations in a participatory exchange with interviewers.
WeaknessesThe weaknesses of using qualitative methods are that data collection and analysis may be la-bour intensive and time-consuming. As a result the number of respondents to which the methodis applied is usually far fewer than for quantitative methods. Another disadvantage is that qualit-ative methods are often not objectively verifiable.
When to use Quantitative or Qualitative Methods
It is often appropriate to employ both quantitative and qualitative methods as they complementeach other’s strengths and weaknesses. Qualitative methods might be used to explore issuesduring the early stages of a longer study, enabling the researchers to understand better whatclosed-ended and focused questions need to be asked as part of a quantitative study. Con-versely, quantitative methods might highlight particular issues, which could then be studied inmore depth through the use of qualitative methods and open-ended discussions. Also remem-ber that quantitative data can result from qualitative methods and qualitative data can resultfrom quantitative methods, such that the distinction between the 2 is often blurred.It is critical to note that the indicator does not necessarily pre-determine the data collectionmethod. More often than not available resources and staff expertise will drive the decision tochoose one data collection method over another. Also the type of data needed (quantitativeversus qualitative) does not necessarily pre-determine the type of method to be used(quantitative versus qualitative).
Quantitative Methods are useful in the following Situations:
• When ‘accurate’ and ‘precise’ data are required.• When sample estimates will be used to infer something about the larger population with the
support of statistical theory.• To test whether there is a statistical relationship between variables.• To produce evidence to prove that a particular problem exists, or to justify a particular
strategy.• To identify the characteristics of a population (for example, during a baseline survey).
Application in WFP OperationsThe most commonly used quantitative methods for M&E purposes in operations are: samplesurveys, questionnaires; visual observation and physical measures, commonly used in monitor-ing food commodities.
Guidelines
10

Qualitative Methods are useful when:
• A broader understanding and explanation is required on a particular topic for which quantit-ative data alone is not sufficient.
• Information is needed on what people think about a particular situation, and what are theirpriorities.
• Seeking to understand why people behave in a certain way.• There is a need to confirm or explain quantitative findings from a previous survey, or from
secondary data.• Resources and time are in short supply.
Application in WFP OperationsQualitative methods commonly used for M&E in operations include in-depth interviews, focusgroup discussions and key informant interviews.
An Example of collecting and analysing average Yearly Income Data usingQuantitative and Qualitative Methods
IndicatorsAverage Yearly Income among households in Somaliland Primary Source of Income
Method 1: Quantitative Method yielding Quantitative DataHousehold Sample Survey using Probability Sampling – Application of a household survey to asample of 210 households, randomly selected using a 2-stage cluster sampling method(villages selected during the first stage and households within selected villages selected at thesecond stage).Results: mean yearly income of $232 USD equivalent +/- 34 USD at 95% confidence (95% con-fidence interval = $198 to $266). For 80% of households livestock was the primary source of in-come.
Method 2: Qualitative Method yielding Quantitative DataFocus Group Discussion with wealth groups – 10 focus group discussions were held in 5 ran-domly chosen villages in Somaliland. In each village a focus group discussion was held withhousehold heads classified as middle to high wealth group and another discussion was heldwith household heads classified as low to very low wealth groups as determined during a wealthranking exercise. In each group, participants were asked to describe the sources of income andamount of income from each source for an average household in their area.Results: The mean income determined by the average from all 10 focus group discussions was$320 USD equivalent. The 2 lowest income estimates were $120 and $140, both from low tovery low income discussion groups. The 2 highest income estimates were $450 and $500, bothfrom middle to high-income discussion groups. In addition it was determined that most house-holds, except for a very small minority, have livestock as their primary source of income.Furthermore respondents indicated that this is due to the fact that people in this area considerthemselves ‘livestock people’ and do not consider planting crops a dignified livelihood.
Guidelines
11

Examples of how Qualitative and Quantitative Methods can be used tocomplement One Another
1. Qualitative methods contribute to the development of quantitative instruments, such as theuse of focus groups in questionnaire construction.
2. Quantitative methods can use qualitative results to help interpret or explain the quantitativefindings.
3. Quantitative results help interpret predominantly qualitative findings, such as when focusgroup participants are asked to fill out survey questionnaires at the session.
4. The 2 methodologies are used equally and in parallel to cross-validate and build upon eachother's results.
Guidelines
12

Sampling
Introduction. This section explains what sampling is and describes when to chooseprobability and non-probability sampling. Choosing the appropriate sampling methods isbased on: i) the data collection method being used in primary data collection; and ii) thedegree of statistical rigour needed for extrapolating the sample estimate to the largerstudy population.
What is Sampling
Sampling occurs when a subset of the population (or other unit) under study is selected fromthe larger group (the entire population under study). By studying the findings from that sample(denoted as “n”) it is hoped that valid conclusions can be drawn about the larger population(denoted as “N”) from which the sample was taken. Sampling is commonly employed in order toavoid the expense and time associated with total enumeration of the population, as is done dur-ing a census.Sampling is used to select respondents from among the larger population. Sampling makes itpossible to analyse the impact of a WFP operation. Whether 2 focus group discussions are heldto analyse the impact of a WFP operation in a geographic region or 1,500 households, in thesame region, are selected at random, visited and asked questions from a questionnaire,sampling is used.
What distinguishes Probability Sampling from Non-probability Sampling
Sampling methods can be divided into 2 broad categories: probability sampling and non-probability sampling. Within each of these a variety of subcategories exist and a number ofways of selecting the sample can be used. Both probability and non-probability sampling meth-ods seek to gather data that provide a fair representation of the larger population, although thedefinition of “representative” varies between the 2 methods.Probability sampling methods rely on statistical theory as a basis for extrapolating findings fromthe sample population (n) to the larger study population (N). By contrast, non-probabilitysampling does not utilise statistical theory to support inference from a sample population (n) tothe study population (N), but rather relies on a more subjective determination of the degree towhich a sample “represents” the larger study population. The choice of which method to followdepends on the intended use of the information and the importance placed on objective(probability sampling) versus subjective (non-probability sampling) determination of how repres-entative the sample is.
Probability SamplingProbability sampling allows for statistical inference. Statistical inference makes use of informa-tion from a sample to draw conclusions (inferences) about the population from which thesample was taken. The estimates are representative of a larger population, from which thesample population is taken, at a known and quantifiable level of confidence or probability. Es-timates are given in ranges, called confidence intervals, although they are often expressed as apoint estimate +/- a number of percentage points. Probability sampling is almost exclusivelyused with quantitative data collection methods.The essence of probability sampling is that each unit of study (e.g. household, individual, child)in the study population for which the estimate is desired must have an approximately equalprobability for selection and inclusion in the sample. In order to ensure that this critical criterion
Guidelines
13

is met, an exhaustive sampling frame must exist or be created for the unit under study(households, individuals, children). A sampling frame is a complete list of all the potential unitsof study (e.g. households, individuals or children) in the population from which the sample willbe taken.In many countries, it is impossible to find an existing sampling frame at the unit of study leveland it is too costly to construct one. In these cases, cluster sampling is used. Cluster samplingaggregates the unit of study into groups or clusters for which a complete or nearly complete listis available. Although cluster sampling is very commonly used, it is rarely employed appropri-ately. Expert guidance should be sought in applying cluster sampling and determining the ap-propriate number and proportional weighting of clusters.Determining the appropriate sample size is based on a set of parameters concerning the de-gree of confidence desired in the estimate, the design effect of the sample, the degree of toler-able error and the proportion or mean estimates for the variable of interest. The sample sizecalculation includes an additional parameter when the desire is to measure change over time.Expert guidance should be sought in determining the appropriate sample size needed if probab-ility sampling is being used.
Non-probability SamplingNon-probability sampling also seeks to draw conclusions about the larger population understudy through using a selected sample or subset of that population. However, in non-probabilitysampling the basis for doing so is not supported by the statistical theory of inference, as it is inprobability sampling. Non-probability sampling is almost always used for qualitative data collec-tion methods and can be used for quantitative methods for which statistical inference is not de-sired.Because there is no effort to draw statistical inferences from a non-probability sample (eitherbecause the conclusions apply to the sample population only or because the inference to a lar-ger population is not supported by statistical theory), there is no sample size calculation for-mula, as there is in probability sampling. It is also common to select and consult groups (casestudies, focus groups) that are made up of a number of units of study; for example, when 5 fo-cus groups of 10 respondents each are consulted, the total sample is 50 units of study or re-spondents.Despite this more free-flowing approach to sampling, the desire to draw conclusions about thelarger population does influence the sample size and the way in which the sample is chosen.The intent is to get a sample that is fairly representative of the geographic area and other im-portant differentiating characteristics of the population under study (e.g. wealth groups, sex,age, livelihood). Choosing characteristics on which to stratify the sample requires thinkingthrough which factors influence the variable(s) of interest in the study and ensuring that eachimportant subgroup of the larger population is included in the sample population.While the guidelines for sample size are less strict for non-probability sampling, a balance mustbe struck between the ideal number of interviews or discussions to hold and the resourcesavailable for doing so. This is particularly important in the use of time-intensive qualitative stud-ies in which a single discussion may take several hours to conduct. The most common types ofnon-probability sampling methods used for M&E in operations are:• Purposive sampling (choosing respondents based on the fact that they are likely to give the
best picture of the phenomena you wish to inquire about).• Random sampling (using a random method to select respondents).• Opportunistic sampling (simply choosing respondents based on their availability to particip-
ate at the moment you arrive to collect data).In general, purposive and random sampling will yield better data than opportunistic sampling.Because of the in-depth nature of qualitative methods, the sample size (sites or study units) willnecessarily be limited. However, the ability to draw conclusions about the larger population from
Guidelines
14

the sample population is enhanced as the sample size increases. Seek guidance from expertsconcerning sample size for the particular data collection method being used. The aim should beto maximize the sample size within the constraints of available resources and while maintainingthe highest level of data quality possible.
Examples of Non-probability and Probability Sampling for a Baseline Survey
The aim of the baseline survey is to determine the average number of weeks of food shortagesuffered by households in the region during the dry season. The following examples illustratethe application of a probability sample and a non-probability sample during a baseline survey toestablish pre-operation conditions for this indicator.
Non-probability SamplingA non-probability sample of respondents is chosen to participate in a focus group discussionconcerning food shortage during the dry season. 5 villages are randomly chosen for inclusionand, within each of those villages, 10 women and 10 men are chosen to participate in gender-separate discussion groups.
Probability SamplingIt is determined that 210 households will need to be chosen at random from among all thehouseholds in the target area to participate in a household survey concerning food shortageduring the dry season. Because no list of all the potential households is available, a 2-stagecluster sampling design is used.In the first stage, 30 villages (clusters) are chosen from the 239 potential sample villages, whichare weighted in proportion to their estimated size (big villages are weighted more than small vil-lages so that all households have an approximately equal chance of being included in the sur-vey).Within each of the 30 villages selected from among all the potential villages (clusters), theUnited Nations Children’s Fund (UNICEF) pencil spin method is used to select 7 households forinclusion in the survey. A pencil is spun at the village’s mid-point and every other household isinterviewed in a line in the direction in which the pencil is pointing until 7 households have beenselected. If the end of the village is reached before 7 households have been selected, the pencilis spun again and a new direction is chosen. Again, every other household is selected for inclu-sion in the survey.
An Example of an Estimate from a Probability Sample
A probability sample of 210 mothers with children under 5 years of age is taken, and eachmother included in the sample is asked whether or not each of her children under 5 has haddiarrhoea in the last 2 weeks. Because some mothers have more than 1 child under 5, the totalnumber of children referenced in the sample is 332. Of these, 154 have had diarrhoea in thelast 2 weeks. Therefore, the diarrhoea prevalence point estimate for the sample population is 46percent and the confidence interval surrounding the estimate is 40 to 52 percent, meaning that,at 95 percent confidence (the confidence level used to determine the sample size), the truepopulation prevalence lies between 40 and 52 percent (e.g. 95 out of 100 samples in this rangewill contain the true population prevalence for diarrhoea).
Guidelines
15

Characteristics, Strengths and Weaknesses of Sample Surveys
Introduction. This section defines 2 broad categories of sample surveys, and analysestheir strengths and weaknesses in order to help determine their appropriateness for aspecific operation.
What is a Sample Survey
A sample survey is a quantitative data collection method that can be used to collect informationon any number of topics. Common techniques used in sample surveys include measurementtechniques such as anthropometric (nutritional measures of children) surveys and interviewingtechniques (e.g, asking the respondent how many meals he or she has eaten in the last week,and what foods he or she ate). Surveys employing interviewing techniques most often utiliseclosed-ended questions listed in questionnaires that are uniformly applied to each respondent.The intent is to gather data to test a pre-determined hypothesis and only answers to thosequestions/variables included in the questionnaire are collected. This eases analysis, but limitsthe degree to which respondents participate and are able to provide explanations on what theyperceive (causes, rationale). Rather, explanations are sought by comparing associations andpotentially causal relationships between variables (e.g. diarrhoea prevalence is lower amongchildren whose primary drinking water source is a borehole, therefore the lower prevalence isexplained by the source of water).The results of quantitative sample surveys are easily analysed and expressed as numbers, per-centages, averages (means), scales or other numeric presentations. Sample surveys may in-clude some questions or methods that are open-ended (e.g. respondents are not probed with orgiven the options of potential answers). In analysis these answers are most often categorisedand summarised in a quantitative way (e.g. the varying reasons given for crop failure are cat-egorised into 5 possibilities to yield a categorical variable, including an ‘other’ category for infre-quent responses).
2 Categories of Sample Surveys: Probability Sample Surveys andNon-probability Sample Surveys
Sample surveys fall into 2 broad categories: probability sample surveys and non-probabilitysample surveys.
Probability Sample SurveysProbability sampling during a survey draws on statistical theory to allow for inference of the ex-perience of the sample population to the larger population of interest (individuals, households,or other units of interest) at a known level of confidence and precision. How the sample size isdetermined and how the sample population is selected determine the statistical validity of theestimates. The ability to draw statistical conclusions about a population, based on a samplefrom that population, requires certain technical expertise in sample determination and selection,as well as analysis. A large sample size also usually requires that data collection teams (e.g.non-staff) be hired and trained.
Non-probability Sample SurveysNon-probability sample surveys attempt to achieve some level of representative sample, thoughit is not supported by statistical theory. They share the characteristics of closed- ended ques-tions and numerically represented responses with probability sample surveys.
Guidelines
16

Analysing the Strengths and Weaknesses of Sample Surveys prior toplanning for Them in an Operation
Choosing whether or not to use probability or non-probability sample surveys in an operationwill depend on time, resources and the need for statistically supported estimates. The addedcomplexity of sample surveys requires external assistance in the form of technical guidance andadditional people for data collection. As a result, Country Offices rarely undertake probabilitysample surveys without the support of WFP’s internal expertise or external consultants.In order to determine if a sample survey should be planned for baseline, monitoring or evalu-ation purposes within an operation, the strengths and weaknesses need to be considered bydecision-makers. The table below lists the strengths and weaknesses that apply specifically toprobability sample surveys and that are largely shared by non-probability sample surveys.
Strengths Weaknesses
• Surveys provide precise, statistical answers to carefullydefined questions.
• The accuracy of results can be verified by checking themethods and statistics that were used.
• The use of a random sample means that people orhouseholds will be contacted from several different loc-ations.
• Methods of analysis are clear and can be relativelyquick, especially when carried out in the field usingportable computers.
• The findings can give support to an argument or hypo-thesis by demonstrating the size and severity of a prob-lem.
• Surveys allow comparisons to be made between differ-ent groups within the survey, or with other surveyswhich used similar methods (e.g. a baseline and follow-up study).
• Considerable resources are often needed – personnel,vehicles, fuel, computers, etc., making surveys expens-ive to carry out.
• Surveys may take several weeks or even months tocarry out.
• Data collection can be intrusive and inconvenient to thepeople interviewed. Non-cooperation can be a problemand could lead to unreliable results.
• Surveys are often planned, and data analysed, far fromthe survey sites, with little or no involvement of peoplefrom the community.
• Working with structured questionnaires can hinder re-laxed discussion.
• Surveys look at pre-defined variables and often allow alimited range of responses. If poorly designed, the sur-vey may ignore important avenues of inquiry or unex-pected answers that could be crucial to the findings ofthe study.
• The analysis of large amounts of numerical data istime-consuming and requires expertise. There is adanger that much of the data gathered might not beanalysed or used effectively.
• When data collection and analysis tools are used incor-rectly, the results may be invalid.
• Surveys are designed to prove or disprove what the de-signers believe, so it is important to look at methodsand conclusions critically.
Source: Toolkits: A Practical Guide to Assessment, Monitoring, Review and Evaluation’, Save the Children Fund, 1995
An Example of Questions asked in Quantitative Sample Surveys
Questions included in quantitative sample surveys are closed-ended. The responses are oftennumeric, yes/no, or categorical (e.g. answer is one or more of up to 5 possible responses).Q1: How many female children under the age of 15 live in this household?A1: 2Q2: What quantity of wheat flour did you receive during the last food aid distribution?A2: 5 kilogramsQ3: How many times per day do you collect water?A3: 3Q4: What is the most common cause of crop failure during the last 3 years?A4: Insects, lack of water, poor seed quality
Guidelines
17

Insects = 1 Lack of water = 2 Poor seed quality = 3
Guidelines
18

What are the Key Techniques used in Qualitative Methods?
Introduction. This section illustrates the key techniques used in qualitative methods.An example is given that shows the value of mixing techniques, involving the communityand using triangulation.
6 Key Techniques used in Qualitative Methods
The following gives the characteristics of 6 key techniques that are employed interdependentlywhen using qualitative methods.
• Triangulation - This refers to the process of crosschecking information. Triangulation usesmulti-disciplinary teams that include different skills, experience and viewpoints; a range oftools and techniques for data collection and analysis; and different sources of informationabout the same problem. In this way, the reliability and bias of findings can be assessed,and if necessary addressed.
• Multi-disciplinary approach - People with different skills, experience and viewpoints willlook for different views, perspectives and analysis of a given topic, and the team as a wholewill obtain new and deeper insights when these different perspectives are shared. Womenand men should always be included on the team, as should members of the community orgroup in question.
• Mixing techniques - Using different techniques gives greater depth to the information col-lected. Typically the team would aim to use a mixture of interview and discussion tech-niques, diagrams and mapping, and direct observation.
• Community Involvement - Most activities are performed jointly with the community or bythe community on its own.
• Flexibility and on-the-spot analysis - Plans and methods are semi-structured, and dis-cussed and modified as fieldwork proceeds. The team constantly reviews and analyses itsfindings to decide how to continue. As understanding increases, emerging issues and un-expected findings come more clearly into focus, and plans, topics and methods can be re-vised.
• Offsetting bias - The team should constantly seek to identify possible sources of error andbias, and see how they influence findings. Views should be obtained from a cross-sectionof the community or group, including women and children and other vulnerable groups.This may require advance training in skills such as gender awareness, communicating withchildren, etc.
An Example of mixing Techniques, Community Involvement andTriangulation of School Attendance Data
A monitoring visit is undertaken to examine whether or not the food commodities being given aspart of a school feeding activity in Malawi are providing an adequate incentive for parents tosend their female children to school on a regular basis. An understanding of disincentives to at-tendance is also desired.1. School records show that attendance is normally quite high, but that for the last month or
so it has dramatically decreased and disaggregated data indicates that the low attendanceis particularly high for girls (secondary quantitative data).
2. The male monitors first meet with the headmaster and a number of both male and femaleteachers in the school and interview them separately (key informants). Teachers and theheadmaster indicate that the reason parents do not send their children to school right now
Guidelines
19

is that the school facilities are inadequate, including no water or toilets for the children touse when they are in school. Some teachers also mentioned that children, and girls in par-ticular, are used as on-farm labour during the harvest season, which is going on right now,and that this likely explains poor attendance along with the lack of water and toilets.
3. Finally a group discussion is held with mothers in the surrounding villages who do not sendtheir children to school regularly. Female monitors are used to create a comfortable andopen discussion among the women. The mothers acknowledge that the school water andtoilet facilities are sub-par, but do not see this as an impediment to school attendance.Rather they point out that the single biggest impediment is the need to use children, girls inparticular, for labour during the harvest. They suggest that if the school schedule could beadjusted during this period, higher levels of attendance would be maintained for both boysand girls. The issue of attendance of both boys and girls was therefore triangulated using 3information sources. The first source is a descriptive, quantitative indication of a drop inattendance for both boys and girls, with the drop more pronounced for girls, exhibited in theschool records. The second source is key informant interviews with the headmaster andmale and female teachers. The third is a focus group discussion held with mothers who donot send their children to school regularly. This brings in 3 sources of information to ana-lyse the problem of attendance and provides both a sound quantitative description of thesituation as well as a qualitative explanation of why attendance has dropped in recentweeks and why girls are disproportionately affected.
Guidelines
20
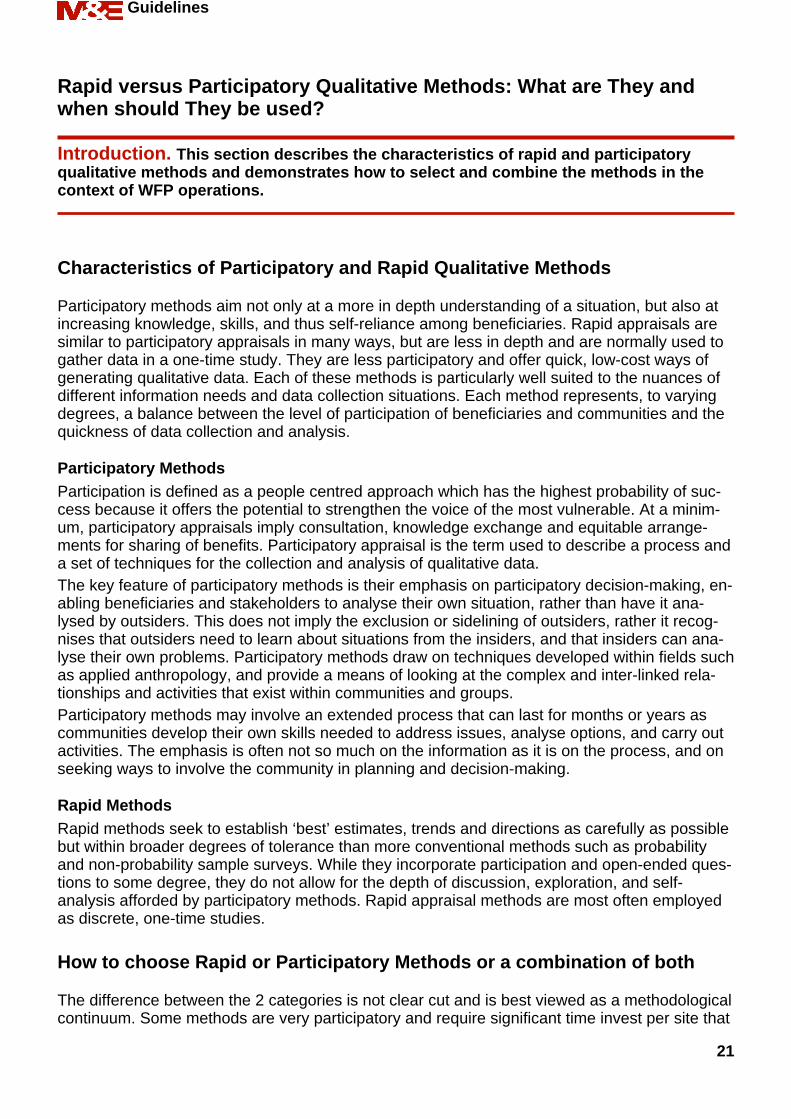
Rapid versus Participatory Qualitative Methods: What are They andwhen should They be used?
Introduction. This section describes the characteristics of rapid and participatoryqualitative methods and demonstrates how to select and combine the methods in thecontext of WFP operations.
Characteristics of Participatory and Rapid Qualitative Methods
Participatory methods aim not only at a more in depth understanding of a situation, but also atincreasing knowledge, skills, and thus self-reliance among beneficiaries. Rapid appraisals aresimilar to participatory appraisals in many ways, but are less in depth and are normally used togather data in a one-time study. They are less participatory and offer quick, low-cost ways ofgenerating qualitative data. Each of these methods is particularly well suited to the nuances ofdifferent information needs and data collection situations. Each method represents, to varyingdegrees, a balance between the level of participation of beneficiaries and communities and thequickness of data collection and analysis.
Participatory MethodsParticipation is defined as a people centred approach which has the highest probability of suc-cess because it offers the potential to strengthen the voice of the most vulnerable. At a minim-um, participatory appraisals imply consultation, knowledge exchange and equitable arrange-ments for sharing of benefits. Participatory appraisal is the term used to describe a process anda set of techniques for the collection and analysis of qualitative data.The key feature of participatory methods is their emphasis on participatory decision-making, en-abling beneficiaries and stakeholders to analyse their own situation, rather than have it ana-lysed by outsiders. This does not imply the exclusion or sidelining of outsiders, rather it recog-nises that outsiders need to learn about situations from the insiders, and that insiders can ana-lyse their own problems. Participatory methods draw on techniques developed within fields suchas applied anthropology, and provide a means of looking at the complex and inter-linked rela-tionships and activities that exist within communities and groups.Participatory methods may involve an extended process that can last for months or years ascommunities develop their own skills needed to address issues, analyse options, and carry outactivities. The emphasis is often not so much on the information as it is on the process, and onseeking ways to involve the community in planning and decision-making.
Rapid MethodsRapid methods seek to establish ‘best’ estimates, trends and directions as carefully as possiblebut within broader degrees of tolerance than more conventional methods such as probabilityand non-probability sample surveys. While they incorporate participation and open-ended ques-tions to some degree, they do not allow for the depth of discussion, exploration, and self-analysis afforded by participatory methods. Rapid appraisal methods are most often employedas discrete, one-time studies.
How to choose Rapid or Participatory Methods or a combination of both
The difference between the 2 categories is not clear cut and is best viewed as a methodologicalcontinuum. Some methods are very participatory and require significant time invest per site that
Guidelines
21

prevents them from being classified as ‘rapid’. Other methods sacrifice the level of participationdue to the need for quick and low-cost data collection and analysis. Still other methods fallsomewhere in between allowing for significant participation while being performed rather rapidlysuggesting that the decision is not either rapid or participatory, but rather how rapid and howparticipatory. In this way there is some trade off between rapidity and participation.Although the right method or set of methods will need to be considered on a case-by-casebasis, in general:• EMOPs will rely to a large extent on rapid methods in the early stages of an operation.• Country Programmes will rely to a large extent on more participatory methods.• In the later stages of an EMOP or during a PRRO an effort should be made, where pos-
sible, to shift along this methodological continuum away from rapid methods toward morein-depth participatory methods.
The Rapid-Participatory Methods Continuum and how It can be applied toM&E Tasks for Operations
The following table outlines some examples of the balance struck between rapidity and particip-ation appropriate for various hypothetical M&E data collection exercises. Note that this balancewill vary depending on the data needs and working environment of each operation and that thetable is intended to be an example not a strict guideline.
Guidelines
22

Qualitative Methods: Individual Interviews versus Group Interviews
Introduction. This section describes the main types of interviews - individual andgroup - used in qualitative methods. Within these main types it further distinguishesamong different interviewing techniques, highlighting the role of the interviewer in each.Some guidance is given on choosing methods to apply for M&E purposes in operations.
What are the Main Interviewing Techniques used in Individual and GroupInterviews or Discussions
A description of individual and group interviews or discussions given below can serve as aguideline for choosing which to employ in a given situation. Within each of these methods sev-eral interviewing techniques are described. When choosing the appropriate qualitative method,consideration must be given to whether it will be more appropriate to meet with individuals orgroups. Often a combination of individual interviews and group discussions serves to triangulatethe findings of each.
Interviewing IndividualsIndividual interviews are particularly useful for gaining insight into the experience of individualsand households. Because they are qualitative in nature, individuals are encouraged to expandupon their answers to specific questions by providing explanations, rationale, and additionalcontext and related issues. The interviewer may use a checklist of topics to guide the interviewor the interview may simply be an informal conversation. Individual respondents can be chosenrandomly, opportunistically (whoever comes along), or purposively (chosen because they havespecial insight into the topic of interest, often called ‘key informant’ interviews). In the context ofM&E for WFP operations, interviews with individuals can be time consuming and a large num-ber may be needed to gain a representative picture for the operation as a whole. For some top-ics respondents may be reluctant to speak truthfully if they fear their views might be unwelcomeby the interviewer.
• Informal Interviews - These aim to elicit information via conversations between an inter-viewer and a respondent. They explore, broadly, the views, experiences and values of therespondent by giving the interviewer freedom to pursue issues as they arise. In view of theinterview's informal nature few notes are taken during the interview.
• Topic-focused Interviews - In these interviews an interview guide is used to direct the in-terviewer through the main topics to be covered. From this the interviewer develops his/herquestions and format to fit the individual respondent. There is no time limit on the responseto each topic or sub-topic and pursuit on topics of particular interest is permitted.
• Semi-structured, open-ended Interviews - These interviews use open-ended question-naires with lists of questions to be asked. However they differ from traditional structured in-terviews by having open-ended questions, which allow for expansion on the points raised;a flexible sequence of questions which allow for interviewer discretion; and leave room foradditional questions to be asked.
Group Interviews/DiscussionsFor group interviews or discussions the intent is to stimulate discussion between the parti-cipants, rather than between the facilitator (interviewer) and the participants. This interaction isoften the most fruitful time for gaining insight into how people view various phenomena in theircommunities and the degree of homogeneity or heterogeneity in thought, explanations, and ra-tionale. The agreements and disagreements and how they are handled by the group are often
Guidelines
23

as enlightening as the content of the discussion.Group discussions are best for gaining insight into the ‘average’ experience in the village orwhat ‘normal’ households do. Group discussions often encourage participants to talk about themore general experience among ‘people like them’ and in this way participants help make thedata more representative (though who is participating in the group greatly influences percep-tions of ‘people like them’). Participants are often more willing to discuss sensitive issues whentalking about ‘people like them’ rather than in individual interviews where the respondent ismore apt to answer conservatively when talking about herself or himself.Although it is advisable to plan meetings ahead of time, even if participants will be chosen onthe day of the discussion, ad-hoc meetings are useful in providing spontaneous additional dataand are an additional check on the validity of data provided by individuals and pre-selectedgroups.2 important group techniques are community interviews and focus group discussions.Community Interviews - These interviews may involve all members of a community or village.When carefully planned, community interviews have great potential for providing insights intohow members of the community view operation activities and how they see the operation affect-ing their lives. When planning and conducting community interviews, facilitators (interviewers)should:• Use structured interview guides.• Select a few representative communities.• Schedule meetings at times when the majority of people within the community can attend;
the evening is often the most convenient.• Use a team of interviewers as conducting a meeting with many people and taking extensive
notes is beyond the capacity of most people.• Plan the process among team members to ensure that participants have a fair say and that
the interviewers don’t take over.• Ensure participation by a balanced representation of those attending. Prominent individuals
should not dominate.• Aim to be able to aggregate and summarise some of the data bearing in mind that extreme
caution should be taken in attempting to quantify the data.• Plan for additional sessions in addition to the main meetings for those who felt inhibited
among the large group of people to discuss their thoughts.Focus Group Interviews or Discussions - These interviews use a more rigorous techniquethan community interviewing and as such require both more extensive planning (e.g. careful se-lection of the participants according to determined criteria, even greater attention to develop-ment of topic guides, more systematic analysis of results) and specialised skills. The basic prin-ciple of the technique is using the skill of a 'neutral' moderator to stimulate exchange of ideasamong a small (ideally 6-10 persons) group of selected participants. Information is thus ob-tained through carefully listening to the interaction among participants. The role of the moderat-or is to guide the discussion to cover the intended topics; he/she should not participate in thediscussion as such, should not 'correct' erroneous ideas expressed, and should essentially be aneutral observer. Clearly, the success of the technique depends largely on the skill of the mod-erator.Members of the group should be from similar social and economic strata to ease discussion andeliminate status barriers. Therefore separate discussions are often held with different wealthgroups identified during a wealth ranking exercise. It is often also advisable to have separatemale and female discussion groups to encourage full participation and gain valuable insight intothe differing experiences of men and women.
Guidelines
24

Examples of when a Group Discussion is more appropriate than IndividualInterviews
The Emergency Officer handling the PRRO operation in Somalia is interested in describing andanalysing how food is redistributed among the community because it appears to be diluting theimpact of food distribution to targeted households.Saves Time and Resources - It is decided that talking with groups of women will provide thebest information since the number of Field Monitors are limited and talking with a sufficient num-ber of women individually would take too much time.Sensitive Subjects - Also it is thought that some of the issues related to redistribution aresensitive in nature and respondents in individual interviews may not be willing to talk openlyabout them. The group setting, in which they are asked ‘what families like them do’ and ‘whythey do it’ is likely to allow for a more open discussion of issues related to food commodity re-distribution.
Guidelines
25

Qualitative Methods: Tools for Stimulating Dialogue and Participation
Introduction. This section describes some of the communication tools that are used tostimulate dialogue and enhance participation during qualitative interviews anddiscussions.
Why are Participatory Communication Tools used
A variety of participatory communication tools have been developed that enhance and contrib-ute to semi-structured or structured interviews. They aim to stimulate interactions and make in-terviews more participatory and fruitful. The intent is to move away from the traditional inter-viewer and respondent relationship, where the Field Monitor sits with a pencil and paper record-ing the ‘answers’ given, to a more interactive and inclusive discussion. Participatory communic-ation tools also provide a deeper understanding of gender relationships by using the tools sep-arately with groups of men and women and sharing and comparing them later.
What are some of the Participatory Communication Tools and how can Theybe used
A brief description of a few of the participatory communication tools is provided below. The fulldescriptions of each and more guidance of how to use them, as well as many more participatorytools, can be found in WFP, A Guide to Deepen Understanding: Participatory Techniques andTools. Some tools are more appropriately suited to participatory methods rather than to rapidmethods due to the time and resources needed to employ them. However, simple tools, such asproportional piling, can be used in either. Some tools are exclusively for use with groups or indi-viduals. Many tools can be applied to both individual or group interviews/discussions, such asmatrix ranking and scoring exercises.Proportional Piling allows people to express their perspective of quantity by piling “counters”such as stones or beans that can then be put into percentages.Matrix Ranking and Scoring is a way to structure the perceptions and opinions of informantsso that individual or group qualities can be ranked in order of importance and the reasons forthis ranking is discussed.Stakeholder Identification and Analysis gives a comprehensive picture of all persons, groupsor institutions that: i) have an interest in the operation’s success or failure; ii) may hinder itssmooth implementation; iii) contribute to or are affected by the objectives of the operation, posit-ively or negatively; or iv) can influence the situation.The Venn Diagram is a popular and effective tool for encouraging participation. A set of circles,each representing a group or institution, is selected or drawn and then arranged to show the re-lationships between these institutions or groups.Social Network Mapping shows the economic, social and cultural ties and relationships thatpeople have within a community or that exist between people from different communities. Mapsof social networks can indicate ways in which different social groups benefit from these link-ages.Wealth or Well-being Ranking is used to get an understanding of local perceptions of the dif-ferent wealth groups within a community and place every household in 1 of these groups.
Guidelines
26

Examples of using Participatory Communication Tools
The Emergency Officer handling the PRRO in Somalia is interested in describing and analysinghow food is redistributed among the community because it appears to be diluting the impact offood distribution to targeted households.• A social network mapping exercise is used to stimulate discussion among men and wo-
men in separate groups concerning food redistribution as it relates to kinship ties and reli-gious obligations.
• Wealth and well-being ranking exercises are used prior to meeting with women in order toidentify different socio-economic groups among the women and to allow for separate groupdiscussions with each.
Guidelines
27

What is Direct Observation and when should It be used?
Introduction. This section describes direct observation and when and how it can beapplied as a data collection technique.
What is Direct Observation?
Direct observation refers to using your eyes to observe people and their environment, situ-ations, interactions or phenomena and recording what you see as data. Everyone collects directobservation data knowingly or unknowingly; using the technique simply requires recording and,in the case of qualitative methods, consciously using what we see to help shape our under-standing of situations or phenomena.
When and how to use Direct Observation
When to use Direct Observation
• Direct observation bigins even before an interview or discussion. Often things seen on thedrive into the area or upon entering the village on foot provide valuable contextual data.
• Direct observation techniques are particularly applicable to interactive discussions, such asfocus group discussions, where the physical response and reactions tell of underlying dis-agreement or agreement between participants in the discussion.
How to use Direct Observation
• Direct observation is most often attached to a data collection exercise that also involvesverbal interaction with beneficiaries using quantitative or qualitative methods.
• Direct observations can be formally included in the data collection exercise, and noted onthe data collection instrument, or they can be informally used to enhance the context or averbal response, description, or explanation given by beneficiaries.
• Every data collection instrument (e.g. questionnaire, interview checklist) should make aprovision and space for direct observation comments and notes as they can add context tothe data. Similarly, data collectors must be advised that their observations are valued andshould be recorded, making sure to separate out their observations from the respondents’comments or responses.
• Direct observation is used as a means of ‘on-the-spot’ triangulation for the responses, dis-cussion, and explanations given by beneficiaries.
• When using qualitative methods, direct observation information can be used to form thenext topic for discussion or to frame a question about inconsistency between what the inter-viewer observes and what the respondents are saying.
• When using quantitative methods, the interviewer should note down his or her observation,but also write down the respondent’s response. Interviewers need to ensure that they donot substitute their direct observation for the respondent’s answer or explanation to a ques-tion or interview topic.
Guidelines
28

Examples of the use of Direct Observation Techniques when applyingQualitative and Quantitative Methods
Quantitative:Upon entering the homestead, Field Monitors are to observe the general tidiness of the cookingarea and record their rating on a scale of 1 to 5 (with 1 being unclean/unsanitary and 5 beingthe most clean and sanitary).The male head of household tells the Programme Officer that the household owns no goats, yetover 20 goats were observed in the area surrounding the homestead and the man’s daughterwas tending them. The Programme Officer notes both the response of the head of householdand her own observation on the questionnaire.
Qualitative:The women’s group explained that it takes over 2 hours to reach the nearest water source. TheAdvisor conducting the interview noted the existence of a borehole just outside the village onthe drive in and inquires about this apparent inconsistency. The women explain that the bore-hole is run by a management committee that charges 10 Kenyan shillings per 20-litre jerry canand that only the middle and rich wealth groups can afford it. The Advisor notes both her obser-vation and the women’s explanation on the interview checklist.
Guidelines
29

Module Summary
What has been covered in this module?This module provided an overview of quantitative and qualitative data collection tools and meth-ods, describing their strengths and weaknesses, as well as when it is appropriate to use each ofthem. The difference between probability and non-probability sampling was explained, andguidance on the appropriate use of both was provided. The module also described a number ofqualitative data collection techniques, such as key informant interviews, focus group discus-sions and observation. In addition, participatory and rapid rural data collection methods were in-troduced, and the usefulness of these methods vis-à-vis different kinds of WFP operations wasoutlined.
What additional resources are available?For further information the following modules and resources might be useful:• Going to the Field to collect Monitoring and Evaluation Data• How to consolidate, process and analyse Qualitative and Quantitative Data• Reporting on M&E Data and Information for EMOPs and PRROs• Reporting on M&E Data and Information for Development Programmes• WFP Participation Toolkit• WFP’s Food and Nutrition Handbook
Guidelines
30

Choosing Methods and Tools forData Collection
United NationsWorld Food ProgrammeOffice of Evaluation and Monitoring
Via Cesare Giulio Viola, 68/70 - 00148Rome, ItalyWeb Site: www.wfp.orgE-mail: [email protected]: +39 06 65131