
URETHRAL CATHETERISATION. ANATOMY OF URETHRA & INDICATIONS FOR URETHRAL CATHETERISATION.

NON-INVASIVE BLOOD PRESSURE - NIBP
a. palpatory - measure at pulse return~ systolic ± 5-8 mmHg
b. limb flush ~ systolic ± 10 mmHg
c. oscillometric - systolic & mean, no diastolic- mean very accurate- systolic ± 5 mmHg
d. ultrasonic - systolic & diastolic accurate
e. pulse arrival - time interval QRS - peripheral pulse
f. auscultatory - Korotkoff's soundsi. phase I - snapping tones ~ systolicii. phase II - murmurs (may be low pitch/inaudible)iii. phase III - thumpingiv. phase IV - mufflingv. phase V - silence ~ diastolic
Monitoring & Equipment

ARTERIAL LINES
there are no absolute, only relative indications,
1. continuous arterial pressure monitoring
2. arterial pressure waveform analysis
3. repeated arterial blood tests
4. research
Advantages
a. ease of cannulation
b. accessibility
c. usually adequate collateral circulation
d. low complication rate
Absolute Contraindications
a. AV shunt for dialysis
b. severe Raynaud's disease
c. absence of collateral circulation (but not +'ve Allen's)
d. Buerger's disease
e. Wegener's granulomatosis
Factors Which Optimise Signal Fidelity
a. equipment factorsi. high frequency transducer responseii. short, stiff, non-compliant tubingiii. elimination of air bubbles from tubing < 0.25 ml → underdamping
> ? → overdampingiv. a slow continuous flush devicev. correct calibration of the transducer against Hg column
b. patient factors which reduce signal fidelityi. rapid heart rates → resonanceii. reflection of high frequencies within circulation
elderly, high SVR, atherosclerosisiii. site of catheter insertion - radial vs. femoral
- axillary vs. aorticiv. profound vasodilatation - post-CPB
Monitoring & Equipment
2
Information Gained
a. systolic and diastolic trends
b. accurate mean
c. hypovolaemia - increased pulse paradox- lower dichrotic notch- steeply peaked systolic wave
d. decreased contractility - reduced upslope- reduced peak pressure
e. indication of myocardial O2 supply/demand - pulse pressure product- systolic area vs diastolic area
f. pulsus paradoxus - hypovolaemia - δSAP up/down- tamponade, constrictive pericarditis- high intrathoracic pressure- severe CCF, myocarditis- RV AMI- PTE- ascites- pregnancy
g. hyperdynamic pulse - sharp rise & fall- sepsis- AI- AV fistula- anaemia- thyrotoxicosis- pregnancy
h. pulsus alternans - pericardial effusion- severe LV dysfunction
i. pulsus bisferens - AI
j. access for frequent blood analyses
Misinformation
a. poor guide to perfusion
b. poor guide to myocardial performance
c. errorsi. calibration / driftii. amplificationiii. resonanceiv. damping
Monitoring & Equipment
3

Complications
a. thrombosis ~ 60% overall incidencei. duration ~ 50% at 2/7, but minimal < 24 hoursii. size of canulae - 20G better in adultiii. wrist size - approximates arterial diameter, < 18 cm ↑ incidence
- female > maleiv. catheter material - teflon/vialon are bestv. flush systemvi. systemic hypotensionvii. technique - number of cannulation attempts
- Seldinger > direct
b. haematoma ~ 50%
c. accidental haemorrhage
d. sepsis - related to technique and duration- increases after 4-5 days
e. distal emboli ~ 2-4%
f. thumb/hand ischaemia - transient in 10%
g. proximal forearm ischaemia
h. aneurysm
i. AV fistula
j. inadvertant drug administration
Calibration of Transducers
a. static calibrationi. zeroii. gainiii. linearityiv. stability with time, temperature variation
b. dynamic calibrationi. high frequency response - ideally ~ 10x fundamental frequencyii. damping coefficient, ξ ~ 0.677
Monitoring & Equipment
4
CENTRAL VENOUS CATHETERS
Indications
a. CVP measurement
b. vascular access - difficult or prolonged
c. hypertonic or irritant fluids - TPN, HCl- inotropes
d. infusion of large volumes - not for rapid administration
e. other therapies - pacemaker- PA catheter- haemodialysis, haemoperfusion, plasmapheresis
Complications
a. during insertioni. failure to site in SVC ~ 55% cephalic / 35% basilic
~ 10% EJV / 0-4% IJV~ 5% subclavian (some ≤ 25%)
ii. haematomaiii. arterial puncture ~ 5% with subclavian approach
~ 1-2% with IJV approachiv. pneumothorax ~ 2% with subclavian approach
< 1-2% with IJV approachv. damage to other structures - vagus/recurrent laryngeal nn.
- stellate ganglion, cervical plexus- thoracic duct, trachea, ETT cuff !
b. during usei. venous thrombosis - hypertonic solutions
± thromboembolismii. colonisation, infection, bacteraemia, septicaemia
~ 10% of colonised → bacteraemiaiii. accidental removaliv. venous perforation - catheter stiffness
- duration & sitev. embolisation - air, thrombus, septic thrombus
- catheter tip (shearing)- AV fistula
c. during removali. embolisationii. haematoma formation
Monitoring & Equipment
5
PA CATHETERS
1953 Lategola & Rahn used hand-made, balloon-tiped catheter for PA catheterisation &occlusion measurement in dogs
Swan et al., 1970 NEJM, reported used of multilumen, balloon-tipped, radio-opaque PVCcatheter with the following charcteristics,
1. reliable, prompt passage into the PA
2. minimal arrhythmias
3. passage without fluoroscopy
balloon occluded PA pressure, pulmonary artery occlusion pressure (PAoP), showed goodcorrelation with traditional pulmonary capillary wedge pressure measurements
the later using traditional stiff right heart catheters "wedged" into small pulmonary vesselssubsequent studies confirmed correlation between PAoP, PWP and LAP by direct measurement
since then a multitude of catheters have been described, uses including,
1. in-vivo oximetry
2. pulmonary angiography
3. paediatric catheterisation
4. His-bundle electrocardiography
5. thermodilution CO estimation
6. LV pacing
Monitoring & Equipment
6
Indications
1. optimisation of LV preload, where the CVP will not reflect LVEDVi. LV dysfunction - present or anticipated
severe IHD - global or regional dysfunction- recent myocardial infarction- ischaemia-induced valvular dysfunction
cardiomyopathyvalvular heart disease - this is argued due to validity of measurementaneurysmal heart diseaseHOCM
ii. aortic surgery - poor LV function- suprarenal clamping
iii. severe pulmonary diseasepulmonary hypertensive diseasemultiple pulmonary emboli
iv. states of increased oedemagenesis - pre-eclampsia, ARDS
2. optimisation of perfusion & oxygen delivery, in patients unresponsive to therapyi. sepsis syndrome / SIRS / MOSFii. LV dysfunction
3. ancillary capabilitiesi. ventricular pacingii. mixed venous SpO2
iii. diagnostic categoriesangiography in PEair embolismpreoperative assessment of post-pneumonectomy risk
iv. therapeutic - regional thrombolytic therapy
4. research
Guidelines For Use
1. check position with a CXR
2. never use fluid to fill balloon & inflate the balloon slowly
3. use the minimal volume to achieve a wedge trace
4. never let balloon remain wedged
5. never withdraw the catheter across the heart with the balloon inflated
6. be aware of increased risk of PA rupture in elderly
Monitoring & Equipment
7

Criteria for "Wedging"
1. blood sample = pulmonary capillary bloodmay not be fully saturated in patients with significant intrapulmonary shunt or withexcessive levels of PEEPnow no longer recommended
2. PA phasic contour should change to LA tracing
3. mean PAoP should be < mean PAP
West Zone 3 Criteria
1. 'a' & 'v' waves visible on PAoP trace
2. mean PAoP ~ PADP (except with large 'v' waves)
3. blood freely aspirated from distal port
4. aspirated blood has a high PO2~ PaO2
changes from zone 3-2-1 occur with,
a. hypovolaemia
b. high PEEP > 10 cmH2O
c. poor catheter position
d. poor patient position
Recording Methods
1. inherent underdamping renders systolic & diastolic unrelaible (Gardner Anaes.'81)
2. most circuits do not allow damping adjustment
3. unselective, time-based electrical sampling & averaging renders "mean" unreliable→ graphic recording mandatory to eliminate respiratory artefact
Monitoring & Equipment
8
PA Catheter - Clinical Aspects
a. no absolute indications
b. essentially a poor indicator of preload in severe diseasetrends of far greater value than isolated readingsderived data probably of greater benefit than PAoP
c. no improvement in outcome in CCU patients
d. no improvement in outcome in severe respiratory disease
e. some suggestive evidence for improved survival,i. in major postoperative and severely septic patients (Shoemaker)*
ii. perioperative MI < 3 months (Rao, El Etr)§
f. results depend upon the use of information derived
NB: *this improvement was not necessarily related to PA catheter§this was a none peer reviewed paper, subsequently claimed benefits withdrawn
Complications
NB: complication rate similar to CVC catheters,especially complications of insertion
1. principal complication = misuse & misinformation
2. minor complications commoni. arrhythmias - VEB's, AEB's, persistent VEB's
- transient RBBB, 3°HB- SVT
ii. haematomaiii. catheter thrombosis
3. major complications rarei. pulmonary infarction ≤ 7%ii. carotid puncture ~ 1-4%iii. infection ~ 1-2%iv. thrombotic endocardial vegetation ≤ 1%v. pneumothorax ~ 0.5%vi. PA rupture ~ 0.1%vii. valvular damageviii. papillary muscle damage
4. catheter knotting
5. bacteraemia / sepsis
6. balloon rupture
Monitoring & Equipment
9
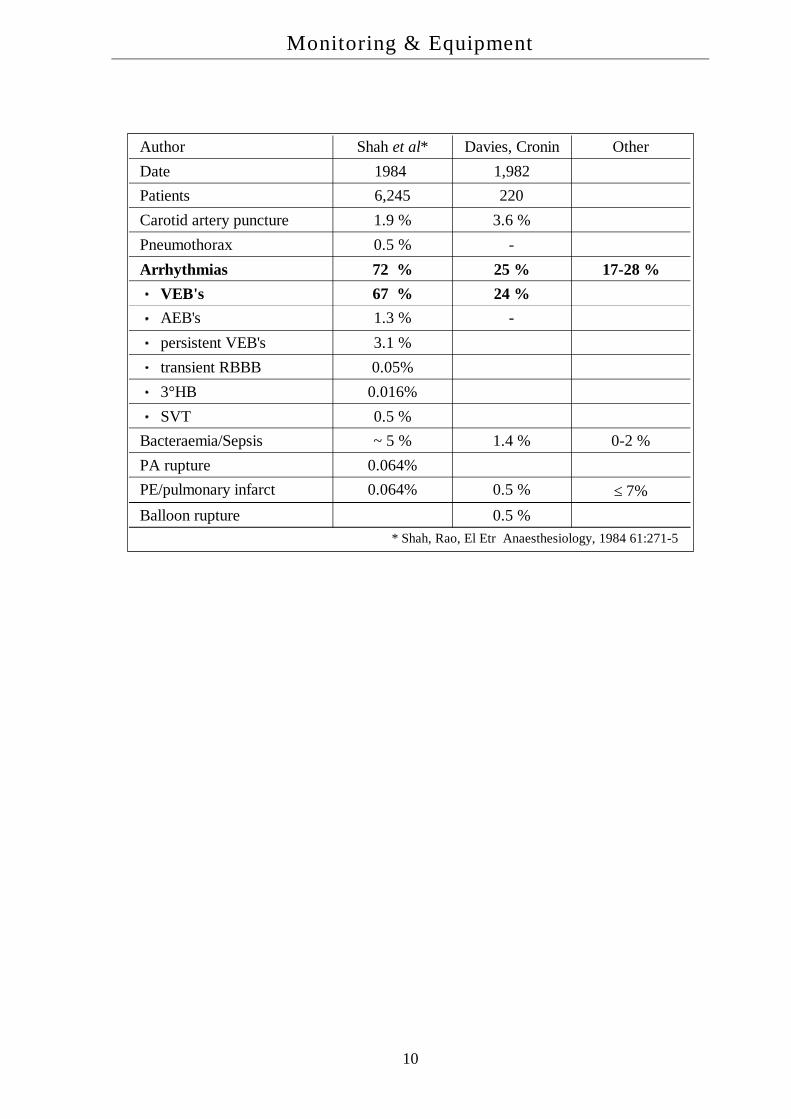
Author Shah et al* Davies, Cronin OtherDate 1984 1,982Patients 6,245 220Carotid artery puncture 1.9 % 3.6 %Pneumothorax 0.5 % -Arrhythmias 72 % 25 % 17-28 %
VEB's 67 % 24 %AEB's 1.3 % -persistent VEB's 3.1 %transient RBBB 0.05%3°HB 0.016%SVT 0.5 %
Bacteraemia/Sepsis ~ 5 % 1.4 % 0-2 %PA rupture 0.064%PE/pulmonary infarct 0.064% 0.5 % ≤ 7%Balloon rupture 0.5 %
* Shah, Rao, El Etr Anaesthesiology, 1984 61:271-5
Monitoring & Equipment
10

Pulmonary Capillary Pressure
Def'n: the effective pulmonary capillary pressure (PC ) = the dynamic pulmonarycapillary hydrostatic pressure, where,
PC = LAP + 0.4 x (PmPA - LAP) the Garr Equation
PC is determined by,
a. PA pressure
b. LAP
c. alveolar pressure
d. PEEP - increased LAP & PAP- increase in PC ~ 0.5 x PEEP
this is the pressure responsible for hydrostatic pulmonary oedema,
PAoP ~ LAP, but PAoP ≠ PC
→ PAoP < PC
where, PC is the "dynamic" pulmonary capillary pressurethis can be calculated upon occlusion of the PA tracing → bi-exponential decayextrapolating the second phase to time zero gives an intercept pressure, Pi where,
PC ~ PAoP + Pi
NB: alternatively, the pressure at the inflexion point of the decay curve ~ PC
Monitoring & Equipment
11

by these techniques it is possible to determine the predominant site of PVR in health and diseasestates,
1. PAP >> PC ~ PAoP → most PVR is precapillary
2. PAP > PC >> PAoP → most PVR is postcapillary
using this technique it has been demonstrated that,
1. most of the increase in PVR with histamine is postcapillary (ie. venous)
2. with 5HT most of the increase is precapillary
PA Catheters - Misleading Information
the primary assumption, that PAoP ~ LVEDP, holds true for 90-95% of "normal" subjectstolerance limits are ± 0-4 mmHgon balloon inflation, at time = 0, the systolic component is lost and PAoP ~ PADPthe pressure then falls away bi-exponentially to approach LAP, the rate of decay depending
upon,
a. diastolic time
b. pulmonary vascular resistance* *time constant = R x C
c. pulmonary vascular compliance*
NB: the value should be taken at end diastole and end expiration
Monitoring & Equipment
12

Potential Problems
1. PAoP > PCP up to 11 mmHg
i. tachycardia - inadequate time for EDP to equilibrate with LAPii. PA hypertension - hypoxia, hypercarbia, acidosis
- CAL- 1° PAH
→ prolongation of time constant
2. PAoP < PCP up to 7 mmHgi. RBBB - RV systole delayed, and
- septal movement interferes with PAEDP ii. hypovolaemia - increase non-zone 3 area
3. PCP > PVP (or LAP)i. pulmonary venous disease (fibrosis, tumour, anomalies) ii. PEEP > 10 cmH2O
4. LAP > LVEDPi. mitral valve disease, prosthetic valveii. atrial myxoma
5. LVEDP ≠ LVEDVaccuracy with which LVEDP represents LVEDV depends upon blood volume andthe compliance of the LVthis is non-linear in normals and displaced in disease statesdeterminants of LV compliance include,
i. LV wall thickness and diameterii. fibre stiffnessiii. pericardial pressure* *juxtacardiac pressureiv. intrathoracic pressure*
lowered compliance occurs in: - IHD, AMI- IHSS- fibrosis- LVH
raised compliance occurs in: - dilated LA or LV
6. LAP < LVEDP - aortic regurgitation
7. West's zone of placement
Monitoring & Equipment
13

other problems reading PA catheters are encountered with,
a. rapid heart rates - difficult to judge end-diastole- insufficient time for equilibrium
b. respiratory pattern - rapid rate, large tidal volumes- large intrathoracic pressure swings- difficult to judge end-expiration
c. digital readouts → - average pressure- where mean ≠ end-diastolic pressure
d. underdamping - small air bubbles < 0.25 ml
e. overdamping - large air bubbles- narrow, long tubing- catheter blockage
Correlation - PAoP & LAP (Sibbald, Raper)
generally a good correlation in postsurgical patients with no respiratory diseasethe correlation is poor with,
a. high levels of PEEP
b. hypovolaemia
c. acute respiratory failure
Monitoring & Equipment
14

Circumstances Where PAoP ≠ LAP
1. incorrect catheter placement
2. non-zone 3 position
3. incorrect transducer placement
4. over/under-damping
5. respiratory pressure artefact, PEEP
6. eccentric balloon inflation
7. balloon overinflation
8. obstructive airways disease (autoPEEP)
9. valvular heart disease
10. increased pericardial pressure
11. altered myocardial compliance
12. pulmonary venous obstruction
Circumstances Where LAP ≠ LVEDP
a. altered myocardial compliance - IHD- IHSS- AMI- aneurysm- fibrosis- LVH- dilated LA or LV
b. mitral valve disease
c. aortic regurgitation - falsely high PAoP
Circumstances Where LAP ≠ LVEDP
factors which influence this include,
a. LV compliance
b. RV diastolic volume (ventricular interdependence)
c. pericardial compliance
d. intrathoracic pressures
e. normal curvilinear relationship between EDP/EDV is volume dependent* steep vs. flat portion of the curve
Monitoring & Equipment
15

Correlation - Reasons why LVEDP ≠ LVEDV
a. myocardial fibre stiffness, compliance, varies
b. myocardial wall thickness varies
c. alterations in juxtacardiac pressures
NB: no animal, or human studies, have shown a consistent correlation betweenLVEDP & LVEDV,
therefore, "PAoP must be regarded as an unreliable index of LVEDV"
Beupre et al., Anaesth.'83, assessing LVEDA and PAoP,
1. linear regression with correlation coefficient, r = 0.3, for > 77% of measurements
2. in > 50% of measurements, the change was in the opposite direction
Sibbald et al., Chest '83, PAoP vs LVEDV by radionuclide LVEF and thermodilution COlinear regression essentially a scatter diagram, but multiple errors in calculation of LVEDVmore recent studies using TOE, PAoP versus LVEDA also show poor correlation
LV Compliance = LV Pressure/Volume Curve
decreased compliance → left shiftincreased compliance → right shift
a. LV preload
b. LV mass - LVH decreases compliance- chronic dilatation increases compliance
c. myocardial fibre stiffness - ischaemia- fibrosis, scar- infiltration, amyloid
d. RVEDV - cor pulmonale- increased PVR
e. hypoxia, temperature, osmolality, HR
f. vasopressors, vasodilators, inotropes, adrenergic blockers
ventricular interdependence depends upon,
a. RV size
b. septal shift
c. juxtacardiac pressure change - tamponade- high PEEP- effusion
Monitoring & Equipment
16
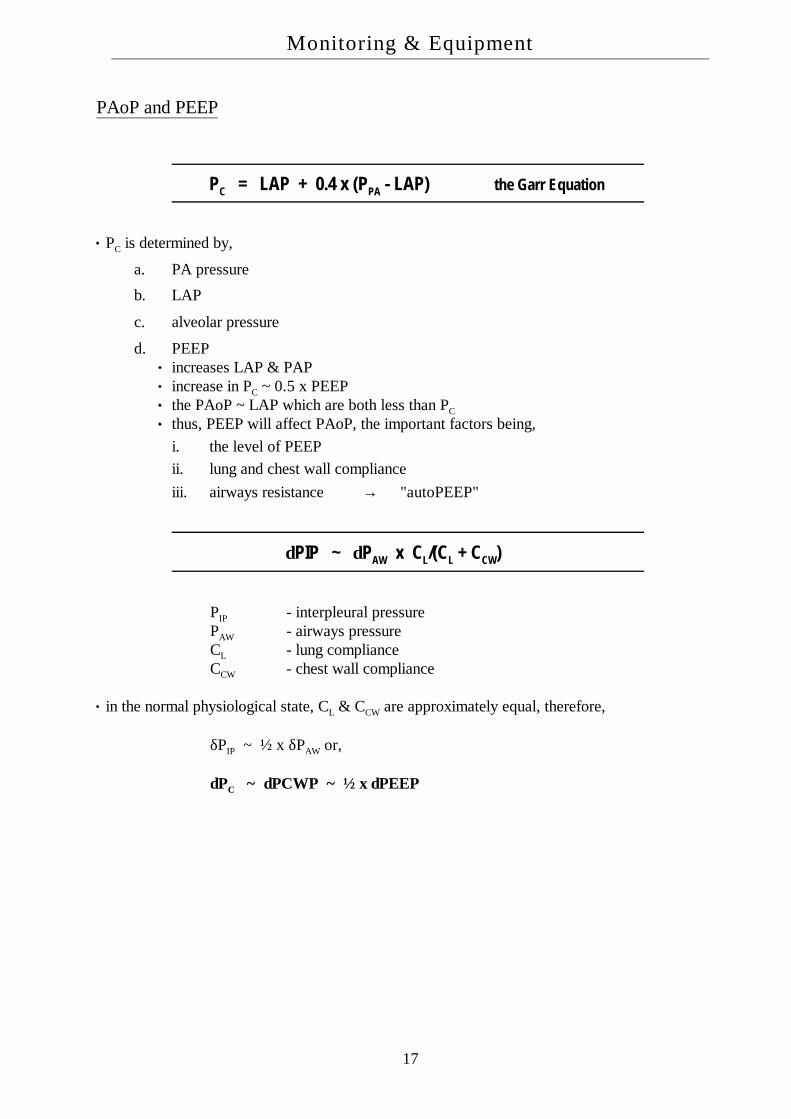
PAoP and PEEP
PC = LAP + 0.4 x (PPA - LAP) the Garr Equation
PC is determined by,
a. PA pressure
b. LAP
c. alveolar pressure
d. PEEPincreases LAP & PAPincrease in PC ~ 0.5 x PEEPthe PAoP ~ LAP which are both less than PC
thus, PEEP will affect PAoP, the important factors being,i. the level of PEEPii. lung and chest wall complianceiii. airways resistance → "autoPEEP"
δPIP ~ δPAW x CL/(CL + CCW)
PIP - interpleural pressurePAW - airways pressureCL - lung complianceCCW - chest wall compliance
in the normal physiological state, CL & CCW are approximately equal, therefore,
δPIP ~ ½ x δPAW or,
δPC ~ δPCWP ~ ½ x δPEEP
Monitoring & Equipment
17
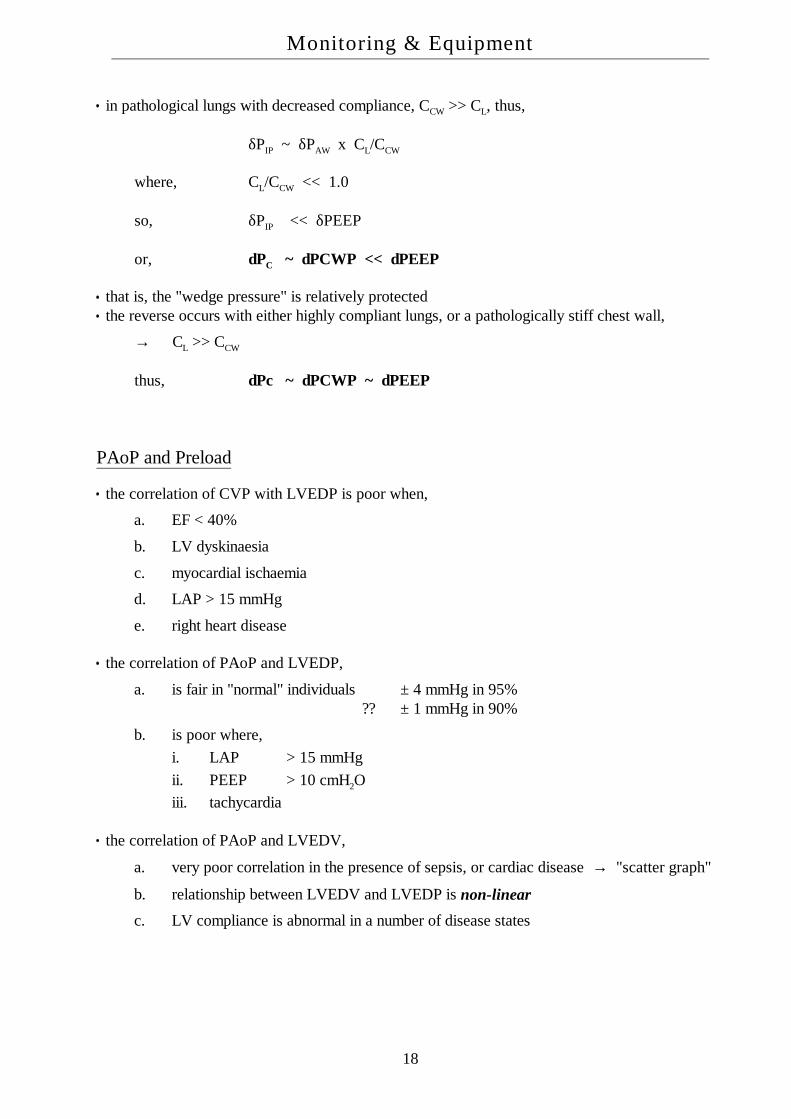
in pathological lungs with decreased compliance, CCW >> CL, thus,
δPIP ~ δPAW x CL/CCW
where, CL/CCW << 1.0
so, δPIP << δPEEP
or, δPC ~ δPCWP << δPEEP
that is, the "wedge pressure" is relatively protectedthe reverse occurs with either highly compliant lungs, or a pathologically stiff chest wall,
→ CL >> CCW
thus, δPc ~ δPCWP ~ δPEEP
PAoP and Preload
the correlation of CVP with LVEDP is poor when,
a. EF < 40%
b. LV dyskinaesia
c. myocardial ischaemia
d. LAP > 15 mmHg
e. right heart disease
the correlation of PAoP and LVEDP,
a. is fair in "normal" individuals ± 4 mmHg in 95%?? ± 1 mmHg in 90%
b. is poor where,i. LAP > 15 mmHgii. PEEP > 10 cmH2Oiii. tachycardia
the correlation of PAoP and LVEDV,
a. very poor correlation in the presence of sepsis, or cardiac disease → "scatter graph"
b. relationship between LVEDV and LVEDP is non-linear
c. LV compliance is abnormal in a number of disease states
Monitoring & Equipment
18
Causes of Increased LV Compliance
a. increased EDV (low EF, volume overload)
b. dilated cardiomyopathy
c. vasodilators(SNP, GTN, β-blockers)
Causes of Decreased LV Compliance
a. decreased EDV - improved EF, relief from volume overload
b. ischaemia
c. PEEP
d. increased RV afterload
e. hypotensive shock - hypovolaemia, sepsis
f. pericardial effusion
g. positive inotropes - β1-agonists
Factors Affecting PAOP in Critically Ill (Sibbald)
a. CVP and RVEDV - 80%
b. LVEDV - 10%
c. PVR - 10%
Monitoring & Equipment
19

Primary Data
NB: individual values are of little use, trends are more useful
a. PAoP as an indicator of oedemagenesisessentially a poor indicator of preload
b. PA pressures indicate degree of PAH
c. PvO2 indicates global O2 supply/demand
Derived Data
a. haemodynamic variablesCI, LVSWI, SVRqualitative information re cardiac and vascular functionsome quantitative information with trends
b. DO2 & VO2
rough guide to O2 supply and utilizationassessment of the effect of therapy
Monitoring & Equipment
20

Cardiac Output - Thermodilution
thermodilution introduced by Fegler 1954 in anaesthetised dogsinjection of a known volume of cold solution in RA & detection by thermister in proximal PAsome disagreement regarding extravascular losses of "coolth"however, distance between injection & detection should be as short as possible
a. V1 = volume of injectate
b. TB / I = blood / injectate temperatures
c. K1 = density factor= [specific heat . specific gravity].Injectate
[specific heat . specific gravity].Blood
d. K2 = adjustment factori. catheter dead spaceii. heat gain by injectateiii. injection rate (should ≤ 2-4s)
e. demoninator corresponds to area under thermodilution curve
NB: recirculation peak should be < 4% of maximum, 5-35 seconds later
CO = V1(TB − TI)K1K2
0∫∞ ∆TB(t)dt
Monitoring & Equipment
21

Errors of Measurement
a. injectate temperaturetheoretically the lower the better → ↑ S:N ratiomultiple studies have shown little advantage & room temperature OK
i. syringe rewarming↑ 1°C → ↑ CO ~ 2.9%TI increases ~ 1°C / 13s handling, ∴ aim at delivery within 30 secsideally, should measure TI at entry point on catheter
ii. loss to catheter wall - most important → K2~ 0.83, assuming 17% loss (catheter specific)
b. blood temperature - lower temperature → overestimation- rarely a problem
i. severe hypothermia and room temperature injectateii. inspiration of cold gases & decrease PA blood temperatureiii. rapid infusion of cold fluids
c. cardiac output ± 0.6% at 5.0 l/min± 2.0% at 4.0 l/min± 4.0% at 3.0 l/min± 7.5% at 2.0 l/min± 20 % at 1.0 l/min
d. volumethe larger the better, small volumes → overestimationhowever, larger volumes more difficult to inject as bolus
e. injectate time - K2 allows for 2-4 secs
f. timing of injectionvariation of CO & PA temperature with respiration and mode of ventilationwith IPPV, CO lower during inspirationvariation ~ 14% → average ≥ 3 readings
g. recirculation - only if frequent calculations, repeated over < 30 secs
h. catheter wedging → underestimation- also seen with catheter thrombosis
i. shuntsi. L → R - measured CO ~ RV output >> LVii. R → L - falsely high CO if injectate bypasses the thermister
j. pulmonary regurgitation - low output state- over & under-estimations may occur
k. diathermy - increased noise
Monitoring & Equipment
22

Summary - Causes of Overestimation
a. higher injectate temperature - room temp.- catheter wall- handling- low CO
b. lower blood temperature - hypothermia- infusion of cold fluids- IPPV with cold gases
c. low injectate volume
d. slow injection time
e. respiratory cycle - SV → inspiration- IPPV → expiration~ 10-15%
f. L → R shunt - overestimates effective forward LV flowR → L shunt - overestimates CO
g. incorrect K1/K2
Summary - Causes Of Underestimation
NB: = opposite of the above, plus
a. PA catheter wedging / thrombosis
b. rapid repetitive calculations
c. RV valve regurgitation (PI/TI)
Other Complications of CO Measurement = "Complications of PA Catheter"
a. technical - insertion- equipment- backup
b. infection - catheter- injection
c. hypothermia
d. thrombosis/pulmonary infarction
e. haemorrhage
Monitoring & Equipment
23
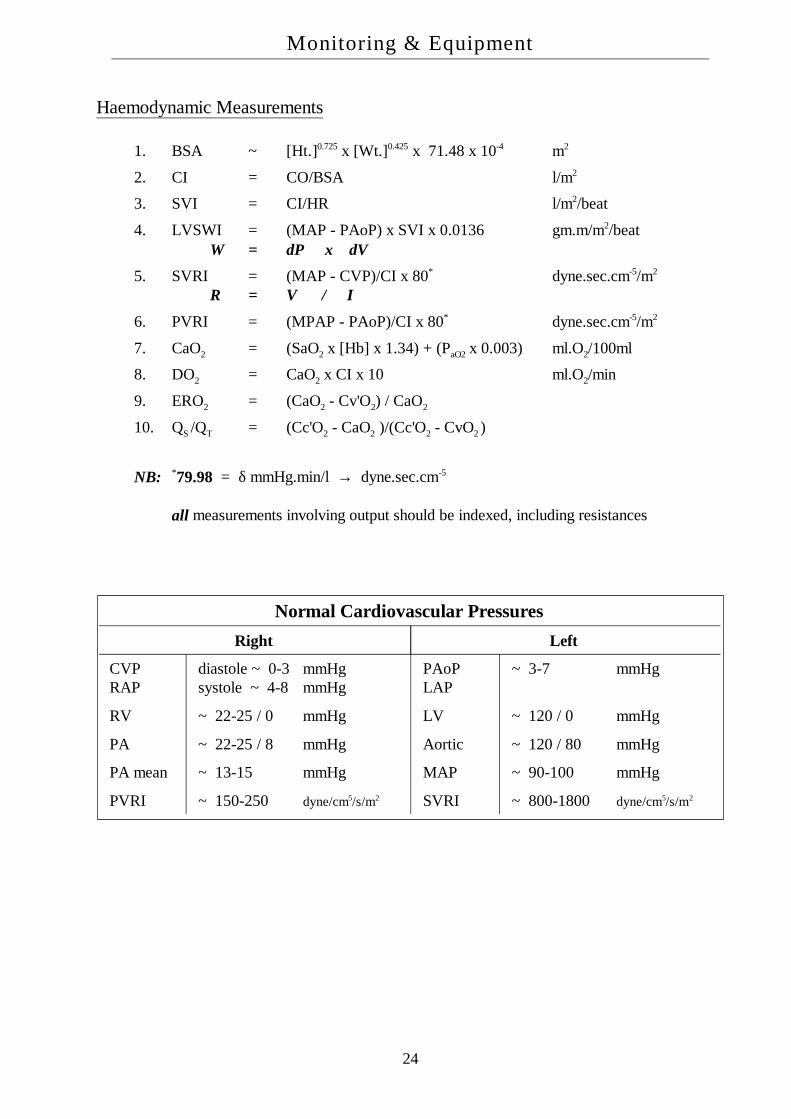
Haemodynamic Measurements
1. BSA ~ [Ht.]0.725 x [Wt.]0.425 x 71.48 x 10-4 m2
2. CI = CO/BSA l/m2
3. SVI = CI/HR l/m2/beat
4. LVSWI = (MAP - PAoP) x SVI x 0.0136 gm.m/m2/beatW = δP x δV
5. SVRI = (MAP - CVP)/CI x 80* dyne.sec.cm-5/m2
R = V / I
6. PVRI = (MPAP - PAoP)/CI x 80* dyne.sec.cm-5/m2
7. CaO2 = (SaO2 x [Hb] x 1.34) + (PaO2 x 0.003) ml.O2/100ml
8. DO2 = CaO2 x CI x 10 ml.O2/min
9. ERO2 = (CaO2 - Cv'O2) / CaO2
10. QS /QT = (Cc'O2 - CaO2 )/(Cc'O2 - CvO2 )
NB: *79.98 = δ mmHg.min/l → dyne.sec.cm-5
all measurements involving output should be indexed, including resistances
Normal Cardiovascular PressuresRight Left
CVPRAP
diastole ~ 0-3 mmHgsystole ~ 4-8 mmHg
PAoPLAP
~ 3-7 mmHg
RV ~ 22-25 / 0 mmHg LV ~ 120 / 0 mmHg
PA ~ 22-25 / 8 mmHg Aortic ~ 120 / 80 mmHg
PA mean ~ 13-15 mmHg MAP ~ 90-100 mmHg
PVRI ~ 150-250 dyne/cm5/s/m2 SVRI ~ 800-1800 dyne/cm5/s/m2
Monitoring & Equipment
24
BLOOD-GAS ELECTRODES
Glass pH Electrode
the circuit consists of,
a. a capillary tube of pH sensitive glass → δV ∝ pHCorning 015
b. anode - Ag/AgCl surrounded by buffer within pH sensitive glass tube
c. cathode - Hg/HgCl (Calomel) within KCl buffer
d. a "salt bridge" to allow Cl- ion flowblood sample interacts with glass & the cathode via the salt bridge
e. a surrounding water jacket at 37°C
f. a high impedance amplifier to measure gradientie. the amplifier should not interact with generated potentialgenerates potential difference
→ E = 61.5 x δpH
Severinghaus PCO2 Electrode
measurements are based on pH, due to the dissociation of carbonic acidthe PCO2 is therefore related to the [H+]the Severinghaus CO2 electrode provides a direct measure of PCO2 from the change is pHthe circuit consists of,
a. a closed cylinder of pH sensitive glass in the centre
b. 2 electrodes, 1 inside, the other outside the cylinder
c. a surrounding solution of sodium bicarbonate
d. a thin film of bicarbonate impregnated nylon mesh covering the end of the cylinder
e. a thin, CO2 permeable membrane covering the end of the electrode
at the end of the electrode CO2 diffuses from the blood sample through the membrane into thenylon mesh and by the formation of carbonic acid lowers the pH of the bicarbonate solution
this change in pH alters the δV across the glasspH changes such that,
δpH ∝ δlog10PCO2
the output of the voltmeter can be calibrated in terms of PCO2
the electrode has an accuracy ~ 1 mmHgthe response time ~ 2-3 minsas for the pH electrode, the CO2 electrode must be kept at 37°C and regularly calibrated with
known concentrations of CO2
Monitoring & Equipment
25

Clark - Polarographic O2 Electrode
the circuit consists of,
a. DC voltage source ~ 0.6 V
b. an ammeter
c. anode Ag/AgCl → Ag + Cl- → AgCl + e-
d. cathode platinum → O2 + 4e- + 2H2O → 4(OH-)
e. an electrolyte solution (KCl, ?KOH) and O2-permeable membrane
separated from the sample by a gas permeable membraneas for any resistive circuit as the voltage is increased the current will increase proportionatelythe above circuit → a plateau voltage range over which the current does not increase with
increasing voltage, however does increase with an increasing PO2 in the cellO2 is consumed in the reaction and the current produced is proportional to the sample PO2
the platinum electrode cannot be inserted directly into the blood stream as protein deposits forman affect its accuracy
factors apart from O2 which affect the current generated include,
1. the age of the membrane
2. the condition of the buffer solution
3. temperature
→ should be calibrated prior to use~ 3% accuracy at 50% O2
the response time is ~ 30-60 seconds, therefore not used for breath-to-breath analysissome specially designed units, with electronic enhancement → 0.25s response timeunlike fuel cells they don't deteriorate when exposed to air, however, their shelf-life is limited by
the life of the membrane and the buffer solution → ∼ 6 months
Monitoring & Equipment
26

Other Methods of Oxygen Measurement
Oxygen Fuel Cell
effectively an O2 limited gold/lead battery, consisting of,
a. an ammeter
b. a mesh gold cathode → O2 + 2H2O + 4e- → 4OH-
c. a lead anode → Pb + 2(OH-) → PbO + H2O + 2e-
d. a compensating thermistor
e. an electrolyte solution (KCl) and O2-permeable membrane
thus, current flow depends upon the uptake of oxygen at the cathodeunlike the Clarke electrode, the fuel cells requires no external power sourcehowever, like other batteries, the fuel cell will eventually expire
Paramagnetic Oxygen Analysis
oxygen is paramagnetic and is therefore attracted into a magnetic fieldthis is due to the unpaired outer shell electrons of the oxygen moleculemost other gases, such as N2, are weakly diamagnetic and are repelled from a magnetic fieldactually measures oxygen concentrationproblems with use include,
1. they require calibration before use with 100% N2 and 100% O2
2. the presence of water vapour biases the result,therefore gases should be dried through silica gel before analysis
3. they are not well suited to continuous analysis, ie. breath-to-breath analysisflows > 100 ml/min through the chamber affect accuracy
4. limited response time doesn't allow breath-to-breath analysis
their advantages include,
1. O2 specific
2. don't wear-out
Monitoring & Equipment
27

Hummel Cell
based upon the paramagnetic principal & used in the Datex instrumentsthe sample gas and an air reference are drawn into a magnetic field through a T-pieceeach sample line is connected in parallel to a sensor chamber, where the differential pressure is
measured across a diaphragmin the resting state both sample lines are at equal pressure, however as a magnetic field is induced
across the T-piece sample set, each gas (air & sample) is "held-up" in proportion to the O2 contentthis then results in a pressure differential within the sensor chamberby oscillating the magnetic field the sensor diaphragm also oscillates, in proportion to the O2
content of the sample gasthe diaphragm effectively acting as a microphone, with the amplitude reflecting %O2
PO2 Optode
based on the principle of photoluminescence quenchingwhen light shines on luminescent material, electrons are excited to higher energy states and on
their return emit light at characteristic wavelengthsthis excited electron can also return to its original energy state by interacting with an oxygen
molecule, increasing the vibrational and rotational energy of the laterfor such photoluminescent quenching dyes, the amount of oxygen present can be related to the
luminescent intensity by the Stern-Volmer equation,
where, I = the luminescent intensity at a PO2
I0 = the intensity in the absence of O2
k = the quenching constant for the dye
the advantages of this system are its simplicity and size, which allow intra-arterial insertion andmeasurement
pH-sensitive dyes are also available, therefore , a three optode sensor can measure PO2, PCO2 andpH simultaneously
IPO2 = I0
1+ (k.PO2)
Monitoring & Equipment
28

PULSE OXIMETRY
Kramer optically measured the O2 in arteries of animals in the early 1930'sKarl Matthes in 1936 was the first to measure O2 from transmission of red and blue-green light
through the human earthe term oximeter was coined by Millikan et al. in the 1940'sthey developed a lightweight oximeter, a smaller version of Matthes' design, which measured
SpO2 by transillumination of the earlobe using red & green filters covering Kramer's photocellsthe signal detected from the photocell under the green filter later proved to be in the IR rangethere were two technical problems with this approach,
a. there are many non-Hb light absorbers in tissue
b. the tissues contain capillary & venous blood in addition to arterial blood
these were overcome by first measuring the absorbance of the ear while it was compressed toremove all blood
after this bloodless "baseline" measurement the ear was heated to "arterialise" the bloodthis device was shown to accurately predict intraoperative desaturations, however, due to the
technical difficulties was never adopted on mass
Development
in the early 1970's, the Japanese engineer Takuo Aoyagi was working on a dye dilution methodfor CO, using an earpiece densitometer
he noted that the pulsatile components of the red & IR absorbances were related to the SpO2
his prototype, built by Nihon Khoden, was tested clinically in 1973 and the first commercialprototype was available in 1974
however, further refinements were required and widespread use did not eventuate until the early1980's
Nomenclature
1. SaO2 = 100.(O2 content)/(O2 capacity)arterial blood saturation measured in vitroO2 content ≠ 1.39 x [Hb], but the amount of O2 which can combine with reducedHb, without removing COHb or MetHb when they are presentthus, at high PaO2 the SaO2 = 100%, irrespective of the [COHb + MetHb]
2. HbO2 = oxyhaemoglobin concentration (fraction or %)multiwavelength spectrometers measure all Hb species as fractions or percentagesof the total [Hb] = HHb + O2Hb + COHb + MetHbthis has been inappropriately termed "fractional saturation" SaO2 computed from PO2 and pH approximates SaO2, not HbO2
3. SpO2 = pulse oximeter saturation
Monitoring & Equipment
29

Methodology
2 wavelengths of light,
1. red = 660 nm
2. IR = 910-940 nm
the signal is divided into two components,
a. ac = pulsatile arterial blood
b. dc = tissue + capillary blood + venous blood + non-pulsatile arterial blood
NB: all pulse oximeters assume that only the pulsatile absorbance is arterial blood
for each wavelength, the oximeter determines the ac/dc fraction, which is independent of theincident light intensity = pulse added absorbance
then the ratio (R) of these is calculated,
R = (ac absorbance/dc absorbance)Red (ac absorbance/dc absorbance)IR
= A660nm / A940nm
this value varies from,
a. SaO2 = 100% R = 0.4 (0.3)
b. SaO2 = 85% R = 1.0
c. SaO2 = 0% R = 3.4 (4.87) - Severinghaus
being a 2 wavelength device, the pulse oximeter assumes that there are only two light absorbingHb species in arterial blood
the photo-detector diodes of the sensor will also register ambient lightthis interference is reduced by cycling the light signal from red only → infrared only → both offthis is repeated at 480-1000 Hz in an attempt to subtract the ambient light signal, even when this
is oscillatingthis allows accurate estimation of SaO2 at arterial pulse frequencies ~ 0.5-4 Hz (30-240 bpm)data is averaged over several cycles
Monitoring & Equipment
30
Uses of Pulse Oximetry
Monitoring Oxygenation
1. anaesthesia & recovery
2. intensive carei. non-invasive monitoring of - all ventilated patients
- during weaning- respiratory / cardiac failure
ii. risk of oxygen toxicity - neonates- chemotherapy, radiotherapy- paraquat poisoning
iii. avoidance of repeated AGA's
3. emergency care & transporti. labourii. premature & newborn infantsiii. home & hospital monitoring for SIDSiv. patients in remote locations - XRay, MRIv. "office" procedures - dentistry, endoscopy
Monitoring Circulation
1. systolic BP & pleth waveform appearance *inflation better than deflation
2. sympathetic blockade with central neuraxis anaesthesia
3. autonomic dysfunction with valsalva manoeuvre
4. anecdotally reported uses - patency of the ductus arteriosus- level of ischaemia in PVD- patency of arterial grafts- circulation in reimplanted digits or grafts
Other
1. optimisation of home O2 therapy
2. sleep studies
3. research
Monitoring & Equipment
31

Limitations of Pulse Oximetry
1. SpO2 does not indicate oxygenation unless [Hb] and CO are known
2. insensitive to directional changes in PaO2 above 80 mmHg
3. due to automatic gain, oximetry is relatively insensitive to perfusion
4. errors of saturation estimationi. signal to noise ratio - vasoconstrictors
- shock or hypothermia, low perfusion pressure- automatic gain
ii. motion artefact ~ 0.5-4 Hz range- improved by coupling with the ECG signal
iii. light artefactiv. dyshaemoglobins
COHb indistinguishable from HbO2, ∴ artefactually high readingMetHb absorbance in high at both A660nm & A940nm → forces R → 1.0
v. anaemia ≤ 15% low error with Hb < 8.0 g/dlvi. intravenous dyes - methylene blue and indocyanine greenvii. pigments - pigmented races → ↑ false high readings
- nail polish ↓ transmitted light & may result in failureviii. abnormal pulses
venous waves - TI, reflectance operationventilation - a large paradox may lead to searching
ix. probe variability errorsx. probe position → the "penumbra effect"xi. electrocautery - most unit are now immunexii. MRI interference - rare, usually probe lead distorts MRI image
e. reading failureFreund et al. ~ 1.12% failure (cumulative > 30 mins) in 11,046 anaestheticsGilles et al. ~ 1.1% incidence (2 x 15 mins) in 1,403 anaesthetics
Monitoring & Equipment
32

Patient Safety
multiple studies showing superiority of oximetry to clinical judgement in detecting desaturationas yet, no published paper has shown a statistically significant reduction in morbidity and
mortality resulting from the use of oximetrymajor problems relating to the detection of desaturation relate to,
1. what level of desaturation is unacceptable?
2. for how long is this unacceptable?
3. in whom do these limits apply?
SpO2 cycling repeatedly down to 30-40% has been recorded during sleep, without detectableend-organ damage, on both,
1. chronic mountain dwellers with polycythaemia
2. obese patients with obstructive sleep apnoea syndrome
Cote et al. Anesth.1988 showed that at least 50% of desaturations, SpO2 < 75% were clinicallyundetected in children, hence praised use of SpO2
however, no morbidity was documented in any patient, in either group resulting from hypoxiaMoller et al., Anesth.1991, looking prospectively at 20,802 cases in which half were monitored
by SpO2, failed to show any reduction in morbidity or mortality, except for a decreased incidenceof intraoperative myocardial ischaemia (?? this would seem contradictory)
the ASA Closed Claims Project, in reviewing 348 "preventable" deaths or injuries, came to theconclusion that "pulse oximetry....would have been efficacious in preventing injury in 138 cases."
using the ASA data, Caplan described 14 cases of arrest under spinal anaesthesia, 12 of whomhad IV sedation/opioids without SpO2 monitoring and hypoxia was believed to contribute
Eichorn, Anesth.1989, looked at 1,001,000 ASA I&II patients between 1976-1988 and foundthat,
1. 11 major anaesthesia related incidents, of which 7-8 related to inadequate O2
2. only 1 of these occurred after the introduction of SpO2 in mid-'85
this paper was accompanied by an editorial by Orchin, which pointed-out that this was notstatistically significant, and this, nor any other paper had yet shown a clear cost-benefit justificationfor the use of pulse oximetry
NB: Severinghaus concludes, "pulse oximetry probably did contribute to increasing thesafety of anaesthesia...however, this change may have come through the device'seducational role in promoting vigilance and awareness of inadequacies intechnique"
Monitoring & Equipment
33

SpO2 PaO2 Clinical example100 % > 250 mmHg FiO2 = 40%97.5 % 100 mmHg arterial, young adult96 % 80 mmHg arterial, elderly
venous from skin93 % 70 mmHg respiratory failure91 % 60 mmHg venous, exercising muscle
85 % 50 mmHg cyanosis may be visible75 % 40 mmHg mixed venous blood
central cyanosis if [Hb] = 2072 % central cyanosis if [Hb] = 1866 % central cyanosis if [Hb] = 1550 % 26 mmHg P50 of HbO2 curve32 % 20 mmHg coronary sinus blood
Cytochrome aa3 Saturation Monitoring
this enzyme is distal in the cytochrome oxidase chain and contains copperwhen oxidised this enzyme has an absorbance peak ~ 830 nm in the near infrared rangeas this wavelength is absorbed by both Hb & HbO2, simultaneous estimation of these must be
carried out and three wavelengths must be usedthe device for measuring this, the Niros scope = near infrared oxygen sufficiency scopeuses powerful laser diodes with sufficient light intensity to penetrate the skulleffectively only measures saturation in the superficial cortical layers
Monitoring & Equipment
34

CAPNOGRAPHY - ETCO 2
continuously monitors ETCO2 by either,
a. in line sampling
b. aspiration sampling
use infrared light at a wavelength ~ 4.28 nmin steady state conditions ETCO2 ~ PaCO2 (δ = 2-8 mmHg)uses include,
a. respiratory monitoring in ICU/anaesthesiai. ETT positionii. ventilation adequacyiii. disconnect alarmiv. emboli (especially air)
b. control of PaCO2 (hyperventilation in head injury)
c. monitoring of muscle paralysis during anaesthesia
d. adequacy of cardiac massage during CPR
e. sleep apnoea study
f. research
causes of a low ETCO2 include,
a. hyperventilation
b. hypovolaemia, hypotension
c. pulmonary embolus - air, fat, amniotic fluid, thrombi, etc.
d. IPPV and PEEP
e. anaesthesia, muscle paralysis
f. hypothyroidism
g. hypothermia
h. posture change from supine - upright/lateral
Monitoring & Equipment
35

causes of a high ETCO2 include,
a. hypoventilation - respiratory failure- narcotics
b. increased CO2 production - IV HCO3-
- trauma- sepsis, pyrexia- MH- hyperthyroidism, storm- MOSF
c. recovery after low CO state - post cardiac arrest- post-hypovolaemia
d. increased VD with fixed VM - anatomical, physiological- apparatus
e. increased inspired CO2
Monitoring & Equipment
36

GASTRIC INTRAMUCOSAL pHi
Tonometric Method
pHi is obtained indirectly from,
1. measuring PCO2 of the gut lumen with a silicone balloon tonometer
2. HCO3- level of arterial blood
3. subsitiution of these into the Henderson-Hasselbach equation
this measurement is based on the assumptions,
1. superficial mucosal PCO2 is in equilibrium with luminal contentsmocosal tissue presents a definite barrier to CO2 diffusion & gradients can existdifferences should be small in the most superficial layers
2. tissue [HCO3-] is in equilibrium with arterial blood
residual food in the stomach will stimulate acid secretion & raise the intramucosal[HCO3
-], ∴ gastric acid secretion must be inhibited for the assumption to holdvalidation studies by Antonsson (AJP, 1990) supported correlation under conditionsof low-flow, no-flow, sepsis, anaphylaxis
3. the pKA' for the H-H equation is the same as for plasma
these correlate well with microprobe samples in normally perfused animals (r = 0.945)however, under conditions of low flow, especially no-flow, pHi underestimates the severity of
tissue acidosisthis dissociation appears to be a linear function of the rate of decline of intramucosal pH
NB: pHi provides an accurate & reproducible measure of actual pHin the most superficial layers, but not of the submucosal space
acid secretion & generation of an alkaline tide must be inhibited for the assumptionthat interstitial and arterial [HCO3
-] are equal
Determinants of pHi
intramucosal acidosis may theoretically result from,
1. back-diffusion of acid, CO2 or both
2. systemic metabolic acidosis
3. local tissue acidosisi. ↑ VO2
ii. reduced mucosal perfusion / DO2
pHi = 6.1 + logHCO3
− PCO2 ×0.031
Monitoring & Equipment
37

back-diffusion of protons appears to be clinically insignificantintraluminal production of CO2 is directly proportional to the amount of acid entering the
duodenum and being bufferred with pancreatic HCO3-
this may be reduced by,
a. aspirating acidic gastric contents
b. administration of a H2-receptor antagonist or proton pump inhibitor
main sources of acid in normoxic tissues,
a. CO2 generated from oxidative phosphorylation ~ 15,000 mmol/d
b. ADP + H+ generated from ATP hydrolysis ~ 150,000 mmol/dcf. ~ 150 mmol/d excreted by the kidney (0.1%)
under conditions of no-flow, H+ generation is greater than ATP hydrolysis, presumable due tometabolism of other high energy phosphate compounds
these H+ ions are then buffered, producing the intramucosal ↑ PCO2 seen in hypoxiathe increased VO2 seen in septic patients is met by an increase in DO2
→ supply being demand-dependent
changes in ERO2 seen in critical illness, do not appear to contribute significantly to intramucosalPCO2 , as pHi bears little/no relationship to ERO2
in animal experiments, pHi remains in normal limits as DO2 is decreased, either by hypoperfusionor hypoxaemia, until the critical point is reached at which supply-dependency develops
this occurs at a higher level in septic models, and endotoxin will decrease pHi in normallyperfused models
the Fick principal would dictate that mucosal PCO2 should rise in proportion to decreased flow,due to failure of CO2 removal, however this is not supported by animal models
therefore, the dominant mechanism for PCO2 rise is the buffer principal, that CO2 originates frombuffering of H+ ions
NB: pHi is indicative of mucosal oxygenation, and an abnormally low pHi provides anindex of the inadequacy of mucosal oxygenation present
quantification of dysoxia,
1. pH-gap pHa - pHi
2. standardized pH 7.4 - log( PtCO2 / PaCO2 )
others have used the tonometric PCO2 alone
Monitoring & Equipment
38

HUMIDIFICATION - IDEAL FEATURES
a. inspired gas delivered to trachea at - 32-36°C- 90-100% humidity
b. no fluctuation of set temperature & humidity with - time- high gas flows- gas composition
c. simple to use, service & sterilise
d. low resistance to gas flow - useful for SV & IPPV≤ 5 cmH2O/l/min at 50 l/min
e. low compliancei. neonate < 1 ml/cmH2Oii. child < 3 ml/cmH2Oiii. adult < 5 ml/cmH2O
f. low dead space
g. inbuilt alarms for - high/low temperature- over/underhydration
h. protection against - microshock (Class A)- scalding, overheating- "rain out"- dehydration/overhydration- "drowning"
i. maintenance of sterility
Complications - Dangers
a. infection
b. drowning
c. burns
d. electrocution
Monitoring & Equipment
39

Nasogastric Tubes
Indications
a. decompression of the stomachair, fluid, drug ingestion, foodbowel obstruction, ileus, pyloric stenosis, SMA syndrome, etcprior to intubationto assist SV in infants (removal of air)
b. drug administration - antacids, charcoal, antibiotics
c. enteral feeding - impaired swallowing/reflexes
d. diagnostic tool - ruptured aorta- barium studies- mucosal pH
e. gastric aspiration and lavage - poisoning- hyperthermia
Complications
a. during insertioni. incorrect placement - trachea, bronchus, mediastinumii. inability to insertiii. haemorrhageiv. perforation - nasal mucosa, oesophagus
b. during usei. ulceration - pharynx, oesophagus, stomachii. patient discomfortiii. difficulty swallowingiv. infection - gastric microaspiration
- sinusitisv. macroaspiration - incompetent LOSvi. extragastric "therapy" - enteral feeding etc.
- lung, mediastinum, pleural spacevii. metabolic - metabolic alkalosis
- hypokalaemia- fluid loss
Monitoring & Equipment
40

Nerve Supply - Nose
a. anterior ethmoidal nerve - anterior and upper septum- anterior roof- anterior parts of middle & inferior chonchae- anterolateral wall
b. infraorbital nerve - vestibule
c. anterior superior dental n. - ant. lower septum & floor- ant. lower portion of the lateral wall
d. pterygopalantine ganglion branches - post. 3/4 of septum, roof, floor, and lateral wall
e. nerve of pterygoid canal - upper & post. roof & septum
f. olfactory nerve - olfactory area
Septum: anterior ethmoidal nerve - anteriorlyshort sphenopalantine - superoposteriorlong sphenopalantine - posterior
Lateral Wall: anterior ethmoidal nerve - anteriorlyshort sphenopalantine - upper/middle chonchaegreater palantine - inferior chonchaant. sup. dental nerve - inf. choncha & floor
Monitoring & Equipment
41

Transoesophageal Echocardiography
Advantages
1. relatively noninvasive, low risk procedure in anaesthetised patients
2. excellent image quality
3. no interference with surgical field
4. stable continuous cardiac monitoring
Clinical Uses
1. global and regional cardiac function
2. monitoring for myocardial ischaemia
3. assessment of valvular function and integrity
4. assessment of anatomical abnormalitiesi. atrial myxomaii. valvular vegetationsiii. mural thrombiiv. calcific disease
5. detection of embolisation - air, fat, thrombi, other
6. assessment of aortic dissection
Indications
1. optimisation of LV preload in patients at risk of decompensationi. severe LV or valvular dysfunctionii. major vascular, thoracic or other surgery
2. monitoring for myocardial ischaemia
3. monitoring and assessment of valve replacement surgery
4. monitoring for VAE, or other embolisation
5. assessment of myocardial anatomy
Contraindications
1. operator inexperience
2. oesophageal disease - tumour- stricture, previous surgery- varices
Monitoring & Equipment
42