Monitoring Cerebral Blood Flow and Oxygen, Glucose, Lactate and Ammonia...
13
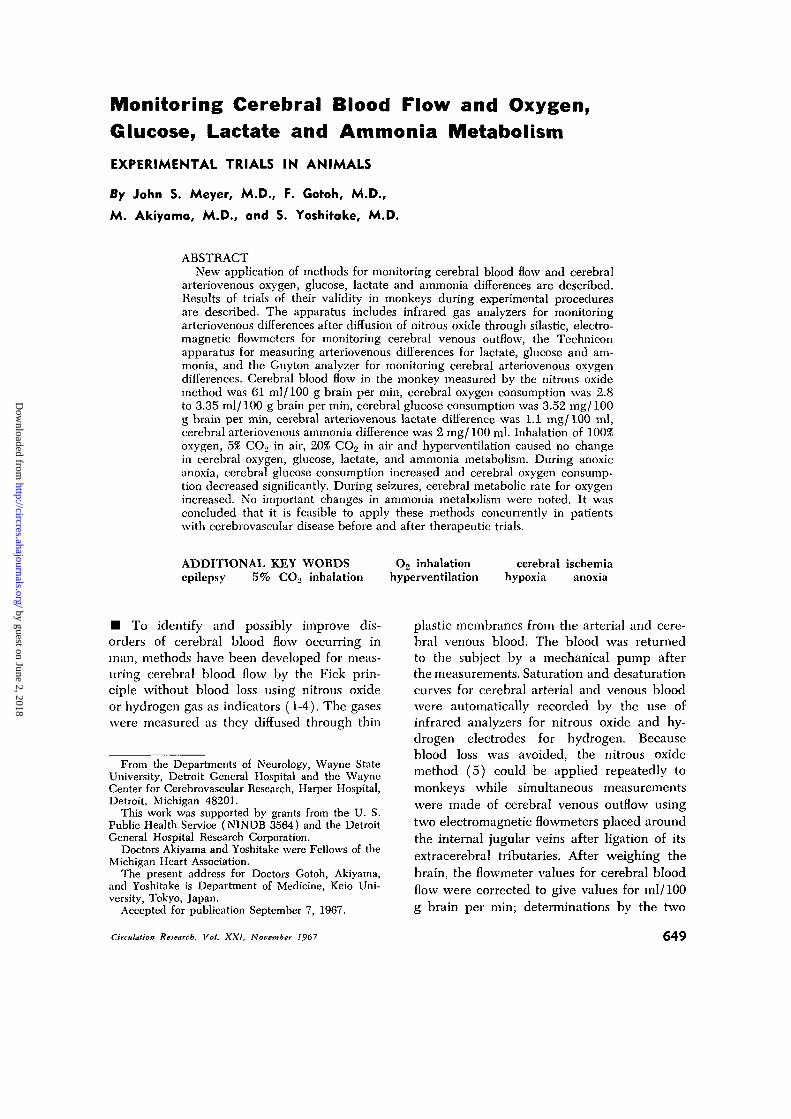
Monitoring Cerebral Blood Flow and Oxygen, Glucose, Lactate and Ammonia Metabolism EXPERIMENTAL TRIALS IN ANIMALS By John S. Meyer, M.D., F. Gotoh, M.D., M. Akiyoma, M.D., and S. Yoshitake, M.D. ABSTRACT New application of methods for monitoring cerebral blood flow and cerebral arteriovenous oxygen, glucose, lactate and ammonia differences are described. Results of trials of their validity in monkeys during experimental procedures are described. The apparatus includes infrared gas analyzers for monitoring arteriovenous differences after diffusion of nitrous oxide tiirough silastic, electro- magnetic flowmeters for monitoring cerebral venous outflow, the Technicon apparatus for measuring arteriovenous differences for lactate, glucose and am- monia, and the Guyton analyzer for monitoring cerebral arteriovenous oxygen differences. Cerebral blood flow in the monkey measured by the nitrous oxide method was 61 ml/100 g brain per min, cerebral oxygen consumption was 2.8 to 3.35 ml/100 g brain per min, cerebral glucose consumption was 3.52 mg/100 g brain per min, cerebral arteriovenous lactate difference was 1.1 mg/100 ml, cerebral arteriovenous ammonia difference was 2 mg/100 ml. Inhalation of 100% oxygen, 5% CO 2 in air, 20% CO 2 in air and hyperventilation caused no change in cerebral oxygen, glucose, lactate, and ammonia metabolism. During anoxic anoxia, cerebral glucose consumption increased and cerebral oxygen consump- tion decreased significantly. During seizures, cerebral metabolic rate for oxygen increased. No important changes in ammonia metabolism were noted. It was concluded that it is feasible to apply these methods concurrently in patients with cerebrovascular disease before and after therapeutic trials. ADDITIONAL KEY WORDS epilepsy 5% CO 2 inhalation O 2 inhalation hyperventilation cerebral ischemia hypoxia anoxia • To identify and possibly improve dis- orders of cerebral blood flow occurring in man, methods have been developed for meas- uring cerebral blood flow by the Fick prin- ciple without blood loss using nitrous oxide or hydrogen gas as indicators (1-4). The gases were measured as they diffused through thin From the Departments of Neurology, Wayne State University, Detroit General Hospital and the Wayne Center for Cerebrovascular Research, Harper Hospital, Detroit, Michigan 48201. This work was supported by grants from the U. S. Public Health Service (NINDB 3564) and the Detroit General Hospital Research Corporation. Doctors Akiyama and Yoshitake were Fellows of the Michigan Heart Association. The present address for Doctors Gotoh, Akiyama, and Yoshitake is Department of Medicine, Keio Uni- versity, Tokyo, Japan. Accepted for publication September 7, 1967. plastic membranes from the arterial and cere- bral venous blood. The blood was returned to the subject by a mechanical pump after the measurements. Saturation and desaturation curves for cerebral arterial and venous blood were automatically recorded by the use of infrared analyzers for nitrous oxide and hy- drogen electrodes for hydrogen. Because blood loss was avoided, the nitrous oxide method (5) could be applied repeatedly to monkeys while simultaneous measurements were made of cerebral venous outflow using two electromagnetic flowmeters placed around the internal jugular veins after ligation of its extracerebral tributaries. After weighing the brain, the flowmeter values for cerebral blood flow were corrected to give values for ml/100 g brain per min; determinations by the two Circulation Research, Vol. XXI, November 1967 649 by guest on June 2, 2018 http://circres.ahajournals.org/ Downloaded from
-
Upload
nguyenthuy -
Category
Documents
-
view
228 -
download
4
Transcript of Monitoring Cerebral Blood Flow and Oxygen, Glucose, Lactate and Ammonia...
Monitoring Cerebral Blood Flow and Oxygen,Glucose, Lactate and Ammonia Metabolism
EXPERIMENTAL TRIALS IN ANIMALS
By John S. Meyer, M.D., F. Gotoh, M.D.,
M. Akiyoma, M.D., and S. Yoshitake, M.D.
ABSTRACTNew application of methods for monitoring cerebral blood flow and cerebral
arteriovenous oxygen, glucose, lactate and ammonia differences are described.Results of trials of their validity in monkeys during experimental proceduresare described. The apparatus includes infrared gas analyzers for monitoringarteriovenous differences after diffusion of nitrous oxide tiirough silastic, electro-magnetic flowmeters for monitoring cerebral venous outflow, the Techniconapparatus for measuring arteriovenous differences for lactate, glucose and am-monia, and the Guyton analyzer for monitoring cerebral arteriovenous oxygendifferences. Cerebral blood flow in the monkey measured by the nitrous oxidemethod was 61 ml/100 g brain per min, cerebral oxygen consumption was 2.8to 3.35 ml/100 g brain per min, cerebral glucose consumption was 3.52 mg/100g brain per min, cerebral arteriovenous lactate difference was 1.1 mg/100 ml,cerebral arteriovenous ammonia difference was 2 mg/100 ml. Inhalation of 100%oxygen, 5% CO2 in air, 20% CO2 in air and hyperventilation caused no changein cerebral oxygen, glucose, lactate, and ammonia metabolism. During anoxicanoxia, cerebral glucose consumption increased and cerebral oxygen consump-tion decreased significantly. During seizures, cerebral metabolic rate for oxygenincreased. No important changes in ammonia metabolism were noted. It wasconcluded that it is feasible to apply these methods concurrently in patientswith cerebrovascular disease before and after therapeutic trials.
ADDITIONAL KEY WORDSepilepsy 5% CO2 inhalation
O2 inhalationhyperventilation
cerebral ischemiahypoxia anoxia
• To identify and possibly improve dis-orders of cerebral blood flow occurring inman, methods have been developed for meas-uring cerebral blood flow by the Fick prin-ciple without blood loss using nitrous oxideor hydrogen gas as indicators (1-4). The gaseswere measured as they diffused through thin
From the Departments of Neurology, Wayne StateUniversity, Detroit General Hospital and the WayneCenter for Cerebrovascular Research, Harper Hospital,Detroit, Michigan 48201.
This work was supported by grants from the U. S.Public Health Service (NINDB 3564) and the DetroitGeneral Hospital Research Corporation.
Doctors Akiyama and Yoshitake were Fellows of theMichigan Heart Association.
The present address for Doctors Gotoh, Akiyama,and Yoshitake is Department of Medicine, Keio Uni-versity, Tokyo, Japan.
Accepted for publication September 7, 1967.
plastic membranes from the arterial and cere-bral venous blood. The blood was returnedto the subject by a mechanical pump afterthe measurements. Saturation and desaturationcurves for cerebral arterial and venous bloodwere automatically recorded by the use ofinfrared analyzers for nitrous oxide and hy-drogen electrodes for hydrogen. Becauseblood loss was avoided, the nitrous oxidemethod (5) could be applied repeatedly tomonkeys while simultaneous measurementswere made of cerebral venous outflow usingtwo electromagnetic flowmeters placed aroundthe internal jugular veins after ligation of itsextracerebral tributaries. After weighing thebrain, the flowmeter values for cerebral bloodflow were corrected to give values for ml/100g brain per min; determinations by the two
Circulation Research, Vol. XXI, November 1967 649
by guest on June 2, 2018http://circres.ahajournals.org/
Dow
nloaded from

650 MEYER, GOTOH, AKIYAMA, YOSHITAKE
methods were found to be in good agreement(1,4,6).
Methods were first developed in animalsand later applied to man (3, 4, 7, 8) wherebycerebral oxygen utilization, pH and Pcoocould be monitored without blood loss. Inthe present communication, methods for mon-itoring cerebral glucose utilization, lactateproduction and ammonia metabolism (withminimal blood loss) will be described and abrief, description of experimental measure-ments in the monkey will be presented.
Methods
We monitored cerebral blood flow, oxygen, glu-cose, lactate and ammonia metabolism in 27 mon-keys of the rhesus or pigtail species after they hadfasted for 36 hr. Then we measured the effectsof: inhalation of 100% oxygen, inhalation of 5%carbon dioxide in air, inhalation of 20% carbondioxide in oxygen, hyperventilation, inhalation of7% oxygen in nitrogen, inhalation of 100% nitro-gen, occlusion of both internal carotid and bothvertebral arteries and the induction of epilepticseizures by bemegride injection. These procedureswere tested because they might clarify changesin cerebral metabolism measured in vivo duringhypoxia, anoxia, increased cerebral functional ac-tivity, increased and decreased cerebral bloodflow and respiratory acidosis.
We induced general anesthesia by ether in-halation supplemented after surgery by carefulregional anesthesia with 1% xylocaine which wasrepeatedly infiltrated at all operative sites toprevent pain. During the recording, the animalswere immobilized with 7 mg/kg of flaxedil. Aftertracheostomy and tracheal cannulation, respira-tion was maintained with a Harvard adjustablerespirator. We reflected the sternomastoid mus-cles, exposed both internal jugular veins andligated the cervical branches. The external carotidarteries were also exposed and ligated as wereboth external jugular and vertebral veins. Twoelectromagnetic flow probes (Model M-4001, 2-channel apparatus, Medicon Division, StathamInstruments) with a lumen diameter of 2 mmwere applied to each internal jugular vein (4, 6)and integrated rates of flow through both internaljugular veins were recorded on a Grass Model 5polygraph and calibrated in milliliters per min-ute. Cerebral venous blood for monitoring cere-bral metabolism was obtained from a catheterinserted into the torcula through the sagittalsinus. Cerebrospinal fluid (CSF) for lactate meas-urement was obtained by cisternal puncture andcatheterization.
We monitored systemic blood pressure by aStatham strain gauge (Model P 23 D6) con-nected to a catheter inserted into the abdominalaorta through the femoral artery. End-tidal car-bon dioxide tension of the expired air (PEco2)was measured with a Beckman infrared carbondioxide gas analyzer. The electroencephalogram(EEG) was recorded from both frontoparietalregions with bipolar electrodes by a Grass 4-channel electroencephalograph.
In experiments in which cerebral metabolismof glucose, lactate and ammonia was recorded,the arterial and sagittal sinus catheters wereconnected to the sample tube of the Techniconautoanalyzer apparatus. By these means, cerebralarterial and venous values were recorded con-tinuously with Technicon or Grass recorders.
In those experiments in which we measuredbrain and CSF lactate, 20 ml of 1% trypan bluewas injected intravenously prior to death andthe brain was examined by serial sections to see ifthere was damage to the blood-brain barrierwhich might be relevant to lactate movementbetween brain, blood and CSF.
Monitoring Cerebral Blood Flow
We measured cerebral blood flow by the auto-matic nitrous oxide method (1) in those experi-ments in which cerebral glucose metabolism wasmeasured. In the remainder, cerebral blood flowwas measured by the electromagnetic flowmetermethod after correcting for the blood removedfrom the sagittal sinus for metabolic studies. Forexample, if arteriovenous oxygen difference wasbeing monitored together with cerebral venousoutflow, 2.9 ml/min, which was removed fromthe sagittal sinus, was added to the flow measure-ments recorded from both internal jugular veins.Values recorded of cerebral venous outflow withflowmeters applied to both internal jugular veinsand values for cerebral blood flow measured inthe monkey by the automatic nitrous oxide methodcorrelated well with measurements of arterialinflow (6).
Monitoring Cerebral Oxygen Consumption
We measured and recorded cerebral arterio-venous oxygen differences (ml O2/100 ml blood)continuously by the use of the Guyton arterio-venous oxygen analyzer (9). Arterial blood andblood from the sagittal sinus were propelled at2.9 ml/min through the two cuvettes of thisapparatus and the blood was returned to thefemoral vein. The apparatus was calibrated bythe Van Slyke and Neill manometric method.The analyzer does not measure the oxygen dis-solved in the plasma. While the monkey breathesair, the dissolved oxygen in its arterial bloodranges between 0.2 to 0.3 ml/100 ml or 1 to 1.5%
Circulation Research, Vol. XXI, November 1967
by guest on June 2, 2018http://circres.ahajournals.org/
Dow
nloaded from

MONITORING CEREBRAL BLOOD FLOW AND METABOLISM 651
of the total oxygen content of the arterial blood.This value is sufficiently small to be considerednegligible under normal circumstances. However,when the Po2 of the blood is greatly increased,correction must be made for the oxygen dissolvedin the plasma. This was done by assuming thatthe amount of oxygen dissolved in the plasmaparallels any increase in Po2 of the inspired air,increasing by 0.3 ml/100 ml blood for eachincrease of 100 mm Hg Po2. If the alveolar air didnot increase to the levels of the inspired air orif there were atelectasis or shunts within the lung,then this assumption would be subject to error.
Monitoring Cerebrol Glucose Consumption
We recorded arterial and cerebral venous glu-cose levels continuously in milligrams per 100 mlby the standard Technicon autoanalyzer tech-nique. The sample lines were connected to thearterial and cerebral venous catheters. Themethod requires that glucose be dialyzed fromthe blood through a membrane and be mixedwith equal samples of potassium ferricyanide;these samples are separated in the tubing of theapparatus by bubbles of air. These are thenpropelled into a water bath and colorimeter. Inthe water bath the dialyzed glucose and reagentmixture is heated to 95°C, the yellow potassiumferricyanide being reduced to colorless potassiumferrocyanide in the presence of glucose. Thedecrease of the optical density of the yellowcolor is proportional to the glucose present inthe blood. This color change is photometricallyrecorded on the graph using a 420-m/i, filter.
The flow of blood required for continuousmeasuring of arteriovenous differences is 0.32ml/min. We calculated cerebral glucose con-sumption from minute to minute in milligramsper 100 g brain per minute from the productof cerebral blood flow and cerebral arteriovenousglucose differences. The reproducibility of themethod is 1 mg/100 ml in the physiologicalrange described in these studies. There was atime delay of 5 min required for pumpingsamples through the apparatus, mixing, dialysis,incubation and for the chemical reaction to takeplace. Once this was achieved, the time delaywas constant at 20 sec between introduction ofa solution of different concentration into theapparatus and the recording of the full value.
Monitoring Cerebral Lactate Metabolism
We monitored arterial, cerebral venous andcerebrospinal fluid lactate levels in milligramsper 100 ml by the enzymatic method of Hochellaand Weinhouse (10) with some modifications.The sample volume was reduced from 0.60 ml/min to 0.10 ml/min so that blood and CSF losswere reduced. Colorimeters were used to graphCirculation Research, Vol. XXI, November 1967
a:
5u
Oil
o
o
M.S
S.S
6.S
ocq
©
©d
O5
c4
inCO
CD
0.4
Vft.
VCO
d
©
in co Vft.V
m
O5
in
co
oV
P ^ ft,O5 -H V
T—|
Od
CO • »O i-t
oi in
o t-rH 00<N ©
mpdV
^ f t ,-1 V
os in
in -H
T, • *
5> l i
o
5 oI 1II >
< -o
• " COTO ^
oa:
CD
O
is a
>. -5
1 CDCO
ilill111"5 -g "|
CJ
by guest on June 2, 2018http://circres.ahajournals.org/
Dow
nloaded from
652 MEYER, GOTOH, AKIYAMA, YOSHITAKE
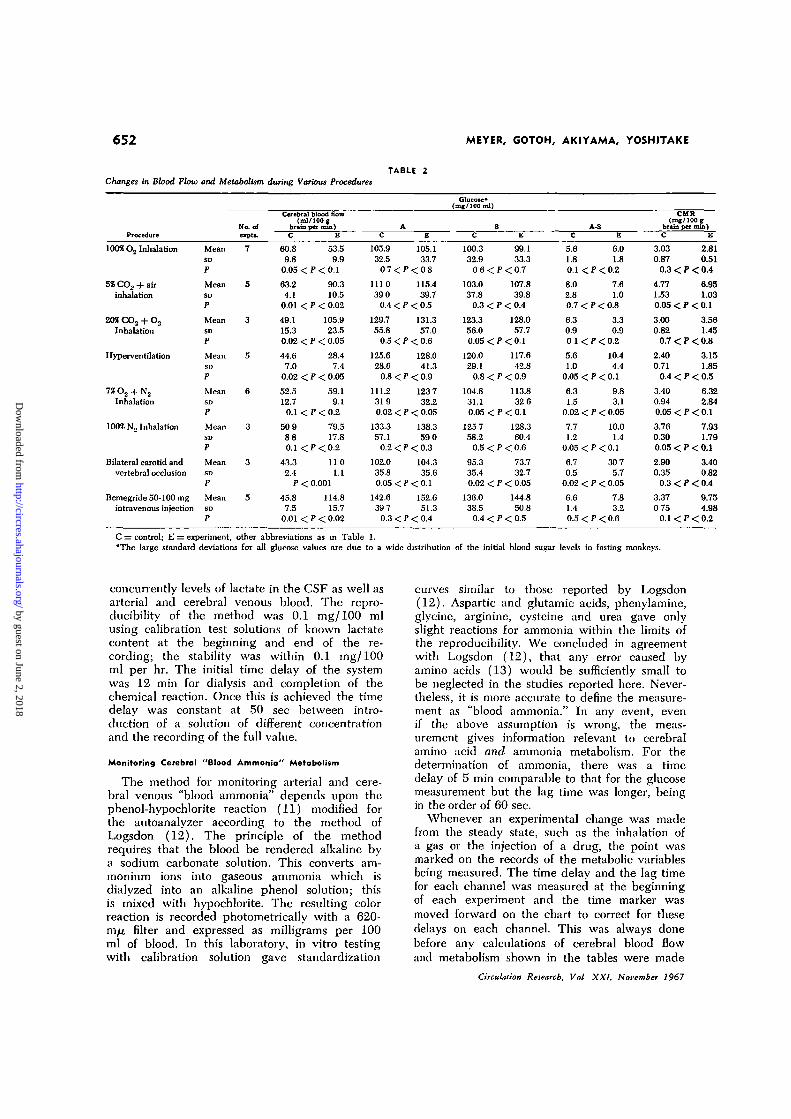
TABLE 2Changes in Blood
Procedure
Flow and Metabolism
No. ofexpta.
during Various Procedures
Cerebral blood flow(ml/100 g
brain per min)C E C
AE
Glucose*(mr/100ml)
SC E C
A-SE
CUR(mg/100 g
brain per nun)C E
100* O, Inhalation
5% CO2 + airinhalation
Inhalation
Hyperventilation
1% O2 -f N2
Inhalation
100% No Inhalation
Bilateral carotid andvertebral occlusion
MeanSD
P
MeanSD
P
MeanSD
P
MeanSD
P
MeanSD
P
MeanSD
P
Mean
Bemegride 50-100 mg Mean 5intravenous injection SD
P
60.8 53.59.8 9.9
0.05<P<0.1
63.2 90.34.1 10.5
0.01 < P < 0.02
49.1 105.915.3 23.50.02 < P < 0.05
44.6 28.47.0 7.4
0.02 < P < 0.05
52.5 59.112.7 9.1
0.1 < P < 0 . 2
50 9 79.58 8 17.80.1 < P < 0 . 2
43.3 1102.4 1.1
P < 0.001
45.8 114.87.5 15.7
0.01< P < 0.02
105.9 105.132.5 33.707<P<08
1110 115.439 0 39.7
0.4 < P < 0.5
129.7 131.355.8 57.0
0.5 < P < 0.6
125.6 128.028.0 41.3
0.8 < P < 0.9
111.2 1237319 32.20.02 < P < 0.05
133.3 138.357.1 59 0
0.2<P<0.3
102.0 104.335.8 35.60.05 < P < 0.1
142.6 152.639 7 51.3
0.3<P<0.4
100.3 99.132.9 33.3
0 6 < P < 0.7
103.0 107.837.8 39.8
0.3 < P < 0.4
123.3 128.056.0 57.70.05<P<0.1
120.0 117.629.1 42.8
0.8 < P < 0.9
104.8 113.831.1 32 60.05<P<0.1
125 7 128.358.2 60.4
0.5 < P < 0.6
95.3 73.735.4 32.70.02 < P < 0.05
136.0 144.838.5 50.8
0.4 < P < 0.5
5.6 6.01.8 1.80.1 < P < 0 . 2
8.0 7.62.8 1.00.7 < P < 0.8
6.3 3.30.9 0.90 1 < P < 0.2
5.6 10.41.0 4.4
0.05 < P < 0.1
6.3 9.81.5 3.1
0.02 < P < 0.05
7.7 10.01.2 1.4
0.05<P<0.1
6.7 30 70.5 5.7
0.02 < P < 0.05
6.6 7.81.4 3.20.5 < P < 0.6
3.03 2.810.87 0.51
0.3 < P < 0.4
4.77 6.951.53 1.030.05<P<0.1
3.00 3.560.82 1.45
0.7 < P < 0.8
2.40 3.150.71 1.85
0.4 < P < 0.5
3.40 6.320.94 2.840.05 < P < 0.1
3.76 7.930.30 1.790.05 < P < 0.1
2.90 3.400.35 0.82
0.3 < P < 0.4
3.37 9.750 75 4.98
0.1<P<0 .2
C = control; E = experiment, other abbreviations as in Table 1."The large standard deviations for all glucose values are due to a wide distribution of the initial blood sugar levels in fasting monkeys.
concurrently levels of lactate in the CSF as well asarterial and cerebral venous blood. The repro-ducibility of the method was 0.1 mg/100 mlusing calibration test solutions of known lactatecontent at the beginning and end of the re-cording; the stability was within 0.1 mg/100ml per hr. The initial time delay of the systemwas 12 min for dialysis and completion of thechemical reaction. Once this is achieved the timedelay was constant at 50 sec between intro-duction of a solution of different concentrationand the recording of the full value.
Monitoring Cerebral "Blood Ammonia" Metabolism
The method for monitoring arterial and cere-bral venous "blood ammonia" depends upon thephenol-hypochlorite reaction (11) modified forthe autoanalyzer according to the method ofLogsdon (12). The principle of the methodrequires that the blood be rendered alkaline bya sodium carbonate solution. This converts am-monium ions into gaseous ammonia which isdialyzed into an alkaline phenol solution; thisis mixed with hypochlorite. The resulting colorreaction is recorded photometrically with a 620-m/x filter and expressed as milligrams per 100ml of blood. In this laboratory, in vitro testingwith calibration solution gave standardization
curves similar to those reported by Logsdon(12). Aspartic and glutamic acids, phenylamine,glycine, arginine, cysteine and urea gave onlyslight reactions for ammonia within the limits ofthe reproducibility. We concluded in agreementwith Logsdon (12), that any error caused byamino acids (13) would be sufficiently small tobe neglected in the studies reported here. Never-theless, it is more accurate to define the measure-ment as "blood ammonia." In any event, evenif the above assumption is wrong, the meas-urement gives information relevant to cerebralamino acid and ammonia metabolism. For thedetermination of ammonia, there was a timedelay of 5 min comparable to that for the glucosemeasurement but the lag time was longer, beingin the order of 60 sec.
Whenever an experimental change was madefrom the steady state, such as the inhalation ofa gas or the injection of a drug, the point wasmarked on the records of the metabolic variablesbeing measured. The time delay and the lag timefor each channel was measured at the beginningof each experiment and the time marker wasmoved forward on the chart to correct for thesedelays on each channel. This was always donebefore any calculations of cerebral blood flowand metabolism shown in the tables were made
Circulation Research, Vol XXI, November 1967
by guest on June 2, 2018http://circres.ahajournals.org/
Dow
nloaded from

MONITORING CEREBRAL BLOOD FLOW AND METABOLISM
TABLE 2 (cont.)
653
No. ofexpts. C
AE
Lactate(ing/100 ml)
SC E C
A-SE
No. ofexpts. C
AE
Ammonia-nitrogen(mg/100 ml)
S
c E CA-S
H
10
10
10
11
11
34.6 33.715.7 15.50.1 < P < 0.2
29.2 30.58.6 8.9
0.001 < P < 0.01
38.9 39.317.8 18.70.7 < P < 0.8
36.4 42.612.1 13.9
P < 0.001
36.0 43.713.3 18.0
0.001 < P < 0.01
39.5 56.618.2 231
P < 0.001
42.9 46.418.4 16.00.1 < P < 0.2
52.6 63.224.3 22.90.01 < P < 0.02
34.8 34.614.7 14.6
0.6 < P < 0.7
28.5 30.48.2 8.7
0.001 < P < 0.01
39.3 38.918.0 18.1
0.7 < P < 0.8
36.2 42.710.8 13 4
P < 0.001
36.2 43.113.6 17.6
0.001 < P < 0.01
39.1 55 618.1 22.9
P < 0.001
42.1 49.717.1 17.90.01 < P < 0.02
50 6 62.123.2 22.00.01 < P < 0.02
-0 .1 -0 .92.8 3.4
0.05 < P < 0.1
0.7 0 11.2 10
0.05<P<0.1
- 0 3 0 32.8 2.70.1 <P<0 .2
0.3 -0.22 1 2.00.4 < P < 0.5
-0.1 0.52 6 2.10.4 < P < 0.5
0.5 1.12.4 1.40.4 < P < 0.5
0 9 -3.21.8 3.7
0 02 < P < 0.05
1.9 1.11.4 1.1
0.01 < P < 0 02
6 65.5 64.725.2 23.50.7 < P < 0.8
4 78.0 83 341.0 35.40.2 < P < 0.3
3 68.7 88.327.8 32.50.1 <P<02
6 76.3 82 017.0 28.50.4 < P < 0.5
4 79 0 90.019.5 25.90 1 < P < 0 2
5 86.2 105.027.0 33 90.05<P<0.1
3 97.3 100.734.8 43.20.6 < P < 0.7
6 96.7 152.837.5 87 30.1<P<0.2
62.7 65.826.0 29.0
0.1 < P < 0 . 2
78.4 81.542.6 43.10.02 < P < 0.05
73.7 90.324.6 30.00.02 < P < 0.05
71.2 82.025.3 29 60.05 < P < 0.1
84.3 88.328.1 38 7
0.6 < P < 0.7
88.0 107.833.5 39.10.05<P<0.1
104.0 134 032.7 49 5
0.1< P < 0.2
90.5 152.729.4 84.8
0.1< P < 0.2
2.8 -1 .24.5 10.80.2 < P < 0.3
3.3 1.86 4 10.30.7 < P < 0.8
-5.0 -2.014.0 6.70.6 < P < 0.7
5.2 010.0 7.70.3 < P < 0.4
-5.3 1.811.9 13.10.2 < P < 0.3
-2.6 -2 .812.1 10.20.9 < P
-6.7 33.32.5 10.3
0.05 < P < 0.1
6.2 0.212 8 11.2
0.3 < P < 0.4
or the illustrations shown in the figures werephotographed.
Results
The results are shown in Tables 1, 2, 3 and4. Table 1 summarizes data for cerebral bloodflow, glucose, lactate and ammonia metabo-lism. The data for steady state and experi-mental values for cerebral oxygen consump-tion (Table 4) from a larger series of similarexperiments will be reported in detail else-where (14), but will be reviewed briefly inthe Discussion.
Effect of Occlusion of Both Carotid and Vertebral Arteries
The most effective method found for pro-ducing ischemia of the brain without systemicanoxia was by simultaneously occluding bothcarotid and both vertebral arteries in the neck(Table 2). The greatly reduced residual cere-bral blood flow (by way of the collateralcirculation) cannot be measured satisfactorilyby the nitrous oxide method but was meas-ured successfully by the electromagnetic
flowmeters on the internal jugular veins in3 animals. The number of minutes of occlusionwas correlated with any staining of the brainby trypan blue to estimate any damage tothe blood-brain barrier. After 2 min of liga-tion, flattening of the EEG occurred but theblood-brain barrier was not altered; if thevessels were occluded for 3 min or longer,damage to the blood-brain barrier resulted.The increase in cerebral venous lactate oc-curred whether or not there was damage tothe blood-brain barrier.
Effect of Seizures Induced by Intravenous Injectionof Bemegride (Megimide)
After bemegride injection, the EEG showedtypical epileptic spike activity as a result ofthis convulsant drug (Table 2). The monkeywas immobilized with flaxedil so that anyeffect of the drug on muscular contraction andmuscle metabolism could be ignored.Monitoring Cerebrol Arteriovenous and Cerebrospinal FluidLactate Differences
Continuous recording of cerebrospinal fluidlactate with arterial and venous lactate was
Circulation Research, Vol. XXI, November 1967
by guest on June 2, 2018http://circres.ahajournals.org/
Dow
nloaded from

TAB
LE 3
Eff
ects
of
Hij
pogl
ycem
ia o
n C
ereb
ral
Blo
od F
low
and
Glu
cose
Met
abol
ism
dur
ing
Sam
e P
roce
dure
s as
Tho
se i
n T
able
2
Du
rin
g:
Inha
lati
on 1
002
O.,
(3)
Inha
latio
n 5%
CO
., in
air
(4)
Hyp
erve
ntila
tion
(4)
Inha
latio
n 7
% O
., in
N,
(4)
Bem
egri
de,
50-1
00 m
gin
trav
enou
s in
ject
ion
(3)
All
abbr
evia
tions
are
exp
lain
ed
Mea
nSD P M
ean
SD P Mea
nSD P M
ean
SI)
P Mea
nSD P in T
able
sN
umbe
r in
par
enth
esis
ind
icat
es n
umbe
r
CB
F(m
l/tO
O g
bra
in p
er m
in)
C
45.0
14.7
0.2
53.2
13.0 0.1
47.1
10.0
0.01
45.9
12.1
0.05
57.7
16.6 0.1
1 an
d 2.
E
36.8
10.3
< P
< 0
.3 77.1
26.2
< P
< 0
.2
33.7 8.9
< P
< 0
.02
57.4
18.6
<P
<0.1 99.5
37.2
< P
< 0
.2
of e
xper
imen
ts.
C
44.0 8.6
0.3
44.5
10.8
0.5
33.3
12.7 0.6
37.5 7.3
0.2
39.3
11.1
0.2
AE
41.3 7.8
< P
< 0
.4 43.0
10.7
< P
< 0
.6 32.5
12.7
< P
< 0
.7 33.0
10.8
< P
< 0
.3 36.3
13.2
< P
< 0
.3
C
39.3
8.1
0.2
39.8
10.6
0.8
28.0 9.9
0.2
33.3
5.9
0.1
34.3
10.4
O.O
J
Glu
cose
SE
36.3 6.5
< P
< 0
.3 39.3
10.4
< P
< 0
.9 25.5 8.0
< P
< 0
.3 28.0
8.4
< P
< 0
.2 30.7
10.1
><
P<
0.1
(mg/
100
ml) C 4.7
0.9
0.4
4.8
1.9
0.4
5.3
2.9
0.2
4.3
1.8
0.2
5.0
0.8
0.7
A-S
E 5.0
1.4
< P
< 0
.5 3.8
0.4
< P
< 0
.5 7.0
4.7
< P
< 0
.3 5.0
2.5
< P
< 0
.3 5.7
3.1
< P
< 0
.8
CM
R(m
g/10
0 g
brai
n pe
r m
in)
C
1.93
0.36 0.
4
2.32
0.34 0.
3
2.25
0.86 0.5
1.80
0.57
0.02
2.80
0.71 0.
3
E
1.70
0.08
< P
< 0
.5 2.77
0.55
< P
< 0
.4 1.97
0.64
< P
< 0
.6 2.55
0.85
< P
< 0
.05
5.16
2.30
< P
< 0
.4
m m 30 e> o AKIYAMA, YOSHITAK
by guest on June 2, 2018http://circres.ahajournals.org/Downloaded from

MONITORING CEREBRAL BLOOD FLOW AND METABOLISM 655
Cerebral Oxygen Consumption in theTABLE 4
Monkey (Mean Values and Standard Deviation)
ExperimentCBF
(ml/100 g brain per min)A-SO- Diff.(ml/100 ml)
CMRO=(ml/100 g brain per min)
Hyperventilation (13)ControlAfter 200 sec hypervent.
Inhalation of 20% COL,-80% (X (8)ControlDuring inhalation
Inhalation of 1% O.,-QZ% N., (7)ControlDuring inhalation
Inhalation of 100% N2 (10)ControlDuring inhalation (EEG theta)
During inhalation (EEG delta)
During inhalation (EEG flat)
Cerebral Ischemia (11)ControlDuring vascular occlusion
After release
Seizures induced by bemegride (9)ControlDuring seizures
53.2 ± 18.733.9 ± 15.9P < 0.001
52.0 ± 10.8113.0 ± 20.8
P < 0.001
52.5 ± 15.068.0 ± 19.1
51.9 ± 9.876.1 ± 12.2
0.001 < P < 0 . 0 1 *73.5 ± 18.6
0.001 < P < 0.01*76.0 ± 19.0
0.001 < P < 0 . 0 1 *
57.3 ± 19.411.9 ± 6.1P < 0.001
67.0 ± 12.9
45.4 ± 19.0104.6 ± 23.7
P < 0.001
5.85 ± 1.818.30 ± 1.49P < 0.001
6.39 ± 1.722.76 ± 0.66P < 0.001
5.29 ± 1.702.62 ± 1.04
0.01 > P > 0.001
5.72 ± 2.242.87 ± 1.20
0.02 < P < 0.05*1.74 ± 1.03P < 0.001*
1.51 ± 0.91P < 0.001*
5.27 ± 1.427.42 ± 1.10P < 0.001
3.64 ± 1.17
4.85 ± 1.083.55 ± 1.99
0.005 < P < 0.01
3.05 ± 1.032.76 ± 1.16
3.35 ± 1.163.06 ± 0.63
2.80 ± 0.841.71 ± 0.64
0.01 > P > 0.001
3.00 ± 1.452.12 ± 0.82
1.26 ± 0.730.01 < P < 0.02*
1.10 ± 0.620.001<P<0.01*
3.02 ± 1.290.90 ± 0.51P < 0.001
2.41 ± 0.77
2.15 ± 0.963.54 ± 0.89P < 0.001
CBF = Cerebral blood flow; A-SO., diff. = cerebral arterial-sagittal sinus oxygen difference; and CMRO2 = cere-bral metabolic rate for oxygen.
Numbers in parenthesis indicate numbers of experiments.*P values for experimental vs. control values.
found to be technically difficult because ofthe small volume of CSF in monkeys. Satis-factory data were obtained in 5 animals butthe CSF data for the numerous procedurestested were insufficient for statistical analysis.
Inhalation of 100% oxygen resulted in smalldecreases of lactate in arterial and cerebralvenous blood and CSF without change inthe EEG.
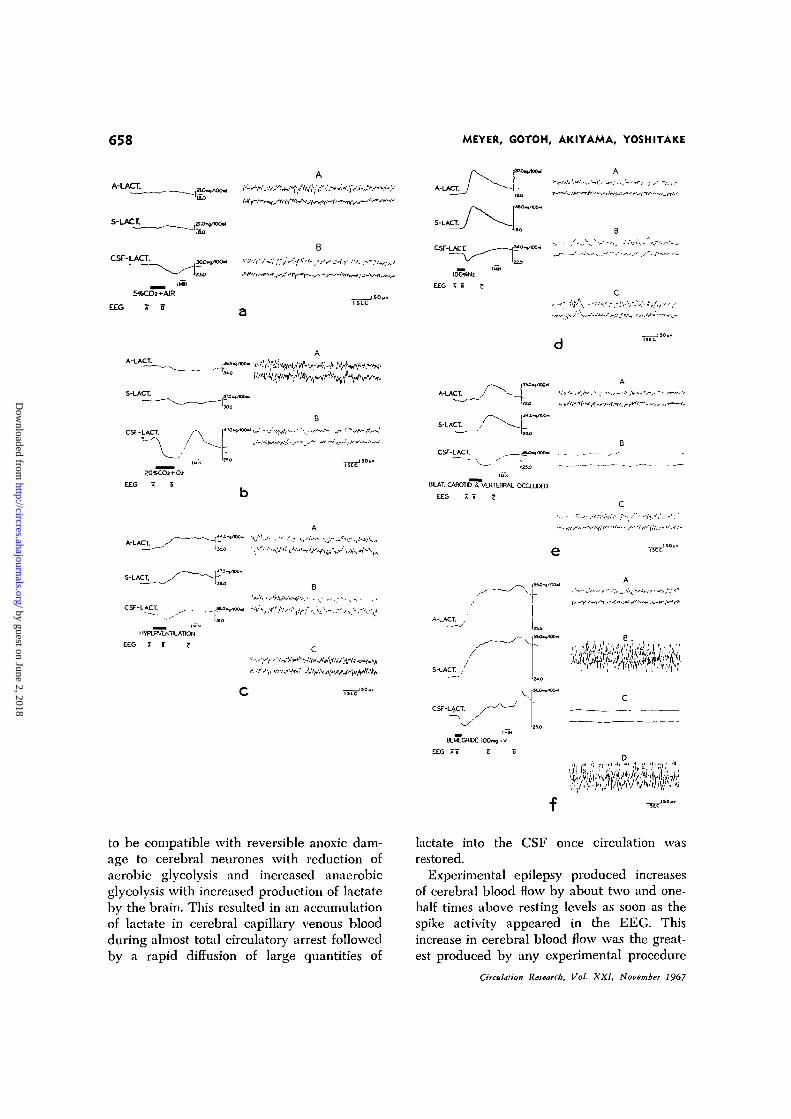
Inhalation of 5% carbon dioxide plus aircaused, if any change, parallel but minimalincreases of arterial and cerebral venous lac-tate as shown in Figure la. The CSF lactate,in contrast, showed a large decrease of 19%
Circulation Research, Vol. XXI, November 1967
which reached a minimum 2 min after dis-continuing inhalation of 5% carbon dioxide.
Inhalation of 20% carbon dioxide and oxygencaused no change in arterial and cerebralvenous lactate but CSF lactate decreased by36% as shown in Figure lb. When inhalationof 20% carbon dioxide was discontinued, CSFlactate increased from 27 to 47 mg/100 mland arterial and cerebral venous lactate alsoshowed increases. These changes occurredwith slight slowing and reduction in ampli-tude of the EEG.
Passive hyperventilation caused an increaseof 24% in arterial and cerebral venous lactate.
by guest on June 2, 2018http://circres.ahajournals.org/
Dow
nloaded from

656 MEYER, GOTOH, AKIYAMA, YOSHITAKE
Lactate levels in the CSF temporarily de-creased during hyperventilation but showeda delayed increase after hyperventilation wasdiscontinued. As shown in Figure lc, theEEG showed slowing during hyperventilation.
Hypoxia was induced by inhalation of 7%oxygen in nitrogen. This resulted in slightincreases in arterial and cerebral venous lac-tate while CSF lactate decreased. The EEGwas not altered.
Anoxia was induced by inhalation of 100%nitrogen as shown in Figure Id. Arterialand cerebral venous lactate showed abruptand large increases while CSF lactate de-creased and then showed a sluggish increaseto above baseline levels. The EEG showedslowing followed by temporary flattening ofthe record with recovery as anoxia was dis-continued.
Ischemic anoxia limited to the brain wasinduced by temporary occlusion of both carotidand vertebral arteries (Fig. le). The EEGbecame flat. During cerebral ischemia, therewas a prompt increase of arterial and cerebralvenous blood lactate by about 60% while thecerebrospinal fluid lactate decreased followedby a sluggish rise to above baseline levels.
Epileptic seizure activity was induced inthe EEG by the intravenous injection ofbemegride (Fig. If). Arterial and cerebralvenous blood lactate rapidly increased byabout twofold after the seizure. Cerebrospinalfluid lactate decreased at first and then in-creased after a delay to levels comparable tothe increase in the blood. When bursts of spikeactivity appeared in the EEG, CSF lactateshowed fluctuating increases with each burst.
Discussion
The results of the experimental trials ofthese methods for measuring cerebral bloodflow, glucose, oxygen, lactate and ammoniametabolism in the monkey are consonant withknown steady state values and reportedchanges induced in vivo and in vitro by thetypes of experimental procedures examined.
Steady state values for cerebral blood flowin the monkey of 61.2 ml/100 g brain permin, measured by saturation and desaturation
curves using the automatic nitrous oxidemethod, are in good agreement with pre-viously reported values of 55.4 ml/100 g brainper min calculated from bubble flowmetermeasurements of internal carotid artery flowin monkeys (15). The values are also reason-ably comparable with steady state valuesof 54 ml/100 g brain per min reported innormal young men (5).
Cerebral oxygen consumption in the presentseries of experiments is discussed in detailelsewhere (14). These values for the steadystate are also comparable to those reportedfor man (5). Cerebral metabolic rate for oxy-gen was not significantly altered during hyper-ventilation or respiratory acidosis but wassignificantly depressed during anoxic anoxia,ischemic anoxia, and during the isoelectricphase of the EEG following prolonged seizureactivity. During the seizure discharge itself,the cerebral metabolic rate for oxygen wasgreatly increased.
Mean arterial and cerebral venous am-monia-nitrogen values were both slightlyhigher than values reported in man; this maybe due to the method used for ammoniadetermination. Lactate values were compar-able to those found in man (16-18).
During inhalation of oxygen, there was nochange in cerebral metabolism.
Inhalation of 5% carbon dioxide in air in-creased cerebral blood flow but did not sig-nificantly alter cerebral glucose consumption,although the concentration of glucose in botharterial and cerebral venous blood increasedslightly. The cerebrospinal fluid lactate de-creased during 5% carbon dioxide inhalationdespite increases in blood lactate. The sta-tistically significant increase in cerebral venousammonia-nitrogen is possibly attributable toincreased cerebral blood flow since someammonia-nitrogen appears to be consumed bythe brain in the steady state.
Respiratory acidosis during inhalation of20% carbon dioxide in oxygen caused largeincreases of cerebral blood flow. Cerebraloxygen, glucose and lactate metabolism werenot changed as the EEG slowed, possibly dueto some effect of severe acidosis on the neu-
Orculaiion Research, Vol. XXI, November 1967
by guest on June 2, 2018http://circres.ahajournals.org/
Dow
nloaded from
MONITORING CEREBRAL BLOOD FLOW AND METABOLISM 657
ronal membrane. Although cerebral arterialand venous lactate did not change, cerebro-spinal fluid lactate showed marked changes.During respirator^' acidosis, the CSF lactatedecreased considerably. This decrease andthat which occurred during inhalation of 5%CO2 could be attributed to several factors:(A) Acidosis of arterial, cerebral venous bloodand the brain and CSF are all known to occurduring inhalation of 20% CO2 (19). The gly-colytic activity of the brain is very sensitiveto changes in pH (20). In the range betweenpH 6.8 and 7.8, Dominkos and Huszak (20)reported that aerobic lactic acid productionincreased in parallel with a rise in pH anddecreased in parallel with a reduction in tissuepH. (B) Increased cerebral blood flow tendsto wash out lactate from brain tissue andCSF and (C) cerebral lactate productioncould be reduced by the Pasteur effect as aresult of better oxygenation of brain tissue.(D) Possibly changes in the blood-brain bar-rier and brain-CSF barriers brought about byincreased tensions of carbon dioxide influencethe movement of lactate.
Respiratory alkalosis resulting from passivehyperventilation caused a decrease in cerebralblood flow but no significant changes in cere-bral oxygen and glucose metabolism duringEEG slowing. The cerebral arteriovenousdifference widened with a decrease of cerebralvenous glucose levels. The lowest level ofcerebral venous glucose during hyperventila-tion was directly proportional to the initialarterial glucose level, i.e., the lower the restingarterial glucose the greater the hypoglycemiaof the cerebral venous blood during hyper-ventilation. This may account for the well-known predisposition of hypoglycemic individ-uals to EEG slowing during hyperventilation.Arterial and cerebral venous lactate signifi-cantly increased as might be predicted fromthe observations of Huckabee during hyper-ventilation (22) who showed that such in-creases may be pH dependent. The CSFlactate increase was thought to be due inpart to the effect of an alkaline shift in pH onbrain and blood lactate levels (20-24) andin part to cerebral anoxia with a shift to
Circulation Research, Vol. XXI, November 1967
anerobic glycolysis (20). There was no sig-nificant change in cerebral ammonia-nitrogenmetabolism during hyperventilation.
Hypoxic hypoxia resulted in an increase ofcerebral glucose consumption of 86% whichdid not quite reach the level of statisticalsignificance. This trend may indicate the be-ginning of a shift to anaerobic glycolysis asdefinitely occurred with nitrogen breathing,since glucose consumption is greater duringanaerobic glycolysis compared to aerobicglycolysis required to supply the same amountof energy. Blood lactate values increased inarterial and cerebral venous blood as mightbe expected from the observations of Hucka-bee during hypoxia in man (25). The CSFlactate first increased then decreased andfinally showed a sluggish increase. The finalpersistent increase in CSF lactate was be-lieved to be due to increased lactate pro-duction associated with cerebral anaerobicglycolysis.
Anoxic anoxia produced more remarkablechanges than hypoxic hypoxia. Cerebral bloodflow tended to increase, cerebral oxygen con-sumption was severely reduced, cerebral glu-cose consumption increased and arterial andcerebral venous lactate levels both increased.There was a delayed increase in CSF lactate.All these changes were considered to becompatible with a shift from aerobic to anaero-bic glycolysis whereby cerebral oxygen con-sumption would be reduced, glucose con-sumption would increase and lactate wouldbe released from the brain into the bloodand cerebrospinal fluid.
Stagnant anoxia, limited to the brain bycarotid and vertebral artery occlusion, resultedin a decrease of cerebral blood flow, cerebraloxygen consumption and cerebral venous glu-cose levels. The cerebral arteriovenous differ-ence for glucose increased fourfold whichwas statistically significant. Cerebral venouslactate levels significantly increased and therewas a significant increase in the cerebralarteriovenous lactate difference. Cerebrospinalfluid lactate slowly increased after an initialdecrease. This pattern of change was believed
by guest on June 2, 2018http://circres.ahajournals.org/
Dow
nloaded from
658 MEYER, GOTOH, AKIYAMA, YOSHITAKE
A-LACT.
S-LACr.
CSF-LACT.
EEG
/•""•^•VfWVW **•**/ ̂ Y V ^ f ' " " v.'"v'* •^h~r*~* *&**&*? - ^ j . ^ ^ . r I00SN2
EEG 7 i I
-4,
SLAT. CAROTO 8, VERTEBRAL OCCLUOED
EEG I I c
C
HYPERVENTLATION
EEG I I ?
T T t c "
/S-LACT.
BEkECRIDE iOOm, , v
EEG A ! c 5
to be compatible with reversible anoxic dam-age to cerebral neurones with reduction ofaerobic glycolysis and increased anaerobicglycolysis with increased production of lactateby the brain. This resulted in an accumulationof lactate in cerebral capillary venous bloodduring almost total circulatory arrest followedby a rapid diffusion of large quantities of
lactate into the CSF once circulation wasrestored.
Experimental epilepsy produced increasesof cerebral blood flow by about two and one-half times above resting levels as soon as thespike activity appeared in the EEG. Thisincrease in cerebral blood flow was the great-est produced by any experimental procedure
Circulation Research, Vol. XXI, November 1967
by guest on June 2, 2018http://circres.ahajournals.org/
Dow
nloaded from

MONITORING CEREBRAL BLOOD FLOW AND METABOLISM 659
and exceeded that induced by inhalation of203> carbon dioxide. Cerebral oxygen con-sumption increased during the spike phasebut was decreased during the isoelectric phaseof the EEC Cerebral glucose consumptionsignificantly increased and cerebral venousarterial and lactate levels increased. This pat-tern of change is compatible with an increaseof both aerobic and anaerobic glycolysisduring seizure activity. It is believed thatlactate was released rapidly from the braininto the systemic circulation but it is possiblethat the systemic blood levels of lactate werealso increased due to release of epinephrineand metabolic acidosis. Muscular contractionwas blocked during the seizures so that lac-tate was not released by muscular contraction.
The cerebrospinal fluid lactate decreasedat the onset of the seizures as cerebral bloodflow increased and lactate tended to bewashed out from brain. The later sustainedincrease of CSF lactate gave further supportto the view that increased production andrelease of lactate by the brain into the CSFoccurred during the seizures. In any event,the blood and brain lactate slowly enteredinto equilibrium with the cerebrospinal fluid.
The most remarkable cerebral metabolicchanges occurred during isolated cerebralischemia and experimental epilepsy. In boththese conditions aerobic and anaerobic gly-colysis were altered. In both conditions cere-bral lactate production appeared to be in-
creased with a release of lactate from braininto cerebral venous blood. The CSF lactateincrease was delayed, however, suggestingthat the CSF enters slowly into equilibriumwith blood and brain (26).
References1. MEYER, J. S., GOTOH, F., AKIYAMA, M., AND
YOSHITAKE, S.: Automatic recording of cerebralblood flow by nitrous oxide inhalation withoutblood loss. Neurology 17: 838-853, 1967.
2. GOTOH, F., MEYEH, J. S., AND TOMITA, M.:Hydrogen method for determining cerebralblood flow in man. Arch. Neurol. 15: 549-559, 1966.
3. MEYER, J. S., COTOH, F., AKIYAMA, M., ANDYOSHITAKE, M.: Monitoring cerebral bloodflow, oxygen and glucose metabolism. Analy-sis of the cerebral metabolic disorder in strokeand results of therapeutic trials. Circulation36: 197-211, 1967.
4. MEYER, J. S., GOTOH, F., TOMITA, M., ANDAKIYAMA, M.: New techniques for record-ing cerebral blood flow and metabolism insubjects with cerebrovascular disease. InCerebral Vascular Diseases, edited by C. Milli-kan, R. Siekert, and J. Whysnant. New York,Grune and Stratton, 1966, pp. 147-156.
5. KETY, S. S., AND SCHMIDT, C. F.: Determinationof cerebral blood flow in man by the use ofnitrous oxide in low concentration. Am. J.Physiol. 143: 53-66, 1945.
6. MEYER, J. S., ISHIKAWA, S., AND LEE, T. K.:Electromagnetic measurement of internal jugu-lar venous flow in the monkey: Effect ofepilepsy and other procedures. J. Neurosurg.21: 524-529, 1964.
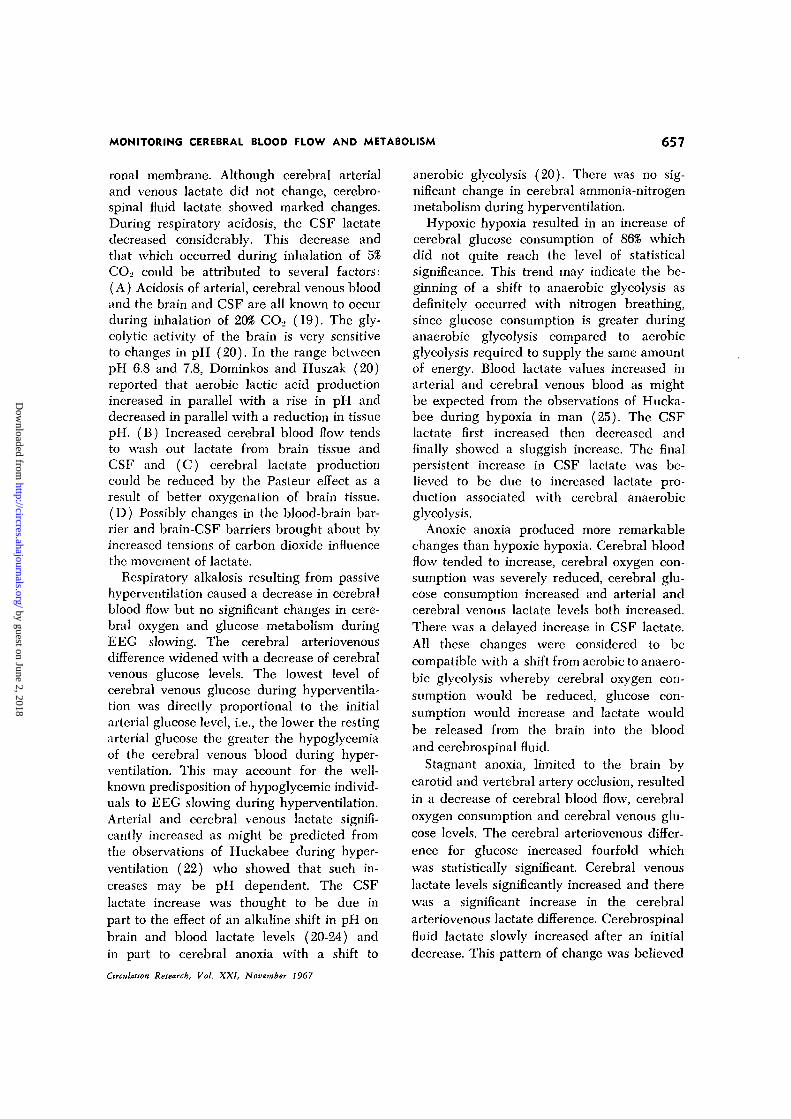
FIGURE 1
(a) Effect of inhalation of 5% carbon dioxide in air during concurrent recording of electroen-cephalogram, arterial (A), cerebral venous (S) and cerebrospinal fluid (CSF) lactate. The EECsamples illustrated to the right were recorded at conventional speed at points marked A and Bon the slower Technicon record of lactate levels. Inhalation of the test gas occurred at the in-terval marked by black line. The time delay for the passage of blood through the catheters, thedialyzers, mixing with the reagents and though the incubation is constant, was found to be thesame for all three recorders since the pump speed and length and size of catheters were thesame. This time delay was measured at the beginning of the experiment and the interval ofinhalation of 5% CO2 was moved forward on the chart to correct for the measured time delay.(b) Effect of inhalation of 20% carbon dioxide—80% oxygen, (c) Effect of passive hyperventila-tion; EEG samples A, B and C were made at points noted on the Technicon record, (d) Effectof inhalation of 100% nitrogen, (e) Effect of cerebral ischemia induced by occlusion of bothcarotid and both vertebral arteries, (f) Effect of drug-induced seizures produced by intravenousinjection of bemegride (Megimide); EEG samples A, B, C and D were made at points noted onthe Technicon record.
Circulation Research, Vol. XXI, November 1967
by guest on June 2, 2018http://circres.ahajournals.org/
Dow
nloaded from

660 MEYER, GOTOH, AKIYAMA, YOSHITAKE
7. MEYER, J. S., AND GOTOH, F.: Interaction ofcerebral hemodynamics and metabolism. Neu-rol. 11: 46-65, 1961.
8. GOTOH, F., MEYER, J. S., AND EBIHARA, S.:Continuous recording of human cerebralblood flow and metabolism. Methods for elec-tronic monitoring of arterial and venous gasesand electrolytes. Med. Res. Eng. 5: 13-19,1966.
9. GUYTON, A. C , NICHOLS, R. J., AND FARISH,
C.: Arterio-venous oxygen difference record-er. J. Appl. Physiol. 10: 158-163, 1957.
10. HOCHELLA, N. J., AND WEINHOUSE, S.: Auto-mated lactic acid determination in serum andtissue extracts. Anal. Biochem. 10: 304-317,1965.
11. RUSSELL, J. A.: Colorimetric estimation of smallamounts of ammonia by the phenol-hypochloritereaction. J. Biol. Chem. 156: 457-461, 1944.
12. LOGSDON, E. E.: A method for the determinationof ammonia in biological materials on theautoanalyzer. Ann. N. Y. Acad. Sci. 87: 801-807, 1960.
13. REINHOLD, ] . C , AND CHUNG, C. C : Formationof artifactual ammonia in blood by action ofalkali. Its significance for the measurement ofblood ammonia. Clin. Chem. 7: 54-69, 1961.
14. MEYER, J. S., SAKAMOTO, K., AKIYAMA, M.,YOSHIDA, K., AND YOSHITAKE, S.: Relation ofelectroencephalogram to cerebral blood flowand metabolism. EEC Clin. Neurophysiol. 23:497-508, 1967.
15. DUMKE, P. R., AND SCHMIDT, C. F.: Quantita-tive measurements of cerebral blood flow inthe macaque monkey. Am. J. Physiol. 138:421-431, 1943.
16. GIBBS, E. L., LENNOX, W. G., NIMS, L. F., ANDGIBUS, F. A.: Arterial and cerebral venousblood. Arterial-venous differences in man. J.Biol. Chem. 144: 325-332, 1942.
17. ROWE, G. G., MAXWELL, C. M., CASTELLO,C. A., FREEMAN, D. J., AND CRUMPTON, C. W.:
A study in man of cerebral blood flow andcerebral glucose, lactate and pyruvate me-tabolism before and after eating. J. Clin. In-vest. 38: 2154-2158, 1959.
18. SCHEINBERG, P., BOURNE, B., AND REINMUTH,
O. M.: Human cerebral lactate and pyruvateextraction. Arch. Neurol. 12: 246-250, 1965.
19. MEYER, J. S., GOTOH, F., AND TOMITA, M.: Acuterespiratory acidemia. Correlation of jugularblood composition and electroencephalogramduring CO., narcosis. Neurology 16: 463-474, 1966.
20. DOMINKOS, J., AND HUSZAK, I.: Effect of hy-drogen ion concentration on the carbohy-drate metabolism of brain tissue. J. Neuro-chem. 4: 238-243, 1959.
21. GOTOH, F., MEYER, J. S., AND TAKACI, Y.:
Cerebral effects of hyperventilation in man.Arch. Neurol. 12: 410-423, 1965.
22. HUCKABEE, W. E.: Relationships of pyruvateand lactate during anerobic metabolism. I.Effects of infusion of pyruvate or glucose andof hyperventilation. J. Clin. Invest. 37: 244-254, 1958.
23. KETY, S. S., AND SCHMIDT, C. F.: Effects ofactive and passive hyperventilation on cere-bral blood flow, cerebral oxygen consumption,cardiac output, and blood pressure of normalyoung men. J. Clin. Invest. 25: 107-119,1946.
24. MCHENRY, L. C, SLOCUM, H. C, BIRENS, H. E.,MAYES, H. A., AND HAYES, G. J.: Hyperven-tilation in awake and anesthetized man. Arch.Neurol. 12: 27-277, 1965.
25. HUCKABEE, W. E.: Relationships of pyruvate andlactate during anerobic metabolism. III. Effectof breathing low-oxygen gases. J. Clin. In-vest. 37: 264-271, 1958.
26. POSNER, J. B., AND PLUM, F.: Lack of rapidequilibration between blood and C.S.F. lac-tate. Neurology 16: 316, 1966.
Circulation Research, Vol. XXI, November 1967
by guest on June 2, 2018http://circres.ahajournals.org/
Dow
nloaded from
JOHN S. MEYER, F. GOTOH, M. AKIYAMA and S. YOSHITOKEEXPERIMENTAL TRIALS IN ANIMALS
Monitoring Cerebral Blood Flow and Oxygen, Glucose, Lactate and Ammonia Metabolism:
Print ISSN: 0009-7330. Online ISSN: 1524-4571 Copyright © 1967 American Heart Association, Inc. All rights reserved.is published by the American Heart Association, 7272 Greenville Avenue, Dallas, TX 75231Circulation Research
doi: 10.1161/01.RES.21.5.6491967;21:649-660Circ Res.
http://circres.ahajournals.org/content/21/5/649World Wide Web at:
The online version of this article, along with updated information and services, is located on the
http://circres.ahajournals.org//subscriptions/
is online at: Circulation Research Information about subscribing to Subscriptions:
http://www.lww.com/reprints Information about reprints can be found online at: Reprints:
document. Permissions and Rights Question and Answer about this process is available in the
located, click Request Permissions in the middle column of the Web page under Services. Further informationEditorial Office. Once the online version of the published article for which permission is being requested is
can be obtained via RightsLink, a service of the Copyright Clearance Center, not theCirculation Research Requests for permissions to reproduce figures, tables, or portions of articles originally published inPermissions:
by guest on June 2, 2018http://circres.ahajournals.org/
Dow
nloaded from