MONITORING AND MODELLING LAHAR FLOWS AT SEMERU … · MONITORING AND MODELLING LAHAR FLOWS AT...
10
MONITORING AND MODELLING LAHAR FLOWS AT SEMERU VOLCANO (JAVA, INDONESIA) Nicolas Lafarge 1 , Guillaume Chambon 1 , Jean-Claude Thouret 2 and Dominique Laigle 1 ABSTRACT Lahars are fast moving mixtures of debris and water. They have been responsible for 40% of all volcanic fatalities over the past century. Development of numerical models capable of accurately simulating these complex debris flows requires a good understanding of sediment transport processes and flow mechanical properties. To provide constraints on these characteristics, we use hydraulic data measured in a river channel at Semeru volcano during real lahars. In addition, rheological tests have been carried out in laboratory to infer the rheological behavior of lahar constitutive material, while the hydraulic relationship between flow height and discharge in control sections is investigated. These elements are then implemented in a code relying on shallow-water equations to simulate the propagation of gravity-driven surges on real topographies and with real hydrograph inputs. Keywords: Lahar, hyperconcentrated flow, debris flow, in-situ monitoring, numerical model, shallow-water approach. INTRODUCTION Lahars are mixtures of water and debris flowing down the flanks of volcanoes. These flows generally occur after heavy rainfall and carry sediments deposited by volcanic eruptions. They are among the most destructive volcanic phenomena, and were responsible, in the 20th century, for 40% of the fatalities associated with volcanic eruptions worldwide (Vallance, 2000, Dumaisnil et al., 2010). However, the mechanical behaviour and the propagation of these flows still remain poorly understood. The French ANR project ‘Laharisk’ aims at improving the knowledge on lahar dynamics, and at providing efficient prediction tools to mitigate the associated risks. In this context, Mount Semeru in east Java (Indonesia) was chosen as a test site due to its persistent volcanic activity and the frequent occurrence of lahars on its flanks during the monsoon rainy period. The erosion rate at Mount Semeru is 4 10 5 t km -2 year -1 , which is comparable to other explosive volcanoes in humid climate (Thouret et al., 2007). Besides due to the constant turnover of the sediment, Mount Semeru is one of the largest producers of lahars in the world (Thouret et al., 2007). Two types of lahars are observed at Mount Semeru: frequent hyperconcentrated flows (concentration ranging between 20 and 60% by volume), and much rarer debris flows (concentration larger than 60%) (Thouret et al., 2007). The flows generally comprise several distinct pulses or ‘packets’ (Doyle et al., 2009, 2010, 2011). Each pulse lasts between 5 and 30 minutes. The typical flows have heights, peak velocities, and maximum discharges in the ranges 0.5–2 m, 3–6 m.s -1 , and 25–250 m 3 .s -1 , respectively (Doyle et al., 2009, 2010). The rheological characterization of lahar constitutive materials is difficult due to the wide grain size distribution of flowing sediment. In addition, the dominant force balance relevant in the mixture may strongly depend on the concentration as well as on the specific characteristics of the particle size distribution (Coussot and Ancey, 1999; Coussot, 2005; Ancey, 2007). The fine silt particle represent 10 at 30% of total particle, the sand represent 50 at 90% and the gravel 0 at 10%. Preliminary 1 Cemagref, UR ETGR, Grenoble, France (e-mail: [email protected]). 2 PRES Clermont, Université Blaise Pascal, Laboratoire Magmas et Volcans, UMR 6524 CNRS et IRD, Clermont-Ferrand, France. 12 th Congress INTERPRAEVENT 2012 – Grenoble / France Conference Proceedings www.interpraevent.at - 191 -
Transcript of MONITORING AND MODELLING LAHAR FLOWS AT SEMERU … · MONITORING AND MODELLING LAHAR FLOWS AT...

MONITORING AND MODELLING LAHAR FLOWS AT SEMERU
VOLCANO (JAVA, INDONESIA)
Nicolas Lafarge1, Guillaume Chambon1, Jean-Claude Thouret2 and Dominique Laigle1
ABSTRACT
Lahars are fast moving mixtures of debris and water. They have been responsible for 40% of all volcanic fatalities over the past century. Development of numerical models capable of accurately simulating these complex debris flows requires a good understanding of sediment transport processes and flow mechanical properties. To provide constraints on these characteristics, we use hydraulic data measured in a river channel at Semeru volcano during real lahars. In addition, rheological tests have been carried out in laboratory to infer the rheological behavior of lahar constitutive material, while the hydraulic relationship between flow height and discharge in control sections is investigated. These elements are then implemented in a code relying on shallow-water equations to simulate the propagation of gravity-driven surges on real topographies and with real hydrograph inputs. Keywords: Lahar, hyperconcentrated flow, debris flow, in-situ monitoring, numerical model, shallow-water approach.
INTRODUCTION
Lahars are mixtures of water and debris flowing down the flanks of volcanoes. These flows generally occur after heavy rainfall and carry sediments deposited by volcanic eruptions. They are among the most destructive volcanic phenomena, and were responsible, in the 20th century, for 40% of the fatalities associated with volcanic eruptions worldwide (Vallance, 2000, Dumaisnil et al., 2010). However, the mechanical behaviour and the propagation of these flows still remain poorly understood. The French ANR project ‘Laharisk’ aims at improving the knowledge on lahar dynamics, and at providing efficient prediction tools to mitigate the associated risks. In this context, Mount Semeru in east Java (Indonesia) was chosen as a test site due to its persistent volcanic activity and the frequent occurrence of lahars on its flanks during the monsoon rainy period. The erosion rate at Mount Semeru is 4 105t km-2 year-1, which is comparable to other explosive volcanoes in humid climate (Thouret et al., 2007). Besides due to the constant turnover of the sediment, Mount Semeru is one of the largest producers of lahars in the world (Thouret et al., 2007). Two types of lahars are observed at Mount Semeru: frequent hyperconcentrated flows (concentration ranging between 20 and 60% by volume), and much rarer debris flows (concentration larger than 60%) (Thouret et al., 2007). The flows generally comprise several distinct pulses or ‘packets’ (Doyle et al., 2009, 2010, 2011). Each pulse lasts between 5 and 30 minutes. The typical flows have heights, peak velocities, and maximum discharges in the ranges 0.5–2 m, 3–6 m.s-1, and 25–250 m3.s-1, respectively (Doyle et al., 2009, 2010). The rheological characterization of lahar constitutive materials is difficult due to the wide grain size distribution of flowing sediment. In addition, the dominant force balance relevant in the mixture may strongly depend on the concentration as well as on the specific characteristics of the particle size distribution (Coussot and Ancey, 1999; Coussot, 2005; Ancey, 2007). The fine silt particle represent 10 at 30% of total particle, the sand represent 50 at 90% and the gravel 0 at 10%. Preliminary
1 Cemagref, UR ETGR, Grenoble, France (e-mail: [email protected]). 2 PRES Clermont, Université Blaise Pascal, Laboratoire Magmas et Volcans, UMR 6524 CNRS et IRD, Clermont-Ferrand, France.
12th Congress INTERPRAEVENT 2012 – Grenoble / France Conference Proceedings www.interpraevent.at
- 191 -

rheological tests on the fine sediment fraction (<400 microns) sampled in situ indicate a mechanical behaviour of the frictional type (Dumaisnil et al., 2010). The goal of this study is to develop a numerical model incorporating the rheology of the material and the hydraulic characteristics of lahar flows. This model will allow to better understand the propagation of these flows and to predict their impacts on the environment. To this purpose, rheological tests will be conducted with a laboratory rheometer on the finest fraction (≤400µm) of material sampled in situ, in order to formulate a proper constitutive law for these flows. The constitutive law will then be implemented in the code Lave2D developed at Cemagref (Laigle and Coussot, 1997). The code will be validated and calibrated against the field data acquired at Semeru volcano.
LAHAR MONITORING
Observations and measurement on lahars flows at Mount Semeru (Fig.1) are carried out on two sites (Doyle et al., 2009, 2010, 2011). The measurement sites are located in the Lengkong River on the southeast flank of the volcano 9.5 km from the summit. The first site was installed on a sabo dam (Fig.3) and the second site lies on the lava bedrock (Fig.2). The downstream site has been instrumented since 2002 (Lavigne and Thouret, 2002; Lavigne et al., 2003). The upstream site has been instrumented since 2006.
Fig. 1 The Mount Semeru volcano is located in eastern Java island. The study area is located on Semeru’s south flank in the lower reach of the Lengkong river, a tributary to Kobokan river.
- 192 -

Fig. 2 Upstream site (inset: cross-section at the site)
Fig. 3 Downstream site (inset: cross-section at the site)
Fig. 4 a) Pore pressure sensor (from Prosensor) and its housing in the bedrock. b) AFM geophone (from Massey University) and a 3 component broad-band seismometer (from Guralp). c) Load cell sensor (from ScotTech-Solinst).
a) b)
c)
- 193 -

The two stations are 510 m apart with a height difference of 28 m and a slope of 3° on average. The river between the two sites is 30 – 40 m wide. The relatively straight and box-shaped channel between the two stations represents a natural flume well suited to study the hydraulics of the flows. Both stations are equipped with video cameras, pore-pressure and load sensors, AFM geophones, and one broad-band seismometer. AFM geophones help to determine the wave velocity of the lahar event. The cameras measure instantaneous flow velocities in the two sites. Pore-pressure sensors and cameras can monitor the height of the flow over time. In addition, the AFM geophone and load sensors bring information on the perpendicular and normal stresses exerted by the flows (Doyle et al., 2010; 2011; Dumaisnil et al., 2010). Bucket samples are also directly taken in the flows at regular time-intervals in order to provide sediment concentration and grain-size distribution. The rheological behaviour of the material is approached through laboratory vane tests conducted on the fine sand and silt-sized fraction (< 400 µm) of the samples. In addition, a D-GPS survey and a complete laser-scanning of the channel have been performed to provide accurate digital elevation models of the site.
MONITORING DATA
Fig. 5 Rheometrical measurements on lahar flow samples using a vane tool: friction coefficient versus vane rotation velocity for three different sediment concentrations. The quasi-constant friction coefficient indicates a frictional rheological behaviour. (Figure from Dumaisnil et al., 2010.)
The validation of the model will focus on the 5 March 2008 lahar event. The recording of this event is complete, the data were processed in detail and concentration measurements were made during the flow (Doyle et al., 2009, 2010). This event involves one of the most concentrated flows that have been recorded in the downstream site. The flow was divided in four ‘packets’ that showed a solid concentration 26%, 48%, 60% and 40%, respectively (concentration measured at the downstream site). The average speed of each packet is determined by the flow travel time of the fronts between the two sites. The instantaneous body velocity is measured by the video cameras. By correlating the video
images, we obtain the surface velocity usurf of the flow. To compute the body velocity u
b , we apply
a correction factor k expressed as: ub= ku
surf . This factor k accounts for the shape of the vertical velocity profile within the flow, which is related to the flow rheology, bed roughness, channel aspect ratio, particle volume concentration, and turbulence (Creutin et al., 2003). We used 0.75 for the value of k (Doyle et al., 2010). The discharge is calculated as the product of the body velocity by the flow height measured by the pore pressure sensor. The corresponding values are summarized in Tab. 1, 2 and Figs. 6, 7, 8.
- 194 -

Tab.1 Hydraulic characteristics of the different packets on the upstream site
Upstream site
Time-average
height (m)
Maximum height (m)
Time-average velocity (m.s-1)
Maximum velocity (m.s-1)
Time-average
discharge (m3.s-1)
Maximum discharge (m3.s-1)
Packet 1 0,45 0,61 1,4 1,8 3,5 5,5 Packet 2 0,67 0,88 1,1 2,1 4,9 10,5 Packet 3 0,66 0,92 1,5 2,1 6,7 12,1 Packet 4 0,47 0,68 1,1 1,8 3,1 7,9
Tab.2 Hydraulic characteristics of the four packets at the downstream site for 5 March 2008 lahar event.
Downstream site
Time-average height (m)
Maximum height (m)
Time-average velocity (m.s-1)
Maximum velocity (m.s-1)
Time-average discharge (m3.s-1)
Maximum discharge (m3.s-1)
Packet 1 0,28 0,35 1,2 1,7 2,6 4,3 Packet 2 0,52 0,73 1,7 2,4 12,2 22,7 Packet 3 0,39 0,68 0,9 1,8 4,6 15,2 Packet 4 0,32 0,46 0,6 1,2 1,7 4,2
The average velocity of the fronts between the two sites is 1.5 ± 0.1m/s for the packet 1, 2.9 ± 0.2m/s for the packet 2, 4.0 ± 0.3m/s for the packet 3, and 1.8 ± 0.1m/s for the packet 4. The peak body
velocity bu at the downstream site occurs during packet 2 with a value of 2.4±0.4 m/s. However, note
that the highest propagation velocity between the sites is recorded for packet 3, which also shows the highest solid concentration. This difference between peak propagation and body velocities may arise from an incorrect velocity distribution curve used in the body velocity calculations. The differences between the propagation and body velocities are not apparent for all recorded events. The peak discharge at both sites occurs during packet 2, and it can be noted that this discharge increased between the upstream and the downstream sites. This increase may be due to a partial coalescence of the packets (Doyle et al., 2009, 2010) and/or to erosion of the bed by the flow. For the other packets, the average discharge decreased between the two sites. This can be explained by a deposition of material along the channel.
- 195 -

Fig.6 Fluctuations in discharge of the four packets that formed the 5 March 2008 lahar.
Fig.7 Height of the 5 March 2008 flow for the four distinct packets.
- 196 -

Fig.8 The associated body velocity of the 5 March 2008 flow for the four distinct packets.
NUMERICAL MODELLING
Numerical modelling of lahars flows is performed using the Cemagref ‘Lave2D’ code (Laigle et al., 2003; Rickenmann et al., 2006). This code relies on shallow-water equations and simulates the propagation of gravity-driven surges on real topographies (Fig. 9).
Fig. 9 Lahar propagation in the Curah Lengkong channel (monitoring data) using the Lave2D code (preliminary result). The color coded scale represents the flow height in meters. Time interval between each plot is 1000 s. The black lines represent the iso-altitude.
The formulation of the shallow-water equations uses a coordinate system that is parallel to bed and is based on the assumptions (Cunge et al., 1980) that fluid density is constant and that vertical accelerations (varying width of the flume, centrifugal acceleration, etc.) can be neglected. As a consequence, a hydrostatic pressure distribution is assumed. Channelled flows are represented by the following one–dimensional system of equations:
- 197 -

−=
+∂
∂+
∂
∂
FrgSxSPS
Q
Q
Q
S
xt θβ sin
0
),(²
where x is distance along channel axis; t is time; θ is channel slope; g is gravity; S is cross-section
area; Q is discharge in this section; β is momentum coefficient ( β= u2/u2
); Fr is the friction
contribution over a cross section ( m3 . s− 2); P(S,x) is a pressure strength over cross section, with
x
hgS
x
xSP
∂
∂=
∂
∂θcos
),(
The front is represented on grid points by discontinuities that verify physical balances but do not express the detailed structure of the front. The friction contribution Fr accounts for the rheological behaviour of the material which, in the case of lahars, still has to be defined. Currently the rheological law implemented in the code is a Herschel-Buckley law. This law applies to cohesive flows (yield-stress fluids). However, lahars appear to behave as non-cohesive granular materials, with a friction coefficient strongly dependent on the concentration (Dusmainil et al., 2010). Further studies of the rheology of these materials are required to formulate an adapted constitutive law.
CONSTITUTIVE LAW
At the scale of the flow, the rheology of the material can also be investigated through the relationship between height and discharge in control sections. This relationship is plotted for each 'packet' in Fig.10. It appears that the curve Q(h) varies with the concentration of the flow. As expected, the concentration thus appears to play an important role on the rheological behavior of flow.
We adjusted the curves Q(h) for each packet using a power function of the form αhAQ .= . Two
values of the exponent α have been tested: α= 3, corresponding to a Newtonian fluid, and α= 2.5, corresponding to a granular fluid (G.D.R. Midi, 2004) (Tab.3). As seen in Tab. 3, the value n= 2.5 provides the best adjustment to the data for the four packets of the 5 March 2008 lahar (error is
calculated as 2).( αhAQerror mesured −=∑ ), in agreement with the local rheological study
(granular behaviour). We also observe that the consistency η of the fluid, defined as
nAn
n θρη
sin12 += , which is representative of its apparent viscosity, increases as the concentration
increases, with the exception of the last packet (may be another behaviour).
Tab. 3 Result of the adjustment of the Q(h) curves by power functions (see text)
Packet n° Concentration Factor A Power α Consistency η Error
1 26% 107,745 3 2,24912734 93,4906 59,1385 2,5 0.083148 79,5444
2 48% 74,4334 3 4,06501656 2142,26 58,1453 2,5 0.10739454 1706,81
3 60% 61,6452 3 5,4413257 581,642 45,7954 2,5 0.19192941 513,236
4 40% 42,5778 3 6,59186868 232,836 25,6955 2,5 0.51010416 229,915
In future work, these Q(h) relationships will be used to calibrate the numerical model. Steady uniform flows will be generated at each station for various input discharges and a numerical Q(h) relationship will hence be constructed and compared to the data. This comparison should allow us, in particular, to define characteristic values for the rheological parameters involved in the code. Finally, the code will be validated in transient cases by entering real hydrographs at the upstream station and comparing the simulated and measured time series at the downstream station.
- 198 -
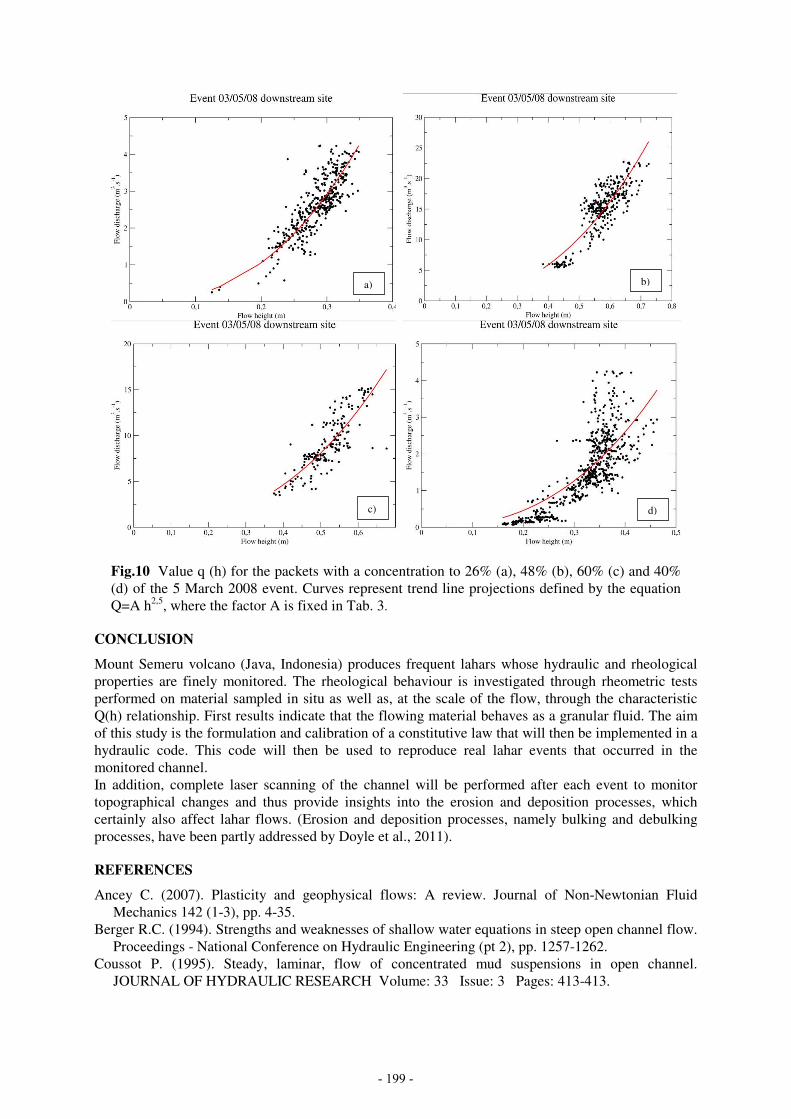
Fig.10 Value q (h) for the packets with a concentration to 26% (a), 48% (b), 60% (c) and 40% (d) of the 5 March 2008 event. Curves represent trend line projections defined by the equation Q=A h2,5, where the factor A is fixed in Tab. 3.
CONCLUSION
Mount Semeru volcano (Java, Indonesia) produces frequent lahars whose hydraulic and rheological properties are finely monitored. The rheological behaviour is investigated through rheometric tests performed on material sampled in situ as well as, at the scale of the flow, through the characteristic Q(h) relationship. First results indicate that the flowing material behaves as a granular fluid. The aim of this study is the formulation and calibration of a constitutive law that will then be implemented in a hydraulic code. This code will then be used to reproduce real lahar events that occurred in the monitored channel. In addition, complete laser scanning of the channel will be performed after each event to monitor topographical changes and thus provide insights into the erosion and deposition processes, which certainly also affect lahar flows. (Erosion and deposition processes, namely bulking and debulking processes, have been partly addressed by Doyle et al., 2011).
REFERENCES
Ancey C. (2007). Plasticity and geophysical flows: A review. Journal of Non-Newtonian Fluid Mechanics 142 (1-3), pp. 4-35.
Berger R.C. (1994). Strengths and weaknesses of shallow water equations in steep open channel flow. Proceedings - National Conference on Hydraulic Engineering (pt 2), pp. 1257-1262.
Coussot P. (1995). Steady, laminar, flow of concentrated mud suspensions in open channel. JOURNAL OF HYDRAULIC RESEARCH Volume: 33 Issue: 3 Pages: 413-413.
a) b)
c) d)
- 199 -

Coussot P., Ancey C. (1999). Rheophysical classification of concentrated suspensions and granular pastes. PHYSICAL REVIEW E Volume: 59 Issue: 4 Pages: 4445-4457 DOI: 10.1103/PhysRevE.59.4445.
Coussot P. (2005). Model for Brownian motion in soft-jammed systems. Physical Review Letters 95 (7), art. no. 078303, pp. 1-4.
Cunge J.A., Holly F.M., Verwey A. (1980). Practical aspects of computational river hydraulics. Pitman Publishing Ltd.
Creutin J.D., Muste M., Bradley A.A. et al. (2003). River gauging using PIV techniques: a proof of concept experiment on the Iowa River. JOURNAL OF HYDROLOGY Volume: 277 Issue: 3-4 Pages: 182-194 DOI: 10.1016/S0022-1694(03)00081-7.
Doyle E.E., Cronin S.J., Cole S.E., Thouret J.-C. (2009). "The challenges of incorporating temporal and spatial changes into numerical models of lahars." In Anderssen, R.S., R.D. Braddock and L.T.H. Newham (eds.), 18th World IMACS Congress and MODSIM09 International Congress on Modelling and Simulation. Modelling and Simulation Society of Australia and New Zealand and International Association for Mathematics and Computers in Simulation, July 2009, pp. 2665-2671. ISBN: 978-0-9758400-7-8.
Doyle E.E., Cronin S.J., Cole S.E., Thouret J.-C. (2010). The coalescence and organization of lahars at Semeru, Indonesia. Bulletin of Volcanology, 72(8): 961-970.
Doyle E., Cronin S.J., Thouret J.-C. (2011). Cycles of bulking and debulking in lahars at Semeru, Indonesia. Geological Society America Bulletin, 123, 1234-1246,. doi:10.1130/B30227.1.
Dusmaisnil C., Thouret J.-C., Chambon G., Doyle E.E., Cronin S.J., Surono (2010). Hydraulic, physical and rheological characteristics of rain-trigerred lahars at Semeru volcano, Indonesia. Earth Surface Processes and Landforms 35: 1573-1590.
MiDi GDR (2004). On dense granular flows, EUROPEAN PHYSICAL JOURNAL E Volume: 14 Issue: 4 Pages: 341-365 DOI: 10.1140/epje/i2003-10153-0
Laigle D., Hector A.-F., Hübl J., Rickenmann D. (2003). Comparison of numerical simulation of muddy debris flow spreading to records of real events. Proceedings of the 3rd International Conference “Debris-Flow Hazards Mitigation”, Davos, Switzerland, 10-12 september 2003, D. Rickenmann & C.-L. Chen (Eds.), MILLPRESS: 635-646.
Laigle D., Coussot P. (1997). Numerical modeling of mudflows. Journal of Hydraulic Engineering 123 (7), pp. 617-623.
Lavigne F., Thouret J.-C. (2002). Sediment transportation and deposition by rain-triggered lahars at Merapi Volcano, Central Java, Indonesia. Geomorphology 49 (1), pp. 45-69.
Rickenmann D., Laigle D., McArdell B.W., Hübl J. (2006). Comparison of 2D debris-flow simulation models with field events. Computational Geosciences 10: 241-264.
Thouret J.-C., Lavigne F., Suwa H., Sukatja B., Surono (2007). Volcanic hazards at Mount Semeru, East Java(Indonesia), with emphasis on lahars. Bulletin of Volcanology 70 (2), pp. 221-244.
- 200 -