MONITORING AND EVALUATION - iapsmgc.org OF PGCHSM/Monitoring... · Difference between monitoring...
20
Module 7 MONITORING AND EVALUATION Indian Association of Preventive and Social Medicine Gujarat Chapter
Transcript of MONITORING AND EVALUATION - iapsmgc.org OF PGCHSM/Monitoring... · Difference between monitoring...
Module 7
MONITORING AND EVALUATION
Indian Association of Preventive and Social Medicine
Gujarat Chapter
PGCHSM 2013 Monitoring & Evaluation Page 2
MONITORING & EVALUATION
Learning objectives :
1. Understanding the monitoring and evaluation as a managerial function. 2. Knowing difference between the monitoring and evaluation. 3. Able to draw the M&E frame work for health project or program.
Monitoring & Evaluation(M&E) is one of the important managerial functions and it
starts with with planning step. Monitoring & Evaluation aim to keep the all activities on
track and bring on track. Though this is the simplest understanding about the M&E but
it is much more complex function with various and divers objectives. M&E is for
evidence-based planning. M&E should be part of the design of a program.
M&E is using indicator-based monitoring tools under which systematic data gathering is
carried out. Information from Monitoring & Evaluation can be used by program
managers, professional groups, policy makers, international agencies. It is used to raise
awareness/numbers for advocacy. It helps in comparisons between facilities, districts,
regions, countries depending on sampling, facilitates measuring trends, and provides
evidence for prioritising planning and interventions. M&E shows whether a
service/program is accomplishing its goals. It identifies program weaknesses and
strengths, areas of the program that need revision, and areas of the program that meet
or exceed expectations.
Monitoring progress and evaluating results are key functions to improve the
performance of those responsible for implementing health services. It provides
information for improved decision making and promotes continuous learning and
improvement. It ensures efficiency and effectiveness by helping in deciding appropriate
strategies/correction in actions and allocation of resources.
Monitoring :
We carry out monitoring simply because we know that things don’t always go according
to plan (no matter how much we prepare)To detect and react appropriately to
deviations and changes to plans.
Monitoring is a planned, systematic process of observation that closely follows a course
of activities, and compares what is happening with what is expected to happen.
Monitorign requires periodic collection and review of information on programme
implementation, coverage and use for comparison with implementation plans, ,
identifies shortcomings before it is too late, provides elements of analysis as to why
progress fell short of expectations, modifying original plans during implementation if
required.
It is a day-to-day follow up of activities during implementation to measure progress and
identify deviations. It requires routine assessment and follow up of activities and results
PGCHSM 2013 Monitoring & Evaluation Page 3
are carried out to ensure activities are proceeding as planned and are on schedule. As a
part of monitoring; tracking of inputs and outputs is kept. They are compared to see
whether it is as per plan or not. Problem is identified and addressed to ensure effective
use of resources, quality and strengthening accountability.
Management monitors following key areas.
Men (human resources), Machines, Materials, Money, Space, Time, Tasks, Quality/Technical Performance.
Inputs : Time, Money, Resources, Material Usage, Tasks, Quality/Technical Performance
Outputs : Progress, Costs, Job starts, Job completion, Engineering / Design changes, Variation order (VO)
Monitoring process:
Monitoring is carried out from field of head office. It is carried out through meetings
with clients, Stakeholders, For schedule – Update CPA, PERT Charts, Update Gantt
Charts, Milestones, Record, Registers, Reports, Supervision and inspections, HMIS
(Health Management Information System) Updating, episodic assessment of overall
achievement and impacts.
Evaluation
A process that assesses an achievement against preset criteria. Has a variety of
purposes, and follow distinct methodologies (process, outcome, performance, etc). A
systematic process to determine the extent to which service needs and results have
been or are being achieved and analyse the reasons for any discrepancy. It is an attempt
to measure service’s relevance, efficiency and effectiveness. It measures whether and to
what extent the programme’s inputs and services are improving the quality of people’s
lives.
Evaluation can focus on:
• Projects: normally consist of a set of activities undertaken to achieve specific
objectives within a given budget and time period.
• Programs :are organized sets of projects or services concerned with a particular
sector or geographic region
• Services: are based on a permanent structure, and, have the goal of becoming,
national in coverage, e.g. Health services, whereas programmes are usually
limited in time or area.
• Processes: are organizational operations of a continuous and supporting nature
(e.g. personnel procedures, administrative support for projects, distribution
systems, information systems, management operations).
PGCHSM 2013 Monitoring & Evaluation Page 4
• Conditions: are particular characteristics or states of being of persons or things
(e.g. disease, nutritional status, literacy, income level).
Evaluation is carried out by internal evaluator or external evaluation depending type
and objectives of evaluation.
Internal evaluation (self evaluation), in which people within a program sponsor, conduct and control the evaluation.
• External evaluation, in which someone from beyond the program acts as the
evaluator and controls the evaluation.
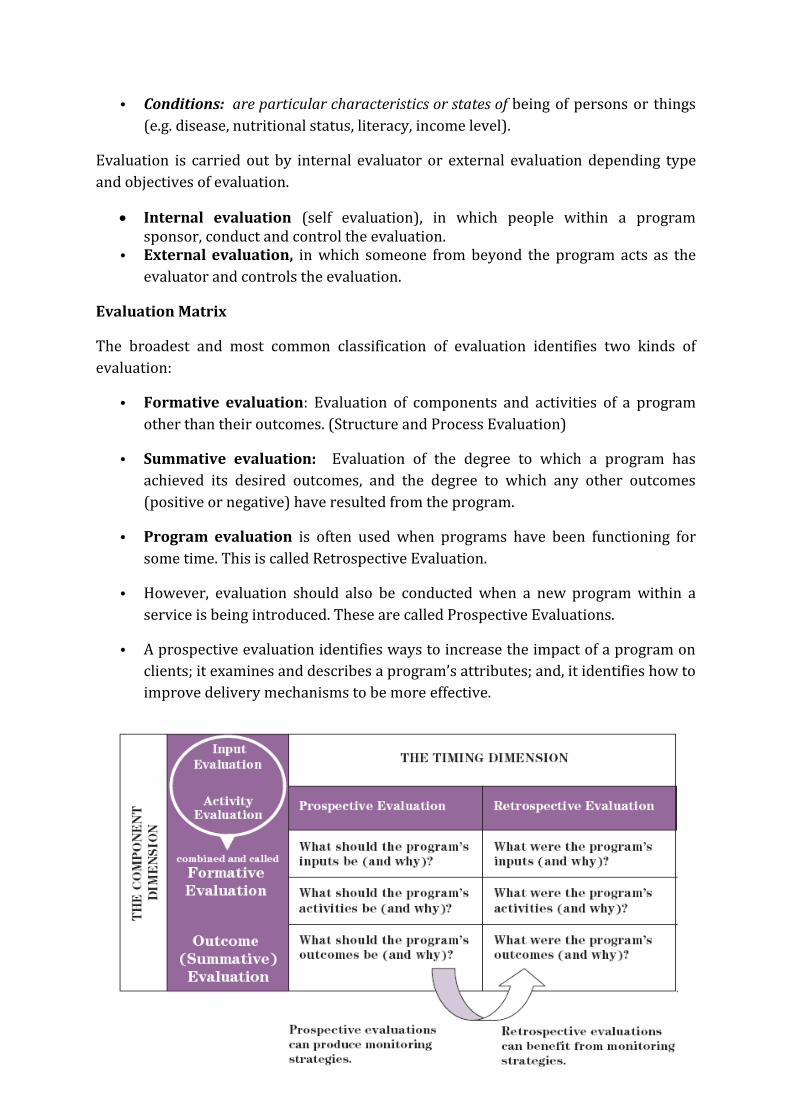
Evaluation Matrix
The broadest and most common classification of evaluation identifies two kinds of
evaluation:
• Formative evaluation: Evaluation of components and activities of a program
other than their outcomes. (Structure and Process Evaluation)
• Summative evaluation: Evaluation of the degree to which a program has
achieved its desired outcomes, and the degree to which any other outcomes
(positive or negative) have resulted from the program.
• Program evaluation is often used when programs have been functioning for
some time. This is called Retrospective Evaluation.
• However, evaluation should also be conducted when a new program within a
service is being introduced. These are called Prospective Evaluations.
• A prospective evaluation identifies ways to increase the impact of a program on
clients; it examines and describes a program’s attributes; and, it identifies how to
improve delivery mechanisms to be more effective.
PGCHSM 2013 Monitoring & Evaluation Page 5
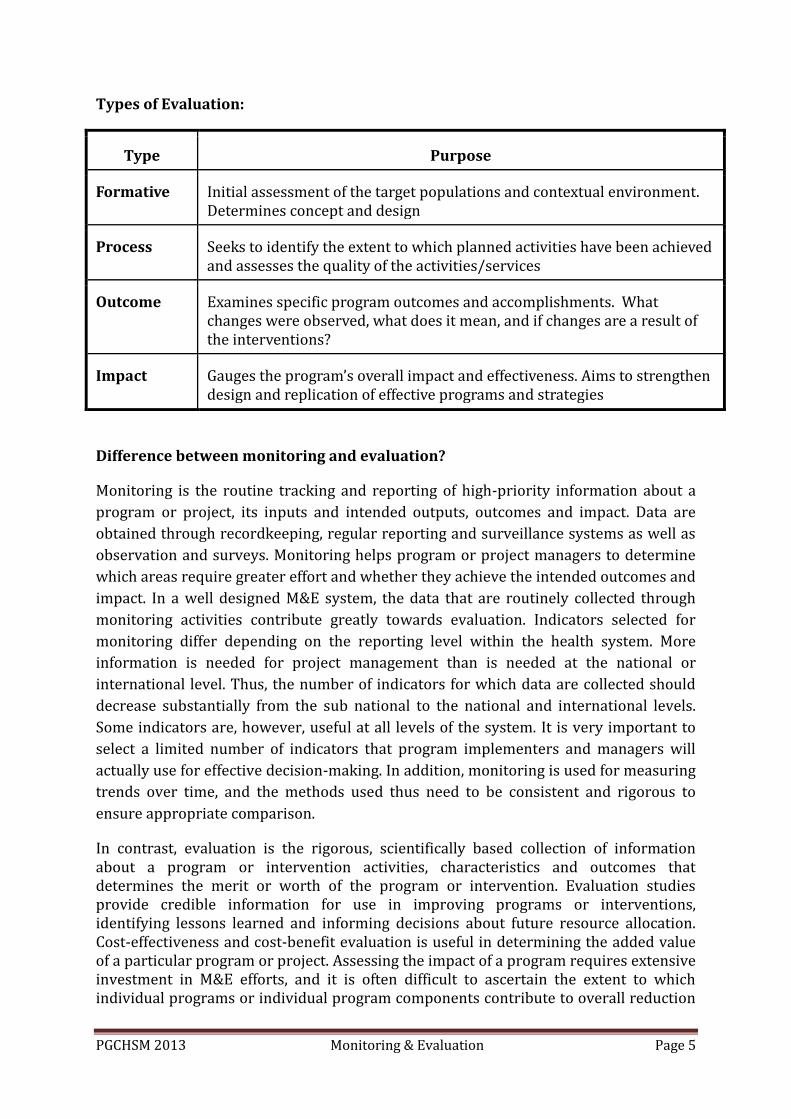
Types of Evaluation:
Type Purpose
Formative Initial assessment of the target populations and contextual environment. Determines concept and design
Process Seeks to identify the extent to which planned activities have been achieved and assesses the quality of the activities/services
Outcome Examines specific program outcomes and accomplishments. What changes were observed, what does it mean, and if changes are a result of the interventions?
Impact Gauges the program’s overall impact and effectiveness. Aims to strengthen design and replication of effective programs and strategies
Difference between monitoring and evaluation?
Monitoring is the routine tracking and reporting of high-priority information about a
program or project, its inputs and intended outputs, outcomes and impact. Data are
obtained through recordkeeping, regular reporting and surveillance systems as well as
observation and surveys. Monitoring helps program or project managers to determine
which areas require greater effort and whether they achieve the intended outcomes and
impact. In a well designed M&E system, the data that are routinely collected through
monitoring activities contribute greatly towards evaluation. Indicators selected for
monitoring differ depending on the reporting level within the health system. More
information is needed for project management than is needed at the national or
international level. Thus, the number of indicators for which data are collected should
decrease substantially from the sub national to the national and international levels.
Some indicators are, however, useful at all levels of the system. It is very important to
select a limited number of indicators that program implementers and managers will
actually use for effective decision-making. In addition, monitoring is used for measuring
trends over time, and the methods used thus need to be consistent and rigorous to
ensure appropriate comparison.
In contrast, evaluation is the rigorous, scientifically based collection of information about a program or intervention activities, characteristics and outcomes that determines the merit or worth of the program or intervention. Evaluation studies provide credible information for use in improving programs or interventions, identifying lessons learned and informing decisions about future resource allocation. Cost-effectiveness and cost-benefit evaluation is useful in determining the added value of a particular program or project. Assessing the impact of a program requires extensive investment in M&E efforts, and it is often difficult to ascertain the extent to which individual programs or individual program components contribute to overall reduction
PGCHSM 2013 Monitoring & Evaluation Page 6
in cases and increased survival. Establishing a cause–effect relationship for a given intervention may require studies with experimental or quasi-experimental designs to demonstrate the impact. Monitoring of output or outcome indicators can also identify such relationships and give a general indication of program progress according to agreed goals and targets. The objectives and the methods used in monitoring and evaluation differ. In general, evaluation is more difficult in view of the methodological rigor needed: without such rigor, wrong conclusions can be drawn on the value of a program or project. It is also more costly; especially outcome evaluation and impact evaluation, which often require population based surveys or rigorous evaluation designs such as those including comparison groups or regions. Evaluation should leverage data and surveys that are nationally available and regularly undertaken, such as population-based surveys, vital registration or sentinel site disease data.
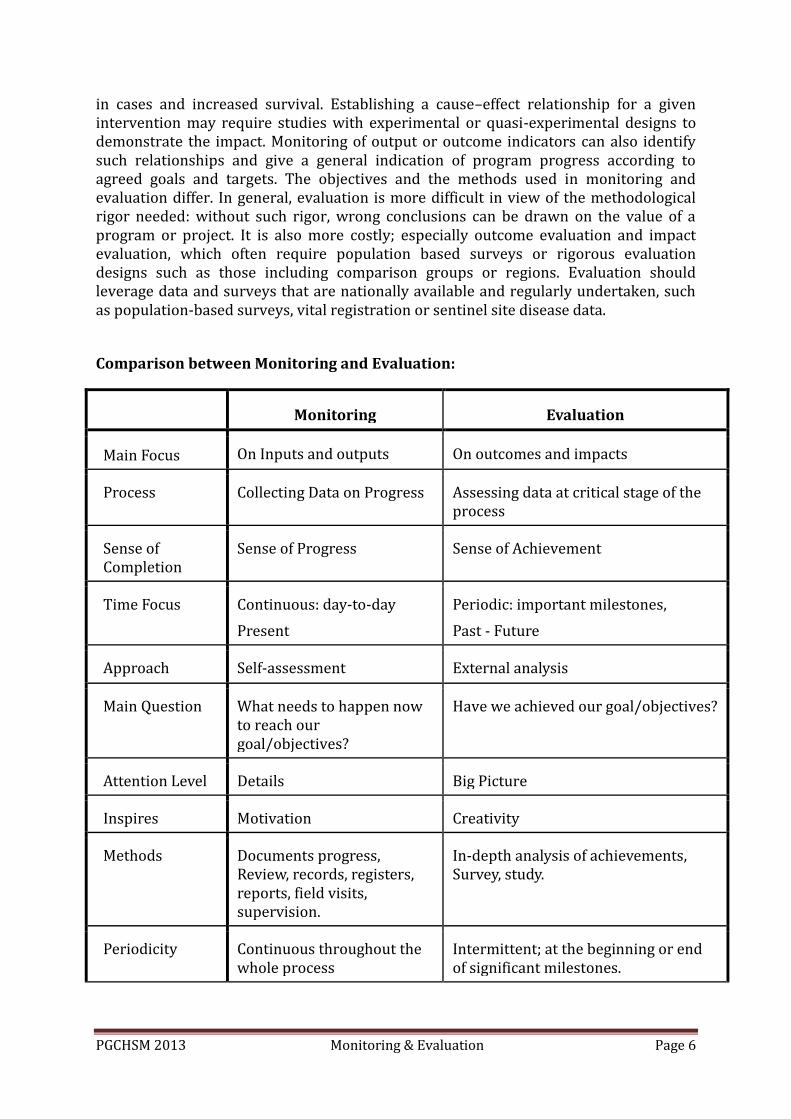
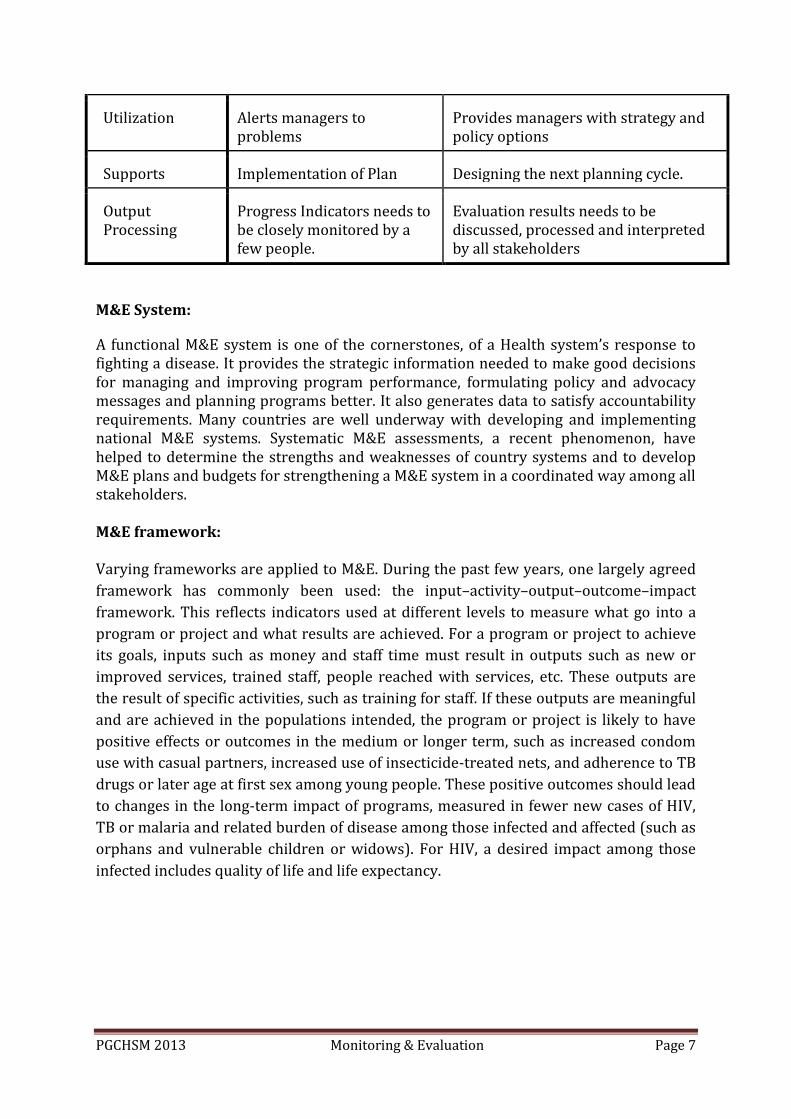
Comparison between Monitoring and Evaluation:
Monitoring Evaluation
Main Focus On Inputs and outputs On outcomes and impacts
Process Collecting Data on Progress Assessing data at critical stage of the process
Sense of Completion
Sense of Progress Sense of Achievement
Time Focus Continuous: day-to-day
Present
Periodic: important milestones,
Past - Future
Approach Self-assessment External analysis
Main Question What needs to happen now to reach our goal/objectives?
Have we achieved our goal/objectives?
Attention Level Details Big Picture
Inspires Motivation Creativity
Methods Documents progress, Review, records, registers, reports, field visits, supervision.
In-depth analysis of achievements, Survey, study.
Periodicity Continuous throughout the whole process
Intermittent; at the beginning or end of significant milestones.
PGCHSM 2013 Monitoring & Evaluation Page 7
Utilization Alerts managers to problems
Provides managers with strategy and policy options
Supports Implementation of Plan Designing the next planning cycle.
Output Processing
Progress Indicators needs to be closely monitored by a few people.
Evaluation results needs to be discussed, processed and interpreted by all stakeholders
M&E System:
A functional M&E system is one of the cornerstones, of a Health system’s response to fighting a disease. It provides the strategic information needed to make good decisions for managing and improving program performance, formulating policy and advocacy messages and planning programs better. It also generates data to satisfy accountability requirements. Many countries are well underway with developing and implementing national M&E systems. Systematic M&E assessments, a recent phenomenon, have helped to determine the strengths and weaknesses of country systems and to develop M&E plans and budgets for strengthening a M&E system in a coordinated way among all stakeholders. M&E framework: Varying frameworks are applied to M&E. During the past few years, one largely agreed
framework has commonly been used: the input–activity–output–outcome–impact
framework. This reflects indicators used at different levels to measure what go into a
program or project and what results are achieved. For a program or project to achieve
its goals, inputs such as money and staff time must result in outputs such as new or
improved services, trained staff, people reached with services, etc. These outputs are
the result of specific activities, such as training for staff. If these outputs are meaningful
and are achieved in the populations intended, the program or project is likely to have
positive effects or outcomes in the medium or longer term, such as increased condom
use with casual partners, increased use of insecticide-treated nets, and adherence to TB
drugs or later age at first sex among young people. These positive outcomes should lead
to changes in the long-term impact of programs, measured in fewer new cases of HIV,
TB or malaria and related burden of disease among those infected and affected (such as
orphans and vulnerable children or widows). For HIV, a desired impact among those
infected includes quality of life and life expectancy.
PGCHSM 2013 Monitoring & Evaluation Page 8
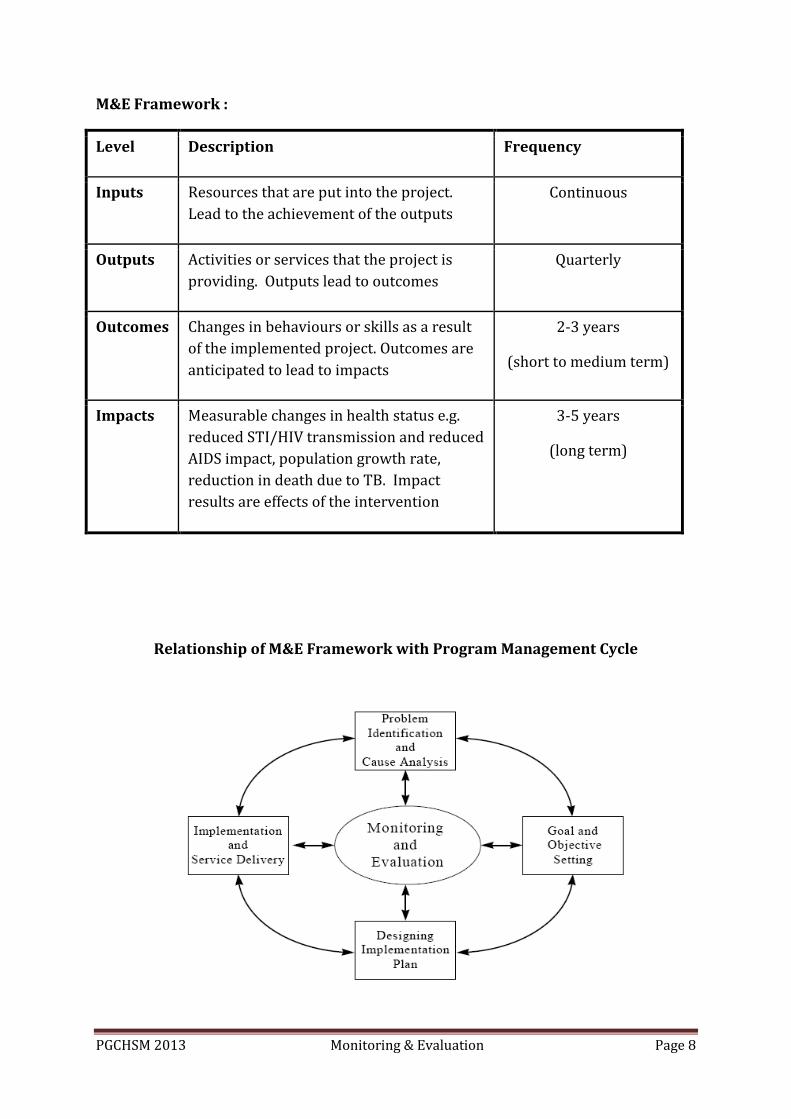
M&E Framework :
Level Description Frequency
Inputs Resources that are put into the project.
Lead to the achievement of the outputs
Continuous
Outputs Activities or services that the project is
providing. Outputs lead to outcomes
Quarterly
Outcomes Changes in behaviours or skills as a result
of the implemented project. Outcomes are
anticipated to lead to impacts
2-3 years
(short to medium term)
Impacts Measurable changes in health status e.g.
reduced STI/HIV transmission and reduced
AIDS impact, population growth rate,
reduction in death due to TB. Impact
results are effects of the intervention
3-5 years
(long term)
Relationship of M&E Framework with Program Management Cycle
PGCHSM 2013 Monitoring & Evaluation Page 9
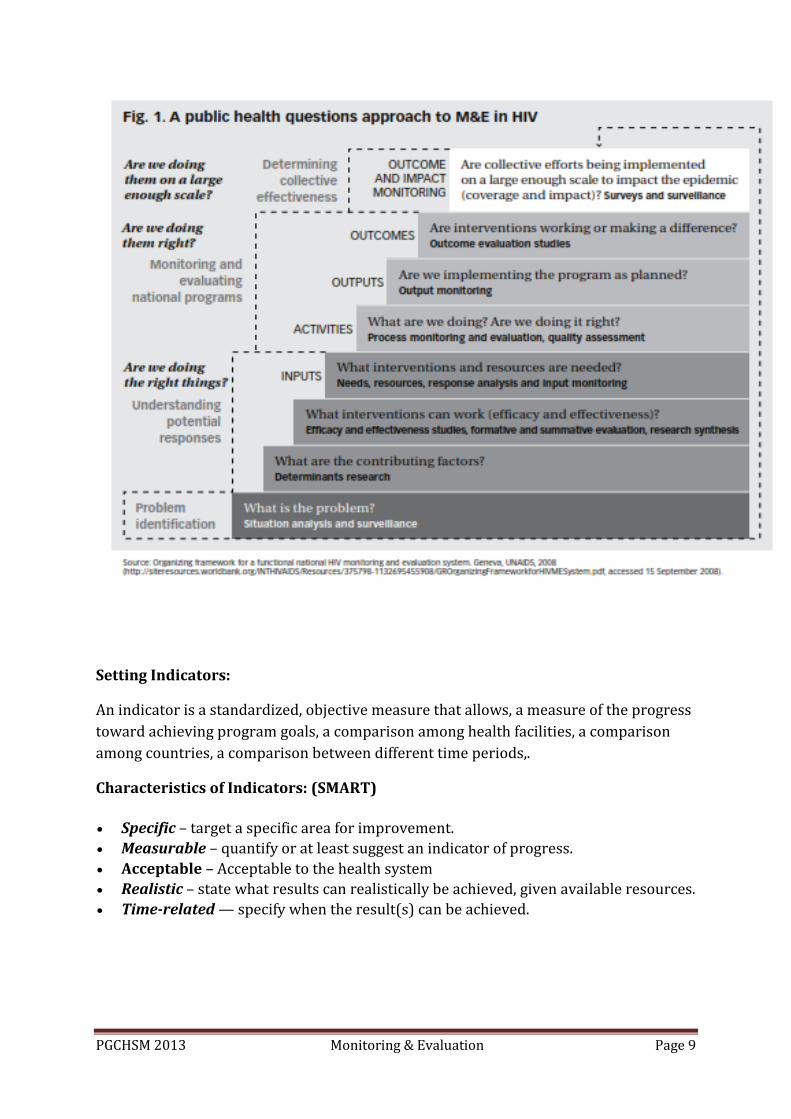
Setting Indicators:
An indicator is a standardized, objective measure that allows, a measure of the progress
toward achieving program goals, a comparison among health facilities, a comparison
among countries, a comparison between different time periods,.
Characteristics of Indicators: (SMART)
Specific – target a specific area for improvement.
Measurable – quantify or at least suggest an indicator of progress.
Acceptable – Acceptable to the health system
Realistic – state what results can realistically be achieved, given available resources.
Time-related — specify when the result(s) can be achieved.
PGCHSM 2013 Monitoring & Evaluation Page 10
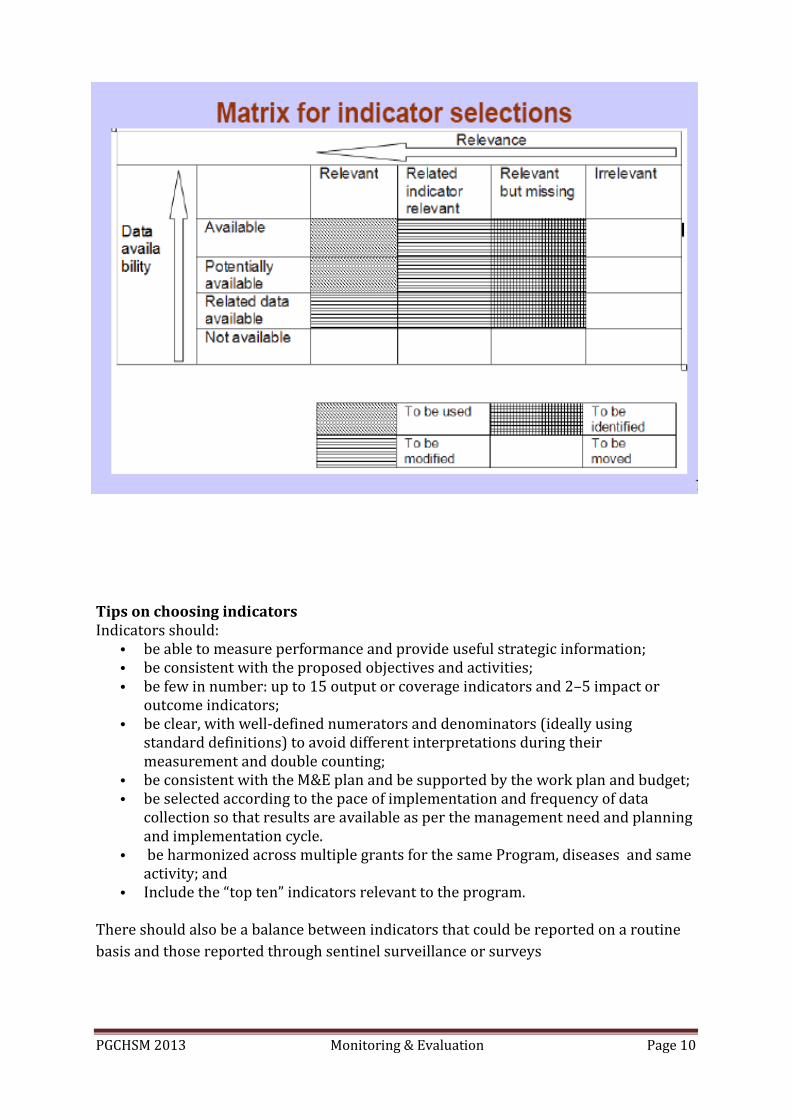
Tips on choosing indicators Indicators should:
• be able to measure performance and provide useful strategic information; • be consistent with the proposed objectives and activities; • be few in number: up to 15 output or coverage indicators and 2–5 impact or
outcome indicators; • be clear, with well-defined numerators and denominators (ideally using
standard definitions) to avoid different interpretations during their measurement and double counting;
• be consistent with the M&E plan and be supported by the work plan and budget; • be selected according to the pace of implementation and frequency of data
collection so that results are available as per the management need and planning and implementation cycle.
• be harmonized across multiple grants for the same Program, diseases and same activity; and
• Include the “top ten” indicators relevant to the program. There should also be a balance between indicators that could be reported on a routine
basis and those reported through sentinel surveillance or surveys
PGCHSM 2013 Monitoring & Evaluation Page 11
Methods of data collection
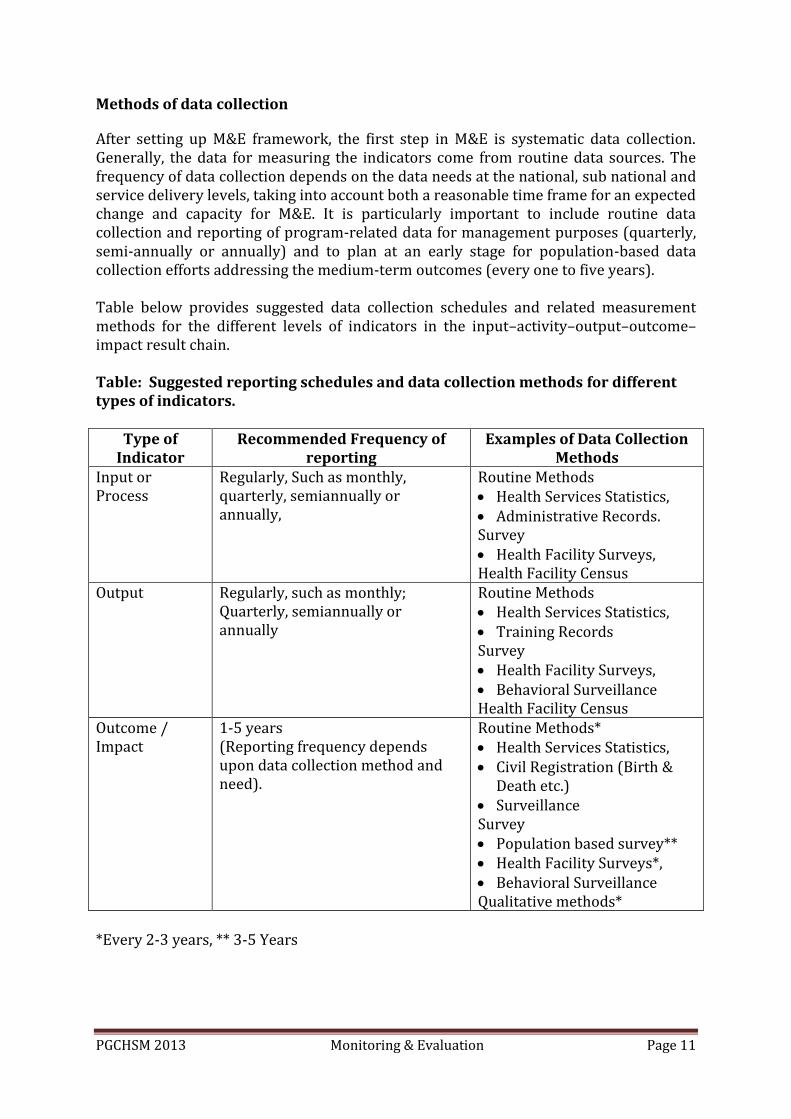
After setting up M&E framework, the first step in M&E is systematic data collection. Generally, the data for measuring the indicators come from routine data sources. The frequency of data collection depends on the data needs at the national, sub national and service delivery levels, taking into account both a reasonable time frame for an expected change and capacity for M&E. It is particularly important to include routine data collection and reporting of program-related data for management purposes (quarterly, semi-annually or annually) and to plan at an early stage for population-based data collection efforts addressing the medium-term outcomes (every one to five years). Table below provides suggested data collection schedules and related measurement methods for the different levels of indicators in the input–activity–output–outcome–impact result chain. Table: Suggested reporting schedules and data collection methods for different types of indicators.
Type of Indicator
Recommended Frequency of reporting
Examples of Data Collection Methods
Input or Process
Regularly, Such as monthly, quarterly, semiannually or annually,
Routine Methods Health Services Statistics, Administrative Records. Survey Health Facility Surveys, Health Facility Census
Output Regularly, such as monthly; Quarterly, semiannually or annually
Routine Methods Health Services Statistics, Training Records Survey Health Facility Surveys, Behavioral Surveillance Health Facility Census
Outcome / Impact
1-5 years (Reporting frequency depends upon data collection method and need).
Routine Methods* Health Services Statistics, Civil Registration (Birth &
Death etc.) Surveillance Survey Population based survey** Health Facility Surveys*, Behavioral Surveillance Qualitative methods*
*Every 2-3 years, ** 3-5 Years
PGCHSM 2013 Monitoring & Evaluation Page 12
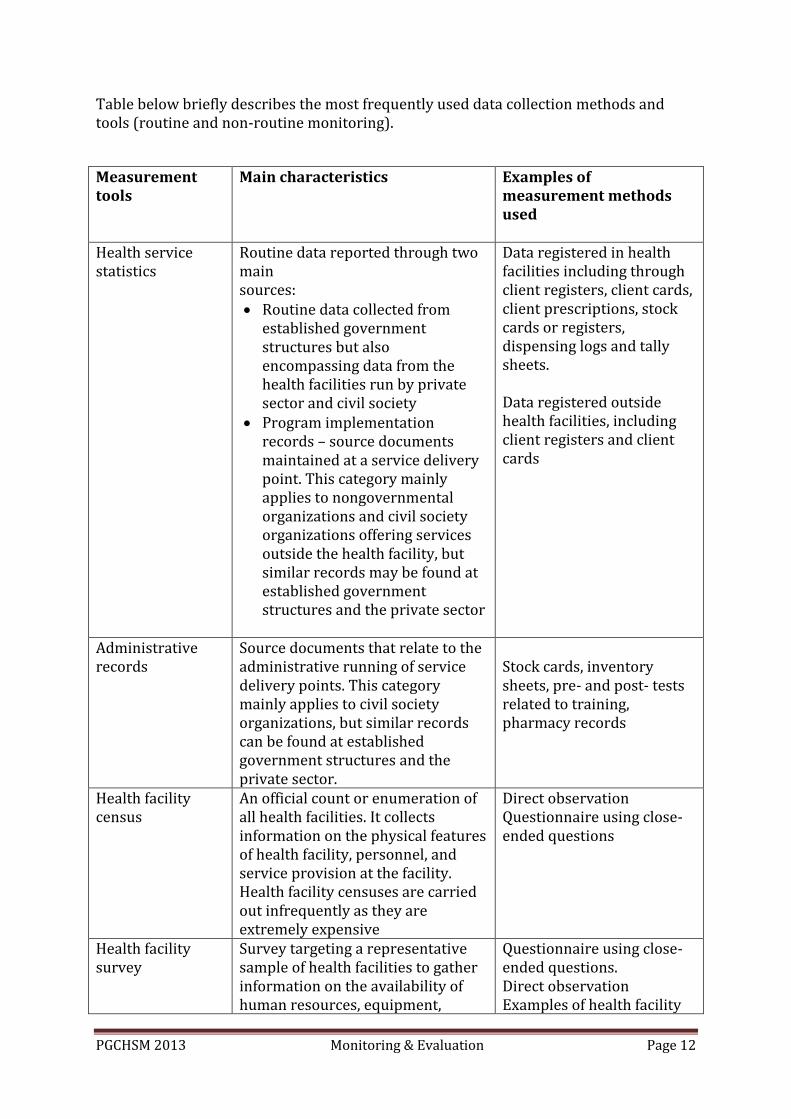
Table below briefly describes the most frequently used data collection methods and tools (routine and non-routine monitoring).
Measurement tools
Main characteristics
Examples of measurement methods used
Health service statistics
Routine data reported through two main sources: Routine data collected from
established government structures but also encompassing data from the health facilities run by private sector and civil society
Program implementation records – source documents maintained at a service delivery point. This category mainly applies to nongovernmental organizations and civil society organizations offering services outside the health facility, but similar records may be found at established government structures and the private sector
Data registered in health facilities including through client registers, client cards, client prescriptions, stock cards or registers, dispensing logs and tally sheets. Data registered outside health facilities, including client registers and client cards
Administrative records
Source documents that relate to the administrative running of service delivery points. This category mainly applies to civil society organizations, but similar records can be found at established government structures and the private sector.
Stock cards, inventory sheets, pre- and post- tests related to training, pharmacy records
Health facility census
An official count or enumeration of all health facilities. It collects information on the physical features of health facility, personnel, and service provision at the facility. Health facility censuses are carried out infrequently as they are extremely expensive
Direct observation Questionnaire using close-ended questions
Health facility survey
Survey targeting a representative sample of health facilities to gather information on the availability of human resources, equipment,
Questionnaire using close-ended questions. Direct observation Examples of health facility
PGCHSM 2013 Monitoring & Evaluation Page 13
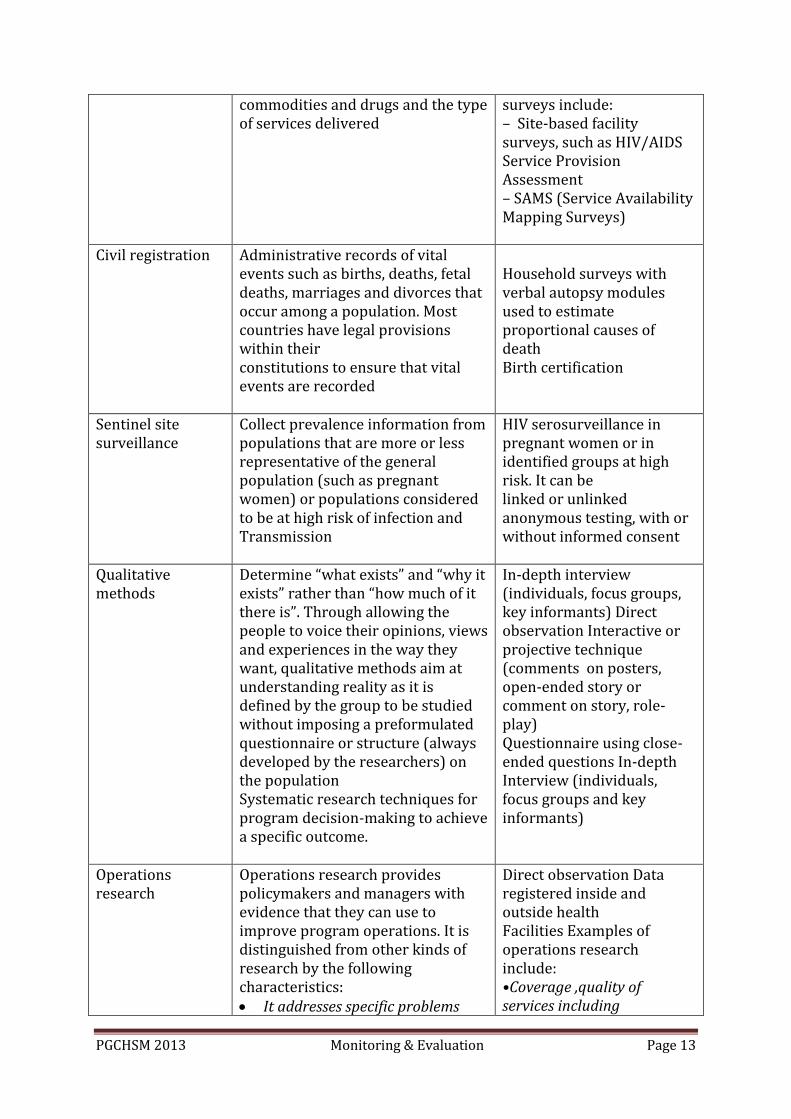
commodities and drugs and the type of services delivered
surveys include: – Site-based facility surveys, such as HIV/AIDS Service Provision Assessment – SAMS (Service Availability Mapping Surveys)
Civil registration
Administrative records of vital events such as births, deaths, fetal deaths, marriages and divorces that occur among a population. Most countries have legal provisions within their constitutions to ensure that vital events are recorded
Household surveys with verbal autopsy modules used to estimate proportional causes of death Birth certification
Sentinel site surveillance
Collect prevalence information from populations that are more or less representative of the general population (such as pregnant women) or populations considered to be at high risk of infection and Transmission
HIV serosurveillance in pregnant women or in identified groups at high risk. It can be linked or unlinked anonymous testing, with or without informed consent
Qualitative methods
Determine “what exists” and “why it exists” rather than “how much of it there is”. Through allowing the people to voice their opinions, views and experiences in the way they want, qualitative methods aim at understanding reality as it is defined by the group to be studied without imposing a preformulated questionnaire or structure (always developed by the researchers) on the population Systematic research techniques for program decision-making to achieve a specific outcome.
In-depth interview (individuals, focus groups, key informants) Direct observation Interactive or projective technique (comments on posters, open-ended story or comment on story, role-play) Questionnaire using close-ended questions In-depth Interview (individuals, focus groups and key informants)
Operations research
Operations research provides policymakers and managers with evidence that they can use to improve program operations. It is distinguished from other kinds of research by the following characteristics: It addresses specific problems
Direct observation Data registered inside and outside health Facilities Examples of operations research include: •Coverage ,quality of services including
PGCHSM 2013 Monitoring & Evaluation Page 14
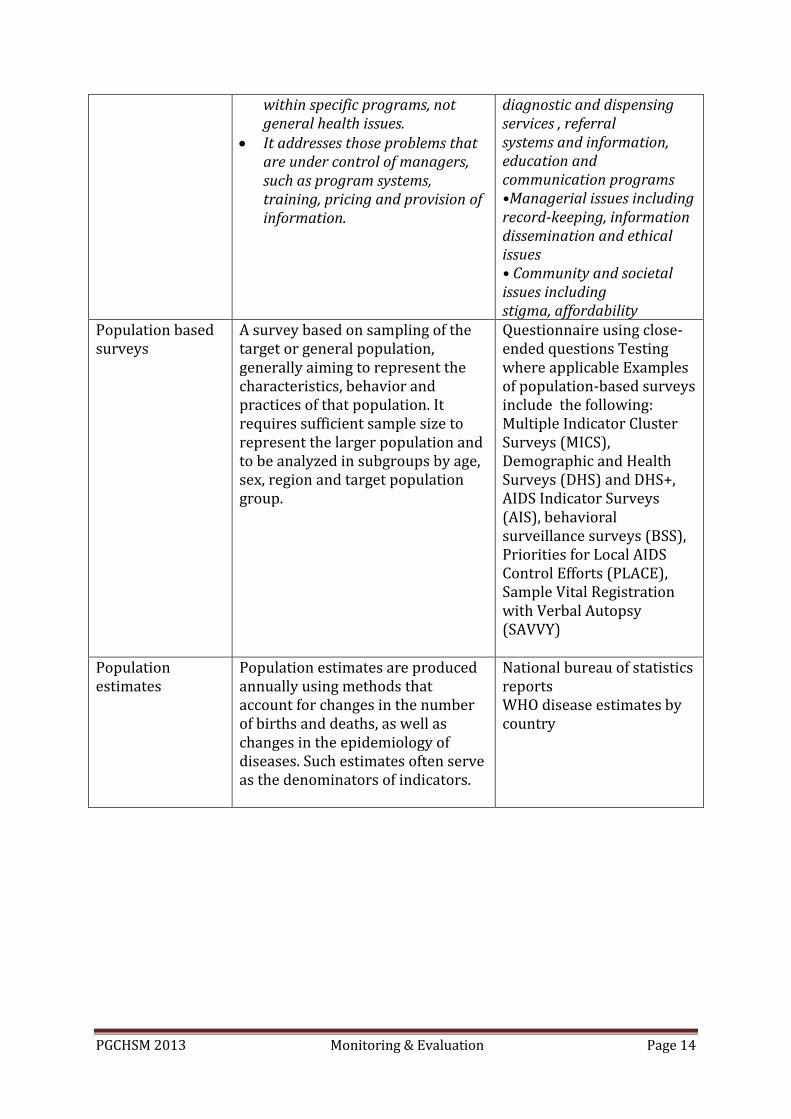
within specific programs, not general health issues.
It addresses those problems that are under control of managers, such as program systems, training, pricing and provision of information.
diagnostic and dispensing services , referral systems and information, education and communication programs •Managerial issues including record-keeping, information dissemination and ethical issues • Community and societal issues including stigma, affordability
Population based surveys
A survey based on sampling of the target or general population, generally aiming to represent the characteristics, behavior and practices of that population. It requires sufficient sample size to represent the larger population and to be analyzed in subgroups by age, sex, region and target population group.
Questionnaire using close-ended questions Testing where applicable Examples of population-based surveys include the following: Multiple Indicator Cluster Surveys (MICS), Demographic and Health Surveys (DHS) and DHS+, AIDS Indicator Surveys (AIS), behavioral surveillance surveys (BSS), Priorities for Local AIDS Control Efforts (PLACE), Sample Vital Registration with Verbal Autopsy (SAVVY)
Population estimates
Population estimates are produced annually using methods that account for changes in the number of births and deaths, as well as changes in the epidemiology of diseases. Such estimates often serve as the denominators of indicators.
National bureau of statistics reports WHO disease estimates by country
PGCHSM 2013 Monitoring & Evaluation Page 15
Routine reporting Routine systems for tracking the demand for and supply of services need to be in place at the national, sub national and service delivery levels. Standardized data from all providers, including those based at health facilities and those not based at health facilities (community based), should be collected on a routine basis and regularly reported. Data that need to be captured through routine reporting include inputs (resources, such as staff, funds, materials, activities and supplies), activities (interventions and services, such as training and treatment) and outputs (immediate results, such as number of staff trained and number of clients treated). The routine data reports in many countries are not comprehensive, as they largely lack data on services provided by the civil society and the private sector. The health information system in a country should routinely track program data (inputs, activities and outputs) from all health facilities that are run by both the public and private sector and the civil society. Strengthening may be needed to ensure valid and reliable data for all types of indicators. These include input data (information on health workforce, budget and stock management), output data and impact data (such as a patient monitoring system or sentinel surveillance information). Although significant progress has been made in setting up functional systems to track, analyze and report on service delivery through public health facilities, further and increased efforts are required for monitoring services provided in facilities run by the private sector and the civil society. To facilitate regular and complete reporting, the health information system should have the following characteristics.
The data collection forms should be simple and user-friendly to avoid overburdening health workers, who often work across the different diseases and health programs.
Information collection efforts across different health programs should be harmonized.
Only information that is used for program management and decision-making should be collected.
Data collection methods and tools should be harmonized between the public sector, private sector and civil society.
The reporting system at the regional and national levels should be able to aggregate data from the various more localized sources (public sector, private sector and civil society).
Monitoring community-based services (outside facilities) Community-based services in this toolkit refer to services provided outside health facilities, such as support to orphans and vulnerable children, managing fever in homes and directly observed treatment of TB. They include services provided both by government and nongovernmental service providers. Depending on country-specific scenarios, several steps need to be taken to strengthen the monitoring of services at the community level;
PGCHSM 2013 Monitoring & Evaluation Page 16
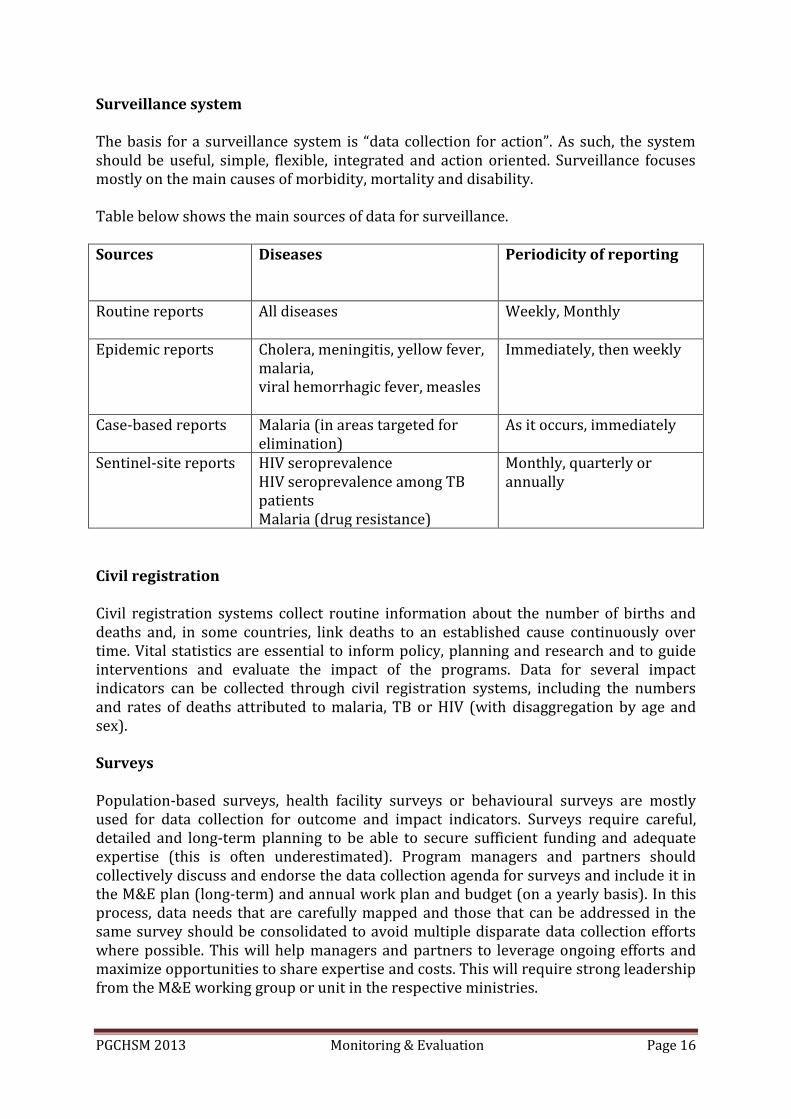
Surveillance system The basis for a surveillance system is “data collection for action”. As such, the system should be useful, simple, flexible, integrated and action oriented. Surveillance focuses mostly on the main causes of morbidity, mortality and disability. Table below shows the main sources of data for surveillance. Sources Diseases
Periodicity of reporting
Routine reports All diseases Weekly, Monthly
Epidemic reports Cholera, meningitis, yellow fever, malaria, viral hemorrhagic fever, measles
Immediately, then weekly
Case-based reports Malaria (in areas targeted for elimination)
As it occurs, immediately
Sentinel-site reports HIV seroprevalence HIV seroprevalence among TB patients Malaria (drug resistance)
Monthly, quarterly or annually
Civil registration Civil registration systems collect routine information about the number of births and deaths and, in some countries, link deaths to an established cause continuously over time. Vital statistics are essential to inform policy, planning and research and to guide interventions and evaluate the impact of the programs. Data for several impact indicators can be collected through civil registration systems, including the numbers and rates of deaths attributed to malaria, TB or HIV (with disaggregation by age and sex). Surveys Population-based surveys, health facility surveys or behavioural surveys are mostly used for data collection for outcome and impact indicators. Surveys require careful, detailed and long-term planning to be able to secure sufficient funding and adequate expertise (this is often underestimated). Program managers and partners should collectively discuss and endorse the data collection agenda for surveys and include it in the M&E plan (long-term) and annual work plan and budget (on a yearly basis). In this process, data needs that are carefully mapped and those that can be addressed in the same survey should be consolidated to avoid multiple disparate data collection efforts where possible. This will help managers and partners to leverage ongoing efforts and maximize opportunities to share expertise and costs. This will require strong leadership from the M&E working group or unit in the respective ministries.
PGCHSM 2013 Monitoring & Evaluation Page 17
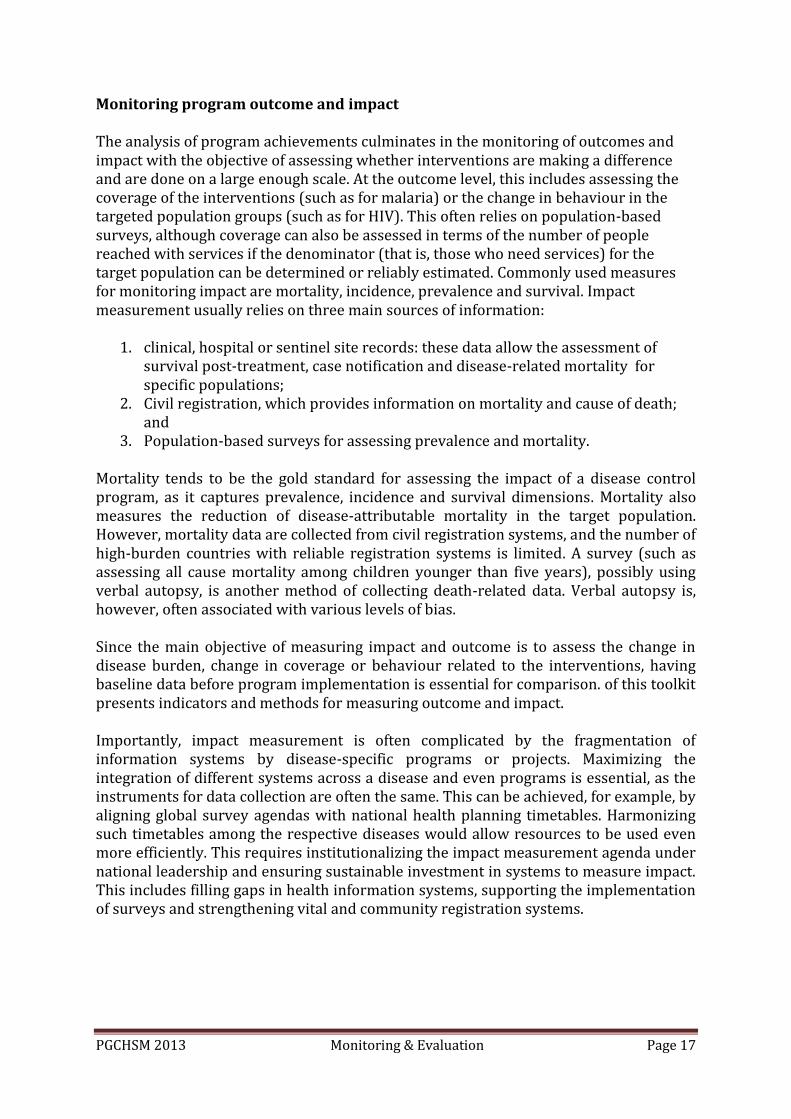
Monitoring program outcome and impact The analysis of program achievements culminates in the monitoring of outcomes and impact with the objective of assessing whether interventions are making a difference and are done on a large enough scale. At the outcome level, this includes assessing the coverage of the interventions (such as for malaria) or the change in behaviour in the targeted population groups (such as for HIV). This often relies on population-based surveys, although coverage can also be assessed in terms of the number of people reached with services if the denominator (that is, those who need services) for the target population can be determined or reliably estimated. Commonly used measures for monitoring impact are mortality, incidence, prevalence and survival. Impact measurement usually relies on three main sources of information:
1. clinical, hospital or sentinel site records: these data allow the assessment of survival post-treatment, case notification and disease-related mortality for specific populations;
2. Civil registration, which provides information on mortality and cause of death; and
3. Population-based surveys for assessing prevalence and mortality. Mortality tends to be the gold standard for assessing the impact of a disease control program, as it captures prevalence, incidence and survival dimensions. Mortality also measures the reduction of disease-attributable mortality in the target population. However, mortality data are collected from civil registration systems, and the number of high-burden countries with reliable registration systems is limited. A survey (such as assessing all cause mortality among children younger than five years), possibly using verbal autopsy, is another method of collecting death-related data. Verbal autopsy is, however, often associated with various levels of bias. Since the main objective of measuring impact and outcome is to assess the change in disease burden, change in coverage or behaviour related to the interventions, having baseline data before program implementation is essential for comparison. of this toolkit presents indicators and methods for measuring outcome and impact. Importantly, impact measurement is often complicated by the fragmentation of information systems by disease-specific programs or projects. Maximizing the integration of different systems across a disease and even programs is essential, as the instruments for data collection are often the same. This can be achieved, for example, by aligning global survey agendas with national health planning timetables. Harmonizing such timetables among the respective diseases would allow resources to be used even more efficiently. This requires institutionalizing the impact measurement agenda under national leadership and ensuring sustainable investment in systems to measure impact. This includes filling gaps in health information systems, supporting the implementation of surveys and strengthening vital and community registration systems.
PGCHSM 2013 Monitoring & Evaluation Page 18
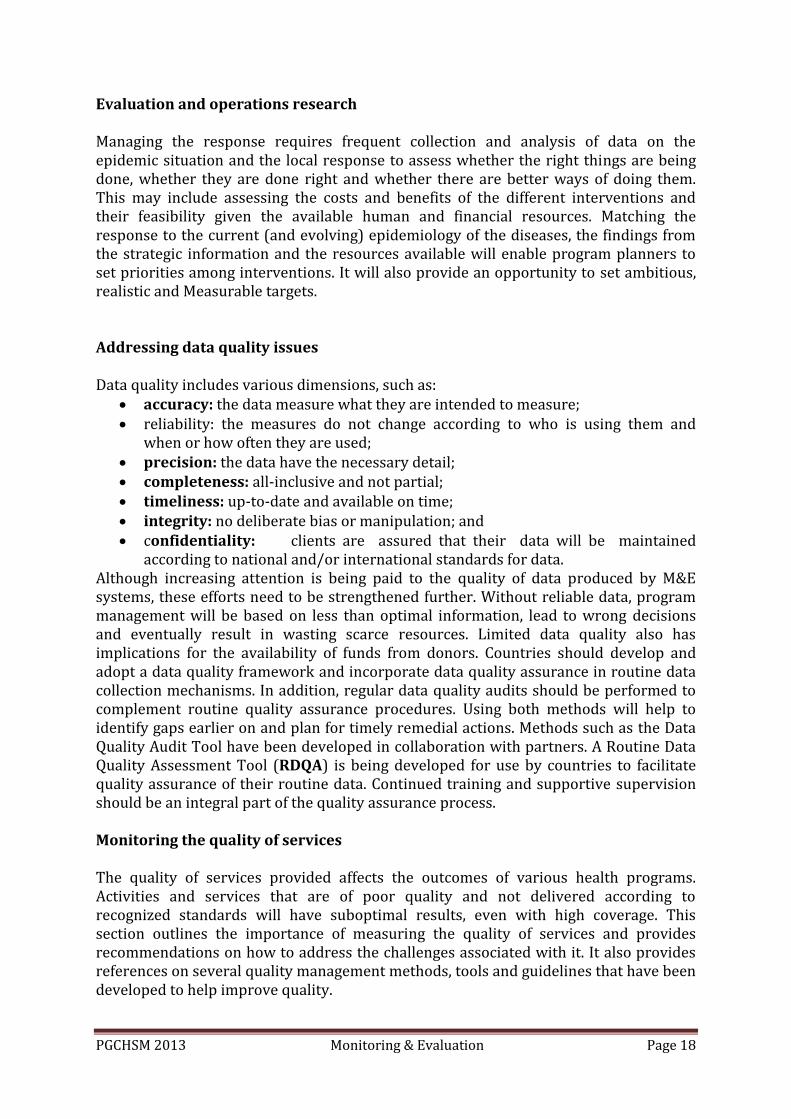
Evaluation and operations research Managing the response requires frequent collection and analysis of data on the epidemic situation and the local response to assess whether the right things are being done, whether they are done right and whether there are better ways of doing them. This may include assessing the costs and benefits of the different interventions and their feasibility given the available human and financial resources. Matching the response to the current (and evolving) epidemiology of the diseases, the findings from the strategic information and the resources available will enable program planners to set priorities among interventions. It will also provide an opportunity to set ambitious, realistic and Measurable targets. Addressing data quality issues Data quality includes various dimensions, such as:
accuracy: the data measure what they are intended to measure; reliability: the measures do not change according to who is using them and
when or how often they are used; precision: the data have the necessary detail; completeness: all-inclusive and not partial; timeliness: up-to-date and available on time; integrity: no deliberate bias or manipulation; and confidentiality: clients are assured that their data will be maintained
according to national and/or international standards for data. Although increasing attention is being paid to the quality of data produced by M&E systems, these efforts need to be strengthened further. Without reliable data, program management will be based on less than optimal information, lead to wrong decisions and eventually result in wasting scarce resources. Limited data quality also has implications for the availability of funds from donors. Countries should develop and adopt a data quality framework and incorporate data quality assurance in routine data collection mechanisms. In addition, regular data quality audits should be performed to complement routine quality assurance procedures. Using both methods will help to identify gaps earlier on and plan for timely remedial actions. Methods such as the Data Quality Audit Tool have been developed in collaboration with partners. A Routine Data Quality Assessment Tool (RDQA) is being developed for use by countries to facilitate quality assurance of their routine data. Continued training and supportive supervision should be an integral part of the quality assurance process. Monitoring the quality of services The quality of services provided affects the outcomes of various health programs. Activities and services that are of poor quality and not delivered according to recognized standards will have suboptimal results, even with high coverage. This section outlines the importance of measuring the quality of services and provides recommendations on how to address the challenges associated with it. It also provides references on several quality management methods, tools and guidelines that have been developed to help improve quality.
PGCHSM 2013 Monitoring & Evaluation Page 19
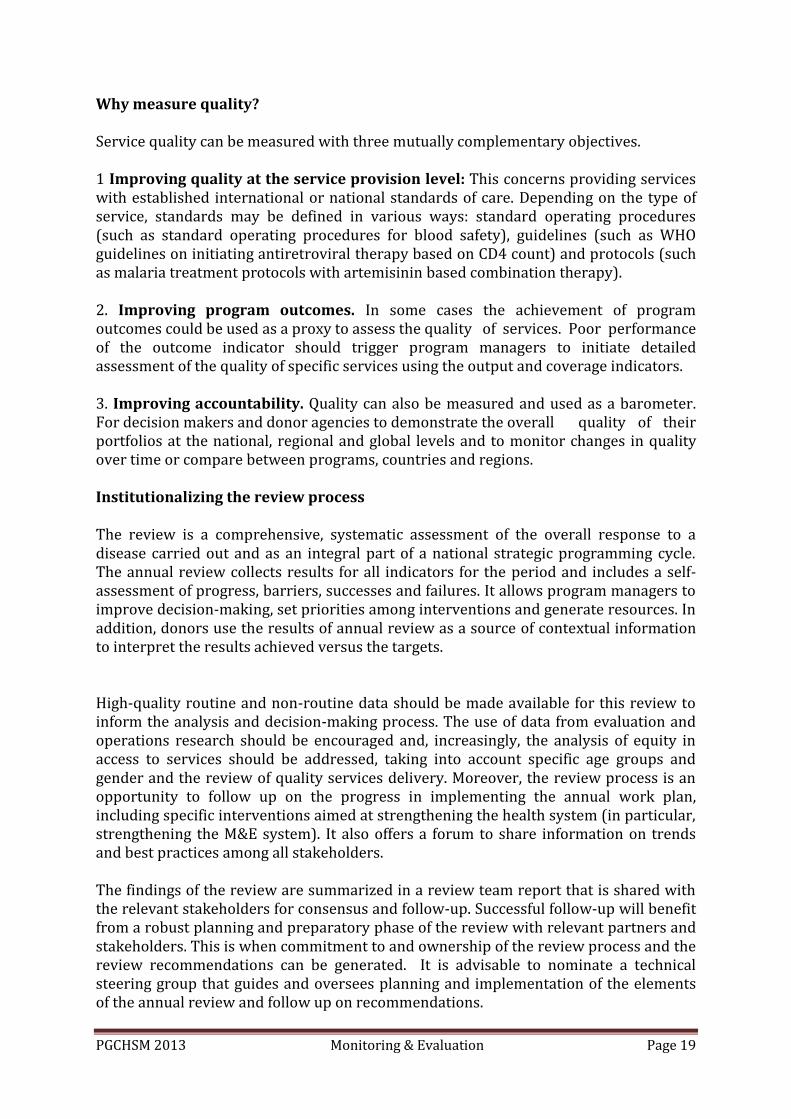
Why measure quality? Service quality can be measured with three mutually complementary objectives. 1 Improving quality at the service provision level: This concerns providing services with established international or national standards of care. Depending on the type of service, standards may be defined in various ways: standard operating procedures (such as standard operating procedures for blood safety), guidelines (such as WHO guidelines on initiating antiretroviral therapy based on CD4 count) and protocols (such as malaria treatment protocols with artemisinin based combination therapy). 2. Improving program outcomes. In some cases the achievement of program outcomes could be used as a proxy to assess the quality of services. Poor performance of the outcome indicator should trigger program managers to initiate detailed assessment of the quality of specific services using the output and coverage indicators. 3. Improving accountability. Quality can also be measured and used as a barometer. For decision makers and donor agencies to demonstrate the overall quality of their portfolios at the national, regional and global levels and to monitor changes in quality over time or compare between programs, countries and regions. Institutionalizing the review process The review is a comprehensive, systematic assessment of the overall response to a disease carried out and as an integral part of a national strategic programming cycle. The annual review collects results for all indicators for the period and includes a self-assessment of progress, barriers, successes and failures. It allows program managers to improve decision-making, set priorities among interventions and generate resources. In addition, donors use the results of annual review as a source of contextual information to interpret the results achieved versus the targets. High-quality routine and non-routine data should be made available for this review to inform the analysis and decision-making process. The use of data from evaluation and operations research should be encouraged and, increasingly, the analysis of equity in access to services should be addressed, taking into account specific age groups and gender and the review of quality services delivery. Moreover, the review process is an opportunity to follow up on the progress in implementing the annual work plan, including specific interventions aimed at strengthening the health system (in particular, strengthening the M&E system). It also offers a forum to share information on trends and best practices among all stakeholders. The findings of the review are summarized in a review team report that is shared with the relevant stakeholders for consensus and follow-up. Successful follow-up will benefit from a robust planning and preparatory phase of the review with relevant partners and stakeholders. This is when commitment to and ownership of the review process and the review recommendations can be generated. It is advisable to nominate a technical steering group that guides and oversees planning and implementation of the elements of the annual review and follow up on recommendations.

PGCHSM 2013 Monitoring & Evaluation Page 20