InGOS – an integrating activity preparing for improved Greenhouse Gases monitoring over Europe
1
Monitoring and Evaluation in the Social Sector*
Draft 17/6/2013
Mirjam Schöning and Pamela Hartigan
With the collaboration of Aalia Datoo
* The paper was commissioned following discussions on this topic during the breakout session entitled “Do Good Governance and a Results-Driven Approach Mix?,” which took place at the 1st annual seminar Advancing Good Governance in International Development, June, 2012.
AppreciationWe wish to thank the key individuals in the international NGOs and social enterprises included in this exploratory study for generously giving their time and trust to the authors. Without their willingness to participate in this effort to advance understanding on a very complex and well-documented topic, we could not have drafted this report.

2

3

4
Executive SummaryThis paper presents the results of an exploratory, hypothesis-generating research effort on the current monitoring and evaluation (M&E) practices of social sector organizations working nationally and internationally. The study hopes to contribute to better understand the governance practices of some of the world's leading entities in the social sector and includes large, international non-governmental organizations (INGOs) as well as recognized non-profit and for-profit social entrepreneurial ventures.
The research assumes that a critical component of good governance is accountability, both to investors/donors and to clients/beneficiaries, requiring feedback loops to both these stakeholder groups. This study emphasizes how data collected from these stakeholder groups, in particular, the clients of the organization's activities, is incorporated for improved governance.
This paper focuses on those who are being asked to conduct monitoring and evaluation activities, that is, the recipients and deliverers of development efforts. While the research compared and contrasted the M&E demands of the different providers of funds, be these governments, multilateral agencies, foundations or private individuals, it did so from the perspective of the recipient organizations.
The results of this exploratory study are based on in-depth interviews with the leaders of 30 social sector organizations operating in different fields and geographical contexts. Some are large INGOs that have operated for several decades on different continents with annual budgets of more than US$50 million. The others are leading social enterprises identified by one or more of the three major network and grant-making organizations in the field: Ashoka, the Schwab Foundation and the Skoll Foundation. These include for-profit social businesses and non-profit ventures with successful operations for at least 5 years and budgets of US$1 million and more.
The study focuses on the main drivers behind M&E practices, what gets measured and how often, the methodologies used, how feedback is gathered and provided back to clients, the process of reporting to donors and investors, including the differences between them, and the resources invested in the M&E process and how these are incorporated into organizational learning. The paper concludes with key insights and recommendations for social sector organizations and their supporters.
Despite the broad range of sectors and geographies represented in the sample, no regional patterns and few sector patterns emerged. The most salient differences were between INGOs and social entrepreneurial ventures.
Finally, this exploratory research hopes to invite and encourage further contributions and perspectives and the authors warmly welcome the insights of others, thus hoping to improve the way in which M&E efforts enhance development outcomes.
Introduction 6Methodology 8
Section 1: Main impetus behind M&E activities 10................................................................Main rationale among social enterprises 11
.................................................................................Main rationale among INGOs 13
Section 2: What is getting measured and how often? 14......................................................................Input, Output, Outcomes or Impact? 14
.........................................................................................................Definitions 14

5
.................................................................................What is getting measured? 15...............................................................................Attempts to evaluate impact 18
..........................................................Different indicators for different purposes 19......................................................................How many indicators are too many? 19
....................................................................................Is there a right time frame? 20
Section 3: Measurement methodologies 21...........................................................................Randomized Control Trials (RCT) 22
.......................................................................................Net Promoter Score (NPS) 23...........................................................................Traffic Light Poverty Assessment 24
Section 4: Feedback from and to beneficiaries 25Section 5: Reporting to donors and investors 29
...................................................................Towards Standard Reporting Formats? 29...............................................................Differences by Type of Donor or Investor 30
.......................................................................................................Foundations 30...................................................................................................Public Funders 30
..............................................................................................Corporate Donors 32..................................................................................................Social Investors 33
...............................................................................................Individual Donors 33
Section 6: Feedback from and to other stakeholders 34Section 7: How are M&E results translated into organizational learning?
35Section 8: What resources are employed for the M&E process? 37
...............................................................................................Financial Resources 37..................................................................................................Human resources 39
........................................................................................Technological resources 40
Key Insights and Recommendations 41.............................................................................For Social Sector Organizations 41.............................................................................For Donors and Social Investors 42
References 43
6
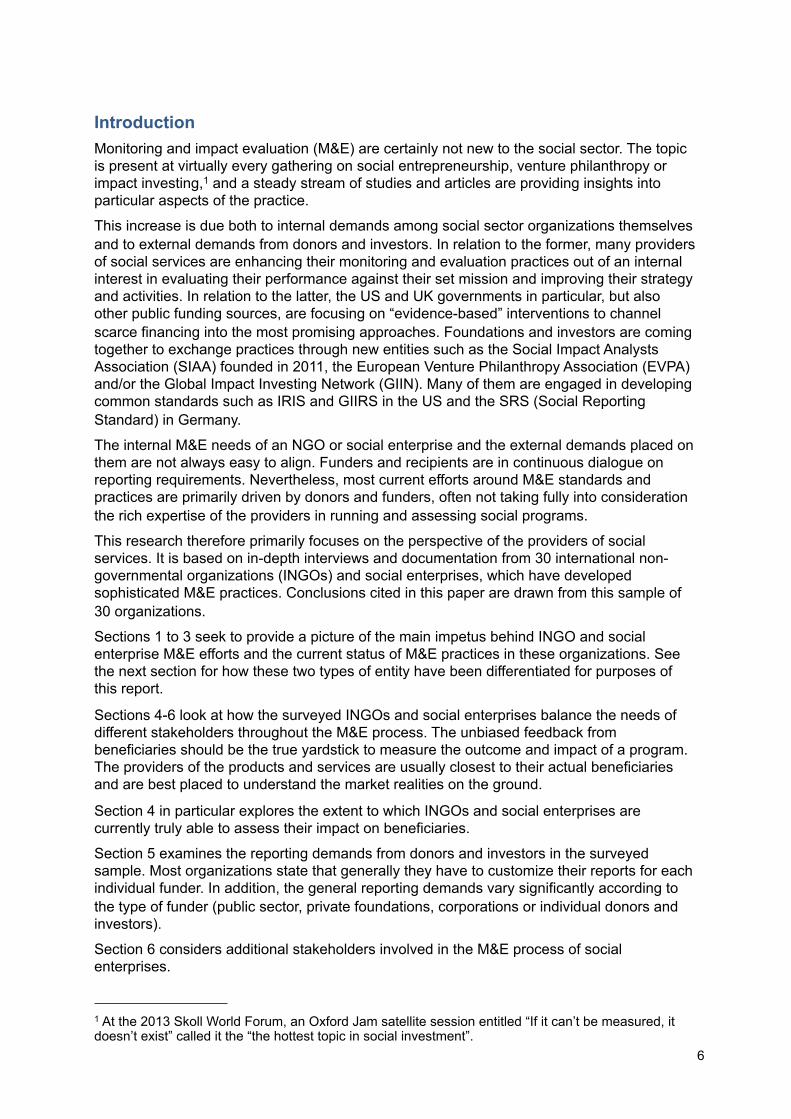
IntroductionMonitoring and impact evaluation (M&E) are certainly not new to the social sector. The topic is present at virtually every gathering on social entrepreneurship, venture philanthropy or impact investing,1 and a steady stream of studies and articles are providing insights into particular aspects of the practice.
This increase is due both to internal demands among social sector organizations themselves and to external demands from donors and investors. In relation to the former, many providers of social services are enhancing their monitoring and evaluation practices out of an internal interest in evaluating their performance against their set mission and improving their strategy and activities. In relation to the latter, the US and UK governments in particular, but also other public funding sources, are focusing on “evidence-based” interventions to channel scarce financing into the most promising approaches. Foundations and investors are coming together to exchange practices through new entities such as the Social Impact Analysts Association (SIAA) founded in 2011, the European Venture Philanthropy Association (EVPA) and/or the Global Impact Investing Network (GIIN). Many of them are engaged in developing common standards such as IRIS and GIIRS in the US and the SRS (Social Reporting Standard) in Germany.
The internal M&E needs of an NGO or social enterprise and the external demands placed on them are not always easy to align. Funders and recipients are in continuous dialogue on reporting requirements. Nevertheless, most current efforts around M&E standards and practices are primarily driven by donors and funders, often not taking fully into consideration the rich expertise of the providers in running and assessing social programs.
This research therefore primarily focuses on the perspective of the providers of social services. It is based on in-depth interviews and documentation from 30 international non-governmental organizations (INGOs) and social enterprises, which have developed sophisticated M&E practices. Conclusions cited in this paper are drawn from this sample of 30 organizations.
Sections 1 to 3 seek to provide a picture of the main impetus behind INGO and social enterprise M&E efforts and the current status of M&E practices in these organizations. See the next section for how these two types of entity have been differentiated for purposes of this report.
Sections 4-6 look at how the surveyed INGOs and social enterprises balance the needs of different stakeholders throughout the M&E process. The unbiased feedback from beneficiaries should be the true yardstick to measure the outcome and impact of a program. The providers of the products and services are usually closest to their actual beneficiaries and are best placed to understand the market realities on the ground.
Section 4 in particular explores the extent to which INGOs and social enterprises are currently truly able to assess their impact on beneficiaries.
Section 5 examines the reporting demands from donors and investors in the surveyed sample. Most organizations state that generally they have to customize their reports for each individual funder. In addition, the general reporting demands vary significantly according to the type of funder (public sector, private foundations, corporations or individual donors and investors).
Section 6 considers additional stakeholders involved in the M&E process of social enterprises.
1 At the 2013 Skoll World Forum, an Oxford Jam satellite session entitled “If it can’t be measured, it doesn’t exist” called it the “the hottest topic in social investment”.

7
Section 7 examines the degree to which social sector organizations embed their respective monitoring, evaluation and reporting processes into their governance structure, and include clear systems to integrate the feedback, both positive and negative, into an organizational learning process.
Finally, section 8 looks at the human, financial and technological resources currently employed for the M&E process of the sampled organizations.
Throughout this paper, several examples serve to illustrate the prevalent practices. In the conclusion, key insights are framed as recommendations to social sector organizations and funders.

8
MethodologyThe observations in this study are based on in-depth interviews of 30 social sector organizations operating in different fields. Seven of them are classified as large INGOs. They run programs on different continents, often in 50 countries or more. Their annual budget size is larger than USD 50 million.
The remaining 23 surveyed organizations represent a cross-section of leading social enterprises. They have been identified by one or more of the three major network and grant-making organizations in the field: Ashoka, Schwab Foundation and Skoll Foundation. They include for-profit social businesses, non-profit social enterprises and ventures with hybrid legal structures.2 They correspond to the criteria of social enterprises established by the three network and grant-making organizations.3 The sample covered relatively large and well-established social enterprises with budget sizes of ≥USD 1 million and successful operations for at least five years. Many have expanded internationally.
The organizations operate across a variety of different geographies (see Figure 1). Organizations that operate in at least three different continents are classified as global. If an organization operates in more than one continent, the predominant continent was counted.
Figure 1: Regional distribution of sample organizations
2 A social venture may pursue a hybrid structure comprising for-profit and non-profit arms, allowing it to better fulfill its primary social mission whilst ensuring its financial sustainability.
3 See the respective criteria for Ashoka (https://www.ashoka.org/support/criteria), the Schwab Foundation (http://www.schwabfound.org/content/criteria), and the Skoll Foundation (http://www.skollfoundation.org/about/skoll-awards/).

9
The surveyed organizations represent a variety of different sectors, including education, health, environment and economic development. Most social enterprises cover more than one of the below sectors, but are categorized in their main sector of activity.
Figure 2: Sectoral distribution of sample organizations
Despite the broad range of sectors and geographies represented in the sample, no regional patterns and very few sector patterns emerged from the interviews. Most patterns emerged between the INGO and social enterprise categories. The interviews were carried out over the phone or in-person in English, German or Spanish and covered a questionnaire with 24 mainly qualitative, but also quantitative, questions. The interviews were conducted mainly with the CEO or founder, in the case of the social enterprises, or with the person responsible for M&E, in the case of the INGOs.
Definitions
It is important to clarify how we have differentiated between the two types of organizations in this sample: International NGOs and Social Entrepreneurial Ventures, as the term “non-governmental organization” is a legal term that can apply to social entrepreneurial ventures as well as INGOs.
The INGOs interviewed for this study are typically over 50 years old and initiated their activities to address poverty and suffering among the world’s most neglected populations. They have grown significantly in size and complexity, and many have operations in 40 to 100 countries with annual revenues in the millions and, in some cases, billions of dollars. They are highly decentralized in their organizational structure and generally rely on individual donations and funding from multilateral and bilateral aid organizations to sustain their activities.
Social entrepreneurial ventures may be legally set up as NGOs (i.e. non-profits) but are increasingly structured as for-profit social businesses, depending on the mission they seek to achieve. In comparison to the INGOs interviewed for this study, these entities are much more recent in formation, the oldest being 25 years old. They are smaller in size and revenue than INGOs. Social entrepreneurial ventures are particularly focused on addressing market failures that require long term systemic transforms. They tend to be solutions-focused pragmatists rather than advocates lobbying for policy change. Their inclination is to create markets or use market mechanisms to achieve transformational social change rather than relying on philanthropic donations and government aid.

10
Section 1: Main impetus behind M&E activitiesAmong the social sector organizations, 70% reported that they were primarily driven by internal factors in enhancing their M&E activities, with the remainder mainly citing external demands, typically from government or bilateral funders.
Figure 3: Main impetus for M&E activities by type of organization
Source: own survey
However, there is a marked difference between social enterprises and INGOs on this topic. More than 80% of the social enterprises claimed to have been intrinsically motivated in setting up their M&E systems. “M&E was part of the DNA of the organization since its very beginning” was a frequent statement expressing a desire to verify if the organization was achieving the mission and purpose for which it was set up in the first place. Given that many social entrepreneurs often make significant sacrifices to set up their organizations, this focus on “whether it is worth it” is plausible.
“We have looked very seriously at evaluation from the first day we opened our door. Having roots in the private sector, we decided to come into this field to have a systemic impact. We knew we needed to keep an eye on the ball to ensure that impact and never fall in love with our model over our mission.”Kyle Zimmer, Founder, First Book, USA
“Measuring is so crucial for Un Kilo de Ayuda that if an intervention cannot be measured, we are not doing it.”Jose-Ignacio Ávalos, Founder, Un Kilo de Ayuda, Mexico
“We see ourselves as an impact-driven organization. The reason for founding streetfootballworld was to deliver a superior impact to what the individual network members could achieve on its own. We want to insure that this is true.”Jürgen Griesbeck, Founder, streetfootballworld, Germany

11
Main rationale among social enterprisesIn addition to verifying the “raison d’être” of the social enterprises, the enterprises in this sample listed the following more detailed reasons for monitoring and evaluating their impact:
1) Proving the effectiveness of an innovative modelIt is often in the nature of social enterprises to develop an innovative and previously untested model. Careful monitoring and evaluation over time is therefore necessary to ascertain the credibility, scalability and sustainability of the model. For example, Riders for Health initially had to establish the link between providing transport for health workers and the health situation of rural communities in Africa.
2) Laying the foundation for scaling and expandingSimilarly, several social enterprises were particularly concerned with assessing the value their programs created and how efficiently they operated before taking them to scale. This includes many that are looking at the possibility of reducing costs and further driving efficiencies. KaBoom!, founded in 1996, developed a scorecard monitoring system in 2004 as it was seeking evidence around these questions before extending its system of community-built playgrounds across the USA and online, as a “do-it-yourself” model.
3) Convincing policy-makersPolicy-makers cannot take risks when adopting a model on a wide scale. Evidence is a strong card in the hand of an organization that wants to bring about systemic change. Escuela Nueva sought rigorous external evaluation of its approach through reputable academic and development institutions in order to convince governments in Colombia, Latin America and elsewhere to implement the model.
4) Improving internal accountability and motivating staffParticularly in larger or geographically dispersed organizations, case studies and other evaluation methods were considered important for staff members to feel connected to what the organization does and promote a sense of ownership.
5) Attracting good partnersMany social enterprises depend on an effective network of partner organizations to progress their mission. One social enterprise mentioned the importance of external validation and of being a “learning organization” to attract good partners for its program.
6) Differentiating opportunity from other players in the fieldSeveral social enterprises straddle the for-profit and non-profit realms and often encounter more traditional companies as competitors. Being able to prove a larger societal or environmental impact provides an opportunity to distinguish itself from others in the sector. Verité, a non-profit social enterprise committed to ensuring that people around the world work under safe, legal and fair conditions, provides many of the same supply-chain audits and trainings to large scale multinational companies as for-profit competitors such as PricewaterhouseCoopers or SGS, the world’s leading inspection, verification, testing and certification company. It makes business sense for Verité to show it is working towards large-scale sector changes such as eliminating child labor or improving the conditions of migrant workers sustainably.
7) Meeting the demands of donors and/or investorsDonor demands were subordinated reasons for the M&E activities of social enterprises, but, interestingly, they were of greater influence on for-profit social enterprises, especially in relation to financial performance. The reason for this

12
emphasis may be that “impact investors” who provide debt or equity funding to these ventures pay significant attention to financial performance.
Most social enterprises claimed that their M&E activities go much further than the demands of most donors and many of the indicators regularly tracked serve internal purposes. Several social enterprises reported that “Donors do not really read our reports. We definitely do our M&E to learn and build a better program”.

13
Main rationale among INGOsThe main impetus for M&E among the large INGOs was the inverse to the rationale of the social enterprises. More than 80% stated that external demands from key financial sources were a significant influence behind enhancing and expanding their M&E activities.
Two specific factors influenced this finding: a) the size of grants; and b) the type of donors providing the bulk of the financing. The larger the grant size from one single source, the more stringent the reporting and impact evaluation requirements attached to them. Several of the interviewed organizations were shifting their main sources of income from small-scale donations from individual donors (such as child sponsorship programs) to larger public sources. Government entities and bilateral or multilateral agencies typically require lengthy and detailed reports to be regularly delivered in prescribed and standardized formats. The UK Department for International Development (DfID) was most often mentioned as a key donor that spurred INGOs to rethink their evaluation practices.
At the same time, many of the INGOs operate in 50 countries or more, have a broad variety of programs and are traditionally decentralized, complex organizational forms. This makes a centralized top-down approach to M&E unmanageable. While in the past some country offices have pursued M&E practices with greater rigor than others, many INGOs are currently restructuring their organizations to develop global guidelines that can be used across the different countries and program areas.
Example: Transparency International (TI)M&E is a big focus of TI’s work today, but it was still quite different two to three years ago. The main reasons were: 1) A decentralized model: the Secretariat does not have power to enforce standards on national offices, which are mostly independent and self-financing; and 2) TI’s work: it is generally seen as difficult to measure results in the field of corruption and advocacy, hence there was very little internal drive and donor pressure to do M&E. Two years ago, TI developed a new strategic plan that specifies M&E as one of four key areas to focus on. At the same time, the pressure from some bilateral donors has increased.
Example: World VisionChild sponsorship programs were the “bread-and-butter” of the early days of World Vision. It had developed an incremental approach to monitoring over the years to ensure donor money was spent as promised, but this included little outcome or impact evaluation. With the onset of the humanitarian crises in the 1970s and 1980s, World Vision took government funding, which had M&E built into its programs. This became the driver for better practice, quality design and concerns for sustainability.

14
Section 2: What is getting measured and how often?Input, Output, Outcomes or Impact?
DefinitionsThe most widely used term to describe the result of an organization’s activities is impact. However, what is actually most commonly measured and reported are outputs and outcomes. This paper is based on the Impact Value Chain and definitions established in the Double Bottom Line Report. In this report, Clark et al. (2004) describe outputs as “the results that a company, non-profit or project manager can measure or assess directly”. This could be the number of children participating in an educational activity or the number of training workshops run or water filters sold or distributed.
Outcomes are the ultimate changes that the program is trying to achieve. This could be a better academic performance for an educational program or a reduced child mortality rate for a health program. Clark et al. (2004) define impact as “the portion of the total outcome that happened as a result of the activity of the venture, above and beyond what would have happened anyway”. This typically requires establishing what the counterfactual would be by comparing the difference between a control group and the program group.
Figure 4: The Impact Value Chain
Source: Clark et al. (2004), Double Bottom Line Report
–
Inputs Activities Outputs Outcomes Goal alignment
What is put into the venture
Venture’s primary activities
Results that can be measured
Changes to social systems
What would have happened anyway
= IMPACT
Activity and goal adjustment

15
What is getting measured?Given the selection criteria for the surveyed organizations, it is not surprising that all of them track and monitor outputs on a regular basis. Sophisticated Management Information Systems (MIS) that enable continuous or “live” tracking are still the exception, but many organizations in the sample reported either recently or currently investing in such systems. Social enterprises and INGOs that operate in remote rural areas in developing countries often still rely on manual data entry of outputs, typically once a week or once a month into the organization’s database.
Figure 5: Measuring outcomes in addition to outputs
Source: own survey
By their nature, outcomes describe the long-term change that occurs thanks to the activities of an organization. Measuring the outcomes of an activity can be proof that there is in fact a causal link (or not) between the intervention and the intended goals or mission. Most organizations aim to track the outcomes of their activities, but only 60% of the interviewed organizations do so systematically. While all INGOs in the sample are conducting studies to assess their outcomes, only half of the surveyed leading social enterprises are regularly looking at outcomes.
Total
Social enterprise
INGO
0% 25% 50% 75% 100%
OutputsOutcomes

16
Transitioning from output to outcome measures
Un Kilo de Ayuda (UKA) is a social entrepreneurial venture that seeks to eliminate malnutrition in children up to five years of age in Mexico so that every child can fully develop physically, mentally and emotionally. Until 1999, UKA was primarily tracking outputs such as the number of children reached and the amount of food packages distributed.
After 1999, UKA began to establish a system of indicators to measure the progress for physical growth, intellectual and psycho-affective development for each of the close to 80,000 children in the program. Physical growth is measured by weighing and measuring children every two and every six months, respectively, and by blood analyses every six months. Neurodevelopment is assessed through a questionnaire to mothers and two cognitive and language tests at 12, 18 and 24 months. All results are immediately entered into a database developed by UKA in early 2000, Infokilo. Once a year, UKA staff collect data at the household and community level, including income, educational background of the parents, housing conditions, water sources and community infrastructure.
Through its real-time monitoring system, UKA has been able to identify that 70% of the children in the program progress well, 4% get worse and the remainder stay equal. Such detailed data has allowed UKA to identify the causes behind the deteriorating health indicators for the 4%. These typically are diseases, water issues, family violence and alcoholism.
UKA is also able to compare its data to the national statistics. If the child mortality rate under the UKA program was equal to the national rate, UKA would lose 400 children per year as a result of malnutrition. Instead the number has been reduced to 24 children per year, as a result of a monitoring system that allows for early prevention. The national Mexican statistics also reveal the biggest prevalence of malnutrition at three months, when mothers habitually stop breast-feeding. UKA heavily promotes breast-feeding during the first one to two years and as a result has not seen the same dip in weight and height as the national average.
As a next step, UKA is planning to conduct a longitudinal study in 2014 on a representative sample of children who have graduated from its program. So far, this has only happened for a few select cases.
Among the organizations assessing their outcomes, most work with external consultants and/or academic partners to conduct irregular studies with typical time ranges between every other year to every three to four years. They often involve longitudinal studies to follow a subset of beneficiaries over a long period of time.
Some of the interviewed organizations stated that in their particular field, a series of studies have already proven the effectiveness of their interventions, establishing the causal link between outputs and outcomes. Adding another study would not change the result, and would take away valuable resources from expanding the program. This particularly applies to interventions focusing on providing a basic need. It applies less to organizations that are pioneering new models such as a unique curriculum or medical cure.

17
Deliberately focusing on Outputs
First Book, for example, provides age appropriate books for disadvantaged children in the USA and Canada. Organizations other than First Book have undertaken a meta-analysis of 11,000 studies on the importance of reading, with 108 of these focusing on the presence of books. As Kyle Zimmer, Founder of First Book says, “You ask yourself if the world is more convinced if you spend a quarter million USD on producing the 109th study or if you use the funds to actually get the books out”. First Book has previously conducted two longitudinal studies, but it deliberately focuses more on output indicators such as number and retail value of books distributed or sold, the number of programs and teachers engaged, and the number of children and communities reached, which it considers to be the true yardsticks of its success.4
Some of the interviewed organizations reported that they team up with other organizations in the field to commission joint studies or gather relevant baseline data where national statistics are weak or non-existent.
4 The Social Impact Exchange (http://www.socialimpactexchange.org/) features 100 “evidence-based non-profits” in its S&I online center, among them First Book. For organizations that provide a basic need, the impact assessment is primarily focused on reach.

18
Attempts to evaluate impactWhile everyone talks about impact, most of the interviewed social service providers agreed that it is beyond their realistic means to measure impact defined as “the outcomes less what would have happened even without the intervention” (see above and Clark et al. (2004), p. 7). A Guide to Impact Measurement by the European Venture Philanthropy Association (EVPA) concedes that “Impact itself is a technical and often academic discussion including concepts such as drop off, displacement, deadweight and attribution. Given it is, in practice, very difficult to measure accurately, we encourage Venture Philanthropy Organizations/Social Investors to focus their efforts on outcomes and acknowledge those factors that may mean that the outcomes are not equal to the impact.”5
Only about 26% of the surveyed social enterprises compared to 50% of INGOs have or are conducting an impact evaluation study. The surveyed organizations stated the following main challenges around evaluating impact:
1) High CostsA statistically meaningful and scientifically credible impact evaluation requires significant resources and external partners. Riders for Health, for example, has received a USD 2.4 million grant for a two-year evaluation with Stanford University to assess the impact of its model on access to healthcare in rural Africa.
2) AttributionLandesa, formerly the Rural Development Institute, was founded in 1967 to secure land rights for the world’s poorest in partnership with governments and local organizations around the world. The founder was largely concerned about outcomes and the larger impact that securing land rights has on improved income, nutrition and education. Today’s leadership at Landesa concedes that Landesa can never claim full attribution for land titles provided, as these are given out by governments. Landesa is careful to frame its communication and language to state that it plays a key partnership role on land rights reforms with governments which then lead to the conferring of land titles.
3) Multiple influencing factorsAnother challenge Landesa encountered around impact evaluation is that of isolating variables. In most achievements around agricultural productivity, income and women’s empowerment where land rights have played a role, land rights are one of several factors. Isolating the specific contribution of improved land rights is difficult, but not impossible. Isolating the specific impact of land rights is often costly but subject to much attention from outside researchers. Consequently, Landesa's internal M&E team focuses on concrete outputs in the form of organisational metrics and financial goals.
Two organizations in the sample reported going back to outcome measures after attempting to evaluate impact, as they sought to find indicators that could be directly linked to what the organization can truly influence and achieve. Plan International, for example, first set up a system of 26 impact indicators, but then transitioned to a performance system, tracking indicators that Plan can directly influence.
Alex Jacobs, Director of Programme Quality at Plan International, “is not convinced that NGOs should spend the limited resources they have available for assessment on trying to evaluate impact. It tends to burn up too much precious staff time for not enough useful insight. ... Instead, NGOs could focus on measuring how much value they are adding to local people and how good a job they are doing in providing assistance. Unlike impact, this is in
5 Hehenberger, Harling and Scholten, 2012, p. 10.

19
their control. It’s also directly related to the daily issues managers face. It may provide a basis for accountability that also drives immediate learning and improvement”.6
Oxfam, on the other hand, has taken the lead among major INGOs and significantly upscaled its efforts on impact evaluation over the last two years. As part of its “Global Performance Framework”, Oxfam now states that it has a good picture of the outputs delivered across its present portfolio of about 1200 projects in 55 countries. Oxfam’s internal policy requires a rigorous analysis of all programs above GBP 1 million. In addition, starting in 2011, Oxfam carries out “Effectiveness Reviews” to assess what difference it is making on 26 randomly selected projects. Their intention is to have a similar number of sample reviews annually in the coming years. Despite showing very mixed results, the reports are published on Oxfam’s website, available to all. The reviews have sparked internal discussion and the management responses are published alongside the reports. Oxfam’s efforts have been commented on and applauded by DFID7 and others.
Different indicators for different purposesSeveral organizations, particularly the larger ones in the interview sample, mentioned that input, process and output monitoring primarily serves internal purposes, while outcomes or impact studies are used for external reporting.8
Monitoring for internal purposesExample: BRAC, Bangladesh
BRAC has a particularly strong focus on internal monitoring. BRAC has two separate departments, one for Monitoring and another for Research & Evaluation. The Monitoring department has more than 20 analysts at headquarters and 80 monitoring officers in the field. They select 20 input, process and output indicators annually in collaboration with the program teams. Program managers are the primary customers of the Monitoring department, which is considered to be a neutral body, as experience has shown that the data entered into the Management Information System (MIS) by program officers can be systematically inflated. The Monitoring department rarely reviews indicators for donors. The internal data needs are typically larger.
On the other hand, the Research & Evaluation division with about 30 people has a largely external audience. It undertakes impact assessment studies and conducts research into the broad range of BRAC’s program areas, including agriculture, microfinance, extreme poverty, reproductive health and food and nutrition. It is an independent unit within the BRAC organizational framework and is sought out for its evaluation expertise by other organizations in the field.
How many indicators are too many?For most organizations interviewed, the development and application of indicators evolved over time. In the first instance, a huge amount of data was captured to report against an increasing number of indicators. In some cases, organizations tracked 200 or more indicators on a regular basis, before realizing that the optimal number of truly meaningful indicators was
6 See blog on NGO Performance: http://ngoperformance.org/2012/10/17/hats-off-to-oxfam-but-are-they-asking-the-right-question/
7 See blog by Nick York, Chief Professional Officer Evaluation, and Caroline Hoy, Results and Evaluation Specialist, Civil Society at DFID (http://www.oxfamblogs.org/fp2p/?p=12254).
8 Also see Hehenberger, Harling and Scholten, 2012 p. 9, for the internal focus on outputs as management tool and the external focus of outcomes and impact indicators for reporting and investment selection.

20
typically somewhere between three and 20.
Consequently, many social enterprises in the sample then refocused their M&E practices on identifying which key metrics were directly related to their theory of change. They felt that for the staff, the senior management and the board, a reduced number of metrics provided a much better mirror of the organization’s progress and efficiency.
Example: EndeavorEndeavor is a US-based non-profit committed to identifying, mentoring and accelerating high-impact entrepreneurs that hold the key to sustained economic growth in emerging markets. From the outset, Endeavor has constantly updated what it is measuring on three levels: the entrepreneur, the organization and the environment. Linda Rottenberg, CEO of Endeavor, recalls collecting “as many indicators around the Endeavor selection and support process as we could find”. These included the number of selected entrepreneurs, MBAs recruited, mentoring hours, jobs created and so forth. Eventually, Endeavor introduced more refined measures, such as the difference in job and revenue growth rates of companies before and after being selected by Endeavor in the form of Compound Annual Growth Rates (CAGR). “People can get lost in too many metrics”, says Rottenberg. Endeavor realized it ultimately values three key metrics: growth rates, Net Promoter Score9 and rates at which Endeavor entrepreneurs give back to the organization.
The European Venture Philanthropy Association (EVPA) backs the notion that social service providers should focus on those indicators that are directly related to their theory of change and hence are in line with their operational process. It advises its members, donors and social investors, to collect any additional indicators they would like to track themselves.10
Is there a right time frame?There is no “one-size fits all” to assess the right time frame for data collection. The surveyed organizations collect output and outcomes data according to the type of activity and available resources, which range from continuous collection to weekly, monthly, bi-monthly and yearly, at the most. For an educational project, it might make sense to wait until the end of a school year to collect data. In the case of a malnourished child, weight needs to be monitored much more frequently for obvious reasons.
A number of organizations unable to implement sophisticated technological monitoring tools mentioned that donors often provide very tight time frames for the reporting of quarterly outputs. In addition, many donors expect to receive outcome or even impact measures at the end of a project cycle, often a one to three year period. However, most outcomes only manifest themselves years after the project period ends. Most of the surveyed organizations therefore stressed the importance of discussing with the funder the appropriate reporting frequency upfront before a project starts.
9 See Section 3 for a more detailed explanation of the Net Promoter Score.
10 Heheberger, Harling and Scholten, 2012, p. 10.

21
Section 3: Measurement methodologiesNumerous guidebooks and studies have been published on the different performance tools available for non-profits over the last decades. The first catalogue of methods for for-profit and non-profit social enterprises was released in 2004. The Double Bottom Line Project11 analysed nine methods according to their applicability, credibility and use of resources. These included Theories of Change, Balanced Scorecard, Social Return on Investment and Benefit-Cost Analysis, as well as other tools developed by funders such as the Acumen Fund Scorecard, Social Return Assessment (Pacific Community Ventures) and the Poverty and Social Impact Analysis (World Bank).
Nicholls (2010) conducted a survey among 40 social enterprises. The most commonly used methods among the survey respondents were the following nine: baseline surveys (22),12 questionnaires (18), social audits (5), focus groups (4), Social Return on Investment (3), Balanced Scorecard (2), Benchmarking (2), Use of Proxies (2) and KPIs (1).
The survey for this paper revealed the predominant use of a very similar set of tools (see Figure 6). Again, baseline surveys emerged as the most common, in most cases complemented with endline surveys. Questionnaires were not assessed as a separate tool, as most organizations employed them to gather data for one or more of the listed methods.
Figure 6: Performance Measurement Methodologies
Source: own survey
Most methods listed above have been extensively discussed in the existing literature.13 The focus for the remainder of this section is on three tools, which have either raised substantial controversy or are new.
11 Clark et al. (2004), pp. 19-37.
12 Number of respondents employing the tool mentioned in parentheses.
13 For a few examples, see Clark et al. (2004), CIVICUS Monitoring and Evaluation toolkit, and The World Bank, 2004.

22
Randomized Control Trials (RCT)20% of respondents mentioned running or having conducted randomized control trials to compare the effect of their interventions to a control group that does not benefit from their program, thus getting a sense of a program’s true impact.
A number of respondents mentioned that they would like to have an RCT study on their program, as RCTs are among the most popular and credible tools to assess impact. However, they are very costly and tend to last for 4 or 5 years during which time the costs mount. Thus, many organizations do not have the resources to invest in such large-scale studies.
The RCTs are typically conducted by external academic partners, often commissioned by governments and financed by bilateral aid agencies or large foundations. For example, mothers2mothers runs a program to prevent HIV/AIDS transmission from mothers to children in seven African countries. The government of Malawi, financed by the Canadian International Development Agency (CIDA), runs an RCT to look at the effectiveness of several different models, including that of mothers2mothers. Another social enterprise, Riders for Health, is assessing its impact under different conditions as a preparation to scale in new countries. This includes an RCT study conducted by Stanford University and financed by the Gates Foundation.
There were also several organizations that voiced strong concerns about RCTs. Three organizations expressed concerns that their objective of reaching maximum impact on the ground does not necessarily sync well with the scientific objectives of RCTs; given that they are expensive, pose ethical problems by deliberately excluding people in genuine need, and face implementation challenges. One of them reported:
“Some foundations and donors get very excited about a very scientific research design without focusing on the larger objective they want to accomplish with the program. A consumer-facing company is surely not doing an RCT, but runs focus groups, and focus groups is what we also do.”

23
Net Promoter Score (NPS)One organization surveyed, Endeavor, finds it very helpful to track the NPS of its selected entrepreneurs or primary beneficiaries. The NPS is a customer loyalty metric frequently used by large multinational companies. The concept was introduced by Fred Reichheld at Bain & Company in a Harvard Business Review article entitled “The One Number You Need to Grow”.14 The concept is based on one single question to customers: “How likely are you to recommend (the company) to a friend or colleague?” The NPS is then calculated by subtracting the percentage promoters of a company from the detractors. A positive score is considered to be a good score and above 50% is considered to be an excellent score.
Figure 7: Net Promoter Score: How likely are you to recommend this organization to a friend or colleague?
Source: http://www.netpromoter.com/why-net-promoter/know/
The NPS is one of three indicators that Endeavor finds most useful to track and report (see Section 2). It is published in its annual Worldwide Performance Report, comparing the previous year’s score to the current year’s score for each of the 11 countries in which it operates.15 It regularly runs the NPS among entrepreneurs that are selected and mentored by Endeavor. Every entrepreneur that gives a score of below nine (a detractor or passive), receives a follow up call to understand what can be improved.
The NPS is also measured for each of the individual services that Endeavor offers to its entrepreneurs. For example, its executive program with a partner university is regularly the star performer, with an NPS of 100%. Other services, which score low several times in a row, are discontinued and replaced by more demand-driven services. Thus, the NPS permits Endeavor to track and act on feedback from its direct beneficiaries.
14 Reichheld 2003.
15 See Endeavor Worldwide Performance Report 2012, p. 5.

24
Traffic Light Poverty Assessment Another respondent, Fundación Paraguaya (FP), has developed its own16 assessment tool to evaluate how it is achieving its ultimate objective of lifting people out of poverty. As Martin Burt, the founder, pointed out, it was an emerging methodology. “We bumped into it in the field and did not develop this in the office”. FP saw that children graduating from its agricultural school program moved out of poverty and on to college. It was not just a question of income, but a personal transformation that dramatically improved the quality of life of present and future generations. Needless to say, poverty is not just a fixed monetary amount below which you are poor. Rather, it is multi-dimensional, hence no one response can resolve it.
Based on the question of what “non-poverty” would look like, FP therefore set out to develop 50 indicators in six dimensions: (1) income employment, (2) health and environment, (3) housing and infrastructure (4) education and culture (5) organization and participation 6) interiority (self-esteem, life planning) and motivation. All indicators have different levels and focus on the gaps between poverty and non-poverty. By way of example, for housing, the indicators include an assessment of the type of roof and floor of a house. A dirt floor would place the household below the poverty threshold, a concrete floor would be given a “green light” and place it above the poverty level on this specific housing indicator.
FP has not only found this tool valuable to establish baselines and evaluate the progress in lifting its microfinance clients and other beneficiaries out of poverty but has also found it to be a highly motivational tool for its staff and has aligned incentives with the number of people they move to a “green” scorecard. Internal auditors verify the results.
The Traffic Light tool is also proving to be an influencer in changing the behavior of beneficiaries. Loan officers meet with their clients every two months when loans are renewed and develop individual plans for each family. The conversations with their clients could, for example, entail why it might be better to invest in a bathroom than buy another television. The tool has been integrated into the agricultural school curriculum and children are taught to assess their own family situation. As a result, children learn what it means not to be poor.
The data provides the basis for more targeted interventions by both FP and other players. The Paraguayan government has taken FP data on housing as a basis to develop a much more targeted housing program. FP is looking at bringing in other services, such as public transportation, to specifically fill the gaps identified by the Traffic Light tool.
16 FP received funding from Avina and technological support from HP to develop the Traffic Light Poverty Assessment tool.
25
Section 4: Feedback from and to beneficiaries The best way to find out if a program is working is to ask its intended beneficiaries. Getting regular feedback from people affected by an intervention is therefore acknowledged by most development organizations as the key yardstick for performance.17 Social service providers can only ensure that they stay on their core social mission if they empower their beneficiaries to hold them accountable.
Every surveyed organization considered it to be crucial to gather feedback from beneficiaries/clients on a regular basis, and at least once a year. Feedback mechanisms such as questionnaires and focus groups are often already embedded in the evaluation methods.
The respondents mentioned several benefits from, and interesting approaches to, beneficiary feedback:
1) Improving product provision and qualityA product or service might be appealing to those who have developed it, but not to those who supposedly benefit from it. When the products or services are distributed for free or at heavily subsidized rates, the market does not provide an adequate feedback mechanism. In addition, beneficiaries typically employ products under very testing conditions such as heat, humidity, dirt and lack of electricity that might lead to unforeseen quality issues and premature break-downs.
Kopernik is a social enterprise distributing water filters, solar lights, cook stoves and other technologies to the poor in Indonesia and other Asian countries. It requests frequent feedback on the products to understand how the products were used and how they could be improved. It provides this feedback to the manufacturers, and also makes it public via its website. It noticed that “people really care about the design of the technology and don’t like it when something is too light or cheap-looking”. Other products may be fantastic innovations, such as a water filter that allows users to drink safely from polluted water sources through a straw-like device, or self-adjustable eyeglasses. However, feedback has suggested that these were, in reality, not widely adopted. “People don’t want to drink all of their water through a straw, making the technology inappropriate for day-to-day use; and many people did not like the design and the weight of the eyeglasses and the way they made them look” reported Ewa Wojkowska of Kopernik.
2) Facilitating feedback through technologyThe widespread use of mobile phones is enabling new, cost-efficient and quick mechanisms to collect feedback from beneficiaries. Kopernik, for example, partially collects feedback by sending and receiving SMS texts to and from its customers. Organizations such as Frontline SMS and Ushahidi specialize in getting information from large crowds of people.
3) Training Beneficiaries to collect feedbackSeveral surveyed social enterprises encourage and train their beneficiaries to run their own surveys and feedback sessions among their communities. The data collected by the beneficiaries is then periodically reported to the social enterprise. This empowers the communities to monitor and evaluate their own progress over time and enables social enterprises to collect data from large numbers of beneficiaries without having to conduct the interviews directly through their own staff.
17 In “Time to Listen”, Anderson, Brown and Jean (2012) relate their findings on the unintended impacts of international aid collected during a six-year “Listening Project”, interviewing recipients of aid in 20 countries. The project was supported by more than 150 of the largest donors and aid agencies.

26
This “Participatory Rural Appraisal” approach has a long tradition of being propagated as the “new professionalism” for development. Participatory Rural Appraisal aims to incorporate the knowledge and opinions of rural people in the planning and management of development interventions. Robert Chambers, a key proponent of the concept, reasons that “poor and exploited people can and should be enabled to analyse their own reality”.18
Example: Gram VikasGram Vikas works with some of the poorest rural communities in several Indian states to implement water and sanitation, education, health and renewable energy programs. Its first task in a new community is to motivate each and every family in the village to unite and establish a village committee. The 12 members have to be representative of the community in terms of gender, economic background and castes. The committee is legally registered to undertake financial transactions and enter into formal agreements.
Gram Vikas trains the village committees to collect relevant data from the community on, for example, water and sanitation usage, water fee collection, water borne diseases, pregnancies, births, deaths and school attendance. Before approaching Gram Vikas to mediate a potential conflict, such as might arise if a family does not use the toilets or refuses to pay for water, the village committee first tries to rectify the situation. The committee also raises critical feedback about Gram Vikas staff and practices such as substandard construction of water tanks, non-inclusion of villagers in the process, or material procurement at elevated prices.
Gram Vikas closes the feedback loop back to its beneficiaries. It displays on large billboards the financial and in-kind contributions to water and sanitation facilities made by the government, Gram Vikas, donors and the villagers themselves, advancing transparency and trust. Gram Vikas also partially shares macro-evaluations and data from other villages with the communities. This has often spurred ideas and innovations among villagers themselves, leading to reductions in water-borne diseases or marked increases in school attendance.
4) Mobilizing beneficiaries as change agentsInvolving the beneficiaries already at the outset of a program can greatly facilitate its implementation, as the above example of Gram Vikas clearly shows.
Transparency International was able to drastically increase the possibilities of implementing its National Integrity Assessments once it started to involve the target groups and those most affected by corruption in its development process. Earlier studies did not have the consultative aspect to them and therefore often failed to achieve the desired results and impact.
5) Developing feedback standards and collaborative effortsThe surveyed INGOs in particular reported taking part in collaborative efforts with peer organizations. Many of them are part of the Humanitarian Accountability Partnership (HAP), which has set up standards to ensure that humanitarian aid agencies are accountable to beneficiaries and provide a certain quality of service. These standards were developed after the Rwandan crisis when NGOs realized that they wielded significant power among beneficiaries in dire need of basic food and shelter. The standards, among other criteria, demand that beneficiaries can address complaints and seek redress safely. They could provide a valuable blueprint for other sectors and smaller organizations.
18 Chambers, 1997, p. 106.

27
Oxfam has gone further and developed a “starter pack” and “minimum standards” for all programs and country offices on beneficiary accountability. Accountability comprises standards around transparency, feedback mechanisms, participation, evaluation and learning.
In the UK, Keystone is an example of an organization specializing in providing tools and services on incorporating the voices of constituents in the planning, monitoring and evaluation processes of development organizations. It specializes in conducting benchmarking surveys that provide independent and comparable feedback from beneficiaries.19
Many social entrepreneurs surveyed expressed surprise at the question of whether and how they incorporate beneficiary feedback, as they have built their entire approaches and theories of change with the involvement of their beneficiaries. Being in a constant dialogue with beneficiaries and incorporating their feedback into their activities is therefore a constant process for many of them.
Two examples of social enterprises with new approaches to the housing sector illustrate this point:
Example: Build Change Build Change designs earthquake-resistant houses based on local materials and practices and trains homeowners and local engineers to build them. Build Change also works with governments to develop and implement building standards and with local private sector businesses to produce and market better building materials and create jobs. The approach is a significant departure from traditional housing projects, where houses are built and then “hopefully the owners like them”. Here, Build Change first looks at existing construction techniques and practices with the homeowners in the driver’s seat. The homeowners select the structural system and architecture and are involved in the cost estimation and construction supervision process. Compared to most agency-built housing projects, empowering homeowners to drive the process results in more satisfied homeowners, higher occupancy rates, and greater investment of the homeowner’s financial resources, which leverages donor funding.
19 See http://www.keystoneaccountability.org/

28
Example: Echale a tu Casa, MexicoSimilarly, Echale a tu Casa establishes themselves in the community in which they work and are in a constant exchange with the beneficiaries. The first step is to identify the real construction demands, followed by social inclusion workshops where the community and Echale select responsible people for financial management, material procurement, etc. Then Echale runs a design workshop to determine the local specific housing model, since houses, practices and climatic conditions vary greatly across Mexico. Next, able craftsmen are identified and trained. They become part of the social franchise system of Echale and allow Echale to have a permanent presence in the different communities with technical expertise once the housing project is completed. All Echale houses are inhabited in contrast to many other government and private housing settlements. The magnitude of the latter is such that if they were all inhabited, the housing crisis in Mexico would be solved.
Both INGOs and social enterprises, in particular the larger ones, often acknowledged self-critically that while already trying hard, they could still greatly improve on collecting and listening to beneficiary feedback. They reported several challenges to raising feedback from beneficiaries:
1) RepresentationSome organizations in the sample have millions of beneficiaries or only affect their ultimate beneficiaries indirectly. These organizations struggle to find a balance between finding a representative sample of beneficiaries and containing costs to a reasonable level.
2) Accuracy and systemic biasBeneficiary surveys, particularly when carried out directly by the service provider, suffer from a systematic bias as clients may not feel comfortable making criticisms. Explaining that the surveys serve the purpose of improving the products or services might help, as well as carefully phrasing the questions.
ICCO, the inter-church organization for development cooperation, piloted a new Client Satisfaction Instrument20 and discovered that it was particularly helpful to ask: “If you were to pay for this service, would you still be equally satisfied or would you want something done differently?”
3) Communication barriersMany beneficiaries are illiterate. Feedback collection therefore often has to rely on oral communication or use pictures, symbols and physical objects to standardize feedback, which can have varying levels of utility.
4) Ethical IssuesOne of the respondents mentioned the complications in seeking direct feedback from patients in the health field. Any survey or questions to patients first needs to be cleared by an independent ethics committee, which determines the rules of research and often takes three to six months to agree to a research protocol.
20 ICCO has set up an online learning community to provide case studies and guides and to exchange opportunities for practitioners engaging in client feedback and downward accountability. See http://www.clientsatisfactioninstruments.org/ for more information.

29
Section 5: Reporting to donors and investorsTowards Standard Reporting Formats? Most social sector organizations mentioned that they themselves largely determine what data they monitor and collect. However, the majority of surveyed organizations find themselves writing largely customized reports around the basic data to their different donors. Many donors have their own reporting formats that they require grantees to fill in periodically and do not accept the data in any other format.
Graph: 1: Monitoring – Evaluation – Reporting
One voice of a social entrepreneur was representative of 90% of the interviewed organizations:
“Reporting requirements vary greatly between funders. One of the most costly responsibilities (in terms of time and money) is to create a system that is flexible enough to meet our standards and yet include the idiosyncrasies of donor requirements. Many donors act according to ‘if you are not sure what you want to know, ask for everything’. As a result, many requirements for reporting do not really contribute to an understanding of what was accomplished, but instead provide some evidence that inputs took place”. Curt Rhodes, Questscope
A few selected organizations among those interviewed have established a clear line as to what they would measure and report on to avoid being carried into a mission drift during negotiations with donors.
“We do not measure anything that we do not find worth measuring or that suggests we should be doing something else from our core mission. Our major donor gave us x million USD, but we worked out every metric and KPI together. We are not customizing reporting to donors, but have been open to feedback if it improved on the existing practice.” Linda Rottenberg, Endeavor
“Non-profits have to ‘twist like pretzels’ to meet funders’ requirements, but we recently walked away from a USD 3 million grant because of incompatible reporting requirements. In general, KaBoom uses its standard data to write customized reports to each donor/partner. There is no common format currently on the horizon.” Darell Hammond, KaBoom!
“Today, we enter every conversation with a potential partner/funder with our strategic plan and ask how the funder can contribute to it rather than seeing how our goals can be adjusted to those of the funder. At the end, about 70% of our reporting is standardized with the remaining 30% customized to individual donors.” Jürgen Griesbeck, streetfootballworld
“We have become more savvy in proactively approaching donors with our implementation plan and offering those results for reporting with the argument that with more focused reporting, we can target more resources on the actual implementation. Nevertheless, most reporting still needs to be individually packaged and some donors insist on their formats and indicators.” Finn Heinrich, Transparency International
Monitoring(Data collection systems)
Evaluation(Data interpretation)
Reporting(Data presentation)

30
Differences by Type of Donor or InvestorThe reporting requirements clearly differ from funder to funder, but the survey also showed patterns in terms of reporting standards and requirements depending on the category of funder. The following paragraphs elaborate the observed differences for the different categories, namely private foundations, public funders (government agencies, bilateral and multilateral institutions), corporations and corporate foundations, social investors and individual donors.
FoundationsFoundations seem to increasingly accept the data brought forward by social enterprises and INGOs, sometimes even accepting the organizations’ standard evaluation reports with a few add-ons. However, one interviewee observed that “the higher the profile of the foundation, the higher the reporting requirements. It helps that program officers at large Foundations such as the Bill & Melinda Gates Foundation are well versed in monitoring & evaluation and take an open approach to jointly developing the evaluation and reporting methodology at the beginning of a project”.21
Still, most Foundations have different agendas and hence require grantees to adapt their reporting and language to meet those agendas. “We collect the same data for all reporting purposes, but package it differently according to what the different donor is looking for – whether it is a powerful story to convey to a large public or whether it is advancing the health field or another purpose” (Andrea Coleman, Riders for Health).
Public FundersPublic, bilateral and multilateral donors have been universally characterized by all interviewed organizations as the most demanding and onerous – both in a positive and negative sense. This is understandable, given that they provide, often by a magnitude of 10 or more, the largest sums of money and are accountable to taxpayers for spending them effectively.
Among the INGOs, several expressed a healthy exchange with major bilateral institutions around how to improve aid effectiveness and how to meet growing reporting requirements. DfID in particular, but also the Swedish, Canadian, Swiss and German bilateral institutions were seen as highly demanding, but generally in a productive and justifiable way. DfID has announced it wants to substantially improve aid transparency and has laid down the challenge for all major NGOs and development institutions to follow suit.22
In 2012, DfID topped the “Publish What You Fund” list of 72 aid organizations around the world for transparency performance. DfID seeks to make the chain of aid delivery fully transparent from DfID right through the intermediaries to the end beneficiaries. DfID has taken a leading role internationally with the International Aid Transparency Initiative (IATI) and launched an Open Aid Information Platform to this end. It is challenging its grantees to adhere to the IATI standards and to publish full information on their disbursements. This includes geocoding data to show where aid is spent as well as publishing feedback from beneficiaries.23
21 Several larger foundations are experimenting with different evaluation techniques, particularly when it comes to evaluating innovative models. Preskill and Beer (2013), p. 5, argue that social innovation can be restricted by traditional evaluation techniques that look at how well a set of activities is implemented or leads to fixed outcomes. Instead, a more flexible “Developmental Evaluation” approach should be adapted.
22 See Barder 2012 and The Guardian, November 29, 2012.
23 For more information, see http://iatistandard.org/

31
Oxfam mentioned that the reporting demands from DfID had to some extent actually been helpful in challenging the organization to assess the effectiveness of its programmes through its Global Performance Framework. Similarly, Transparency International felt that the pressure from two bilateral donors (DfID and AusAID) to provide baselines was a healthy challenge to advance the M&E practice at TI, which was always considered important on paper but the resources might not have been prioritized without the external nudge.
The EU was criticized as the most difficult and inflexible partner to work with by both INGOs and social enterprises, as exemplified by these three voices:
“The EU is the most rigid institution. This is particularly challenging for programs, which require local adaptation and flexibility to change course over time. For the EU, ticking off the activities is what counts, less the final outcome. If the project prescribes four workshops, we have to deliver these, even if we realize the money might be better spent. If the budgets would be more flexible, our impact could have been bigger. This makes our EU programs the worst in terms of input/output balance.” (INGO)
“We’ve often had evaluators being sent in who spent 1-2 days on the ground, often without sufficient consultation with the recipient organization and understanding of the program outcomes.” (Social Enterprise in the Middle East)
“The EU has much higher demands than any other donor. It is a separate ballgame and not empowering for the receiving organization. They often require outcome and impact measures at the end of the 2-3 year project duration, when these take much longer to manifest themselves.” (Social Enterprise in Asia)
A 2008 study on reporting to funders underlines the comments above. The study found a wide variation in the reporting costs corresponding to the different types of funders. Reporting to government funders was the most expensive (9% of total budget, rising to 20% for European funding).24 Reporting to individual donors and independent funders had much lower average costs (around 3% of budget).
Some social enterprises which run large programs funded by international public agencies expressed frustration over the external evaluation processes and the lack of participation from their side:
“Many outside evaluators are sent to assess our program. Someone forms an opinion in 33 hours on 33 years of work with little space for dialogue. Many independent evaluators are very judgmental, work under pressure to produce a report in 2-3 days. As a result, evaluations do not go deep and do not build our organizational capacity over time. The ideal situation is a participatory evaluation, where we jointly identify 10-15 key indicators and leave out the 250 peripheral things, which are a waste of energy.” (Social Enterprise in Asia)
Several of the social enterprises in the sample receive funding from city, state and government agencies, confirming that their demands typically exceed those of other funding partners. A Latin American social enterprise lamented that the government does not accept its records in electronic form, but demands paper versions because the electronic signatures are not recognized.
Two organizations reported on different approaches to achieve greater harmonization and co-operation among donors, which could serve as examples for other large recipient organizations and sectors:
1) Donor ConsortiaBangladesh-based BRAC has succeeded in getting donors for some of its largest
24 See Ógáin, Lumley and Pritchard, 2012, p. 29

32
programs to work together in concert. The three to eight consortium members, mainly government agencies and INGOs, agree on shared reviews twice a year and receive the same standardized reports. They largely forego having a say in the details of a long-term program unless it is coordinated in the consortium. One key benefit of the consortia is that donors cannot choose to simply fund the most attractive parts of a program, but all must contribute proportionately to overhead and M&E costs, for example.
2) Global PlanThe “Global Plan towards the Elimination of New HIV Infections” is one example of rallying many different players around a common goal, involving common reporting standards. The effort coordinated by UNAIDS, brings together countries, civil society, international organizations and the private sector to work and be accountable together for the elimination of HIV/AIDS infections among children by 2015. At the national level, this aligned approach facilitates joint planning, combined resource mobilization efforts and joint monitoring and evaluation.25
The Global Plan calls for systems that enable communities to collect data and for the development of new metrics, focusing more on the desired result, the elimination of HIV/AIDS infections, rather than the process and individual substrategies.
Mothers2mothers says that its reporting to bilateral and international organizations is greatly facilitated because it is aligned to the Global Plan. The Global Plan has also adopted the mentor mothers model based on its strong results. However, “some private foundations often still request different data”. According to a staff member from mothers2mothers, having a Global Plan in place “has also immensely facilitated the expansion of the model to new countries”.
Corporate Donors
Most organizations working with corporate partners expressed that these provided more latitude and often accepted their standard evaluation report. Some also praised the greater willingness of corporate donors to innovate and take risks:
“Corporate donors tend to be more innovative and risk-taking as well as interested in understanding what we can already bring to the table in terms of M&E. Public funders tend to have reporting structures that everyone needs to follow”. Rich Thorsten, Water.org
Some interviewees pointed out that companies are often looking for different metrics and results:
“I would not say that companies are less interested in impact measurement or more lenient, but they care more about “net” impact to company (such as visibility and employee engagement) than overall impact.” Linda Rottenberg, Endeavor
“Our corporate funders always ask for photographs and increasingly site-visits and staff engagement opportunities.” Jimmy Pham, KOTO
“Our primary means of revenue generation next to own revenue generation comes from corporations. Reporting to companies can include the number of books we provide and the number of children we reach. We also report on relevant marketing and media results, which have been identified as significant metrics of success for our corporate partners.” Kyle Zimmer, First Book
One organization mainly working with corporate clients on a “fee for service” basis pointed out the advantage of also taking grant money to advance its broader mission to improve labor practices:
25 UNAIDS, 2011.

33
“For our foundation and government programs we fill in logical frameworks and monitor progress against these. These donors force us to look at impact more than our corporate clients. Corporations mostly “tick a box” if an audit or training has been done rather than taking this as a basis for a long-term intervention. Part of the issue is that employees are not measured on long-term sustainability, but more on budgeted activities.” Dan Viederman, Verité
Social InvestorsSeveral of the for-profit social enterprises in the sample had raised debt and/or equity capital from social investors (or “impact investors”). They reported that the investors, despite highlighting the that they see themselves committed to financing with a social cause, primarily pay attention to the financial performance of a social enterprise and require very light social reporting.
The social reporting usually focuses on a few (about five) output indicators that are easily collected on a regular basis by the enterprises. Some investors have provided input sheets or formats.
“When we raised capital from two social investors, we had to introduce a new financial tracking and auditing system. You can say they are 80% interested in financials, 20% in content and impact. We just include a few social output metrics with the financials each quarter.” Andreas Heinecke, Dialogue Social Enterprise
Individual Donors
The interviews in this sample largely corroborated the findings of a 2004 study that surveyed 22 individual donors (as opposed to institutional donors mentioned in the previous sections), who mainly earned their wealth in finance and investing: individual donors care less about nonprofit performance or impact.26 They found common beliefs among these individuals: there wasn’t much difference between nonprofits, any giving was good, and performance measures were a waste of time and money. Most importantly, they found that individual donors picked nonprofits based on personal relationships, not performance.
“Around thirty percent of our income comes from individual donors, who do not explicitly ask for feedback, but Kopernik sends regular update reports and technology user feedback to them anyway.” Ewa Wojkowska, Kopernik
“We eventually received feedback that our reports were never read.” (Social Enterprises from Europe and the USA)
“Originally I thought people care about metrics and where their money goes, but that has not been the case. Rigorous impact evaluation does not really translate into increased funding. For people that are inclined to provide funding to Endeavor, it is a confirmation. Others are turned off, believing that Endeavor is working so well, it does not need them. For many it is‚ too much head, too little heart.” Linda Rottenberg, Endeavor
The interviewed organizations, which all have a strong commitment to proving their results, expressed frustration at this lack of interest from high net worth individuals. It is this indifference that has fueled scandals such as “Three Cups of Tea”, where donors did not care to verify whether the claimed schools on the ground in Afghanistan were actually set up and running and did not notice that the schools were 20 times more expensive than those of comparable organizations. When these scandals come to light, they affect the reputation of the entire sector.
26 See Cunningham and Ricks, 2004 and Ogden, 2013.

34
Section 6: Feedback from and to other stakeholdersWhile the primary stakeholders in the M&E process are clearly beneficiaries and donors, a few organizations mentioned additional stakeholders with whom they had set up regular evaluation and reporting exchanges. The three organizations below highlight feedback loops with peer organizations, non-beneficiary clients and experts.
Peer to Peer exchange: Riders for HealthRiders for Health and its partner organizations set up a regular process where they hold each other accountable and assess their roles in delivering towards a common goal. Similar to Riders, the partner organizations work in the same areas of rural Africa to improve the health conditions, but mostly with different approaches. A Partnership Director at Riders is responsible for working with those partners to improve collaboration and offer better services to beneficiaries as well as regularly reporting to partners the benefits and challenges of cooperation. This also entails co-reporting to a major donor.
While individually the organizations cannot claim to have an impact on reducing child and maternal mortality rates or incidences of malaria, such pooling of efforts allows for comprehensive reporting of the joint impact.
Client Feedback: KOTO, VietnamKOTO provides vocational training to disadvantaged youth in Vietnam. Important stakeholders which regularly provide feedback to KOTO are the hotels and restaurants and other companies that employ the graduates of KOTO’s training. KOTO has an agreement with 10 hospitality establishments who work quite closely with KOTO in placing graduates and giving feedback on their performance.
Academic and Expert Feedback: Un Kilo de Ayuda (UKA), MexicoThis Mexican social entrepreneurial venture set up an Advisory Council on Evaluation comprising leading academics, public health officials and nutrition experts in the country, which regularly reviews the program results. On the basis of evaluating the data for the more than 50,000 children in the program, they discovered that early childhood stimulation contributed to two-thirds of the neuro-development of the child, while nutrition, water, hygiene and all other factors were only responsible for the remaining one-third. This led to a strong shift and focus on neuro-development. In addition, the public health officials in the advisory board were able to take the findings and translate them into public policies in Mexico.

35
Section 7: How are M&E results translated into organizational learning?How do organizations ensure that the lessons learned from the monitoring and evaluation process are not just “buried in reports to funders” but are shared within the organization and translated into better and more efficient products, services and internal processes? Ideally, measurement is embedded into the organization’s governance, processes and procedures and not considered an add-on. In practice, many respondents confessed that they found it challenging to set up the right processes and create an open feedback culture.
In smaller social enterprises that operated largely in one office or country it was mostly the founder(s) that ensured continuous learning was taking place from the monitoring and evaluation process. As described in Section 1, their primary motivation to set up the M&E process was to improve their services and products in the first place. Many founders reported spending a significant amount of their own time on analysing results and changing practices as a consequence.
As social enterprises scaled across borders and managed offices in different regions and across cultures, they reported challenges in establishing an open, internal feedback culture beyond the committed founder. Representatives from faraway offices are often reluctant to openly share negative results and there can be cultural barriers to open feedback that accentuate this problem. Below are some examples of how social enterprises are experiencing and addressing the cross-cultural challenges:
“We could still get much better at incorporating lessons learned into organizational practice. The challenge is particularly difficult given the organization works in different remote locations and has different cultural backgrounds. Staff are often particularly keen to report positive results and less forthcoming about reporting negative results, even though failures can often result in more learning. A culture change is necessary to achieve this. Landesa is considering using fail fests to encourage transparency around failures and drawing joint conclusions from them.” Tim Hanstad, Landesa
“We let the numbers speak for themselves. We send out the results for comparable KPIs to our different country offices on a quarterly basis. The Net Promoter Scores (from our beneficiaries) are shared every six months. This allows the country management to compare themselves to the other countries on a fact basis rather than forcing the HQ to come in and criticize.” Linda Rottenberg, Endeavor
“We consider ourselves a learning organization. At our annual strategic planning process we incorporate external factors as well as internal learnings. Lessons learned are also built into each project report. However, the reality is that they are not always shared within the organization. We are currently working on more systematically drawing those lessons from the individual projects and reports for the benefit of the larger organization.” Jürgen Griesbeck, streetfootballworld
The interviewed INGOs looked back on a longer trajectory of managing organizational learning across cultures. They face particular challenges due to the high number of countries in which they operate (often more than 50) and the network structure of most organizations that provides fairly large autonomy to the different country organizations.
The first set of statements illustrates approaches to personal exchanges at INGOs, the second set describes attempts to disseminate learning through publications.
“We have a strong learning culture at Oxfam. For example, every six months, the programme leadership team, made up of senior managers from the international and campaigns divisions meet for a full week to share, reflect and learn. Additionally, every two years, we run a global learning event called Oxfam Reflects on a theme of

36
particular strategic importance. In 2014 this will focus on Inequality and Oxfam’s role in bringing about change on this theme. It is a great way to ensure that the organization is regularly learning from its own experiences and the changes taking place around it.” Jennie Richmond, Oxfam
“We run quarterly and half-yearly fish bowl meetings (i.e. review meetings involving all staff at the secretariat) to report on key programs with a focus on challenges and lessons learned. We find the seating arrangement of a fishbowl is conducive to creating an open culture to allow critical reflections and not just giving the impression that people have to shine.” Finn Heinrich, Transparency International
The below examples indicate how some INGOs are changing the nature of their publications or introducing new ones to effect organizational learning and change. Plan International currently produces hundreds of reports but is rigorously trying to focus on those that provide value to the organization and/or external stakeholders. World Vision has published a new accountability report, rating its different programs and offices.
“Huge resources are involved in producing our hundreds of reports and the key question should be: what are we learning from these? You need negative feedback to really draw out the lessons. The key for evaluations and performance reviews is to look less at what is being said about the program, whether it is positive or critical, but more at the clarity of management recommendations and whether these are implemented.” Simon Early, Plan International
“In 2010, we introduced a new system in accountability reporting across our programs and offices, aligning governance, programmatic and management assessments in an “Integrated Review Framework” linked to National Office ‘dashboards’. With increasing transparency, tensions surfaced between people wanting to be able to demonstrate results and those wanting to use evidence of poor results as a platform for organizational learning. Instead of concealing the challenges faced, the accountability team seeks to create a better understanding among supporters about how difficult it is to promote justice and eradicate poverty. At the same time, while sometimes painful, greater transparency gives early warning and focuses attention on offices needing additional support.” Beris Gwynne, World Vision
BRAC’s internal monitoring department has a regular process to provide feedback to program teams and track how recommendations are implemented:
“Monitors share data with the program teams (health, education and microfinance, in particular). When data is challenged from program directors, a neutral team of both monitors and program members verify the data. After validation, a narrative report is prepared for the top management. Auditing reports with the financials are taken much more seriously by the program teams. In some cases, monitoring reports have a tendency to be disregarded. BRAC hence introduced a follow up monitoring after typically 6 months, looking at the same indicators to see if the program managers have acted upon the feedback.” BRAC

37
Section 8: What resources are employed for the M&E process? Financial ResourcesThe amount spent on M&E among the surveyed organizations falls in the range of 1-10% of their respective total budgets. In general, the larger organizations tend to spend less as a percentage of their total budget than the smaller ones. Figure 8: Spending on M&E as percentage of total budget (number of organizations)
Source: own survey
A survey among close to 800 charities in the UK showed a larger percentage of organizations spending less than 3% on M&E than this sample (62% versus 33%) and a lower number of charities spending between 4% and 10% (35% versus 62%), suggesting that the organizations interviewed spend a higher than average proportion of their budget on M&E.27 The same study suggests that an optimal spending range seems to be around 1-6% and organizations reporting higher spending did not necessarily feel this translated into better services or increased fundraising.28
All INGOs in this survey spent between 1% and 3% of their total budget on M&E, yet they note that they were “not nearly spending enough”, citing 3% as the minimum amount they try to budget into project proposals, with an overall spending range of 5% and higher as the optimal size.
27 Ógáin, Lumley and Pritchard, 2012, p. 29.
28 The numbers have to be interpreted with caution due to high subjectivity of cost estimates and low rate of respondents.

38
Among the surveyed social enterprises, the largest number of organizations spent between 7% and 10% on M&E as a percentage of their total budget (44% of respondents). They typically reported a funding gap between donor or their own M&E demands, and the amount of funding they receive:
“Donors often provide some funding for M & E, but not usually commensurate with the demands they make. They are willing to pay for Chevrolets, but want the services of a Cadillac.” Curt Rhodes, Questscope
“We are generally looking for grants to cover M&E costs as we cannot shift these onto the customer, our end beneficiary. It is not easy to find donors for M&E activities, but we finally found a US based foundation.” Francesco Piazzesi, Echale a tu Casa
“The nature of working with marginalized and mobile populations means that data gathering continues to be labor intensive and challenging. Donors increasingly require that information, but are unwilling to allocate budget to that exercise or it has to weigh on the administration budget line, which is kept very tight. In addition, it is difficult to find qualified personnel in our region of operations, thus forcing us to rely heavily on expensive international specialists.” Sébastian Marot, Friends International
Similar to the Ógáin, Lumley and Pritchard 2012 study referred to previously, most organizations in this sample expressed doubts that evidence of impact helps procure contracts and funding.

39
Human resourcesAll the large INGOs surveyed and the majority of social enterprises had a person or team fully dedicated to M&E activities. In total, 72% percent of those surveyed had a separate person or team in place – in some cases substantial divisions with dozens of employees. This is a significantly higher proportion than the 37% in the New Philanthropy Capital study of UK charities (see Figure 9).29
Figure 9: Percent of organizations having a dedicated person or team to M&E
Source: own survey; and Ógáin, Lumley and Pritchard, 2012, p. 31
The New Philanthropy Capital study establishes a link between having a dedicated person and team and more intensive measurement practices, as conventional wisdom would assume. Some M&E teams in the survey sample, such as BRAC and Landesa, have gained excellent reputations and are contracted by other organizations to conduct evaluation studies.
There is not one organizational model, and the examples below describe the functioning of two M&E teams in organizations operating across many countries:
“Landesa has a team of three in its Research, Monitoring and Evaluation (RM&E) department. Additional Landesa staff are contributing to the process as needed. This team supports the project implementation staff in building M&E into each project at the outset and drawing up an M&E plan as part of each project lifecycle document. There are no specific templates or general standards at the project level. Each of the roughly 50 concurrent projects undertaken has a customized plan depending on whether it is a project of more experimental nature (requiring more frequent M&E) or a proven concept, as well as donor requirements.” Tim Hanstad, Landesa
“There are staff members for M&E at the global, regional and country level. The Global Advisory team provides leadership, advisory services, guidance and tools, and services the programme information systems needed to support quality programmes. Regional teams work directly with country programmes – providing support, guidance and facilitating learning.” Jennie Richmond, Oxfam
29 Ógáin, Lumley and Pritchard, 2012, p. 31.

40
Technological resources Many of the surveyed social enterprises reported currently investing in technologies to facilitate feedback from beneficiaries, improve tracking of progress and make their M&E efforts more efficient.
The following technologies and uses were featured:
1) SMSSMS as a good and inexpensive way to collect feedback from customers and beneficiaries. Most beneficiaries have mobile phones and their numbers can be obtained upon purchase of the products.
2) GPSSeveral projects are using GPS tracking systems to track where their activities are happening. This is particularly valuable in the absence of maps in rural areas. “Outreach health workers often tell us that being able to use a Riders’ motorcycle means they can visit more villages, more regularly, see more people and reach areas they couldn’t reach before to deliver health care services. We’re hoping these GPS maps will help us to measure and demonstrate this.” Andrea Coleman, Riders for Health
“More and more partners are using GPS to track where loan groups meet and water structures are built. It allows us to easily locate the intervention communities. Originally, we wanted to provide a direct tracking tool via social media to raise awareness and funds. We had a large number of followers, but this did not materialize into funds.” Rich Thorsten, Water.org
3) M&E software tools for sectorsFundacion Paraguaya has developed a software tool for its Traffic Light Poverty Assessment tool (see section 3) with the help of HP and makes it available for adaptation to other settings. Streetfootballworld is developing a comprehensive M&E planning tool for organizations that, similarly to Streetfootballworld, act as network or umbrella organizations and seek to aggregate the impact of their many partners.
4) Open Database systemsWhile almost all of the surveyed organizations track their outputs in some form of databases, a few organizations have invested in more sophisticated on-line tools that enable them to monitor and mine data real-time. Two organizations open their databases to partner organizations, in particular international organizations and government agencies. However, the access rate of these partner organizations and their ability to generate their own reports is not always given. Rather than forcing all organizations to open their databases and “data dump”, one INGO expressed the preference to push for “meaningful transparency” and common standards among recipient organizations to feed information into the central IATA Registry.

41
5)
Key Insights and RecommendationsFor Social Sector Organizations• Before scaling and/or expanding a new model, it should be rigorously tested. Evidence
that a specific model works is particularly key to convincing policy-makers and large donors to support the expansion efforts.
• Most organizations have found it useful to limit the number of key indicators they monitor to somewhere between three and 15, resulting in greater management attention on the key levers.
• Regular feedback from the people affected by an intervention is the key yardstick for performance. Ideally, beneficiaries are already participating in the design of the intervention and are active agents in the change process.
• Inputs (financial and human resources) and outputs (i.e. number of people directly affected by the activities) should be monitored regularly. Organizations should strive to assess the link between their activities and the ultimate change it achieves (outcome) through periodic external evaluations.
• For some models, particularly around basic needs, the output-outcome link might already be well established through several reputable studies. In such cases, donors should be referred to these studies and the financial resources should be employed on expanding the program rather than on conducting additional impact evaluations.
• The reporting indicators and outcomes should be agreed with the donors or investors at the beginning of a project. Social sector organizations should not be pressed to collect data that does not directly correlate with their mission and Theory of Change.
• If a program has multiple donors, it might be worthwhile to convince the different co-investors to form a “donors’ circle”, where all donors agree upfront on one reporting format to eliminate the burden of multiple reporting demands.
• Statistically meaningful and scientifically credible impact evaluations are expensive and difficult to obtain as multiple external factors and interventions influence a specific population group. The experience of large INGOs in evaluating impact can serve as examples to smaller NGOs and social enterprises. In addition, several organizations working in the same area can pool their resources to conduct joint impact evaluations and co-report to major donors.
• Social service providers have a wide range of measurement methodologies at their disposal. Two of the surveyed organizations have adopted simple, effective tools: the Net Promoter Score is an indicator for client satisfaction and the Traffic Light Poverty Assessment tool provides a differentiated instrument to assess whether a program is lifting beneficiaries above the poverty line.
• Translating the lessons from the M&E process into organizational learning remains an ongoing challenge for most organizations. The processes include regular meetings and reports that promote an open feedback culture, looking less at what is said about the program, whether positive or critical, and more at the management recommendations and responses.
• A rough guideline for M&E expenditures seems to be about 3-5% of the budget for larger and about 4-10% for smaller organizations. Higher spending levels do not seem to translate into additional benefits.
• Case studies and other forms of evaluations can also be a powerful communication and motivational tool “to keep an ear to the ground” in larger organizations or in organizations where part of the staff is more removed from the field and the actual beneficiaries.

42
For Donors and Social Investors• Corporate donors and foundations have more leeway to take risks and fund
innovative causes. They should therefore take advantage of this position to advance innovative approaches to difficult challenges.
• When funding innovative models, a standard evaluation process tracking activities and specific outputs at the end of the project timeline is not appropriate. Consider a continuous monitoring process with enough flexibility to adapt to changing circumstances and results.
• Agree on output and outcome indicators upfront. The timeline should take into consideration that many outcomes only manifest themselves after several years. Revisions should be possible if significant changes occur.
• Consider that high-performing social enterprises have a strong intrinsic motivation to evaluate their outcome and often closely involve the intended beneficiaries in the design of their model.
• Respect recipient organizations’ desire to focus on those indicators that are closely aligned with their mission and Theory of Change. Any additional indicators needed by the donor should be carefully evaluated and collected by the donor or investor directly.
• Be prepared to factor in an additional 3-10% to the project’s budget for M&E, depending on M&E needs. If the recipient has to spend more than 10% on M&E and reporting, this should raise a red flag.
• Reporting costs can be reduced if the donor or social investor agrees to common reporting standards with other co-investors. There are a number of attempts to remove reporting inefficiencies, such as the Social Reporting Standard (SRS) developed by several foundations in Germany, and GIIRS and B-Corp evaluations, developed in the US.
• Be aware that impact evaluations are very difficult and costly to measure accurately. • Involve all stakeholders in developing transparency and reporting standards. An
example is the UNAIDS-coordinated Global Plan to eliminate new HIV/AIDS infections in children, where multiple partners contribute and report towards a common goal.
• Pay attention to the results of M&E efforts! Compare them to similar interventions to assess whether the support being given is invested effectively and efficiently.
• Many surveyed organizations expressed the desire to conduct impact studies but find it difficult to find the financing for them. Consider supporting such studies for innovative models which can serve as blueprints for a larger sector.

43
References
Anderson, Mary, Dayna Brown and Isabella Jean. Time to Listen. Hearing People at the Receiving End of International Aid. CDA Collaborative Learning Projects, Cambridge, MA. 2012.
Barder, Owen. “Could Britain’s New Aid Transparency Be a Game-Changer?”. Center for Global Development. Posted December 7, 2012. Available from http://international.cgdev.org/blog/could-britains-new-aid-transparency-be-game-changer.
Clark, Catherine, William Rosenzweig, David Long and Sara Olsen. “The Double Bottom Line Project Report. Assessing Social Impact in Double Bottom Line Ventures. Methods Catalog.” Research Initiative on Social Entrepreneurship, Columbia Business School (2004).
Chambers, Robert. Whose Reality Counts? Putting the First Last. Intermediate Technology Publications, London, 1997.
Cunningham, Kate and Marc Ricks. “Why Measure. Nonprofits Use Metrics to Show that They are Efficient. But What if Donors Don’t Care?” Stanford Social Innovation Review, Summer (2004): pp. 44-51.
Endeavor Worldwide Performance Report. Endeavor, New York, 2012. Available from: http://share.endeavor.org/December%202012%20-%20Endeavor%20Worldwide%20Performance%20Report.pdf
Hehenberger, Lisa, Anna-Marie Harling and Peter Scholten. “A Practical Guide to Impact Measurement.” European Philanthropy Association, Brussels, November (2012).
Jacobs, Alex. “Hats off to Oxfam. But are they asking the right question?”. NGO Performance. Posted October 17, 2012. Available from http://ngoperformance.org/2012/10/17/hats-off-to-oxfam-but-are-they-asking-the-right-question/
Nicholls, Alex. “The Functions of Performance Measurement in Social Entrepreneurship: Control, Planning and Accountability.” In Hockerts, K., Robinson, J., and Johanna Mair (eds.), Values and Opportunties in Social Entrepreneurship, Palgrave MacMillan (2010), pp. 241-272.
Ógáin, Eibhlín N., Tris Lumley and David Pritchard. “Making an Impact. Impact measurement among charities and social enterprises in the UK.” New Philanthropy Capital, October 2012.
Ogden, Timothy. “Ten Years On. Are Donors Different? Were They Ever?” Stanford Social Innovation Review. Posted April 1, 2013. Available from: http://www.ssireview.org/blog/entry/ten_years_on_are_donors_different_were_they_ever?utm_source=Enews&utm_medium=email&utm_content=1&utm_campaign=ogden
Perry, James. “Social Impact Measurement: Time to Admit Defeat”. The Guardian, 11 April 2013.

44
Preskill, Hallie and Tanya Beer. “Evaluating Social Innovation”. Foundation Strategy Group, 2012. Accessed May 3, 2013. Available from http://www.fsg.org/tabid/191/ArticleId/708/Default.aspx?srpush=true
Reichheld, Frederick. “The One Number you Need To Grow”. Harvard Business Review, December 2003.
The Guardian. “Aid Transparency is UK’s Top Priority”. November 29, 2012. Available from http://www.guardian.co.uk/global-development-professionals-network/2012/nov/27/aid-transparency-uk-development
The World Bank. Monitoring and Evaluation. Some Tools, Methods and Approaches. Washington, D.C, 2004. Available from http://siteresources.worldbank.org/EXTEVACAPDEV/Resources/4585672-1251481378590/MandE_tools_methods_approaches.pdf
UNAIDS. Countdown to Zero. Global Plan towards the Elimination of New HIV/AIDS Infections among Children by 2015 and Keeping their Mothers Alive. Geneva, 2011. Available from http://www.unaids.org/en/media/unaids/contentassets/documents/unaidspublication/2011/20110609_jc2137_global-plan-elimination-hiv-children_en.pdf
Twersky, Fay, Phil Buchanan, and Valerie Threlfall. “Listening to Those Who Matter Most: the Beneficiaries”. Stanford Social Innovation Review, Spring (2013), pp. 40-45.
York, Nick and Caroline Hoy, “What do DfID Wonks think of Oxfam´s Attempt to Measure it’s Effectiveness?”, Oxfam. Posted October 24, 2012. Available from http://www.oxfamblogs.org/fp2p/?p=12254