MONGOLIA - zsl.org Steppe... · 3 Mongolia officially traded seven wildlife species during the...
230
MONGOLIA SILENT STEPPE II: Mongolia’s Wildlife Trade Crisis, Ten Years Later June 2018 Independent Research Institute IRIM MONGOLIA
Transcript of MONGOLIA - zsl.org Steppe... · 3 Mongolia officially traded seven wildlife species during the...
MONGOLIA SILENT STEPPE II:
Mongolia’s Wildlife Trade Crisis, Ten
Years Later
June 2018
Independent Research
Institute
IRIM
MONGOLIA

MONGOLIA
SILENT STEPPE II: Mongolia’s Wildlife Trade Crisis,
Ten Years Later
June 2018

This study was prepared by The Zoological Society
of London (ZSL), Legal Atlas, and the Independent
Research Institute of Mongolia (IRIM) with funding
from the Illegal Wildlife Trade Challenge Fund of
Great Britain’s Department for Environment, Food
and Rural Affairs (DEFRA). The UK government is
committed to tackling illegal wildlife trade, a
criminal industry worth more than £6 billion each
year threatening both wildlife and people. The
Illegal Wildlife Trade (IWT) Challenge Fund
provides financial support to practical projects
around the world which:
develop sustainable livelihoods for
communities affected by illegal wildlife trade
strengthen law enforcement and the role of the
criminal justice system
reduce demand for the products of the illegal
wildlife trade
As of 2017, the Challenge Fund has allocated
around £9.8 million to 34 projects.
This publication is available online at www.zsl.org
and www.legal-atlas.net.
Suggested citation:
Wingard, J., Pascual, M., Rude, A., Houle, A.,
Gombobaatar, S., Bhattacharya, G.,
Munkhjargal, M., Conaboy,
N., Myagmarsuren, S., Khaliun, T., Batsugar,
T., Bold, T. 2018.
Wildlife Trade Crisis, Ten Years Later. Zoological
Society of London, London UK, Legal Atlas and
IRIM.
Contact information of the primary authors:
James R. Wingard, JD
Legal Director, Legal Atlas
Email: [email protected]
Maria Pascual
Director, Legal Atlas
Email: [email protected]
Gitanjali Bhattarcharya
South and Central Asia Programme Director
Zoological Society of London
Email: [email protected]
This report is a product of the staff of the
Zoological Society of London, Legal Atlas, and IRIM,
as well as the reviewers that provided valuable
input to the final draft. In this regard, special
thanks are due to Mr. Gombobaatar from the
Ministry of Environment and Natural Resources,
who provided a review of the critical chapters. The
report’s findings do not necessarily reflect the
views of the Directors of these entities or the
government of Mongolia. No entity involved in this
study guarantees the accuracy of the data included.
Likewise, the boundaries, colors, denominations,
and other information shown on any map in this
work do not imply any judgment on the part of any
entity named herein concerning the legal status of
any territory or the endorsement or acceptance of
such boundaries.
The material in this publication is copyrighted.
Copying and/or transmitting portions or all of this
work without permission may be a violation of
applicable law. The Zoological Society of London
and Legal Atlas encourage dissemination of this
work and will normally grant permission to
reproduce portions of this work promptly. For
permission to photocopy or reprint any part of this
work, please send a request with complete
information to ZSL.
Cover image: Kirk Olson, Mongolia Country
Director, © Wildlife Conservation Society
Cover design by: Legal Atlas
Publication Copyright
© 2018 The Zoological Society of London
© 2018 Legal Atlas, LLC
All rights reserved.

ii
Contents
PREFACE IV
FORWARD FROM MONGOLIA VI
FORWARD FROM UK VII
ACRONYMS VIII
TRANSCRIPTIONS IX
CREDITS X
EXECUTIVE SUMMARY 2
CHAPTER I. INTRODUCTION
THE SETTING 20
A CROSS-SECTIONAL STUDY 23
OBJECTIVES AND APPROACH 25 A More Holistic Approach To Surveying Wildlife Trade Matching Wildlife Trade Cycles Tailoring Survey Instruments To Separate Tasks Refined Sampling Methods A Professional Survey Team Tapping Into New ICT Opportunities Adding Data Visualization Nesting The Survey In A Global Context
CHAPTER II. METHODS
INTRODUCTION 30
RESEARCH QUESTIONS 31
SOURCES OF INFORMATION 32
RESEARCH TEAM 33
RESEARCH CALENDAR 35
RESEARCH INSTRUMENTS 36 Instrument Development Instrument Validation Instruments Targeting Households Instruments Targeting Markets Instruments Targeting Stakeholders
SAMPLING DESIGN 44 Household Design Sampling for Market Instruments
DATA COLLECTION AND ANALYSIS 51
CHAPTER III. THE BIGGER PICTURE
INTERNATIONAL TRADE IS A PRIMARY DRIVER 56 China’s Influence Russia’s Influence A Confirmed Transit Country
CITES TRADE REFLECTS A CHANGING ROLE 63 Official Numbers Tell Part of the Story Mongolia is a Consumer Country of Foreign Wildlife Live Specimen Trade Dominates Exports are Still Strong

iii
HARD TO CONTROL 71 Increased Trade Requires Increased Capacity Free Trade Zones Pose Risks Unprotected Borders Facilitate Trade Vast Territories Challenge Enforcement The Threat of Violence Hinders Enforcement Illicit Wildlife Trade Similarities to Drugs Trafficking International Organized Crime is Part of IWT in Mongolia Synergies with Business to Hide Illicit Trade
CHAPTER IV. INSTITUTIONS AND LAWS
INSTITUTIONAL LANDSCAPE 81 Rebuilding Capacity Regulators and Managers The Enforcers Corruption
IWT LEGAL FRAMEWORK 106 The Full Framework What Constitutes a Wildlife Offense CITES Compliance Gap Analysis Summary
PROSECUTING WILDLIFE CRIMES 127 A Divided System Wildlife Crime Cases The Final Challenge to Prosecution Conclusion
CHAPTER V. WILDLIFE TAKE AND TRADE
WILDLIFE TAKE 142 Estimating Hunters and Fishers Variety of Species Targeted Reported Harvest Volumes Trends 2005-2015 Harvest Seasons Old Times, New Times Illegal Hunting Methods Taking Over Fish: The New Marmot ‘We Fish Like Thieves’ Hunter and Fisher Profiles
WILDLIFE TRADE MARKETS 160 Household Sales Household Purchases Restaurants Traditional Medicine Retail Markets Outdoor Markets Trophy Hunting Case Study: Gray Wolf Case Study: Marmot
BIBLIOGRAPHY 193
ANNEXES 198 ANNEX I. Research Questions
Annex II. Household Survey Annex III. Observational Sheet Annex IV. Retail Shop Survey Annex V. Tourism Agency Survey Annex VI. Restaurant Survey Annex VII. Traditional Medicine Survey Annex VIII. Price Report Annex IX. Key Informant Interview Annex X. Management Authorities Questionnaire Annex XI. Enforcement Authorities Questionnaire Annex XII. Scientific Authorities & Academia Questionnaire Annex XII. NGOs and International Organizations Questionnaire

iv
Preface In the summer of 2005, a collection of 30
organizations and close to 50 people, led by the
Wildlife Conservation Society (WCS) and with
financial support from the Environment and
Natural Resource Division of the World Bank (WB),
undertook the largest and most comprehensive
wildlife trade survey ever conducted in Mongolia.
The impetus for the effort came from many fronts,
but all centered on the suspected increases in
hunting and trade as the probable cause for the
gradually more obvious decreases in wildlife
populations.
Covering every one of the country’s 21 Aimags 1
(provinces), researchers queried more than 4,000
individuals and completed another 1,100 market
surveys to gather data on a wide variety of wildlife
trade related practices and trends. At the same
time, the authors gathered hunting data from local
governments; traveled to China and Russia to see
firsthand what was happening at the border;
completed a gap analysis of Mongolia’s national and
international wildlife trade laws and obligations;
and conducted stakeholder meetings with lawyers,
judges, police, border control, rangers, biologist;
virtually anyone that could offer insight into what
was happening, and what needed to be done.
The results, detailed in the 100+ pages of Silent
Steppe: the Illegal Wildlife Trade Crisis in Mongolia,
documented in numbers, graphs, and images what
until then could only be guessed at and described
through anecdote. Mongolia’s wildlife – unprotected
sometimes by law, but certainly in practice – was
not only targeted by a large and growing number of
hunters and consumers across the country, but also
by industries and markets beyond its borders.
Species that had been traded in the past were of
course still being traded. But with little to no
control, trade was happening at volumes and for
purposes and markets never before seen. Marmots,
always a game meat staple, became the target of a
fur market in China. Instead of thousands, the
study concluded it was likely being traded in the
millions each year.2 Wolves, traditionally hunted for
many reasons (fur, meat, medicine, livestock
protection), had to contend with a new international
market with an appetite for traditional medicine
and trophies that few knew existed. Trading in a
limited number of species for decades, 3 Mongolia
1 Mongolia is divided into 21 Aimags with the capital city, Ulaanbaatar, governed as an independent provincial municipality.
2 Wingard, J and P. Zahler. (2006) Silent Steppe: The Illegal Wildlife Trade Crisis in Mongolia. Wildlife Conservation Society.
3 Mongolia officially traded seven wildlife species during the Soviet era, including marmot, red fox, corsac fox, wolf, wild boar,
had yet to come to terms with the fact that most if
not all of its wildlife was a commodity at home and
abroad.
The reasons for the surge in take and trade were
rooted in a seemingly disconnected event, the fall
of the Berlin Wall in 1989. With the end of a
political era came the collapse of an economic one,
the consequences of which fell especially hard on
countries like Mongolia whose economies were
entirely nested within the Soviet system. In the first
few years, Mongolia’s inflation rate stayed in the
triple digits, GDP lost as much as 30%,4 and every
sector of the economy suffered from shortages in
everything, including the basics of food and
clothing. As much as one-third of the country found
itself in extreme poverty, and 50% living on less
than two dollars per day.5 For a variety of reasons,
this transformational recession continued into the
early 2000s.6 A culture that had always relied on
wildlife for medicine, fur, and clothing, turning to
this traditional resource was as natural as it was
forced by unprecedented circumstance.
And for many, it was also hard to imagine that so
much harm could be done in so little time. In the
early 90’s, standing almost anywhere on the
steppes, a mostly untouched sea of grass so large
more than a few countries might fit within its
borders, was to witness wildlife spectacles few
places on earth could still boast. Marmots seemed
as common as grasshoppers; white-tailed gazelles
roamed the landscape a million strong; red deer
grazed in front of apartments a few blocks from
Ulaanbaatar’s city center; and the rivers, were a
fisherman’s dream. With an economy in collapse
and an open door to trade, this was a resource that
simply could not be ignored.
Against this backdrop, it was slowly but
increasingly clear that the political and economic
transition was having a direct and untenable impact
on Mongolia’s wildlife. What was known, however,
was still mostly anecdotal and certainly limited,
even if in many instances it came from professional
organizations actively involved in wildlife research
and conservation. The problem was the study of
wildlife trade per se was not a part of anyone’s
particular mandate, if it was being studied at all for
some species. The impetus and objective in 2005
was to break through this knowledge gap; to study
wildlife trade in a singular fashion, but also as
broadly as possible across species and regions,
Mongolian gazelle, and red squirrel. Wingard, J and P. Zahler. 2006. p. 17.
4 CIA World Factbook, Mongolia. January 12, 2017; see also Sindelar, Daisy. December 9, 2009. Mongolian Democracy: From Post-Soviet Success to Post-Transition Struggle. Radio Free Europe/Radio Liberty.
5 Sindelar (2009).
6 CIA World Factbook.

v
bringing as many organizations together as would
be needed to document what everyone collectively
suspected was happening. The result was the Silent
Steppe study published in the spring of 2006.
That the study has had a lasting impact is a little
surprising, but not entirely. It is not unusual for
studies of this kind to fade into a world of grey
literature known to a few, but generally leaving
little trace of their having been. For fortunate (and
unfortunate) reasons, this did not happen with the
first Silent Steppe report. Although reported on
ahead of publication by New York Times science
writer, John Wilford,7 causing more than the usual
amount of interest, its persistence is less a
testament to the study and international interest
than it is to the value Mongolians place on the
magnificent wildlife that inhabits its vast steppes,
deserts, and forests. The year Silent Steppe was
published, 2006, was still many years before
wildlife trade would be understood by the larger
international community as a growing crisis of
global proportions. Even now, the global IWT
conversation tends to focus on species that do not
occur in Mongolia (tigers, rhinos and elephants) and
on countries far removed from its ambit of trade.
Whatever efforts have happened to change the
course of wildlife trade in Mongolia since the first
Silent Steppe study owe their life force to
Mongolia’s citizenry and government.
As these efforts continue, and just over a decade
since the first Silent Steppe, it is hoped that this
new assay of statistics, policies, and practices will
again capture the story of wildlife trade; delivering
hard facts and figures to inform decisions about the
future of managing wildlife trade in Mongolia.
7 Wilford, N. 2005. In Mongolia, an Extinction Crisis Looms. The New York Times. Science Section. Available at http://www.nytimes.com/2005/12/06/science/in-mongolia-an-extinction-crisis-looms.html
vi
Foreword
Dr G. Nyamdavaa
Head of the Natural Resource and Environmental Administration
Ministry of Environment and Tourism
Government of Mongolia
Mongolia is a country that has undergone rapid
transformation during the preceding decades and
now sits within a dynamic global community. The
nature of today’s international marketplace means
that understanding Mongolia’s role in the
international community is more important than
ever, with foreign markets now intrinsically linked
to Mongolia’s domestic practices. This is most
certainly the case with the illegal wildlife trade in
Mongolia, one of the nation’s great challenges, and
an issue that can significantly impact a country’s
economic, environmental, national security and
social prosperity.
Mongolia is a nation with a proud environmental
protection heritage working to conserve diverse
iconic landscapes from vast grassland steppes to
the rolling dunes of the Great Gobi Desert. Many for
instance, wouldn’t know that Bogdkhan Uul, south
of Ulaanbaatar is the world’s oldest legally protected
nature reserve, having been established in 1778.
Today, however, the species that occupy these
landscapes, as with many of the world’s protected
areas, are becoming increasingly threatened by the
illegal wildlife trade. In Mongolia, this is of concern
for the variety of ecosystems that depend upon
these ecologically important species, and the
Mongolian people whose livelihoods have depended
upon them for generations.
Improving knowledge and our understanding of the
illegal wildlife trade is vital to combatting its
occurrence. In Mongolia, our understanding of the
illegal wildlife trade has improved dramatically, and
a concept that few would have imagined impacting
Mongolia’s species, is now a priority for many of
Mongolia’s institutions who work to halt its
occurrence. The Mongolian public too, are becoming
increasingly aware of the impacts that over-hunting
and illicit trade has on many of its iconic species
with many local communities dedicating to ensuring
the sustainable management of the surrounding
landscape that they live within. In today’s ever-
evolving international landscape, it is vital to
continue ever-improving our understanding so that
national and international organizations are capable
of rapidly adapting and targeting the key drivers of
illegal poaching, and the trade of illicit products.
The Government of Mongolia and the Ministry of
Environment and Tourism are striving to promote
Mongolia’s green and sustainable development,
ensuring the sustainable use of its natural resources
in the protection of its flora and fauna. The
Government of Mongolia has committed itself both
nationally and internationally to stopping the illegal
trade of wildlife. Domestically in Mongolia, progress
has been made to revise national legislation and
improve enforcement capacity to protect species
vulnerable to over-hunting and illegal hunting for
illicit trade. Likewise, in 2016 Mongolia joined global
leaders in Hanoi, Vietnam to confirm Mongolia’s
international commitment to eradicating the illegal
trade in wildlife. The Mongolian Government is set
to attend the 2018 London Conference on Illegal
Wildlife Trade, ensuring Mongolia’s long-term
international role to halting its occurrence.
In light of the progress that has been made, there is
still work to be done in eradicating the illegal trade
in wildlife Mongolia. As with all complicated, and
highly inter-connected activities, the international
community must work together to fight the
international drivers of this market, ensure
institutions are strong domestically to police and
stop its local occurrence, and raise awareness of the
impact of illicit trade to the public to support
grassroots conservation. In aiding these efforts the
continued acquisition of knowledge and
understanding of the current marketplace is critical
to ensure effective execution.
In a time when global, and Mongolia’s biodiversity is
facing immense pressure, the international
community must rally together, to conserve our
natural heritage, so that future generations will be
able to live alongside wildlife that our forward-
thinking Mongolian ancestors protected for modern
Mongolians to appreciate today.

vii
Foreword
Philip Malone
Ambassador to
Mongolia
The illegal wildlife trade is now recognised as one of
the world’s most pressing threats to global
biodiversity. On a vast scale, it also places human
livelihoods at risk and fuels global crime. Asia has
been at the centre of discussion around the illegal
wildlife trade and is key to tackling it.
Mongolia, with its breath-taking landscapes and
diverse fauna, is also at risk. Poaching is often
occurring at unsustainable levels, threatening the
long-term existence of many of Mongolia’s iconic
species. The livelihoods of those who still depend
on the land are also at stake. Correspondingly, the
Mongolian government and international
community have been working actively to disrupt
and stop this illegal trade to preserve Mongolia’s
natural heritage and the cultural identities of rural
communities.
The United Kingdom has been at the forefront of
funding and leading initiatives in these areas. The
Department for Environment, Food and Rural
Affairs (DEFRA), through the Illegal Wildlife Trade
Challenge Fund, has granted over £14 million in
funding to 47 projects globally including Mongolia.
The illegal wildlife trade is dynamic and complex.
Ensuring an accurate and robust understanding is
critical to combatting it effectively. In Mongolia, a
country of vast resource wealth and a rapidly
developing economy, a relevant and up-to-date
knowledge of the illegal wildlife trade is vital to
ensure Mongolia’s natural resources are managed
sustainably. The government of Mongolia has been
working collaboratively with international
governments and NGOs to stop poaching, not only
in Mongolia, but also internationally, by preventing
the illicit transit of wildlife products across its
borders. The Silent Steppe II Report represents a
fine example of this collaborative, concerted and
international effort, shedding light on Mongolia’s
place in the illegal wildlife trade and its role in
stopping it.
This report compiles the largest, most
comprehensive and the first longitudinal study of
the illegal wildlife trade in Mongolia. In the decade
since the first report on this since 2006, the illegal
wildlife trade has unquestionably evolved. The
compilation and analysis of comprehensive and
accurate data will provide the impetus and direction
required for forward-thinking leaders and decision-
makers to develop Mongolia’s capacity to combat
the illegal wildlife trade, ensuring the protection of
some of the world’s most iconic landscapes and
wildlife.
viii
Acronyms
ASEAN Association of Southeast Asian Nations
ASEANWEN ASEAN Wildlife Enforcement Network
CITES Convention on International Trade in Endangered Species of Wild Flora and Fauna
DEFRA Department for Environment, Food, and Rural Affairs
DFID Department for International Development
ESFL Endangered Species Foreign Trade Law; shorthand reference to the …
IRIM Independent Research Institute of Mongolia
IWT Illegal Wildlife Trade
IB-NAS Institute of Biology-National Academy of Sciences
MNET Mongolian Ministry of Nature, Environment and Tourism
MNT Mongolian Tögrög
SLAWEN Snow Leopard and Wildlife Enforcement Network
TCM Traditional Chinese Medicine8
TM Traditional Medicine
UB Ulaanbaatar
USD Dollars of the United States of America
WCS Wildlife Conservation Society
WWF World Wildlife Fund
WB World Bank
ZSL Zoological Society of London
8 Traditional medicine practices are sometimes generically referred to as Traditional Chinese Medicine or TCM, despite their not necessarily being associated with China. This report, however, uses this term only in reference to medicinal practices found in China and that were documented as playing a role in illicit wildlife trade in Mongolia. Traditional medicine uses for Mongolia’s wildlife are otherwise more properly referred to simply as traditional medicine or TM.

ix
Transcriptions This report uses a number of transcribed
Mongolian terms, many of which have two or
three alternative spellings in English. As with
every non-Latin script, there is a problem
rendering it into Roman alphabetical characters
that involves a choice between two methods:
transcription and transliteration. Transcription
is the conversion of the characters of one
language to the characters of another language
with the hope of approximating the
pronunciation of the target language. The goal is
help readers at least guess at how the word
might be pronounced. In transliteration, each
character of the source language is assigned to a
different unique character of the target language
and a literal inversion of the word is produced.
In 2012, the Mongolian government issued a
revised version of its official transliteration
standard for the Romanization of its alphabet.9
However, it has not been universally followed by
all those writing in English about Mongolian
affairs; hence, the multiple versions for
individual words. To some extent, there are
practical and understandable reasons for this.
One of them is pronunciation. Pure
transliteration standards, like the one adopted
by Mongolia, are not intended to consider
possible alterations to spelling to account for
pronunciation. While the standard is useful, even
necessary, its mechanical application can result
in spellings that confuse readers of English. For
example, the word “Бага” (the term for the
smallest administrative unit in Mongolia), should
be transliterated as ‘Baga.’ However, as the last
‘a’ is essentially silent when pronounced, it is
often transcribed into English simply as ‘Bag,’
and the versioning of words continues.
It is not the intent of this report to wade into the
world of linguistics, but a choice had to be made.
The text in general follows MNS 5217:2012, but
with a few minor alterations for pronunciation.
9 "Монгол кирил үсгийн латин хөрвүүлгийн шинэ стандарт батлагдлаа" [New latinization standard for Mongolian cyrillic script approved]. 18 February 2012 (in Mongolian). GoGo.mn. Retrieved 16 January February 2017.
x
Credits In 2015, ZSL was a recipient of the DEFRA IWT
Challenge Fund and tasked with implementing a
sequel to the first Silent Steppe report. This work
was managed by Gitanjali Bhattacharya, ZSL
Programme Manager for South and Central Asia and
Nathan Conaboy, ZSL Coordinator of the Mongolian
Programme. Legal Atlas, whose Legal Director was
the lead author on the original Silent Steppe, was
asked to reprise that nationwide survey. This new
study uses (and improves) the survey methods and
data collected in the first Silent Steppe study, and
further investigates the current trends in IWT in
Mongolia. In a major departure from the 2005 study,
the team included a locally-based, social survey
research partner, the Independent Research Institute
of Mongolia (IRIM), one of Mongolia’s leading
national organizations in the areas of research,
monitoring and evaluation, training, advocacy and
consulting.
The results of this collaborative effort can be found
in the following pages, including a comprehensive
review of Mongolia’s existing wildlife-related laws
and a list of recommendations for action. Before
thanking all of those involved in this report, we
would like to take the somewhat unusual step of
thanking someone instrumental in the direction and
sponsorship of the first effort – Tony Whitten, who
at the time was the person within the Natural
Resources Department of the World Bank
responsible for funding the first Silent Steppe
report. It is with tremendous sadness that we
learned of Tony’s passing earlier this year. This
work would indeed never have happened without
him. We are greatly indebted and can only hope that
study adds to his extraordinary legacy. We would
also like to thank Peter Zahler – then the Asia
Regional Director at WCS and now the Vice President
of Conservation Initiatives at the Woodland Park
Zoo in Seattle, Washington. Peter’s consummate
editing skills and knowledge of wildlife, Central
Asia, and Mongolia made the first report not only a
success, but a joy to work on.
From here, we thank the contributing authors on the
present report, Amanda Rude and Abigail Houle,
from the Legal Atlas team. They deserve special
mention for their extensive research and diligence in
gathering and analyzing information that was
sometimes challenging to obtain and not always
accessible in a language they are familiar with. If
this report has merit, it is in large part theirs. We
also thank the ZSL’s biologists, Nathan Conaboy and
Munkhjargal, without whom we would have been
lost in many of the particulars. The ZSL experts
provided invaluable support gathering and decoding
species information, and waded through
government documents (police records, custom
reports, hunting quotas) to help tell this story in
ways the surveys never could. We also owe a debt of
gratitude to many that contributed to the successful
completion of the market and household surveys. It
was an absolute pleasure to work dedicated,
knowledgeable and professional team at IRIM,
including Project Consultants, Bold Ts, and
Batsugar, as well as Survey Staff: Sukhbaatar O.,
Uchralt B., Bayarsaikhan J., Undrakh, Taivanjargal B.,
Purev-Ochir T., Erdenejargal, Tserenbayamba,
Chintushig, Tserendorj E., Sukhbaatar O.,
Erdenesaikhan L., Gerelchuluun, Baya Oyuntuya,
Sonormaa, Delgerjargal, Gerelbayar, Bat. Oyuntuya,
Monkhtuya, and Byambademberel.
As with the first Silent Steppe, we again thank all of
the respondents to the survey as well as those that
shared their time and expertise in separate
interviews to answer questions about the larger
context for wildlife trade in Mongolia. For the entire
study, we did our best to eliminate unnecessary
lines of inquiry that we learned from the first effort,
but it still took time and more importantly, a
willingness to contribute. It is this willingness that
makes it possible to understand practices and
trends that most often remain hidden as they are
scattered across the landscape, within communities,
offices, and ultimately the lives of individuals.

Executive
Summary
2
Introduction
Mongolia’s Wildlife Trade Crisis Continues Global estimates of illegal wildlife
trade (IWT) are anywhere between
USD $15 billion and USD $150
billion annually. Research from
around the world tells us that
IWT is 1) driven by rising prices
that grow as species become
scarcer, spurring even more
illegal trade; 2) controlled by
professional criminal networks;
3) facilitated by corruption; 4)
supported by advances in
logistics and communications;
and 5) fueled by armed groups
that use IWT as source of
financing.
In 2005, the first Silent Steppe
report told us that Mongolia had
a share in this crisis. Wildlife
trade was no longer just a part of
the cultural fabric; it was also big
business with annual trade for
some species counted in the tens
of thousands, even millions of
specimens. Estimated trade
values ran into the tens of
millions of dollars.
In 2016, the second Silent
Steppe report tells us that the
crisis continues. There may be
fewer people willing to openly
discuss their wildlife trade
activities, but the overall number
of people harvesting and trading
is similar. Total harvests are less
than they were in 2005, but this
may have more to do with
reduced wildlife populations than
anything else. Illegal trade,
however, continues; the species
most heavily targeted 10 years
ago are still the primary targets
today; and dispersed criminal
networks using a variety of illegal
methods and an ‘on-demand’
supply model are a major part of
Mongolia’s IWT problem.
Increased Enforcement Impacts Research Design Ten years earlier, the research
team was responding to a
situation that was still only
hinted at and that seemed
predominantly local, even a little
innocent. Enforcement was
present, but still minimal and
trade was highly visible. Talking
to hunters and traders, taking
pictures, and openly recording
observations were possible in
many instances without concern
for safety or the worry that
interviewees would deliberately
hide information.
In 2016, the research team
confirmed initial suspicions that
IWT was affecting domestic
markets as much as international
markets; that the intervening
years had seen increased
enforcement and awareness of
potential liability; and that
obtaining information was going
to be more difficult even at the
household level, let alone in the
markets and trade centers.
With all of these limitations, this
version of the Silent Steppe
report is still the first cross-
sectional study on wildlife trade
in Mongolia, and brings with it
the opportunity to develop a
unique historical perspective on
the many parts that constitute
wildlife trade in Mongolia’s post-
Soviet era.
Silent Steppe II Expands Scope This second Silent Steppe report
goes further than its predecessor
in understanding IWT in
Mongolia. It documents what has
happened in the intervening
years to species in trade, to the
laws designed to address the
problem, to the entities
responsible for their
implementation, and in the
courts handling wildlife trade
cases. Finally, it provides
recommendations to bring illicit
trade under control.
Multiple Innovations Improve Research The 2016 version incorporates
many innovations beginning with
a more holistic approach, going
beyond take and trade data, to
collect information on wildlife
trade logistics, economics, legal
frameworks and institutional
architecture.
The survey calendar was also
adjusted to match hunting
seasons and improve accuracy;
sample methods were refined
while still maintaining the same
size; and qualitative and
quantitative research instruments
were better tailored to target
audiences
Finally, the 2016 edition
benefited from a professional
field survey team and the use of
survey software for data
collection and processing.
Throughout the report, an
intentional effort has been made
to visualize information and
results to facilitate
comprehension.
Research Methods
Research Begins By Identifying Knowledge Gaps The overall research approach
was guided by 70 research
questions that targeted
knowledge gaps, embodied
research goals, and set the
foundation for the remaining
research effort. A total of 53
different sources of information
were then identified to provide
answers and data to the research
questions. The list included
3
public and private entities, as
well as academic institutions.
Research took the form of
interviews, data acquisition from
management and enforcement
entities, and online research into
related publications and IWT e-
commerce. In short, all major
wildlife stakeholders and sectors
in Mongolia were approached.
Specialized Research Team The 2016 research team was
smaller than the one used in
2005, with the same core team
conducting the entire survey
effort from design through data
collection and analysis. Along
with expertise in biology, team
members brought experience in
the areas of law and legal
development, economics,
international trade, business
promotion, research, survey
design and statistics, and data
visualization.
Three different entities were
involved including the Zoological
Society of London, Legal Atlas,
and Independent Research
Institute in Mongolia. The
Zoological Society of London,
acted as the lead organization,
while Legal Atlas performed as
the lead investigating and
analysis team and the
Independent research Institute of
Mongolia brought the field survey
capacity across the country.
Survey Periods A total of 14 months were
invested in the project to make
this report possible (March 2016
to April 2017). The first two
months were focused on
reviewing the baseline study to
distill strategic recommendations
for the 2016 editions and prepare
all research methods. The
household survey was conducted
between May and August 2016.
The market survey followed from
August to December 2016. In
parallel, in depth interviews with
stakeholders were conducted in
Ulaanbaatar during June and July.
The drafting of sections of the
report also began at this time,
with the support of desk
research. In the final stages, key
international and national
experts were invited to review
and comment on results, building
recommendations through a
participatory process.
Diversification of Research Instruments Key to Approach The diversification and tailoring
of survey instruments was a key
strategy, in particular given the
anticipated reluctance of hunters
to participate. The household
survey therefore included a
primary survey and an
observational sheet to
systematically document
anecdotal information. Market
survey used separate instruments
for each market segment,
including, a Retail Shop Survey,
Traditional Medicine Survey,
Tourism Agency Survey,
Restaurant Survey, and an
Observational Sheet, a Price
Report, and a Key Informant
Structured Interview Guide.
Finally, stakeholder’s opinions
were captured using seven
different semi-structured
Stakeholder Questionnaires.
Preserving and Amending 2005 Approach As Silent Steppe II is the first full
cross-sectional view of wildlife
trade in Mongolia since 2005, the
strategy from its conception was
to preserve as much as possible
of the original approach while
overcoming some of its
shortcomings. This report
replicated two important aspects
of the household sampling
design and data collection,
although some changes were
introduced in the 2016 iteration.
The sample size 4,070 was
maintained and the array of
techniques used to identify
households to be surveyed was
again a combination of strata,
linear intersects, and random
methods. The household survey
areas were set at 44, including 39
soums across the country and 5
districts in the capital.
For markets, 20 survey areas
were established taking into
account two relevant trade
criteria: 1) the location of border
crossing points with China and
Russia and 2) the location of
outdoor wildlife markets. After
selecting areas, estimations of
the population for each market
segment (i.e. tourism agencies,
restaurants, shops, etc.) were
conducted. Based on these
results, a target of 850
observations was established.
This represented 250 fewer
observations than obtained in
2005 (with 1,100 market
surveys), however the
segmentation of both the
population surveyed and the
refined research instruments
compensated for the fewer
number of observations,
providing a larger set of valid
data to analyze.
Data Collection Data collection was conducted in
three different sprints. In the
first, a single international
wildlife trade expert conducted
27 in depth interviews with
stakeholders from May to June
2016. In a second sprint
(concurrent with first), a total of
25 trained surveyors completed
4,070 household surveys and 46
observational sheets over a
period of 29 days. The final
sprint took place in the fall,
during which time a team of 9
surveyors implemented all
surveys targeting each market
segment. In total, 5,013
observations were captured

4
through the three research
sprints, with an estimated
investment in data collection
time of 1,564 hours.
The process for assuring data
quality was dramatically
improved through the use of a
dedicated quality assurance team
and basic information
technologies (e.g., the use of
survey software and mobile
devices; closed menu choices and
pre-defined question flows in the
questionnaires; automatic
recording of interviews; and geo-
location of surveys). The
combination of tools provided a
strong foundation for tracking all
data and reducing the possibility
of mistakes and fake
respondents. As a result, few
instruments (less than 10
instruments or 0.2% of the total)
from the entire sample were
invalidated.
The Bigger Picture
International Trade is the Primary Driver in Mongolia’s IWT Mongolia does not generate all of
the demand for its own wildlife;
nor is it a major destination for
wildlife products from other
countries. It is, however, a part of
global and regional trade flows
that to some extent explain
Mongolia’s role in, and
vulnerability to largely hidden
wildlife trade markets. In brief,
sandwiched between two major
economies (Russia and China)
and far from any ports, Mongolia
finds its foreign trade dominated
by these two neighbors, their
markets, and political interests.
The increase in wealth and
incomes of the middle class in
Mongolia’s southern neighbor,
China, have created a seemingly
inexhaustible demand for wildlife
products pushing illegal
trafficking to new levels. The
most common species found in
IWT include wolves, bear
(gallbladders and bile), red deer
(blood antlers), and musk deer
(glands). In addition to these, furs
from polecats, marmot, and other
Mongolian species are sold to
China to supply the apparel
industry.
With Russia, the story has almost
completely changed compared to
former times. In the Soviet era,
Mongolia was predominantly an
exporter of wildlife to Russia,
albeit in a more controlled
manner than is now happening
with China. Today, Mongolia is
principally an importer from
Russia. Although exports of
animals from Mongolia have
remained almost the same,
imports from Russia have risen
dramatically, going from less
than USD 0.5 million 1996 to
almost USD 9 million in 2015.
Official exports of fur from
Mongolia have dropped to just 5%
of their 1996 trade values, while
imports from Russia increased
30-fold over the same period.
Mongolia is a Transit Country One unresolved question from
the 2005 Silent Steppe report was
whether Mongolia was also a
transit country for illegally
traded wildlife. This survey
found that Mongolia’s status as a
transit country is beginning to
emerge and it is now a clearly
documented part of its wildlife
trade problem. Mongolia may not
be a major transit route at this
point, but it does have
transportation infrastructure (in
particular, the direct railroad and
highway that runs north-south
through Mongolia from Russia)
already known as a route for
other forms of illicit trafficking
including drugs and people. The
survey was able to document
some cases of wildlife specimens
harvested in third countries, such
as lion, Dalmatian pelican, and
saiga being transported through
Mongolia to China. Until its most
recent amendment in September
2016, the Criminal Code did not
criminalize illegal trade or
possession of wildlife species not
sourced in Mongolia. The ‘gap’
created by this loophole resulted
in ‘transit’ cases not being
properly documented or
prosecuted, and even dropped by
the courts for lack of jurisdiction,
a situation that has been now
corrected.
CITES Trade Is Indicator of a Larger Problem While CITES trade volumes for
some species and regions are in
the order of thousands and
millions, trade in Mongolian
species are in the order of
dozens or, in limited cases,
hundreds (e.g., wolves) or
thousands (e.g., falcons). The low
volumes, however, should not be
mistaken for low value either in
economic, or more importantly,
in ecological terms. The species
that occur in Mongolia inhabit an
arid landscape where the ones
that thrive in large numbers tend
to be insects and rodents. As a
result, hunting and trade quotas
in Mongolia generally need to be
small to ensure the continued
survival of the species.
On average, the official numbers
for aggregated CITES exports of
wildlife come very close to, if not
exceed, the total that Mongolia’s
wildlife managers believe are
necessary. In all cases, illicit
trade volumes are surpassing
these limits by orders of
magnitude. Just a few cases and
enforcement records are enough
to demonstrate that illicit exports
are substantially higher than the
licit trade represented by the
official numbers (in some
instances many times more).
Wolf trade illustrates this well.
According to records provided by

5
the Customs Agency, wolves have
been one of the top species
seized in illegal trade at the
border for several years. In 2009,
permitted wolf exports were 56
including all trade terms (17
skins, 15 trophies, 2 live, 20
specimen and 2 skulls). That
same year, however, wolf
seizures reported by Customs
were six times that amount, at
312 frozen wolf carcasses.
Seizures represent an unknown,
but likely small percentage of
actual illicit trade.
CITES Trade Indicates Mongolia Is Also a Consumer Country Mongolia is steadily becoming a
consumer country of foreign
wildlife. In the first ten years
after joining CITES (1996), import
permits were barely significant.
Since 2006, however, numbers
have steadily risen and are now
three times their former
numbers. Accompanying the
increases in demand for foreign
wildlife is a concomitant increase
in the number of source
countries, going from 24 to 43 in
the last decade. Among the top
trade partners are United States,
Colombia, Thailand, India, China,
and Vietnam.
CITES import records also
indicate that live specimen trade
is the single most important
category for Mongolia. In the
past, this trade was almost
entirely cacti. From 2006 to 2015,
trade in live specimens more
than doubles, but switches
almost entirely to live sturgeon.
The relatively early maturity of
Siberian sturgeon and its
freshwater lifecycle, make it the
most common species found in
aquaculture. Rumored, but not
confirmed in this survey, is an
effort to establish a fish farm for
sturgeon in Mongolia.
Saker Falcon, Wolf, and Argali Top CITES Trade Species Exports, however, are still strong
and play a role for several critical
species. Among the top three
exported species are wolves,
Saker falcons, and argali.
Over the years, gray wolf permits
have represented approximately
one third of the total CITES
export permits making it the top
export species based solely on
permit totals (291 permits for a
total of 2,700 wolves and wolf
parts).
Falcons, however, are traded in
far greater numbers. Used in
falconry, eight species are
exported by Mongolia under
CITES. Of these eight, by far the
most common is the Saker falcon
with 24,748 specimens exported
from 1996-2015, constituting
97% of all CITES specimens
exported by Mongolia.
Argali is also among the top
three, with almost all exports
associated with trophy hunting.
Similar to gray wolf exports,
argali permits comprise roughly
one third of total trade (263 from
1996-2015) in most years,
making it the second most
frequently exported species
based on permit totals. The total
number of animals traded is also
similar to gray wolf numbers,
with records documenting 1,322
trophies and another roughly
thousand specimens traded for a
total of 2,369.
Increased International Trade Challenges Mongolia’s Efforts to Control IWT Increases in international trade
bring easier or more fluid
avenues for both legal and illegal
trade. With millions of shipments
going through ports around the
world every day, less and less is
being inspected. This happens in
all ports as they become busier
and is already occurring in the
ports of Mongolia.
Increases in the country’s foreign
trade has been substantial over
the last two decades, going from
USD 0.75 Billion in 1996 to USD 8
Billion in 2015. Dominated by
exports of raw minerals and
imports of industrial products,
this trade has a direct footprint
in the number and frequency of
freights crossing Mongolia’s
borders every day. On the
southern border with China,
empty 100-200 ton trucks enter
the country heading toward
mining operations and cross back
fully loaded, in many cases with
sealed containers – seals placed
on-site by mining operation
inspectors without the
opportunity for custom officers
to conduct proper inspections. It
is precisely in this type of vehicle,
carrying coal and minerals that
several customs inspections have
uncovered hidden wildlife
specimens as traders attempt to
illegally cross the border.
Increased trade and shipping are
straining already understaffed
and underfunded customhouses
and border offices. In particular,
adequate imaging equipment to
conduct routine inspections of
these heavy vehicles is not in
place.
Adding to this, the relaxation on
inspections and cargo scans in
free trade zones, in an effort
speed up trade, simplify
trafficking. After approving Free
Trade Zone legislation in 2002,
Mongolia signed an agreement
with China in 2015 that led to
breaking ground of the first FTZ,
next to the Zamiin-Uud border
point, the number one customs
area by volume for Mongolia and
one where wildlife traders are
known to be located. Although
completion is not expected until
2018, there are concerns about
its future impact in wildlife trade.

6
Border Security Concerns Overlap with IWT Mongolia’s international border
with Russia and China is 8,252
km long and has long been a
security concern. Testifying to
this, Mongolia is one of the few
countries in world that has
almost entirely enclosed its
borders in fencing. In addition, at
least one source claims that
between 300-350 border patrol
units operate at all times.
Despite the fencing and border
staffing, it is still true that
Mongolia’s borders are
exceptionally open and difficult
to control. Except for its far
western border, defined by the
Altai Mountains, there are few
natural features that significantly
impede crossing at any point. Its
entire southern border with
China is either grassland or
desert, and with much of its
northeastern border with Russia
also grassland, much of it can be
usually traversed by jeep. With
these long, mostly deserted
borders to both the north and the
south, traffickers are not
restricted in their movements
and, once they have navigated
fencing, they can move
contraband with relative ease and
little risk of detection, an
inevitable result of a vast
landscape that is difficult to
monitor.
Patrolling Vast Spaces is a Major Challenge In Mongolia, park rangers are
responsible for controlling
265,000 km2 – or roughly 17% - of
the country’s territory. Divided
into 75 different individual
protected areas, these spaces are
also located in some of the
remotest regions, covering largely
uninhabited mountains and
deserts. Added to this is the need
to monitor increasing activities
along the country’s 10,409 km of
major rivers and 13,418 km2 of
lakes, as pressure on aquatic
resources has risen sharply in
recent years. In sum, few places
on earth have so much territory
to cover with as few people and
resources as does Mongolia.
Iconic national parks such as
Toson Huslai or Khuvsgul have
just 6 and 15 rangers in service,
with each person responsible for
an average of 783 km2 and 559
km2. At the perspective of the
aimag level, it is even more
difficult. In Selenge aimag, 28
rangers are expected to cover its
41,000 Km2, while in Bayan-Olgii,
30 rangers have responsibility for
45,700 km2. The average for
these two comes to a surveillance
requirement of around 1,500 Km2
per ranger; clearly insufficient
staffing levels and a daunting
task by any definition.
Reports from enforcement
personnel at literally all levels
concerning insufficient resources
(rangers, inspectors, customs
officials, and police) are
ubiquitous. With limited
resources, salaries are
unfortunately low and basic
equipment (uniforms and
binoculars) in some cases is old
or unusable.
The Threat of Violence Impedes Efforts by Rangers Rangers are not only challenged
by the size of the areas they must
patrol, but by the threat of
violence. In many countries
around the world, rangers often
find themselves on the frontlines
in the battle against poachers. It
is estimated that around 10,000
rangers worldwide have been
murdered while on duty in the
last ten years, 80% by poachers
and militia groups.
Violence, however, is not a
common threat to rangers in
Mongolia compared to other
countries. No stories of violence
were collected during the survey.
Instead, there were many stories
of encounters between armed
groups of illegal hunters and
rangers where conflict was
avoided by both sides. If it was
not the poachers escaping using
modern vehicles, then it was the
rangers that were inevitably
forced to retreat for their own
safety.
Organized Crime a Significant Factor in Mongolia’s IWT Highly lucrative and illegal
businesses are necessary for
international organized crime
networks to exist and flourish.
These networks typically involve
a relatively high number of
people, operate with
sophisticated equipment, invest
in expensive logistics and self-
protection structures, and
frequently use military
equipment. They also require
complex international monetary
transactions to pay regular bribes
and secure their supply chains. It
does not matter whether the
products are drugs, wildlife,
counterfeit products, people, or
other.
Organized crime targeting
Mongolia’s wildlife centers
around a few highly profitable
endangered species (e.g., red
deer, musk, bear, saiga and wolf),
but also a few fur bearing species
used in the apparel industry (e.g.,
marmot, corsac fox, and red fox)
where the profit is in the volume.
Methods include on-demand
hunting requests to local
poachers, the use of specially
equipped, fast vehicles, and an
array of illegal hunting methods
including night lighting,
automatic weapons, intentional
vehicle-wildlife collisions, and car
chasing. Drones have also been
identified by the police as being
used by criminal organizations
to geo-locate wildlife.
Enforcement officials talked
about 12 different criminal
networks being the object of
7
undercover investigations during
recent years in Mongolia, with an
estimated value of their illegal
wildlife operations of 15 million
USD.
Tackling the Network and not the Individuals Wildlife crimes are effectively
smuggling schemes, sharing the
same logistics and financial
methods used by traffickers of
weapons, drugs, people, and
diamonds. Wildlife investigators
in some jurisdictions use
techniques similar to those used
in narcotics enforcement, in
particular, controlled deliveries
of contraband, followed by
anticipatory warrants. These
techniques are used when
authorities detect freight with
illicit products and allow, under
strict surveillance, the delivery of
the freight to its final destination.
This allows them to identify a
larger portion of the network
beyond the seller or the
transporter.
Testifying to the need for such
techniques in Mongolia (explicitly
part of the investigative powers
of Mongolia’s Customs
Authority), this survey revealed
stories of Mongolian women
living in poverty being used to
cross the border with small
amounts of illegal wildlife hidden
in candy and biscuit wrappers
and personal bags. In these cases,
the target of enforcement actions
focused on the women (known as
‘mules’ in the world of
smuggling) and never reached
those that manage the illicit
network.
Institutional Landscape
Mongolia Rebuilding Capacity to Fight IWT Over the past several years,
management and enforcement
agencies in Mongolia have been
the recipients of a steady, if not
yet complete, effort to rebuild.
Some notable efforts in the last
10-15 years have been the
reorganization among existing
inspection and enforcement
agencies on environmental
crimes, including illicit wildlife
trade. Up to 15 different
governmental units across the
legislative, executive and
judiciary branches are today
involved in setting, implementing
and enforcing wildlife legislation.
Many Bodies ‘Manage’ Mongolia’s IWT, But Capacity is Still Lacking The Parliament
Standing Committee has been
instrumental in the drafting of
three new wildlife related laws,
including a revised Criminal
Code, a new Law on
Infringements, and a revised a
revised Law on Fauna. The
Committee should also be
credited for the specific wildlife
provisions included in other
fundamental laws enhancing
wildlife management, such as the
Tax Law (2008), Medicines &
Medical Devices Law (2010),
Criminal Procedure Code (2015).
The Office of the President also
bears mentioning in the context
of illegal wildlife trade as
Presidential decrees have been
issued in the past to impose
hunting bans for wolves and
marmots. The use of a
Presidential Decree has particular
importance, if for no other
reason than the level of the
issuing office. Its value in
combatting illicit trade may be
therefore in its ability to raise
awareness more than anything
else.
Within the Ministry of
Environment, the Department of
Natural Resource Management
is Mongolia’s primary body
responsible for developing the
implementing regulations for
wildlife, as well as directing the
on-the-ground management of
wildlife, including the principal
responsibility for most of the
country’s protected areas,
hunting and fishing regimes,
legal trade in CITES species, and
combatting illegal wildlife trade.
In this last responsibility, it must
be noted that the Ministry is
purely an administrative body,
and not an implementation or
enforcement authority. The
Department itself does not in fact
have field operations. On-the-
ground management is lead by
other bodies. Key activities of the
Department are the review of the
lists of species protection status
(today including 31 Very Rare
species and 76 Rare), the
calculation of the Ecological
Value of species, used to
determine the restoration values
of illegal take, and the setting of
annual hunting quotas.
The Director of this department
is also the CITES Management
Authority. Understaffed and
underfunded, its role has been
limited and their reporting on
CITES obligations as well as the
general ability to leverage all
legal and technical opportunities
the convention offers could be
improved.
The CITES Scientific Authority
similarly could improve the
fulfillment of its role in making
non-detriment findings (NDFs).
Mongolia has no standard NDF
procedures and has not
published in recent years any of
the evidence accepted by CITES
as the basis for NDFs, such as
studies on species distribution,

8
population status, population
trends, or threats.
Local governments at the Aimag
and Soum level are also principal
actors in Mongolia’s efforts to
manage hunting and fishing
resources within their territory.
The legal mandate of local
government officials in aimags
and soums includes close
coordination with the Ministry of
Environment on issues such as
population surveys wildlife
conservation, public awareness
campaigns, as well as the general
implementation of the Law on
Fauna (e.g., quotas, and bans). A
total of 69 hunting regions have
been established and all have
hunting management at the local
level. Within these, soums have
the ultimate authority to issue
hunting permits pursuant for the
approved quota for their region.
Since 2012, funds from hunting
permits and trophy hunting no
longer go to state budget
controlled by the Ministry of
Finance, but to the soum
governor’s budget. This incentive
is seen as a positive development
for combatting illicit wildlife
trade as local governments in
theory now have a vested interest
in maintaining the resource.
IWT Enforcement Bodies Need More Support Similar to wildlife management,
enforcement is also a shared
responsibility, involving eight
different government agencies
that overlap in their powers and
authority to detect and suspend;
to search and seize; and to
investigate and enforce.
The General Agency for
Specialized Inspection (GASI)
concentrates all governmental
inspection powers. It has two
units relevant to the management
of the wildlife trade: the
Environmental Control Office,
with close to 700 inspectors and
rangers in the field monitoring
hunting and other environmental
permits, and the Customs
Inspection Office, inspecting
CITES permits (and others) at
border crossing points.
Formally part of the Ministry of
Justice, the Police are the prime
investigative and enforcement
authority for all crimes in
Mongolia, including illegal
hunting and illegal wildlife trade.
In 2010, the Police established an
Eco-Crimes Division, a positive
new development for Mongolia’s
fight against the illegal trade in
wildlife since the first Silent
Steppe report. The Eco-Crimes
Division is specifically tasked
with environmental crimes,
offering the opportunity to
accumulate the expertise and
practices necessary to fight
specialized crimes. Although the
Division’s attention is presently
concentrated mostly on mining
cases, 15% of their caseload
involves illegal wildlife take and
trade incidents.
Staffing and resources of the
division have shown a downward
trend in the years since it was
formed. Initially staffed with 30
officials when created in 2010,
this has dropped to just 12
officials in 2016, a level of
manpower insufficient to cover
all of the Eco-Crimes cases they
currently receive, much less the
wildlife cases. In the last three
years, the Police investigated 168
criminal cases of illegal hunting,
sending to court 112 (67%) of
these and confiscating more than
8,000 wildlife specimens.
Tips about illegal hunting are
sometimes received from citizens
because the law includes a
reward of 15% for informers.
While the system has certainly
experienced some success, there
remain concerns about its
application with respect to
protecting the identity of
informants and ensuring that
they receive rewards as intended.
Key informants relate that this is
having a potentially negative
impact on the number of people
willing to report wildlife crimes.
Another development has been
the creation of mobile anti-
poaching units (MAPUs), which
currently operate in the West,
East, and Center of the country.
MAPUs are joint units involving
customs, GISA, police, and
rangers that collaborate on IWT.
MAPUs are intended to address
an important gap in fighting
wildlife crime: the lack of regular
and immediate information
exchange between enforcement
agencies. As a practical matter, it
also removes the disruption in
enforcement activities caused
when soum and protected area
rangers operate alone. Although
MAPUs have seen some success,
the lack of direct integration in
routine government activities
raises concerns for its continued
operations.
International wildlife trade
enforcement begins at the border
where customs officials conduct
inspections on permits, other
paperwork such transport bills,
or vehicles certifications, and
products to determine the
legality of trade. For that reason,
customs are set to play a very
prominent role in CITES
enforcement worldwide.
Mongolia Custom General
Administration is today part of
the larger Customs and Tax
Authority (CTA), overseeing at
the same time the Mongolia Tax
Administration. This explains
why enforcement of import and
export duties is a priority
concern. In 2011, Mongolia
Customs collected over MNT 3
trillion (USD 1.3 billion) in
customs duties; accounting for
40% of all state revenue and 6%
of the GDP. Exports of minerals
and imports of oil, vehicles and
construction and mining
equipment are the primary
sources of customs revenue and
consequently attract most of the
attention. As much as 90% of the
export and import commodities
cross through Altanbulag
(Selenge), Sukhbaatar, and

9
Zamiin-Uud ports, and most of
the Customs operational
resources are dedicated to these
same ports.
Customs reports only three
criminal cases of wildlife
smuggling detected nationwide in
2014; six in 2015; and seven in
the first five months of 2016. All
cases, except one, are related to
trade with China, a border that
officers confirm concentrates
more than 90% of border
problems. The species and
products trafficked are
consistent with the Eco-Crimes
Division reports and include
Mongolian gazelle (horns), gray
wolf (whole carcasses and skins),
marmot (skins), bear (paws; fresh
and dried bile), red deer (blood
antlers, genitals and female tails),
Dalmatian pelican (beaks), Corsac
and Red fox (skins).
Customs manages also a
Detector Dog Unit that reported
310 cases of attempted illegal
wildlife trade in the last three
years alone (80% of which were
illegal skins). This number is
almost twenty times larger than
the criminal cases investigated
for the same period, but includes
both criminal and administrative
cases. The data provided does
not indicate how many cases
were handled as administrative
infractions and therefore not
reported to the Police for
investigation.
In 2000, after a long period of
reorganization of the intelligence
apparatus during the post-Soviet
era, Mongolia established a
modern General Intelligence
Agency (GIA) to support the
enforcement of more than 25
different types of laws and
regulations related to national
security and crime, including
wildlife crime. GIA is therefore
another key enforcement body
relevant to illicit international
wildlife trade. GIA agents gather
intelligence on money laundering
operations, human trafficking,
firearms trafficking, corruption,
and smuggling through
Mongolia’s borders
The General Authority for
Border Protection (GABP) holds
the mandate to enforce the law
within a 15 km wide buffer zone
that stretches the entire 8,252
km perimeter of the country,
defining an area of 123,780 km2.
Its primary mission is to prevent
the entry of terrorists and
terrorist weapons into the
country, the deterrence of illegal
immigrants and the prohibition
of trafficking of illegal
substances across the nation’s
borders. According to GABP, 3
million persons and 1.5 million
vehicles cross Mongolia’s borders
on an annual basis.
Corruption Plagues Efforts to Combat IWT Both management and
enforcement are impacted by
corruption in Mongolia. With a
score of 36 and ranking 103 out
of 180 on Transparency
International’s 2017 Corruption
Index, Mongolia is firmly within
the lower ranked countries along
with its neighbors China (41) and
Russia (29). This ranking has not
changed significantly in the past
5 years, suggesting that anti-
corruption efforts will require a
long-term effort.
A survey in Mongolia
independent from this Silent
Steppe report put some numbers
behind this finding that 31% of
businesses expect to give gifts to
officials to ‘get things done’; 10%
of trading companies encounter
corruption in the course of their
work; 7% percent of the
individuals surveyed paid a bribe
in the three months prior to the
survey; and Mongolian citizens
generally perceive customs
officials to be corrupt.
The Silent Steppe survey
collected many personal
testimonies of collusion, bribes,
and embezzlement connected
illicit wildlife trade. Among the
unverified practices described by
interviewees are smugglers
colluding with customs officials
to avoid being examined at the
border, environmental inspectors
imposing fines without
documentation and not reporting
the money collected, government
officials issuing hunting permits
to friends and family in exchange
for the meat obtained, and
bribing ranger to ‘look the other
way’.
On a positive note, the legal
environment surrounding
corruption is improving and
some high-level corruption
cases have been uncovered.
Mongolia is not a party to the
OECD Convention on Combating
Bribery, but it has ratified the
United Nations Convention
against Corruption. It also
addresses corruption in two
national laws; the Criminal Code
(2016) and the Anti-Corruption
Law (2006). The Criminal Code of
Mongolia forbids the abuse of
functions, money laundering and
active and passive bribes of
officials and providers.
Punishment includes
imprisonment for up to ten years
as well as fines. The Anti-
Corruption Law establishes the
Independent Agency Against
Corruption (IAAC) as the
principal agency responsible for
investigating corruption cases.
The IAAC has the power to
monitor for corruption and
conduct investigations, including
customs, border officials, and
rangers.
IWT Legal Framework
Multi-Faceted Approach to Combatting IWT Supporting the institutional
improvements of the last decade
have been several legal
10
developments significantly
enhancing the normative
framework to manage wildlife
and fight illegality. In addition to
the creation of a new CITES
implementation law in 2002 and
revisions to the Law on Fauna in
2012, there have been new legal
developments in a new Law on
Infringements in 2015 and the
Criminal Code in 2016. Not
including the multiple hunting
restrictions and bans issued over
the years, the current framework
of laws that apply to wildlife
trade includes 20 major laws and
regulations, as well as
periodically issued hunting bans
and quotas.
Concerning the management of
wildlife take, Mongolia has two
resource-related laws of
particular importance; the Law on
Special Protected Areas; and the
Law on Fauna. The Law on Fauna
acts as a core legal instrument in
the framework, and the umbrella
for many others that define, inter
alia, the status of species,
hunting quotas and bans,
finances, and permitting
processes. The Law on Special
Protected Areas is a place-based
approach that prohibits hunting
and fishing in certain zones.
For the management of wildlife
trade, another five laws are
considered relevant. Belonging to
this group are three laws
regulating domestic trade
including the Advertisement Law,
the Medicine and Medical Devices
Law, and the Tax Law. Another
two laws regulate international
trade, including the Customs
Tariffs and Tax Law and the Law
on Foreign Trade of Endangered
Species, implementing Mongolia’s
CITES trade obligations.
The framework is completed with
another five laws relevant to
wildlife crime: the Criminal Code,
the Criminal Procedure Code, the
new Law on Infringements, and
two additional laws that may be
useful, but which have no
express relation to the wildlife
crime; the Anti-Corruption and
the Anti-Money Laundering Law.
Neither of these specifically
mention wildlife or wildlife trade
in any article. Instead, they focus
on the specific money laundering
or corrupt act. In this sense, they
take an ‘all crimes’ approach and
could be used regardless of the
underlying or related crime. As
attested to by key informants,
wildlife trade is an element of
both money laundering and
corruption in Mongolia.
Major Improvements in Penalties and Criminal Sanctions
Among the more important legal
developments is the creation of a
new Law on Infringements in
2015, replacing the 1992 Law on
Administrative Penalties. This law
is intended to consolidate all
administrative fines that in the
past were found in up to 220
separate pieces of legislation. It
includes one dedicated chapter
covering violations of
environmental law with
subsections on violations of the
Laws on Fauna, Special Protected
Areas, and International Trade in
Endangered Species. Other
chapters cover IWT-related
legislation also identified in this
framework including Laws on
Customs, Advertising, Anti-
Corruption, and Anti-Money
Laundering. With this
crosscutting change, Mongolia
has not only improved the
consistency and transparency of
its administrative penalty
system, but also simultaneously
increased the coverage and
applicable fines across the
wildlife trade value chain.
The next most important
development is the substantial
revision of the format and
content of the Criminal Code.
Whereas in the past, effectively
only two articles were used in
connection with wildlife crime
with questionable coverage, the
current version explicitly
addresses wildlife trade in a
comprehensive fashion similar to
the Law on Infringements,
increasing the level of fines and
prison sentences, as well as
establishing explicit liability for
legal entities. Neither of these
laws was in effect for the period
of the survey and therefore much
remains to be seen, but the
improvements in the letter of the
law are clear.
Between the Criminal Code and
the Law on Infringements, this
gap analysis identified 77
separate types of acts (e.g., illicit
sale, purchase, storage, etc.)
considered wildlife offenses. Each
act that could be independently
prosecuted was identified and
then organized according to the
major areas they covered. Most of
the offenses are related to illegal
harvest (27 offenses) and to
illegal trade (26). The remaining
offenses are connected to
firearms (15) organized crime (6)
and other miscellaneous issues
(3). Combined, they cover a much
greater range of the value chain
associated with wildlife trade
than the previous laws, including
penalties for the illegal sale,
purchase, preparation, use,
collection, transportation,
storage, import, and export.
Associated penalties include
compensation for damage caused
based on the ecological value of
the species, a differentiated fine
scheme for individuals, for legal
entities, community service, and
detention and imprisonment
time.
Fines range from USD 4,700-
23,500 for Rare species and USD
8,700-34,700 for Very Rare
species. Even at the lower end,
fines are greater than the known
market value of any of Mongolia’s
Very Rare or Rare listed species,
effectively denying traders the
benefit of the illegal activity.
Prison sentences range from 1-5
years for Rare species, and 2-8
years for Very Rare species

11
criminal
penalty system for take and
trade in listed species as a
Gap Analysis Indicates Areas for Continuing Reform Despite a number of
improvements, the gap analysis
points to a few areas for future
legal reforms.
The Criminal Code, for example,
touches on almost the entire
trade chain, but leaves a few
critical gaps.
There is, for example no longer
an explicit mention of organized
crime in relation to illicit
wildlife trade. Instead, the law
creates a generic category that
imposes increased prison
sentences (5-12 years) for
smuggling of ‘prohibited or
restricted goods’ as part of an
organized crime group. No other
illegal wildlife trade act
connected to organized crime is
covered. Given the frequent
disclosure of ‘on demand’
hunting networks, this is a
significant gap.
Similarly, there is no longer any
liability for legal entities in
relation to illicit wildlife trade.
Like organized crime, liability for
legal entities is a key concern,
particularly in light of the
reported synergies between
trading companies and wildlife
trade. The updated version of the
Criminal Code, initially passed in
2015, held legal entities
criminally liable for trade in Rare
and Very Rare species. In 2017,
however, this provision was
deleted from the law.
The list of prohibited acts
applicable to game animals does
not cover the entire trade chain.
It identifies only their illegal:
sale,
purchase, and
use.
Missing from the list of trade
chain offenses are-
preparation,
collection,
possession,
transportation, and
storage.
The wording of the law also
makes it unclear whether export
is included and to which species
the penalties for smuggling
might apply. Instead of expressly
penalizing the export of any
species without the appropriate
permit, the Law on Infringements
penalizes the smuggling of
‘prohibited’ or ‘restricted’ goods.
Pursuant to the Law on Customs,
Tariffs and Taxes, wildlife
constitute ‘goods’ and require
permits issued by the Ministry of
Environment. It is not clear from
these texts whether the Ministry
of Environment actually requires
or issues export licenses for all
wildlife.
For Very Rare and Rare species,
there are no criminal penalties
associated with illegal
possession, medicinal trade, or
the domestication of wildlife.
Related to this transportation,
storage, and processing are
criminalized, but not otherwise
regulated. In other words, what
might constitute legal forms for
these has no foundation. With no
definition of legality, there can be
no finding of ‘illegality.’
The Law on Infringements does
not specifically refer to the
violation of hunting bans.
Instead, it applies fines for
hunting at ‘other prohibited
times.’ The assumption is that
this applies to bans, as they are
generally time limited, but there
is no explicit reference.
For quotas, the only mention is
the violation of hunting and
trapping limits as established in
a contract. The law does not
apply a penalty for limits not
associated with contracts and
there is no mention of violations
with respect to fishing.
Prosecuting Illegal Wildlife Trade
IWT is a Minor Part of the Prosecutors Office
The Prosecutors Office of
Mongolia is the independent
authority within the judiciary
tasked with this end of the
enforcement process. With
around 700 prosecutors covering
39 jurisdictions, the Prosecutors
Office has been handling close to
20,000 cases a year for the past
decade. Less than 1% of those
cases are crimes against the
environment and an even smaller
proportion of them, specific
wildlife cases. It is reasonable to
assume that a similarly small
proportion of resources (in terms
of staff and hours assigned,
dedicated investigative budget,
specialized training, etc.) is being
dedicated to their prosecution.
Problems Begin with Divisions Between Inspections and Investigations
Wildlife criminal cases begin in
the field with the involvement of
enforcement personnel.
Commonly this involves an
inspection or stop by rangers,
customs officials, or border
patrol agents. Those incidents
suspected of constituting a
wildlife crime are referred to the
Eco-Crimes Police. The police
then initiate an investigation of
the incident and collect evidence
according to established criminal
procedures. If evidence is
considered sufficient, the police

12
then make an inquiry to the
Prosecutors Office, which can
request further investigations
and finally determine if the case
has adequate grounds to be
brought to trial. At this point,
prosecutors represent the state
and present the case at trail in
one of the ordinary courts, which
act as the courts of first instance
for wildlife related criminal
cases. Prosecution is thus a
multi-stepped process
involving several entities before
a court is in a position to issue a
sentence for a wildlife crime.
Prosecutors decide whether to
prosecute or drop the case based
on the quality of the evidence
that other agencies have put in
their hands. This passing of the
inspection, investigation, and
prosecuting authority from one
agency places a premium on the
quality of each stage of the
enforcement process.
This in turn has direct
implications for the successful
use of criminal laws both to
penalize wildlife crime and
impose sentences capable of
deterring future crimes. Those
first on the scene of a suspected
crime are in the best position to
protect and document the scene;
to preserve physical evidence, as
well as collect and submit
evidence for scientific
examination.
Lack of Evidentiary Protocols Jeopardizes IWT Cases
Physical evidence of a crime is a
vital part of a criminal case.
Illegal wildlife take and trade
cases require presenting tangible
proof of the illegal behavior in
the form of wildlife specimens
(e.g., live animals, parts,
derivatives), guns, vehicles,
documents, and more. When such
evidence has not been secured
and properly preserved along a
secure chain of custody,
defendants can easily challenge
their validity and authenticity in
court. Lacking irrefutable
evidence, a prosecutors’ ability to
secure convictions is
compromised.
In Mongolia, the Criminal
Procedures Code falls short of
providing specifications on the
methods that should be used by
law enforcement personnel when
collecting, storing, preserving,
and handling evidence. As a
result, wildlife cases sometimes
begin with shortcomings related
to the presentation of evidence
for which no remedy will be
available once it lands in the
Prosecutor’s hands or in the
court.
Exacerbating matters, Mongolia
lacks official evidence storage
facilities, forcing an ad hoc
approach to the handling of
evidence that may include
multiple arrangements as
explained by interviewees, such
as simply returning the
specimens to the illegal
fishermen, the sale of seized
items, the disposal of perishable
forms of evidence, returning
wildlife to nature even if
wounded, etc. As a result,
evidence is not always available
at the time of trial, seriously
affecting the ability to
successfully prosecute.
Conviction Rates and Compliance are Generally Low
For the decade 2005-2014, the
conviction rate was 43%. This is
the portion of the total criminal
offenders with open cases for
investigation in the Prosecutors
Office (19,927 for the decade,
averaging close to 2,000 a year)
that were finally convicted by a
court and a sentence applied
(8,248 individuals, or close to
800/annum).
The enforcement of court
judgments is another critical
factor when reviewing conviction
information related to wildlife
cases. A conviction is not the
same as compliance with
sentencing and the gap that
exists is not trivial. For the
decade 2004-2014, the national
average of implementation of
judicial decisions was around
70%. Connected to this indicator
is the proportion of the
assessment of economic damage
that is finally restituted (to both
public and private entities). For
the period 2005-2016, the ratio
of assessed damage to actual
restitution was on average 3:1, or
just 36% of the assessed damages
were in fact paid. In aggregate
numbers for the decade 2005-
2016, the amount of assessed
damages effectively restituted
came only to USD 348 million out
of an initial assessment of USD
953 million made during
investigations. In essence, the
difference of around USD 600
million in unpaid damages is the
real opportunity cost of not
having in place evidentiary
protocols, equipment, and
infrastructure for proper criminal
prosecution.
IWT Cases Are Still a Minor Focus Over the last decade,
environmental criminal cases
represented an insignificant
portion of total criminal cases;
approximately 2,500 out of
250,000 cases or 1%, or 1 in 100.
The amount of wildlife crime
cases is even smaller at just 15%
of that 1%, or 1.5 cases per 1,000.
Although this survey did not
have access to national statistics
on wildlife crime prosecution,
estimates offered by the Police
Eco-Crimes Division indicate that
only 15% of their cases are
related to wildlife, with mining
cases dominating most of their
attention and resources.
Information on wildlife crime
cases from 17 of the 21 aimags
provided by the Prosecutors
13
Office supports the same
estimate. It shows that for the
decade 2007-2016 the total
wildlife cases investigated were
as low as 263 (220 for illegal
hunting plus 43 for wildlife
smuggling), which would
represent 11% of the
environmental cases for the same
period. The survey did not have
access to data from the UB
Prosecutors Office for the 3-year
period from 2013-2015. Staff
from that office, nevertheless,
were able to confirm that wildlife
crimes represented an
insignificant part of their
caseload compared to the total
prosecuting effort, with only 17
wildlife cases out of 8,000 total
criminal cases. Around 65% of
the cases made it to court, while
the remaining 35% percent were
dropped by the Prosecutors
Office, due to inadequate
evidence. For the 17 out of 21
aimags for which information
was available, only 142 cases
involving illegal wildlife take and
27 involving illegal wildlife trade
(more precisely ‘smuggling) made
it to court. No information was
available on sentencing and
sentence implementation for
those wildlife cases.
Multiple Weaknesses Make IWT a Low-Risk, High Reward Crime In conclusion, the prosecution of
wildlife crime during the last
decade is limited. In the field,
enforcement personnel in
hunting areas lack operational
capacity and investigative
powers; while customs officials
seem to give priority to the
smuggling of taxable items such
as tobacco and alcohol; and the
Eco-crimes Division of the Police
mostly target mining crimes,
which implicate the government’s
collection of mining royalties. As
a result, a relatively tiny number
of wildlife crimes were detected,
which, due to a myriad of
problems (e.g., structural,
procedural, and logistical
problems in evidence collection
and handling, the lack of expert
capacity to care for seized
wildlife, inadequate forensic
testing, insufficient coordination
between domestic and foreign
enforcement authorities), have all
translated into an even lower
number of cases being brought to
court with many offenders
potentially escaping justice. Even
where court sentences were firm,
prison sentences were usually
appealed under the Amnesty Law,
and economic penalties were
likely not paid in full as hinted at
by the damage payment ratios of
the court system in general.
The end result of this is that
illegal hunting and illegal trade
in Mongolia are still today,
unfortunately, a low risk
activity with a low likelihood of
being caught or suffering either
financial or criminal penalties.
While the most recent legal
reforms are increasing penalties
and explicitly criminalizing more
wildlife related activities,
bringing hope that conviction
rates will increase, more
improvement is needed.
Wildlife Take 2015
The Big Shift – Hunting to Fishing
More than a decade ago, the
combination of relaxed controls
on weapons, cheap ammunition,
and sparse enforcement helped
fuel a wildlife harvesting spree of
unequaled proportions. In 2005,
over 30% of men in the ages 15-
65 claimed to hunt or fish, a
percentage that extrapolated to a
quarter million hunters. In 2015,
the estimate of hunters and
fishers is roughly the same at
247,504 (25%), but their
willingness to admit to this and
the percentage of fishers in the
total has changed dramatically.
Even considering the potential
biases of underestimation of
hunters due to low self-reporting
and greater reporting of fishing
due to less sensitivity, there is a
still a clear shift from hunting to
fishing. That hunters have more
years of experience (on average
12 years) compared to those that
fish (8 years) is one indicator. A
more telling indicator is the
percentage of hunters and fishers
with less than 5 years of
experience: hunters, 38%; and
fishers, 68%. In other words,
more people have entered the
world of wildlife take as fishers
in recent years than as hunters.
Hunters are also ‘growing older.’
In 2005, hunter age quartiles
showed 44% of all hunters were
between the ages of 15 and 28, a
percentage that has dropped to
30% in 2015. The bulk of the
hunting population (41%) is now
between the ages of 31 and 50.
Finally, mammals and birds are
targeted by 58% of those that
take wildlife, but fish, by 82%. In
2005, fishers were around 10%.
If in 2005 the survey recorded
only 4 out of 34 species being
taken as fish (12%), the
proportion ten years later
increased to 46%, with at least 11
different fish species being
harvested, including seven that
were not reported in the past
(Altai osman, Amur catfish, Artic
grayling, common and grass
carps and whitefish). That fish
are now more widely found
within Mongolia’s wildlife take
and trade regime is actually an
incredible shift that has as yet
unstudied implications. It is also
not quite in the conscience of
Mongolia’s policy makers. The
new Law on Infringements and
Criminal Code, for example, only
have a few provisions that
expressly penalize illegal fishing
(see Chapter 4) compared to the

14
detail directed at hunting and
trapping crimes.
Species Not Discussed by Hunters Shows Awareness of Illegality
Household Survey reports 24
different species being harvested
against the 34 informed in 2005.
Species not mentioned by
hunters include Very Rare and
Rare species such as snow
leopard, brown bear, musk deer,
Altai snowcock, or Asiatic wild
ass. They do however, appear as
being hunted and traded in
criminal police records.
Most of these same species were
also listed as Very Rare and Rare
in 2005, meaning that the
primary change is not their legal
status, but the level of
enforcement. That specifically
those species are the ones not
mentioned by hunters during the
survey is not an accident or a
function of the survey method,
but further confirmation of the
awareness of illegality among the
population.
Lower Harvests, but Intensity Continues
At first glance, the survey shows
a significant decrease in
Mongolia’s wildlife harvest and
trade activity since 2005.
Estimated Harvest were 4.4
million specimens for that year
(based on 12 species), while the
current survey estimates a
national harvest of 2.4 million
specimens (with data from 18
species). Extrapolating survey
data in 2015 to estimate harvest
at the national level is
significantly more challenging
than it was in 2005 given the
much smaller number of
individuals that claimed to hunt
and the subsequently smaller
number that reported harvests.
Among the top harvested species
are, from higher to lower based
on estimated annual take:
Siberian marmot (849,764), lenok
(216,890), river perch (192,075),
Northern pike (96,782), and gray
wolf (17,000, not corrected for
underreporting).
The list of the most targeted
mammals remains similar to
those listed in 2005, with a few
minor changes and include in
order of estimated take 1)
Siberian marmot, 2) gray wolf, 3)
altai marmot (38,000), 4) corsac
fox (19,000), 5) wild boar (9,000),
6) roe deer (8,000), 7) Mongolian
Gazelle (6,000) and 8) red fox
(4,000).
Siberian marmot and gray wolf
are still clearly the preferred
species with at least 44% of the
hunter respondents taking
marmots (121,000 hunters), and
16% hunting wolves (44,000
hunters). Average take per hunter
for both species is down
compared to 2005, but total
estimated take volumes still
suggest significant levels of
illegal hunting far exceeding
quotas by many orders of
magnitude. In the case of the
wolf, these levels are still likely
too high given population
estimates. The lowest estimated
take in 2015 for wolf comes to
17,000, which is at odds with
total population estimates of
between 10,000-20,000. That
both the 2005 survey and this
survey obtain similar average
take levels, however, suggests
that detailed wolf population
studies are needed to understand
populations and identify
scientifically sound off-take
levels. The current official
hunting quota of 20 per year is
certainly being exceeded by
hunters and probably by as much
as 1,000 times the permitted
take.
The survey shows that harvesting
activity is spread across the year,
with the summer and fall being
the two more active seasons, with
17 and 20 species respectively.
Winter is the next most active
season with 14 species; followed
by the spring with 12 species
targeted. Volumes drop
substantially in spring, but in all
seasons, there is always a
percentage of hunters and
fishermen engaged in some level
of wildlife take. When compared
to the open and closed seasons
as established in the Law on
Fauna, it is clear that poaching is
essentially constant through the
year. Out of season hunting
affects, for example, roe deer
(permitted in Fall, hunted all 4
seasons); corsac fox (permitted
late Fall through the winter,
hunted all 4 seasons); Siberian
and Altai marmot (permitted late
summer through the Fall, hunted
during 3 seasons); and Taimen
(permitted summer and fall,
taken in all 4 seasons).
The Other Big Shift – Guns to Cars In 2015, only 58% of the hunters
claimed to own a firearm,
compared to 96% in 2005.
Increased seizures, restrictions
on gun permits, and difficulties
with the legal purchase of
ammunition at the local level
partially explain the decrease.
However, this survey also
documents a disturbing trend in
the use of illegal and highly
destructive hunting methods
that not many years ago were
rare or even unheard of. Among
them are intentional vehicle-
wildlife collisions and the use of
cars to run animals to
exhaustion. This describes a
transition in take methods where
motor vehicles may now be
overtaking firearms as the most
common hunting method, as per
some enforcer’s opinions.
Ownership of traps among
hunters increased from 8% in
2005 to 21% in the current
survey. Corroborating this result
is the increase in the import of

15
traps identified by a Mongolian
Customs official.
Concerning methods and
equipment used for fishing,
survey results indicate the
overwhelming ownership of rods
(74%) compared to handmade
equipment (15%), and nets (13).
Household fishing is primarily
based on imported modern rods
that are accessible in country in
specialized fishing stores.
Household Wildlife Trade
No One is Talking about Household Sales of Wildlife Contrary to the results in 2005,
households in 2015 rarely
declared selling any of the
wildlife they harvested. Self-
reporting of purchases (described
in a separate section), however,
tells an entirely different story,
as do observations in markets,
restaurants, and retail shops.
While the sales data obtained
during the survey are presented
here, it is clear that the
enforcement environment has
had an impact on respondents
involved at this end of the trade
chain. The entire volume of fish
take, for example, was claimed as
household consumption only. For
mammals, only 4% of the
marmots (Siberian marmot) and
10% of wolfs skins were reported
as sold. Using these percentages
over the estimated number of
specimens taken nationally in a
year, household wildlife sales
would extrapolate to just 15,431
marmots and 4,422 wolfs for
2015. Total sales for households
as self-reported by respondents
barely reached half a million
dollars. Using prices provided by
the survey, the 15,431 marmots
estimated as total annual take for
Mongolia would result in an
aggregated national household
income of around USD 216,000,
while the 4,422 wolves would
result in around USD 280,000
additional income derived from
trade in skins.
Household Purchases Tell Another Story The results for household
purchases of wildlife present a
substantially different
perspective of wildlife trade at
the household level. Where
hunters only claimed to have sold
two species (wolf and marmot),
households reported purchasing
a total of 35 different species. In
general, the participation of
households in wildlife purchases
appears to be active, with almost
175,000 households or 20% of
the total engaged in purchasing
wildlife.
The survey also shows that the
percentage of households
purchasing wildlife increases as
household purchase power does.
While only 11% of the poorest
households buy wildlife, this
rises to 34% for the wealthiest
households.
Food consumption is the most
common use of wildlife, with
animals being purchased whole
or by the kilo for meat, in both
raw and processed forms (i.e.
cooked marmots, smoked fish).
Purchase of skins or furs and oil
are the next most common trade
commodity. Purchases of internal
organs such as bile, brains,
stomachs, or livers appear in the
survey only for three species
(gray wolf, European badger and
brown bear). Taimen, a catch-and-
release-only species, was
reported purchased during 2015,
both for its meat and for its oil.
The top five mammals being
purchased are marmots, gray
wolf, Mongolian gazelle, roe deer
and wild boar. The top five fish
species are whitefish, lenok, carp,
perch, and taimen. Extrapolation
of wildlife household purchases
come close to USD 4 million,
which is roughly eight times the
estimated household wildlife
sales (USD 0.5 million).
IWT in Restaurants The significance of fish
harvesting and purchases in the
Household survey triggered
further inquiries into fish
consumption in Mongolia in the
context of the Market survey, a
country where meat and milk
products have always been the
dominant source of protein.
Although no one claimed to sell
the fish they caught in the
household survey, the fact that
locally caught fish are found on
the market and in restaurants
was visible in 2005 and even
more present in 2015.
At 42% of the total sample,
traditional Mongolian restaurants
are the top cuisine style category
that includes fish on the menu.
The next highest cuisine style is
Korean (30%), followed by
Chinese, Italian, and European
(all at 17%). Even though
foreigners represent a
vanishingly small percentage of
Mongolia’s residents (0.6%), they
are nonetheless a large portion of
those ordering fish in
restaurants.
Restaurants source up to 37
different fish species, with only
nine of them being native to
Mongolia, including the Artic
whitefish, Artic grayling, taimen,
lenok, perch, Altai osman, pike,
common carp and grass carp.
Only four species though seem to
be more commonly used
(whitefish, salmon, taimen and
tuna), while the rest appear in 1%
to 5% of the restaurants.
Analysis of purchase seasonality
reveals that local markets offer
fish across all seasons and
restaurants are able to source
16
their local fish all year round.
Only Arctic grayling and Altai
osman appear to be restricted in
the market to the spring, and
Arctic grayling again to the fall.
As most native fish procured by
restaurants are reportedly
frozen, it is possible that the
seasons of sale do not align with
catches and this is thus not an
accurate indicator of out of
season fishing.
Finally, for native species
restaurant suppliers are mostly
wholesalers (67% of the
purchases), with the percentage
of purchases directly from
fishermen relatively low (15%)
and similar to the percentage
coming from retail traders (17%).
In spite of being listed as ‘Rare’
and legally regulated as a catch-
and-release only species, taimen
continue to be part of the menu
in Mongolia. In 2005, the survey
documented its presence in
markets and restaurants, without
being able to provide estimates.
In 2015, 9% of the restaurants
surveyed reported serving it on
the menu. Criminal penalties now
apply to its illegal catch and
trade ranging between 1 to 5
years incarceration and
administrative penalties starting
at USD 4,500. As reported in the
2005 survey, taimen do not breed
until the age of 6 or 7 and have
long lifespans of 30 years or
more. As a result, they are
extremely vulnerable to
overfishing.
The aggregated trade value of the
restaurants surveyed was USD
337,000 a year. It is not possible
to extrapolate this survey data to
the entire population of
restaurants, since neither the
total number of restaurants
operating in Mongolia nor the
number of restaurants that sell
fish were available. Official
statistics estimate the 2015 total
annual revenue for the sector at
MNT 205.5 billion or around USD
90 million. These levels of
income suggest that fish related
business could be several times
more than the survey results.
Traditional Medicine Mongolian Traditional Medicine
Hospitals rely primarily on herbal
preparations for their treatments,
with wildlife playing a distinct,
but minor role by comparison.
The survey identified six species
of fauna as the most commonly
used.
Brown bear oil and brown bear
bile are used to treat joint pain,
chronic diseases, inflammations,
skin burns, and stomach
problems. Respondents
mentioned unanimously the
client preference for the
Mongolian origin of brown bear
products, but affordable Russian
TM products seem to be common
on the market.
The use of Eurasian badger oil to
treat skin burns, stomach ulcers,
and colon inflammations were
mentioned.
Marmot oil is being used in cases
of stomach ulcers and joint
problems (arthritis pain and bone
calcification).
Red fox lung was mentioned to
treat lung problems.
Respondents from UB identified
gray wolf meat as a product
commonly used in UB for
preventing diseases and also for
treating cold and lung
inflammation.
Also in UB, musk deer products
(testicles and wombs) were
mentioned as used in the capital,
although not so commonly. Musk
deer products are also used for
preventing diseases and boosting
the immune system, and for the
treatment of neurological
diseases, paralysis, and
inflammatory processes.
Retail Shops A sample of 106 retail shops
provided an estimated annual
income generated only of the
self-reported ‘bestselling’
Mongolian wildlife products at
$600,000. Most of the shops
visited trade in a variety of
products in the order of dozens
and, in some cases hundreds of
products. The survey was also
restricted to UB and eight aimags.
The true value of wildlife trade at
retail shops is certainly more and
could be many times the
estimated figure.
Wildlife Is Common in Mongolia’s Retail Shops
Clothing and shoe products
represented by far the most
important category of wildlife
product found during the survey.
Just over half (54%) of the shops
claimed that wildlife-based
apparel is their best selling
commodity. This category also
represents 83% of the estimated
total revenue for all wildlife-
based products in the retail
market. Clothing articles
reported include hats, coats,
jackets, and boots. The most
commonly used wildlife for these
products are wolf, sable,
reindeer, and badger. With the
exception of two product types
(crocodile skin boots and snake
skin shoes), all of the wildlife in
this market segment occurs in
Mongolia. In most cases, stores
claim sourcing wildlife locally,
but in some stores also stocked
imported apparel from China and
Russia, in particular fox and
sable fur products.
The next most common top seller
category is jewelry, with 40% of
the sample self-reporting jewelry
products as bestsellers. As a
function of overall revenue
generation, it runs a distant
second behind clothing and
shoes, at just 8% of the total
estimated revenue. Unlike

17
clothing, however, all products
reported by retail shops include
wildlife sourced exclusively in
Mongolia. In order of the
frequency of observations, they
include items containing gray
wolf canines and ankles, vulture
claws, wild boar canines, bear
canines, and saker falcon claws.
Already reported in the
Restaurant survey, fish is another
important wildlife trade segment
in Mongolia’s retail shops. Just
under one third (28%) of the
shops surveyed sell fish. Overall
revenue, however, is just 2% of
the combined sales results. Of
the 13 species identified in the
shops, eight of them are sourced
in Mongolia, The only species
with a clear prevalence above all
others is locally sourced lenok.
Not as common as other market
segments, nonetheless 16% of the
stores report TM products as top
selling items. This portion of the
survey found some of the same
species and products revealed in
the survey for TM hospitals (e.g.,
bear oil). Similar to the TM
Hospital survey, the actual
species and sources were not
always known (e.g., in some
instances only ‘fish’, ‘bird’, and
‘bear’ are mentioned). Species
specifically identified include red
deer, Altai snowcock, and
Eurasian badger.
Gifts and souvenirs constitute
another category for wildlife
products with 13% of the stores
surveyed claiming this as a best
seller. Total sales volumes,
however could not be estimated
as no information was offered for
three of the four Mongolia
sourced products. Of note in this
market segment is the open sale
of wildlife listed as Very Rare and
Rare, including snow leopard and
argali.
Outdoor Markets
Wildlife Trade No Longer as Visible, but Still Accessible Two facts were clear during the
visits to outdoor wildlife
markets. The first is that law
enforcement has succeeded in
putting some degree of pressure
on traders and has pushed
wildlife trade to the black
market, but not completely out of
sight. Traders did not usually
offer their products openly. On
some occasions, a limited
amount of product –one or two-
were hidden in black bags with
traders affirming that more were
available in a different location, if
the buyer was interested. On
other occasions, secret shoppers
were invited to visit homes or
private spaces close to the
market to see the complete
product offer. Secrecy was the
norm, but learning about
products and finding offers was
still relatively easy.
On Demand Trade Has Become a Standard The second fact is that wildlife
trade in Mongolia is an ‘on
demand’ enterprise. Mystery
shoppers were asked repeatedly
about the amount of product
they wanted to purchase. Many
traders insisted on the fact they
could get any amount requested,
including wolf, red fox, sable, and
marmot. In one instance,
surveyors were able to engage in
some follow-up by calling a
phone number provided to one of
the mystery buyers, which put
them in contact with a dealer in
Zamiin-Uud. This trader
explained that he could request
others to hunt any amount and
variety of fur on demand. This on
demand trade was also captured
in some formal retail shops in
UB. These interactions were the
closest the survey team came to
the organized criminal networks
discussed in Chapter 5.
Wildlife Products and Prices Wherever possible, surveyors
inquired about prices of wildlife
products on offer. The results
show similarities in commodity
types, but significant variability
in prices that seemed to be tied
generally to location, season, size
and quality of the item on offer.
The degree of variability,
however, is also typical of an
informal economy operating
mostly in secret; with little
connection between markets, and
minimal standardization in the
offer. Estimates are difficult in
these circumstances, but results
are nonetheless instructive.
Trading in whole animals is
common in Mongolia’s outdoor
markets, with national average
prices estimated at $85 for wolf,
$52 for Altai snowcock, $28 for
the Mongolian gazelle, $17 for
marmot, $11 for black-tailed
gazelle, $9 for Eurasian badger
and $6 for white-tailed gazelle.
Many fish species were also
found being traded whole, at
lower prices ranging from USD 1
for an Artic Grayling to USD 6 for
a Pike. No taimen was found for
sale in the outdoor markets.
Meat from both mammals and
fish is also traded by the kilo,
with the highest prices for the
wild boar meat at USD 6/Kg and
the lowest for the Mongolian
gazelle at USD 1/Kg.
Up to five different fur products
sold by the piece were found,
including wolf pelts at USD 300
on average, fox furs at USD 100,
rabbit furs at USD 80, sable furs
at USD 60, and marmot furs at
the lowest cost of only USD 3 per
piece.

18
Antlers are traded both by the
entire antler and by the piece.
The price analysis may be
distorted by this fact. Reindeer
antlers were the more expensive
at USD 90/piece, closely followed
by Saiga antelope antlers at USD
75/piece. Much cheaper were the
Mongolian gazelle antlers at
USD10/piece, and Deer antler at
just USD 7/piece and USD
1/piece for blood antler.
Extracts and oils were identified
from five different native species
including deer oil (USD
47/100ml), marmot oil (USD
13/ml), brown bear oil (USD
10/ml), Eurasian badger oil (USD
6/100ml) and fish oil, the
cheapest of all at USD 5/ml on
average.
E-Commerce The Internet is being
predominantly used for online
advertising of wildlife products
more than for direct e-commerce
in wildlife. During the survey, two
different sites containing 40
wildlife-related ads were
identified including
www.unegui.mn, a popular
Mongolian site for classified ads,
and the global social media site
Facebook.
The five most common
advertised species were marmot,
wolf, deer, bear, and badger.
Across the entire survey from
Household to Market to
Enforcement, Mongolia’s gray
wolf is one of the most common
species harvested and traded.
The online market is no different,
with more advertisements and
more parts offered than for any
other species. In the case of the
marmot, another common
species seen across the survey,
one single ad offered 300
marmot ankle bones in a single
ad.
The most valuable product,
however, was not among those
species. It was a pair of
Dalmatian pelican beaks offered
for MNT 3.5 million or USD 1,500.
This is a Very Rare species and
thus a restricted product that
makes this online advertisement
illegal. The most recent legal
reform imposes more stringent
penalties on the advertising of
wildlife, with criminal penalties
applicable for trade in listed
species.
Trophy Hunting Collecting data for trophy
hunting proved to be a more
challenging task than any other
activity in the survey. Only two
hunting companies agreed to
share information with the
survey, while the remaining
companies refused to participate.
This does not allow for any
estimation or extrapolation and
results serve only illustrative
purposes.
The first agency is based in UB
and is exclusively dedicated to
organizing fishing trips in
Khuvsgul aimag. They reported
hosting around 40 foreigners in
2015 from the USA, UK, Russia,
Japan, and France. Together, their
clients took 12 taimen, 250 Artic
grayling, and 250 lenok. The
agency takes care of fishing
permits for foreigners.
The other agency is based in
Bayan-Ulgii aimag and organizes
big mammals hunting trips
within this aimag. They target
Argali, Ibex and Red Deer and
specialize in international visitors
from Spanish-speaking countries
(Spain and Latin America). The
six hunters they hosted in 2015
harvested 6 Argali, and 2 Red
Deer, being unsuccessful at Ibex.
The agency provides a wide range
of services including facilitation
of gun permits and hunting
permits (based on quotas
obtained from the agency),
taxidermy, disposal of remaining
animal parts in local markets,
and management of CITES
permits to export the trophies.

CHAPTER I
Introduction
20
The Setting In 2005, illicit wildlife trade was already a global
problem, but it was not mainstream, and remained
a topic for specialists. Articles surfaced in a variety
of journals and publications, but they did not grace
the front pages or regularly populate major
newspapers. In 2017, it is fair to say that this topic
is reaching a global audience and is having an
impact. Major newspapers run wildlife trade stories
in their main pages,10 not just tucked away in the
science section. Numerous online news outlets are
fully dedicated to tracking and reporting on illegal
wildlife trade.11 Governments have taken notice of
the multiple implications of this uncontrolled and
illicit trade on their resources, economies, cultures,
even the security of their countries. Many have
established departments, special investigative
units, and other programs with the sole focus of
combatting illegal wildlife trade.12 Testimony to this
can be found in the fact that in 2016, the
Convention on International Trade in Endangered
Species (CITES) saw its largest conference of
member states ever, owing unquestionably to a
growing level of awareness among those states.
There are also a growing number of regional and
international initiatives aimed at supporting
capacity development, forensics expertise, and the
exchange of critical, enforcement related
information across borders. 13 Many of them are
10 For example, the New York Times has run articles in some of its various sections, including Business Day (Ron Nixon and Coral Davenport. October 5, 2015. “Environmentalists Praise Wildlife Measures in Trans-Pacific Wildlife Pact”); World News (Ron Nixon. December 22, 2015. “U.S. Pours Millions into Fighting Poachers in South Africa” and Bettina Wassener. March 12, 2013. “No Species is Safe from Burgeoning Wildlife Trade”); and the Opinion section (Tristan McConnell. October 29, 2015. “The Ivory-Funded Terrorism Myth”). Available on www.nytimes.com. Likewise, the Wall Street Journal recently ran an article about wildlife trade in China in its World News section: Chun Han Wong. December 31, 2016. “China to Shut Down Ivory Trade by End of 2017.” Available on www.wsj.com.
11 www.wildlifetradetracker.org, healthmap.org/wildlifetrade/, and poachtracker.oxpeckers.org/ are several examples.
12 Examples of this include: Kenya, which established its Kenya Wildlife Service (KWS) in 1989 to enforce Kenya’s wildlife laws (see UN Chronicle Vol. LI No. 2 2014, available at https://unchronicle.un.org/article/fighting-wildlife-trade-kenya); Thailand, which implemented a training program for airport personnel on how to identify and handle commonly traded protected species (see Voice of America. November 2, 2009. “Thailand calls for Wildlife Trade Enforcement.” Available at http://www.voanews.com/a/a-13-2009-03-09-voa34-68635822/407764.html; and the U.S., which issued a National Strategy for Combating Wildlife Trafficking in 2014, which includes a wildlife trafficking task force comprised of 17 different federal agencies. See https://www.state.gov/e/oes/ecw/wlt/. The U.K.’s Department for Environment, Food and Rural Affairs set up the global Illegal Wildlife Trade Challenge Fund aimed at reducing global IWT by providing funding to practical projects around the world.
13 The ASEAN Wildlife Enforcement Network (ASEANWEN) and the more focused Snow Leopard and Wildlife Enforcement Network (SLAWEN)13 are two examples of this.
adopting legal mechanisms to improve their ability
to enforce and prosecute illicit trade as a serious
crime.14
The uptick in attention is certainly a recognition
that the problem is getting worse, driven in some
instances by unlikely economic impulses such as
pure speculation in trade.15 However, we should be
careful not to label it as new. In 2001, some
estimates placed illegal wildlife trade as the second
highest illicit trade following illegal drug trade,
with annual volumes in excess of US$5 billion
globally.16 In 2016, at least one source lists it as the
fourth largest form of illicit trade (after drugs,
counterfeiting, and human trafficking), 17 not
because it has diminished, but because other forms
of illicit trade are also growing and being studied
more carefully. Today, these estimates have risen
to anything between USD $15 billion and USD $150
billion annually, depending on the source and
method of assessment.18
These are of course just estimates. Doing so
accurately is exceptionally difficult for legal trade,
let alone for something as clandestine as illegal
wildlife trade. However, the real story hidden
behind these numbers is not that illicit trade is
worse than 15 years earlier, but that it is also being
uncovered. We are beginning to grasp the real
dimensions of wildlife trade at local and global
scales, although we are probably still far from the
truth. While most of the attention focuses on illicit
trade in iconic species such as elephants and
rhinos, we are learning about other species that are
similarly being driven to the edge of extinction by
our seemingly insatiable appetite for wildlife. Owl
eggs in Kenya, for example, trade for as much as
$3,800 each, or roughly $89/gram, which makes
them more than twice as valuable as rhino horn
($35/gram)19 and eighty times more valuable than
14 Kenya, for example, adopted an entire law in 2013, the Wildlife Conservation and Management Act, with wildlife trade as a central focus.
15 Yufang, G., K. Stoner, A. Leed, S. Clark. Rhino horn trade in China: An analysis of the art and antiques market. Biological Conservation, Volume 201, September 2016, Pages 343-347.
16 Jagodinski G. 2001. “Region 3 News. e Federal Wildlife Officer.”
Federal Wildlife Officers Association, Inc. 15 (1) (Winter). 17 UNEP-INTERPOL Report: Value of Environmental Crime Up 26%. June 2016.
18 For example, UNEP Year Book 2014 (Emerging Issues Update: Illegal Trade in Wildlife. Available at http://www.unep.org/yearbook/2014/PDF/chapt4.pdf) estimates the illegal wildlife trade’s annual worth at between US$50-150 billion, whereas UNEP’s illegal Trade in Wildlife Factsheet from May 2016, available at http://www.unep.org/documents/itw/ITW_fact_sheet.pdf, estimates the international illegal wildlife trade as being worth between US$15-20 billion. TRAFFIC estimates the trade at between US$24.8–40 billion (see http://www.traffic.org/trade/).
19 Odaga, D. (2016) Where an Owl Egg Is Worth More Than Ivory or Rhino Horn, Explorers Journal on October 4, 2016 – citing cost of ivory in China in November 2015. Citing rhino horn prices in Vietnam in September of 2016.
21
ivory ($1.10/gram). 20 At these prices, owl
populations in Kenya have little chance of avoiding
collapse. The study that documents these prices
notes that a particular population of owls had not
produced a single chick in two years.21 The list of
lesser-known species in trade is already very long
and more than likely incomplete.
But one thing is clear from all of this – no matter
how it is measured; we are facing a crisis. Species
impacted by trade have been wiped out in many of
their home ranges, and in some instances, are
moving ever closer to extinction.22 Populations of
pangolin in China’s Guangdong and Hunan
provinces, for example, have plummeted an
estimated 90% since 2000 and are likely extinct in
three other provinces (Hainan, Henan, and
Jiangsu).23
The causes and effects of this crisis are far
reaching. As noted in the first Silent Steppe report,
rapid declines and loss of wildlife can have
unintended, large-scale effects on non-target
species, including predators, competitors,
symbiotes (species with close ecological
relationships, e.g., species that utilize marmot
burrows for dens), and even vegetation
composition. In Mongolia, as in other countries,
there is still little research into the ecological roles
performed by targeted species.
While it should have been obvious even many years
ago, there is no denying that today this trade is:
stimulated by the accelerated growth of human populations and the unsustainable lifestyle of millions of consumers that assign to wildlife curative powers and social status;
driven by rising prices that only grow as
species become scarcer – creating a perverse
incentive to invest in and go after the few that
remain;24
controlled by professional, connected and
adaptive criminal networks that feed a growing
20 Id. Citing cost of ivory in China in November 2015.
21 Id.
22 IUCN lists a total of 5,157 species as Critically Endangered
Species, a category that precedes Extinction. The IUCN Red List of
Threatened Species. Version 2017-1. <www.iucnredlist.org>.
Downloaded on 23 May 2017 23 Block, B. (2017) Illegal Pangolin Trade Threatens Rare Species. WorldWatch Institute, Eye on Earth online news service.
24 This concept is discussed with respect to the ivory trade in Africa in this blog article from Brookings: Kimenyi, Mwangi S. March 6, 2015. “The Dilemma of Destroying Ivory as an Anti-Poaching Strategy.” As ivory becomes more scarce as a result of the government destroying seized ivory stockpiles, prices for ivory rise and incentivize increased poaching. The issue is also discussed in: Plumer, Brad. November 6, 2013. Washington Post. Wonkblog. “The Grisly Eonomics of Elephant Poaching.”
appetite for what were previously inaccessible
products;25
facilitated by corruption as common and
widespread as it is difficult to control;26 and
supported by advances in logistics and
communications that shorten the distance
between poachers and buyers, making it
possible to trade on a truly global scale.27
Fueled by conflict and armed groups, that find
a financing source in wildlife trafficking.
The first Silent Steppe report told us that Mongolia
had a share in this crisis. Wildlife trade was no
longer just a part of the cultural fabric; it was also
big business with annual trade for some species
counted in the tens of thousands, even millions of
specimens.28 Trade was not just seasonal and local,
but increasingly sustained, professional, and
international. Estimated trade values ran into the
tens of millions of dollars, and even then, these
estimates were probably substantially undervalued.
While the full picture may never be known, all
indications are that the vast majority of this trade
went south to China, either for direct consumption
(e.g., wolves) or for further processing and sale to
other markets (e.g., marmot for processing into fur
coats). Organized crime was certainly a part of the
equation then, but still relatively hidden. The 2005
team’s introduction to Mongolia’s wildlife trade
with China was, to everyone’s surprise, made
possible through meetings with individuals
involved in organized crime. In short, Mongolia was
just one more supplier in a global store already
liquidating faster than anyone suspected.
All of this meant that the setting for the 2016
survey was different and that wildlife trade would
likely be more difficult to survey than anything
experienced in 2005. Ten years earlier, the research
team was responding to a situation that was still
only hinted at and that seemed predominantly
local, even a little innocent. Enforcement was
present, but still minimal, and trade, highly visible.
Talking to hunters and traders, taking pictures, and
openly recording observations were possible in
25 See Steyn, Paul. May 26, 2015. National Geographic. “As Animal Poaching Surges, Organized Crime Plays Bigger Role.” Available at news.nationalgeographic.com.
26 UNODC. 2016. World Wildlife Crime Report: Trafficking in Protected Species. United Nations, New York. Also for example, see Fernquest, Jon. March 5, 2013. Bangkok Post. “Rhino Horn Smuggling: Caught on Suvarnabhumi Video.” Available at http://www.bangkokpost.com/learning/learning-news/338953/rhino-horn-smuggling-caught-on-suvarnabhumi-video.
27 The internet provides an international marketplace for sale of illegal wildlife and wildlife parts that is difficult to regulate. See Hastie, Jo and Tania McCrea-Steele. 2014. “Wanted- Dead or Alive: Exposing Online Wildlife Trade.” International Fund for Animal Welfare. Available at www.ifaw.org.
28 Wingard and Zahler, (2006).

22
many instances without concern for safety or the
worry that interviewees would deliberately hide
information. In 2016, the research team started
with the expectation that illicit trade was as much
for international markets as domestic ones, that
the intervening years had seen increased
enforcement and awareness of potential liability,
and that obtaining information would be more
difficult even at the household level, let alone in
the markets and trade centers.
The approach in this study is therefore directed at
least in part by methods that were unnecessary
before, among them the Unmatched Count
Technique (UCT) (described in Chapter II Methods).
UCT is a specialized questioning technique
designed to improve estimates when sensitive
and/or incriminating questions are expected to
influence the likelihood of respondents answering
questions truthfully. The study also included
simpler methods, such as eliminating ‘on location’
recording of observations or direct questioning,
relying instead on key informants in offsite
interviews. These and other changes detailed in
Chapter II proved essential as much in the
implementation of the survey as in the analysis of
results.
On the positive side and equally important to the
setting is the number of subsequent wildlife
studies that have been conducted in Mongolia since
the original 2005 survey. The 2016 study has been
able to use these studies as critical input into the
necessary effort of improving survey methodology.
Among these studies are:
A 2007-2008 survey of the raw materials and
food markets in Ulaanbatar by WCS for a report
to the World Bank, to determine species traded
and enforcement activities employed;29
A 2007 market survey conducted by a research
group as part of a larger study on wolf
mortality in the Gobi for conservation
purposes;30
Student-led observational surveys of
Ulaanbaatar-area markets from December
2008-January 2009, as preparation for
implementation of multi-agency illegal wildlife
trade market patrols;31
Nationwide population surveys of mountain
and steppe ungulates for conservation
29 See Parkinson, Andrew M., Odonchimeg Nyamtseren, Tuvshinjargal D., Amanda Fine. May 2008. “World Bank FLEG Ulaanbatar Wildlife Trade Survey: Wildlife Conservation Society Report.” Wildlife Conservation Society.
30 See Kaczensky, Petra, Namtar Enksaikhan, Oyunsaikhan Ganbaatar, and Chris Walzer. 2008. Wildlife Biology. 14(4). “The Great Gobi B Strictly Protected Area in Mongolia- Refuge or Sink for Wolves Canis Lupus in the Gobi.”
31 See Wildlife Conservation Society. March 31, 2009. “Protecting Mongolia’s Wildlife through Wildlife Trade Law Enforcement.”
programs conducted by MNET in collaboration
with WWF in October 2009;32
A national population survey of saker falcons
by MNET in collaboration with The Institute of
Biology- National Academy of Sciences (IB-NAS)
to determine sustainable harvest levels for
CITES complience;33
A recent report by TRAFFIC, published in 2016,
on the snow leopard trade using market
surveys in several countries including
Mongolia.34
32 See “Summary of Reports and Other Documents, Delivered to the World Bank Mongolia Office During Preparation and Implementation of Mongolia Ungulate Surveys, which was Supported by the NEMO II Project.” Available via documents.worldbank.org.
33 See Convention on International Trade in Endangered Species of Wild Fauna and Flora. “Programme for the Conservation and Sustainable Use of Falco Cherrug in Mongolia.” 25th Meeting of the Animals Committee. Geneva, Switzerland. 18-22 July 2011. Available via www.cites.org.
34 See Nowell, Kristin, Juan Li, Mikhail Paltsyn, and Rishi Kumar Sharma. October 2016. “An Ounce of Prevention: Snow Leopard Crime Revisited.” TRAFFIC.

23
A Cross-Sectional Study Surveys have long been a common tool for
monitoring wildlife resources, and trade related
surveys increasingly so. In the past ten or more
years, surveys of one type or another have been
conducted by a growing number of organizations
tracking everything from trade in live animals as
pets (birds,26 reptiles,27 tropical fish28), to wildlife
products sold for medicinal purposes (rhino
horn,29 tiger bone30) and aesthetic values (elephant
ivory, 31 red ivory 32 ), and for food (pangolin,
turtles).33 This emerging body of data and analysis
has done more than just document change; it has
painted an increasingly clear picture of the trade
crisis and raised awareness across the globe,
bringing wildlife trade into focus among global
leaders (e.g., the coalition “United for Wildlife”
unites the global leading wildlife charities and
was created by The Royal Foundation of The Duke
and Duchess of Cambridge and Prince Harry.
Some of their global ambassadors include sport
champions such as tennis player Andy Murray, or
cyclist Chris Froome).
26 Chow, A., S. Cheung, and P. Yip. Human-Wildlife Interactions 8(1). Spring 2014. “Wildlife Markets in South China.” 108-112. Accessed via www.berrymaninstitute.org.
27 Id.
28 The following paper discusses the results of a survey of Costa Rican households to determine the incidence and types of wildlife trade, including fish, kept as pets: Drews, Carlos. Society and Animals 9:2. 2001. Wild Animals and Other Pets Kept in Costa Rican Households: Incidence, Species, and Numbers. Koninklijke Brill NV, Leiden, 2001.
29 This article discusses a 2012 market survey conducted in China to determine rhino horn consumption and awareness: Vallianas, Christina. 2014. “Rhino Horn Demand.” WildAid. Available from www.wildaid.org. TRAFFIC conducted an earlier survey in Chinese markets related to the sale of tiger bone and rhinoceros horn: TRAFFIC. May 1997. “Rhinoceros Horn and Tiger Bone in China: An Investigation of Trade Since the 1993 Ban.”
30 TRAFFIC. May 1997. “Rhinoceros Horn and Tiger Bone in China: An Investigation of Trade Since the 1993 Ban.”
31 See Vallianos, Christina. “Ivory Demand in China 2012-2014.” WildAid. Available via awf.org. See also: TRAFFIC. July 3, 2014. “Market Survey Finds Disturbing Increase in Thai Ivory Market.” Available at www.traffic.org.
32 See Jenkins, Anna, Neil Bridgland, Rachel Hembery, Ulrich Malessa, James Hewitt, and Chen Hin Keong. Chatham House Workshop: Tackling the Trade in Illegal Precious Woods. April 23-24, 2012. Background Paper 1: “Precious Woods: Exploitation of the Finest Timber.” TRAFFIC. Accessed via illegal-logging.info. (The paper refers to red ivory as “pink ivory,” a different name for the same wood.)
33 Chow, et al. 2014.
However, cross-sectional wildlife trade surveys as
extensive as the one recorded in this report are
fairly rare. One major reason for this is the time
they take. These studies are designed to repeat
the same observations over long periods of time,
often over decades, with the goal of tracking
changes and understanding patterns that emerge.
Making sure that resources are dedicated and
available for these periods runs up against
typically short funding cycles, limited financial
capacity, and the changing attention of politics.
Another major challenge is having an agreed
upon method that results in the same
observations, by tracking individuals or groups
with the same characteristics and collecting the
same information in the same way.
The practical realities of illegal wildlife trade
make any kind of survey difficult to conduct. In
some instances, the clandestine nature of trade
reduces surveys to little more than anecdotal
observations, with informants reporting on what
they see, but far from collecting a uniform set of
data in a standardized and comparable way. 34
Another reality is that even if trade is open, it is
still not easy to observe. Trade typically begins in
the remote, mostly inaccessible locations where
wildlife is found. Some of it is in small quantities
and can be easily concealed. It can also take a
myriad of forms, and change hands in a wide
variety of markets, both formal and informal. In
this survey, and in a country like Mongolia that is
not high in species diversity, researchers
nonetheless recorded as many as 32 species
actively being traded in everything from isolated
collection points and trade markets, to
restaurants, individual homes, tourist and jewelry
shops, and across borders. In more tropical
climes, the number of species in trade can reach
into the thousands35 and include many more trade
points and forms. In sum, although parts of it
may be seen, the bulk of trade can easily remain
out of sight, even if no one is trying to hide it.
Challenges aside, cross-sectional studies have
tremendous advantages and should be supported
as a regular effort. There really is no substitute
for their temporal perspective and the data they
provide to document patterns and changes. As
34 This concept is discussed, for example, in the following study on Chinese trade in tiger products, which employed market surveys: Gratwicke, Brian, Judy Mills, Adam Dutton, Grace Gabriel, Barney Long, John Seidensticker, Belinda Wright, Wang You, and Li Zhang. July 2, 2008. Plos One. 3(7). “Attitudes Toward Consumption and Conservation of Tigers in China.”
35 Numbers for species traded illegally are difficult to obtain. However, Vietnam, for example, is home to an estimated 21,017 species of plants and 11,458 species of animals. Of these, 6,000 species of plants are used for food, medicine, and other uses; 130 insect species were documented as being traded as part of a 2004 study, and 147 other terrestrial animal species are legally traded. The CITES Scientific Authority of Vietnam. 2008. “Report on the Review of Vietnam’s Wildlife Trade Policy.”

24
this study shows, trade can sometimes shift
dramatically, making yesterday’s approaches to
the problem obsolete and ineffective. In 2005,
Mongolia’s wildlife trade crisis appeared to be
primarily focused on mammals, and many of the
efforts that followed focused on this problem set.
It has now shifted at least in part, and perhaps
substantially to the country’s freshwater fish.
Cross-sectional studies also provide some
flexibility that can allow the focus of the study to
be adapted and improved over time. The 2016
study took advantage of this to adjust questions
and approaches from the 2005 surveys. For the
household survey, this meant that in 2016 the
socio-economic questions (education, income and
property assets) could be aligned with national
census data and incorporated into closed-ended
questions to ensure consistency in the responses
and their comparability with national data. In
addition, all questions that had low or irregular
response levels in 2005 could be discarded, and
in particular, questions requiring responses about
quantities by weight (e.g., number of kilos of meat
per hunted animal, which is not typically referred
to by kilo weight within rural families). For the
market survey, a review of the 2005 data revealed
the difficulties faced when attempting to fit
diverse market realities into a single market
survey instrument (e.g., shops in UB vs. open
wildlife markets outside the city). In 2016, this
experience allowed the survey team to design new
instruments tailored to the market segments (e.g.,
restaurants, retail shops, tourism agencies,
traditional medicine shops, etc.).
Finally, it is possible to learn more about cause
and effect relationships through cross-sectional
studies, with it possible to draw connections
more easily. More data over longer periods of
time allows for more accurate results. For
example, the effects of a decade of enforcement
in Mongolia can be seen today in the level of
awareness, the number of seizures and the fines
being paid. All of these have increased
substantially from 2005. But it can also be seen in
the transition from one resource to another.
Where hunting dominated the wildlife trade
market a decade ago, the evidence is now
showing a clear shift to fishing. Finally, this cross-
sectional study is helping document the impact of
increased enforcement on trade visibility and the
practices used to hide it; e.g., moving illicit trade
at night, selecting unpatrolled borders, improved
logistics and communication, use of drones, and
more.
As the first cross-sectional study on wildlife trade
in Mongolia, it brings with it the opportunity to
develop a unique historical perspective on the
many parts that constitute wildlife trade in
Mongolia’s post-Soviet era. But it still has its
limitations. What these are and how they have
potentially impacted the results are stated in
Chapter II detailing the methods.

25
Objectives and Approach This second Silent Steppe report aims to go
further than its predecessor in characterizing
and understanding wildlife trade in Mongolia. It
is also to document what has happened in
Mongolia in the intervening 10 years to the
species in trade, to the laws designed to address
the problem, to the departments responsible for
their implementation, and in the courts handling
wildlife trade cases. Finally, it is to detail the
practical efforts and concrete steps still required
to bring illicit trade under control.
Beyond revisions to the methods described in
Chapter II, a number of overarching
considerations and innovations guided this
effort. These were born out of the strategic
planning process that inaugurated the study
with an in-depth discussion around the
opportunities to improve the 2005 study. In this
initial step, the core research team assessed the
2005 survey instruments and data in detail, the
questions that worked, and those that did not.
All stages of the process, from the setting of the
research goals, to the final evaluation, passing
through the design of the field work calendar,
surveyor’s profiles, data analysis, public
outreach, and any additional stages were
reviewed, analyzed, and evaluated. As a result,
the team identified 20 strategic
recommendations for the 2016 edition. Rather
than go into details, the strategic
recommendations were phrased as guiding
principles for the development of the 2016
survey. This section presents a selection of those
recommendations; specifically, the
recommendations describing key improvements
and innovations over the study’s predecessor.
A MORE HOLISTIC APPROACH TO SURVEYING WILDLIFE TRADE The first improvement is the more holistic
approach of the 2016 report. Looking back at
2005, one of the lessons learned is that some
areas, in particular the review of the legal
architecture and institutional ecosystem, needed
not just a more concerted effort, but a
systematic approach designed to solicit
information across a broader spectrum of actors.
In 2005, the focus was principally on take and
trade. The goal in 2016 was to understand not
just what was happening, but to place greater
emphasis on the mechanisms that either
hindered or facilitated illicit trade, as well as the
practical realities of combatting it.
As a result, from its conception, this report has
intended to gather more targeted information
about the system that surrounds wildlife trade.
Beyond the improvements within the household
and market surveys, the final set of research
tools included additional, tailored instruments
and lines of inquiry for multiple sectors,
including:
a comparative, gap analysis method for legal
assessments that included the review and
comparison to other countries;
more detailed questions specific to
enforcement personnel, operations, and
capacity;
data requests and interview formats for
Customs officials;
mapping of border areas and the
identification of suspected high trade areas;
more questions specific to transportation
and logistics to document trade movement;
a new line of inquiry into public opinion
towards the need for, and efficacy of
enforcement;
additional review of global trends to support
the analysis and comparison of Mongolia’s
role in international wildlife trade;
deeper inquiry into the economics of illicit
trade, including an understanding of
administrative costs, related fines, and
market prices for illicit goods.
Some of these improvements resulted in
separate instruments (e.g., semi-structured
interview sheets; prioritized lines of inquiry,
etc.). In some instances, the results were
incorporated into more than one instrument,
including the market and household surveys, key
informant interviews, and desk research
instructions.
MATCHING WILDLIFE TRADE CYCLES In the 2005 survey, all interviews were
conducted in the summer. As the majority of
hunting in Mongolia occurs in the fall, this likely
had some impact on the household surveys, but
a clear impact on the market survey. 36 As
36 Of the 26 mammals listed in the Mongolian Law on Fauna (2012), most have seasons that begin and end between the months of September and December, with some ending in early February.
26
designed, the household survey relied entirely on
respondent recall and did not attempt to collect
observable hunting statistics. However, for the
market survey, enforcement even 10 years ago
was enough that adjustments had to be made
mid-survey to rely more on direct observations
than originally planned. Direct observations of
markets during the summer season were
necessarily limited and certainly missed some
forms of trade, and species traded. In 2016, all
indications were that enforcement had increased
and that direct observation might be the only
viable method to gather certain types of data.
Regardless of the increase in enforcement, it
seemed clear that shifting the timing of the
market survey to the fall would increase chances
for direct observation and generally capture
better and more accurate information. This
resulted in two major adjustments to the 2016
survey design:
First, the market surveys were rescheduled to
begin in September overlapping with a portion of
almost all fishing seasons, as well as a
substantial part of the hunting season for many
mammals and birds. Fishing seasons are
substantially longer and were therefore not the
primary concern in establishing market survey
dates. In contrast, hunting seasons for birds and
mammals are usually more restricted, and were
consequently the determining factor. While the
survey’s timing overlapped for most species, it
did not encompass 11 game species hunted for
their fur. 37 To this extent, some bias is liked
introduced into the observations.
To supplement the market survey data, the
market survey field teams were tasked with
collecting anecdotal hunting information when
travelling outside Ulaanbaatar. The collection of
this information was standardized through the
use of observation sheets. Teams registered any
actual hunting activity they observed, including
pictures, information, and quotes from hunters.
Given the nature of illicit hunting and the
increased level of enforcement, this effort was
subject to safety and security guidelines. The use
and implementation of the observation sheets
was part of the formal training for market
surveys conducted in the fall of 2016.
37 The following species have hunting seasons that begin November 20th and end on February 11th: Sable, Beech marten, American mink, Lynx, Wolverine, Red fox, Corsac fox, Eurasian red squirrel, Siberian weasel, Steppe polecat, Least weasel, Stoat or Ermine, Pallas's cat, Artic or mountain hare, Tolai hare, Long-tailed ground squirrel
TAILORING SURVEY INSTRUMENTS TO SEPARATE TASKS The 2005 report relied on only two formal
research instruments, household surveys and
market surveys. The lack of tailored instruments
for the different market segments as well as the
institutional and legal reviews resulted in
knowledge gaps. To resolve this oversight, the
2016 effort assembled a set of twelve research
instruments to better engage each segment. This
included a combination of:
quantitative information (surveys with
closed-ended responses);
instruments to collect direct observations by
surveyors (prices, stories, and pictures in
systematic ways); and
instruments to collect qualitative
information (semi-structured interviews).
In total, the set of research instruments included
five (5) quantitative surveys (households,
restaurants, TCM hospitals and users, tourism
agencies, and retail shops), one (1) observational
sheet to capture opportunistic stories and
pictures, one (1) price report (to be applied in
markets and online), and five (5) semi-structured
interviews (targeting key informants in general,
and for management authorities, for
environmental authorities, for scientific
authorities, and NGO/international agencies). In
combination, these project specific instruments
provide a more robust foundation for the
planned study.
REFINED SAMPLING METHODS The 2016 proposal equaled the same number of
surveys completed in 2005 – 4,010 household
surveys and 1,110 market surveys. However,
survey methods were refined to avoid problems
associated with under/oversampling, as well as
improving the cost and efficiency of completing
such a large survey effort. The 2005 survey
implemented a simple random sampling method
in urban areas and a line-intercept sampling
method in rural areas. Distances, timing, and
coordination constraints resulted in at least five
regions being under-sampled. The 2016 survey
implemented several sampling changes,
including a geographic stratification of the
sampling. For the first time, these surveys now
include statistical techniques designed to
account for potential underreporting of sensitive
behavior, as is the case with illegal hunting. As a
result of specific questions developed on the
Unmatched Count Technique, this report is now

27
able to provide an estimation of how far survey
results likely deviate due to deliberate
underreporting by respondents.
A PROFESSIONAL SURVEY TEAM A significant improvement over the prior survey
is the integration of a professional organization,
IRIM, to participate in the development and
implementation of the field research tools. The
2005 survey was essentially a combined effort
involving staff from different organizations,
many with expertise in wildlife surveys, but not
necessarily with significant experience in social
surveying. There were also geographic
limitations that meant not all staff were capable
of attending training sessions simultaneously.
Trainings were therefore disbursed and could
not be observed to ensure quality.
IRIM is specialized in conducting surveys using
teams of experienced researchers, standards and
protocols that eliminate common problems, as
well as issues more specific to the
implementation of surveys in Mongolia (e.g.,
timing to avoid elections, how to sample
nomadic areas, etc.). Their involvement included
all logistics, sampling design, data quality
control, internal auditing systems to verify
responses, and English translations. IRIM’s
partnership made it possible to critically review
the 2005 survey and incorporate improvements
by, for example eliminating unnecessary
questions, improving the delivery of questions,
verifying results, detecting field errors, and
more. These improvements contributed to
greater efficiency in the overall process,
resulting in fewer errors, and more accurate,
robust results.
TAPPING INTO NEW ICT OPPORTUNITIES Advances in technology over the last decade
have made it possible to refine and improve the
2016 study. In 2005, researchers needed to print
and reprint sufficient numbers of multi-sheet
surveys before heading to the field, where they
were recorded with pen and paper during
potentially challenging weather. Two members of
the team dedicated their entire time to re-
entering all 5,000+ interview results by hand into
Microsoft Excel. Given the potential for inevitable
errors in this type data entry process, this
method also required additional time intensive
reviews.
There is no fair comparison to the situation in
2016. ICT advances facilitated research design
and development, implementation procedures,
and data entry approaches that were not
available to a simple field team 10+ years earlier.
First, it was possible to engage experts in five
different locations thanks to the ability to
collaborate online, something unthinkable in
2005 when all resources needed to be located in
Mongolia. Second, the report profited from the
revolution that survey software has brought to
the field of research. Gains include: i) integration
of training with the survey, ii) the opportunity to
adjust questions on-the-go, iii) improving the
speed and accuracy in data entry, iv) real time
results, and v) the integration of statistical
analysis.
Tablets were used as the platform to input data,
providing access to important digital services.
These included GPS systems (to geo-locate and
later map each interview); built-in cameras (to
capture images associated with an interview
location and respondent); and voice recorders (to
record statements or comments of the
interviewers in their own words and conduct
data quality reviews). An additional advantage of
mobile devices is the minimization of surveyor
errors. With previous systems, surveyors could
potentially complete surveys dishonestly at
home without visiting the survey area or actually
interviewing a respondent. Because mobile
technology records the exact location and time
of the survey, the risk of false results was
minimized. 38 Additionally, training was
integrated with surveying, with surveyors
capable of accessing explanations to the
questions if they needed to refresh how to ask or
how to enter data in any particular scenario.
Another benefit included the opportunity to
make corrections during the survey (although
most errors were corrected during the pilot). If a
mistake had been detected (for example an
option of “Other” is missing and necessary in a
multiple-choice question), the correction can be
made in real time and surveyors have immediate
access to the corrected version of the survey.
The entire process of compiling paper
questionnaires and entering data is avoided
since surveying software includes check control
capabilities to detect and limit errors in the field.
Finally, when survey results are transmitted,
administrators can immediately access all
tabulated results. It can detect errors to correct
and also provides preliminary result reports.
These technological advances resulted in
immense improvements on the 2005 survey,
38
In the 2005 survey, one team was dismissed and their data
deleted for this reason.
28
making the data collection process smoother,
faster, and more reliable.
ADDING DATA VISUALIZATION The first report included non-text elements such
as maps, pictures, graphics, and tables. The
current report takes a step forward in the field
of data visualization. In an attempt to enhance
reader comprehension and understanding of the
significant quantity and variety of data gathered
and analyzed, a strong emphasis has been
placed on improved visualization. A visual
expert supported the report drafting process by
creating illustrations to better represent complex
interactions contained in the results.
NESTING THE SURVEY IN A GLOBAL CONTEXT Finally, this report has also been adapted to view
Mongolia’s experiences through a global lens. In
2005-06, the international elements of the trade
were certainly not ignored, but the global
dimensions were only touched on tangentially.
The team completed limited surveys across the
border in China and Russia, but the focus was
always tied to Mongolia’s challenges as a source
country. As our understanding of the
international scale of wildlife trade has grown, it
is only logical for this report to draw those
connections wherever possible. Strategic
recommendations cited the opportunity to
review Mongolia’s progress in its implementation
of CITES against other countries, as well as its
membership and implementation of other
wildlife related treaties such as the United
Nations Convention Against Transnational
Organized Crime (UNTOC) and the United
Nations Convention Against Corruption
(UNCAC). Understanding Mongolia’s legal
framework can certainly be advanced by
reference to international best practices, as well
as the experience of countries in similar
situations, comparing systems, practices, and
specific legal content. Beyond this, it was also
the intent to make this report accessible to other
countries and investigators facing similar issues,
particularly in the Central Asia region with
similar species, trade, and enforcement
challenges.

CHAPTER II
Methods
30
Introduction This chapter describes the variety of methods
used to organize the research and analysis.
Following the different stages of the investigation,
it presents the original research questions that
were formulated to guide the entire process; the
tools and instruments designed for data
collection and validation; and the design of the
sampling and the field data collection process. It
also describes how the research team was
formulated, trained and how roles were
distributed. Finally, it outlines the quality control
process to ensure clean and reliable data for
analysis.
It has been organized into the following seven
sub-sections:
- identifying eight areas
of wildlife trade for inquiry, including 1)
wildlife conservation, 2) take and trade, 3)
legal and institutional frameworks related to
wildlife trade, 4) markets, 5) enforcement, 6)
public awareness, and 7) the generic socio-
economic context of Mongolia.
– an extensive list of
sources that could be targeted by research
efforts in addition to the primary household
and market surveys.
– describing the members of
the research team, their qualification and
participation in the various research and
survey tasks.
– outlining the dates and
associated levels of effort for each of the
survey and research tasks.
– a section describing
the 13 research instruments used to
implement the household and market
surveys, as well as the desk research.
– separate, detailed
descriptions of the sampling design for the
household and market surveys.
– discussing all
methods and practices used to collect data in
the field for the household and market
surveys.
This part of the report is significantly longer than
the first Silent Steppe report. The entire process,
including the contents of all questionnaires,
sampling methods, and data analysis are
discussed. The intent is to comprehensively
describe all aspects of the survey methods,
instruments, and analysis to support its
replication and adaptation in other areas.
The foundation for the development of all
methods and instruments described was the
strategic recommendation to maintain the 2005
methods, unless circumstances demanded (e.g.,
increasing enforcement making certain survey
methods no longer viable), or improvements
could be introduced without deviating entirely
from the prior survey approach (e.g., use of
technology to track survey results geographically,
elimination of unnecessary or confusing
questions). Initial planning sessions and the
team’s anecdotal reports made it clear that
several adjustments would be necessary if the
2016 survey were to obtain a comparable or
better level of information. Changes have been
highlighted in Chapter I and are discussed in this
Chapter as necessary.
The proceeding chapters discuss the global
context surrounding Mongolia’s trade (Chapter
III); an analysis of the institutional and legal
framework (Chapter IV); and key results from the
surveys (Chapter V), and finally recommendations
for priority actions to combat illicit wildlife trade
in Mongolia (Chapter VI).
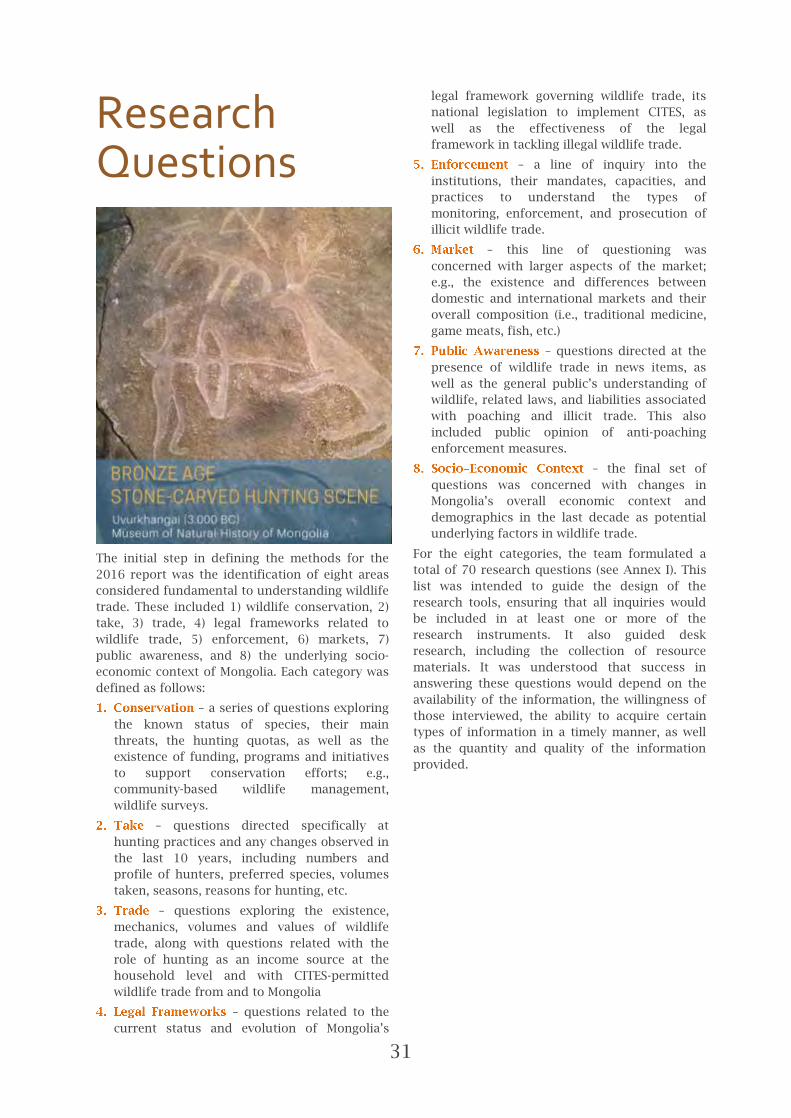
31
Research Questions
The initial step in defining the methods for the
2016 report was the identification of eight areas
considered fundamental to understanding wildlife
trade. These included 1) wildlife conservation, 2)
take, 3) trade, 4) legal frameworks related to
wildlife trade, 5) enforcement, 6) markets, 7)
public awareness, and 8) the underlying socio-
economic context of Mongolia. Each category was
defined as follows:
– a series of questions exploring
the known status of species, their main
threats, the hunting quotas, as well as the
existence of funding, programs and initiatives
to support conservation efforts; e.g.,
community-based wildlife management,
wildlife surveys.
– questions directed specifically at
hunting practices and any changes observed in
the last 10 years, including numbers and
profile of hunters, preferred species, volumes
taken, seasons, reasons for hunting, etc.
– questions exploring the existence,
mechanics, volumes and values of wildlife
trade, along with questions related with the
role of hunting as an income source at the
household level and with CITES-permitted
wildlife trade from and to Mongolia
– questions related to the
current status and evolution of Mongolia’s
legal framework governing wildlife trade, its
national legislation to implement CITES, as
well as the effectiveness of the legal
framework in tackling illegal wildlife trade.
– a line of inquiry into the
institutions, their mandates, capacities, and
practices to understand the types of
monitoring, enforcement, and prosecution of
illicit wildlife trade.
– this line of questioning was
concerned with larger aspects of the market;
e.g., the existence and differences between
domestic and international markets and their
overall composition (i.e., traditional medicine,
game meats, fish, etc.)
– questions directed at the
presence of wildlife trade in news items, as
well as the general public’s understanding of
wildlife, related laws, and liabilities associated
with poaching and illicit trade. This also
included public opinion of anti-poaching
enforcement measures.
– the final set of
questions was concerned with changes in
Mongolia’s overall economic context and
demographics in the last decade as potential
underlying factors in wildlife trade.
For the eight categories, the team formulated a
total of 70 research questions (see Annex I). This
list was intended to guide the design of the
research tools, ensuring that all inquiries would
be included in at least one or more of the
research instruments. It also guided desk
research, including the collection of resource
materials. It was understood that success in
answering these questions would depend on the
availability of the information, the willingness of
those interviewed, the ability to acquire certain
types of information in a timely manner, as well
as the quantity and quality of the information
provided.

32
Sources of Information Once the research questions were defined, the
survey team prepared a table of potential sources
to direct information gathering efforts. The goal
was to complement the core data collected by
households and traders with the opinions,
statistics, and publications of other relevant
stakeholders.
The final list of potential sources came to 53,
covering the institutional environment and
included management, trade, and enforcement
related agencies, national and international NGOs,
academia, international and national finance
institutions, and the private sector. In the end,
inputs were collected from a total of 36 of the 53
identified sources (marked in blue in Table 2),
including almost all institutional and enforcement
bodies, all targeted civil society groups, as well as
several national and international NGOs.
Unfortunately, the inability to coordinate the
collection of information from Aimag and Soum
officials meant an important source of
information was missed. As hunting is a locally
managed activity, it provides an ideal basis for
data collection. The ability to assess at this level
is critical to an accurate understanding of local
practices that in turn can provide a more solid
understanding of national trends.
While some sources were missed in this process,
the amount of information gathered was
nonetheless substantial. An organized approach
to key informant and stakeholder interviews was
essential. This approach provided important
validation of survey results, including
explanations that helped better understand and,
in some instances, directly support results
presented in this report. These additional sources
can be found throughout the report and are cited
accordingly.
Table 1. Sources of Information

33
Research Team In 2005, the desire for the wildlife trade survey to
cover the entire country, representing a vast
geographic area, required the necessary
participation of several organizations. Staff
members from more than 30 organizations
supported the effort at different research stages,
resulting in some degree of inevitable
discontinuity. For the most part, this included the
division of the training and some of the validation
efforts, as well data input and review.
The 2016 team was smaller than the team used in
2005, but its core members conducted the entire
survey from the design through to the data
collection and analysis. The 2016 team also
included more relevant specialist expertise than
2005. Along with biological expertise, team
members brought experience in the areas of law
and legal development, economics, international
trade, business promotion, research, survey
design and statistics, and data visualization. This
resulted in a more robust research design and
implementation, with all staff coordinated in the
effort, coherent in the process, with steps
implemented uniformly and evaluated by the
members, and documented following consistent
standards and methods.
The parties involved and their respective roles
were as follows:
The , acted as
the lead organization, and was involved in all
aspects of the project from strategic planning
through all phases of implementation. This
team included Mongolian Projects
Coordinator and Co-Project Lead, Nathan
Conaboy (general management, co-
authorship, and document review),
Munkhjargal Myagmar (conservation biologist
and technical specialist), Gombobaatar
Sundev (document review), and South and
Central Asian Programme Manager and Co-
Project Lead, Gitanjali Bhattacharya (co-
author and editor).
, as the lead investigation and
analysis team, included James Wingard
(research design, legal analysis, and report
drafting) Maria Pascual (research design,
statistics and data analysis, data
visualization, report drafting, and project
management), Amanda Rude (field interviews,
desk research, and report drafting) and
Abigail Houle (legal analysis, desk research,
and report drafting).
, as the field survey team including 25+
surveyors under the leadership of Dolgion
Aldar (Executive Director), Batsugar
Tsedendamba (Operations Director), Bold
Tsevegdorj (Consultant), Nyamkhorol Sainbat
(Research Manager) and Batsaikhan
Ulziibuyan (Senior Researcher). IRIM
participated in all stages of survey
implementation, including design, training of
surveyors, validation of research instruments,
survey logistics, data collection and data
cleaning, and reporting.
The following graphic illustrates the participation
of each of the organizations and their role as the
lead for the various tasks:
Figure 1. Research Team & Tasks
Concentrated training of those implementing the
various parts of the survey and research was
critical to the survey’s success. As in 2005,
training focused on initial sessions during which
lead surveyors were trained and then tasked with
training the remaining survey team. Training was
divided into two sessions coinciding with the
Household survey in May and Market surveys in
September. All training of trainers was conducted
in UB by combined team of experts from ZSL and
Legal Atlas.
For the Household survey, a total of five
facilitators participated during three days (May
13-14, 16) training seven facilitators from IRIM’s
core team. Subsequent training was conducted
with the remaining members of the survey teams
from May 18-19, including the participation of
eight facilitators from IRIM and 24 surveyor
candidates.
A similar format was used for the Market Survey,
with four facilitators from Legal Atlas and ZSL –
again training seven trainers from IRIM’s core
team. Four trainers from IRIM then conducted the
training of the rest of the market survey team.
Given the number of instruments and variability
in the market, training was divided into three
separate sessions. The first session focused on

34
Key Informant Interviews and Price Reports; the
second on market surveys of restaurants, travel
agencies, retail shops, and traditional medicine
shops. In a final session, all surveyors were
trained in the use of the Observation Sheet.
For both surveys, additional candidates were
trained than required for two reasons – firstly, to
eliminate candidates from the survey team that
did not appear capable of conducting the survey
and second, to have backup surveyors available if
required. All candidates were tested and
evaluated after the training sessions to determine
suitability for participation. For the Household
Survey, a total of 31 people received training, but
only 20 actually participated in the data
collection. In the Market Survey, from the initial
11 trainees, ten participated in its
implementation.
Unlike the 2005 survey, the follow-on sessions to
train all survey team members was accomplished
through the observation and input from those
involved in the research design and primary
training. This allowed the principal team to assess
the results of the entire training program.

35
Research Calendar The 2016 survey, including data analysis and
report writing took 12 months to complete. This
is roughly the same as the time taken in 2005.
However, there were major differences in the
research calendar reflecting a core
recommendation from the strategic assessment –
that each of the three survey types (household,
market, and stakeholder surveys) be divided into
separate efforts with individual development and
implementation calendars. There were three
primary reasons for this:
In the 2005 survey, all interviews
were conducted in the summer. This had a
clear impact on the market survey as the
majority of hunting occurs seasonally in the
fall. Direct observations of markets during
the summer season were necessarily limited
and therefore missed some forms of trade
and species that were hunted. Adjustments
were therefore made to the 2016 survey
design to schedule market surveys to begin in
September.
The annual Naadam
festival takes place each summer (July) in
Mongolia, and has a predictable impact on
most people’s availability. Adjusting the
stakeholder survey calendar to avoid this
event was crucial to ensure interviewee
availability. Furthermore, the national
parliamentary elections were also scheduled
for June 29th 2016. IRIM predicted that
elections would have a negative impact on the
willingness of the general public to
participate in the survey, given the increased
number of surveys commonly conducted
ahead of the elections. As a result the
household survey calendar was adjusted to
start in May and finish before the end of June
to account for these events.
For the market
surveys, field teams, in addition to gathering
targeted market data, were also trained to
collect anecdotal hunting information
through key informant interviews and
observation sheets. For the stakeholder
surveys, an entirely separate team was
assigned and equipped with instruments
tailored to the source and the needs of a
semi-structured interview.
Compared to 2005, the 2016 survey invested
significantly more time in developing a refined
research and analysis calendar. The survey effort
itself was spread over more months (3 months in
2005, compared to 4 months in 2016); although
the final analysis, drafting, and publication of the
report were completed in a similar length of time.
Figure 2. Research Calendar

36
Research Instruments One of the major lessons from the 2005 survey
was the need to diversify and improve the set of
research tools. This section describes the reasons
behind this need and includes detailed
descriptions of each instrument. Descriptions
have been organized under the three major
survey types – household, market, and
stakeholder surveys. There were three primary
reasons that lead to the diversification of
research instruments.
This was notable for the market surveys. In
2005, the survey tried to capture all market
data using a single ‘market survey’ sheet. This
proved to be cumbersome and resulted in
missed opportunities to better describe the
different types of markets and the wildlife
trade practices that are unique to them.
Although
enforcement had some impact on the 2005
survey, there was no real comparison to
conditions in 2016. A new and palpably more
stringent enforcement environment meant
that respondents in all surveys, not just the
market survey, were less receptive. The
biggest impact on survey design was in the
household survey. Respondent reluctance
required the use of a different survey
technique – the unmatched count technique
or UCT; a specialized survey method
employed when sensitive questions are likely
to result in lower than expected response
rates.
In 2016, the chances that the
standard surveys (household and market)
would result in incomplete information was
higher. It was therefore expected that key
informant and other stakeholder interviews
would play a significant role in the final
analysis. To support this increased effort,
specialized instruments were designed to
ensure that targeted information was
consistently sought during each of these
interviews.
For the 2016 survey, the research team designed a
set of 13 research instruments to better facilitate
the accurate and standardized collection of the
various types of qualitative and quantitative
information targeted. Figure 3 organizes each of
the survey instruments according to the three
types of survey targets – households,
stakeholders, and markets. Figure 4, on the
following page, lists all 13 instruments and
provides details on the sample size, instrument
type, survey duration time, and the specific
individuals or sectors targeted. The sections that
follow provide more information on the content
and application of each instrument.
Figure 3. Survey Instruments by Type
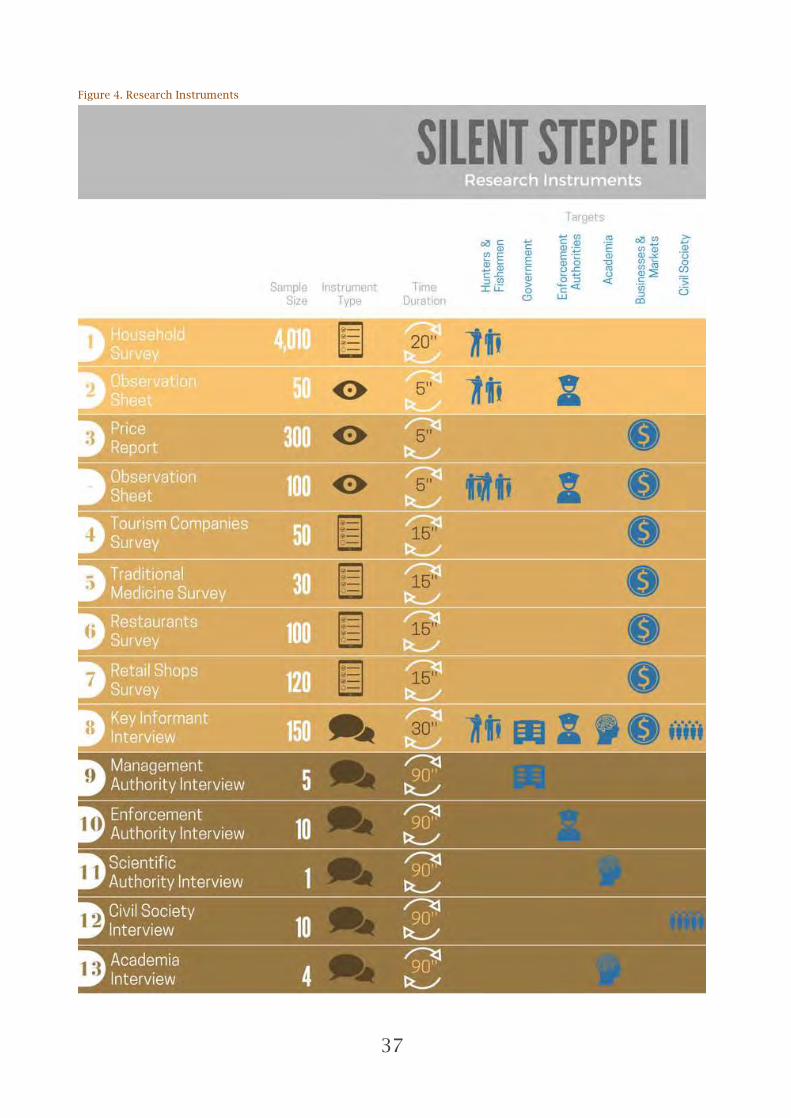
37
Figure 4. Research Instruments

38
Instrument Development For the development of each instrument, the
research team undertook several steps to assess
the 2005 instruments and results, making
recommended changes, and organizing the
results by survey type. Among the tasks
completed during this phase are the following:
For the household
and market surveys, all questions from 2005
and the corresponding results were reviewed
in detail to identify:
• low response rates - e.g., for some
questions only a handful of the
respondents answered, and it was not
expected this would change in 2016,
• unusable responses - e.g., when asking
about weights of meat, response rates
were high, but were so inconsistent that
they did not produce reliable information,
and
• poor accuracy in responses – e.g., in some
instances, the questions were confusing
and resulted in responses that were
inconsistent with the expected response.
Each instrument was assessed for its ability to
return usable responses to the initial set of
research questions. These initial questions
were then distributed among the instruments
to ensure this ‘best fit’ was implemented
throughout the survey instruments.
For the household
and market surveys, the use of digital
platforms made it possible to develop menu
choices for responses and thereby avoid open-
ended questions. This reduced data entry
mistakes, and improved data collection
efficiency as surveyors were not required to
write down responses. Options for answers
came from three sources: 1) the experience of
the team on the topic (e.g., the list of species in
trade); 2) the most common answers reported
in 2005 (e.g., vehicle types); and 3) the
Mongolian national socio-economic census
(e.g., responses for education level or
household income level).
Instrument Validation Validation of the household and market survey
instruments (instruments #1 to #8) was
conducted immediately after both training
sessions in May and August. No validation was
conducted for the stakeholder instruments (#9 to
#13). A total of 239 surveys were conducted to
test the comprehension, delivery, ease of use,
potential for confusion, as well as the adequacy of
the menu choices. This amount included 139
Household Surveys, 10 Observation Sheets, 5
Price Reports, 15 Tourism Company Surveys, 10
Traditional Medicine Surveys, 10 Restaurants
Surveys, 40 Retail Shop Surveys and 10 Key
Informant Interviews. As a result, minor
adjustments were implemented in the survey
where necessary. For each of the eight survey
types involved, the following additional steps
were implemented for validation:
– each instrument was evaluated
by the staff at ZSL and Legal Atlas and again
compared to the initial set of Research
Questions to assess whether the instruments
as designed would capture targeted
information.
– In a second stage, the questions
were translated into Mongolian and reviewed
by IRIM staff; first, to ensure that translations
were correct; and later, to evaluate the
questions for embedded errors that might
cause confusion among the respondents.
– After all questions had been
reviewed for face validity and translated, a
pilot test was run with a limited number of
respondents in two locations, including both
urban and rural settings. All trained surveyors
were involved and used the same system that
would be used during the actual survey.
– Using the
automatic reports generated by the data input
program, all surveyors that had participated in
the pilot discussed all aspects of the survey,
including the ease of use of menu items,
difficulties delivering any questions, issues
with data entry, etc.
– Only minor changes to the survey
were necessary to adjust the formulation of
some questions and the data entry process
dictated by the programming of the handheld
data entry survey tool.

39
Instruments Targeting Households Two instruments were used for research at the
household level: the Household Survey and the
Observation Sheet. The survey contains the
majority of the questions from the 2005 survey
incorporating the changes previously indicated,
one of the most significant being the introduction
of UCT questions (explained on pg. 39). Both the
Observation Sheet and the UCT questions are new
to the 2016 survey, created in response to the
heightened enforcement surrounding wildlife
trade, the associated risk that respondents would
not fully disclose information, and the need to
rely on anecdotal information and key
informants. Each instrument is described in the
following sections. Copies of the instruments can
be found in the Annex to this report.
HOUSEHOLD SURVEY The Household Survey acted as a principal
instrument in the 2005 survey and, while it was
coupled with a number of additional survey
instruments, it remained the focal point in 2016.
The reason for this is the well-documented role
Mongolia plays as a source country for its
domestic consumption of wildlife, as well as its
participation in international wildlife trade. In
this context, households and the individuals
within them are a major part of the trade chain,
acting both as suppliers and consumers.
Households and individuals, although part of the
same unit surveyed, are actually different target
populations. Including them within a single
survey has implications when defining a unique
sample size (that has to be based in the larger
population) and when realizing inference of
results (that has to be based in both populations).
Drawing upon the 2005 results, the 2016
household survey was directed explicitly at
households and individuals over 15 years old. A
total of 21 questions were divided into four major
areas covering take, trade, use, and purchase (see
Annex II).
Questions addressed to HOUSEHOLD units were
intended to capture the socio-economic
characteristics that might underlie trade,
including the size of the household, income
sources, and assets. Concerning use and trade,
the survey contained specific questions on
species, parts, uses, amounts, and prices to help
understand what parts of wildlife were being used
by the household and what part(s) sold, along
with information on any other wildlife species
that were being purchased at the market.
Questions addressed to INDIVIDUALS included
two sections; the first was general and directed at
all respondents. It recorded age, gender,
residency, and other traits suspected of playing a
role, including education, knowledge of wildlife
and related laws. The first set of questions also
included questions to capture perceptions on the
status of wildlife populations in Mongolia
compared with that of the past 5 and 10 years; as
well as the respondent’s opinion on the ability of
the government to combat wildlife crime. A list of
nine governmental measures (covering education,
legal, economic, and enforcement measures) was
presented to respondents asking for their opinion
on the ability of each measure to improve
conservation of Mongolia’s wildlife.
The second section of the survey was asked only
if respondents confirmed that they fished or
hunted during the 2015 season. If confirmed, the
survey inquired about species targeted, amounts,
and hunting and harvesting locations in the
previous year, as well as hunting experience,
ownership of hunting/fishing equipment, and
techniques used.
Unmatched Count Technique (UCT) Underreporting of illegal and sensitive behaviors
in surveys is an age-old problem that makes
accurate estimates of the prevalence of such
behavior difficult.39 The UCT40 is a survey method
designed to improve the number of true
responses to sensitive, uncomfortable, or self-
incriminating questions.41 Although it is still being
studied and improved upon, it is widely used, and
its effectiveness in eliciting truthful responses in
these circumstances is commonly reported.42 The
success of the method is based on its ability to
ensure the anonymity of the respondent and their
response. The analysis section describes how this
anonymity is achieved, but in brief, respondents
are randomly divided into case and control
39
Coutts, E. and B. Jann (2008). Sensitive Questions in Online
Surveys: Experimental Results for the Randomized Response Technique (RRT) and the Unmatched Count Technique (UCT). ETH Zurich Sociology Working Paper No. 3
40 Also known as: the list experiment, list count technique,
unmatched block design, block total response.
41 Raghavarao, D. and W. T. Federer (1979). Block Total Response as an Alternative to the Randomized Response Method in Surveys. Journal of the Royal Statistical Society, Series B. 41 (1): 40–45.
42 E.g., Tsuchiya, Hirai, and Ono 2007; Holbrook and Krosnick 2010; Coutts and Jann 2011.

40
groups.43 Both groups are presented a list of items
or statements and are requested to provide the
number of statements that are ‘true’ for them.
However, only a numeric response is obtained,
not which of the statements is ‘true’. The control
group is asked to respond to a shorter list of
statements, all of which are morally neutral, and
to which respondents will likely respond without
difficulty. The case group has one additional
statement in the list; the sensitive behavior the
survey is interested in capturing. The fact that
they do not have to reveal which questions they
have included in their numeric response results in
a greater number of truthful answers to the
sensitive question. The differing number of
statements in the list (e.g., 3 items in the control
group and 4 items in the case group) makes it
possible to mathematically estimate the number
of people that may have included the sensitive
item in their numeric answer.44 The method has
been used to survey in a variety of contexts from
racial prejudice,45 to drug use,46 and more recently
for wildlife trade.47
Figure 5. UCT Question #1; Illegal Method
Because it was suspected that the current
enforcement environment would result in
respondent reluctance to self-report hunting and
trade activities, the 2016 survey includes three
UCT questions. The survey team did not have
43
This division was also internal, with respondents not knowing
what group were they being allocated. Survey software was automatically assigning respondents to case or control group based on their odd or even order.
44 Although several approaches are being applied to conduct
this estimation, this research uses the most commonly used method: a simple difference-in-means estimator.
45 Kuklinski, J. H., Cobb, M. D., & Gilens, M. (1997). Racial
attitudes and the "new South". Journal of Politics, 59(2), 323-349.
46 Droitcour, Judith, et al. "The Item Count Technique as a
Method of Indirect Questioning: A Review of Its Development and a Case Study Application" in Measurement Errors in Surveys, by Paul P. Biemer et al. New York: John Wiley & Sons, Inc., 1991, pp. 185-210
47 Hinsley, A., A. Nuno, M. Ridout, F. St John, and D. Roberts
(2016). Estimating the Extent of CITES Noncompliance among Traders and End-Consumers; Lessons from the Global Orchid Trade. Conservation Letters, October 2016, 00(0), 1–8.
time to test this assumption empirically, but felt
confident in its estimation based on the fact that
the selected UCT questions were potentially
legally incriminating. Other project efforts and
interviews with stakeholders conducted prior to
the current survey indicated high degrees of
reluctance among target populations to openly
and truthfully answer these types of questions.
Figure 6. UCT Question #2; Illegal Equipment
For each set of UCT questions, the team created a
set of menu choices or items (ji) that respondents
could count to answer with a number ranging
from 0 to ‘j’, where ‘j’ is the total number of menu
items listed for the particular question set (j = Σji).
‘Control’ items included both high and low
prevalence statements48 to reduce the chance that
a respondent would agree with all or none of the
questions. 49 In such cases, the sensitive question
loses the protection afforded by the others,
reducing the likelihood of truthful responses. 50
Although, it is also considered good design to
have negatively associated statements51 to reduce
the variability of answers, the control set was not
designed with this in mind. The short season
available for the household surveys as dictated by
the upcoming elections, reduced the opportunity
to separately develop and test for negative
associations. In future efforts, this should be
introduced as it increases statistical efficiency,
reducing the overall number of surveys needed to
achieve reliable results.52
UCT questions #1 and #2 were implemented
together with the primary Household Survey.
These tested for two types of illicit hunting
48 Statements to which a high or low percentage of the
population is expected to respond in the affirmative.
49 Glynn, A.N. (2013). What can we learn with statistical truth
serum? Design and analysis of the list experiment. Public Opin. Quart., 77(S1), 159-172.
50 Hinsley et al, 2016; Droitcour et al. 1991.
51 Negatively associated statements are those that are not likely
to result in individuals that do both. In other words, a person that buys health food regularly is unlikely to eat fast food regularly and vice versa.
52 Glynn (2013).

41
behaviors suspected of being widely practiced:
shooting from vehicles and night lighting.
As these questions were only administered to
those in the previous
year, they did not account for the bias created by
reluctance to self-report this initial fact.
The first results of the household survey in the
summer showed a clear and abrupt decrease in
the number of respondents that claimed to hunt.
Whereas in 2005 almost 30% of the male
population over 15 years of age reported hunting
in the previous year, in 2016 this number
dropped to just 8%.53 Anecdotal information being
collected at the same time on the field, however,
suggested that this result was a significant
underrepresentation of reality.
For that reason, a third UCT question was
administered during the fall, this time targeting
hunting participation. Taking advantage of the
regular surveying activities conducted by IRIM,
this extra UCT question was included in an
unrelated, national survey in September 2016.
The sample size for this unrelated survey was
1,500, randomly selected at the national level, and
with a respondent profile including men and
women over 16 years of age. As it matched the
respondent profile and remit of the wildlife trade
survey, it presented a useful opportunity to
undertake an additional examination of
household survey results on hunting prevalence.
Figure 7. UCT Question #3; Hunting Prevalence
OBSERVATION SHEETS An Observation Sheet (see Annex III section) was
designed to allow the survey team to collect
qualitative information at the same time that
formal surveys were taking place. The level of
effort for each interview varied from a few
minutes (if no interaction ensued), to as much as
30 minutes. The same instrument was used in
both the household and market surveys.
53 199 out of 2,518 men over 15 years self-declared having hunt the previous year, a percentage of 7,903%
The goal was to gather additional anecdotal
evidence to provide background information,
personal stories, and images to be used as
examples of activities targeted in the survey. All
surveyors were trained to identify potential
wildlife trade related circumstances, including
unplanned encounters with rangers during their
drives across the countryside, talking with
fishermen near rivers and lakes, and engaging
individuals in discussion about openly displayed
furs or other wildlife products whether in public
or private settings.
The sheets were designed to capture small stories
and the form –in the electronic version- had the
capacity to upload up to five (5) images and
associated soft-copy documents, to record dates
and places, and to enter a brief story (less than
200 words) describing the scene witnessed or
discussed with the respondent.
Instruments Targeting Markets Early in the process of designing the 2016 market
survey methods, recommendations were made
that the 2005 surveys be fully revisited. While the
intent to preserve the cross-sectional aspect of
the survey remained, there was little in the prior
survey that would be affected by deeper changes.
Unlike the household surveys in the first Silent
Steppe report, the market surveys were
principally observational and did not result in a
dataset that could be statistically analyzed.
Without previous experience, the goal was to
document (albeit with some level of consistency)
what was being traded (species, parts, products),
to whom, at what prices and quantities, and
where. The approach was not expected to result
in numbers that could be extrapolated across all
markets for the country as a whole.
The 2005 market survey involved only two basic
instruments; one for restaurants and the other for
what was in fact a multiplicity of market types,
including wholesale markets, grocery stores,
containers shops, tourist markets, hospitals, and
clothing markets. Naturally, the kind of
information available depended entirely on the
market segment in question. Both instruments
were deliberately designed as broadly as possible
and in some instances purely as a way of
for potentially relevant information; e.g., who was
selling what in the container shops. To make it
possible to capture whatever might be seen or
heard, the data capture sheets were lengthy and
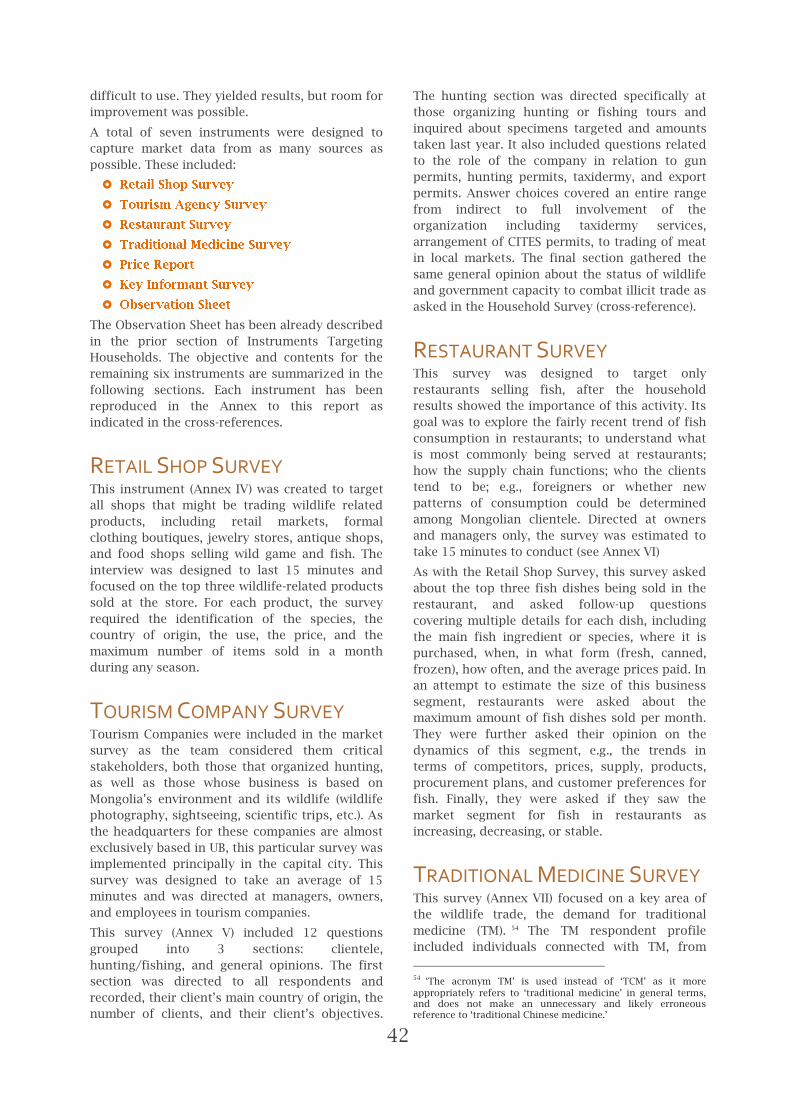
42
difficult to use. They yielded results, but room for
improvement was possible.
A total of seven instruments were designed to
capture market data from as many sources as
possible. These included:
The Observation Sheet has been already described
in the prior section of Instruments Targeting
Households. The objective and contents for the
remaining six instruments are summarized in the
following sections. Each instrument has been
reproduced in the Annex to this report as
indicated in the cross-references.
RETAIL SHOP SURVEY This instrument (Annex IV) was created to target
all shops that might be trading wildlife related
products, including retail markets, formal
clothing boutiques, jewelry stores, antique shops,
and food shops selling wild game and fish. The
interview was designed to last 15 minutes and
focused on the top three wildlife-related products
sold at the store. For each product, the survey
required the identification of the species, the
country of origin, the use, the price, and the
maximum number of items sold in a month
during any season.
TOURISM COMPANY SURVEY Tourism Companies were included in the market
survey as the team considered them critical
stakeholders, both those that organized hunting,
as well as those whose business is based on
Mongolia’s environment and its wildlife (wildlife
photography, sightseeing, scientific trips, etc.). As
the headquarters for these companies are almost
exclusively based in UB, this particular survey was
implemented principally in the capital city. This
survey was designed to take an average of 15
minutes and was directed at managers, owners,
and employees in tourism companies.
This survey (Annex V) included 12 questions
grouped into 3 sections: clientele,
hunting/fishing, and general opinions. The first
section was directed to all respondents and
recorded, their client’s main country of origin, the
number of clients, and their client’s objectives.
The hunting section was directed specifically at
those organizing hunting or fishing tours and
inquired about specimens targeted and amounts
taken last year. It also included questions related
to the role of the company in relation to gun
permits, hunting permits, taxidermy, and export
permits. Answer choices covered an entire range
from indirect to full involvement of the
organization including taxidermy services,
arrangement of CITES permits, to trading of meat
in local markets. The final section gathered the
same general opinion about the status of wildlife
and government capacity to combat illicit trade as
asked in the Household Survey (cross-reference).
RESTAURANT SURVEY This survey was designed to target only
restaurants selling fish, after the household
results showed the importance of this activity. Its
goal was to explore the fairly recent trend of fish
consumption in restaurants; to understand what
is most commonly being served at restaurants;
how the supply chain functions; who the clients
tend to be; e.g., foreigners or whether new
patterns of consumption could be determined
among Mongolian clientele. Directed at owners
and managers only, the survey was estimated to
take 15 minutes to conduct (see Annex VI)
As with the Retail Shop Survey, this survey asked
about the top three fish dishes being sold in the
restaurant, and asked follow-up questions
covering multiple details for each dish, including
the main fish ingredient or species, where it is
purchased, when, in what form (fresh, canned,
frozen), how often, and the average prices paid. In
an attempt to estimate the size of this business
segment, restaurants were asked about the
maximum amount of fish dishes sold per month.
They were further asked their opinion on the
dynamics of this segment, e.g., the trends in
terms of competitors, prices, supply, products,
procurement plans, and customer preferences for
fish. Finally, they were asked if they saw the
market segment for fish in restaurants as
increasing, decreasing, or stable.
TRADITIONAL MEDICINE SURVEY This survey (Annex VII) focused on a key area of
the wildlife trade, the demand for traditional
medicine (TM). 54 The TM respondent profile
included individuals connected with TM, from
54
‘The acronym TM’ is used instead of ‘TCM’ as it more
appropriately refers to ‘traditional medicine’ in general terms, and does not make an unnecessary and likely erroneous reference to ‘traditional Chinese medicine.’

43
workers of TM facilities, to patients using TM or
traders selling the products. Questions were
addressed generically to these individuals familiar
with TM to try to identify common products used
and traded in the respondent’s area. There were
not questions addressing the personal experience
of the respondent; i.e., their personal use of such
products. Each survey was designed to last
approximately 15 minutes.
The survey asked respondents to specify the
names and parts of wildlife most commonly used
in traditional medicine in their area of residence,
the medical uses, and information on the supply
chain (provider type and source aimag). Two final
questions were included in the survey. The first
inquired about consumer preference for
Mongolian or foreign products, with China
included as one of the responses due to the
presence of Chinese medicines in Mongolia. A
second question asked about the prevalence of
traditional medicine practices in the respondent’s
community to corroborate whether traditional
medicine still plays a significant role in the
wildlife trade in Mongolia.
PRICE REPORT This instrument (Annex VIII) was used by
surveyors to record prices of wildlife products
obtained in a single location (market/shop). The
species listed in the system were based on the list
of 62 species identified in Silent Steppe I, and not
limited to the species reported in the 2016
household surveys. The price for a particular
product was asked when considered safe and
appropriate, and later annotated (not in front of
the seller). The form allowed surveyors to
annotate prices in the terms provided by the
seller (for example by fur, by kg of meat, by the
entire animal, by article of clothing or jewelry,
etc.). This form was also used to document prices
found online in websites advertising Mongolian
wildlife products.
KEY INFORMANT QUESTIONNAIRE This questionnaire (Annex IX) was designed to
collect qualitative information faster than
stakeholder interviews (nevertheless, these
interviews lasted approximately 30 minutes).
Questions were designed to identify the main
areas of interest, and provided guiding questions
to help surveyors conduct the interview, whilst
allowing flexibility, depending on the type of
informant.
Areas of information targeted included
characterizing “what” was being taken and traded
in the area (specimens, their uses, the seasons),
“who” was involved (hunters, traders, processors,
clients, and enforcement officials), “how” the
species and products are taken (equipment,
methods), the economics of the trade (cost of
permits, fines, hunting cost, selling prices, profits
along the chain), the logistics (transportation
vehicles and roads, border crossing points,
storing facilities) and enforcement capacity and
activities (patrols, captures and seizures,
enforcement equipment, citizens cooperation,
etc.).
Instruments Targeting Stakeholders A total of four questionnaires were designed as
semi-structured interviews for key stakeholders.
They were used to guide the initial qualitative
field research by Legal Atlas staff in UB, as a part
of the effort to gather baseline information on the
topic. Each interview was expected to last 90
minutes on average. Questions targeted
information likely known by the stakeholder and
relevant to wildlife trade, including but not
limited to: governmental data and statistics,
previous reports and research, laws and
regulations, etc. Questionnaires were customized
to the profile of the different stakeholders
targeted, including:
(see Annex X)
(see Annex XI)
(see Annex XII)
(see Annex XIII)
Each of them identified sections of interest (such
as the economics of wildlife trade, conservation
issues, cross-border cooperation, etc.) and a
myriad of trigger questions within each section to
support specific lines of inquiry.

44
Sampling Design Silent Steppe II is the first complete cross-
sectional study of wildlife trade in Mongolia since
2005. In considering the methodology, the
strategy was to preserve as much as possible
from the original approach while overcoming
some of its shortcomings. For that reason, the
2016 study replicated two important aspects of
the household sampling design and data
collection, specifically: the sampling size and the
array of techniques used to identify households
to be surveyed (a combination of strata, linear
intersects, and random methods). There are,
however, some design differences both necessary
and desirable in the 2016 iteration. The following
section summarizes the main differences in
sample design for both survey types between the
first and the second edition.
Improving Household Sampling The 2005 survey planned for national coverage,
with an even sampling distribution across 21
aimags and UB. Actual survey implementation
was constrained by limitations in logistics and, as
a result, not all aimags were evenly surveyed,
resulting in over-representation of some aimags
and under-representation in others. In the end,
almost 70% of all surveys were collected from
only 7 aimags (Tov, Zavkhan, Dornogovi,
Khovsgol, Uvs, Uvurkhangai, Omnogovi) plus UB,
while the remaining 14 aimags provided only 30%
of the sample size.
Many of the aimags with higher levels of
biodiversity in terms of wildlife species, such as
Selenge, Khovd, Arkhangai, Dornod, Khentii, and
Govi-Altai were part of the under-represented
group. Within each aimag, some sample clusters
were instead dictated by convenience and not by
statistical design (i.e., the ability to reach certain
areas and the presence of partner
organizations). 55 When reviewing the correlation
between final sampling and aimag population,
important deviations also resulted from the
convenience criteria used. As an example, in
Dornogovi aimag 7 surveys were collected for
every 1,000 inhabitants while in Orkhon aimag
the ratio was just 0.1surveys/1,000 inhabitants.
All of these situations were throroughly disclosed
55 Wingard, J. and P. Zahler, 2006.
in the original report as weaknesses and potential
sources for bias in research results.
The goal of national survey coverage remained an
important objective in 2016, but, learning from
the past, an improved approach was designed to
better select geographical clusters, and collect a
data sample that might be better suited to
represent national behaviors. Sampling design is
therefore one of the principal differences between
the two studies. The 2016 survey followed a
multi-stage strata sampling design informed by
social, economic, and environmental criteria that
ignored convenience criteria entirely. This
provided a more robust set of data to analyze, as
is detailed in the following section.
Improving Market Survey Sampling Contrary to 2005, the selection of wildlife
markets in 2016 did not attempt to achieve
geographical representativeness. The deliberate
objective was instead to track trade points along
the wildlife value chain, including national
wholesale and retail trade, online (internet-based),
and international trade. These trade points are,
for the most part, known areas and do not occur
homogenously throughout the territory. Sampling
was thus based on established value chains for
wildlife.
Although the sample size for the market survey
finally dropped in quantity from 1,100 in 2005 to
850 in 2016, it increased in quality thanks to the
combination of market segments, customized
instruments, and the value chain approach in
sampling.
Household Sampling
SAMPLE SIZE In 2005, the sample size (n=4,010) was more a
result of the team’s inter-agency and ability to
collect surveys than the result of a statistical
computation. For populations over 100,000, as in
our case, a sample size around 400 is considered
already large enough to provide reasonable
statistical confidence. The margin of error (MOE;
also called confidence interval) and the
confidence level (α) are the two statistical
parameters that together describe that
confidence, or in other words how powerful a
sample is to describe the behavior of a
population. When sampling design is random, a

45
sample of 400 individuals provides a 5%
confidence interval56 and a 95% confidence level,57
both commonly accepted parameters in statistical
design.
When sampling design is not entirely random, as
is the case in this study, increasing sampling size
is a standard way to compensate biases. The 2005
sample was already 10 times larger than the
minimum required in random sampling studies.
When applying to it a sample size calculation
formula in reverse,58 we see that the 4,010 size
would provide a level of confidence of 99% and a
confidence interval of +/- 2%, in both cases much
higher than common standards when random
sampling is performed.
Sample size was therefore not altered in 2016,
trusting in the power of a large sample to
counterbalance the fact that pure random
sampling methods could not be applied, as
described in the following sections.
MULTI-STAGE STRATA SELECTION In considering the required sampling strategy and
Mongolia’s unique geographical conditions and
population density in Mongolia, the 2016
sampling design and data collection strategy
relied on the combination of three techniques
including stratification, linear intersection, and
random selection. The following sections detail
the different stages of the sampling selection for
the household survey.
Stage I: Aimag Selection The regional division of Mongolia in 21 aimags
and UB provided the foundation for the current
sampling design. These 22 strata were considered
to initially divide the country’s population. The
research budget was estimated to allow fieldwork
56 The confidence interval or margin of error (MOE) refers to the level of precision of a given result, meaning that a result of 21% for certain behavior within a sample should be inferred into a population as 21% +/- MOE. If our margin of error is 5%, that mean that behavior A can be estimated to be between 16 and 26% of the target population
57 The confidence level refers to how sure we are that the results
obtained through the sample are truly representing the entire
population. The confidence level is expressed as the probability
that the true population proportion for a given behavior is really
contained within the margin of error defined. The most
common confidence level used is 95%, meaning that a given
result (for example 16% to 26% percent for a behavior A has 95%
chances to be true. 58 n=(Zα)2 (σ) (1- σ)/MOE2 ; where “n” means Sample Size; “Z-
score” indicates the random variable of a normal distribution; “α” indicates confidence or significance level; “σ” means
standard deviation; and “MOE” means margin of error
in approximately 60% of the territory, requiring
selection of a maximum of 14 of the 22 strata.
Level one of the strata selection was not
conducted randomly. It was considered of
paramount importance that the selected strata
represent the various socio-economic and
ecological characteristics of the country.
Mongolia’s vastness and low population density
means that a random selection of strata would
result in bias by failing to account for parameters
that are highly connected to wildlife trade; e.g.,
household purchase power, or the species that
occur in the area. For this reason, the first step
was to identify indicators that would capture the
drivers of Mongolia’s wildlife trade and would
inform the selection process in this first stage.
In the end, five indicators were used to capture: 1)
key species coverage; 2) ecological zones; 3)
human population density; 4) GDP per capita; and
5) Competitive Index. For each of these five
criteria, values were obtained from official
statistical sources. Four of the criteria resulted in
numbers that could be categorized as high,
medium, and low and ranked accordingly. One
criterion (key species coverage) came in the form
of a map. Rather than estimate specific values
within the map, we used a simple
presence/absence indicator. The overall goal was
to ensure that sampling achieved the highest
degree of representativeness from all categories,
and that Aimags that were essentially the same or
similar to others, could be safely omitted. Details
on the indicators used are as follows:
– A total of 25 key
species were selected by the team based on
their known importance to hunting and trade
in Mongolia. 59 Then, using range and
distribution maps from the IUCN, 60 these 25
species were assigned to their corresponding
aimags or provinces. Through a basic
presence/absence matrix, the number of
species present in each aimag was calculated.
For example, a score of 5 meant that only 5 of
the key species are known to have range and
distribution in that particular aimag (e.g., in
Darkhan Uul); a score of 17 meant that 17 of
25 species are present (e.g., in Zavkhan, Uvs, or
Khovds). Finally, aimags were divided into
equal groups of high, medium, and low
presence of species.
59 Including Snow Leopard, Eurasian Otter, Dalmatian Pelican, Musk Deer, Mongolian Saiga, Moose, Reindeer, Beaver, Pheasant, Swan, Baikal Sturgeon, Wild Ass, Argali, Wild Boar, Red Deer, Siberian Ibex, Goitered Gazelle, Taimen, Gray Wolf, Saker Falcon, Siberian Marmot, Altai Marmot, Corsac Fox, Red Fox, Roe Deer
60 Available at http://maps.iucnredlist.org.

46
– Mongolia may not be high
in ecological diversity, but it is nevertheless
made up of distinct ecosystems that influence
a variety of factors of interest to this study,
including, most importantly, the species that
inhabit an area and their relative abundance.
Ecological zones were therefore used as an
additional criterion in this first stage of the
selection process. Ecological zones were based
on categories defined by The Nature
Conservancy (TNC) and included
alpine, taiga forest, forest-steppe,
steppe, semi-desert, and desert.61
A map of each of these zones was
overlayed with the administrative
divisions map of Mongolia to
ensure that sampling would be
representative of all ecological
zones.
– This
indicator was sourced from the
National Statistics Office from
Mongolia’s latest population
census in 2015, and measured
persons per km2 within each
aimag.62 The sampling distribution
sought to represent the
population distribution and for
that reason, this indicator was
used to divide aimags into high,
medium, and low density strata.
– This economic criterion
highlights the economic differences between
Mongolia’s aimags and their differing purchase
power. Some aimags have more than twice the
GDP per capita compared to others – as is the
case between Omnogovi at USD$7,694 USD
and Bayan-Olguii at USD$3,109 USD. Data for
this economic indicator was also sourced from
the National Statistics Office of Mongolia.63 It
was used to divide aimags (strata) between
high, medium, and low GDP.
– Economic activity is
directly tied to trade, and while there are no
empirical studies demonstrating links to illicit
trade based on this criterion alone, it was clear
from the 2005 survey and other observations,
61 Heiner, M., G. Davaa, J. Kiesecker, B. McKenney, J. Evans, T.
Enkhtsetseg, Z. Dash, U. Vanchindorj, O. Baast, S. Dolgorjav, G. Radnaabazar, E. (????) Identifying Conservation Priorities in the Face of Future Development: Applying Development by Design in the Grasslands of Mongolia. Available at https://www.nature.org/media/asia-pacific/east-mongolia-grasslands-ecoregional-assessment.pdf
62 National Statistics Office of Mongolia. Statistical Database (www.1212.mn)
63 National Statistics Office of Mongolia. Statistical Database (www.1212.mn)
that trade naturally centered in the markets
where economic activity was also high. To
ensure that these areas were not over or
under-sampled, it was decided to include
competitiveness as an additional selection
criteria.
As a result, UB and a total of 13 aimags were
ultimately selected as representative of the social,
economic, and environmental diversity of
Mongolia.
From Mongolia’s
, four
Aimags were included
(Uvs, Khovd, Zavkhan,
and Govi-Altai), and
only one excluded
(Bayan-Ölgii). This
aimag was excluded for
convenience. Lying in
the extreme west of the
country, access is
difficult and given the
time available, its
sampling was
considered both cost
and time prohibitive. Its
exclusion may introduce
some bias, however, as
it is the only aimag
where the range and
distribution of at least one key wildlife trade
species does not overlap with other aimags (the
Altai marmot or ). It is also the
only Aimag that is predominantly inhabited by
Mongolia’s minority Kazakh population. Hunting
methods in Kazakh communities are known to
differ from other Mongolian ethnic groups. They
are, for example, the only communities that
practice eagle hunting. It is not known whether
this has an impact on the variety of species
hunted and/or levels of trade. In other respects,
the Aimag is similar to several other areas; i.e., it
shares all of its ecological zones with at least six
other Aimags and it is close to the average in the
number of key species, in addition to the socio-
economic indicators.
From the , lying in the central and
western part of Mongolia and defined by the
Khangai Mountains, another four aimags were
selected (Övörkhangai, Arkhangai, Khövsgöl, and
Bayankhongor). From this region, again only one
Aimag was omitted, Bulgan. As a northern-
forested region with significant water resources,
Bulgan was considered substantially similar to
Khentii, Selenge, and Khövsgöl Aimags.
Table 2. Selected Aimags by Region
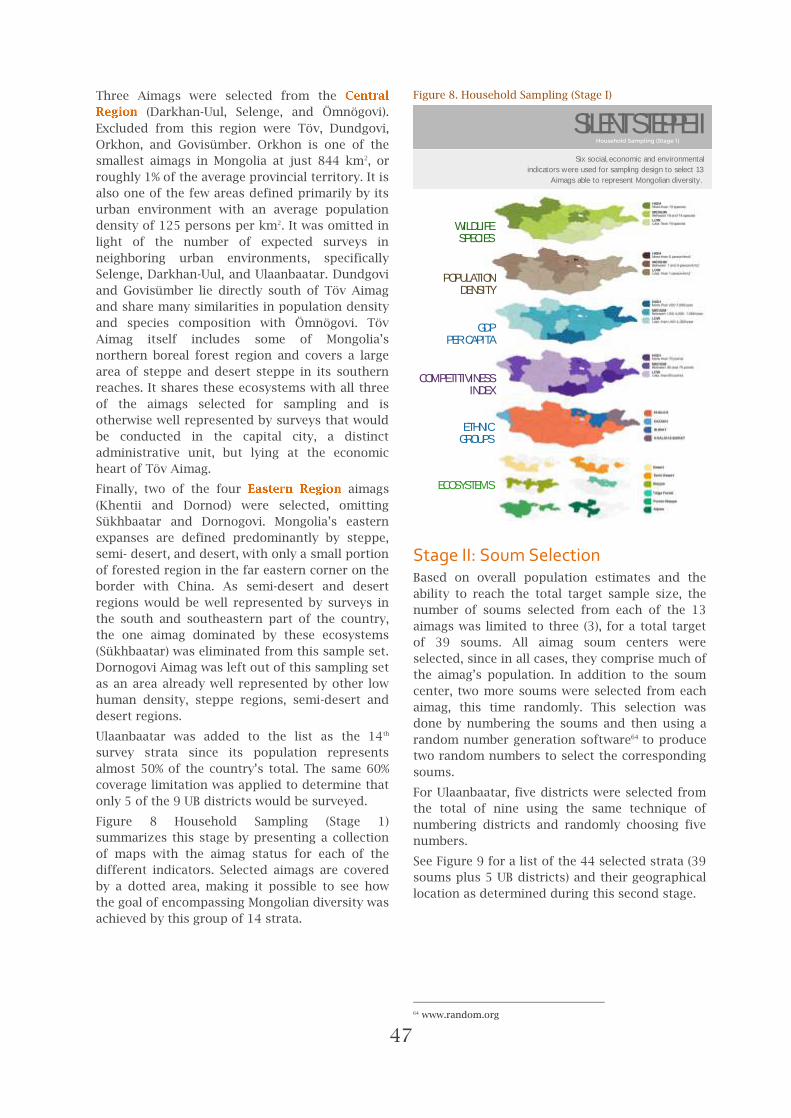
47
Three Aimags were selected from the
(Darkhan-Uul, Selenge, and Ömnögovi).
Excluded from this region were Töv, Dundgovi,
Orkhon, and Govisümber. Orkhon is one of the
smallest aimags in Mongolia at just 844 km2, or
roughly 1% of the average provincial territory. It is
also one of the few areas defined primarily by its
urban environment with an average population
density of 125 persons per km2. It was omitted in
light of the number of expected surveys in
neighboring urban environments, specifically
Selenge, Darkhan-Uul, and Ulaanbaatar. Dundgovi
and Govisümber lie directly south of Töv Aimag
and share many similarities in population density
and species composition with Ömnögovi. Töv
Aimag itself includes some of Mongolia’s
northern boreal forest region and covers a large
area of steppe and desert steppe in its southern
reaches. It shares these ecosystems with all three
of the aimags selected for sampling and is
otherwise well represented by surveys that would
be conducted in the capital city, a distinct
administrative unit, but lying at the economic
heart of Töv Aimag.
Finally, two of the four aimags
(Khentii and Dornod) were selected, omitting
Sükhbaatar and Dornogovi. Mongolia’s eastern
expanses are defined predominantly by steppe,
semi- desert, and desert, with only a small portion
of forested region in the far eastern corner on the
border with China. As semi-desert and desert
regions would be well represented by surveys in
the south and southeastern part of the country,
the one aimag dominated by these ecosystems
(Sükhbaatar) was eliminated from this sample set.
Dornogovi Aimag was left out of this sampling set
as an area already well represented by other low
human density, steppe regions, semi-desert and
desert regions.
Ulaanbaatar was added to the list as the 14th
survey strata since its population represents
almost 50% of the country’s total. The same 60%
coverage limitation was applied to determine that
only 5 of the 9 UB districts would be surveyed.
Figure 8 Household Sampling (Stage 1)
summarizes this stage by presenting a collection
of maps with the aimag status for each of the
different indicators. Selected aimags are covered
by a dotted area, making it possible to see how
the goal of encompassing Mongolian diversity was
achieved by this group of 14 strata.
Figure 8. Household Sampling (Stage I)
Stage II: Soum Selection Based on overall population estimates and the
ability to reach the total target sample size, the
number of soums selected from each of the 13
aimags was limited to three (3), for a total target
of 39 soums. All aimag soum centers were
selected, since in all cases, they comprise much of
the aimag’s population. In addition to the soum
center, two more soums were selected from each
aimag, this time randomly. This selection was
done by numbering the soums and then using a
random number generation software64 to produce
two random numbers to select the corresponding
soums.
For Ulaanbaatar, five districts were selected from
the total of nine using the same technique of
numbering districts and randomly choosing five
numbers.
See Figure 9 for a list of the 44 selected strata (39
soums plus 5 UB districts) and their geographical
location as determined during this second stage.
64 www.random.org
SILENT STEPPE II
POPULATION DENSITY
WILDLIFE SPECIES
GDP PER CAPITA
COMPETITIVINESS INDEX
ETHNIC GROUPS
ECOSYSTEMS
Six social, economic and environmental
indicators were used for sampling design to select 13
Aimags able to represent Mongolian diversity.

48
Figure 9. Household Sampling (Stage II)
SURVEY SAMPLING DISTRIBUTION With 44 survey areas identified (39 soums and 5
UB districts), the initial distribution of the 4,010
surveys within them was calculated based on
their relative proportion of the population, where
the aggregated population of all 44 survey areas
to be sampled (835,851 persons) represented
100%. Population figures for each Aimag were
taken from the 2015 Mongolia official census.65
While Figure 9 provides the specific distribution
of the sample among the 44 survey units, Table 3
presents an example of how this distribution was
calculated for one survey unit (Unit #42).
Table 3. Example of sampling distribution (A)
Once the survey area was proportionally
distributed among the survey units, a secondary
sample distribution was calculated for each unit
to be sampled to account for differences between
rural and urban populations within each area. In
65 National Statistics Office of Mongolia. Mongolian Statistical Information Service. Available at www.1212.mn/en
this step, it was not necessary to conduct the
same calculation for districts in Ulaanbaatar,
since the entire population is considered non-
rural. Mongolia’s 2015 official census data was
again used as a source for population data. The
same unit #42 is used to give an example of this
step in Table 4.
Table 4. Example of sampling distribution (B)
Sampling for Market Instruments Research into Mongolia’s wildlife markets was
designed with a strong qualitative component.
Apart from gathering quantitative data on wildlife
trade prices to estimate economic values within
the value chain, there were key questions about
the actors and procedures of the value chain that
required qualitative investigation. Some of these
queries, formulated in the first stage (see
Research Questions) revolved around the profile
of the actors in the wildlife trade chain, the
specific procedures for transporting, storing and
smuggling wildlife, and the preference of
Mongolian consumers for wildlife based products.
Based on these research needs, markets were
targeted through a suite of seven quantitative and
qualitative instruments, none of which were
intended to obtain statistical representativeness.
Based on these objectives, the selection of survey
areas was neither random nor driven by statistics.
Instead, it was focused on the need to observe
wildlife trade along its value chain with the
understanding that trade does not occur
homogenously throughout the country. Trade
generally, including wildlife trade, occurs
principally in or near Mongolia’s urban centers.
This is especially true for segments such as
tourism companies or restaurants selling wildlife,
most of which are highly concentrated in UB.
Additionally, wildlife trade in particular has a
strong international component with Mongolia
acting as a source country for China and Russia.
Survey Unit #42 at Uliastai Soum (ZAVKHAN Aimag)
POPULATION SAMPLE
Survey Unit
PopulationNi 15,679 75 n i
Survey Unit
Sample
Total Survey Units
PopulationN=Σ N i 835,851 4,010 n=Σ ni
Total Survey Units
Sample
% Ni /N 1.876% 1.876% n i/n %
Survey Unit #42 at Uliastai Soum (ZAVKHAN Aimag)
POPULATION SAMPLE
Survey Unit
PopulationNi 15,679 75 n i
Survey Unit
Sample
Survey Unit
Urban PopulationNi(u) 3,606 17 n i(u)
Survey Unit
Urban Sample
% Ni(u) / Ni 23% 23% n i(u)/n i %
Survey Unit
Rural PopulationNi(r) 12,073 58 n i(r)
Survey Unit
Rural Sample
% Ni(r) / Ni 77% 77% n i(r)/ni %
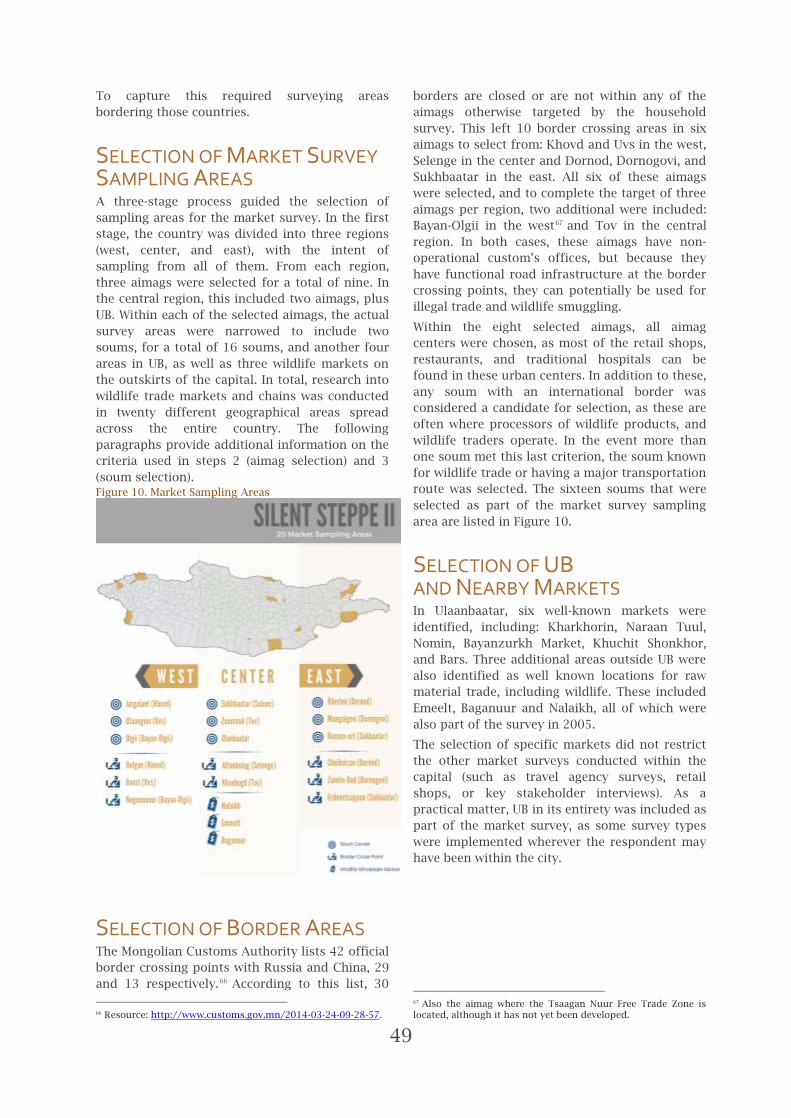
49
To capture this required surveying areas
bordering those countries.
SELECTION OF MARKET SURVEY SAMPLING AREAS A three-stage process guided the selection of
sampling areas for the market survey. In the first
stage, the country was divided into three regions
(west, center, and east), with the intent of
sampling from all of them. From each region,
three aimags were selected for a total of nine. In
the central region, this included two aimags, plus
UB. Within each of the selected aimags, the actual
survey areas were narrowed to include two
soums, for a total of 16 soums, and another four
areas in UB, as well as three wildlife markets on
the outskirts of the capital. In total, research into
wildlife trade markets and chains was conducted
in twenty different geographical areas spread
across the entire country. The following
paragraphs provide additional information on the
criteria used in steps 2 (aimag selection) and 3
(soum selection).
Figure 10. Market Sampling Areas
SELECTION OF BORDER AREAS The Mongolian Customs Authority lists 42 official
border crossing points with Russia and China, 29
and 13 respectively. 66 According to this list, 30
66 Resource: http://www.customs.gov.mn/2014-03-24-09-28-57.
borders are closed or are not within any of the
aimags otherwise targeted by the household
survey. This left 10 border crossing areas in six
aimags to select from: Khovd and Uvs in the west,
Selenge in the center and Dornod, Dornogovi, and
Sukhbaatar in the east. All six of these aimags
were selected, and to complete the target of three
aimags per region, two additional were included:
Bayan-Olgii in the west67 and Tov in the central
region. In both cases, these aimags have non-
operational custom’s offices, but because they
have functional road infrastructure at the border
crossing points, they can potentially be used for
illegal trade and wildlife smuggling.
Within the eight selected aimags, all aimag
centers were chosen, as most of the retail shops,
restaurants, and traditional hospitals can be
found in these urban centers. In addition to these,
any soum with an international border was
considered a candidate for selection, as these are
often where processors of wildlife products, and
wildlife traders operate. In the event more than
one soum met this last criterion, the soum known
for wildlife trade or having a major transportation
route was selected. The sixteen soums that were
selected as part of the market survey sampling
area are listed in Figure 10.
SELECTION OF UB AND NEARBY MARKETS In Ulaanbaatar, six well-known markets were
identified, including: Kharkhorin, Naraan Tuul,
Nomin, Bayanzurkh Market, Khuchit Shonkhor,
and Bars. Three additional areas outside UB were
also identified as well known locations for raw
material trade, including wildlife. These included
Emeelt, Baganuur and Nalaikh, all of which were
also part of the survey in 2005.
The selection of specific markets did not restrict
the other market surveys conducted within the
capital (such as travel agency surveys, retail
shops, or key stakeholder interviews). As a
practical matter, UB in its entirety was included as
part of the market survey, as some survey types
were implemented wherever the respondent may
have been within the city.
67 Also the aimag where the Tsaagan Nuur Free Trade Zone is located, although it has not yet been developed.

50
MARKET POPULATION AND SAMPLE SIZE
STEP 1: Estimating Market Population Estimating the market population for each of the
targeted market segments required collecting
data from a variety of sources,68 including calls to
Aimag governor’s offices, personal visits, online
research, and a review of the national phone
directory. Statistics for Ulaanbaatar city were
collected from websites69 and the national phone
directory. The aggregated result is presented in
Figure 11.
Figure 11. Market Sample Size
STEP 2: Sample Size Definition Within the 20 selected sampling areas, it was
possible to identify the existence of 17 wildlife
markets, 56 tour operators, 9 traditional medicine
hospitals, 103 restaurants, 90 retail shops, and
200 key informants. Even though they are
estimations, the provided sufficient insight to
define sampling goals for each of the market
research instruments.
As Figure 11 shows, sample targets were defined
at 400 observations in wholesale markets
(including 300 Price Reports and 100 Observation
Sheets) and 30 doctors and patients of the TM
hospitals. For the remaining instruments, the goal
was to try to encompass the entire market
estimated to exist in the 20 sampling areas: 50
surveys for travel agencies, 100 for restaurants,
and 120 for retail shops selling wildlife. 70
68 www.touristinfocenter.mn, http://tugeene.mn, www.ikon.mn, and websites of governmental aimags.
69 Such as http://www.touristinfocenter.mn, www.ikon.mn.
70 In the case of the retail shops, the estimated population
considered to be under estimating informal retail shops that were not appearing in directories and other sources used. For that reason, sample size is bigger than the estimated population.
Additionally, it included a target of 150 key
informants.
Combining all instruments, the total sample size
for market research was 850. This represents 250
observations less than was obtained in 2005
(1,100 market surveys). However the
segmentation of both the population surveyed
and the refined research instruments used,
compensated for these fewer observations,
providing a larger set of valid data for analysis.
STEP 3: Assigning Sample Size to Areas Following these national level targets, sub-targets
for each sample area were calculated to account
for the major concentration of respondents in UB.
Some cases were clear, like the tourism company
segment, all of which are headquartered in the
capital. For this instrument, the entire sample
size (50 surveys) was assigned to UB. For the
remaining instruments, UB and its outlying
markets were allocated between 40% and 70% of
the sample target size, depending on the
segment, with the 16 remaining soums being
assigned a sample size of the remaining portion,
equally distributed.
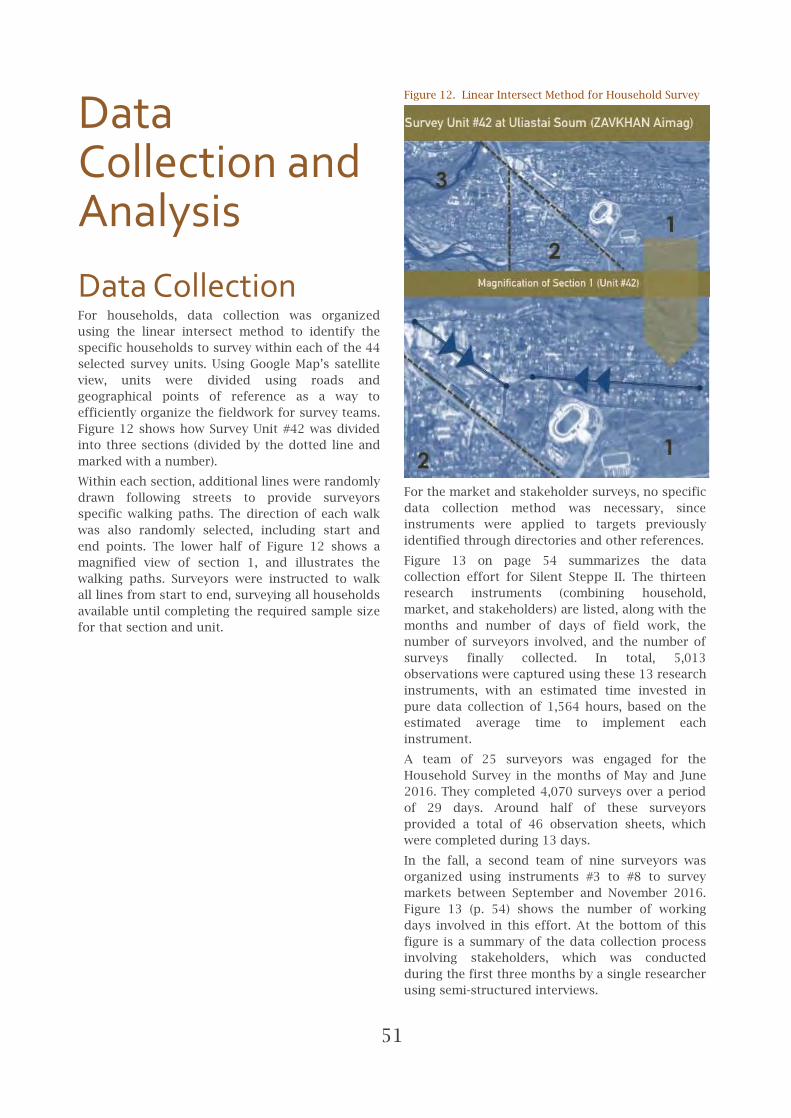
51
Data Collection and Analysis
Data Collection For households, data collection was organized
using the linear intersect method to identify the
specific households to survey within each of the 44
selected survey units. Using Google Map’s satellite
view, units were divided using roads and
geographical points of reference as a way to
efficiently organize the fieldwork for survey teams.
Figure 12 shows how Survey Unit #42 was divided
into three sections (divided by the dotted line and
marked with a number).
Within each section, additional lines were randomly
drawn following streets to provide surveyors
specific walking paths. The direction of each walk
was also randomly selected, including start and
end points. The lower half of Figure 12 shows a
magnified view of section 1, and illustrates the
walking paths. Surveyors were instructed to walk
all lines from start to end, surveying all households
available until completing the required sample size
for that section and unit.
Figure 12. Linear Intersect Method for Household Survey
For the market and stakeholder surveys, no specific
data collection method was necessary, since
instruments were applied to targets previously
identified through directories and other references.
Figure 13 on page 54 summarizes the data
collection effort for Silent Steppe II. The thirteen
research instruments (combining household,
market, and stakeholders) are listed, along with the
months and number of days of field work, the
number of surveyors involved, and the number of
surveys finally collected. In total, 5,013
observations were captured using these 13 research
instruments, with an estimated time invested in
pure data collection of 1,564 hours, based on the
estimated average time to implement each
instrument.
A team of 25 surveyors was engaged for the
Household Survey in the months of May and June
2016. They completed 4,070 surveys over a period
of 29 days. Around half of these surveyors
provided a total of 46 observation sheets, which
were completed during 13 days.
In the fall, a second team of nine surveyors was
organized using instruments #3 to #8 to survey
markets between September and November 2016.
Figure 13 (p. 54) shows the number of working
days involved in this effort. At the bottom of this
figure is a summary of the data collection process
involving stakeholders, which was conducted
during the first three months by a single researcher
using semi-structured interviews.

52
The main challenge for collecting information on
illegal wildlife trade was the clandestine
atmosphere surrounding it, caused in part by
heightened enforcement in recent years. This new
environment, contrary to the one experienced
during the first study, limited both the readiness
and openness of respondents to collaborate, and
also the possibility for surveyors to directly
observe illegal wildlife trade. At the household
level, UCT questions incorporated in the survey
confirmed that respondents did not always
respond truthful to sensitive questions. For market
surveys, two of the targeted segments directly
refused to participate with surveyors. This was also
the case for all hunting associations and all tourism
companies (except for one) that organize hunting
and fishing tours. Phone contacts and visits to
share the official letter from MoE backing the
survey did not overcome a general lack of trust.
Also, many officers related stories of illegal trade
occurring at night or in secret areas. It is therefore
possible, and likely, that the few direct
observations collected by surveyors during their
fieldtrips (through the Observation Sheets and
Price Reports) were only a glimpse of reality.
Logistical challenges also played a role in the
survey team’s ability to conduct key informant
interviews with custom officers and soum rangers.
It was not uncommon for staff to be absent from
the office when contacted by the survey team, but
to be otherwise engaged in field inspections. In
other instances, the complete replacement of field
teams meant that staff did not yet have the
experience or information to provide detailed
answers. Nevertheless, the sample was sufficiently
large (150 interviews completed), and deemed
successful in engaging enforcement personnel
across all agencies involved in wildlife issues.
Data Quality Control In comparison to the previous report, assuring
quality data was collected during research was
dramatically improved through the use of basic
information technologies. The first advantage was
the possibility to reduce data entry mistakes
through the use of closed menu choices and pre-
defined question flows in the questionnaires. Since
electronic devices automatically recorded
interviews, it was easy to recall the original answer
if a particular response raised any concern. Geo-
location of surveys and pictures provided a strong
cross-verification mechanism to reduce the
possibility of fake respondent data. Additionally,
phone numbers were collected for household
survey respondents and random follow-up calls
were conducted to confirm not only their
participation in the survey, but also a selection of
key questions. A quality assurance team member in
UB was able to remotely access all data collected
during fieldwork, and store it online. This made it
possible to react quickly to any data collection
problems. As a result, few instruments (less than
10 instruments or 0.2% of the total) from the entire
sample were invalidated.
Data Analysis After collection and quality control, data went
through a variety of analyses to ensure that results
were as reliable as possible. In some instances,
however, low response rates prevented full
extrapolation of data. This is noted in the text
wherever it applies.
ASSESSMENT OF DATA In the research team’s assessment, the accuracy of
the 2016 survey results has been affected primarily
by low response rates among those that engage in
wildlife harvests, whether as hunters or fishers.
This particular issue, and the use of the UCT is
fully discussed previously in this Chapter, and
again in Chapter V. In addition, other limitations in
the study both for the Household and Market
surveys are outlined in the following paragraphs.
Household and Market Surveys In general, the design and implementation of the
2016 survey was substantially more rigorous than
its predecessor. That said, the advances that saved
time and improved results in some areas have also
never been applied and tested in this context.
1. The sampling design included several selection
tools designed to ensure representativeness of
the survey, but which may or may not
introduce some level of bias. These are:
a. the use of Competitiveness Index (CI) as an
indicator of a given region’s general well-
being and economic status. The CI is a
broad concept that measures numerous
factors that have an impact on conducting
business. It does not, however, measure
pure economic factors and therefore may
hide important economic realities, in
particular those related to strong, but illicit
economies.
b. the reliance on presence/absence for
several criteria. For example, the sampling
design intended to ensure that species
were well represented by the selected

53
areas. Aimags were considered, however,
they were based only on whether species
occurred at all within their territory. A
more refined estimate of presence may
have helped; i.e., X aimag has X% of the
distribution of X species. The same is true
for other criteria used in the selection
process.
c. the particular combination of criteria used
in the sampling design has not been tested
in other studies. In the end, the sampling
design and the sample size were both
robust enough to at least mitigate against
any bias that may been introduced by the
preceding.
2. Both the Household and Market surveys relied
on respondent recall, which has the potential
to introduce some bias. As was true in 2005,
the present survey has no access to
independent records that would allow for
comparisons. The UCT estimates that there was
clearly a large degree of underreporting, and
this certainly introduces error to the estimates
of hunters, take, and trade levels. Unlike 2005,
this survey invested significantly in meeting
with key informants to independently test the
validity of survey results.
3. The limitation of the UCT to overcome some
knowledge gaps. The UCT method is useful
when testing for the prevalence of a particular
behavior. It is difficult to use if the goal is to
also solicit more detailed information about a
particular illicit behavior. In other words, the
survey was able to determine how many people
are likely engaged in wildlife harvests. It could
not be used to then question those individuals
about their hunting and fishing behaviors.
4. The timing of the survey. In 2005, the summer
surveys lacked seasonal representativeness.
This time, only the household survey was
implemented during the summer. However, it
coincided with Mongolia’s national elections.
The survey was able to avoid the actual election
itself, but it is known that elections have an
impact on respondent willingness to take part
in a survey. This likely introduced some
measure of bias.
5. No observations of night trading. This is a new
form of trade that was only reported during
the key informant interviews. The survey has
no direct observations or other anecdotal
information to offer.
6. The singular focus on restaurants that offer
fish. In one part of the Market survey, the focus
was exclusively on fish. Surveyors nonetheless
recorded some anecdotal information that
some wildlife (e.g., gazelle) may be used as a
substitute for other red meats.
7. The missing respondents. Hunting
organizations were noticeably absent and could
have provided valuable insight into hunting.
However, these organizations are supposedly
limited to hunting trophy animals, so it’s
possible they may lack knowledge on the
remainder of the market.

54
Figure 13. Data Collection

CHAPTER III
The Bigger
Picture

56
International Trade is a Primary Driver Mongolia does not generate all of the demand
for its own wildlife; nor is it a major destination
for wildlife products from other countries. It is,
however, a part of global and regional trade
flows. Understanding the dynamics of this trade
is a starting point for understanding Mongolia’s
role in and vulnerability to the largely hidden
and under regulated nature of wildlife trade
markets. While a domestic market for wildlife
trade is certainly a factor in Mongolia, both the
2005 and 2016 surveys indicate that a large
portion is either directly or indirectly intended
for the international market.
Discussed briefly in Chapter I. The Setting,
wildlife trade (whether illegal or simply
unregulated) is a global problem not unique to
any one country or limited to the few species
receiving the most press coverage – elephants,
rhinos, tigers, and more recently pangolins.
Estimating the scale of this trade is incredibly
difficult, but a commonly accepted assessment is
that “wildlife trade involves hundreds of millions
of individual plants and animals from tens of
thousands of species.”71 Virtually every place on
the planet is implicated and it includes species
and uses that most of us have never heard of –
to name only a few: helmeted hornbills, whose
beaks are traded for their ‘red ivory’ used in
small carvings and decorative pieces; pittas,
birds from Southeast Asia sold in the pet trade;72
slow loris, a small mammal, also from Southeast
Asia and sold for the pet trade; and giant clams,
sold for carvings and as aquarium ornamentals.
Examples from Mongolia include the Saiga
antelope, whose horn is sold for its purported
medicinal properties; gray wolves, sold whole
and frozen to Chinese buyers, but also in
71
TRAFFIC, Background: Trade, http://www.traffic.org/trade/.
72 Shepherd, C., Eaton, J., & Chng, S. C. L. Pittas for Pittance: Observations on the Little Known Illegal Trade in Pittadae in West Indonesia, BirdingASIA 24(2015): 18-20, available at http://www.traffic.org/home/2016/2/17/indonesias-little-known-pitta-trade.html.
individual parts, e.g., ankle bones and teeth; and
musk deer, well known in wildlife trade for its
musk gland for the perfume and medicinal use,
but less well known as yet another source of
ivory from its unique tusks.
Wildlife trade is diversified, can happen in high
volumes, often travels long distances, and has
immense value. In 2016, for example, Peru
seized 8 million dried seahorses valued at
almost USD $5 million and bound for Asia on a
Chinese-flagged vessel. 73 In the same year in
Hong Kong, officials confiscated four tons of
pangolin scales, labeled as ‘sliced plastic.’
Shipped from Cameroon, this one transaction
represented as many as 6,600 individual animals
and was worth $1.25 million. 74 Rhino horn,
another high value wildlife product used as an
aphrodisiac in Asia, is worth roughly 1.5 times
its weight in gold. 75 A single rhino horn,
averaging 1.5-3.0 kilos, can be worth as much as
$65,000.76
Mongolia has similarly high value wildlife. Its
brown bear is a source for bear gallbladders that
can fetch up to several thousand dollars (sold
whole) in some markets in Asia; they are almost
$200 per gram in powder form, 77 which
translates to $200,000 per kilo. The report
documenting these prices, also found bear
gallbladder product in South Korean markets
labeled as coming from Mongolia. Saker falcons
in demand in the Arab states of the Persian Gulf
are trafficked in the thousands and sourced
throughout their range in Central Asia, including
Mongolia, and can bring as much as USD $25,000
each.78 For rare specimens, these sums can be
more than double, as reported in 2014 in a
transaction in Saudi Arabia.79
73 ABC News Australia, Peru Seizes 8 Million Seahorses Illegally Bound for Asia On Chinese-Flagged Vessel, (Jun. 22, 2016) http://www.abc.net.au/news/2016-06-22/peru-seizes-8-million-seahorses-illegally-bound-for-asia/7531550.
74 Actman, Jani, Smuggled Pangolin Scales, National Geographic: Wildlife Watch (Jun. 26, 2016), http://news.nationalgeographic.com/2016/06/pangolin-scales-smuggling-hong-kong/.
75 Harper, Jennifer. $60K a Pound: Illegal Rhino Horn Now Declared More Valuable than Gold, Diamonds, and Cocaine, Washington Times (May 2015). http://www.washingtontimes.com/news/2015/may/17/rhino-horn-considered-cure-all-and-aphrodesiac-now/
76 Prices of Exotic Animals and Wildlife. Harvoscope Global Black Market Information.
77 Foley, K., Stengel, C., & Shepherd, C., Pills, Powders, Vials, and Flakes: The Bear Bile Trade in Asia, TRAFFIC Southeast Asia Report (2011).
78 https://www.forbes.com/sites/guymartin/2015/12/30/the-250000-bird-falcon-hunting-in-qatar/#3465b0e34bc1. (Retrieved on May 17th, 2017).
79 A rare saker falcon was sold for SR 210,000 in Saudi Arabia, equivalent to approximately USD 56,000.

57
There are many more examples, but these few
already underscore the high values and long
distances traveled as trade crosses from source
countries in South America, Africa, and Central
Asia to enter markets in the Middle East, Asia,
Europe, and North America. Wildlife trade (when
combined with timber trafficking and illegal
fishing),80 is currently considered one of the top
five illicit markets in the world worth up to
USD$20+ billion or more annually.81
Despite increasing attention by enforcement
authorities, international wildlife trade remains a
major and increasing threat to many species. A
global marketplace fueled by: growing
economies and populations; advanced and highly
connected transportation networks; speculation
on the potential extinction of species by private
investors; 82 and increasingly efficient harvest
technologies; wildlife trade today has the
potential to drive the loss of more species and at
rates never before witnessed.
While there are other threats to Mongolia’s
wildlife (e.g., linear infrastructure, 83 climate
change, habitat loss, etc.), the single largest
threat arguably comes from its role in the
international market as a supplier of wildlife
products. Sandwiched between two major
economies (Russia and China) and far from any
ports, Mongolia finds its foreign trade
dominated by these two neighbors, their
markets, and political interests; a fact it
recognizes and a relationship it seeks to improve
upon. Mongolia’s stated goal is to “double trade
with China and quintuple it with Russia, growing
each to $10bn a year by 2020.”84 Among other
measures, this has included the promulgation of
pro-business legislation (in 2013); and new bi-
lateral trade deals with both Russia and China
(in 2014).85 In terms of exports, the country does
http://www.arabnews.com/offbeat/news/651846. Retrieved on May 17, 2017.
80 UNODC, Estimating Illicit Financial Flows Resulting From Drug Trafficking and Other Transnational Organized Crimes, Oct. 2011 (38). https://www.unodc.org/documents/data-and-analysis/Studies/Illicit_financial_flows_2011_web.pdf.
81 Haken, Jeremy, Global Financial Integrity, Transnational Crime in the Developing World, February 2011 (11) http://www.gfintegrity.org/storage/gfip/documents/reports/transcrime/gfi_transnational_crime_web.pdf.
82 Platt, J. (2016). China’s Wealthy Are Banking on Extinction. Participant Media.
83 Wingard, J. et. al. (2014).
84 Oxford Business Group. Mongolia builds new partnerships in trade and investment, with China and Russia and beyond. Accessed online at https://www.oxfordbusinessgroup.com/overview/mongolia-builds-new-partnerships-trade-and-investment-china-and-russia-and-beyond-0.
85 Mongolia has, for example, signed 15 bilateral agreements with Russia and 26 with China. Oxford Business Group.
not have a wide variety of resources to offer,86
but exports nonetheless account for 50% of
GDP,87 while the world average is closer to 30%).88
Most of its exports are dedicated to supplying
one of its neighbors, China, which accounts for
79% of all export trade in 2016). 89 Mongolia’s
import market is also high (34%) and similarly
dominated by the same trading partners90 Figure
1 shows the distribution of Mongolia’s combined
imports and exports among its trade partners,
with China and Russia representing 71% of total
trade and six other partners comprising another
18%.91 The dominance of international trade in
its economy creates the opportunity to
participate in licit and illicit international wildlife
markets.
Mongolia builds new partnerships in trade and investment, with China and Russia and beyond.
86 In 2013, coal and copper represented 26.1% and 22.2% of mineral exports respectively, with mineral export accounting for 28% of GDP. Other exports included iron ore (15.3%); crude oil (12.1%); and gold (7.3%).
87 Total Exports for Mongolia amounted 4.917 Billion USD for 2016, half of its GDP for that same year, amounting 9.878 Billion USD. Source: Mongolian Statistical Information System (www.1212.mn).
88 World Integrated Trade Solution. The World Bank. www.wits.worldbank.org (Retrieved on April 20, 2017)
89 In 2016, Mongolia traded with many countries, but almost 80% of all trade was with neighbor China (79%) and Russia (11%). The remaining major trading partners are the UK (9%), the US and South Korea (both at 5%), and Japan (4%). WTO (2014).
90 Mongolian Statistical Information System (www.1212.mn).
91 The total value of Trade of Merchandises for Mongolia was USD 8.275 billions for 2016 (including USD 4.917B in Exports and USD 3.357B in Imports). The Top Trade Partners for 2016 were China (USD 4.926B or 60% of the total), Russia (USD 0.936B or 11% of the total), UK (USD 0.585B for 7% or the total), Japan (USD 0.344B or 4% of the total, Switzerland (USD 0.240B or 3% of the total), Republic of Korea (USD 0.206B or 2% of the total) and Germany (USD 0.163B or 2% of the total). The remaining 10% is trade with Other Partners. Source: Mongolian Statistical Information System (www.1212.mn).

58
Figure 1. Mongolia’s Top Trade Partners, 2016 (for all merchandise, including imports and exports)
China’s Influence The increase in wealth and incomes of the
middle class in Mongolia’s southern neighbor,
China, have created a seemingly inexhaustible
demand for wildlife products pushing illegal
trafficking to new levels. Goods, once considered
luxury items and reserved for the few, are now
within the purchasing power of the many,
spanning everything from art pieces, to exotic
pets, food items, and traditional medicine
products. The proximity of the dynamic Chinese
market and the vast borders that separate both
countries makes Mongolia an easy target for
illicit wildlife exports. According to reports and
officials interviewed in this survey, there is a
direct connection between increased diplomatic
and business partnerships with China, and the
growth in illegal wildlife trade. 92 Data from
Mongolia’s Customs supports this assertion, as
most of the seized illegal wildlife products are in
fact destined for China.93
According to Mongolia’s Customs Authority, the
top species and products illegally traded to
China in recent years have been wolves, bear
gallbladders and bile, red deer blood antlers, and
musk deer glands.
92 Key informant interviews; see also, N. Otgonsaikhan, The Current Situation for Mongolian Foreign Trade and Cooperation with Northeast Asian Countries, Erina Report 127 (Dec. 2015) (8), available at http://www.erina.or.jp/en/wp-content/uploads/2015/02/se12712_tssc.pdf.
93 Mongolia Customs Data.
Wolves are traded for various parts and
organs as well as frozen whole. In the last
decade, Mongolia has legally exported only 56
wolves to China under CITES (under different
trade terms including skins and bodies). Many
more have been sent illegally, as reported by
customs data and officers. They reveal that
the highest peak of the year in illegal exports
of frozen wolfs to China is just before the
Chinese New Year.94
Bear gallbladder and bile, traded for use in
TCM, are routinely seized by police and
customs. This trade is a violation of CITES
legislation, which, since 2015, bans all trade
in Mongolia’s brown bear. Domestic hunting
and trade, however, are only banned for the
Gobi bear, which is listed as a ‘Very Rare’
species in the Law on Fauna and is strictly
protected. Up until 2014, Mongolia issued
export permits for bear gall bladder.
In this survey, researchers were told about,
but could not confirm, the existence of a bear
farm in Mongolia set up to supply bear bile.95
Key informants predict that trade in wild bear
bile will continue given existing demand and
the fact that users consider it more potent
than the farmed product. In the last decade,
China had 109 CITES-Imports related to bear
products including 38 bodies, 150 claws, 20
gall bladders, 67 live animals, 147 skins, 72
specimens, 5 skulls, and 70 trophies.96
Red deer blood antler trade is not unique to
Mongolia, 97 but the country is a source for
China’s market. All trade in this wildlife
product to China has been illegal. Red deer is
an Appendix II species requiring export
permits. There have been no legal CITES
exports from Mongolia to China registered in
the last two decades. Customs and police
officials, however, both provided data
showing that red deer antlers are a commonly
seized illegal product on the border with
China. 98 Blood anters are sold for their
94 Key Informant Interviews #UB5 and #UB6 (Customs Agency central office in UB).
95 Interview with TM specialist at GASI.
96 CITES Trade Database (https://trade.cites.org) Retrieved on May 17, 2017.
97 Id. “…New Zealand is the world's largest producer of deer antler, followed closely by Australia and Canada (both increasing rapidly), and … Korea is probably the world's largest user of antlers, with an apparently insatiable appetite for antlers of all species.”
98 Myagmaruren, Sh., Gombobaatar, S., Munkhjargal, M., Conaboy, N., The First National CITES Report of Mongolia, MEGD, Steppe Forward Programme, Zoological Society of London, Mongolica Publishing (2014) (54), 451.7 red deer antlers and 150 red deer blood antler and elk antler seized at borders between 2002-2014.
59
purported medicinal properties, a common
ingredient in Chinese tonic preparations. 99
They are harvested while still in a growth
phase and thus contain blood (hence the
name). Past experiences with harvesting
proved problematic as they were cut from the
animal while they are still growing; a painful
and potentially fatal process to the animal.
Attempts to farm this product in Mongolia
were thus criticized for their high mortality
rates and generally poor condition. 100
Harvesting antlers in the wild is equally, if not
more problematic, as poachers first kill the
animals before harvesting the blood antlers.
Musk deer glands (or pods) are sometimes
found in illicit trade coming from Mongolia.
In the past, this product was used by the
perfume industry, but has since been largely
supplanted by synthetic musk.101 Trade from
Mongolia is instead used as a traditional
medicine to treat a variety of conditions (e.g.,
pain, swelling, convulsions and delirium). In
Mongolia, there have been attempts in the
past to farm musk deer for the pods
produced by the males.102 A current project is
rumored to be operating in partnership with a
South Korean company intending to develop
synthetic equivalents for the medicinal
market.103 Its operations, however, could not
be independently verified by this survey.
Seizures indicate that trade continues, but the
source of the trade is not known. Given
suspected decreases in Musk deer
populations,104 it is possible that at least some
of this trade is in fact transiting from Russia
through Mongolia to supply other markets in
Asia.
In addition to these four endangered species,
there are many others being illegally exported to
China. Among them are deer testicles and tails,
and saiga horn, all documented by Customs
seizures. In addition, furs from polecats,
99 Deer Antler to Nourish Blood, Bone, and Joints by Subhuti Dharmananda, Ph.D., Director, Institute for Traditional Medicine, Portland, Oregon.
100 Wingard, J. and P. Zahler (2006).
101 The Conversation, The Changing World of Perfume and Why Some Chemicals are Being Taken Out, (Nov. 27, 2014) https://theconversation.com/the-changing-world-of-perfume-and-why-some-chemicals-are-being-taken-out-34502.
102 Farms were personally visited by individuals associated with the 2005 survey, but not during the present effort.
103 Personal communication with official in GASI. This information has not been independently verified or supported by documentation.
104 Nyambayar, B., Mix, H. & Tsytsulina, K. 2015. Moschus moschiferus. The IUCN Red List of Threatened Species 2015: e.T13897A61977573.
marmot, 105 and other Mongolian species are sold
to China for supplying the apparel
manufacturing industry. These are used for
production and shipment throughout China and
to the international apparel and fur markets. The
fur processing industry and market has
increased in China in recent years. A 2014 report
by the China Leather Industry documented
significant increases in the production of “mink,
fox, and raccoon pelts… with 60 million mink
pelts, 13 million fox pelts and 14 million raccoon
pelts produced, up 50 percent, 30 percent and
16.7 percent year-on-year respectively.”106
Russia’s Influence Russia’s involvement in Mongolia’s economy has
evolved over the years just as its influence on
Mongolia’s governance has. In the 90s it was
Mongolia’s first trade partner, representing
almost 80% of the country’s foreign trade; today
it stands a far second behind China, after being
reduced to just 11% of total foreign trade
turnover.107 Mongolia´s desire to counterbalance
China’s current dominance and invigorate its
commercial ties with Russia has been paired
with Putin’s interests to improve the country’s
commercial position in its neighbor.
Despite this interest in improved trade relations,
Mongolia has not been able to achieve a better
balance of trade with Russia. Exports have
increased in recent years, but imports have
increased even more. Mongolia’s trade deficit
with Russia has been steadily growing over the
last two decades, with its highest trade deficit
recorded in 2012, reaching US$1.769 billion.”108
This overarching pattern is reflected in the
wildlife trade between the two countries as well.
During the Soviet rule of Mongolia, Russia had
direct access to Mongolia’s resources, including
its wildlife products. The main wildlife products
Russia imported from Mongolia included various
furs, e.g., marmot, wolf, polecat, and fox. Russia
105 Id. 1,253 skins seized in 2012. More than 30,000 skins seized between 2002- first half of 2014.
106 China Daily, Industry, (Aug. 20, 2016) http://www.chinadaily.com.cn/business/2015-08/20/content_21659731.htm.
107 Sneath, David, Looks to Its Old Big Brother to Counterbalance China, The Conversation (Jan. 27, 2015), https://theconversation.com/russias-borders-mongolia-looks-to-its-old-big-brother-to-counterbalance-china-36721.
108 (footnote 20) N. Otgonsaikhan, The Current Situation for Mongolian Foreign Trade and Cooperation with Northeast Asian Countries, Erina Report 127 (Dec. 2015) (8), available at http://www.erina.or.jp/en/wp-content/uploads/2015/02/se12712_tssc.pdf.

60
would then produce coats and fur clothing
products. Even after Soviet control ended in
1991, Mongolia continued to supply wild
sourced furs to Russia’s fur industry. After this,
records of legal trade in wildlife are not
published independently from CITES records,
and general trade data on animals, hides and
skins. The general trade data does not provide a
breakdown of wildlife, but it is nonetheless part
of this trade. The dramatic shift in the balance of
trade between the two countries is an indicator
of the change in wildlife trade as well. Figure 2
shows this difference from 1996 to 2015. The
first category, Animals, refers to live animals, a
form of trade that can include wildlife, but which
does not appear to be a significant factor in
Mongolia’s trade to date. CITES records indicate
some trade, but limited to circus animals. The
second category refers to all forms of animal
skins, including wildlife pelts. In 1996, legal
exports in hides and skins to Russia were USD
412 thousand, while imports from Russia were
insignificant. In 2015, this trade has changed
dramatically with imports from Russia
dominating at USD 793 thousand, and
Mongolia’s exports a mere USD 22 thousand.
One explanation behind this shift in the balance
of trade, may be related to changes in the market
generally. Today, most fur products in the global
market are sourced from farms – a cheaper and
easier way to obtain and guarantee supply.
Currently, only 15% of fur on the global market
comes from the wild, while the remaining 85%
comes from farmed species.109
In brief, both the balance and level of trade in
these categories has changed dramatically with
Mongolia, now principally an importer rather
than exporter. Although exports of animals from
Mongolia have remained almost the same,
imports from Russia have risen dramatically,
going from less than USD 0.5 million in 1996 to
almost USD 9 million in 2015. Official exports of
fur from Mongolia have dropped to just 5% of
their 1996 trade values, while imports from
Russia increased 30-fold over the same period.
Apparent in the survey was the increase in the
number of souvenir stores in the capital offering
fur products from its northern neighbor.110
There are at least two factors that likely play a
role in this, although it is not clear which of
109 Farmed Fur, Int ’ l Fur Trade Fed ’ n, http://www.iftf.com/#/farmed-fur/ ; We Are Fur, Fur Farming, www.wearefur.com/about-fur/fur-farming; SPCA.
110 It should be noted that the actual origin of the furs was not verified independently. This information is based solely on observations markets with pelts marked as coming from Russia.
these may be most important, or how much of a
role they play in to the observed changes in
wildlife trade associated with the fur industry.
First, is an apparent increase in Mongolia’s
capacity to produce value added materials. Many
shops sell high quality furs produced in
Mongolia, a change from the 2005 survey when
much of the trade appeared to be in the form
raw pelts for processing abroad. Second, is that
hunting of several wild species is either
completely prohibited or at least more restricted
than in the past (e.g., wolf and marmot).
Combined, these two factors at least partially
explain the dramatic changes in wildlife trade
between Mongolia and Russia.
Figure 2. Historical Evolution of Mongolia’s bilateral wildlife trade with Russia (1996 and 2015)111
A Confirmed Transit Country One unresolved question from the 2005 Silent
Steppe report was whether Mongolia was also a
transit country for illegally traded wildlife.
Hinted at in the previous sections in this report,
this survey found that Mongolia’s status as a
transit country is beginning to emerge and it is
now a clearly documented part of its wildlife
trade problem.
Mongolia may not be a major transit route at this
point, but it does have transportation
infrastructure (in particular, the direct railroad
and highway that runs north-south through
Mongolia from Russia) already known as a route
for other forms of illicit trafficking including
111 Visual elaborated based on data retrieved form the World Integrated Trade Solution (http://wits.worldbank.org).
61
drugs and people.112 As wildlife trafficking has
become associated with global organized crime
and with Mongolia’s location next to the large
demand center of China, this transportation
corridor makes it not just plausible, but highly
probable that Mongolia’s role as transit country
already exists and will continue to rise in the
coming years.
Some of the police and customs data and
information acquired during the survey point
explicitly to this transit status. It also indicates
that there are multiple species potentially
involved. One case, for example uncovered more
than 100 saiga antelope horns from Kazakhstan
traded by Kazak traders through Mongolia en-
route to the final destination of China.113 Another
trader was found in possession of a lion pelt, a
species that does not occur in Mongolia. 114 In
2016, Customs officials recorded a transit
attempt to bring four Dalmatian pelican beaks to
China (a CITES Appendix I species) through
Mongolia at the Bayan Ulgii border crossing.
It is, however, hard to confirm the degree to
which Mongolia acts as a transit country today; a
problem caused in part by loopholes in the
Criminal Code (discussed in more detail in
Chapter V), but also by the failure to use other
applicable legislation (e.g., CITES trade
prohibitions in national law). Up until its
amendment in September 2016, the Criminal
Code did not criminalize illegal trade or
possession of wildlife species not sourced in
Mongolia. The ‘gap’ created by this loophole
resulted in ‘transit’ cases not being properly
documented or prosecuted, and even dropped by
the courts for lack of jurisdiction.
This was, however, not a gap within the legal
framework generally. At least since 2002,
Mongolia’s law regulating foreign trade in
endangered species (herein CITES Regulation)
made it illegal to trade any CITES Appendix I
species internationally for commercial
purposes,115 and all CITES species in a manner
contrary to its provisions. 116 Requirements
relevant to transit cases include obtaining re-
export permits from the Administrative
Council.117 Prior to the approval of the Law on
Infringements in 2015, international trade
112 Mongolia. Trafficking in Persons Report 2016. US State Department (July 1, 2016).
113 Cite Customs data; key informant interview.
114 Cite Customs data; key informant interview.
115 Law on the Regulation of Foreign Trade in Endangered Animal and Plant Species and Derivatives Thereof, Art. 7.1.
116 Id. at Art. 7.6.
117 Id. at Arts 8 and 9.
without the appropriate license carried a
maximum fine of ‘50,000 MNT for citizens,
60,000 MNT for public officials, or 250,000 MNT
for economic entities.’118 While the law did not
state what a minimum sentence would be, nor
did it apply criminal sanctions in the form of
incarceration, liability for international trade in
species that do not occur in Mongolia was
nonetheless applicable under this law. The
transit cases in the preceding paragraph were all
dropped because of the perceived loophole in
the Criminal law, ignoring the applicability of
Mongolia’s CITES implementation legislation.
This gap has since been addressed in the new
Criminal Code, but it is still too early to assess
its impact (see Chapter IV, Mongolia’s IWT Legal
Framework).
This gap has likely had a larger impact on
prosecutions than can be satisfactorily reviewed.
Without evidentiary protocols requiring
preservation, evidence is not typically kept and
is no longer available for further investigation.
What is known is that some of the ‘transit’ cases
involved species that are also present in
Mongolia, for example Saiga and Dalmatian
pelican. However, without evidence that a given
specimen was illicitly harvested in Mongolia or
forensics to verify its Mongolian origin,
prosecutors were unable to use the older version
of the Criminal Code law to satisfactorily argue
for jurisdiction. The mere claim that the species
was of extra-jurisdictional origin was sufficient
to have the case dismissed.
Even if the CITES Regulation had been applied, it
is not clear that the fine level would have acted
as much of a deterrent. With values of more than
USD$250 per horn, 119 the single transaction
attempted by the Kazak trader would have been
worth at least $25,000. The CITES Regulation,
however, set the maximum fine for an individual
trader at only 50,000 MNT (USD $20), or less
than one tenth the value of a single saiga horn.
Even though the horns were confiscated, the
penalty for the attempt is still only a small
fraction of the potential benefit. Stated
differently, it would take penalties from more
than one thousand infractions to equal the value
of this single illicit trade attempt. Documented
in numerous regulatory environments, a fine will
only have a deterrent value if it exceeds the
anticipated benefit. The fine, in other words,
118 Id. at Art. 15.1.1.
119 Reported prices vary, but have increased dramatically from the 1990s when locals reported paying USD $30 per horn. In 2013, Chinese officials estimated the value of a seizure of 4,470 horns from Kazakhstan at USD$22 million, or almost USD$5,000 per horn.

62
cannot be so small that it is disregarded as a
mere cost of doing business.120
Even without the full prosecution of transit
cases, testimonies and enforcement data
collected in the survey indicate that Mongolia
has indeed become another transit country for
illicit wildlife products. The expectation is that
the changes in the Criminal Code will close at
least one partial gap and shed more light on how
deeply Mongolia has become involved.
120 “Crime and Punishment: An Economic Approach” by Gary S. Becker, Journal of Political Economy, Vol. 76, No. 2 (Mar. - Apr., 1968), pp. 169-217.

63
CITES Trade Reflects a Changing Role Before discussing Mongolia’s CITES trade and the
trends visible within it, it should first be noted
that the numbers presented are, for the most
part, significantly smaller than trade figures for
other species and regions. While trade volumes
for some species and regions are in the order of
thousands and millions, trade in Mongolian
species are in the order of dozens or, in limited
cases, hundreds (e.g., wolves) or thousands (e.g.,
falcons). The low volumes, however, should not
be mistaken for low value either in economic, or
more importantly, in ecological terms. The
species that occur in Mongolia inhabit an arid
landscape where the ones that thrive in great
numbers tend to be insects and rodents. With
the exception of marmots, those targeted for and
threatened by trade are large herbivores,
carnivores, and a few, highly prized bird species.
Hunting and trade quotas, where they exist, may
seem small when compared to trade in species
found in tropical climes. The annual hunting
quota for Gray wolf, for example was set at just
20 in 2015, with population estimates ranging
between 10,000-20,000.121 For comparison, Spain,
at just 1/3 the size of Mongolia and an estimated
wild population of 2,000-2,500 wolves restricted
in range to a small area in the north, set a quota
of 200 animals for the same year.122
Hunting and trade quotas in Mongolia are likely
small to ensure the continued survival of the
species that inhabit this fragile environment. On
average, the official numbers for aggregated
CITES exports of wildlife come very close to, if
not exceed, the total that wildlife managers
believe may be legitimately supported to insure
species survival. In all cases, illicit trade volumes
are surpassing these limits by orders of
magnitude.
121 Mech, D.L and L. Boitani (2003) Wolves: Behaviour, Ecology and Conservation. P. 448.
122 España autoriza la caza de centenares de lobos pero oculta el número total de muertes, in El Diario online available at http://www.eldiario.es/sociedad/Espana-autoriza-caza-lobos-oculta-muertes_0_371663169.html.
Official Numbers Tell Part of the Story Several trends are visible in Mongolia’s official
CITES trade, but the most critical may be an
invisible one. The following paragraphs highlight
three visible trends that show how the country’s
official CITES trade is changing, reflecting new
patterns of consumption and trade overall. They
show in official numbers 1) how imports are
increasing over time, evidence of Mongolia’s role
as a consumer country for international wildlife
products; 2) that live specimens dominate this
trade, and 3) that exports for endangered species
remain mostly unchanged.
Behind this last trend, is a hidden trend; the
continuation of illicit trade as documented in the
first Silent Steppe report. Just a few cases and
enforcement records are enough to demonstrate
that illicit exports are substantially higher than
the licit trade represented by the official
numbers (in some instances many times more).
Wolf trade illustrates this well. According to
records provided by the Customs Agency, wolves
have been one of the top species seized in illegal
trade at the border for several years. In 2009,
permitted wolf exports were 56 including all
trade terms (17 skins, 15 trophies, 2 live, 20
specimen and 2 skulls). That same year,
however, wolf seizures reported by Customs
were six times that amount, at 312 frozen wolf
carcasses. In 2013, with a legal trade of only 8
skins and 2 trophies, seizures were of 232 teeth
and snouts. 123 Seizures represent an unknown,
but likely small percentage of the actual illicit
trade.
Added to this are instances of transit trade to
China in saiga horn (from Kazakhstan),
Dalmatian pelican beaks (source country
unknown), and lion (source country unknown);
cases that were virtually non-existent in the
customs records reviewed during the first Silent
Steppe report, and that also do not have paired
data in CITES permitted imports.
There is no easy way to accurately measure how
much more illicit trade is occurring compared to
licit trade. Multiple methods are being used to
123 Myagmaruren, Sh., Gombobaatar, S., Munkhjargal, M., Conaboy, N., The First National CITES Report of Mongolia, MEGD, Steppe Forward Programme, Zoological Society of London, Mongolica Publishing (2014) (54), 312 frozen carcasses seized at the border in 2009 alone, 232 teeth and snouts seized in 2013.

64
smuggle, including hiding pelts and carcasses
inside tires, under coal, in secret compartments,
and wheel wells.124 What is known, however, is
that even at the domestic level, take and trade
are likely substantially more than what is
officially permitted and that some of this also
feeds into international trade. Despite highly
restrictive hunting quotas, 125 domestic trade is
generally not banned. Wolf pelts, for example,
are openly displayed in Ulaanbaatar’s iconic
Soviet-era department store, the Ikh Delguur.
Shops on almost every block in Ulaanbaatar sell
wolf canine jewelry and wolf pelts were regularly
offered to surveyors in the markets. Tracking
actual sales to foreigners within these domestic
markets is virtually impossible, but they are
clearly a target market segment.
A comparison of enforcement data and market
observations with CITES export data shows that
the number of CITES permits issued are far
fewer than total international trade numbers.
The Sniffer-Dog unit of the Customs Agency
alone, operating 50 sniffer-dogs in 15 customs
houses and branches, was able to detect 245
individual cases of illegal animal fur trade over a
three-year period from 2011-2013.126 Legal CITES
trade during that same time was only 110 CITES
export permits.127 Even more telling, however, is
that almost 80% of all infractions detected by the
Sniffer-Dog unit were for animal furs, compared
to 20% for illegal shipments of alcohol, tobacco,
medicine, raw meat, and cashmere.
Unfortunately, sniffer-dog units are only able to
detect a fraction of what is actually being
smuggled, while the vast majority of trade
remains hidden.
Mongolia is a Consumer Country of Foreign Wildlife Looking again only at official CITES trade, the
data hints at Mongolia’s new role as a consumer
of international wildlife trade products.
124 Source: Customs Official Database of Criminal Incidents, 2016.
125 2016 Mongolian Hunting Quota: Дугаар 463 ТУСГАЙ ЗОРИУЛАЛТААР 2016 ОНД АГНАХ АГНУУРЫН АМЬТНЫ ТООГ ТОГТООХ ТУХАЙ.
126 Sniff Dog Unit of the Mongolian Customs Agency http://www.customs.gov.mn/en/2012-03-14-03-21-37/2012-03-14-03-24-07. Retrieved on May 17, 2017.
127 CITES Trade Database (https://cites.org) Retrieved on November 12, 2016.
Mongolia joined CITES in 1996, soon after its
democracy formed, with a dominant profile as a
source country for international wildlife trade
markets. In the first decade of its membership,
export permits had a strong upward trend going
from roughly 20 permits in its first year (1996)
to just under 60 in 2005. Over the next ten years,
exports slowly decreased, falling to just below
30 permits in 2013. This CITES export trend is in
direct contrast to imports. In the first decade of
trade, annual import permits mostly remained
under 10, making them an insignificant part of
the trade equation. The second decade of trade,
however, has witnessed a steady and significant
increase, going from just ten permits issued in
2006 to more than 40 in 2013. 128 If the
cumulative total for import permits in the first
decade was 85, the second decade saw officials
issue almost three times as many (249 import
permits). Stated another way, 75% of all CITES
imports were recorded from 2006 to 2015. At
the same time, CITES exports were in decline and
in 2011, for the first time, the number of import
and export permits were roughly equal.
Figure 3. CITES Permitting in Mongolia (1996-2015)
Accompanying the increase in demand for
foreign wildlife products is a clear increase in
the number of source countries. In its first
decade of CITES trade, Mongolia imported
wildlife from 24 different countries. A majority
of this trade was from Europe with six of the top
ten countries including (in order of importance)
Denmark, Switzerland, Netherlands, France,
Austria, and the UK. The second decade of CITES
trade witnessed an increase in the number of
source countries expanding from 24 to 43
countries. 129 Major trading partners shifted in
128 Another exception is noted in this decade as well with only one import permit issued in 2015. (do we know the reasons?).
129 This includes 39 source countries exporting directly to Mongolia and another 4 countries acting as re-exporters. The majority of Mongolia’s CITES imports are in fact sourced in third countries different from the exporter country. Of the 304
-
10
20
30
40
50
60
70
80
90
100
1996 1997 1998 1999 2000 2001 2002 2003 2004 2005 2006 2007 2008 2009 2010 2011 2012 2013 2014 2015
Nu
mb
er
of
CIT
ES P
erm
its
Mongolia CITES-Permited Trade (1996-2015)
CITES Export Permits
CITES Import Permits
Silent Steppe I Silent Steppe II

65
this timeframe to the Americas and Asia,
reflecting general changes in trade for the
region, and including among the top ten the
United States, Colombia, Thailand, India, China,
and Vietnam (See Figure 4).
Figure 4. Comparison of CITES Imports to Mongolia 1996-2005 and 2006-2015
While official import data do not provide the
entire picture, they are, nonetheless, an indicator
of increasing and shifting demand for foreign
wildlife goods by Mongolians. In other words,
Mongolia is also a consumer country with an
appetite for wildlife products from beyond its
borders. From the official records, this includes
as many as 73 CITES listed species, although
more than 97% of the trade is concentrated in 27
of them, the rest having minor values (see
Figures 5 and 6). Records and results from the
survey not visible in CITES data indicate that
other species are also part of this trade flow, but
are unreported. Field visits to antique and
jewelry shops also showed some, albeit limited,
amounts of ivory, typically as chopsticks or as
traditional snuff bottles.
At present, there is no official record of imports
(CITES, Customs seizures, or otherwise) of exotic
foods like shark fin or pangolin as is the case for
other Asian countries. These types of dishes
import permits issued between 1996 and 2015, 211 (or 69%) were to import products not from the country of origin.
(e.g., shark fin or pangolin soup) were also not
uncovered during the restaurant survey portion
of the study. Similarly, the demand for foreign-
produced traditional medicine products does not
appear to be as common as the use of domestic
traditional medicine products.130
Notably, the association of increased wealth and
increased consumption of wildlife appears to be
as valid in Mongolia is it is in other parts of Asia.
Economic growth in the country may not be as
dramatic as some neighboring countries, but
certain sectors of society have nonetheless
experienced rapid increases. Reports indicate,
for example, that Mongolia’s ruling elite in
particular has amassed fortunes far outpacing
the rate of growth in the economy.131 And even
though Mongolia’s consumption of wildlife
products pales in comparison to China’s, it
confirms, even at these smaller scales, the direct
relationship found in Asia between wealth
accumulation and increases in the consumption
of wildlife products.
Live Specimen Trade Dominates Live specimen imports to supply the pet market
are frequently found in many countries, but this
is not the case for Mongolia, where pet trade and
exotic pet ownership is generally uncommon.
This survey found a few pet shops in the capital
city supplying turtles, cats, dogs, parakeets, and
possibly some endangered marine fish species.
This is an observed change compared to the
2005 survey, when no stores of this type were
documented. However, in general there does not
seem to be a large market for exotic pets.
Nonetheless, official CITES import records
indicate that live specimen trade is the single
most important category for Mongolia, with
increases in total volume of trade that follow the
general trend in import permits already
discussed. As shown in Figure 5, from 1996 to
2005 live imports accounted for 99% of the total
CITES import volume, most of which were live
cacti, followed by Przewalskii horse and saker
falcons. Total live trade volume was 14,175
specimens of which roughly 90% are cacti.
130 There are, however, rumors from officials of a planned bear bile farm to meet demand in China, with some of the expected output to be used in Mongolia.
131 The Mongolist Blog using numbers submitted by Mongolia’s parliament members to the Independent Authority Against Corruption (IAAC), Mongolia’s agency responsible for investigating government corruption.

66
Of note during this decade are the imports of
live falcons. Four species are among the imports:
saker falcon (Falco cherrug), gyrfalcon (Falco
rusticolus), and peregrine falcon (Falco
peregrinus), as well as hybrid falcon. Hybrid
falcons are created by cross-breeding two or
more falcons (typically either saker or gyr
crossed with peregrines or barbary) and are
preferred by falconers over pure bred varieties
because of the combined attributes they exhibit -
larger size, enhanced performance, more suited
to Middle East climate, more aesthetically
pleasing.132
There is some concern over the introduction of
hybrids into the wild that could potentially lead
to the extinction of wild species caused by
genetic introgression. 133 In response to this
concern, Birdlife International is calling for
institutional measures to prevent this
occurrence, as well as prohibit their deliberate
release into saker breeding grounds. 134 Under
Mongolian law, it is illegal to breed exotic
species135 and their use is to be regulated by the
Ministry of Environment and Tourism. 136 While
the law also prohibits the introduction of foreign
and invasive species, the question of hybrids is
not explicitly addressed either in the overarching
environmental protection legislation or the
specific wildlife conservation and trade laws.
Figure 5. Mongolia’s CITES species imports by type
From 2006 to 2015, total CITES trade in live
specimens more than doubled, but also switched
almost entirely to trade in live sturgeon; again
followed by Przewalskii’s horse and saker falcon,
but at much reduced numbers. One of the
132 Id. Dixon, A. (2012). Conservation of the Saker Falcon (Falco cherrug) and the use of hybrids for falconry. Aquila (2012), Vol. 119, p. 9–19.
133 Id.
134 CMS Technical Series No. XX (2014). Saker Falcon (Falco cherrug) Global Action Plan (SakerGAP), including a management and monitoring system, to conserve the species.
135 Mongolian Law on Fauna, Art. 36.4, 2012.
136 Id. at Art. 36.5.
sturgeon’s, known as the white sturgeon
(Acipenser transmontanus), is native to the
Pacific coast of North America and a favorite
among sport fishermen. Trade with Mongolia in
this species is, however, restricted to caviar. The
other, the Siberian sturgeon (Acipenser baeri),
can be found throughout the Siberian river
basins as well as Mongolia. At 32,400 specimens,
this species dominates Mongolia’s live imports in
its second decade of CITES trade. The relatively
early maturity of Siberian sturgeon and its
freshwater lifecycle, make it a common species
found in aquaculture. Rumored, but not
confirmed in this survey, is an effort to establish
a fish farm for sturgeon in Mongolia.137
Figure 6. Mongolia’s CITES species imports by term
Exports Are Still Strong The shift in orientation from predominantly
exporting to almost equal import and export
permits is an important transition in Mongolia’s
CITES trade. Exports, however, are still strong
and play a role for several critical species.
Among the top three exported species are
wolves, saker falcons, and Altai argali.
In the past, most exports were designated as
trophy hunting or for scientific purposes,
reflecting the predominance of Mongolia’s
trophy hunting industry for Altai argali and
Siberian ibex, 138 and the scientific research
137 Key informant interview.
138 The United States, Japan, and Germany have historically been the three main CITES markets for Mongolia.

67
initiated after the opening of the country. The
major trading partners for these exports reflect
the purpose of this trade as well. During the first
decade of CITES trade, major export destinations
were the United States, and a few countries in
Europe. The one exception to this was South
Korea, a country that factors into Mongolia’s
wildlife trade, but does not dominate the overall
volume of trade, as do other trading partners.
Figure 7. Comparison of CITES Exports from Mongolia 1996-2005 and 2006-2015
CITES exports have changed in character in the
second 10-year period, diversifying in the
number of trading partners as well as the
number and types of species traded.
Wolves are one of Mongolia’s top CITES trade
species. Over the years, gray wolf CITES permits
have represented approximately one third of the
total CITES export permits issued by Mongolia,
making it the top export species based on permit
totals (291 permits), followed by Argali with 263
permits. On average, 33% of all export permits
were wolf specimens during the first decade,
dropping to 25% in Mongolia’s second decade of
trade.
Each permit, however, may contain more than
one specimen. Records document exports of
more than 2,700 wolves and wolf parts over the
past 20 years;139 a figure that is high, but not as
high as saker falcon trade (see next section).
Trophies and skins are the primary trade term
recorded for CITES wolf permits, although data
also show a trend in wolves being traded live for
scientific purposes and to zoos in Japan and
Western countries. In addition to whole
carcasses and live animals, wolf parts, including
teeth and pelts, are part of this trade.
Figure 8. CITES Exports of Gray Wolf from Mongolia 1996-2015
Falcons, in particular saker falcons, are another
common CITES trade species from Mongolia.
Nine species occur in Mongolia, including Amur
falcon (Falco amurensis); saker falcon (Falco
cherrug); merlin (Falco columbarius); lesser
kestrel (Falco naumanni); peregrine falcon (Falco
peregrinus); gyrfalcon (Falco rusticolus); Eurasian
hobby (Falco subbuteo); common kestrel (Falco
tinninculus); and Barbary falcon (Falco
pelegrenoides). With the exception of the Barbary
falcon, all of the other species appear in the
official CITES trade records.140 The list of exports
also includes hybrid falcon, for which there is no
further indication of hybrid type. Of these eight
139 CITES trade statistics derived from the CITES Trade Database, UNEP World Conservation Monitoring Centre, Cambridge, UK.
140 CITES Trade Database.
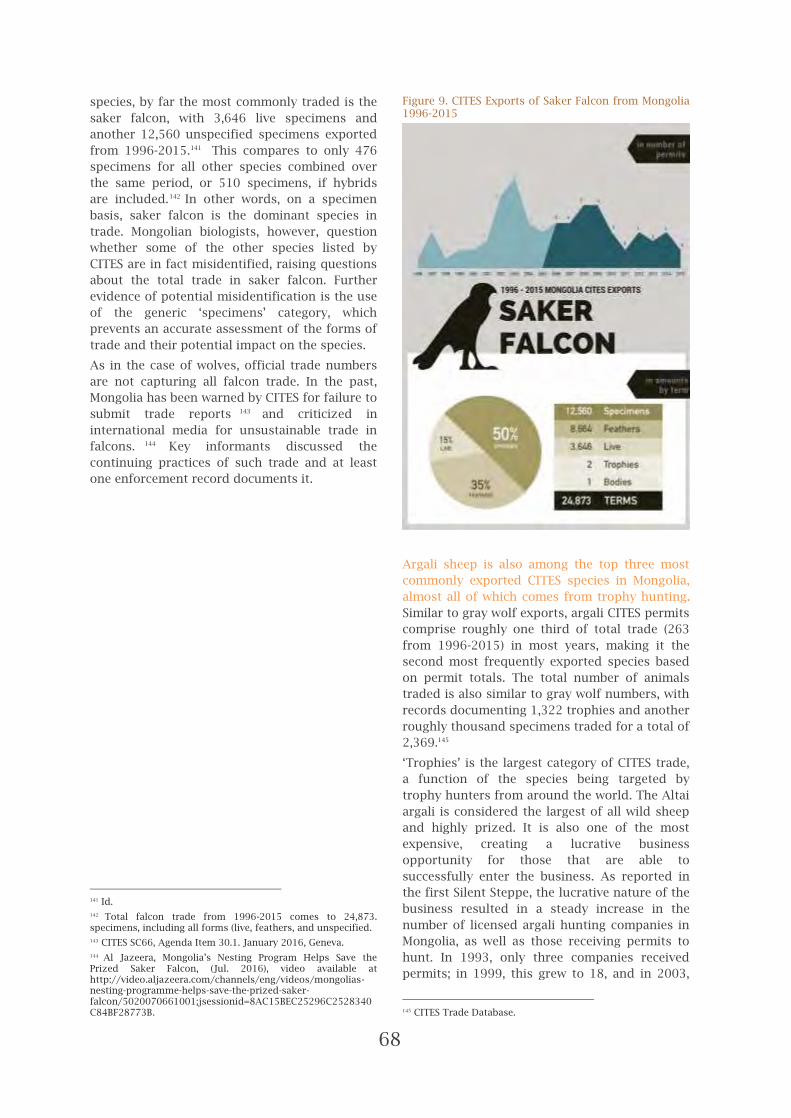
68
species, by far the most commonly traded is the
saker falcon, with 3,646 live specimens and
another 12,560 unspecified specimens exported
from 1996-2015.141 This compares to only 476
specimens for all other species combined over
the same period, or 510 specimens, if hybrids
are included.142 In other words, on a specimen
basis, saker falcon is the dominant species in
trade. Mongolian biologists, however, question
whether some of the other species listed by
CITES are in fact misidentified, raising questions
about the total trade in saker falcon. Further
evidence of potential misidentification is the use
of the generic ‘specimens’ category, which
prevents an accurate assessment of the forms of
trade and their potential impact on the species.
As in the case of wolves, official trade numbers
are not capturing all falcon trade. In the past,
Mongolia has been warned by CITES for failure to
submit trade reports 143 and criticized in
international media for unsustainable trade in
falcons. 144 Key informants discussed the
continuing practices of such trade and at least
one enforcement record documents it.
141 Id.
142 Total falcon trade from 1996-2015 comes to 24,873. specimens, including all forms (live, feathers, and unspecified.
143 CITES SC66, Agenda Item 30.1. January 2016, Geneva.
144 Al Jazeera, Mongolia’s Nesting Program Helps Save the Prized Saker Falcon, (Jul. 2016), video available at http://video.aljazeera.com/channels/eng/videos/mongolias-nesting-programme-helps-save-the-prized-saker-falcon/5020070661001;jsessionid=8AC15BEC25296C2528340C84BF28773B.
Figure 9. CITES Exports of Saker Falcon from Mongolia 1996-2015
Argali sheep is also among the top three most
commonly exported CITES species in Mongolia,
almost all of which comes from trophy hunting.
Similar to gray wolf exports, argali CITES permits
comprise roughly one third of total trade (263
from 1996-2015) in most years, making it the
second most frequently exported species based
on permit totals. The total number of animals
traded is also similar to gray wolf numbers, with
records documenting 1,322 trophies and another
roughly thousand specimens traded for a total of
2,369.145
‘Trophies’ is the largest category of CITES trade,
a function of the species being targeted by
trophy hunters from around the world. The Altai
argali is considered the largest of all wild sheep
and highly prized. It is also one of the most
expensive, creating a lucrative business
opportunity for those that are able to
successfully enter the business. As reported in
the first Silent Steppe, the lucrative nature of the
business resulted in a steady increase in the
number of licensed argali hunting companies in
Mongolia, as well as those receiving permits to
hunt. In 1993, only three companies received
permits; in 1999, this grew to 18, and in 2003,
145 CITES Trade Database.
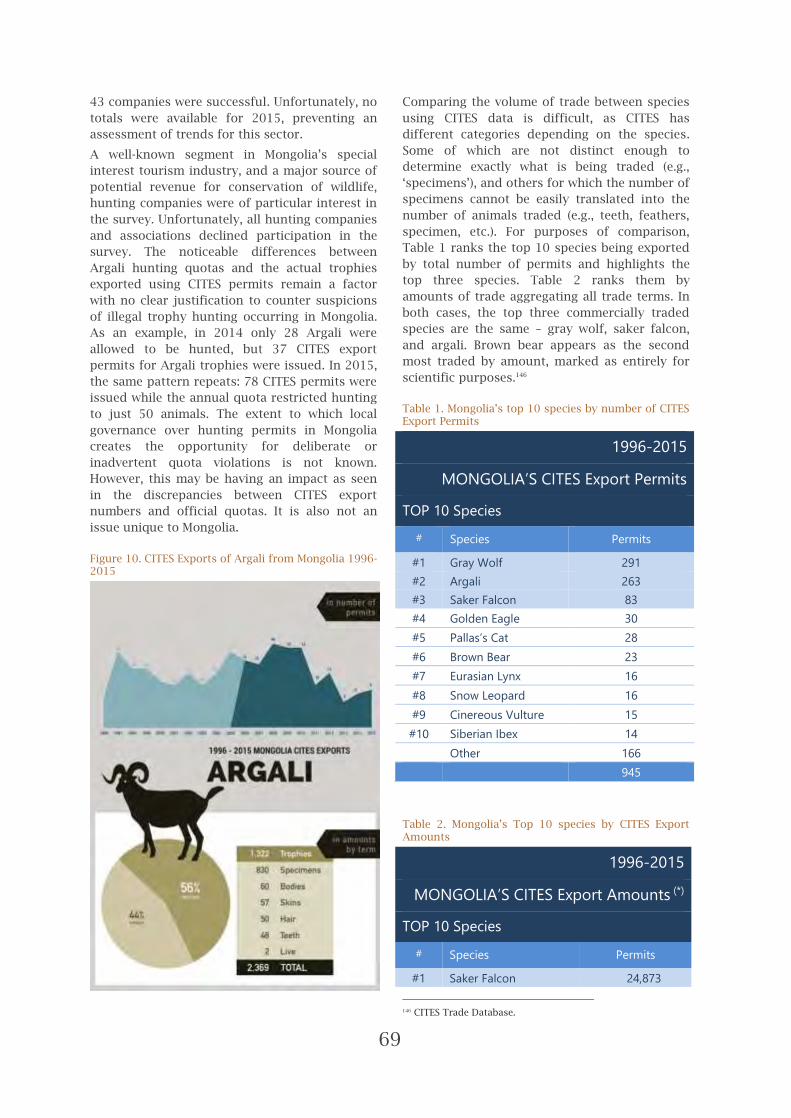
69
43 companies were successful. Unfortunately, no
totals were available for 2015, preventing an
assessment of trends for this sector.
A well-known segment in Mongolia’s special
interest tourism industry, and a major source of
potential revenue for conservation of wildlife,
hunting companies were of particular interest in
the survey. Unfortunately, all hunting companies
and associations declined participation in the
survey. The noticeable differences between
Argali hunting quotas and the actual trophies
exported using CITES permits remain a factor
with no clear justification to counter suspicions
of illegal trophy hunting occurring in Mongolia.
As an example, in 2014 only 28 Argali were
allowed to be hunted, but 37 CITES export
permits for Argali trophies were issued. In 2015,
the same pattern repeats: 78 CITES permits were
issued while the annual quota restricted hunting
to just 50 animals. The extent to which local
governance over hunting permits in Mongolia
creates the opportunity for deliberate or
inadvertent quota violations is not known.
However, this may be having an impact as seen
in the discrepancies between CITES export
numbers and official quotas. It is also not an
issue unique to Mongolia.
Figure 10. CITES Exports of Argali from Mongolia 1996-2015
Comparing the volume of trade between species
using CITES data is difficult, as CITES has
different categories depending on the species.
Some of which are not distinct enough to
determine exactly what is being traded (e.g.,
‘specimens’), and others for which the number of
specimens cannot be easily translated into the
number of animals traded (e.g., teeth, feathers,
specimen, etc.). For purposes of comparison,
Table 1 ranks the top 10 species being exported
by total number of permits and highlights the
top three species. Table 2 ranks them by
amounts of trade aggregating all trade terms. In
both cases, the top three commercially traded
species are the same – gray wolf, saker falcon,
and argali. Brown bear appears as the second
most traded by amount, marked as entirely for
scientific purposes.146
Table 1. Mongolia’s top 10 species by number of CITES Export Permits
1996-2015
MONGOLIA’S CITES Export Permits
TOP 10 Species
# Species Permits
#1 Gray Wolf 291
#2 Argali 263
#3 Saker Falcon 83
#4 Golden Eagle 30
#5 Pallas’s Cat 28
#6 Brown Bear 23
#7 Eurasian Lynx 16
#8 Snow Leopard 16
#9 Cinereous Vulture 15
#10 Siberian Ibex 14
Other 166
945
Table 2. Mongolia’s Top 10 species by CITES Export Amounts
1996-2015
MONGOLIA’S CITES Export Amounts (*)
TOP 10 Species
# Species Permits
#1 Saker Falcon 24,873
146 CITES Trade Database.

70
#2 Brown Bear 3,402 147
#3 Gray Wolf 2,708
#4 Argali 2,369
#5 Great Bustard 1,912
#6 Golden Eagle 1,529
#7 Wild Ass 980
#8 Snow Leopard 664
#9 Pallas’s Cat 527
#10 Musk Deer 309
Other 2,098
41,371
* Including and aggregating the following trade
terms (live, hair, specimen, skulls, trophies,
derivatives, etc.)
Comparing the absolute number of animals
traded can only be done by aggregating terms
where each item traded is likely to represent a
single animal. For saker falcon, the following
three forms meet this requirement – live, trophy,
and body. Excluded from this were ‘specimen’
and ‘feathers.’ It is likely that ‘specimen’ trade
actually contains live trade, but without further
information, this cannot be fairly included as
part of this aggregation. For argali, a single
animal is typically represented by – trophy, skull,
and horns. Excluded are several other categories
including ‘specimen,’ ‘hair,’ ‘skulls,’ ‘skeletons,’
and ‘garments.’ As with saker falcon trade terms,
it is likely that some of these include trade in
whole animals, but these cannot be included
without further information. For gray wolf, the
terms ‘skins,’ ‘trophy,’ ‘live,’ and ‘body’ were
selected, excluding ‘specimens,’ ‘hair,’ and
‘teeth.’
Using this filter, at least 3,524 saker falcons were
exported by Mongolia from 1996-2015 (average
176/year). For gray wolf, the total trade in
individual animals was at least 2,249 over 20
years (average 112/year). For argali, the total
trade in individual animals was at least 1,384
(average 69/year). For at least two of these
species, saker falcon and gray wolf, documented
trade is likely significantly lower than actual
trade. Excluded trade terms for both are either
147 As the Mongolian population of brown bear is a CITES Appendix I species, its exports are entirely for scientific purposes. The top three commercially traded species by amount are highlighted in blue.
large enough in number or indistinct enough as
a trade concept to include important numbers of
individual animals. The aforementioned saker
falcon trade figure, for example, excludes high
rates of trade in ‘specimens’ (n. 12,560) and
‘feathers’ (n. 8,664). It is not known from the
‘specimens’ whether this in fact includes live
animals or only parts. For the gray wolf, rates of
trade in excluded trade terms is less, but still
worth noting, in particular the trade in
‘specimens’ (n. 319).

71
Hard to Control
Increased Trade Requires Increased Capacity The increases in international trade brings with it
easier or more fluid avenues for both legal and
illegal international trade. With millions of
shipments going through ports around the world
every day,148 less and less is being inspected. This
happens in all ports as they become busier and is
already happening in the ports of Mongolia as
well. Increases in the country’s foreign trade has
been substantial over the last two decades, going
from USD 2.9 Billion in 2005 to USD 11.4 Billion in
2011 and then to USD 8.4 Billion. 149 The high
growth rate of the Mongolian trade sector
(between 300 – 400%) has not even been matched
by the dynamic Chinese economy over the same
time frame.150 Moreover, Mongolia’s foreign trade
is dominated by exports of raw minerals and
imports of industrial products. The increase in
both forms of trade has a direct footprint in the
number and frequency of freights crossing
Mongolia’s borders and custom points every
day, 151 something that does not occur in
economies with trade dominated by high value
added products.
148 UNCTAD collects data and stats on shipments. The indicator
of “Container port throughput”, which refers only to Maritime
Transportation, was 651 Million of TEUS in 2013 (Twenty Feet
Equivalent Unit) and 684 Million of TEUS (provisional data) in
2014. Retrieved from http://unctadstat.unctad.org on May 30th,
2017. 149 Mongolia Statistical Information Service (www.1212.mn).
150 China Total Trade Turnover increased from USD 3,765 T to USD 5,977 in the period 1996-2015 (less than doubled). World Integrated Trade Solution (www.wits.worldbank.org).
151 The UNCTAD reports that data for the indicator “Container
port throughput (TEU)” as not available, so this survey assumes
that is information not being shared by Mongolia government in
the same way other countries do. (www. http://unctadstat.unctad.org/CountryProfile/GeneralProfile/en-
GB/496/index.html).
Increased trade and shipping have added strain to
already understaffed and underfunded custom
houses and border offices in Mongolia. X-Rays,
Gamma Rays, Neutron scanning, and Backscatter
X-rays are all non-intrusive inspection equipment
considered the most common technology for
cargo screening by the World Customs
Organization. 152 Their use boosts capacity to
conduct freight audits without involving physical
inspection by customs officials. Its procurement
and operating costs, however, are high, in part
because of their use of nuclear technology. Key
informants working for the Custom Agency, both
at the central office in Ulaanbaatar and in the
border points surveyed, refer to insufficient
imaging equipment to conduct routine
inspections of heavy vehicles. It is precisely in
this type of vehicle, carrying coal and minerals,
where several customs inspections have
uncovered hidden wildlife specimens as traders
attempt to illegally cross the border. This is a
problem mostly found on the southern border
with China. On this border, empty 100-200 ton
trucks enter the country heading toward mining
operations and return fully loaded, in many cases
with sealed containers – seals placed on-site by
mining operation inspectors without the
possibility for custom officers to conduct proper
inspections.153 The use of secret compartiments in
cars, truckbodies and even trains, where fake
ceilings and floors have been discovered to hide
wildlife, would be more easily discovered if this
152 World Customs Organization. Guidelines For The Procurement And Deployment Of Scanning/NII Equipment. April 2015. http://www.wcoomd.org/en/topics/facilitation/instrument-and-tools/tools/~/media/1BC3CBC9189B4BECB21BC5F261E43694.ashx.
153 Key Informant Interviews # 1.8, #1.10 (Khovd, Custom Inspector), # 5.5, 5.6 and 5.7 (all Umnogovi Custom Inspectors), # UB5 and #UB6 (From Customs central office in UB).
0
2
4
6
8
10
12
1996 1997 1998 1999 2000 2001 2002 2003 2004 2005 2006 2007 2008 2009 2010 2011 2012 2013 2014 2015
MONGOLIA FOREIGN TRADE TURNOVER 1996 - 2015
In USD Billions Exports Imports

72
technology were in place in all customs without
distinction.154
Free Trade Zones Pose Risks Add to the problems mentioned in the previous
section, the relaxation on inspections and scans
on cargo in free trade zones and the traffickers’
job becomes much easier. In other countries, free
trade zone and the liberalization of trade in
general have been used as opportunities for
wildlife traffickers to exploit. Chief among these
are restrictions on inspections and investigations
to speed up trade going in and out of the zone. In
general, more information is required before a
scan will be authorized, much less a full
inspection of a shipment.
Mongolia has actively pursued several policies
and actions to promote its international trade.
Among them are the identification of free trade
ports along its southern, northern, and western
borders (Zamiin Uud, Altanbulag, and Tsagaan
Nuur respectively);155 and approval of free trade
zone (FTZ) legislation (starting in 2002). Although
long on the agenda, the FTZ legislation stalled for
more than a decade before gaining new life in
2015, when an agreement between China and
Mongolia led to breaking ground at the Zamiin
Uud site. Although completion is not expected
until 2018, the concerns stated at the inception of
these FTZs remain valid and relevant to wildlife
trade.
Shortly after their designation, an international
study reviewed Mongolia’s free trade program and
two of the selected sites, Altanbulag and Zamiin
Uud. 156 Among its conclusions were that the
program ‘suffers from serious conceptual and
operational weaknesses’ and that ‘[s]ubstantial
legal and regulatory framework enhancement is
required’ to reach standards.’ 157 Not specifically
mentioned, but likely part of this concern is the
primary law’s reliance on implementing
154 Key Informant Interviews #UB6 and #UB7 (Custom Officials
from central office in UB). 155 This includes the following legislation: The Law of Mongolia on the Free Zone, adopted in 2002; the Law on the Legal Status of Zamyn-Uud Free Econnomic Zone, adopted in 2003; The law on the Legal Status of and Resolution No.17 on the Development of the Zamyn-Uud Free Economic Zone adopted in 2004 by the Parliament of Mongolia.
156 Id. USAID (2004). Assessment of Mongolia’s Free Trade Zone Program and Site Evaluation. Mongolia Economic Policy Reform and Competitiveness Project (EPRC).
157 Id.
regulations. Of particular concern for illicit
wildlife trade are two articles: Article 4.2 -
requiring that the entry into such zones be
restricted and conducted pursuant to ‘procedures
to be approved by the Custom Office’; and Article
10.1 – calling for the creation of an independent
inspection unit tailored to the form, purpose, and
location of the zone. In both cases, the question
remains how well these regulations will respond
to the particular challenges that illicit wildlife
trade poses.
Unprotected Borders Facilitate Trade Even under the best of circumstances, it is an
enormous and costly task to control borders, one
that some countries cannot reasonably afford.
Mongolia’s international border, at 8,252 km 158
and 2.5 times longer than the US-Mexico border, is
one of those cases. Acting as a buffer between
major powers, however, Mongolia’s border has
always been of paramount concern and, in the
past, well-equipped. During the Cold War, the
government maintained a force of 15,000 troops
to control its borders and immigration. Basic
military equipment supported border control
activities including “[f]ixed-wing aircraft,
helicopters, tanks, motor vehicles and
motorcycles, radio communications equipment,
engineering equipment, and automatic
weapons.” 159 The current numbers are not
published, but at least one source claims that
between 300 - 350 border patrol units operate at
all times.160 Testifying to their continuing concern
for security along the border, Mongolia is one of
the few countries in world that has almost
entirely enclosed its borders in fencing (see Figure
11).161 This fencing, however, is not solid and, as
observed in several areas, not consistently
maintained.
158 Mongolia international border includes 4,677 Km of borders with China (57% of the total) and 3,543 Km with Russia (43%).
159 Id. Mongolia - Border Troops / Border Forces. Global Security (www.globalsecurity.org) Retrieved on May 24, 2017
160 Id.
161 This information has not been confirmed in this survey. The exact length and locations of fencing was not available for this publication.

73
Figure 11. Map of Security Border Fencing in Eurasia162
Despite the fencing and staffing, it is still true
that Mongolia’s borders are relatively open and
difficult to control. Except for its far western
border, defined by the Altai Mountains, there are
no major natural features (e.g., mountain areas or
major water bodies) that significantly impede
crossing at any point. Its entire southern border
with China is either grassland or desert, and
much of its northeastern border with Russia is
grassland, all of which can be crossed by jeep
almost as easily as using a paved road. With these
long, mostly deserted borders to both the north
and the south, traffickers are not restricted in
their movements and, once they navigate any
fencing, can move contraband with relative ease
and little risk of detection.
Several stories from key informants questioned
during the survey illustrates this point. A customs
official from Khovd aimag in the west, for
example, related instances of Korean porters
carrying frozen fish during the winter using
secret roads and informal crossing points into
China. 163 From Bayan-Ulgii aimag, the use of
uncontrolled crossing points is also reported as
being used by wildlife smugglers using horses, as
well as small, and large vehicles.164 In the same
aimag, key informant surveys also revealed how
traffickers use illegal crossing points to bring
wildlife from Kazakhstan to Mongolia.165 From the
northern aimag of Selenge, there were more
reports captured by surveyors of ‘fast cars’ used
to cross the border using forested areas as
162Linnel, D., A. Trouwborst, L. Boitani, P. Kacenzsky, D. Huber, S. Relijc, J. Kusak, A. Majic, T. Skrbinesk, H. Potocnik, M. Hayward, E.J. Milner-Gulland, B. Buuveibaatar, and U. Breitenmoser (2016). Border Security Fencing and Wildlife: The End of the Transboundary Paradigm in Eurasia?. https://doi.org/10.1371/journal.pbio.1002483
163 Key Informant Interview # 1.1 (Khovd Customs Officer).
164 Key Informant Interview # 3.6 (Bayan-Ulgii Environmental Inspector).
165 Key Informant Interview # 3.7 (Bayan-Ulgii, Surveyor Inspector).
cover.166 Making matters even more difficult is the
fact that traffickers are using more sophisticated
methods including: arranging by phone to
exchange goods in unmonitored border areas,
such as forests and woods, and replacing car
plate numbers with fake ones to elude law
enforcement.167
Vast Territories Challenge Enforcement Wildlife is typically found in vast, sparsely
inhabited spaces that tend to be difficult, if not
impossible, to patrol. Front line enforcement staff
is usually limited in number and often restricted
to park rangers for established protected areas.
With large areas to patrol, it is nearly impossible
to catch illegal activity on a consistent basis.
This is especially true in Mongolia, where park
rangers are responsible for controlling 265,000
km2 – or roughly 17% - of the country’s territory.
If each square kilometer were laid end-to-end,
Mongolia’s protected areas would circle the earth
almost 7 times. Making the job of patrolling even
more difficult, these areas are divided into 75
different individual protected areas (excluding
national monuments and international
designations, e.g., World Heritage sites) spread
across the entire the country. Furthermore, they
are still located in some of the remotest regions,
covering largely uninhabited mountains and
deserts. Added to this is the need to monitor
increasing activities along the country’s 10,409
km of major rivers and 13,418 km2 of lakes, as
pressure on aquatic resources has risen sharply in
recent years. In sum, few places on earth have so
much territory to cover with as few people and
resources as Mongolia – an impressive landscape
and equally daunting task by any definition. (see
Figure 12).168
166 Key Informant Interview # 4.5 (Selenge – Police).
167 Key Informant Interview # 3.13 (Bayan-Ulgii, Altai Mountain Inspector).
168 Sources include: Mongolian Statistical Information Service
(www.1212.mn) for data on total area (2016), major rivers and lakes, and border length; World Database on Protected Areas (WDPA) (www.protectedplanet.net) for data on number and size of protected areas (2016). (UNEP-WCMC).

74
Figure 12. Mongolia, a vast space to manage
Illustrating the challenge is Figure 13, which
provides a quick comparison of the relation
between the size of two of Mongolia’s protected
areas, Toson Khulstai Nature Reserve and
Khuvsgul National Park, and the average territory
rangers must patrol. According to official data,
these parks have just 6 (Toson Khulstai) and 15
(Khuvsgul) rangers each. At 4,699km2 and
8,380km2 respectively, rangers have an average of
783 km2 and 559 km2 to cover. Compared to
Yellowstone National Park in the US (27
km2/ranger), they have between 20 and 30 times
fewer personnel by area. However, this
comparison only takes into account permanent
staff, a figure that doubles in Yellowstone during
the summer season. Mongolia does not report
increased staffing practices during its high
season, making the understaffing of rangers in
Mongolia even more dramatic.
Figure 13. Staffing Mongolia’s Protected Areas169
Outside protected areas, the situation for
enforcement personnel is not any easier. The
same conditions that make Mongolia a haven for
wildlife (and therefore a source country for
certain species) also make it nearly impossible to
patrol. With only 2 people per square kilometer
on average, 170 it is one of the least densely
populated countries in the world.171 Since almost
half of its 3.1 million population reside in the
capital city, Ulaanbaatar, 172 the reality is that
human population densities are often much lower
and at least nine aimags have less than 1
person/km2. 173 Wildlife thrives in the country’s
large, undeveloped spaces. But just as wildlife
roam vast landscapes, so must the rangers who
protect them.
These relatively uninhabited spaces are not paired
with sufficient human and economic resources to
ensure successful management. Given Mongolia’s
base economic conditions, this is of course
difficult to achieve. As a general indicator of the
capacity to invest in such efforts, Mongolia ranks
at the bottom of all countries in terms of
169 Sources www.protectedplanet.net for area protected. EU Biodiversity Conservation Report and US Forest Service for park rangers numbers.
170 2016 National Population Density from the Mongolia Statistical Information Service (www.1212.mn) Retrieve on April 23, 2017.
171 World Atlas, The 10 Least Densely Populated Places in the World (2016) http://www.worldatlas.com/articles/the-10-least-densely-populated-places-in-the-world-2015.html.
172 The Mongolist Blog, Rethinking Ulaanbaatar’s Population (May, 2014) quoting Data from table “Хүн амын тоо, хүйсээр, оны эхэнд, мянган хүн” at: http://ubstat.mn/StatTable=11, available
at http://www.themongolist.com/blog/society/89-rethinking-ulaanbaatar-s-population.html.
173 Mongolian Statistical Information Service (www.1212.mn).

75
population, population density, and also in tax
collection; three indicators that point to scarce
human and public resources to respond to
governance needs in general (See Figure 15).
Despite this challenge, however, the funding
levels for environment generally, and for
enforcement in particular, have been increasing in
recent years. Prior to 2006, capital investment for
environmental inspection was virtually non-
existent. In the last decade, this budget line has
increased roughly 10 fold, going from 2.6 billion
MNT (USD $1.1 million) in 2006 to more than 28
billion (USD $11.6) in 2015 and is now the second
largest budget line item for this group.174
Figure 14. 2000-2015 Capital Investment for Protection and Rehabilitation of Natural Resources in Mongolia
Figure 15. Limited Human and Economic Resources175
The view from the aimag level is even worse than
that experienced by protected area rangers. In
Selenge aimag, 28 rangers are expected to cover
its 41,000 km2 while in Bayan-Ulgii, 30 rangers
174 Id.
175 Mongolian Statistical Information Service (www.1212.mn) for
data on Total Population (2016), Population Density (2016), and Tax Revenue (2016). CIA WorldFactBook (www.cia.gov) for data on Mongolia’s position within Global Rankings.
have responsibility for 45,700 km2. The average
for these two comes to an average surveillance
requirement of around 1,500 km2 per ranger.176
Virtually all aimags have similarly daunting
ranger to area ratios, although it is also true that
aimag administration has played a role in recent
years in funding ranger patrolling operations. As
a result, there are disparities among aimags.
Reports from enforcement personnel – rangers,
environmental inspectors, customs officials, and
police – during the survey are ubiquitous
concerning insufficient resources. Salaries are
insufficient and basic equipment (uniforms and
binoculars) in some cases old or unusable. Several
of those interviewed complained of the lack of
means for self-defense (such as stun batons or air
guns) to cope with armed poachers that rangers
and inspectors are expected to confront. Access
to motorized vehicles was not found to be the
norm, with many rangers relying on old
motorbikes or horses, which makes patrolling in
the winter sometimes impossible, or at least a
life-threatening task. Other specialized gear, such
as cameras, tents and blankets, lamps, GPS, and
instruments to preserve wildlife after seizures
seems to fall into the category of extraordinary
circumstances. Such equipment is usually only
available when there is outside support. Although
not a necessity for many, access to desks and
computers by rangers was also pointed to by
some as a missing and much-needed resource.
The dramatic shortage of public resources is
sometimes compensated by private ones,
including rangers using their own means
(vehicles, phones to take pictures, or even
clothing for uniforms), as well as donations from
mining companies and non-profit conservation
organizations. Although promoting public-private
partnerships to overcome structural shortages in
funding environmental protection is certainly a
smart strategy for the country, those partnerships
today are not enough to cover shortages and the
continuing lack of basic equipment has a clear
impact in the capacity to patrol and conduct
inspections. Enforcement officials interviewed in
this survey universally stated that patrolling plans
are constrained by a lack of fuel and some
environmental difficulties.177
176 Key Informant #3.13 (Bayan-Ulgii-Altai Mountain Inspector) and #4.1 (Selenge-Environmental Inspector).
177 Key Informant Interviews #1.3, #2.6, #2.7, #2.8, #3.3, #3.9, #4.3, #4.12, #5.2, #5.8, #5.11, #5.13, #6.8.
0
5
10
15
20
25
30
2000 2001 2002 2003 2004 2005 2006 2007 2008 2009 2010 2011 2012 2013 2014 2015
2000 - 2015 Capital Investment for Protection and Rehabilitation of Natural Resources in Mongolia
Environmental Protection Fund
Environmental Inspection
Special Protected Areas
Reforestation & Forestry Activities
Protection of Nature
Land Protection & Rehabilitation
In Billions of Tugrigs
76
The Threat of Violence Hinders Enforcement Rangers are not only challenged by the size of the
areas they must patrol, but by the threat of
violence. In many countries around the world,
rangers often find themselves on the frontlines in
the battle against poachers. Just in the Virunga
National Park in the Democratic Republic of the
Congo (DRC) alone, around 150 rangers have been
reported killed on duty. 178 It is estimated that
around 10,000 rangers worldwide have been
murdered while on duty in the last ten years, 80%
by poachers and militia groups.179
Violence, however, is not a common threat to
rangers in Mongolia compared to other countries.
As reported by surveyors, both poachers and
illegal fishermen have easy ways of avoiding
rangers and actively pursue this strategy to avoid
detection and prevent conflict.180 Finding ways of
knowing in advance about inspection plans,
including the days and areas to be patrolled,
seems to be the most common practice for
poachers to evade detection. An environmental
inspector from Uvs aimag estimates that one in
every two inspection operations may be leaked by
the officers involved. 181 Hunting at night is
another easy and common technique used to
avoid encountering rangers. As a Dornod
fisherman revealed, “since there is no possibility to
obtain permits to fish for us, we fish like thieves.
We are breaking the law, so we need to hide very 182
Under Mongolian law, protected area rangers are
also limited in their ability to conduct
enforcement actions and in the use of force. By
law, they can only use firearms in self-defense.
Pursuant to Article 32.2.1 of the Law on Protected
Areas, rangers have the right to use weapons
“when life and health of wildlife rangers are
potentially endangered due to a real
circumstance” or “when life and health of wildlife
rangers are potentially endangered by wild
animals.” For the most part, however, rangers are
178 Neme, Laurel, For Rangers on the Front Lines of Anti-Poaching Wars, Daily Trauma, National Geographic (Jun. 27, 2014), http://news.nationalgeographic.com/news/2014/06/140627-congo-virunga-wildlife-rangers-elephants-rhinos-poaching/.
179 Thin Green Line Foundation, What We Do, https://www.thingreenline.org.au/.
180 Key Informant Interview #2.2 (Uvs – Custom Officer).
181 Key Informant Interview #2.9 (Uvs – Environmental Inspector).
182 Key Informant Interview #6.4 (Dornod – Fisherman).
not armed, as revealed by this survey. They also
do not have the authority to arrest people; they
can only issue ticket citations. As a result, the
normal circumstance is that unarmed rangers
must approach armed men and travel to the
nearest community – often dozens of kilometers
away – to find a police officer to make the actual
arrests. With these preconditions, the tactic of
avoiding conflict seems the only reasonable
choice not only for poachers but also for rangers
themselves.
As a result, no stories of violence were collected
during the survey. Instead, there were many
stories of encounters between armed groups of
illegal hunters and rangers where conflict was
avoided by both sides. If it was not the poachers
escaping using their fast vehicles,183 then it was
the rangers themselves that fled the area to save
their lives.184
Similarities to Drug Trafficking Illicit wildlife trade may be classifiable as an
environmental crime, but it has more in common
with drug and human trafficking than other
environmental crimes, like illegal hazardous
waste dumping. Wildlife crimes are effectively
smuggling schemes to bring illegal wildlife
products into the market, sharing the same
logistics and financial methods used by
traffickers of weapons, drugs, people, and
diamonds (see Figure 16). The similarity between
wildlife crime and other smuggling crimes is
crucial to understanding and developing
appropriate enforcement and prosecution
strategies. It is in fighting this crime that
countries have developed some of the most
advanced prosecution techniques and where IWT
enforcement can benefit the most.
Wildlife investigators, particularly the special
agents of Homeland Security (ICE), the U.S. Fish
and Wildlife Service and the National Oceanic and
Atmospheric Administration, already use
techniques similar to those used in narcotics
enforcement, in particular, controlled deliveries of
contraband, followed by anticipatory warrants.185
The first technique is most effectively used when
authorities detect an unaccompanied freight with
183 Key Informant Interview #2.9 (Uvs – Environmental Inspector).
184 Key Informant Interview #5.2 (Umnogobi – Hunter).
185 Sellars, J. (2017) What Wildlife Trade Enforcement Can Learn from Drugs and Arms Enforcement. Global Initiative Against Transnational Organized Crime.

77
ilicit products. In these cases, enforcement
authorities allow, under strict surveillance, the
effective delivery of the freight to its final
destination, which allows them to identify a larger
portion of the network, and secure criminal
evidence against them. Anticipatory warrants are
essentially warrants sought from a judge based
on the suspicion that a crime will be committed at
a certain place in a certain moment. Standard
warrants operate only after a crime has been
committed and may be issued if enforcement
personnel have a reasonable belief that evidence
of a crime will be discovered. Both techniques
work together allowing authorities to be ready
with a search warrant at the moment the final
addressee of the illegal product receives the
freight.
Figure 16. Illegal Trade: Common Methods
These techniques avoid the drawback of catching
only the ‘mules’ and can result in overwhelming
evidence against trafficking networks. In the
world of smuggling, the term ‘mules’ refers to the
individuals used to carry illicit product, and not
those involved in the remainder of the illicit trade
chain. This survey revealed stories of Mongolian
women living in poverty being used to cross the
border with small amounts of illegal wildlife
hidden in candy and biscuit wrappers and
personal bags.186 Also, in these cases, the target of
enforcement actions were the ‘mules’ and never
reached those that manage the illicit network.
Controlled deliveries make it possible to move to
the next level and secure significant evidence of
crimes committed by the network. With this level
of evidence arrayed against them, defendants are
often more willing to cooperate, providing critical
information about suppliers and networks. The
greatest deterrent effect occurs when suppliers
are convicted, as opposed to minor traders and
mules.
Global operations coordinated through INTERPOL
against wildlife trade have been mimicking the
past experience in drug trafficking global
prosecution. These operations involve an
extraordinary number of police, customs, border
agencies, and environmental and wildlife officials
to tackle global networks with truly global
enforcement operations. Mongolia has
participated in one of the most recent operations,
resulting in significant achievements in terms of
suspects identified, wildlife seizures, and assets
confiscated (see Figure 17). These global
operations give Mongolia high levels of experience
with the real dimension of the international
traficking networks, the continuation of which is
encouraged.
Figure 17. INTERPOL Operation ThunderBird At a Glance
In Mongolia, there are opportunities to apply
additional criminal prosecution techniques to
186 Key Informant Interviews 1.8 and 1.12 from Khovd Aimag.

78
IWT. The legal analysis in Chapter 5 describes the
current system and highlights the legal reforms
that may enhance criminal procedures and would
contribute to more effective enforcement of
wildlife legislation.
International Organized Crime is Part of IWT in Mongolia Highly lucrative and illegal businesses are the
necessary grounds for organized international
crime networks to exist and flourish. Networks
involve a relatively high number of people,
operate with sophisticated equipment, invest in
expensive logistics and self-protection structures,
frequently using military equipment. They require
complex international monetary transactions to
pay regular bribes at numerous levels and in
many countries to secure their supply chains,
including sourcing, transportation, processing,
storage and final sale of the product of their
exploitation – whether the products are drugs,
wildlife products, counterfeit products or other.
Only highly lucrative transactions can finance all
of the operation costs associated with illegal
businesses in the way and at the scale criminal
networks require to survive.
Organized crime profiting from Mongolia’s
wildlife occurs around the highly profitable
trafficking of endangered species parts (such as
red deer, musk deer, brown bear, gray wolf,
corsac fox, wild horse, red fox, or Saiga antelope)
principally to supply the traditional medicine
markets of China, but also to a lesser extent in
Korea. As high ranking enforcement officials
revealed in this survey, international networks
operating in Mongolia involve Chinese and Korean
buyers that issue purchase requests or orders,
triggering a sequence of communications over
phone and internet at aimag and soum levels,
reaching poachers within the network, who then
plan for the harvest on-demand. Hunting happens
mainly in groups using fast vehicles and an array
of illegal hunting methods. Night lighting,
automatic weapons, intentional vehicle-wildlife
collisions, and car chasing comprise some of
these methods. Drones have also been identified
by the police as being used by criminal
organizations to geo-locate wildlife. 187 When the
“purchase order” is high, specialization occurs
with some of the hunters shooting from their
motorbikes, while others pick up the corpses
using large and fast vehicles. If not hurried by
time or unexpected inspectors in the field,
poachers take the time to extract the parts
needed while still in the field, leaving the corpses
behind. Once the harvest target has been
achieved, a chain of intermediaries at the local,
soum, and aimag level are in charge or collecting
the organs and parts from their assigned areas.
Avoiding passing through UB, the shipment or
shipments then go straight to the border at
Zamiin-Uud or Ereen to cross into China. One of
these key informants claimed to have participated
in the undercover investigation of up to 12
different criminal networks in recent years in
Mongolia, with an estimated value of their illegal
wildlife operations at USD 15 million.
Enforcement officers would not share any
information related to further actors in the
network beyond the importer, but many others
are needed to distribute the products to factories
for processing and to the wholesale and retail
markets for commercialization.
Synergies with Business to Hide Illicit Trade The terms ‘front company’ or ‘shell company’
both imply use of a legal business, which acts as a
front for the some other, typically illicit business.
On paper, the front or shell is an independent,
legal entity engaged in some form of legitimate
trade or service. In practice, however, it is
controlled and used by another organization,
typically involved in a prohibited activity; e.g.,
drug trade, human trafficking, and the like.
Using a legal trade to hide illegal trade is
common, an integral part of international wildlife
trade, and notoriously difficult to uncover. The
arrest of an ivory kingpin in Tanzania in 2015 is
an excellent example. Known as the Chinese ‘ivory
queen,’ the person was arrested in Tanzania for
smuggling over 200 elephant tusks, which she
moved using several front companies. Her arrest
came only after she had been in operation for
187 Key informant interview.
79
decades, and only after she crossed an
international border. 188
So far, the various surveys conducted in Mongolia,
including this one, have not uncovered this type
of operation. However, key informants from
Mongolia’s enforcement and customs staff are
pointing to possible business synergies between
wildlife traders and transporters linked to mining
operations.189 Given the expense of setting up a
mining operation, it is unlikely, however, that
these types of businesses serve solely as a front
for illicit wildlife trade. It does, nonetheless, offer
the opportunity to conceal illicit trade and
smuggle it across the border.
188 Smith, David, Chinese 'Ivory Queen' Charged with Smuggling 706 Elephant Tusks, The Guardian (Oct. 8, 2015), https://www.theguardian.com/environment/2015/oct/08/chinese-ivory-queen-charged-smuggling-706-elephant-tusks.
189 Key Informant Interviews from Umnovobi Aimag 5.8, 5.9,
5.10, 5.14 and 5.15.

CHAPTER IV
Institutions
and Laws

81
Institutional Landscape
Rebuilding Capacity The first Silent Steppe reported on the rapid
decline of Mongolia’s wildlife trade related
institutions, precipitated by the economic
collapse and the dramatic transformation of
government in the early 90s. As a key, sometimes
overused resource, however, wildlife had been a
concern for many decades already and its
management was firmly embedded in Mongolia’s
governance structure. Formal efforts to bring take
and trade under control began in the early 1900s
and, by the 1960s, Mongolia had instituted a
nationwide program that achieved successes not
seen before or since. Reminiscent of Chinggis
Khan’s decimal-based organization of his military
units, Mongolia organized its hunters into
‘brigades.’ Managed by a Central Hunting
Authority, these units operated in a tightly
controlled social environment (e.g., licensing
hunters, controlling weapons, ammunition, and
movement of people) and were the only ones
allowed to conduct official wildlife harvests.
Numbering 25,000, these brigades were present in
every aimag and soum, and had the power to
investigate and prosecute poaching incidents.
Well-organized and supported, they had a
dramatic impact on controlling hunting activity.
Testifying to this is the effectiveness of the
hunting ban on all internationally traded species
instituted in the early 1970s. According to official
figures, international trade was held at zero for a
full five years. For some species, hunting for
international trade was never resumed; for others,
the brigades maintained take and trade volumes
that did not again exceed 50% of prior levels.
Hunting brigades remained a strong part of the
legal and institutional fabric for wildlife
management until 1991, when the virtual
disappearance of funding and material supply
(fuel, ammunition, vehicles) left them effectively
powerless. Without the funding, and to some
extent considered a holdover from Soviet times,
they have never recovered their former status or
their operational capacity. According to a high-
level Police Official in the Eco-Crimes Division,
hunter’s associations ‘have lost their significance,’
as well as their historical reputation. Since
hunting licenses are not a requirement anymore,
anyone with a firearm permit can effectively be a
hunter.190
The radical increases in wildlife hunting and trade
that began in the post-Soviet era has led Mongolia
to again focus its attention on its wildlife. Over
the past several years, management and
enforcement agencies have been engaged in
effort to rebuild that is not yet complete and
has suffered setbacks. Some notable efforts in
the last 10-15 years have been the reorganization
among existing inspection and enforcement
agencies on environmental crimes, including illicit
wildlife trade. In particular, this includes: the
General Agency for Specialized Inspection
(GASI), 191 the Eco-Crimes Division of the Police,
and the Mobile Anti-Poaching Units (MAPUs).
GASI was created in 2002192 as a regulatory
agency of the Government of Mongolia,
centralizing existing inspection bodies that
previously operated as separate units located
in the various ministries. It concentrates
inspections in many fields, among them
environment, tourism, mining, and finances,
and benefits from standardized procedures
and synergies. As such, it is now the principal
agency for inspections related to wildlife take
and trade and is therefore also charged with
overseeing state environmental inspectors
and rangers stationed throughout the
country.
The Eco-Crimes Division of the Police is
another relatively new division, established in
2010 and responsible for the investigation of
crimes involving natural resources, including
wildlife.
Mobile Anti-poaching Units (MAPUs) have
also been created to conduct patrols in snow
leopard, saiga antelope, and Altai argali
ranges. Initially started and sponsored by
WWF Mongolia in 2001, these units represent
an integrated approach to patrols that
combine the experience and the suite of
enforcement powers held by GASI state
inspectors, rangers, custom officials, and
police.
190
Key Stakeholder Interview #UB17 Police authority of
Mongolia.
191 In Mongolian, the term used in the title of the Agency is ‘Expert’ as opposed to ‘Specialized.’ This report uses the English translation used by the official governmental website (http://eng.inspection.gov.mn).
192 Ikh Khural Resolution #58 and Government Resolution 126, 2002.

82
Figure 1. Capital Investment for Protection and Rehabilitation of Natural Resources
The responsibility of these and other related
agencies with respect to wildlife trade are further
described in the following sections. While some of
them have both general wildlife management and
enforcement functions (e.g., protected area
rangers), this report divides them into two groups
based on their primary roles:
as ‘regulators’ or ‘managers’ – responsible for
drafting and approving wildlife related laws
and regulations, as well as implementing them
(e.g., issuing hunting and trade permits, CITES
compliance, population surveys, and quota
setting, etc.); or
as ‘enforcers’ – responsible for detecting,
inspecting, investigating, and prosecuting
potential wildlife crimes.
In spite of the recent institutional developments,
there is much left to do and the public seems to
be aware of the challenge. The survey asked on
three occasions (to households, travel agencies,
and retail shops) about the respondent’s
perception of the government’s ability to
efficiently manage wildlife conservation and
tackle wildlife crime. Opinions on the importance
of wildlife conservation among the general public
as recorded in the household survey were
consistently high at 9.66 out of 10. The same
question was presented to market segments with
an interest in wildlife conservation (tourism
companies and restaurants that sell fish) with
similar results. In contrast, opinions of the ability
to prevent wildlife crime in the same survey were
low, at just 3.42 out of 10.
Figure 2. Public perception of government ability to prevent wildlife crime

83
Figure 3. Institutional Framework for Wildlife Trade in Mongolia
Regulators and Managers Standard wildlife trade related tasks for public
authorities include: establishing the legal
framework; implementing wildlife conservation
and research; managing protected areas and
reserves; conducting hunting management
through the establishment of hunting quotas,
hunting regions and permits, as well as managing
CITES trade. Many of these activities are directly
relevant to combatting illicit trade; they are the
backbone of the system that establishes what is,
and what is not legal.
In Mongolia, a total of eight government entities
(including local governments) from the executive
and legislative branches form the institutional
landscape that fulfill the wildlife trade related
regulatory and management tasks mentioned. The
distribution of responsibilities between national
and local levels is both necessary and appropriate
for a resource that requires a coordinated
approach across multiple jurisdictions, as well as
for on-the-ground activities to be successful. It is,
however, precisely in these divisions that some of
the observed weaknesses with respect to the
management of wildlife trade reside. In addition,
all of these government bodies lack the resources
and capacity necessary to more effectively
manage the country’s ability to control wildlife
trade, whether licit or illicit.
For purposes of comparison, the responsibilities
listed in the relevant laws were organized into
three basic types: 1) policy and conservation; 2)
hunting and trade; and 3) CITES management.
The first, policy and conservation, includes the
authority to issue laws and policies in whatever
form. This applies not only to those entities
typically associated with legislative development
(e.g., Parliament), but those executive agencies
that also issue decrees, regulations, orders, and
the like, as a normal part of their functions.
Figure 4 associates this authority with Parliament,
the President’s Office, the MET, and in limited
form for local governments.
The second set, hunting and trade, refers to
activities solely related to managing how, when,
where, and in what quantity animals may be taken
from the wild and traded. In some instances, the
law stipulates this authority. The MET, for
example, is recognized in the Law on Fauna as the
principle agency authorized to conduct all forms
of hunting management, including the
establishment of hunting seasons, zones, quotas,
and more. Parliament is not involved in the daily
business of managing hunting, but it does
approve legislation, and formally sets the list of
Very Rare animals in the Law on Fauna. The
exercise of this authority also effectively bans
hunting for the animals on this list. The
President’s Office, also not typically concerned
with hunting, has nonetheless in the past used its
power to issue Decrees to establish hunting bans.
Related to trade, but excluded from this section,
is Customs. This agency is responsible for
enforcing trade requirements and is listed in the
following section on Enforcers.
The third set, CITES management, is a limited
area of activity, but nonetheless an important
focus given its role in preventing international
trade from impacting endangered species. There
are two authorities responsible: the CITES
Management Authority (CITES MA), which handles
all activities other than issuing non-detriment
findings (NDFs); and the Scientific authority,
which issues NDFs and otherwise provides advice
to the CITES MA.
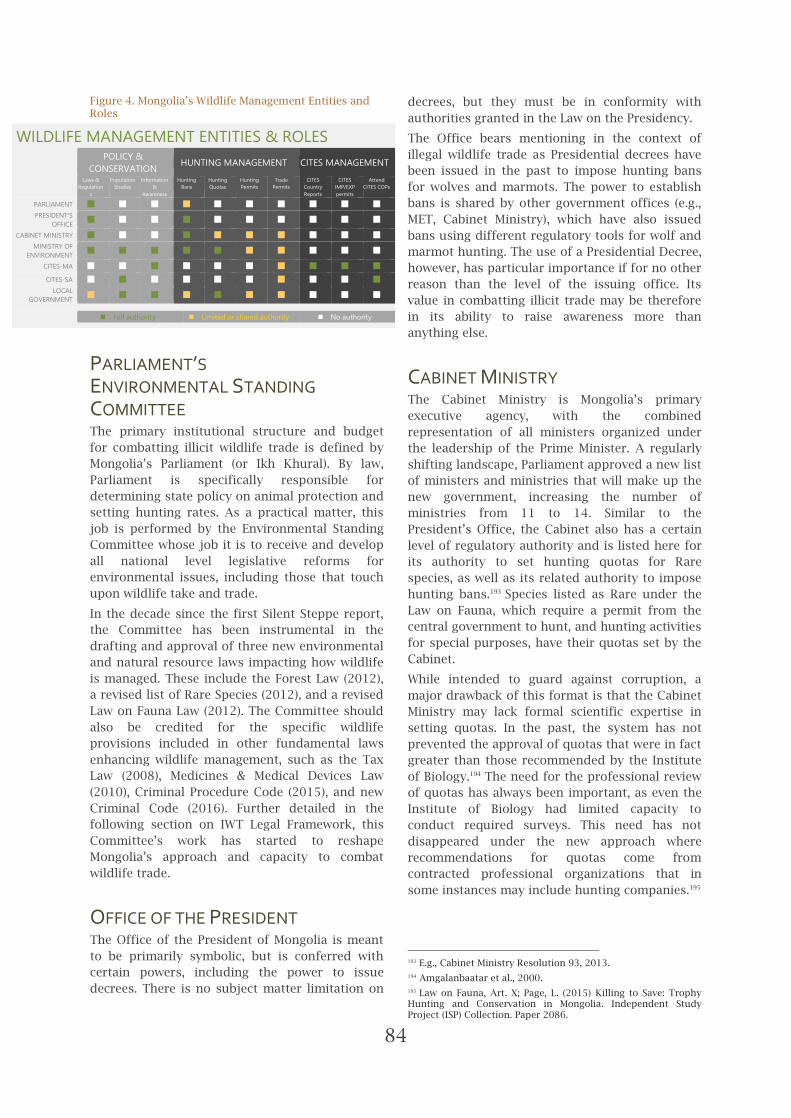
84
Figure 4. Mongolia’s Wildlife Management Entities and Roles
WILDLIFE MANAGEMENT ENTITIES & ROLES
POLICY &
CONSERVATION HUNTING MANAGEMENT CITES MANAGEMENT
Laws &
Regulation
s
Population
Studies
Information
&
Awareness
Hunting
Bans
Hunting
Quotas
Hunting
Permits
Trade
Permits
CITES
Country
Reports
CITES
IMP/EXP
permits
Attend
CITES COPs
PARLIAMENT
PRESIDENT'S
OFFICE
CABINET MINISTRY
MINISTRY OF
ENVIRONMENT
CITES-MA
CITES-SA
LOCAL
GOVERNMENT
Full authority Limited or shared authority No authority
PARLIAMENT’S ENVIRONMENTAL STANDING
COMMITTEE The primary institutional structure and budget
for combatting illicit wildlife trade is defined by
Mongolia’s Parliament (or Ikh Khural). By law,
Parliament is specifically responsible for
determining state policy on animal protection and
setting hunting rates. As a practical matter, this
job is performed by the Environmental Standing
Committee whose job it is to receive and develop
all national level legislative reforms for
environmental issues, including those that touch
upon wildlife take and trade.
In the decade since the first Silent Steppe report,
the Committee has been instrumental in the
drafting and approval of three new environmental
and natural resource laws impacting how wildlife
is managed. These include the Forest Law (2012),
a revised list of Rare Species (2012), and a revised
Law on Fauna Law (2012). The Committee should
also be credited for the specific wildlife
provisions included in other fundamental laws
enhancing wildlife management, such as the Tax
Law (2008), Medicines & Medical Devices Law
(2010), Criminal Procedure Code (2015), and new
Criminal Code (2016). Further detailed in the
following section on IWT Legal Framework, this
Committee’s work has started to reshape
Mongolia’s approach and capacity to combat
wildlife trade.
OFFICE OF THE PRESIDENT The Office of the President of Mongolia is meant
to be primarily symbolic, but is conferred with
certain powers, including the power to issue
decrees. There is no subject matter limitation on
decrees, but they must be in conformity with
authorities granted in the Law on the Presidency.
The Office bears mentioning in the context of
illegal wildlife trade as Presidential decrees have
been issued in the past to impose hunting bans
for wolves and marmots. The power to establish
bans is shared by other government offices (e.g.,
MET, Cabinet Ministry), which have also issued
bans using different regulatory tools for wolf and
marmot hunting. The use of a Presidential Decree,
however, has particular importance if for no other
reason than the level of the issuing office. Its
value in combatting illicit trade may be therefore
in its ability to raise awareness more than
anything else.
CABINET MINISTRY The Cabinet Ministry is Mongolia’s primary
executive agency, with the combined
representation of all ministers organized under
the leadership of the Prime Minister. A regularly
shifting landscape, Parliament approved a new list
of ministers and ministries that will make up the
new government, increasing the number of
ministries from 11 to 14. Similar to the
President’s Office, the Cabinet also has a certain
level of regulatory authority and is listed here for
its authority to set hunting quotas for Rare
species, as well as its related authority to impose
hunting bans.193 Species listed as Rare under the
Law on Fauna, which require a permit from the
central government to hunt, and hunting activities
for special purposes, have their quotas set by the
Cabinet.
While intended to guard against corruption, a
major drawback of this format is that the Cabinet
Ministry may lack formal scientific expertise in
setting quotas. In the past, the system has not
prevented the approval of quotas that were in fact
greater than those recommended by the Institute
of Biology.194 The need for the professional review
of quotas has always been important, as even the
Institute of Biology had limited capacity to
conduct required surveys. This need has not
disappeared under the new approach where
recommendations for quotas come from
contracted professional organizations that in
some instances may include hunting companies.195
193 E.g., Cabinet Ministry Resolution 93, 2013.
194 Amgalanbaatar et al., 2000.
195 Law on Fauna, Art. X; Page, L. (2015) Killing to Save: Trophy Hunting and Conservation in Mongolia. Independent Study Project (ISP) Collection. Paper 2086.

85
DEPARTMENT OF NATURAL
RESOURCES MANAGEMENT,
MINISTRY OF ENVIRONMENT AND
TOURISM The Department of Natural Resources
Management of the Ministry of Environment and
Tourism is Mongolia’s primary body responsible
for developing the implementing regulations for
wildlife, as well as directing the on-the-ground
management of wildlife, including the principal
responsibility for most of the country’s protected
areas, hunting and fishing regimes, legal trade in
CITES species, and combatting illegal wildlife
trade. In this last responsibility, it must be noted
that the Ministry is purely an administrative body,
and not an implementation or enforcement
authority. The Department itself does not in fact
have field operations. On-the-ground management
is led by other bodies. Without field operations,
the Department also lacks the authority and
ability to investigate, detain, or arrest for wildlife
trade related crimes. In contrast, similar agencies
in other countries have field officers with such
enforcement powers. This is the case, for
example, in Mexico, with its Environmental
Secretary (SEDEMA) and its ‘Environmental Police’
and in the US Fish and Wildlife Service with its
‘Special Agents.’
On the regulatory side, the Department has
developed three new regulations in the last
decade related to some degree to wildlife. These
include the Environmental Measures Decree
(2005), the Special Protected Areas Decree (2011),
and a Forest Law Resolution (2015). The section
on IWT Legal Framework analyzes the impact of
these and other regulations on the country’s
ability to fight wildlife crime.
The Department also manages and proposes
adjustments to the official lists of Very Rare and
Rare species. The national lists today include a
total of 31 Very Rare species and 76 Rare species,
for a total of 107 species with either complete or
strong restrictions on take and trade. The
additions, as well as the number of species on
those lists that are also targeted by hunters for
domestic and international trade, underscores the
importance of this management tool. Changes to
the list of Very Rare include new listings for six
birds, including Reed parrotbill (Paradoxornis
heudei), white-headed duck (Oxyura
leucocephala), short-toed snake eagle (Circaetus
gallicus), golden eagle (Aquila chrysaetos), Pallas’s
fish eagle (Haliaeetus leucoryphus), and greater
spotted eagle (Aquila clanga). Also of note is the
removal of the two species of sturgeon from the
list of Very Rare fish and the new listing of
Taimen as Rare.
Table 1. Mongolia’s List of Very Rare and Rare Species by Class, Comparative View 2000 and 2012
MONGOLIA
VERY RARE AND RARE SPECIES BY CLASS COMPARATIVE VIEW (2000-2012)
2000 2012
Very Rare 25 31
ALL Rare 10 76
SPECIES 35 107
Very Rare 11 13
Rare 10 14
MAMALS 21 24
Very Rare 8 9
Rare 2 23
BIRDS 10 32
Very Rare 4 2
Rare 0 1
FISH 4 3
Another task of this Department with direct
implications for combatting illicit trade is the
calculation of the ‘ecological value’ of species.
Required by the Law on Fauna,196 this value has in
the past been used to establish fines for illegal
hunting or trade. It is designed to monetize the
ecological loss of a particular specimen for a
given species for the country. In practical terms,
the established ‘ecological values’ tend to mimic
black-market prices and in this way are intended
to act as a deterrent to illegal harvests. Table 2
presents a sample of ecological values in
Mongolian Tugrig (MNT) and their equivalents in
USD for some of the most iconic species of
Mongolia.
196 Law on Fauna, Arts. 4.1.25; 5.3.3; 23, and 37.

86
Table 2. Wildlife Ecological Values in Mongolia
2016 EXAMPLES OF WILDLIFE ECOLOGICAL VALUES
In MNT and their equivalents in USD
male female
Panthera uncia MNT 22,400,000 MNT 26,000,000
SNOW LEAPARD $9,739 $11,304
Ovis ammon MNT 22,000,000 MNT 26,000,000
ARGALI SHEEP $9,565 $11,304
Pelecanus crispus MNT 13,140,000
DALMATIAN PELICAN $5,713
Cervus elaphus MNT 6,000,000 MNT 7,500,000
RED DEER $2,609 $3,261
Capra sibirica MNT
5,400,000 MNT 6,200,000
SIBERIAN IBEX $2,348 $2,696
Saiga tatarica mongolica MNT 4,000,000 MNT 4,400,000
MONGOLIAN SAIGA $1,739 $1,913
Procappra guturosa MNT 1,000,000 MNT 1,100,000
MONGOLIAN GAZELLE $435 $478
Hucho taimen MNT 422,000
TAIMEN $183
Tetraogallus altaicus MNT 260,000
ALTAI SNOWCOCK $113 Exchange Rate Used 1 USD = 2,300 MNT
Managing wildlife population surveys is also the
responsibility of this Department. As described in
the Law on Fauna, 197 wildlife surveys must be
implemented to ensure hunting quotas are
evidence-based. However, according to key
informants, and not surprisingly given the
vastness of the task and resource constraints,
these reports require more robustness and
frequency. The 2013 reports, for example had yet
to be submitted in the summer of 2016, three
years after being conducted.198 According to the
2015-2016 Mongolia Report sent to the CITES
Secretariat as a part of the bi-annual progress
reporting activities, population surveys have been
conducted for at least eight CITES listed species,
but none of the reports or results are available.
Species indicated in the report as surveyed are:
snow leopard (Panthera uncia), Eurasian lynx
(Lynx lynx), Pallas’s cat (Otocolobus manul), gray
197 See Law on Fauna, Arts. 5.3.2.
198 Key Stakeholder Interview (MOE).
wolf (Canis lupus), Przewalskii’s horse (Equus
przewalskii), Mongolian saiga antelope (Saiga
tatarica mongolica), gyrfalcon (Falco rusitcolus),
and peregrine falcon (Falco peregrinus). As a
result, this survey was not able to compile up-to-
date official data on estimated wildlife
populations for most species to compare with
those presented in the 2005 survey. In the
opinion of informants at the Department of
Biology at the National University of Mongolia,
government studies to estimate wildlife
populations occur only every 5 years and are not
always entirely reliable or useful, likely due to a
lack of funding capacity at the levels required to
survey Mongolia’s vast landscape.
The first Silent Steppe report cited dramatic
declines in Mongolian saiga antelope, red deer,
argali sheep, saker falcon, and Siberian marmot as
emblematic of the impact uncontrolled and illegal
wildlife trade was having at the time. Mongolian
saiga had declined from over 5,000 to less than
800, an 85% drop (WWF 2004). Red deer had gone
from 130,000 in 1986 to roughly 8,000-10,000 in
2004; a 92% decline in only 18 years. Argali,
estimated at 50,000 in 1975 and 60,000 in 1985,
were recorded at just 13,000 to 15,000 in 2001
(Amgalanbaatar et al. 2002); a 75% decline in just
16 years. Marmot once numbering more than 40
million, fell to around 5 million in 2002; a decline
of 75% in only 12 years (Batbold 2002). Finally,
saker falcons went from an estimated 3,000
breeding pairs in 1999 to 2,200 pairs in 2004; a
loss of 30% of the population in just 5 years
(Shagdarsuren 2001). Anecdotal evidence
suggested similar declines in the population of
other wildlife species were occurring, however no
data was available.
More recent population estimates are available
only for some of these, and in many instances,
they too, are already dated. The most recent argali
survey, for example, was conducted in 2009, and
concluded a population of 19,700 individuals,199 a
marginal increase over previous estimates.
Mongolian saiga populations have undergone
substantial changes, but the 2017 data estimates
almost 5,000 head. While this is far more than the
800 estimated in 2004,200 it is still less than more
recent surveys and represent a reduction of 54.5%
199 Lkhagvasuren, B, Y. Adiya, G. Tsogtjargal, G. Amgalanbaatar, and R. Harris. (2016) "Current Status and Conservation of Mountain Ungulates in Mongolia" (2016). Erforschung biologischer Ressourcen der Mongolei / Exploration into the Biological Resources of Mongolia, ISSN 0440-1298. 180.
200 This is the population figure used during the first Silent Steppe report.

87
due to due disease outbreak, and goat plague
(peste des petits ruminants).201
Lastly, the Department is charged with
establishing annual hunting quotas, a
responsibility it shares with local governments.
Lacking regular and reliable estimates of wildlife
populations means that the setting of quotas may
lack accuracy. As designed, the right to make
quota proposals rests with the local governments.
There are concerns about the potential lack of
expertise and funding within local governments
required to conduct scientifically sound studies.
Even if experts were available, the current
approach may still cause issues. Many species in
Mongolia are migratory or have large seasonal
movements. Purely local estimates are not likely
to represent the necessary larger context that
quotas need to consider.
As a matter of practice, local proposals are
reviewed by the Department and tend to be
accepted without significant adjustments. The
consolidated numbers for the entire country are
published annually in the form of government
resolutions. Except for falcons and birds, (which
receive a generic quota for all species within
them), only eight species had quotas for the last
three years (Table 3), including seven mammals
and one fish. The mammals include ibex,
Mongolian gazelle, red deer, roe deer, wild boar,
argali, and wolf – all species known to be targeted
by hunters. Without survey data, it is not possible
to say whether quotas are high or low, although
they have remained mostly steady. The quota for
Taimen is strictly for catch and release.
Reduced capacity within the Ministry has
exacerbated an already difficult task to address
illegal wildlife trade. At present, only one person
is dedicated to all wildlife programs, both
international and domestic. This is a recent
change. From 2011 – 2014 the Ministry had a
“National Committee on Rare and Endangered
Species” with four people working just on CITES
and wildlife trade issues. In 2014, however,
Parliament cut budgets to a number of national
committees, including this one. In the absence of
government funding, it ceased to function that
same year and has not been reinstated. All
international wildlife and biodiversity treaty
implementation and compliance issues, national
wildlife programs, and special hunting issues now
fall essentially on one staff member within the
office.
201 Online report available at http://wwf.panda.org/?296930/545-percent-of-the-Mongolian-Saiga-population-is-lost-due-to-disease-outbreak.
Table 3. Consolidated National Hunting Quotas for Personal Use.
2014-2016 MONGOLIA Annual Personal Hunting
Quotas 2014 2015 2016
Birds - 300 400
Falcons 40 300 400
Ibex 41 60 70
Mongolian Gazelle 200 150 150
Red Deer 20 15 30
Roe Deer 10 10 10
Taimen (Catch &
release) 310 350 400
Wild Board 10 10 10
Wild Sheep 28 50 60
Wolf 20 20 20
SOURCES 2014 - Government Resolution 122 (January 12, 2014) 2015 - Government Resolution 377 (May 1, 2014), amended on April 27,
2015
2016 - Government Resolution 463 (November 23, 2015)
CITES MANAGEMENT AUTHORITY The CITES Management Authority (CITES-MA) sits
in the Ministry of Environment and Tourism as an
unfunded office that operates mostly as a
coordinating committee with the legal obligation
to meet at least twice a year.202 Four professionals
are registered with the Convention as Mongolia’s
CITES-MA: i) The Director of the Department of
Environment and Natural Resources Management,
ii) one additional officer of that same unit, iii) the
Chairman of the CITES Implementation
Professionals Association in Mongolia (developing
the internet domain www.cites.mn), and iv) the
CEO of the Mongolian Professional Fauna and
Flora Organizations United Association (also
accredited as Scientific Authority). 203 Another
seven organizations, including police, customs,
GASI and NGOs, such as WWF Mongolia,
participate in the committee, although they are
not formally registered with CITES.
202 Key Stakeholder Interview (MOE).
203 CITES National Contact Information (https://cites.org/eng/cms/index.php/component/cp/country/MN.

88
Without exclusively dedicated staff, it is difficult
for Mongolia’s CITES-MA to be actively engaged in
the Convention, either for implementation or to
engage more widely in its biannual conferences.
During the last Conference of the Parties (CoP17)
organized in Johannesburg (South Africa) in 2016,
Mongolia was able to send only one
representative. Other countries with lower GDPs
were participating with significantly higher
number of delegates, as was the case for Namibia
(23), Mozambique (12), and Maldives (7). 204
Mongolia’s neighboring countries participated
with large delegations as well: China (26) and
Russia (10).
The situation in 2016 in South Africa was not
exceptional. A quick review of the participation of
Mongolia in COPs since its incorporation in 1996
reveals the same pattern during the past two
decades. (See Table 4) In the last three COPs, just
one representative from Mongolia has been able
to attend these important events.205 With multiple
sessions and negotiations occurring in many
different rooms at the same time, it is not hard to
understand how difficult, if not impossible, it is
for one representative to fully participate.
More than just a lack of participation, however,
this low attendance rate is also an indication of
Mongolia’s lost opportunities at CITES events to
strengthen coordination and collaboration with its
neighboring countries in its fight against illicit
wildlife trade. CITES-MA reports, for example,
only one joint enforcement operation with Russia
(2003-04 Report) and that communication with
other CITES authorities is infrequent (2015-16
Report). In 2016, it also reported having no
national or international enforcement strategy or
action plan, and no formal international
cooperation, such as an international enforcement
network. Mongolia has yet to formally join the
Snow Leopard and Wildlife Enforcement Network
(SLAWEN). Recognizing the need for improved
inter-agency and cross-border communication,
SLAWEN is a dedicated effort to facilitate the
sharing of wildlife trade enforcement data
between snow leopard range states. SLAWEN is
expected to complement other cross-border
enforcement networks including the South Asian
Wildlife Enforcement Network (SAWEN) and the
ASEAN Wildlife Enforcement Network
(ASEANWEN) establishing a similar system for the
Central Asian region, covering countries that are
204 CITES List of Participants to the 17th Conference of the Parts. (https://cites.org/sites/default/files/eng/cop/17/FinalCoP17ParticipantList.pdf).
205 CITES. List of Participants to the different COPs.
not eligible for membership in SAWEN or
ASEANWEN.
Table 4. Mongolia’s participation at CITES COPs since it joined in 1996
CITES Conferences of the Parties
(CoP) Official Participation of the Government of
Mongolia
CITES-MA
Representatives
CITES-SA
Representatives
10th CoP 1997 ZIMBAWBE 2 -
11th CoP 2000 KENYA 3 -
12th CoP 2002 CHILE 2 -
13th CoP 2004 THAILAND 3 -
14th CoP 2007 NETHERLANDS 1 1
15th CoP 2010 QATAR 1 -
16th CoP 2013 THAILAND 1 -
17th CoP 2016 SOUTH AFRICA 1 -
Reporting to the convention has been infrequent
since joining. Although countries commit
themselves to report on a biannual basis on the
national progress and impact of CITES
implementation, the Convention Secretariat has
received only two reports from Mongolia since
2003, corresponding to the periods 2003-2004
and 2015-2016. Not only are five reports missing
during the decade 2005-2014, but existing reports
sometimes lack accuracy and completion of
responses, and may not present evidence in the
form of attachments to back-up the assessments
provided (e.g., copies of legislation, data on
confiscation, etc.).206
Mongolia could take advantage of two convention
mechanisms that would reinforce its ability to
control illegal wildlife exports:
national export quotas, and
Annex III listings.
National export quotas are voluntary for Annex II
listed species, with Parties proposing them to the
Convention to cap their own CITES export permits
for selected species. A total of 36 countries of the
186 current CITES Parties are using this
mechanism to complement national hunting
quotas. Examples are Uzbekistan, with an export
quota of 6 Argali (skulls) per year; and Romania,
206 CITES Mongolia Biennial Reports at https://cites.org/eng/cms/index.php/component/cp/country/MN/national-reports.

89
setting a limit of 30 permits for wolf (skins and
skulls) exports.207
Annex III is a mechanism that parties use to
provide the same protection level afforded to
Annex II species, but applied only to exports of
unlisted species from their jurisdiction. Annex III
species are ones that either do not occur in other
countries or are not in danger on a global level
and have therefore not otherwise been listed by
CITES, but which would benefit from export
restrictions for that particular country. As an
example, India lists in Annex III of the Convention
the red fox (Vulpes vulpes); Pakistan lists the
Siberian ibex (Capra sibirica) – both of which are
examples of species that occur in Mongolia and
are subject to hunting and trade pressure. Any
country may request the inclusion of additional
species in Annex III. Trade is then regulated with
mandatory export permits accompanying its
passage through customs border points in source,
transit, and demand countries.
Species whose hunting is not completely banned
in Mongolia and that are known to be impacted by
international trade, might therefore benefit from
export quotas and Annex III protection include
the brown bear, red deer, Siberian and Altai
marmots, Siberian ibex, and Altai snowcock.
Beyond the more strategic functions of the CITES-
MA, its core and daily responsibility is in fact the
issuance of export and import permits for all
species contained in CITES Appendixes I and II. A
big question mark arises regarding its capacity to
deliver this service in an efficient manner due to
the structure and resources of the unit. It may be
true that the workload is small (since joining
CITES, Mongolia has never exceeded 100
combined import and export permits per year),
but its operations require some basic conditions.
First, permits should be made available for
exporters and importers close to their locations.
In a country the size of Mongolia, fulfilling this
condition is key to incentivizing legal trade
simply by reducing compliance burden. In
addition, a database of permits needs to be
accessible by enforcement officers at all times,
including police and custom officers.
At present, neither of these is available in
Mongolia. CITES permitting is a centralized
activity that obligates traders to travel to UB,
which from some locations can be a significant
undertaking. According to Mongolia’s 2016 CITES
report, permit issuance is still a paper-based
system although backed by an electronic data
management system not yet available for sharing 207 CITES National Export Quotas at https://cites.org/eng/resources/quotas/export_quotas.
with other concerned agencies, e.g., Customs. 208
Plans to move to an e-permitting system have
been declared, but no details are available in the
report or online.
A quick review of the CITES permits database as
published by CITES using information submitted
by its Parties, reveals that the information sent by
Mongolia has room to improve. Inconsistencies in
the way information is provided (e.g., parts
traded, the units, and purposes) may challenge
the reliability of the information and make it
difficult to accurately present a picture of CITES
trade in Mongolia.
Informants from different enforcement agencies
expressed the need to access wildlife trade
materials to better understand: the different
levels of protection afforded to species; the laws
and restrictions that apply depending on their
source, the season, and type of trade; the ability
to identify species based on the parts seized, how
to handle evidence, etc. The Convention has
developed state-of-the-art knowledge resources
and also training programs that would satisfy the
kind of information demanded by Mongolia’s
managers and enforcers including CITES
Implementation Model Legislation, Identification
Manuals, Species Fact Sheets and Guides, and a
Wildlife Crime Analytical Toolkit. A more active
CITES-MA could leverage these existing resources
and ensure they are properly distributed across
custom border points, ranger offices, police and
the court system.
CITES SCIENTIFIC AUTHORITY As stipulated in CITES, it is the role of the
Scientific Authority (CITES-SA) to make non-
detriment findings (NDFs). These are essentially
decisions that the proposed trade in Appendix I
and II species will not be detrimental to the
survival of that species or its role in the
ecosystem.209 NDFs may be written or verbal, or
may take the form of a quota. The Convention
does not provide guidance on the how NDFs must
be supported, but accepted evidence in the past
has included studies on species distribution,
population status, population trends, and threats.
In Mongolia, two people are officially appointed to
act as the CITES-SA: the Head of the Institute of
Biology at the Mongolian Academy of Sciences,
and the Head of the Mongolian Professional Fauna
and Flora Organizations United Association. It is
unclear what form their NDFs take, as there are
208 CITES Mongolia Biennial Report, 2016.
209 CITES, Arts. III and IV. There is no NDF requirement for Appendix III species.

90
no publicly available records of them. According
to Mongolia’s 2015-2016 CITES report, it has no
standard NDF procedures. 210 As reported by
Mongolia’s CITES-MA, export quotas are used.
According to the CITES database, however, there
are no export quotas in place for Mongolia for
2016 or 2017.211
More specific to illegal wildlife trade, Mongolia’s
CITES report claims that it has no capacity to
conduct forensic tests. According to other
sources, one of the members of the Scientific
Authority, the Institute of Biology, is the same
entity responsible for conducting forensic tests
on specimens submitted by enforcement officials
during wildlife crime investigations. In sum, the
small government budgets seen during previous
years, the general lack of participation in CITES
COPs, 212 and the absence of current population
estimates for many species, speaks to insufficient
institutional capacity also affecting the CITES-SA.
LOCAL GOVERNMENTS Local governments at the aimag and soum level
are principal actors in Mongolia’s efforts to
manage hunting and fishing resources within
their territory. The legal mandate of local
government officials includes close coordination
with the Ministry of Environment on issues such
as population surveys 213 wildlife conservation, 214
public awareness campaigns, 215 as well as the
general implementation of the Law on Fauna (e.g.,
quotas,216 and bans). A total of 69 hunting regions
have been established and all have hunting
management at the local level.217
Soums have the ultimate authority to issue
hunting permits pursuant to the approved quota
for their region. With the modifications to the
2012 Law of Fauna, funds from hunting permits
and trophy hunting no longer go to the state
budget controlled by the Ministry of Finance, but
to the soum governor’s budget.218 This incentive is
considered a positive development for combatting
illicit wildlife trade as local governments now
have a vested interest in maintaining the resource.
210 CITES Mongolia Biennial Report, 2016.
211 CITES National Export Quotas at https://cites.org/eng/resources/quotas/export_quotas
212 In the 20 years that Mongolia has been a member of CITES, a member of its Scientific Authority has attended only one time, the 14th COP in 2007.
213 Law on Fauna, Art. 5.5.3, 2012.
214 Law on Fauna, Arts. 6.1.3 and 6.1.7, 2012.
215 Law on Fauna, Art. 6.1.11, 2012.
216 Law on Fauna, Art. 26, 2012.
217 Key Stakeholder Interview (MOE)
218 Key Stakeholder Interview (MOE)
The Enforcers Similar to wildlife management, enforcement is
also a shared responsibility, involving eight
different government agencies that overlap with,
but include more than those involved in
regulation and management. Figure 5 summarizes
the key powers and authorities given to each of
the enforcement bodies. For purposes of
comparison, the powers assigned by law to the
different agencies have been organized into three
basic types including the authority to: 1) detect
and suspend; 2) search and seize; and 3)
investigate and enforce.
The first set of powers, (detect and suspend),
includes those typically exercised in the field at
the time a suspected violation is observed by
enforcement officers. As shown in Figure 5,
almost all of the entities listed have this primary
authority. The only exceptions are for soum
rangers and customs officers.
For soum rangers, this power is expressly
prohibited in the Environmental Protection
Law, with the caveat that it may be granted by
other legislation.219 Absent the grant, however,
soum rangers have no explicit authority to
inspect. A primary method of detecting
criminal activity, inspections, as used in this
context, should not be confused with the term
‘searches.’ The former involves methods of
observation exercised prior to any
determination of legal activity. They may be
instituted as a matter of course (e.g., a
Customs inspection) or because there is some
suspicion of illegal activity (e.g., a ranger
stopping and inspecting a hunter’s papers).
The right to suspend activities is similarly
limited for soum inspectors as per the same
provision limiting their right to inspect.
For customs officers, the right to inspect is
limited to initial inspections of goods
crossing the border. The moment a product,
document or activity is suspected of being a
violation, custom officers have to submit the
case to the Customs Division representative
of GASI.
The second set of legal enforcement powers,
search and seizure, are often exercised at the
scene of an infraction, but not exclusively. A
search and seizure may be part of a stop where
suspicion of a violation exists, but no formal
charges have been brought. They may, however,
also be conducted after the fact, during an
219 Environmental Protection Law Art. 28.1(2).
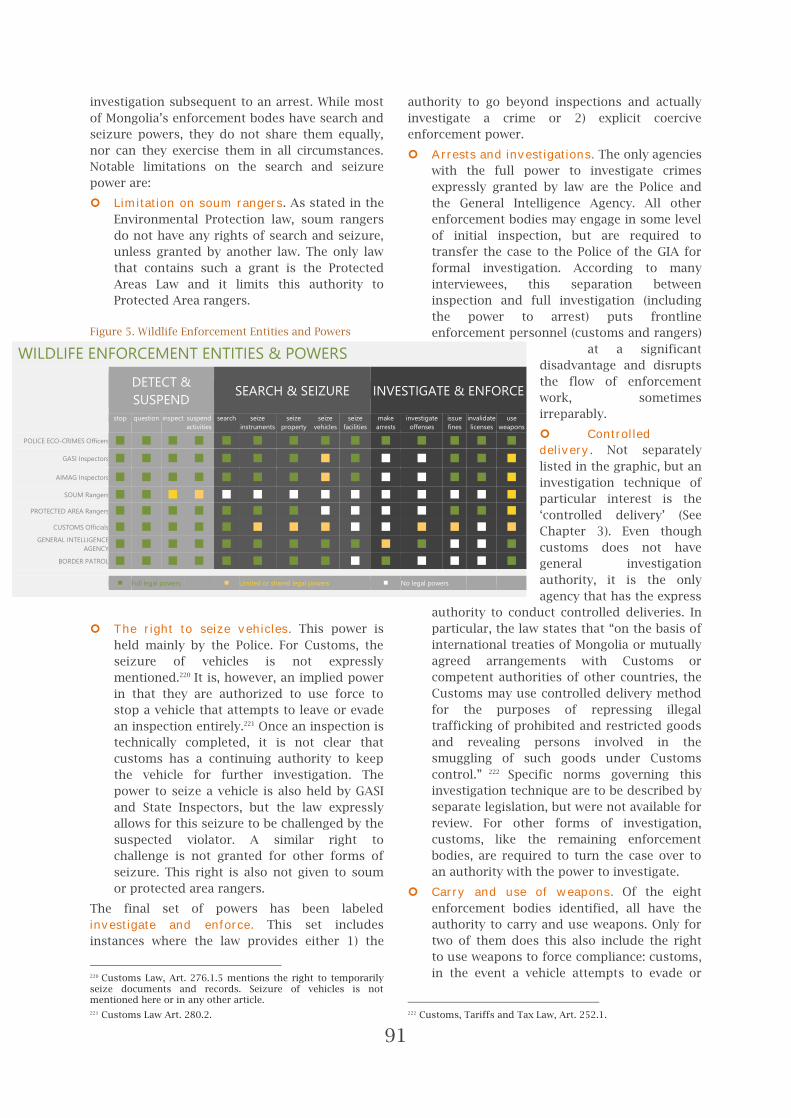
91
investigation subsequent to an arrest. While most
of Mongolia’s enforcement bodes have search and
seizure powers, they do not share them equally,
nor can they exercise them in all circumstances.
Notable limitations on the search and seizure
power are:
Limitation on soum rangers. As stated in the
Environmental Protection law, soum rangers
do not have any rights of search and seizure,
unless granted by another law. The only law
that contains such a grant is the Protected
Areas Law and it limits this authority to
Protected Area rangers.
Figure 5. Wildlife Enforcement Entities and Powers
The right to seize vehicles. This power is
held mainly by the Police. For Customs, the
seizure of vehicles is not expressly
mentioned.220 It is, however, an implied power
in that they are authorized to use force to
stop a vehicle that attempts to leave or evade
an inspection entirely.221 Once an inspection is
technically completed, it is not clear that
customs has a continuing authority to keep
the vehicle for further investigation. The
power to seize a vehicle is also held by GASI
and State Inspectors, but the law expressly
allows for this seizure to be challenged by the
suspected violator. A similar right to
challenge is not granted for other forms of
seizure. This right is also not given to soum
or protected area rangers.
The final set of powers has been labeled
investigate and enforce. This set includes
instances where the law provides either 1) the
220 Customs Law, Art. 276.1.5 mentions the right to temporarily seize documents and records. Seizure of vehicles is not mentioned here or in any other article.
221 Customs Law Art. 280.2.
authority to go beyond inspections and actually
investigate a crime or 2) explicit coercive
enforcement power.
Arrests and investigations. The only agencies
with the full power to investigate crimes
expressly granted by law are the Police and
the General Intelligence Agency. All other
enforcement bodies may engage in some level
of initial inspection, but are required to
transfer the case to the Police of the GIA for
formal investigation. According to many
interviewees, this separation between
inspection and full investigation (including
the power to arrest) puts frontline
enforcement personnel (customs and rangers)
at a significant
disadvantage and disrupts
the flow of enforcement
work, sometimes
irreparably.
Controlled
delivery. Not separately
listed in the graphic, but an
investigation technique of
particular interest is the
‘controlled delivery’ (See
Chapter 3). Even though
customs does not have
general investigation
authority, it is the only
agency that has the express
authority to conduct controlled deliveries. In
particular, the law states that “on the basis of
international treaties of Mongolia or mutually
agreed arrangements with Customs or
competent authorities of other countries, the
Customs may use controlled delivery method
for the purposes of repressing illegal
trafficking of prohibited and restricted goods
and revealing persons involved in the
smuggling of such goods under Customs
control.” 222 Specific norms governing this
investigation technique are to be described by
separate legislation, but were not available for
review. For other forms of investigation,
customs, like the remaining enforcement
bodies, are required to turn the case over to
an authority with the power to investigate.
Carry and use of weapons. Of the eight
enforcement bodies identified, all have the
authority to carry and use weapons. Only for
two of them does this also include the right
to use weapons to force compliance: customs,
in the event a vehicle attempts to evade or
222 Customs, Tariffs and Tax Law, Art. 252.1.
WILDLIFE ENFORCEMENT ENTITIES & POWERS
DETECT &
SUSPEND SEARCH & SEIZURE INVESTIGATE & ENFORCE
stop question inspect suspend
activities
search seize
instruments
seize
property
seize
vehicles
seize
facilities
make
arrests
investigate
offenses
issue
fines
invalidate
licenses
use
weapons
POLICE ECO-CRIMES Officers
GASI Inspectors
AIMAG Inspectors
SOUM Rangers
PROTECTED AREA Rangers
CUSTOMS Officials GENERAL INTELLIGENCE
AGENCY
BORDER PATROL
Full legal powers
Limited or shared legal powers No legal powers
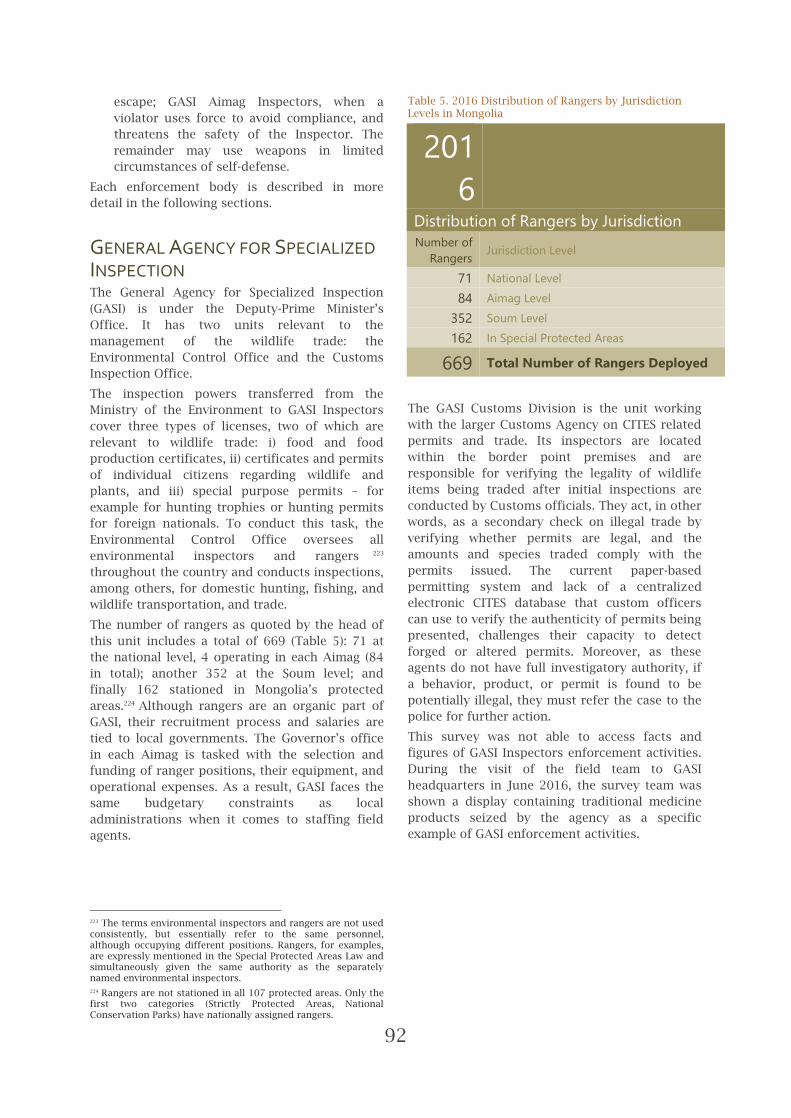
92
escape; GASI Aimag Inspectors, when a
violator uses force to avoid compliance, and
threatens the safety of the Inspector. The
remainder may use weapons in limited
circumstances of self-defense.
Each enforcement body is described in more
detail in the following sections.
GENERAL AGENCY FOR SPECIALIZED
INSPECTION The General Agency for Specialized Inspection
(GASI) is under the Deputy-Prime Minister’s
Office. It has two units relevant to the
management of the wildlife trade: the
Environmental Control Office and the Customs
Inspection Office.
The inspection powers transferred from the
Ministry of the Environment to GASI Inspectors
cover three types of licenses, two of which are
relevant to wildlife trade: i) food and food
production certificates, ii) certificates and permits
of individual citizens regarding wildlife and
plants, and iii) special purpose permits – for
example for hunting trophies or hunting permits
for foreign nationals. To conduct this task, the
Environmental Control Office oversees all
environmental inspectors and rangers 223
throughout the country and conducts inspections,
among others, for domestic hunting, fishing, and
wildlife transportation, and trade.
The number of rangers as quoted by the head of
this unit includes a total of 669 (Table 5): 71 at
the national level, 4 operating in each Aimag (84
in total); another 352 at the Soum level; and
finally 162 stationed in Mongolia’s protected
areas.224 Although rangers are an organic part of
GASI, their recruitment process and salaries are
tied to local governments. The Governor’s office
in each Aimag is tasked with the selection and
funding of ranger positions, their equipment, and
operational expenses. As a result, GASI faces the
same budgetary constraints as local
administrations when it comes to staffing field
agents.
223 The terms environmental inspectors and rangers are not used consistently, but essentially refer to the same personnel, although occupying different positions. Rangers, for examples, are expressly mentioned in the Special Protected Areas Law and simultaneously given the same authority as the separately named environmental inspectors.
224 Rangers are not stationed in all 107 protected areas. Only the first two categories (Strictly Protected Areas, National Conservation Parks) have nationally assigned rangers.
Table 5. 2016 Distribution of Rangers by Jurisdiction Levels in Mongolia
201
6
Distribution of Rangers by Jurisdiction
Number of
Rangers Jurisdiction Level
71 National Level
84 Aimag Level
352 Soum Level
162 In Special Protected Areas
669 Total Number of Rangers Deployed
The GASI Customs Division is the unit working
with the larger Customs Agency on CITES related
permits and trade. Its inspectors are located
within the border point premises and are
responsible for verifying the legality of wildlife
items being traded after initial inspections are
conducted by Customs officials. They act, in other
words, as a secondary check on illegal trade by
verifying whether permits are legal, and the
amounts and species traded comply with the
permits issued. The current paper-based
permitting system and lack of a centralized
electronic CITES database that custom officers
can use to verify the authenticity of permits being
presented, challenges their capacity to detect
forged or altered permits. Moreover, as these
agents do not have full investigatory authority, if
a behavior, product, or permit is found to be
potentially illegal, they must refer the case to the
police for further action.
This survey was not able to access facts and
figures of GASI Inspectors enforcement activities.
During the visit of the field team to GASI
headquarters in June 2016, the survey team was
shown a display containing traditional medicine
products seized by the agency as a specific
example of GASI enforcement activities.

93
Image 1. GASI’s seized traditional medicine products
AIMAG STATE INSPECTORS At the Aimag level, State Chief Inspectors and
State Inspectors are the highest level of non-
police enforcement authorities. These inspectors
operate under the umbrella of GASI, but also have
a relation with local governments, which provide
the funding for their operations. While they are
clearly under the direction of GASI National State
Inspectors, the rights and duties of each as
described in the Environmental Protection Law are
the same. They have a long list of inspection and
enforcement authorities that allow them to
suspend activities, inspect identification cards,
search and confiscate vehicles, as well as illicit
property, weapons, equipment, facilities and tools
used in the illicit activity. The power to seize
facilities is a type of authority unique to State
Inspectors at this level. In the context of their
monitoring and inspections, their rights include
entering businesses and organizations, but not
private residences. They do not, however, have
the power to arrest and cannot conduct full
investigations. Their use of weapons is limited to
instances of self-defense and instances where a
suspect “clearly refuses to comply… and uses
weapons or threatens the life of an inspector or
ranger in any other way” (emphasis added).225
The Law on Environmental Protection 226 lists
several enforcement authorities. As some of these
relate to each other, but have not been listed
together in the law, they have been regrouped
here under three headings for convenience as
follows: 1) detection and suspension, 2) search
and seizure, and 3) investigate and enforce:
225 Law on Environmental Protection, Art. 29.2(1).
226 Law on Special Protected Areas, Art. 31.2.
Detection and suspension authorities
obtain information from citizens,
businesses, and organizations required for
‘supervision’227
suspend activities of citizens, businesses,
and organizations228
inspect identification cards of citizens229
Search and Seizure
enter and ‘carry out supervision’ of business
entities and organizations230
take samples and have samples analyzed231
search vehicles232
confiscate identification cards, illicit
property, weapons, equipment, facilities, and
tools233
confiscate vehicles234
Investigate and Enforce
propose the invalidation of licenses, permits
and rights235
require or propose the invalidation of official
decisions that violate environmental law236
order elimination of damage caused237
impose administrative penalties238
carry weapons and instruments while
performing duties239
As part of the powers just listed, and as a specific
example of their use in combatting wildlife trade,
Dornod’s Governor Office operates three different
check points over the Kherlen river, a water
border crossing point in the east identified as
hotspot for illegal wildlife trade flowing to China.
During the winter, when the river is frozen,
transporters of illegal wildlife are known to avoid
the border point by crossing the ice to enter
China. Image 2 depicts the checkpoint building
and the handwritten instructions and controls
being used to track the different transports.240
227 Environmental Protection Law, Art. 27.1(2).
228 Environmental Protection Law, Art. 27.1(3).
229 Environmental Protection Law, Art. 27.1(6).
230 Environmental Protection Law, Art. 27.1(4).
231 Environmental Protection Law, Art. 27.1(4).
232 Environmental Protection Law, Art. 27.1(6).
233 Environmental Protection Law, Art. 27.1(6).
234 Environmental Protection Law, Art. 27.1(9).
235 Environmental Protection Law, Art. 27.1(10).
236 Environmental Protection Law, Art. 27.1(11).
237 Environmental Protection Law, Art. 27.1(3).
238 Environmental Protection Law, Art. 27.1(7).
239 Environmental Protection Law, Art. 29.1(3).
240 #1 Market Survey – Observational Sheet #804- 4 November 2016.

94
Image 2. Anti-Wildlife Trafficking Checkpoints established by Dornod Governor
SOUM RANGERS Soum rangers are the next level of enforcement
authority. Their placement at the Soum level with
patrol duties makes them essential in combatting
illegal hunting and trade. Their powers, however,
are limited principally to inspection, unless
otherwise authorized by law. In particular, they
are only permitted to supervise compliance, enter
businesses and organizations for this purpose,
and take and analyze samples. Pursuant to the
Law on Environmental Protection,241 soum ranger
powers include the following:
Detection and Suspension
supervise compliance242
enter and ‘carry out supervision’ of
business entities and organizations243
take samples and have samples
analyzed244
Investigate and Enforce
carry weapons and instruments while
performing duties245
241 Law on Special Protected Areas, Art. 28.1(1) and (2).
242 Environmental Protection Law, Art. 28.1(1), referencing Art. 27.1(1).
243 Environmental Protection Law, Art. 28.1(1), referencing Art. 27.1(4).
244 Environmental Protection Law, Art. Art. 28.1(1), referencing 27.1(4).
245 Environmental Protection Law, Art. 29.1(3).
According to the Law on Environmental
Protection, the additional rights to inspect,
suspend activities, search and seizure as listed in
Articles 27.1(6) and (7) of the Law are not
automatically among their rights. 246 These
additional powers include the imposition of
penalties, as well as the authority to inspect
identification cards, search and confiscate
vehicles, as well as seize illicit property, weapons,
equipment, facilities and tools used in the illicit
activity. For reasons not clear, the law states that
other laws may grant such rights. However, unless
such a grant has been made, the practical result is
that soum rangers cannot exercise them. No law,
other than the Special Protected Areas law, grants
such powers to rangers.
As with all other inspectors and rangers, they do
not have the power to arrest and cannot conduct
full investigations. Similar to State Inspectors,
their use of weapons is limited to only instances
of self-defense, and instances where a suspect
‘clearly refuses to comply… and uses weapons or
threatens the life of an inspector or ranger in any
other way.’247
Given the lack of authority, physical and financial
support, the on-the-ground reality for soum
rangers is difficult. Ranger Byambasuren, for
example, is responsible for the 1st and 2nd Bag of
Chandmani-Undur soum where he has been
working as ranger for 17 years. In recent years, he
states that he has been more focused on
protecting forests than wildlife because they are
no longer present. He related that he has not
received any protection equipment or special
clothing in the last few years. The only protection
he has is a police baton, pictured in Image 3 along
with his official ID card.
Image 3. Soum Ranger pictured with police baton and ranger ID.
The real story at the local level is that volunteer
rangers, of their own volition or in cooperation
with paid rangers, are doing much of the work.
246 Law on Special Protected Areas, Art. 28.1(2).
247 Law on Environmental Protection, Art. 29.2(1).

95
Ranger Erdenebayar from Tuv aimag, for example,
has put together a team of six volunteer rangers
from the local community. Together, they patrol
the entire soum with only a motorbike and limited
fuel. 248 Image 4 shows a volunteer ranger in
Bayankhongor Aimag with one of the survey team
members. He claims that like other local
residents, he is committed to, and helps protect
wildlife. Without being backed by official
resources or equipment, he monitors and
coordinates with travelers and tourists, as well as
supports authorities in managing wolf
populations in conflict situations. He explained
that he once received the award of “Best
Environmental Protector” from the Ministry of
Environment,249 revealing some degree of formal
recognition by authorities for the importance of
local volunteers.
Image 4. Volunteer ranger (left) and survey team member (right) in Bayankhongor Aimag.
PROTECTED AREA RANGERS Mongolia’s Protected area rangers act as a first
line of defense against illicit wildlife trade inside
its Strictly Protected Areas and Nature
Conservation Parks. By law, they have the same
status as ‘state environmental inspectors,’250 and
are structurally part of the Environmental Control
Office within GASI, but are also assigned to
protected areas managed by the MOE. Unlike
soum rangers, the Law on Fauna specifically
authorizes them to intervene and temporarily
stop illicit activities, and if necessary, search
vehicles, confiscate illicit property, weapons, and
instruments used in the illicit activity. They may
248 #2 – Household Survey – May 2016. Aimag: Tuv, Soum: Sergelen.
249 #1 – Household Survey – May 2016. Aimag: Bayankhongor.
250 Law on Special Protected Areas, Art. 31.1.
also make orders, instructions, and demands,
although the law provides no clarity on what
these may include. They do not however, have the
power to arrest, cannot seize vehicles, and cannot
conduct full investigations. In the context of their
monitoring and inspections, their rights include
entering businesses and organizations, but not
private residences. In contrast to the rights
exercised by State Inspectors, their use of
weapons is limited to instances of self-defense
only.251
Following the same division of enforcement
authorities applied to Aimag State Inspectors and
Soum Rangers, the Law on Special Protected
Areas 252 grants protected area rangers the
following:
Detection and Suspensions authorities
temporarily stop activities of citizens,
business entities and organizations253
check and collect documents of
suspects254
confiscate identification cards, weapons,
instruments and illicit property255
Search and Seizure
search vehicles256
entering and auditing business entities
and organizations257
Investigate and Enforce
carrying weapons and instruments while
performing duties258
imposing fines259
making orders, instructions, and
demands260
MOBILE ANTI-POACHING UNITS Another development in Mongolia that came as a
result of increased poaching of endangered
species was the creation of mobile anti-poaching
units (MAPUs), which currently operate in the
west, center, and east of the country. MAPUs are
joint units involving customs, GISA, police, and
rangers that collaborate on IWT.
251 Law on Special Protected Areas, Art. 32.
252 Law on Special Protected Areas, Art. 31.2.
253 Id. at Art. 31.2(4).
254 Id. at Art. 31.2(3).
255 Id. at Art. 31.2(3).
256 Id. at Art. 31.2(3).
257 Id. at Art. 31.2(2).
258 Id. at Art. 31.2(5).
259 Id. at Art. 31.2(1).
260 Id. at Art. 31.2(4).

96
MAPUs are intended to address an important gap
in fighting wildlife crime: the lack of regular and
immediate information exchange between
enforcement agencies. 261 As a practical matter, it
also removes the disruption in enforcement
activities caused when soum and protected area
rangers operate alone. By including all groups of
law enforcement within a single unit, information
exchange between the agencies is naturally
expected to increase. In the event the unit detects
a poaching incident, it combines all enforcement
powers necessary to detain, conduct searches,
seize weapons, instruments, property and
vehicles, makes arrests, and conduct
investigations.
The first MAPU was created in 2001 with support
from WWF Mongolia. After a first decade of
success, responsibility was handed over to the
government in 2010.262 In 2012, however, public
funds were cut and private funds were again
primarily responsible for funding the units.
MAPUs have since been funded by the mining
company Oyu Tolgoi (OT), with guidance and
training provided by WCS. 263 They have been
known to inspire other conservation private
efforts like the protection of taimen. Although
these units have seen some success, the lack of
direct integration in routine government activities
raises concerns for it continued operations.
POLICE ECO-CRIMES DIVISION Formally part of the Ministry of Justice, the Police
are the prime investigative and enforcement
authority for all crimes in Mongolia, including
illegal hunting and illegal wildlife trade. In 2010,
the Police established an Eco-Crimes Division, a
positive new development for Mongolia’s fight
against the illegal trade in wildlife since the first
Silent Steppe report. The Eco-Crime Division is
specifically tasked with environmental crimes,
offering the opportunity to accumulate the
expertise and practices necessary to fight
specialized crimes. Although the Division’s
attention is presently concentrated mostly on
mining cases, 15% of their caseload involves
illegal wildlife take and trade incidents.264
Eco-Crime Police officers are essentially the
middle point in the process between front-line
enforcement personnel and the prosecutor’s
261 Key Stakeholder Interview (WWF).
262 WWF Mongolia. The Way Forward: 20 Years in Mongolia.
263 Key Stakeholder Interview (WWF); Key Stakeholder Interview (OT) and WCS.
264 Key Informant Interview: Official within the Eco-Crimes Division.
office. Their involvement begins once a wildlife
product is determined to be illegal and in need of
further investigation, as may be determined and
referred to them by rangers, GASI Inspectors,
Customs, Border Patrol and GIA. The Police
cooperate with all of these agencies to conduct
investigations and inspections of illegal hunting
or illegal wildlife trade and rely heavily on
effective collaboration and information sharing.
They also work with the Institute of Biology on
evidentiary matters that require scientific
evidence, and with State Prosecutors to help bring
illegal wildlife cases to trial.
Similar to the Ministry of Environment, staffing
and resources of the division has shown a
downward trend in the years since its formation.
Staffed with 30 officials when created in 2010,
this has dropped to just 12 officials in 2016. Key
informants from the Division personally believe
that this amount of manpower is unlikely to cover
all of the Eco-Crimes cases they receive, much less
the wildlife cases. Cuts affect other operational
budget lines and police officers confirmed that
investigations are potentially jeopardized when
budget is not available to cover basic needs, such
as sending wildlife samples to a lab for
determination of species or date of death.265 Police
265 Institute of Biology is the certified lab used by Police to send wildlife sample. The cost of the Species identification test is
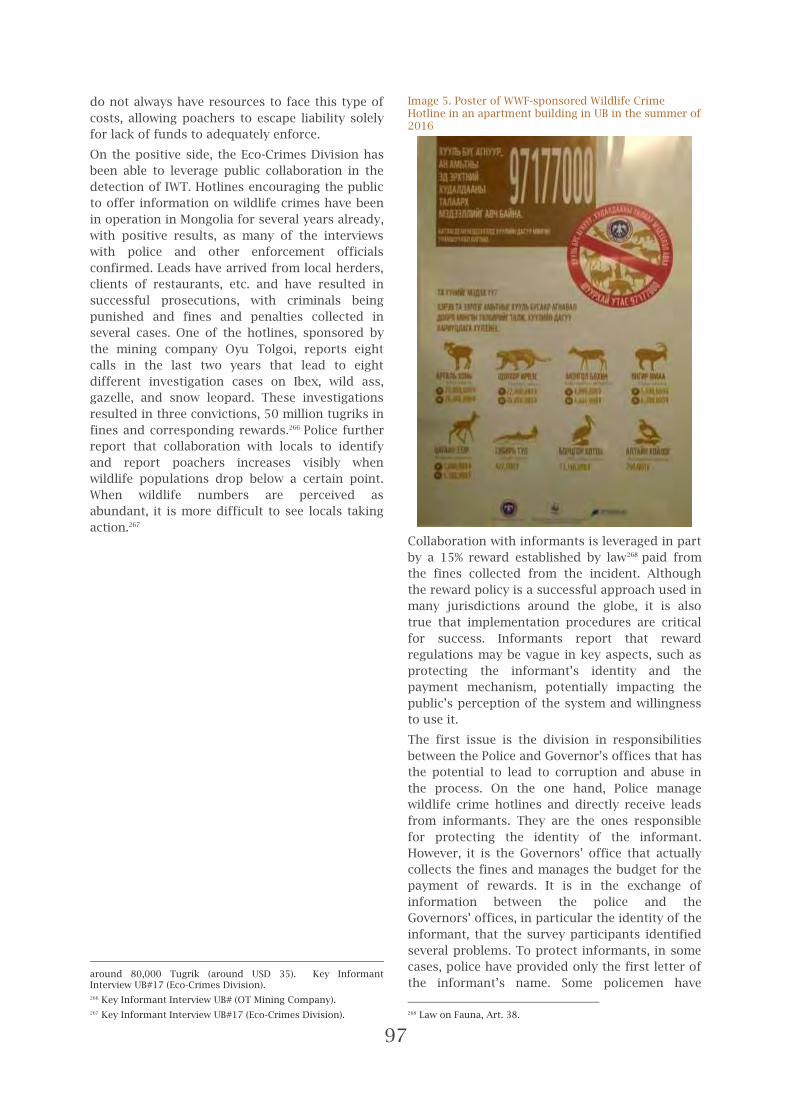
97
do not always have resources to face this type of
costs, allowing poachers to escape liability solely
for lack of funds to adequately enforce.
On the positive side, the Eco-Crimes Division has
been able to leverage public collaboration in the
detection of IWT. Hotlines encouraging the public
to offer information on wildlife crimes have been
in operation in Mongolia for several years already,
with positive results, as many of the interviews
with police and other enforcement officials
confirmed. Leads have arrived from local herders,
clients of restaurants, etc. and have resulted in
successful prosecutions, with criminals being
punished and fines and penalties collected in
several cases. One of the hotlines, sponsored by
the mining company Oyu Tolgoi, reports eight
calls in the last two years that lead to eight
different investigation cases on Ibex, wild ass,
gazelle, and snow leopard. These investigations
resulted in three convictions, 50 million tugriks in
fines and corresponding rewards.266 Police further
report that collaboration with locals to identify
and report poachers increases visibly when
wildlife populations drop below a certain point.
When wildlife numbers are perceived as
abundant, it is more difficult to see locals taking
action.267
around 80,000 Tugrik (around USD 35). Key Informant Interview UB#17 (Eco-Crimes Division).
266 Key Informant Interview UB# (OT Mining Company).
267 Key Informant Interview UB#17 (Eco-Crimes Division).
Image 5. Poster of WWF-sponsored Wildlife Crime Hotline in an apartment building in UB in the summer of 2016
Collaboration with informants is leveraged in part
by a 15% reward established by law268 paid from
the fines collected from the incident. Although
the reward policy is a successful approach used in
many jurisdictions around the globe, it is also
true that implementation procedures are critical
for success. Informants report that reward
regulations may be vague in key aspects, such as
protecting the informant’s identity and the
payment mechanism, potentially impacting the
public’s perception of the system and willingness
to use it.
The first issue is the division in responsibilities
between the Police and Governor’s offices that has
the potential to lead to corruption and abuse in
the process. On the one hand, Police manage
wildlife crime hotlines and directly receive leads
from informants. They are the ones responsible
for protecting the identity of the informant.
However, it is the Governors’ office that actually
collects the fines and manages the budget for the
payment of rewards. It is in the exchange of
information between the police and the
Governors’ offices, in particular the identity of the
informant, that the survey participants identified
several problems. To protect informants, in some
cases, police have provided only the first letter of
the informant’s name. Some policemen have
268 Law on Fauna, Art. 38.

98
reportedly used this technique, however, to take
the reward in place of the informant. When the
complete name of the informant was given, other
abnormal situations arose including the
information being leaked by relatives and friends
of the poachers and placing informants at risk.
Also, taking advantage of the fact that an
informant will not openly claim their reward, staff
at the Governor’s office could theoretically steal
the identity of the informant and cash the reward.
Finally, the regulations may lack details in the
terms of payment procedures and fail to specify
details regarding from what account and to what
account payments should be made. 269 While the
system has certainly experienced some success,
there remains room for improvement regarding
its application with respect to protecting the
identity of informants and ensuring that they
receive rewards as intended.
Beyond bringing increased expertise to the
matter, the Eco-Crimes Division is having an
impact on the ability to track wildlife crime
investigations. Figure 6 provides a summary of
this information for the years 2013 to 2016,
although only figures for the first five months of
2016 were available at the time of the survey. This
is not enough yet to really begin interpreting
trends, but it is informative nonetheless.
269 Key Informant Interviews #5.1, $5.8, #5.10, #5.12, and #5.13.
Figure 6. 2013-2016 Police Eco-Crimes Division Wildlife Investigation Cases
The first thing to highlight is that data on
investigations is solely for Criminal Code, Art.
203, which imposes criminal penalties for hunting
illegally. 270 According to the Prosecutor’s Office,
an additional 43 cases were investigated under
Article 175, covering illegal wildlife smuggling.
These were not part of the information provided
by the Eco-Crimes Division. It is also not known to
what extent enforcement authorities have
imposed administrative and fines and penalties
contained in other applicable laws. In the past,
these were contained directly in the relevant laws;
e.g., Law on Fauna, Law on Protected Areas, Law
on International Trade in Endangered Species, etc.
Today, they are consolidated within the new Law
on Infringements, which contains penalties for
wildlife related violations (see Table 8 and Table 9
for a detailed list of wildlife offenses and
penalties), some of which can be substantial.
However, as stated in the past (and a format
maintained under the new legislation), the
270 Art. 203.1 covers illegal hunting generally (e.g., without permission, with prohibited weapon, etc); Art. 203.2 covers hunting of Very Rare species and their illegal movement ‘through the state border.’

99
administrative fines were to be applied when the
incident was not otherwise subject to criminal
liability.271
Second, the total number of cases investigated
seems very low at only 168 for a period of almost
4 years. This likely underrepresents the actual
number of cases, as it does not entirely match
with data provided by Customs, GASI, the
Prosecutor’s Office, or with cases discussed by
key informants. In 2015, for example, GASI
Inspectors report catching a trader with 40
gazelle for sale. The Eco-Crimes Division,
however, records no cases of seized gazelle in
that year. Similarly, reports by Customs of
attempts to smuggle wolf carcasses (presented in
the following section) also do not appear in Police
records. To some extent, the differences may be
due to the fact that the Eco-Crimes Division only
deals with cases involving criminal penalties. For
example, the Customs Detector Dog Unit reported
310 cases of attempted illegal wildlife trade in the
last three years alone (80% of which were illegal
skins). This number is almost twice as many as
the cases investigated in the last four years, but
includes both criminal and administrative cases.
As already mentioned, the data does not indicate
how many cases were handled as administrative
infractions and therefore not reported to the
Police for investigation.
Third, the number of cases sent to court after
investigation averages 67% in the period (112 out
of 168). There are a number of factors that can
play into the decision to proceed with prosecution
(lack of evidence, missing witness, etc.), but the
overall percentage is not low compared to other
crimes or the experience in other countries.
Finally, the species still most impacted by illegal
hunting is the marmot, making up 98% of all
specimens seized. Known to be targeted both for
domestic consumption and international fur
trade, hunting continues despite the succession of
restrictions and bans introduced since the late
90s. Of the Very Rare and Rare species impacted
by trade, the Mongolian saiga (VR), snow leopard
(VR), red deer (R), and brown bear (R) are the top
two in these categories.
CUSTOMS GENERAL
ADMINISTRATION International wildlife trade enforcement begins at
the border where customs officials conduct
inspections on permits, other paper work such as
271 See for example: Law on Fauna, Art. 39; Law on Special Protected Areas, Art. 43.
transport bills, or vehicles certifications, and
products to determine the legality of trade. For
this reason, the customs administration is set to
play a prominent role in CITES enforcement
worldwide. In Mongolia, the Custom General
Administration 272 is part of the larger Customs
and Tax Authority (CTA), overseeing at the same
time the Mongolia Tax Administration. 273
Historically a part of different ministries (e.g., the
Ministry of Finance, Trade and Industry, Defense
and Social Security, Foreign Trade and the
Cabinet), its most recent association with tax
collection is, in the opinion of customs officers
interviewed, a factor that explains why
enforcement duties over imports and exports is a
major concern. It also explains why it receives
most of the attention compared to other issues,
such as security or trade norms. In 2011,
Mongolia Customs collected over 3 trillion tugrigs
(USD 1.3 billion) in customs duties; accounting for
40% of all state revenue and 6% of the GDP. 274
Exports of minerals and imports of oil, vehicles
and construction and mining equipment are the
primary sources of customs revenue and
consequently attract most of the attention. As
much as 90% of the export and import
commodities cross through Altanbulag (Selenge),
Sukhbaatar, and Zamiin-Uud ports, and most of
the Customs operational resources are dedicated
to these same ports.275
A couple of examples illustrate the emphasis on
tax collection. One of the most recent training
seminars organized at the Zamiin-Uud, Dornogobi
province, and bringing together 600 officials from
Customs General Administration, GASI and Eco-
Criminal Police on 6-7 April, 2017 on “Crime
Prevention” focused the syllabus on crimes
related to drug trafficking, cybercrime, border
quarantine control, offenses prevention and
leadership, with no focus on wildlife trafficking
issues. As a second example, although Customs
has lab capacity in seven different locations and
modern equipment thanks to support from the
Asian Development Bank, technology is available
only to test products with high duties (and
therefore income potential) such as drugs,
alcohol, cigarettes, minerals, petroleum or
cashmere. There are no specialized testing
capabilities for wildlife parts. To date, the
customs labs have performed 14,806 tests and
helped to uncover the wrong classification of
272 www.customs.gov.mn
273 www.mta.mn
274 Information published at the Customs General Authority Site, Support Divisions (www.customs.gov.mn)
275 Information published at the Customs General Authority Site, Current Environment (www.customs.gov.mn)

100
goods made by traders in the attempt to reduce
or avoid the payment of their custom duties. At
the same time, the Customs Detector Dog unit
reports that 80% of the 310 administrative and
criminal offenses detected by the dogs in the last
3 years (2013-2015) were related to animal fur
and only 20% to other products.276
Image 6. Dog inspecting a truck at Customs border crossing
Beyond the headquarter offices in
UB, Customs General
Administration staff is distributed
among 50 physical sites around the
country. Those locations
correspond to three different
categories of facilities, including 14
Customs houses, 20 Custom
branches and 16 Border crossing
points. 277 Image 7 present some views of the
custom’s infrastructure visited during the field
survey. In these, a first inspection of goods takes
place on any import and export, including for
wildlife.
Image 7. Custom’s infrastructure from 2016 field visits
Custom inspectors make a first determination
whether the transaction is legal or not. If legal,
276 Information published at the Customs General Authority Site, Support Divisions (www.customs.gov.mn)
277 Information published at the Customs General Authority Site, Organizational Structure (www.customs.gov.mn)
goods are referred to GASI Inspectors, who verify
standards, quality, certificates, and permits
(including CITES and export certificates). If a
custom inspector suspects that a transaction is
illegal, goods are referred to Police for further
investigation. Transports are also inspected to
uncover attempts of smuggling. Image 8 depicts
the inspection of vehicles and trucks at the
Khavirga border. The custom officer is checking
and inspecting before it crosses the eastern
border to China. During the inspection, inspectors
pull luggage from vehicles and trucks when
needed, check underneath using a mirror, and
check tires by knocking on them. Given the
number of areas that wildlife may be hidden, and
the lack of adequate inspection tools, it is likely
that these efforts are only finding a small
percentage of actual trade. Again, any findings
resulting in a violation beyond custom
administrative offenses are transferred to the
Police staff sitting in the same customs facilities.
Image 8. Inspection process at Khavirga border (November 2016)
The required ‘handing off’ of the case just
described is in contrast to other countries278 and
has been highlighted as a crucial break in the
enforcement process. The World Customs
Organization (WCO) stated in a recent illicit trade
report that this authority “to interdict
shipments… can have a dramatic effect on
improving the situation for Customs,” and
encourages administrations to improve their legal
frameworks by giving this power directly to
Customs officials. 279 The Customs Office of
Mongolia, however, has limited investigative
authority and information flows in one direction.
As a result, the customs officials who initially
discovered an illegal wildlife product is unlikely
to know what happens to a case once it has been
moved to the Police.
278 In the US, for example, the customs office (Department of Homeland Security- Immigration and Customs Enforcement- DHS/ICE) has strong investigative authority.
279 World Customs Organization, Illicit Trade Report 2012, (2013) 36.
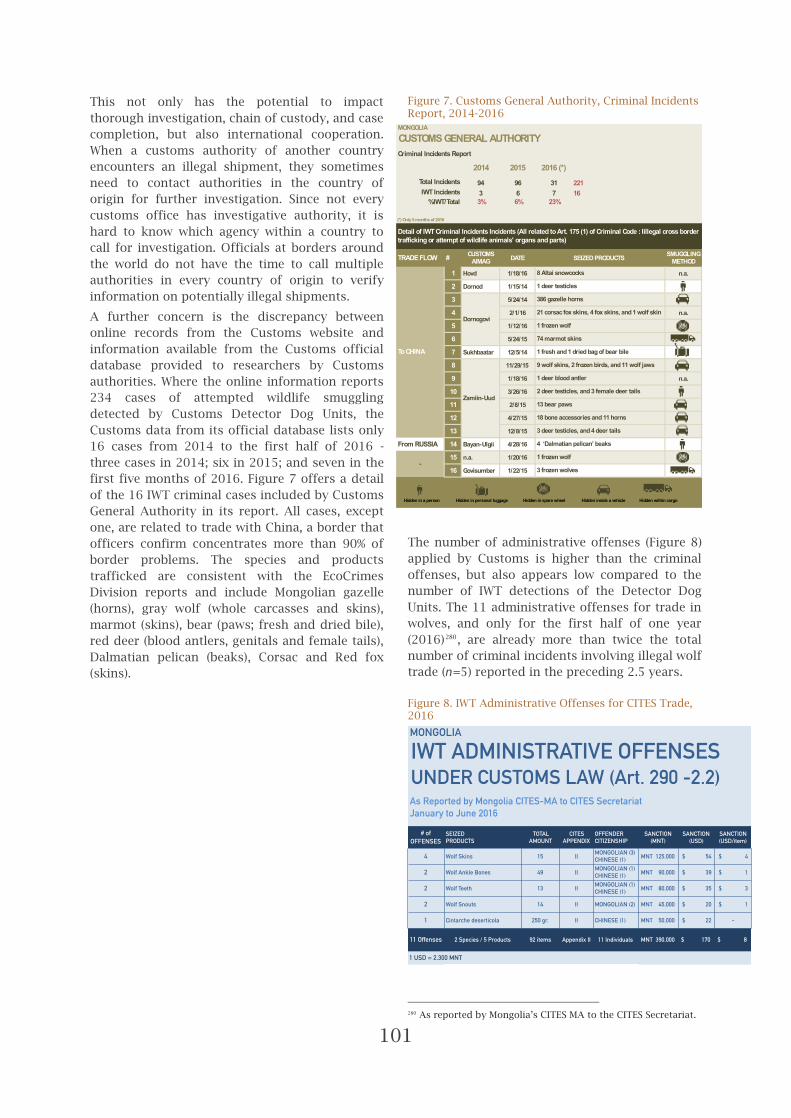
101
This not only has the potential to impact
thorough investigation, chain of custody, and case
completion, but also international cooperation.
When a customs authority of another country
encounters an illegal shipment, they sometimes
need to contact authorities in the country of
origin for further investigation. Since not every
customs office has investigative authority, it is
hard to know which agency within a country to
call for investigation. Officials at borders around
the world do not have the time to call multiple
authorities in every country of origin to verify
information on potentially illegal shipments.
A further concern is the discrepancy between
online records from the Customs website and
information available from the Customs official
database provided to researchers by Customs
authorities. Where the online information reports
234 cases of attempted wildlife smuggling
detected by Customs Detector Dog Units, the
Customs data from its official database lists only
16 cases from 2014 to the first half of 2016 -
three cases in 2014; six in 2015; and seven in the
first five months of 2016. Figure 7 offers a detail
of the 16 IWT criminal cases included by Customs
General Authority in its report. All cases, except
one, are related to trade with China, a border that
officers confirm concentrates more than 90% of
border problems. The species and products
trafficked are consistent with the EcoCrimes
Division reports and include Mongolian gazelle
(horns), gray wolf (whole carcasses and skins),
marmot (skins), bear (paws; fresh and dried bile),
red deer (blood antlers, genitals and female tails),
Dalmatian pelican (beaks), Corsac and Red fox
(skins).
Figure 7. Customs General Authority, Criminal Incidents Report, 2014-2016
The number of administrative offenses (Figure 8)
applied by Customs is higher than the criminal
offenses, but also appears low compared to the
number of IWT detections of the Detector Dog
Units. The 11 administrative offenses for trade in
wolves, and only for the first half of one year
(2016)280, are already more than twice the total
number of criminal incidents involving illegal wolf
trade (n=5) reported in the preceding 2.5 years.
Figure 8. IWT Administrative Offenses for CITES Trade, 2016
280 As reported by Mongolia’s CITES MA to the CITES Secretariat.
MONGOLIA
CUSTOMS GENERAL AUTHORITYCriminal Incidents Report
2014 2015 2016 (*)Total Incidents 94 96 31 221IWT Incidents 3 6 7 16
% IWT/Total 3% 6% 23%
(*) Only 5 months of 2016
TRADE FLOW # CUSTOMS AIMAG DATE SEIZED PRODUCTS SMUGGLING
METHOD
1 Hovd 1/18/16 n.a.
2 Dornod 1/15/14
3 5/24/14
4 2/1/16 n.a.
5 1/12/16
6 5/24/15
7 Sukhbaatar 12/5/14
8 11/29/15
9 1/18/16 n.a.
10 3/26/16
11 2/8/15
12 4/27/15
13 12/8/15
From RUSSIA 14 Bayan-Ulgii 4/28/16
15 n.a. 1/20/16
16 Govisumber 1/22/15
Hidden in a person Hidden in personal luggage Hidden in spare wheel Hidden inside a vehicle Hidden within cargo
Detail of IWT Criminal Incidents Incidents (All related to Art. 175 (1) of Criminal Code : Iillegal cross border trafficking or attempt of wildlife animals' organs and parts)
8 Altai snowcocks
1 deer testicles
386 gazelle horns
21 corsac fox skins, 4 fox skins, and 1 wolf skin
13 bear paws Zamiin-Uud
To CHINA
-
Dornogovi1 frozen wolf
74 marmot skins
1 fresh and 1 dried bag of bear bile
9 wolf skins, 2 frozen birds, and 11 wolf jaws
1 deer blood antler
2 deer testicles, and 3 female deer tails
18 bone accessories and 11 horns
3 deer testicles, and 4 deer tails
4 ‘Dalmatian pelican’ beaks
1 frozen wolf
3 frozen wolves

102
Customs inspectors also shared pictures of a case
involving the small-scale smuggling of four
Dalmatian pelican beaks from Kazakhstan that
transited through Russia, with the final
destination being Mongolia.281 Dalmatian pelicans
(Pelicanus crispus) are classified as Very Rare
under the Mongolian Law on Fauna and listed on
CITES Appendix I. Hunting and all forms of trade
in pelican beaks are strictly prohibited in the
country. Pelican beaks are prized in Mongolia as
traditional sweat blades, used to remove sweat
from horses after a hard ride. The smuggler was a
Mongolian national who tried to cross the border
illegally from Russia at Mongolia’s northern
Altanbulag port with the contraband hidden
under his jacket. This was purportedly a transit
case headed to China, previously referred to in
this report in Chapter 3 and the only one of its
kind involving an Appendix I species so far
detected by customs authorities in recent years.
Image 9. Altanbulag Port inspectors identify smuggling of pelican beaks, sourced in Kazakhstan and transiting through Russia
When visiting Umnugobi’s border point to China
on November 7th 2016, the survey field team
witnessed the search of a Mongolian woman
trying to smuggle 3 kg of gazelle antlers hidden in
under her clothing into China. Image 10 depicts
the moment when she was asked to remove her
jacket and shoes during the customs search.
281 Customs Case #14.
Image 10. Woman discovered attempting to smuggle gazelle antlers to China
Image 11 shows a seizure of mixed wildlife
products at the Zamiin-Uud border point that
occurred in November 2015 at the beginning of
the winter when IWT is known to increase. The
dog unit was able to identify, hidden inside black
bags among the cargo of a UAZ 469 truck
travelling to China, a total of 31 different wildlife
products. The shipment included several wolf
skins (nine are visible in the photograph), two
birds listed as western capercaillie, but identified
by Mongolian biologists as either spotted
capercaillie or black grouse,282 wolf canines (9, as
reported by customs staff) transported with the
snout to, in the words of the smuggler, allow the
client to verify that they are not dog canines.
Image 11. Wildlife seizures by the dog unit at Zamiin-Uud port
Image 12 depicts the most common modus
operandi when exporting frozen wolves to China.
The frozen corpse has the front legs tied and is
placed inside a rudimentary bag. In this case, the
smuggler used a shipment of beef to hide the
wolf, but was stopped by customs officials on
January 2016.
282 The western capercaillie is not listed as Very Rare or Rare by Mongolia. Hunting quotas are not issued for this species separately.

103
Image 12. Confiscated frozen wolf in January 2016, that was hidden among a beef meat shipment in an attempt to smuggle it to China
A key obstacle identified by Customs officers
themselves in this survey is their lack of ability to
detect IWT, including: i) a lack of investigative
capacity, ii) no electronic link with MoE to verify
the authenticity of CITES permits, and iii)
insufficient training about wildlife laws, species
recognition, etc.283
GENERAL INTELLIGENCE AGENCY In 2000, after a long period of reorganization of
the intelligence apparatus, Mongolia established a
modern General Intelligence Agency (GIA) to
support the enforcement of more than 25
different types of laws and regulations related to
national security and crime, including wildlife
crime. In addition, Article 27 of the Criminal
Procedure Code puts the General Intelligence
Agency in charge of investigating the illegal
passage of items through Mongolia’s border. GIA
is therefore another key enforcement body
relevant to illicit international wildlife trade.
GIA agents gather intelligence on money
laundering operations, human trafficking,
firearms trafficking, corruption, and smuggling
through Mongolia’s borders. They share this
information with Police and Ministry of Justice for
283 Key Stakeholder Interviews (Customs Agency).
prosecution. GIA also has its own hotline and
dedicated email addresses to facilitate
collaboration from citizens providing leads and
information on such crimes.
GENERAL AUTHORITY FOR BORDER
PROTECTION The General Authority for Border Protection
(GABP) holds the mandate and jurisdiction to
enforce the law within a 15 km wide buffer zone
that stretches the entire 8,252 km perimeter of
the country, defining an area of 123,780 km2. In
operation since 1933 under different names and
ministries (e.g., Defense and Interior), the GABP
was reshaped in 2002 as a regulatory agency of
the Ministry of Justice. Its primary mission is to
prevent the entry of terrorists and terrorist
weapons into the country. It is also responsible
for deterring the entry of illegal immigrants and
for prohibiting the trafficking of illegal
substances across the nation’s borders. GABP has
authority at points of entry, and oversees a total
of 46 operative border crossings points, which
includes 14 international crossing points, 14 Bi-
lateral permanent ones, 10 two-way temporary
crossing points, and 7 transit points. They are
charged with handling document inspections.
GABP officers do not, however, have the authority
to handle customs, immigration, and agricultural
inspections. Aside from enforcing laws on
national security and border protection, this
agency also implements 53 existing bilateral
agreements on border protection with other
countries (15 of them with Russia and another 13
with China). According to GABP, 3 million people
and 1.5 million vehicles cross Mongolia’s borders
on an annual basis. 284
A specific example of the role of GABP enforcing
wildlife legislation and a positive case of inter-
agency cooperation was the MOU signed between
the Ministry of Environment, WWF and the
General Authority for Border Protection in 2010.
The agreement was signed ‘…in an effort to
protect the lives of migratory species such as
argali and gazelle and prevention of illegal
wildlife trade.’ 285 In 2007, WWF developed
“SARAN”, a software program for monitoring
species and tested it in two border areas of the
Mongolian side of the Altai Sayan Ecoregion. The
following involvement of GABP allowed the
284 General Authority for Border Protection site at http://bpo.gov.mn.
285 Post “General Authority for Border Protection and WWF Mongolia have a Memorandum of Understanding” on June 10, 2011 at WWF Mongolia site (http://mongolia.panda.org/en/?200594/Ge).

104
scaling of the effort nationwide, creating
synergies for wildlife protection while building
capacity of border officers in conservation
issues.286
Corruption Similar to many countries, corruption in Mongolia
is an issue. With a score of 38 (where 0 is highly
corrupt and 100 is very clean) and ranking 87th
out of 176 countries on Transparency
International’s 2016 Corruption Index, Mongolia
falls well below the mid-point in the index and is
among the “lower ranked” countries along with its
neighbors China (40) and Russia (29). According
to Transparency International, “lower-ranked
are plagued by untrustworthy and
badly functioning public institutions,’ corruption
laws are not implemented, and people frequently
face bribes and extortion. This ranking has not
changed significantly in the past 5 years, and in
2017 dropped two points to 36 (ranking 103 out
of 180 countries; suggesting that anti-corruption
efforts will require a long-term effort.
Independent surveys in Mongolia put some
numbers behind this finding – 31% of businesses
expect to give gifts to officials to ‘get things
done’; 287 10% of trading companies encounter
corruption in the course of their work; 7% percent
of the individuals surveyed had paid a bribe in the
three months prior to the survey; and Mongolian
citizens generally perceive customs officials to be
corrupt.288
As attested to by several key informants during
the survey, there is potential for instances of
collusion, bribes, and embezzlement that are also
connected to illicit wildlife trade. Among the
practices described, are the following unverified
anecdotes:
Inspectors that do not issue the actual fine
documentation when imposing fines. There is
suspicion that the fine receipts are not
reported to the governor’s office and instead
kept by the enforcement agent.289
286 Post “General Authority for Border Protection and WWF Mongolia have a Memorandum of Understanding” on June 10, 2011 at WWF Mongolia site (http://mongolia.panda.org/en/?200594/Ge).
287 Enterprise Surveys 2013, available at http://www.enterprisesurveys.org/data/exploreeconomies/2013/mongolia.
288 Asia Foundation, Jun. 2015.
289 Key Informant Interview UB-Fisher#11 describing how at Lake Uggi, unidentified Inspectors fine fishermen but never hand out the physical documents.
Government officials issuing hunting permits
to staff they hire in public offices in exchange
for the meat obtained. In one instance, a key
informant reported that meat obtained this
way was used to feed children at the soum
secondary school.290
Bribing rangers to ‘look the other way,’ while
they hunt or fish illegally. Taking advantage
of the low salaries rangers receive, hunters
have a number of ways to bribe, including
cash payments, providing alcohol, paying for
the school tuition of a ranger’s child, paying
for a wife’s medical treatment, etc.291
Rangers engaged in hunting and trade directly
to supplement their income.
Low ranking Customs officials colluding with
smugglers to transport products across the
border.
Corruption indices by Aimag provide further
insight. Of note are the high-levels of corruption
in all Aimags (averaging .65 in 2013), which
remained relatively unchanged for the years
reported (2009-2013). However, during those past
years it has also been at its highest in the three
Aimags that are also the primary trade and
commercial centers – Sukhbaatar (0.77 in 2013),
Tov (0.71 in 2009), and Dornogobi (0.65 in 2013).
Critical to international wildlife trade, each of
these aimags have the most frequently used
customs transit points. Only one of these three
(Tov Aimag) has shown improvement, which was
given a score of 0.58 in 2013.
Table 6. Corruption Index by Aimag 2009, 2011 and 2013
Corruption Index by Aimag Aimag 2009 2011 2013
Bayan-Ulgii 0.54 0.46 0.56
Gobi-Altai 0.59 0.62 0.69
Zavkhan 0.64 0.63 0.46
Uvs 0.54 0.54 0.64
Khovd 0.49 0.49 0.59
Arkhangai 0.47 0.60 0.73
Bayankhongor 0.58 0.58 0.59
Bulgan 0.66 0.66 0.69
Uvurkhangai 0.60 0.66 069
Khuvsgul 0.55 0.53 0.53
Orkhon 0.49 0.56 0.61
Dornogobi 0.66 0.64 0.65
Dundogobi 0.66 0.55 0.63
Umnugobi 0.55 0.53 0.63
290 Key Informant Interview UB-Hunter #7.
291 Key Informant Interview UB-Fisher#8 and #9, Hunter #19.

105
Selenge 0.64 0.69 0.58
Tov 0.71 0.68 0.58
Darkhan-Uul 0.60 052 0.64
Govisumber 0.67 0.58 0.61
Dornod 0.59 0.65 0.66
Sukhbaatar 0.58 0.67 0.77
Khentii 0.56 0.68 0.68
Average 0.64 0.63 0.65
Corruption, however, is not limited to custom
officials. It is normal for Mongolians to use social
pressure with friends working in the
administration to obtain favors (such as
permissions, pardons of a fine, avoid searches,
etc.).292 When it comes to hunting, the chance that
a ranger will point to a relative, friend, or
acquaintance as an illegal hunter is very low.
There is really little to no protection offered for
rangers. As they live in the areas where they are
expected to enforce the law, they need to
maintain good relations with the community. If
they fine their friends and neighbors for every
illegal hunting incident, they themselves would be
unable to cope. Sometimes, they have no choice
but to overlook illegal activity. For instance, after
fining an individual on several occasions, rangers
may often feel pressured to let them go in the
future.293
Mongolia, however, is making positive progress, the legal environment and some high-level corruption cases have been uncovered.294 Mongolia is not a party to the OECD Convention on Combating Bribery, but it has ratified the United Nations Convention against Corruption. It also addresses corruption in two national laws; the Anti-Corruption Law (2006) and the Criminal Code (2016). The Anti-Corruption Law establishes the Independent Agency Against Corruption (IAAC) as the principal agency responsible for investigating corruption cases. The IAAC has the power to monitor for corruption and conduct investigations, including customs, border officials, and rangers. The Criminal Code penalizes the abuse of functions, money laundering, as well as active and passive bribes of officials and providers. Punishments include imprisonment for up to ten years as well as fines.
Impeding progress, not uncommon between
government agencies, is Mongolia’s management
and enforcement offices tend to work in silos
with a general lack of collaboration. Though there
is a working relationship between GASI, Police,
Customs, and the Ministry of Environment, there
292 Key Informant Interview, UB #2 (NGO Director).
293 Key Informant Interview UB #2 (NGO Director) and UB-Fisher#8 and Hunter #18.
294 Key Stakeholder Interview (IAAC).
is limited interagency cooperation. This lack of
collaboration was a repeated narrative throughout
various interviews with government and private
stakeholders alike. One major obstacle included
the lack of a centralized database to register and
monitor 1) all hunting permits given by local
authorities; 2) all CITES import/export permits, 3)
all assets confiscated in wildlife cases; and 3) all
revenue flows from hunting permits and fines to
park management budgets, rewards, etc.295
295 Key Stakeholder Interview (IAAC).

106
IWT Legal Framework Supporting the institutional improvements of the
last decade described in the previous section have
been several legal developments significantly
enhancing the normative framework to manage
wildlife generally and combat illicit trade. In
addition to the creation of a new CITES
implementation law in 2002 and a new Law on
Infringements in 2015, there have been
amendments to four core laws including the Law
on Fauna, the Law on Reinvestment of Natural
Resource Use Fees, the Law on Advertisement,
and the Criminal Code. This section of the report
outlines these and other changes and assesses the
strengths and weaknesses of the legal system to
combat illegal wildlife trade. It is divided into two
major sections describing:
The Full Framework – providing description of
the framework of laws relevant to wildlife
management and the prosecution of wildlife
related crimes.
What Constitutes a Wildlife Offense – pulling
from the relevant legislation, this section
provides a composite view of wildlife offenses
as they apply to domestic take and trade, and
international trade, including applicable
administrative and criminal penalties. It also
discusses and analyzes legal gaps for the
different sub-sections that call for further legal
developments. Each of the gap analyses looks
principally at the language of the law, but is
supplemented by commentary from key
informants on implementation and prosecution
practices wherever such information was
available.
Before describing the framework of the laws
reviewed, it should be noted that Mongolia has
made significant changes to its IWT laws. The
change to note is the creation of a new Law on
Infringements in 2015, replacing the 1992 Law on
Administrative Penalties. This law is intended to
consolidate all administrative fines that in the
past were found in up to 220 separate pieces of
legislation. It includes one chapter dedicated to
violations of environmental law with subsections
on violations of the Laws on Fauna, Special
Protected Areas, and International Trade in
Endangered Species. Other chapters cover related
legislation also identified in this framework
including Laws on Customs, Advertising, Anti-
Corruption, and Anti-Money Laundering. With this
cross-cutting change, Mongolia improves the
consistency and transparency of its
administrative penalty system. Among the
improvements is the overall increase in fine levels
over the previous law, which in some instances
were considered insufficient to act as deterrents.
Offenses defined by the Law on Infringements
that relate to wildlife trade are discussed in the
following sections.
The second major development has been the
substantial revision of the Criminal Code, with
particular implications for the prosecution of
wildlife crimes as it covers more parts of the
wildlife trade chain, has less ambiguous language,
and contains some application of criminal liability
to organized crime and legal entities, albeit
limited for wildlife crimes. The offenses defined
by the Criminal Code with respect to wildlife
trade are discussed in the following sections.
The Full Framework Not including the multiple hunting restrictions
and bans issued over the years, or legislation that
has been recently superseded, the current legal
framework compiled and assessed includes 20
laws and regulations, as well as the most recent
examples from two additional categories of
periodically issued regulations; hunting bans and
hunting quotas. The Criminal Code was analyzed
both in its 2002 and its 2015 versions, since the
most recent did not enter into force until July of
2017, well after the primary survey was
completed.
Figure 9 presents a snapshot of the legal
framework, organizing the laws according to basic
hierarchical relations with the Constitution at the
center; which confirms in one of its initial articles
the State’s ownership of the resource and, by
extension, its power to regulate it.296 The figure
also groups laws based on the role they play with
respect to wildlife take, trade, and enforcement.
Defining procedures and limitations applicable to
wildlife take are three resource-related laws.
These include the Law on Forest, the Law on
Special Protected Areas; and the Law on Fauna.
The Law on Fauna acts as a core legal instrument
in the framework, and the umbrella for many
others that define, inter alia, status of species,
296 2001 Constitution, Article 6.

107
hunting quotas and bans, financial requirements,
and permitting processes.
Figure 9. IWT Legal Framework Map, Mongolia 2017
In the wildlife trade sphere, another five laws are
considered relevant. Belonging to this group are
three laws regulating domestic trade including the
Advertisement Law, the Medicine and Medical
Devices Law (in reference to traditional medicine),
and Tax Law. Concerning international trade, the
framework includes the Customs Tariffs and
Taxes Law and the Law on Foreign Trade of
Endangered Species, which implements
Mongolia’s CITES trade obligations.
The analysis includes five laws relevant to wildlife
crime: the Criminal Code, Criminal Procedure
Code, the new Law on Infringements and two
additional laws that may be useful, but which
have no express relation to wildlife crime; e.g., the
Anti-Corruption and the Anti-Money Laundering
Law. So far as the enforcement and case records
indicate, these last two laws have never been used
in Mongolia in any wildlife trade cases. Their
relationship, therefore, is untested and based
purely on an assessment by international and
Mongolian legal specialists of their potential
application and the example of other countries
applying these connecting laws to prosecute
wildlife crime. Mongolia’s anti-corruption and
anti-money laundering laws do not specifically
mention wildlife or wildlife trade in any article.
Instead, they take a generic approach that
theoretically apply, and as attested to by key
informants, could include instances of wildlife
trade. For this reason, it has
been deemed applicable and
therefore included in the
framework.
The same legal framework is
represented in Figure 10,
organized as a chronological
list of laws, showing the date of
entry into force or last
amendment. This
complementary display of the
framework highlights the
important legal developments
in the decade (2006-2016) since
the first Silent Steppe report.
This is especially true for the
five laws related to
enforcement, all of them
approved or updated during
the last decade, hinting at the
possibility for enforcers to take
advantage of modern legal
tools in the investigation and
prosecution of prosecute
wildlife crime.
Finally, Table 7 provides yet another view of the
same framework, this time organizing the laws in
two broad groups (‘primary’ and ‘related’ laws),
based on the degree of relevance of each
particular law with the topic of wildlife trade. In
this case, the framework lists the different laws
and provides a brief summary of the role each law
plays in regulating IWT.
In presenting these lists and diagrams, the goal is
to show as many parts of the system that relate to
or can be used to combat illicit wildlife trade.
Having a full picture of all parts of the system can
support multiple functions, in particular the
development of comprehensive investigation and
prosecution strategies. True in the legal field as
much as other areas of governance, the
professionals involved tend to work with silos of
information and the parts of the legal system they
are directly charged with implementing and
therefore most familiar with. Laws that may also
be applicable are not always considered, or not
considered early enough to make sure that
investigations secure necessary evidence in
support of these additional prosecution
strategies. In Mongolia, for example, cases of
international trade in CITES listed species were
either prosecuted under the former Criminal Code
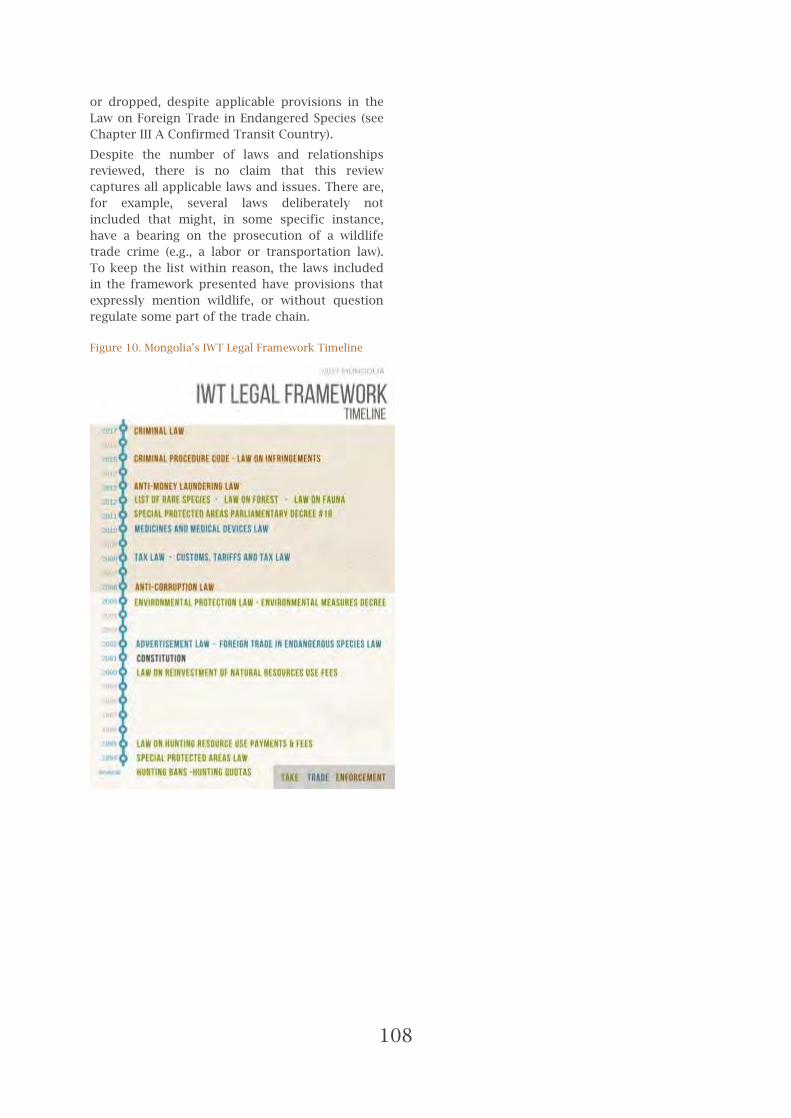
108
or dropped, despite applicable provisions in the
Law on Foreign Trade in Endangered Species (see
Chapter III A Confirmed Transit Country).
Despite the number of laws and relationships
reviewed, there is no claim that this review
captures all applicable laws and issues. There are,
for example, several laws deliberately not
included that might, in some specific instance,
have a bearing on the prosecution of a wildlife
trade crime (e.g., a labor or transportation law).
To keep the list within reason, the laws included
in the framework presented have provisions that
expressly mention wildlife, or without question
regulate some part of the trade chain.
Figure 10. Mongolia’s IWT Legal Framework Timeline

109
Table 7. Mongolia’s IWT Legal Framework organized as Primary and Related Legislation
2017
MONGOLIA
IWT LEGAL FRAMEWORK
Title Year Legal Area Relevance to Wildlife Take & Trade
P R I M A R Y L E G I S L A T I O N
Law on Fauna 2012 Natural
Resources
Mongolia's Law on Fauna is the primary law addressing wildlife take and trade. The entire law
has relevance to the management of wildlife, and several specific articles that deal with take
and trade: e.g., Article 7 establishes the list of ‘Very Rare’ species (for which all commercial
take and trade is prohibited) and references the creation of a list of Rare species; Article 12
prohibits selling animal raw materials when the animal's origin is not specified. The Law on
Fauna superseded the 2000 Law on Hunting, which before 2012 was the primary law
regulating take.
Cabinet Ministry Order
on List of Rare Species
2012 Natural
Resources
Pursuant to the Law on Fauna, the Cabinet Ministry is responsible for issuing the list of Rare
Species; a category with heightened protection and limits on take and trade.
Hunting Quotas
Government
Resolutions
Annual Natural
Resources
The Ministry of Environment issues hunting quotas on an annual basis. This review was able
to obtain the resolutions for 2010, 2012, and 2014-2016.
Temporary Hunting
Bans and Restrictions
Various Natural
Resources
Over the years, various authorities in the Mongolian government have issued complete or
partial bans on hunting. This review obtained seven documents of this type directed at
marmots, argali, gray wolf, and fox.
Law on Hunting
Resource Use
Payments & Fees
1995 Natural
Resources;
Finance
The law establishes fee requirements for hunting permits, to help monitor hunting activities
and fund conservation measures.
Law on Reinvestment
of Natural Resource
Use Fees
2000 Natural
Resources;
Finance
This law dictates how the government spends hunting permit fees for environmental
protection.
R E L A T E D L E G I S L A T I O N
Constitution 2001 Constitutional Mongolia's Constitution has one provision directly relevant to wildlife trade. Chapter 1, Article
6 provides that fauna and flora are subject to state sovereignty and state protection.
Law Regulating
Foreign Trade of Rare
Animals and Plants
and their Derivatives
2002 Trade
This law is Mongolia's CITES implementation legislation managing international wildlife trade.
As such, it is applicable to wildlife trade in its entirety. The law has three sections. The first
contains general provisions dealing with the scope of the law; the second dictates how
wildlife trade will be regulated in Mongolia and the parties responsible; and the third
addresses what limitations in trade apply to which species.
Special Protected
Areas Law 1994
Natural
Resources
Establishes protected area types and internal zones where wildlife uses are either strictly
prohibited or limited in some way.
Parliamentary Decree
#18 on Special
Protected Areas
2011 Natural
Resources
Included in the framework as it establishes some protected areas and revises the borders of
others, all of which have implications for the legality of hunting and fishing in those areas.
Forest Law 2012 Natural
Resources
The Forest Law has at least two provisions relevant to wildlife take. Article 18.2.14 grants
Soum governments the authority to issue hunting permits, as well as present requests to limit
and cease activities during the fire season. Article 29.7 makes it a violation of the law to hunt
in forests without permission.
Environmental
Protection Law 2005 Environment
Mongolia’s overarching environmental protection law establishes the management principles
for most natural resources, including wildlife. It has several articles relevant to wildlife trade,
among them: Article 4, citizens right to inform authorities about unlawful use of natural
resources, damages, or loss; Article 15, state power to establish limits on wildlife resource use;
Articles 17 and 18, local government power to issue licenses for natural resource use; Article
19, state required to ‘protect the environment’ by providing hunting and trapping of very rare
animals and collection and preparation of very rare plants, as well as registering very rare
plants and animals in the Redbook of Mongolia.
Environmental 2005 Environment This Decree has one provision related to wildlife trade: Section 1 of the document provides

110
Measures Decree that the government will undertake the passage of legislation to combat illegal distribution
of resources related to wild species, including Gobi bear, camel, snow leopard, deer, musk
deer, Mongolian saga, and gazelles, as well as endangered plant species.
Advertisement Law 2002 Media;
Trade
Mongolia's Law on Advertisement has one provision related to wildlife trade. Article 14,
section 1 prohibits advertising "supply, trade, and purchase of rare and endangered species
of fauna and flora," as well as specific derivatives enumerated in the law. Section 2 of the
same Article further prohibits advertisement of the sale and purchase of wildlife or parts of
which hunting or harvesting is prohibited.
Anti-Money
Laundering and Anti-
Terrorism Financing
Law
2013 Finance;
Criminal
Mongolia's Anti-Money Laundering and Terrorism Financing Law has no specific provisions
directly related to wildlife trade, as the law takes an all-offense approach. To the extent that
money laundering and terrorist financing co-exist with wildlife crime, the law is applicable in
its entirety.
Customs, Tariffs and
Tax Law 2008 Trade; Finance;
This law has three provisions that address wildlife trade: Article 3.1.1 includes animals and
plants in the definition of "goods." Article 209 lists "endangered species of animals and plants
and products thereof" as goods that may not be destroyed. Pursuant to Article 246.5,
Customs officials may inspect goods containing animals without the presence of the
declarant.
Tax Law 2008 Finance
Mongolia's General Law on Taxation has several provisions related to wildlife trade: Article 5.7
provides that taxes include payments, defined as capital taken from forest and plant
resources as well as animal hunting. Article 7.4 designates the following as local taxes:
charges on the use of natural plants (7.4.8); charges on use of hunting reserves and hunting
permit fees (7.4.10); and gun duty (7.4.13).
Medicines and
Medical Devices Law 2010 Health
Mongolia's Law on Medicines and Medical Devices has two provisions related to wildlife
trade. Article 3 defines "traditional medicine" as a natural product used to treat or prevent
disease that contains ingredients derived from plants, animals, or minerals. Article 16 requires
that non-traditional medicines must be dispensed in a pharmacy, but provides no similar
requirement for traditional medicine.
Criminal Code 2015 Criminal
Mongolia's Criminal Code was revised in 2015, with additional amendments added in 2017. It
contains one provision (Art. 24.5) that criminalizes the hunting and trapping of animals in
State Special Protected Areas, as well hunting and trade related activities involving Very Rare
and Rare Animals. Additional articles apply generally to smuggling of prohibited items (which
can include wildlife), corruption, and money laundering. In each instance, crimes committed
by organized crime groups or on behalf of or in the interest of a legal entity have increased
fines and criminal sanctions applied.
Criminal Code 2002 Criminal
Although superseded by the 2015 revised version and the 2017 amendments, the 2002
Criminal Code has been included in this framework as it governed all criminal acts related to
wildlife up until the end of 2016. It contains two articles that were the primary grounds for
criminal prosecution: Art. 175, criminalizing the smuggling of wildlife, and Art. 203.
Law on Infringements 2015 Criminal
This law supersedes the Law on Administrative Liability adopted on Nov 27, 1992. It
consolidates violations formerly specified in 220 different legislative texts. It applies whenever
a violation does not constitute a criminal violation. It has several articles specific to wildlife
trade, including: Article 6.3, which criminalizes the illegal crossing of Mongolia’s border with
CITES listed species; Article 6.6 criminalizes several other hunting violations including use,
possession or hunting without permission; transfer of licenses, contracts and certificates;
hunting in amounts greater than in the contract; hunting in prohibited zones, places, or using
prohibited methods; and finally the purchase or sale without the appropriate license. Article
6.16 further criminalizes violations of the Special Protected Areas law.
Criminal Procedure
Code 2001 Criminal
Mongolia's Criminal Procedure Code has two provisions related to wildlife trade. Article 26
designates the Border Intelligence Service as the party responsible for controlling illegal
passage of items across the Mongolian border. Article 27 puts the General Intelligence
Agency in charge of investigating the illegal passage of items through the border of
Mongolia.
Anti-Corruption Law 2006 Criminal
Mongolia's Law on Anti-Corruption has no provisions that deal specifically with wildlife take
or trade. However, the law creates an anti-corruption agency that monitors and investigates
official corruption. Official corruption contributes to illegal wildlife trade, making its control
directly relevant to wildlife trade, whether international or domestic in nature.

111
What Constitutes a Wildlife Offense The purpose of this section is to take a focused
look at what acts constitute a wildlife offense, or
a wildlife related crime, how they are penalized
(e.g., administrative or criminal sanctions), and
the level of the sanction. In the course of this
study, the Mongolian government introduced
significant changes to the legal framework
relevant to wildlife trade making the analysis
more complex than it might otherwise have been.
These changes took place at the end of 2016 and
in some instances have not been fully
implemented. This section examines the old and
new formats, discussing the improvements and
potential issues. Given how recent these changes
are, however, this section is unable to assess the
performance of the new laws and limits its
comments only to anticipated benefits and
concerns for enforcement and the courtroom.
Figure 11. Overview of Offenses and Penalties in Mongolia’s IWT Legal Framework
Although some of the areas reviewed overlap with
general management concerns (especially the
regulatory environment related to ‘take’), legal
issues that are strictly related to conservation and
management of populations are not commented
on (e.g., listing procedures, establishing quotas,
etc.). In each instance, the focus remains solely on
trade and discusses general principles of wildlife
management only to the extent they play a role in
determining the legality of trade.
ILLEGAL TAKE As a preliminary point of clarification, the term
‘take’ as used in this section is a generic reference
to the act of taking an animal from the wild
whether by trapping, fishing, hunting, or other
means, regardless of the intended end use. When
used in the broader context of endangered
species legislation, ‘take’ can also include acts
that cause the loss of a species (referred to as
‘incidental take’) caused by loss of habitat or
other direct harm, but which are not intended to
make beneficial and direct use of the species.
The term “take” is not used in Mongolia’s laws,
which instead refer to hunting, trapping, and
fishing. “Hunting” is defined in the Law on Fauna,
in an unofficial English translation, to mean,
“hunting and trapping animals in accordance with
the time specified by law for the use of raw
materials, methods, tools, and permits.” Trapping
and fishing, on the other hand, are not defined.
Not central to this analysis, but nonetheless worth
noting is the fact that incidental take is also
associated with criminal penalties. In particular,
the Criminal Code establishes criminal liability for
the destruction of habitat297 for animals listed as
Very Rare, without special permission.298 Penalties
are high at 10,000 units (min) and 40,000 units
(max) and imprisonment from two to eight years.
For reasons not clear in the text, and contrary to
the liability schemes for other types of violations,
legal entities are not mentioned.
Species-Based Offenses A common approach to managing take and trade
at the national level is to establish limits and
controls on a species-by-species basis. Several
distinct regulatory tools use this approach (e.g.,
quotas, limits on hunting and fishing methods,
trade requirements, etc.), as do the new Law on
Infringements and Criminal Code. The starting
point for liability under these laws begins with
Mongolia’s listing process. Mongolia’s 2012 Law
on Fauna uses a species-based approach to set
out three categories of wildlife species: 1) Very
Rare; 299 2) Rare 300 and 3) Game Animals 301 - and
297 In Mongolian: амьдрах орчныг алдагдуулсан. 298 Criminal Code, Art. 24.5.2, as amended 2017.
299 Official language version of Article 4.1.3. "нэн ховор амьтан"
гэж тархац нутагтаа бүхэлдээ, эсхүл ихэнх хэсэгт тоо толгой эрс
цөөрсөн, ашиглах нөөцгүй, устах аюулд орсон амьтныг; (emphasis added). Mongolian Law on Fauna, revised 2012.

112
bans, restricts or permits hunting based on these
categories. Although the content of the lists has
changed with time, 302 the legal format remains
essentially the same. The list of ‘Very Rare’
species is incorporated directly into the law303 and
receives the highest level of protection with uses
limited to ‘management or research purposes.’
The list of ‘Rare’ animals, as well as the associated
hunting rules, are set out separately and
approved by the Cabinet.304 Lastly, the regulatory
framework for ‘game animals’ is also incorporated
directly into the Law on Fauna, including the
seasons when hunting is permitted, but not the
associated quotas.305 This is new to the Law on
Fauna, but not a change in Mongolia’s regulatory
approach as it was also used in the now
superseded Law on Hunting from 2000.
The new Law on Infringements does not have an
explicit species-based approach, as its provisions
are generally worded to apply to wildlife without
distinction. However, to some extent, it operates
on a species-specific basis as it applies only to
those species not otherwise covered by the
Criminal Code. The Criminal Code applies
substantially higher fines and criminal penalties
for virtually all forms of take and trade that
involve listed species. For Rare species, the types
of criminal violations specifically identified
include hunting, trapping, purchase, sale,
processing, transportation, collection, and
export. 306 For Very Rare species, the list is the
same with the exception of the express reference
to ‘storage’ and ‘habitat destruction,’ both of
which are found in the article governing Very Rare
species, but not Rare species.307 For Rare species,
fines are set at a minimum of 5,400 units (MNT
5.4 million, USD 4,700) and a maximum of 27,000
units (MNT 27 million; USD 23,500); detention
from 1 to 5 years; or imprisonment from 1 to 5
years. For Very Rare species, fines are 10,000
units (MNT 10 million, USD 8,700) and a
maximum of 40,000 units (MNT 40 million; USD
34,700); or imprisonment from 2 to 8 years; with
no provision for detention.
300 Official language version of Article 4.1.4. 4.1.4. "ховор амьтан" гэж тархац нутагтаа тоо толгой цөөрсөн, нөөц багатай, устаж болзошгүй амьтныг; (emphasis added). Mongolian Law on
Fauna, revised 2012. 301 Official language version of Article 4.1.7. "агнуурын амьтан" гэж арьс, үс, мах болон бусад түүхий эдийг нь ашиглахаар агнаж ирсэн уламжлалтай, агнуурын нөөцтэй амьтныг; (emphasis added). Mongolian Law on Fauna, revised 2012.
302 The 2012 Law on Fauna in fact introduced many changes to existing lists, which were originally defined in 2000.
303 Law on Fauna, Art. 7.1., revised 2012.
304 Law on Fauna, Art. 7.6, revised 2012.
305 Law on Fauna, Art. 9.
306 Criminal Code, Art. 24.5.1, as amended 2017.
307 Id. at Art. 24.5.2.
Place-Based Offenses Place-based approaches are another common
approach to managing wildlife take and trade.
They can either be specifically delineated
geographic areas (with boundaries on a map) or
generally defined environments or habitats. In
either case, specific limitations or controls are
established on the taking of all wildlife in these
areas regardless of their status.
There are some benefits to the approach. One is
that hunting restrictions can be tailored to the
types and numbers of species living in a
particular area. Wildlife populations are not
uniform across their range. Place-based
management regimes, including differing hunting
limits, allow for adaptations based on local
population levels and trends. They can also help
make monitoring and enforcement of illegal
hunting more manageable. Depending on the size
of the area, having designated areas can
contribute to a more manageable mandate for
rangers, covering fewer species and territory.
Mongolia uses several place-based tools in
managing its wildlife. All of Mongolia’s protected
areas, for example, are closed to hunting, with
one zone within national parks open to fishing for
household purposes only. 308 The Law on Fauna
includes several place-based tools such as the use
of specially designated hunting zones; 309
temporary hunting bans restricted to certain
areas; bans exercised by local governments for
the area under their jurisdiction; as well as
wildlife assessments and hunting quotas for
established hunting areas.310
Complementing these restrictions, both the Law
on Infringements and Criminal Code incorporate
place-based offenses and liabilities. Within the
Law on Infringements, these include 1) violating
hunting rules applicable to the Mongolia border
zone 311 and 2) hunting outside hunting areas. 312
Fines for border zone violations are set at 25
units (MNT 50,000; USD 22) for individuals and
ten times this amount (250 units = MNT 500,000;
USD 220) for legal entities. Fines for hunting
outside hunting areas are 6 times as high at 150
units (for individuals) and 1500 units (for legal
entities), or MNT 300,000 (USD 130) and MNT 3
million (USD 1,300) respectively. For the special
case of hunting and trapping inside protected
areas, Article 24.5 of Criminal Code imposes even
308 Law on Protected Areas, Art. 16(2), 2012.
309 Law on Fauna, Art. 4.1.9, 2012.
310 Law on Fauna, Art. 5, 2012.
311 Law on Infringements, Art. 16.11.
312 Law on Infringements, Art. 6.6.3.

113
higher penalties ranging from 5,400 to 27,000
units for individuals; MNT 10.8 million (USD
4,695) and MNT 54 million (USD 23,478).313 The
same violations may also result in 1 to 5 years
detention, or 1 to 5 years incarceration. As
mentioned before, there is no longer any criminal
liability for legal entities under this section.
Violation of Quotas and Bans The violation of quotas and bans is another type
of offense specifically included in the Law on
Infringements and the new Criminal Code. The
basis for these penalties is contained in the Law
on Fauna and the resolutions or decisions issued
by the Ministry of Environment and Cabinet
Ministry. A permanent ban on domestic hunting is
created by Article 7.1 in the Law on Fauna, which
lists 30 species as ‘Very Rare;’314 Article 7.2, which
permits hunting only for scientific purposes; and
Art. 7.3, which expressly bans all other forms of
hunting and trade for these species. The Criminal
Code is again the reference for violations setting
fines at a minimum of 10,000 units and a
maximum of 40,000 units; MNT 20 million (USD
8,695) and MNT 80 million (USD 34,782)
respectively; or 2 to 8 years in prison.
For all other species, bans come in the form of
temporary mandates typically directed at
particular species and areas. A 2012 ban on gray
wolf hunting, for example, included specific
soums within three aimags and was good for one
year. According to the records available, marmot,
gray wolf, and argali appear to be the most
frequent subjects of such bans. The Law on
Infringements does not specifically refer to the
violation of bans. Instead, it applies fines for
hunting at ‘other prohibited times.’ 315 As the
violation of seasons is a separate offense, the
assumption is that this provision is a generic
reference to these bans as they are all time
limited. This is an interpretation of the authors,
however, and not supported by any known court
decisions or Supreme Court interpretations.
Penalties are set at 150 units (for individuals) and
1500 units (for legal entities), or MNT 150,000
(USD 130) and MNT 1.5 million (USD 1,300)
respectively. Under the Law on Infringements,
there are no detention or prison sentences.
Hunting quotas are used in limited circumstances
in the current Law on Fauna.316 This differs from
the 2000 Law on Fauna and 2000 Law on Hunting,
313 Law on Infringements, Art. 6.6.6.
314 The list actually contains 31 species.
315 Law on Infringements, Art. 6.6.2.
316 Law on Fauna. Article 26. 2012.
which used quotas much more broadly for a wider
range of species. The current law limits take for
individual household use, depending on the type
of species harvested 317 and gives the central
government authority to limit fishing on a
district-by-district basis. For quotas, the only
mention is the violation of hunting and trapping
limits as established in a contract.318 The law does
not apply a penalty for the same violation with
respect to fishing. As part of the same provision
covering violations of ‘other prohibited times,’
fines for exceeding contract limits have the same
penalty levels.
Hunting During Closed Seasons Closed seasons are used to regulate hunting of a
wide range of species in the Law on Fauna. The
2006 Silent Steppe report discussed two problems
with how this was implemented in the law. One is
that the descriptors used for animals when
designating each hunting season were sometimes
vague, listing large categories as opposed to
specific species. The other is that the fixed
hunting seasons designated in the statute were
not adaptable based on fluctuations in species’
relative abundance from year to year.
The current Law on Fauna contains the same
generic and thus problematic species descriptors,
such as “ducks, geese, and waterfowl.’ However, it
now also includes 23 different hunting seasons,
as opposed to 13 in the previous Hunting Law,
allowing for more individualized treatment of
species. The increased specificity of course also
means that enforcement personnel need to be
equally well trained in species identification and
knowledge of applicable seasons.
Violation of hunting seasons is included in the
Law on Infringements with a penalty of 150 units
(for individuals) and 1500 units (for legal entities),
or MNT 300,000 (USD 130) and MNT 3 million
(USD 1,300) respectively.
317 Law on Fauna. Article 28. 2012.
318 Law on Infringements, Art. 6.6.2.

114
Figure 12. Open and Close Hunting and Fishing
Seasons

115
Table 8. Offenses related to illegal ‘take’

116
TRADE CHAIN OFFENSES Specific to trade, Mongolia has established fines
and criminal penalties associated with several
parts of the wildlife trade chain. Between the Law
on Infringements and Criminal Code, a list of ten
separate acts within the wildlife value chain have
been identified, including the illegal:
sale,
purchase,
preparation,
use,
collection,
transportation,
storage,
import,
export, and
smuggling.
Not all of the acts identified apply to all species,
however, and different fines and penalties are
applied depending on the act and status of the
species involved. To begin with, all prohibited
acts that involve species listed as either Rare or
Very Rare fall under the jurisdiction of the
Criminal Code. For all other species, all prohibited
acts are subject to fines levied by the Law on
Infringements.
For Very Rare and Rare species, the prohibited
acts include those already mentioned with the
exception of ‘import.’ The law does not
distinguish the status of the species in this
instance, applying the same fine for the
introduction of species into the country without
permission. Fines are higher for the introduction
of alien species; i.e., it does not occur naturally in
Mongolia. The law also does not distinguish on
the basis of species status for the illegal use of
species, applying monetary fines for any
unpermitted use. In this instance, fines are the
lowest of any applied to the trade chain at 75
units (for individuals) and 750 units for (for legal
entities); MNT 150,000 (USD 65) and MNT 1.5
million (USD 652) respectively.319
For Rare species, the minimum fine is 5,400 units
and the maximum, 27,000 units; MNT 5.4 million
(USD 4,695) and MNT 27 million (USD 23,478)
respectively. Criminal penalties for the same
offence include 1 to 5 years restricted rights of
movement, or 1 to 5 years prison.
For Very Rare species, the minimum fine is
10,000 units and the maximum, 40,000 units;
319 Law on Infringements, Art. 6.6.1.
MNT 10 million (USD 8,695) and MNT 40 million
(USD 34,782) respectively; respectively. Criminal
penalties for the same offence include 2 to 8
years in prison.
The law imposes separate fines for unlawfully
crossing the border with CITES listed species to
the extent they are not otherwise listed as Very
Rare or Rare in Mongolia.320 Fines in this case are
established by the Law on Infringements with no
associated criminal liability. They are set at 500
units (for individuals) and 5,000 units for (for
legal entities); MNT 500,000 (USD 435) and MNT 5
million (USD 4,350) respectively.
The list of prohibited acts applicable to the
remaining species does not have the same
specificity as it does for Very Rare and Rare
species. It identifies only their illegal:
sale,
purchase, and
use.
Missing from the list of trade chain offenses are-
preparation,
collection,
transportation, and
storage.
The wording of the law makes it unclear whether
export is included and to which species the
penalties for smuggling might apply. Instead of
expressly penalizing the export of any species
without the appropriate permit, the Law on
Infringements penalizes the smuggling of
‘prohibited’ or ‘restricted’ goods. 321 Pursuant to
the Law on Customs, Tariffs and Taxes, wildlife
constitute ‘goods’322 and require permits issued by
the Ministry of Environment. To the extent
permits are required, it may be true that all
wildlife constitute at least ‘restricted’ goods, but
it is not clear from these texts alone whether the
Ministry of Environment actually requires or
issues export licenses for all wildlife.
VIOLATION OF ADVERTISING
RESTRICTIONS The Law on Advertisement directly addresses
trade in wildlife products and may be helpful in
curbing wildlife sales. Article 14 of the law
provides that “advertisement of supply, trade,
and purchase of rare and endangered species of
fauna…or wild animal organs such as deer horn,
320 Id at. Art. 6.6.3.
321 Criminal Code, Art. 18.5.1.
322 Law on Customs, Tariffs and Taxes, Art. 3.1.1.

117
deer genital, deer testicles, female deer’s tail,
uterus, musk, bear’s gall shall be prohibited.” It
further prohibits advertising the sale or purchase
of “organs or raw materials” from wild animals
that are not legally harvested. The records
obtained from Police and the Courts do not
indicate any instances where violation of this
provision was either investigated or served as the
basis of a prosecution.
The Law on Infringements identifies three types
of transactions within advertising specific to
wildlife trade to which it applies the same
penalty. They include the ordering, creating, and
distribution of illegal wildlife related
advertisement making anyone in the advertising
value-chain liable for the illegal content.323 At the
writing of this report, this provision is still new
and it is not known if any fines have been issued
pursuant to it. Records of past infringements
under a similar provision in the Law on
Advertising do not indicate its use in any wildlife
trade related case.
MEDICINAL TRADE OFFENSES A special form of trade in wildlife is medicinal
trade. Documented in the first Silent Steppe
report and again in this survey, wild animal parts
and derivatives are an important part of both
domestic and international trade in Mongolia. The
Law on Medicines and Medical Devices, though
only indirectly related to wildlife trade, is
nevertheless unhelpful in its regulation. The law
relates to wildlife trade in that it addresses
traditional medicine, stating only that such
medicine may be dispensed outside a pharmacy.
In other words, it exercises no direct control over
the sale of traditional medicine products, and
thus the sale of traditional wildlife medicine
products.
This does not mean that wildlife use in traditional
medicines is completely unregulated. For Very
Rare and Rare species, criminal liability attaches
to the illicit ‘preparation’ and ‘collection’ of
species parts without permission. While not
defined or explicitly tied to medicinal trade, these
terms are generally understood to apply to any
preparation or collection, regardless of the
purpose. For Rare species, the fines are 5,400 to
27,000 units for individuals; MNT 10.8 million
(USD 4,695) and MNT 54 million (USD 23,478).324
The same violations carry the possibility of
detention from 1 to 5 years, or incarceration also
323 Law on Infringements, Art. 9.4.4.
324 Law on Infringements, Art. 6.6.6.
from 1 to 5 years. For Very Rare species fines rise
to a minimum of 10,000 units and a maximum of
40,000 units; MNT 20 million (USD 8,695) and
MNT 80 million (USD 34,782) respectively.
Criminal penalties include 2 to 8 years in prison.
Legal entities have no liability in either of these
offenses.
ORGANIZED CRIME PREDICATE
OFFENSES Mongolia does not have a separate law on
organized crime. Instead, what constitutes
organized crime and the associated penalties are
incorporated directly into the Criminal Code. The
law uses a predicate offense approach; meaning
that only identified crime types are subject to
additional liability if associated with the activities
of an organized crime group. In general, the law
applies increased prison sentences ranging from
one to five or more years.
While the same approach existed in the 2002
version of the Criminal Code, the format and
application of such penalties to wildlife crimes
has changed. Under the 2002 version, the
transport, trade of illegally hunted animals,325 as
well as the smuggling of restricted animals ‘in
large amounts’326 were both subject to increased
criminal penalties if connected to organized
crime. In 2017, there is no longer an explicit
mention of organized crime in relation to illicit
wildlife trade. Instead, the law creates a generic
category that imposes increased prison sentences
(5-12 years) for smuggling of ‘prohibited or
restricted goods’ as part of an organized crime
group, and makes no mention of a threshold
volume.327 Pursuant to the Law on Infringements,
Customs Law, and other provisions of the
Criminal Code, the import and export of Very
Rare and Rare species,328 as well as CITES-listed
species329 all require special permission and thus
constitute either restricted or prohibited goods.
CRIMINAL LIABILITY FOR LEGAL
ENTITIES With respect to legal entities, the prior versions of
the Criminal Code restricted its application to
individuals only; an approach consistent with
325 Criminal Code, Art. 161, 2002.
326 Criminal Code, Art. 175, 2002.
327 Criminal Code, Art. 18.5.1, as amended 2017.
328 Law on Infringements, Arts. 6.6.5 and 6.6.6; Criminal Code, Art. 24.5, as amended 2017.
329 Law on Infringements, Arts. 6.3.

118
countries like Germany and Sweden. In 2015,
however, Mongolia’s Parliament introduced
sweeping changes that now hold a legal entity
(e.g., a business) liable for certain criminal acts
committed on behalf of the entity (e.g., an
employee or agent) or in its interest, relieving the
individual who committed the crime from
liability. Under the new Criminal Code and
depending on the crime involved, legal entities
may be subject to substantial fines, the
deprivation of operating rights, and ultimately
dissolution.
Similar to organized crime, liability for legal
entities operates on a predicate offense basis. In
other words, legal entities are not subject to
criminal liability in all instances where a crime is
committed on their behalf or interest; only where
the law provides for such liability. The updated
version of the Criminal Code, initially passed in
2015, held legal entities criminally liable for trade
in Rare and Very Rare species.330 In 2017, however,
this provision was deleted from the law.331 Given
the reported synergies between trading
companies and wildlife trade, the lack of criminal
liability in these cases needs to be corrected.
CRIMINAL LIABILITY FOR MONEY
LAUNDERING Money laundering offenses and penalties were
already part of the prior Criminal Code, although
with no explicit relation to illicit wildlife trade.
From the enforcement records provided by the
Police, Customs, and Courts, it appears that in no
instance was money laundering used as the basis
of a wildlife trade related investigation and
prosecution. The reasons for this are not clear,
but the language of the law and intent
requirement in the old Criminal Code may have
had some role to play.332
The new version similarly makes no reference to
any underlying crime type but it has eliminated
the intent requirement, creating a form of strict
liability for conduct identified in the law as
money laundering. It remains to be seen whether
these improvements will lead to anti-money
laundering investigations connected to wildlife
trade seizures.
Money laundering is one of the areas for which
criminal liability may be imposed on legal entities.
330 Criminal Code, Art. 24.5.3, 2015 (annulled).
331 Criminal Code, Art. 24.5, as amended May, 2017.
332 Criminal Code, Art. 163.1, 2002; ‘knowingly releasing illegally gained property and money into circulation by way of entering into transactions’ (unofficial translation).
The anti-money laundering provisions directed at
legal entities establish both increased fines for
the entities and detention, presumably the
individuals involved in the money laundering
activity.333 Fines are set at a minimum of 120,000
and a maximum of 400,000 units334; equal today
to MNT 120 million (USD 104.3 thousand) to 400
million (USD 347.8 thousand).
TABLE OF OFFENSES The following page contains a table of offenses
with reference to the legal provisions that form
the basis for either administrative or criminal
liability. Each provision in the Law on
Infringements and the Criminal Code was
reviewed to determine all of the separately
identifiable ‘acts’ that constitute an offense. The
law itself does not list everything separately. For
purposes of clarity, however, and as each
identified act can be prosecuted independently,
they have been listed and reorganized
accordingly. For example, the sale of wildlife
without permission is one form of illegal activity;
as is the purchase of wildlife without permission.
The law lists them in the same article, whereas
this table segregates them.
333 The law provides for the restriction of movement rights, but does not clarify how this would apply to companies.
334 One Unit equals MNT 1,000.

119
Table 9. Trade Offenses and Penalties

120
CITES Compliance The Convention on International Trade in
Endangered Species (CITES) is arguably one of the
most important international agreements
regulating wildlife trade. 335 It is the only treaty
that focuses specifically and solely on one point
of the value chain (foreign trade) covering a long
list of species. Mongolia, along with 183 other
countries, is a member of CITES having ratified
the Convention in April 1996. With a total of 87
mammals, birds, and fish species that occur
within its territory included either in Appendix I
or II, it does not rank among those countries with
a high number of listed species. It is, nonetheless,
home to several high value species impacted by
illicit international trade; e.g., Saker falcon, saiga
antelope, and brown bear.
Pursuant to this treaty, countries are required to
promulgate national implementation legislation.
The Endangered Species Foreign Trade Law
(ESFT Law) is intended to implement Mongolia’s
obligation in this regard. First adopted in 2002,
the current version of the law is its second
iteration in the 20 years since Mongolia became a
member. 336 Despite improvement, Mongolia
remains a Category II country, 337 meaning that
pursuant to CITES own assessment, Mongolia’s
national legislation does not meet one to three of
the four requirements for effective
implementation of CITES.338
Article VIII of the convention, “Measures to be
Taken by the Parties,” delineates the laws that
335 In the global context, illegal and uncontrolled wildlife take and trade have been the impetus for the creation of national and international legislation for well over a century. The devastating effects of trade in birds for the fashion industry, for example, lead the US to sign the Lacey Act into law as early as 1900,335 the first in the U.S. to protect wildlife and go beyond national borders to penalize the illegal killing or trading of species in foreign countries.335 The Migratory Bird Treaty Act (MBTA) (1918) and the US-Mexico Migratory Bird and Game Mammal Treaty (1936) were born out of similar concerns. The International Whaling Convention was created in 1946 in response to the rampant, and by then long-term overexploitation of whales. Many other treaties, regional and global, have followed, including the Convention on Fishing and Conservation of the Living Resources of the High Seas (opened for signature in 1958); the International Commission for the Conservation of Atlantic Tunas (ICCAT) (established in 1969); the Convention for the Conservation of Antarctic Seals (1972); and the Council Regulation (EC) No. 338/97 of the European Union (1996).
336 Mongolia became the 133rd signatory to CITES in April 1996.
337 Status of Legislative Progress for Implementing CITES (updated on September 1, 2016 by CITES). Retrieved from www.cites.org on April 21, 2017.
338 Parties whose domestic measures do not provide them with the authority to i) designate at least one Management Authority and one Scientific Authority; ii) prohibit trade in specimens in violation of the Convention; iii) penalize such trade; or iv) confiscate specimens illegally traded or possessed.
member states must implement in order to be
compliant. Certain legal provisions are mandatory
under the convention and others are simply
permissive. The following sections consider both
sets.
PROHIBITING TRADE AND
POSSESSION The first mandatory provision in CITES is its
requirement that member States prohibit
commercial trade and/or possession in Appendix
I species. 339 There are currently 931 species on
this list, of which 14 are native to Mongolia.
Mongolia complies with this in Article 7 of its
Endangered Species Trade Law by stating: ‘the
sale for profit of species listed in Appendix I of
the Convention or of its derivatives is prohibited.’
In other words, Mongolia has opted to prohibit
trade, excluding the ‘and/or possession’ language.
As already mentioned, the Law on Infringements
and Criminal Code both penalize several parts of
the trade chain with respect to wildlife. However,
the only instance that CITES listed species are
actually mentioned is in the Law on Infringements
which penalizes crossing the border with CITES
species that are not otherwise listed as Very Rare
and Rare.340 The assumption is that trade in Very
Rare and Rare species in any form (which would
include crossing the border) is already prohibited
by the Law on Fauna and penalized under the
Criminal Code in Article 24.5, which would make
an additional reference unnecessary. Penalties for
trade in CITES species not covered by the
Criminal Code are thus covered under the Law on
Infringements, but only in the instance of border
crossing. Possession of the same or transport
within the country would not be covered. The only
two species that are CITES listed and that are not
also listed as either Rare or Very Rare in Mongolia
are the Baikal sturgeon (Acipenser baeri
baicalensis) and the Amur sculpin (Mescottus
haitej). Over the last decade, sturgeon has been
Mongolia’s most important CITES trade species by
volume. It is also one of the few species delisted
from Mongolia’s list of Very Rare species in 2012.
It now has no listing status under Mongolian law.
While this is technically full compliance, it
nonetheless creates a gap in that ‘possession’ per
se is not addressed; a gap that can make
339 CITES Art. VIII, 1(a). “1. The Parties shall take appropriate measures to enforce the provisions of the present Convention and to prohibit trade in specimens in violation thereof. These shall include measures: (a) to penalize trade in, or possession of, such specimens, or both;”
340 Law on Infringements, Art. 6.3.

121
enforcement more difficult. As a practical matter,
possession is much more likely to be observed
and certainly much simpler to prove. To prove
sale, both possession and an established intent to
dispose of those items in trade is necessary.
Obviously, there are methods for doing this; e.g.,
surveillance and undercover buys. However, these
methods are both costly and time consuming for
enforcement personnel that are already working
with limited staff and resources. Possession, on
the other hand, only requires that an individual be
found with the contraband. The fact that most
wildlife crime cases appear to be the result of
routine traffic stops suggests that criminalizing
possession could have immediate positive returns
in Mongolia’s fight against illicit trade.
That said, simply criminalizing possession
without defining what constitutes possession
would also be a mistake. Possession can be
described in legal terms as “actual” or
‘constructive.’ Actual possession is when
contraband is found directly in a person’s hand,
clothing, or body. Constructive possession occurs
when the contraband is not necessarily on an
individual’s person, but is within his or her
‘control.’ For example, if two individuals are
riding in a car containing the furs of a prohibited
species (no matter where in the vehicle they are
stored), both of them could be charged with
possession because the furs are under the control
of both. Actual possession is easier to prove than
constructive possession, because there is less
question that the suspect had contraband in his
or her possession. Contraband that is
constructively possessed, however, significantly
increases law enforcement’s ability to secure
criminal charges, as there is a greater chance that
contraband will be within someone’s control
rather than literally in someone’s hands or on
their person when law enforcement arrive. Putting
the focus on possession, especially the separate
elements of actual and constructive possession,
obviates the need to find evidence of actual or
intended trade, significantly broadening law
enforcement’s authority to act, and ultimately
support the ability of prosecutors to secure a
verdict.
REQUIRING CONFISCATION Mongolia’s compliance with the CITES
requirement to confiscate prohibited species is
less clear. Article VIII, no. 4 of CITES states that:
Where a living specimen is confiscated as a result
of measures referred to in paragraph 1 of this
Article:
(a) the specimen shall be entrusted to a
Management Authority of the State of
confiscation;
(b) the Management Authority shall, after
consultation with the State of export, return
the specimen to that State at the expense of
that State, or to a rescue centre or such other
place as the Management Authority deems
appropriate and consistent with the purposes
of the present Convention; and
(c) the Management Authority may obtain the
advice of a Scientific Authority, or may,
whenever it considers it desirable, consult the
Secretariat in order to facilitate the decision
under sub-paragraph (b) of this paragraph,
including the choice of a rescue centre or other
place.
The ESFT Law addresses this in Article 15.2
providing that wildlife and its derivatives that
were “obtained by illegal means” will be seized.
While this language appears at first glance to be
consistent with CITES requirements, it is not
exactly the same, adding an element that narrows
its application and complicates both enforcement
and prosecution. CITES requires confiscation only
of ‘prohibited species’ when discovered. There is
no requirement, at least for CITES purposes, or
further proof of any kind. Mongolia’s Article 15.2,
however, limits this by applying only to species
that were ‘obtained by illegal means.’ Just as
possession is easier to prove than sale, mere
possession is also easier to prove than whether a
particular item was obtained using illegal means.
The ESFT Law also may cause issues for its lack of
instructions on how to handle confiscated
wildlife. Mongolian law provides that confiscated
specimens are seized as ‘state property,’ 341 but
does not specify to whom they should be
entrusted. The law also does not include
information about what to do with specimens
once they are seized. There are no specific actions
required of the seizing authority, including
shipping the specimen back to its origin state.
Placement with a rescue center, or destruction as
the case may be.
The problem is not that the lack of instruction in
the law prevents action, but it leaves it an open
question. The provision that provides for
confiscation is important, but without designating
that responsibility to a specific entity, it is
difficult to ensure that the confiscation will occur
and no way of managing how confiscated items
will be disposed of. This leaves the potential for
341 Article 15.1.2., ESFT Law.

122
no actions to be taken with evidence potentially
lost or destroyed, later creating problems for
successful prosecution.
CARE AND HANDLING
REQUIREMENTS Care and handling is another requirement that
Mongolia’s legislation complies with at least in
part, but where questions concerning its
application remain. CITES requires a provision
stating that live specimens must be subject to
proper care during transit, holding, or shipment.
It does not say how this is to be done or limit the
requirement to either import or export.
Mongolia’s ESFT Law addresses the requirement
by providing that its Management Authority be
responsible for making sure that “appropriate
procedures [are] followed” and “conditions
established” for caring for plants and animals
during transport when determining whether to
issue a license or certificate. 342 Under Article
6(1)(2), the Scientific Council is responsible for
determining if parties wishing to import Appendix
I species are equipped to care for the animals.
There is, however, no similar requirement for
export. Further, Article 10(4) provides that no
license is required for carrying animals or plants
in transit. In other words, the fact that no license
is required renders the requirement to establish
conditions a moot point. The absence of any
reference to exports in Article 9(1)(5) and the fact
that no license is required under Article 10(4)
both appear to contradict the more general
wording and intent of CITES.
Maintaining Records
One requirement under CITES that the Mongolian
law misses is keeping records of trade for species
in all three CITES appendices. Appendix III, is not
mentioned in the law, nor is record keeping. The
ESFT Law does require that an annual report be
submitted to the secretariat. However there are no
explicit requirements about what that report
should contain. There is also no requirement
included for a biennial report even though a
biennial report is mandatory under CITES.
CITES SUGGESTED PROVISIONS The convention also includes suggested, non-
mandatory provisions that aid in effective
enforcement. These include:
342 ESFT Law, Article 9(1)(5).
a. a mechanism for reimbursement of
expenses associated with seizures;
b. designated ports of entry;
c. the cooperation of the Management
Authority with the Scientific Council
concerning the placement of confiscated
species; and
d. the designation of a rescue center.
Of these, only the ports of entry are mentioned.
Article 11 provides that the Administrative
Council will designate ports of entry. The law is
silent concerning the other three measures.

123
Gap Analysis Summary As a general rule, legal systems resist change.
Without intending to debate the exact trajectory
of legal and human development, there is little
doubt that the pace of change in modern history,
advances in communications, travel, business
forms, and technology have sometimes
outstripped the ability of the legal world to keep
up. Mongolia’s efforts to adapt its wildlife trade
laws are similarly challenged as new forms of
trade emerge (e.g. wolf tooth trade to China), new
species are targeted (e.g., marmots and squirrels
for fur), and new methods to avoid detection are
used (e.g., the use of cell phones to coordinate
deliveries along the border).
However, to the credit of the government, wildlife
conservation and combatting illicit trade have
remained on the agenda – resulting in a number
of changes in the past decade to its legal
framework regulating wildlife trade. Among the
more notable improvements are:
A revised Criminal Code and Law on
Infringements that provide a far more
comprehensive set of penalties in ranges that,
although untested, appear stringent enough
to act as a deterrent.
The application of higher fines and prison
sentences for all illegal take and trade
involving Very Rare and Rare species:
o Penalties include fines (ranging from USD
4,700-23,500 for Rare species and USD
8,700-34,700 for Very Rare species. Even
at the lower end, fines are greater than
the known market value of any of
Mongolia’s Very Rare or Rare listed
species, effectively denying traders of the
benefit.
o Prison sentences range from 1-5 years for
Rare species, and 2-8 years for Very Rare
species classifying Mongolia’s penalty
system for take and trade in Very Rare
and Rare species as a ‘serious offense.’
The explicit coverage of a greater range of
illegal acts that form the value chain
associated with wildlife trade, including
penalties for the sale, purchase, preparation,
use, collection, transportation, storage,
import, and export.
A similarly value chain oriented expansion of
the penalty section for wildlife related
advertising including the ordering, creation,
and distribution.
In addition to these specific points, the new laws
and amendments have also targeted several
problems inherent in the drafting, including
unclear language and the lack of connectors in
complex sentences. The 2002 Criminal Code for
example, only held an individual liable for
smuggling ‘in large amounts,’ or for illegal
hunting that caused ‘damage,’ neither of which
were defined. There were also numerous
instances of long, complicated sentences with few
connectors creating an environment ripe for legal
and factual challenges. The new Criminal Code
has eliminated the problematic undefined terms.
Both the Law on Infringements and Criminal Code
are also more careful in their use of clearer
sentence structures, where the conjunctive or
disjunctive nature of lists are more apparent.
GAPS AND CONFLICTS Despite improvements in the legal framework,
and whether planned or unplanned, gaps and
conflicts remain. Summarizing some of these in
visual format is a IWT Legal Framework Monitor
(Figure 13). This graphic provides a rapid, but not
exhaustive, overview of the major areas of wildlife
trade regulated by each of the laws included in
the framework.
The X-axis (the rows, listing laws) shows where an
individual law has provisions related to one or
more areas of wildlife trade; the total number of
areas regulated by the particular law is a general
indicator of its importance in managing trade as
well the major areas of concern. The Y-axis (the
columns, listing wildlife trade concepts) indicates
which laws have content for the wildlife trade
concept listed, indicating possible overlap and/or
conflict between laws. In the columns, a total of
21 management and enforcement issues have
been selected and organized following value chain
logic, from left to right in six major categories:
1. The first category includes generic issues
related to ownership of wildlife, its
conservation efforts, and research. It also
includes the important aspect of
categorization of species into status or levels
of protection, as this has an impact on what
may be legally hunted as well as the level of
administrative and criminal penalties that
apply.
2. The second category includes In-Situ and Ex-
Situ identifying provisions that place
protections and apply penalties for activities
in specifically defined areas that are either

124
designated for because of their value to
wildlife (e.g., protected areas, hunting zones,
etc.) or in areas where they have been placed
for conservation purposes (e.g., a zoo, or
wildlife reserve).
3. The third category includes concepts related
to take and trade including domestication,
breeding, re-introduction and harvest
(including hunting, trapping and fishing). This
is a highly summarized set of issues designed
to provide a high-level overview. Details,
where necessary, are discussed in following
sections.
4. The fourth is a summary view of specific
elements related to the value chain including
wildlife possession, transportation,
processing, and storage.
5. The fifth category lists trade-related
components including medicinal trade,
advertisement of wildlife products, e-
commerce, and domestic and international
wildlife trade.
6. Lastly, specific elements related to
enforcement are listed, including generic
provisions related to enforcement powers and
authorities and provisions defining
administrative and criminal offenses and
penalties.
This particular graphic is not intended to provide
a comprehensive view of wildlife trade related
regulatory elements. As presented, this graphic is
intended only as a quick overview and indicator
of major patterns that are nonetheless instructive.
To this end, a colored box indicates that a
particular law contains at least some content
relevant to the concept. Where there is no colored
box, there is no content in the law indicated for
that concept. Just as the presence of a box does
not provide an assessment of the quality of the
content, the absence of a colored box is not
intended to indicate a particular failure for any
law by itself. That said, complete absences (where
no law addresses a particular concept) may
indicate pervasive gaps in the legal framework as
a whole. Likewise, whether a given issue is
regulated in more than one law is not immediate
proof of a gap or a conflict of any kind. It merely
indicates the presence or absence of parallel
regulatory elements that may in fact work
together to create a consistent and cohesive
system.343
Major patterns observable in this graphic include: 343 The static view replicated in this report can also be found online in a dynamic panel in the Legal Atlas platform, providing access to the provisions associated with each area and law, and facilitating independent and ongoing reviews.
Based solely on the number of elements
regulated, the most relevant laws for the topic
are the Law on Fauna, Law on Infringements,
and Criminal Code.
The Law on Fauna is the foundation for many
of the penalties identified in the Law on
Infringements and Criminal Code. It
establishes which species are Very Rare and,
through a separate Resolution, which are Rare.
It also contains the lists of prohibited seasons,
methods, areas, and more.
The Criminal Code is certainly an important
piece of legislation as it touches on almost all
of the identified elements. However, this
should not be confused with an assessment of
its completeness or adequacy. The number of
elements it rules on may be misleading, as it is
restricted only to defining criminal penalties.
As the only law that establishes such penalties,
it is more notable that it does not cover all of
them. There are, for example, no criminal
penalties associated with:
illegal possession
medicinal trade
illegal domestication
While related activities, such as transportation
and storage of prohibited species, are covered,
outright possession of prohibited species is
not criminalized.
Harvest of wildlife is still a major area of focus
with at least 11 different laws having some
relevance. Some of the laws are merely
implementing the requirements of others or
establishing the necessary permissions and
prohibitions. All of this is likely an appropriate
focus given Mongolia’s main status as a source
country, even though it is now also a
recognized consumer and transit country.
Medicinal trade in species is still not regulated
in a specific way. The Criminal Code references
several acts that may be related to such trade,
but does not criminalize medicinal trade per
se. The Medicine and Medical Devices Law also
excludes traditional medicine from any
regulatory requirements.
Possession of protected wildlife is still not
adequately covered. Chapter III in the Law on
Fauna has several articles that describe
requirements for possession, none of which
explicitly address ‘possession’ as an actionable
offense. The Criminal Code addresses several
related concepts, including transportation,
storage, processing, use, and collection, but

125
does not include the more general reference to
illicit possession.
Transportation, storage, and processing are
criminalized, but not otherwise regulated. In
other words, what might constitute legal forms
for these should perhaps also be considered.
Other gaps noted in the preceding analysis
include and that are not visible directly in the
Gap/Conflict Monitor include:
The lack of liability for legal entities trading in
Very Rare and Rare species. Curiously, legal
entities are liable for illicit trade for species
more generally. The fine in this instance,
however, is just over 5% of the maximum fine
applicable to Rare species trade, and 3.8% of
the maximum for Very Rare species trade. The
way the law is structured, it is not clear
whether these lower fines would be applied, or
whether legal entities would escape liability
entirely.
The application of enhanced penalties for
organized crime groups that engage in wildlife
trade is not direct. The only related crimes that
explicitly reference organized crime are
‘smuggling of prohibited or restricted goods’
and money laundering. For smuggling, the
increased penalties are not triggered if the
item smuggled does not fall within the
category of ‘prohibited’ or ‘restricted.’ For
money laundering, there is no further
restriction, but the lack of a direct relationship
may lessen the chances of its use going
forward.
Not all parts of the trade chain are covered.
One of the most important acts associated
with illicit trade, possession, is not mentioned
in the Criminal Code. Related concepts, such
as ‘transportation,’ ‘storage,’ and ‘collection’
are included but are arguably more limited in
scope than the terms ‘possession’ and ‘trade’.
‘Possession’ is a more general concept and
considered a fundamental tool in enforcement,
as it is the most likely act to be discovered and
does not require proof of a specific use or
intent. It thus presents a significant
opportunity for successful prosecution of
crime.
Medicinal trade is only covered to the extent
concepts like ‘preparation,’ ‘collection,’ and
‘use’ are associated with it. Otherwise, the Law
on Medicines creates a potential loophole by
expressly excluding traditional medicines from
its regulatory framework. This gap may be
minimized by the blanket prohibitions on
trade for Mongolia’s Very Rare and Rare
species, but certainly does not cover other
species.
The application of penalties for the export of
species not listed as Very Rare, Rare, or by
CITES is unclear. The Law on Infringements
does not expressly penalize the export of
species without the appropriate permit.
Instead, it limits its application to the
smuggling of ‘prohibited’ or ‘restricted’
goods.344 Wildlife constitute ‘goods,’345 but it is
not clear whether all species are subject to
permitting requirements.
NOTE ON LEGISLATIVE
DEVELOPMENT Typical of any legal system, amendments to one
law can trigger the need to amend related
legislation. In the ten years since the first report,
many of the main laws related to wildlife trade
and management have been amended and in
some instances substantially. These amendments
typically lead to delays in enforcement and
implementation because there is an inevitable
waiting period for related legislation to
subsequently be amended. This can leave offices
and ministries stymied in their daily tasks. This
was the case during the survey for some officers
at the Ministry of Justice, who were forced to
delay the implementation of their legal mandate
to monitor legislation pursuant to the adoption
of a new Law on the Effectiveness of Laws and
Enforcement Efforts, requiring many other legal
adjustments.346
344 Criminal Code, Art. 18.5.1.
345 Law on Customs, Tariffs and Taxes, Art. 3.1.1.
346 Key Stakeholders Interview (M. of Justice).
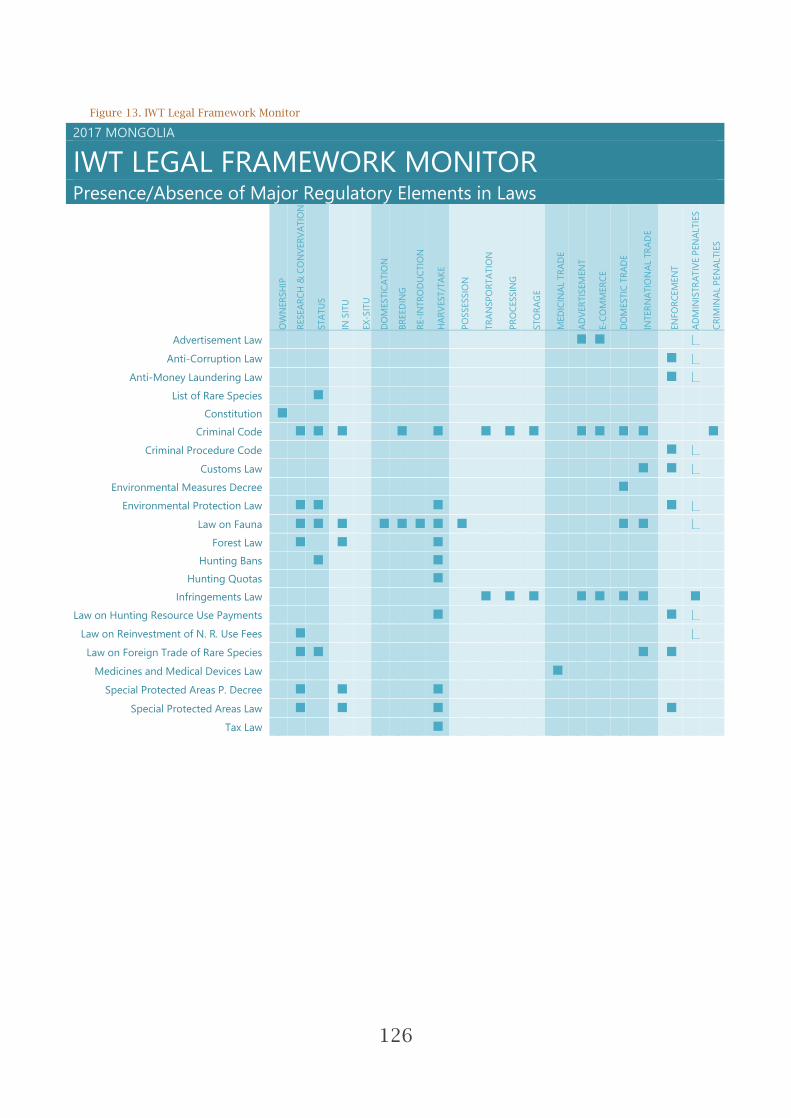
126
Figure 13. IWT Legal Framework Monitor
2017 MONGOLIA
IWT LEGAL FRAMEWORK MONITOR
Presence/Absence of Major Regulatory Elements in Laws
O
WN
ER
SH
IP
RESEA
RC
H &
CO
NV
ER
VA
TIO
N
STA
TU
S
IN S
ITU
EX
-SIT
U
DO
MESTIC
ATIO
N
BR
EED
ING
RE-I
NTR
OD
UC
TIO
N
HA
RV
EST/T
AK
E
PO
SSESSIO
N
TR
AN
SP
OR
TA
TIO
N
PR
OC
ESSIN
G
STO
RA
GE
MED
ICIN
AL
TR
AD
E
AD
VER
TIS
EM
EN
T
E-C
OM
MER
CE
DO
MESTIC
TR
AD
E
INTER
NA
TIO
NA
L TR
AD
E
EN
FO
RC
EM
EN
T
AD
MIN
ISTR
ATIV
E P
EN
ALTIE
S
CR
IMIN
AL
PEN
ALTIE
S
Advertisement Law Anti-Corruption Law
Anti-Money Laundering Law List of Rare Species
Constitution Criminal Code
Criminal Procedure Code Customs Law
Environmental Measures Decree Environmental Protection Law
Law on Fauna Forest Law
Hunting Bans Hunting Quotas
Infringements Law Law on Hunting Resource Use Payments
Law on Reinvestment of N. R. Use Fees Law on Foreign Trade of Rare Species
Medicines and Medical Devices Law Special Protected Areas P. Decree
Special Protected Areas Law Tax Law
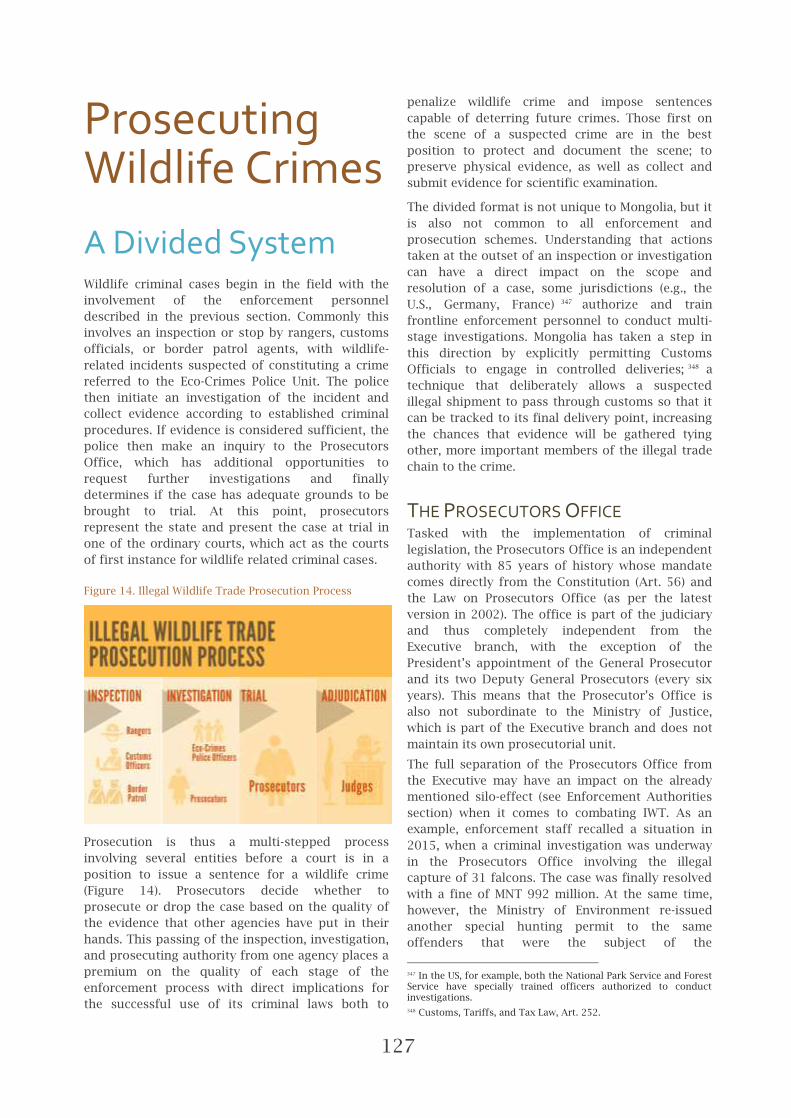
127
Prosecuting Wildlife Crimes
A Divided System Wildlife criminal cases begin in the field with the
involvement of the enforcement personnel
described in the previous section. Commonly this
involves an inspection or stop by rangers, customs
officials, or border patrol agents, with wildlife-
related incidents suspected of constituting a crime
referred to the Eco-Crimes Police Unit. The police
then initiate an investigation of the incident and
collect evidence according to established criminal
procedures. If evidence is considered sufficient, the
police then make an inquiry to the Prosecutors
Office, which has additional opportunities to
request further investigations and finally
determines if the case has adequate grounds to be
brought to trial. At this point, prosecutors
represent the state and present the case at trial in
one of the ordinary courts, which act as the courts
of first instance for wildlife related criminal cases.
Figure 14. Illegal Wildlife Trade Prosecution Process
Prosecution is thus a multi-stepped process
involving several entities before a court is in a
position to issue a sentence for a wildlife crime
(Figure 14). Prosecutors decide whether to
prosecute or drop the case based on the quality of
the evidence that other agencies have put in their
hands. This passing of the inspection, investigation,
and prosecuting authority from one agency places a
premium on the quality of each stage of the
enforcement process with direct implications for
the successful use of its criminal laws both to
penalize wildlife crime and impose sentences
capable of deterring future crimes. Those first on
the scene of a suspected crime are in the best
position to protect and document the scene; to
preserve physical evidence, as well as collect and
submit evidence for scientific examination.
The divided format is not unique to Mongolia, but it
is also not common to all enforcement and
prosecution schemes. Understanding that actions
taken at the outset of an inspection or investigation
can have a direct impact on the scope and
resolution of a case, some jurisdictions (e.g., the
U.S., Germany, France) 347 authorize and train
frontline enforcement personnel to conduct multi-
stage investigations. Mongolia has taken a step in
this direction by explicitly permitting Customs
Officials to engage in controlled deliveries; 348 a
technique that deliberately allows a suspected
illegal shipment to pass through customs so that it
can be tracked to its final delivery point, increasing
the chances that evidence will be gathered tying
other, more important members of the illegal trade
chain to the crime.
THE PROSECUTORS OFFICE Tasked with the implementation of criminal
legislation, the Prosecutors Office is an independent
authority with 85 years of history whose mandate
comes directly from the Constitution (Art. 56) and
the Law on Prosecutors Office (as per the latest
version in 2002). The office is part of the judiciary
and thus completely independent from the
Executive branch, with the exception of the
President’s appointment of the General Prosecutor
and its two Deputy General Prosecutors (every six
years). This means that the Prosecutor’s Office is
also not subordinate to the Ministry of Justice,
which is part of the Executive branch and does not
maintain its own prosecutorial unit.
The full separation of the Prosecutors Office from
the Executive may have an impact on the already
mentioned silo-effect (see Enforcement Authorities
section) when it comes to combating IWT. As an
example, enforcement staff recalled a situation in
2015, when a criminal investigation was underway
in the Prosecutors Office involving the illegal
capture of 31 falcons. The case was finally resolved
with a fine of MNT 992 million. At the same time,
however, the Ministry of Environment re-issued
another special hunting permit to the same
offenders that were the subject of the
347 In the US, for example, both the National Park Service and Forest Service have specially trained officers authorized to conduct investigations.
348 Customs, Tariffs, and Tax Law, Art. 252.
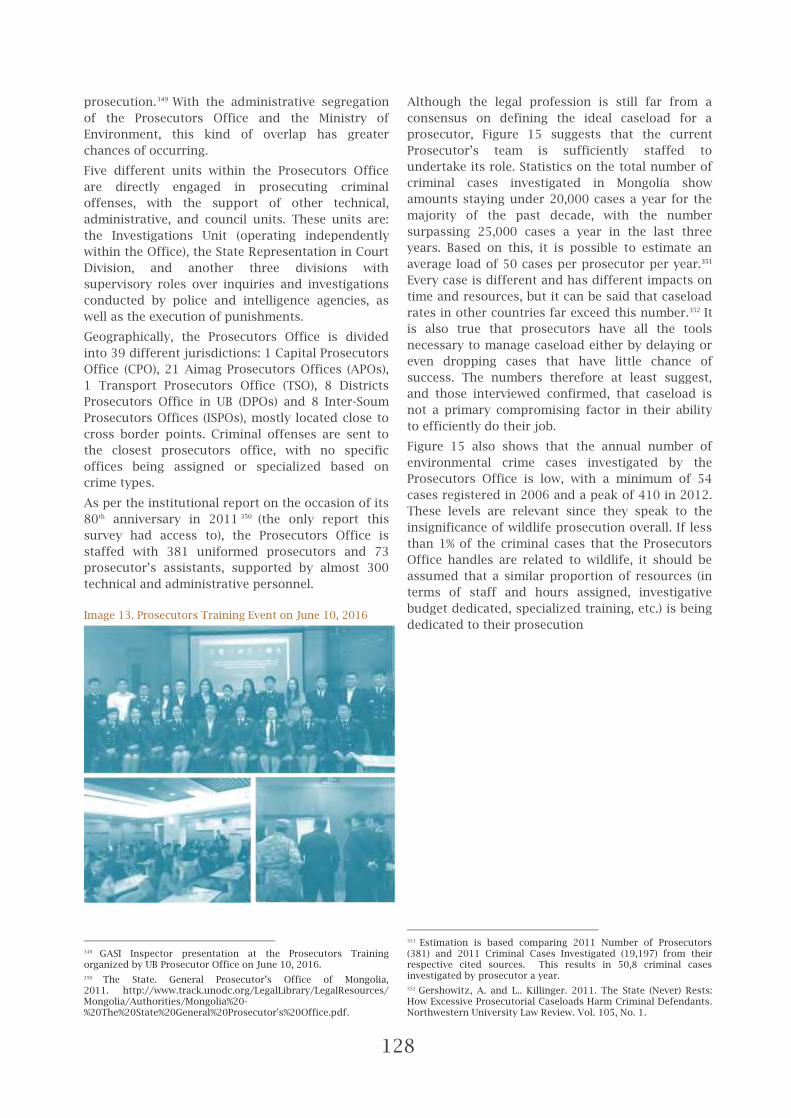
128
prosecution.349 With the administrative segregation
of the Prosecutors Office and the Ministry of
Environment, this kind of overlap has greater
chances of occurring.
Five different units within the Prosecutors Office
are directly engaged in prosecuting criminal
offenses, with the support of other technical,
administrative, and council units. These units are:
the Investigations Unit (operating independently
within the Office), the State Representation in Court
Division, and another three divisions with
supervisory roles over inquiries and investigations
conducted by police and intelligence agencies, as
well as the execution of punishments.
Geographically, the Prosecutors Office is divided
into 39 different jurisdictions: 1 Capital Prosecutors
Office (CPO), 21 Aimag Prosecutors Offices (APOs),
1 Transport Prosecutors Office (TSO), 8 Districts
Prosecutors Office in UB (DPOs) and 8 Inter-Soum
Prosecutors Offices (ISPOs), mostly located close to
cross border points. Criminal offenses are sent to
the closest prosecutors office, with no specific
offices being assigned or specialized based on
crime types.
As per the institutional report on the occasion of its
80th anniversary in 2011 350 (the only report this
survey had access to), the Prosecutors Office is
staffed with 381 uniformed prosecutors and 73
prosecutor’s assistants, supported by almost 300
technical and administrative personnel.
Image 13. Prosecutors Training Event on June 10, 2016
349 GASI Inspector presentation at the Prosecutors Training organized by UB Prosecutor Office on June 10, 2016.
350 The State. General Prosecutor’s Office of Mongolia, 2011. http://www.track.unodc.org/LegalLibrary/LegalResources/Mongolia/Authorities/Mongolia%20-%20The%20State%20General%20Prosecutor's%20Office.pdf.
Although the legal profession is still far from a
consensus on defining the ideal caseload for a
prosecutor, Figure 15 suggests that the current
Prosecutor’s team is sufficiently staffed to
undertake its role. Statistics on the total number of
criminal cases investigated in Mongolia show
amounts staying under 20,000 cases a year for the
majority of the past decade, with the number
surpassing 25,000 cases a year in the last three
years. Based on this, it is possible to estimate an
average load of 50 cases per prosecutor per year.351
Every case is different and has different impacts on
time and resources, but it can be said that caseload
rates in other countries far exceed this number.352 It
is also true that prosecutors have all the tools
necessary to manage caseload either by delaying or
even dropping cases that have little chance of
success. The numbers therefore at least suggest,
and those interviewed confirmed, that caseload is
not a primary compromising factor in their ability
to efficiently do their job.
Figure 15 also shows that the annual number of
environmental crime cases investigated by the
Prosecutors Office is low, with a minimum of 54
cases registered in 2006 and a peak of 410 in 2012.
These levels are relevant since they speak to the
insignificance of wildlife prosecution overall. If less
than 1% of the criminal cases that the Prosecutors
Office handles are related to wildlife, it should be
assumed that a similar proportion of resources (in
terms of staff and hours assigned, investigative
budget dedicated, specialized training, etc.) is being
dedicated to their prosecution
351 Estimation is based comparing 2011 Number of Prosecutors (381) and 2011 Criminal Cases Investigated (19,197) from their respective cited sources. This results in 50,8 criminal cases investigated by prosecutor a year.
352 Gershowitz, A. and L.. Killinger. 2011. The State (Never) Rests: How Excessive Prosecutorial Caseloads Harm Criminal Defendants. Northwestern University Law Review. Vol. 105, No. 1.

129
Figure 15. Crimes Investigated: Total and Environmental Crimes (2006-2015)
SECURING AND PRESERVING EVIDENCE Physical evidence of a crime is often a part of a
criminal case. For wildlife crime, it is hard to
imagine a circumstance where physical evidence is
not just important, but a critical part of the case.
Illegal wildlife take and trade cases require
presenting tangible proof of the illegal behavior in
the form of wildlife specimens (e.g., live animals,
parts, derivatives), guns, vehicles, documents, and
more. When such evidence has not been secured
and properly preserved along a secure chain of
custody, defendants can easily challenge their
validity and authenticity in court. Lacking
irrefutable evidence, a prosecutors’ ability to secure
convictions is compromised.
In Mongolia, the Criminal Procedure Code dictates
the practices and techniques used in criminal
investigations related to evidence. Chapter 11
(Evidence) and Chapter 12 (Activities of Proof) of
the code dedicate a total of 25 articles to the
collection, documentation, storage, and disposal of
all types of evidence. With respect to physical
evidence, unfortunately, the Criminal Procedure
Code offers only a generic approach for
documenting, photographing, sealing, and storing
in a special place all physical evidence that for
reason of its size can not be kept within the case
files. The Code falls short of providing
specifications on the methods that should be used
by law enforcement personnel to conduct those
activities. As a result, wildlife cases may be
impacted by the preservation and presentation of
evidence for which no remedy will be available at
later stages of the prosecution. One of the judges of
UB Songino Khairkhan District recalled one of his
cases where two hunters were charged with the
crime of hunting 203 marmots in the off-season.
The court found that the lack of evidence
concerning the specimens confiscated, the fact that
they were no longer available, and that no weapons
were identified as being used in the crime meant
there was insufficient evidence of a crime.
Sentencing was therefore issued in favor of the
accused.353
The proper storage of evidence is also cited by
multiple agencies as a major difficulty in the
prosecution of crime in Mongolia. Because of its
potential for decomposition, wildlife evidence often
needs secure and climate stable storage. It is
common for countries to have cold and dry storage
facilities with 24-hour surveillance and strict
protocols for registration of all physical evidence or
staff entering and leaving the facilities. In Mongolia,
the Criminal Procedure Code does not describe the
chain of custody and does not provide any specific
rule for ensuring the preservation of evidence.
According to those surveyed, Mongolia does not
have storage facilities that would meet the
standards necessary to preserve evidence for
wildlife crimes and would need resources to build
proper facilities.
Lacking clear legal guidance on physical evidence
storage, informants from GASI and the Prosecutors
Office provided unverified examples on how
officers may deal with the loophole on a case-by-
353 Presentation of Judge Dashdondov at the Prosecutors Training organized by UB Prosecutor Office on June 10, 2016.
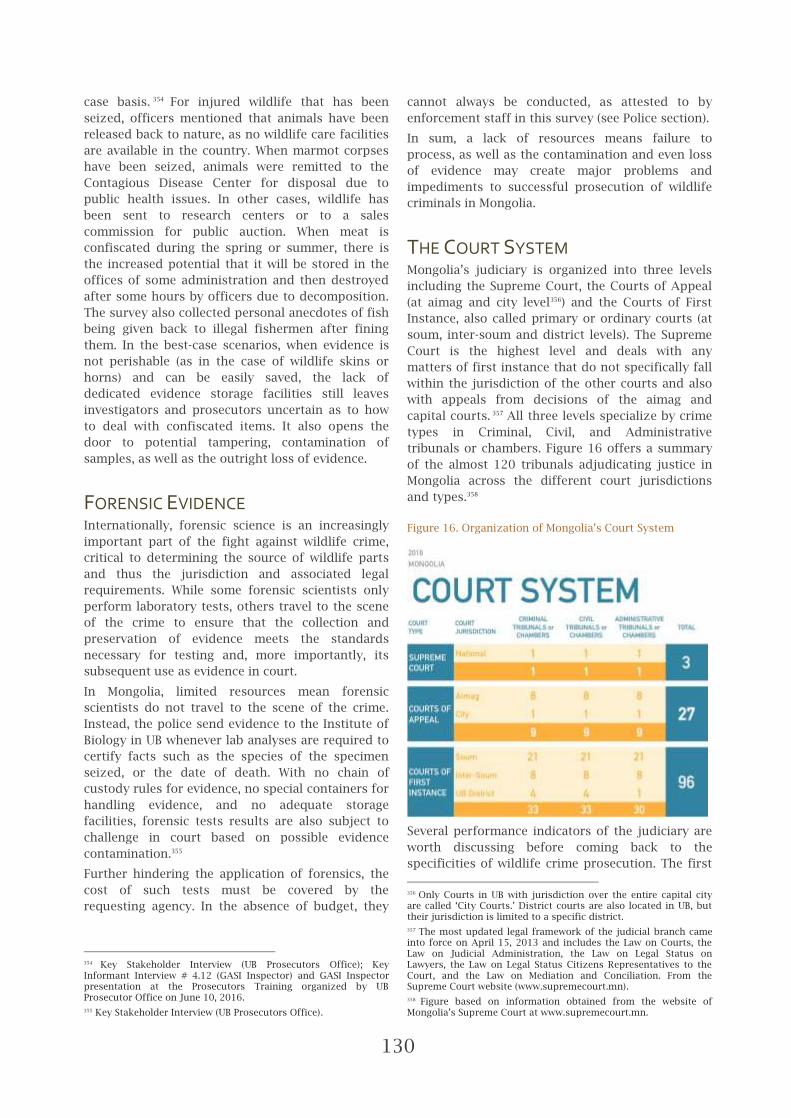
130
case basis. 354 For injured wildlife that has been
seized, officers mentioned that animals have been
released back to nature, as no wildlife care facilities
are available in the country. When marmot corpses
have been seized, animals were remitted to the
Contagious Disease Center for disposal due to
public health issues. In other cases, wildlife has
been sent to research centers or to a sales
commission for public auction. When meat is
confiscated during the spring or summer, there is
the increased potential that it will be stored in the
offices of some administration and then destroyed
after some hours by officers due to decomposition.
The survey also collected personal anecdotes of fish
being given back to illegal fishermen after fining
them. In the best-case scenarios, when evidence is
not perishable (as in the case of wildlife skins or
horns) and can be easily saved, the lack of
dedicated evidence storage facilities still leaves
investigators and prosecutors uncertain as to how
to deal with confiscated items. It also opens the
door to potential tampering, contamination of
samples, as well as the outright loss of evidence.
FORENSIC EVIDENCE Internationally, forensic science is an increasingly
important part of the fight against wildlife crime,
critical to determining the source of wildlife parts
and thus the jurisdiction and associated legal
requirements. While some forensic scientists only
perform laboratory tests, others travel to the scene
of the crime to ensure that the collection and
preservation of evidence meets the standards
necessary for testing and, more importantly, its
subsequent use as evidence in court.
In Mongolia, limited resources mean forensic
scientists do not travel to the scene of the crime.
Instead, the police send evidence to the Institute of
Biology in UB whenever lab analyses are required to
certify facts such as the species of the specimen
seized, or the date of death. With no chain of
custody rules for evidence, no special containers for
handling evidence, and no adequate storage
facilities, forensic tests results are also subject to
challenge in court based on possible evidence
contamination.355
Further hindering the application of forensics, the
cost of such tests must be covered by the
requesting agency. In the absence of budget, they
354 Key Stakeholder Interview (UB Prosecutors Office); Key Informant Interview # 4.12 (GASI Inspector) and GASI Inspector presentation at the Prosecutors Training organized by UB Prosecutor Office on June 10, 2016.
355 Key Stakeholder Interview (UB Prosecutors Office).
cannot always be conducted, as attested to by
enforcement staff in this survey (see Police section).
In sum, a lack of resources means failure to
process, as well as the contamination and even loss
of evidence may create major problems and
impediments to successful prosecution of wildlife
criminals in Mongolia.
THE COURT SYSTEM Mongolia’s judiciary is organized into three levels
including the Supreme Court, the Courts of Appeal
(at aimag and city level356) and the Courts of First
Instance, also called primary or ordinary courts (at
soum, inter-soum and district levels). The Supreme
Court is the highest level and deals with any
matters of first instance that do not specifically fall
within the jurisdiction of the other courts and also
with appeals from decisions of the aimag and
capital courts. 357 All three levels specialize by crime
types in Criminal, Civil, and Administrative
tribunals or chambers. Figure 16 offers a summary
of the almost 120 tribunals adjudicating justice in
Mongolia across the different court jurisdictions
and types.358
Figure 16. Organization of Mongolia’s Court System
Several performance indicators of the judiciary are
worth discussing before coming back to the
specificities of wildlife crime prosecution. The first
356 Only Courts in UB with jurisdiction over the entire capital city are called ‘City Courts.’ District courts are also located in UB, but their jurisdiction is limited to a specific district.
357 The most updated legal framework of the judicial branch came into force on April 15, 2013 and includes the Law on Courts, the Law on Judicial Administration, the Law on Legal Status on Lawyers, the Law on Legal Status Citizens Representatives to the Court, and the Law on Mediation and Conciliation. From the Supreme Court website (www.supremecourt.mn).
358 Figure based on information obtained from the website of Mongolia’s Supreme Court at www.supremecourt.mn.

131
(Figure 17) shows the conviction rate of Mongolia’s
criminal tribunals, which for the decade of 2005-
2014 averaged 43%. This is the portion of the total
criminal offenders with open cases for investigation
in the Prosecutors Office (19,927 for the decade or
an average close to 2,000 a year) that were finally
convicted by a court and a sentence applied (8,248
individuals or close to 800 a year). For the
remaining 57% of the criminal investigations, the
evidence secured was insufficient to either bring it
to court or, once there, to properly demonstrate the
culpability of the defendants. Missing from this
data is the number of cases actually brought to
trial, which would allow comparison with other
jurisdictions, as the common measure references
cases brought against convictions.
Figure 17. Criminal Convictions compared to Investigations in Mongolia
Another performance indicator in Mongolia’s
criminal justice system is the effective
implementation or enforcement of judicial
decisions or court sentences. As shown in Figure 18,
from 2004-2014 the annual rate of non-compliance
with judicial sentencing for all sentences (including
all civil, criminal and administrative related
sentences) was close to 30%. The highest level of
compliance occurred in 2013 and 2014 with 77% of
the sentences executed; and the lowest in 2010,
with only 52% of the court decisions enforced. 359
The enforcement of court judgments is therefore
another critical factor when reviewing conviction
information related to wildlife cases. A conviction is
not the same as compliance with sentencing, and
the gap that exists could be improved.
Figure 18. Implementation of Judicial Decisions
Connected to the preceding indicator (compliance
with court decisions) is the proportion of the
assessment of economic damage that is finally
restituted (to both public and private entities). For
the period 2005-2016, the ratio of assessed damage
to restitution was on average 3:1, or just 36% of the
assessed damages were in fact paid (see Figure 19).
In the first part of the decade, total annual damages
were appraised at around MNT 40 billion (USD 17.4
million). Starting in 2013, this annual figure more
than tripled, surpassing MNT 150 billion (USD 65.2
million), and has not dropped in the years since. In
aggregate numbers for the decade, the amount of
assessed damages effectively restituted came only
to USD 348 million out of the initial assessment of
USD 953 million made during investigations. In
essence, the difference of around USD 600 million
of unpaid damages is the real opportunity cost of
not having in place more effective evidentiary
protocols, equipment, and infrastructure. Viewed in
this light, leveraging financial resources to enhance
enforcement and prosecution capacity to better
359 Mongolia Statistical Information Office (www.1212.mn).
52 %
77 %
0%
100%
2004 2005 2006 2007 2008 2009 2010 2011 2012 2013 2014
MONGOLIA 2004-2014
IMPLEMENTATION OF JUDICIAL DECISIONS National Average (in % of total court decisions)

132
secure, store, and handle evidence should be a
priority, and an investment that could be supported
internally through increases in damage restitution
that would follow.
Figure 19. Restitution of Damages in Criminal Prosecutions
Wildlife Crime Cases Over the last decade, environmental criminal cases
represented an insignificant portion of total
criminal cases; around 2,500 out of 250,000 cases
or 1% as per Figure 15. The volume of wildlife crime
cases is even smaller at just 15% of that 1%, or 1.5
cases per 1,000. Although this survey did not have
access to national statistics on wildlife crime
prosecution, estimates offered by the Police Eco-
Crimes Division indicate that only 15% of their
cases are related to wildlife (with mining cases
dominating most of their attention and resources).
Information on wildlife crime cases from 17 of the
21 aimags provided by the Prosecutors Office and
detailed in Figure 20 supports the same estimate. It
shows that for the decade 2007-2016 the total
wildlife cases investigated were as low as 263 (220
for illegal hunting, plus 43 for wildlife smuggling),
which would represent 11% of the environmental
cases for the same period. The survey did not have
access to data from the UB Prosecutors Office for
the 3-year period from 2013-2015. Staff from that
office, nonetheless, were able to confirm that
wildlife crimes represented an insignificant part of
their caseload compared to the total prosecuting
effort, with only 17 wildlife cases out of 8,000 total
criminal cases.360
Figure 20 also shows that around 65% of the cases
made it to court, while the Prosecutors Office
dropped the remaining 35%. As explained in the
previous section, this occurs when evidence is not
considered sufficient to sustain the case in front of
a judge. For the 17 out of 21 aimags for which
information was available, 142 cases involving
illegal wildlife take and 27 involving illegal wildlife
trade (more precisely ‘smuggling) made it to
court.361
The difference in the overall number of cases for
each type of crime (more hunting related than
smuggling related), highlights the fact that
enforcement is concentrated precisely in those
areas where evidence collection is more challenging
– the illegal hunting activity. The fact that both
types of enforcement activities have roughly the
same percentage of cases that make it to court
suggest that both circumstances nonetheless suffer
from the inability to secure adequate evidence.
Unfortunately, no information on wildlife cases
court sentences was available to the survey.
Figure 20. Wildlife Crime Prosecution under Criminal Code Article 203 and Article 175
360 Key Stakeholder Interview (UB Prosecutors Office).
361 Information provided by the Prosecutors Office.
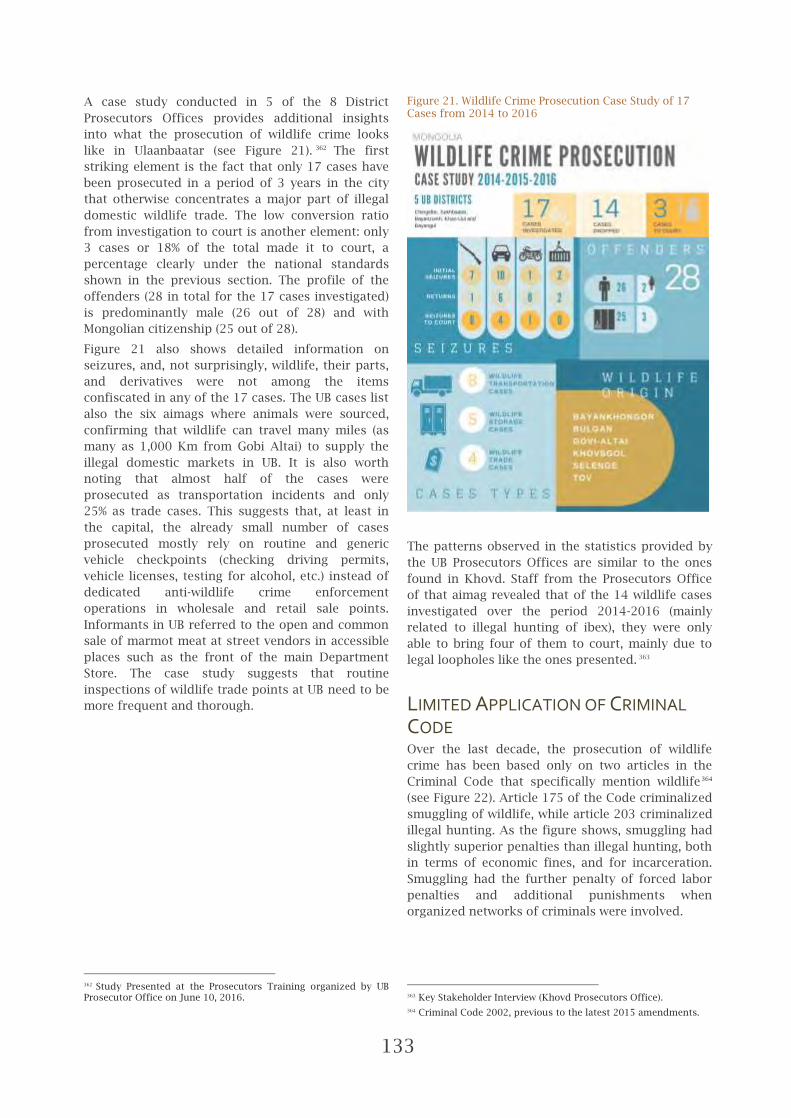
133
A case study conducted in 5 of the 8 District
Prosecutors Offices provides additional insights
into what the prosecution of wildlife crime looks
like in Ulaanbaatar (see Figure 21). 362 The first
striking element is the fact that only 17 cases have
been prosecuted in a period of 3 years in the city
that otherwise concentrates a major part of illegal
domestic wildlife trade. The low conversion ratio
from investigation to court is another element: only
3 cases or 18% of the total made it to court, a
percentage clearly under the national standards
shown in the previous section. The profile of the
offenders (28 in total for the 17 cases investigated)
is predominantly male (26 out of 28) and with
Mongolian citizenship (25 out of 28).
Figure 21 also shows detailed information on
seizures, and, not surprisingly, wildlife, their parts,
and derivatives were not among the items
confiscated in any of the 17 cases. The UB cases list
also the six aimags where animals were sourced,
confirming that wildlife can travel many miles (as
many as 1,000 Km from Gobi Altai) to supply the
illegal domestic markets in UB. It is also worth
noting that almost half of the cases were
prosecuted as transportation incidents and only
25% as trade cases. This suggests that, at least in
the capital, the already small number of cases
prosecuted mostly rely on routine and generic
vehicle checkpoints (checking driving permits,
vehicle licenses, testing for alcohol, etc.) instead of
dedicated anti-wildlife crime enforcement
operations in wholesale and retail sale points.
Informants in UB referred to the open and common
sale of marmot meat at street vendors in accessible
places such as the front of the main Department
Store. The case study suggests that routine
inspections of wildlife trade points at UB need to be
more frequent and thorough.
362 Study Presented at the Prosecutors Training organized by UB Prosecutor Office on June 10, 2016.
Figure 21. Wildlife Crime Prosecution Case Study of 17 Cases from 2014 to 2016
The patterns observed in the statistics provided by
the UB Prosecutors Offices are similar to the ones
found in Khovd. Staff from the Prosecutors Office
of that aimag revealed that of the 14 wildlife cases
investigated over the period 2014-2016 (mainly
related to illegal hunting of ibex), they were only
able to bring four of them to court, mainly due to
legal loopholes like the ones presented. 363
LIMITED APPLICATION OF CRIMINAL
CODE Over the last decade, the prosecution of wildlife
crime has been based only on two articles in the
Criminal Code that specifically mention wildlife 364
(see Figure 22). Article 175 of the Code criminalized
smuggling of wildlife, while article 203 criminalized
illegal hunting. As the figure shows, smuggling had
slightly superior penalties than illegal hunting, both
in terms of economic fines, and for incarceration.
Smuggling had the further penalty of forced labor
penalties and additional punishments when
organized networks of criminals were involved.
363 Key Stakeholder Interview (Khovd Prosecutors Office).
364 Criminal Code 2002, previous to the latest 2015 amendments.

134
Figure 22. Criminal Code Articles Used in Prosecution of Wildlife Crimes
Since the Criminal Code did not explicitly penalize
the possession or domestic trade of wildlife illegally
hunted, traffickers and even illegal hunters in the
past have escaped charges by claiming they did not
hunt the animal. Several officials cited this loophole
as a common obstacle to a successful prosecution.
Without evidence to prove a suspect was in fact the
hunter, the judge or prosecutor could decide to
drop the case. The same was true if the species was
endangered but did not occur exclusively in
Mongolia, again because Article 203 only
criminalized illegal hunting inside the country. In
instances where a species did not occur in the
country, illegal traders could rest on its foreign
sourcing to escape prosecution. This happened in
recent years with a case of Saiga horns from
Kazakhstan and a lion pelt from an unknown
location; both cases were dropped due to the
aforementioned loopholes, despite the applicability
of Mongolia’s Endangered Species Trade law as
previously discussed.
The prosecution of wildlife crimes in Mongolia in
the past decade has been done without fully
exploring the opportunities potentially offered by
the Criminal Code. Many other articles could have
been leveraged to fight illegal hunting and trade of
wildlife including:
Art. 155, punishing the sale, acquisition, and
storage of illegal products;
Art. 161, criminalizing the transportation of
illegal products;
Art. 304, criminalizing the mass destruction of
animals;
Art. 163, criminalizing money laundering of
proceeds from illegal operations.
None of these articles were used against wildlife
offenders. In the UB case study presented above
(Figure 21), all 17 mentioned cases were prosecuted
under Art. 203 (illegal hunting) in spite of the fact
that the offenses involved had several elements
(transportation, storage and sale of illegally hunted
animals) overlapping with the provisions just
mentioned.
FINES VS IMPRISONMENT Another common fact in recent years is that
sentencing has been dominated by fines rather than
by detention or imprisonment. Figure 22 shows how
detention, forced labor, and incarceration are
penalties included in both articles 175 and 203. In
reality, prosecutors confirmed that in very few
sentences did wildlife offenders receive jail time.365
It is clear by statements also from managers and
enforcers that criminals only face economic
penalties, and that even in the case of
imprisonment, the Amnesty law is used to pardon
illegal hunters or traders from serving time in jail.
The Prosecutors Office illustrated the point with
multiple examples of cases of illegal hunting that
should have been considered serious offenses, but
which ended only with fines. Hunting moose, a
species classified as Very Rare and therefore strictly
protected, in Khentii aimag in October 2015 ended
with a fine of around USD 3,500366 (plus USD 4,350367
for the Ecological Value) and no prison time.368 The
same has been true for hunting animals in large
numbers, such as marmots, which are commonly
confiscated in the order of hundreds; or fishing for
catch and release-only species like Taimen. In all
cases, sentences include fines and no prison time.
Even fines are subject to dismissal. In reviewing
Supreme Court sentences related to wildlife cases,
this survey found the pardon of fines previously
imposed by the Court of Appeals supposedly as a
form of celebrating the 25th anniversary of the
Mongolian democracy.369
365 Key Stakeholder Interview (UB and Khovd Prosecutors Office)
366 MNT 8 million, converted at the rate of 1 USD = 2,300 MNT
367 MNT 10 million, converted at the rate of 1 USD = 2,300 MNT
368 Key Stakeholder Interview (Prosecutor Office)
369 Three illegal hunters of Dalmatian Pelicans were sentenced in a first instance court to an aggregated fine of 67 Million Tugriks plus 13 Million Tugriks in Damage Restoration (equivalent to 30,000
135
A VIEW INSIDE THE COURT ROOM During the survey, one member of the research
team had the opportunity to attend a district
criminal court case and observe the proceedings.
The case did not involve a wildlife crime, but was
nonetheless instructive on the general practices,
providing some ability to consider how they would
relate to or be applied in a wildlife crime case.
Already a clear issue identified in the preceding
section, the types of evidence and evidence
handling presented the most obvious pitfalls in the
prosecution of the case; ones that would be equally
troublesome in a wildlife trafficking case. The case
in question was an assault case where neither the
victim (i.e., the plaintiff) nor the police or other
witness was present. Instead, the three judges who
heard the case let it proceed with the Prosecutor
presenting evidence, both physical and written
testimony. In article 94 of Mongolia’s Criminal
Procedure Code, there is no distinction made
between a court’s inquiry and an initial
investigation by law enforcement. In basic terms, if
evidence is collected “lawfully” and properly by the
Police, it can be admitted into evidence. However,
none of the evidence was corroborated or verified
by the officer who collected it or by any witness.
Despite this being proper procedure under the law,
and other prosecutors verifying that this is how a
court case would proceed normally at the District
level, the judges had clear problems with the
evidence collection. They questioned the origin and
validity of the evidence multiple times in the case.
The lack of enforcement personnel also seemed to
play a clear role in the sentencing. Ultimately, the
defense in this case successfully argued that much
of the physical evidence should not be considered,
as there was no proper foundational testimony
provided. The court, in fact, agreed that one piece
of evidence should not be considered; a decision
that appeared to impact the final outcome.370
While the majority of the evidentiary problems that
came up in this case seemed to favor the
prosecution, they could, in other cases, just as
easily not favor them. In fact, the low number of
wildlife cases brought to court and the low
conviction rates suggest that the latter is more
common. In the observed case, problems with the
USD and 5,700 USD). After appealing to a court of appeals based on unlawful evidence procedures, the Court void the first instance decision based on the anniversary of Mongolian democracy. After Prosecutors Office appeal to the Supreme Court, fines were reestablished and Courts of Appeal rule amendment. Criminal Case 153/2015/054/e at www.supremecourt.mn
370 Judges issue decisions, but no opinions in these instances. There is, therefore, no way to verify the reasoning behind the decision made. This opinion is based solely on the discussions and comments made at the time of the proceeding.
evidence, ones that might have been avoided with
tighter handling of evidence and the production of
necessary witnesses, resulted in a lighter sentence.
Beyond the presentation of evidence, another major
issue observed was the format of the testimony
presented by the defendant, in particular the lack of
any real structure in the questioning and
opportunity for cross-examination. The defendant’s
free-form testimony left no space to manage the
introduction of this testimony either through
questioning or objections. It also tended to prevent
the prosecution’s ability to conduct effective cross-
examination, and thus to examine the veracity of
statements made.
A survey of one case, of course, is not a survey.
However, the practices observed and commented on
were also ones that prosecutors confirmed as a
normal part of criminal proceedings in Mongolia.
They point directly to problems related to the legal
requirements and practices associated with
collection and presentation commented on by
virtually all enforcement and prosecutors in the
context of this survey. In the end, no case can stand
without adequate evidence. Neither the law, nor the
actual practices are set up to ensure that the best
evidence is being gathered and preserved for
presentation when it is most needed in the
courtroom.
The Final Challenge to Prosecution The final hurdle to adequate prosecution of wildlife
can sometimes be a function of the overarching
legal system, as opposed to any provision specific
to wildlife trade. How the system operates as a
whole, and especially within the courtroom, can be
a deciding factor in securing a verdict. These
questions are dictated in part by the type of legal
system (e.g., is it a civil law vs common law
jurisdiction), the role of judges in the interpretation
of law, the format of case proceedings, and some of
the instructions (or lack thereof) with respect to
handling evidence, expert witnesses, and conflicts
of law. This section discusses some of these issues
as observed during the implementation of the
overall survey. It is not meant to be exhaustive, but
useful to the extent it highlights additional
challenges.
The starting point in this analysis is Mongolia’s
legal heritage; based on the civil law system used in
most European countries, later adapted by Russia,
and finally introduced from there to Mongolia. As a

136
result, the civil law system in Mongolia reflects in
many ways the Soviet approach to jurisprudence,
sometimes referred to as a socialist law system.371
Although there have been rapid advances in
legislation and new influences from other legal
systems in the post-soviet era, the base remains the
same and informs both the structure and
application of law generally. Some of these practices
relate to how the legislation is developed and
organized. Others concern how they are applied and
interpreted by courts. In the fight against illicit
wildlife trade and in the process of developing
comprehensive and effective legislation, they all
matter. The following sub-sections give a brief
introduction to some of these for reference in this
and later analyses.
LEGISLATIVE HIERARCHY Legislative hierarchy is a fundamental part of the
rule of law. Understanding how it works generally in
a given country and in relation to a particular topic
matters both to the development and application of
law. For legal development, hierarchy is critical to
how the system functions as a whole and must be
considered to ensure that each level and type of law
has appropriate content. In the application of law,
the hierarchy instructs the courts on which laws are
superior and thus, in some instance, which may
take precedence in the event of a conflict of laws.
In Mongolia, the basic hierarchy holds that the
Constitution is the supreme law and that all laws372
and treaties signed by the country 373 must be in
conformity with it. This is a common formula
similar to most countries in the world.
Where international law fits in this hierarchy is not
without debate, but there are several environmental
laws that require resolution of conflicts in favor of
international requirements. In other words,
international agreements that Mongolia has joined,
to the extent they do not conflict with the
Constitution, are by the terms of many laws legally
superior to national legislation. The Civil Code, for
example, specifically permits courts to ‘apply
universally accepted international norms in case
proceedings related to international civil law
provided that they do not conflict with the
Constitution of Mongolia.’374 In addition to this, a few
laws in the compiled IWT legal framework state that
if an international treaty to which Mongolia is a
party provides ‘otherwise than the present Law, then
371 "Socialist Legal Systems" lawin.org. 07, 2013. Accessed 06 2017. http://lawin.org/.
372 Civil Code, Art. 10.1.
373 Civil Code, Art. 10.5.
374 Civil Code, Art. 10.5.
the provisions of the international treaty shall
prevail.’ 375 Wildlife related treaties to which
Mongolia is a signatory include CITES, the
Convention on Migratory Species, and the
Convention on Biological Diversity. This assessment
only discusses Mongolia’s implementation of its
CITES obligations, as it is specifically dedicated to
the issue of international wildlife trade.
National laws (using the term in the broadest sense
possible) follow in this hierarchy, but there are
many types and relationships between. They can
include laws, decrees, and resolutions issued by
Parliament, the President’s Office, the Cabinet
Ministry, and all of the line Ministries. Although the
majority of the IWT legal framework compiled in
this study was issued by Mongolia’s parliament,
important wildlife related resolutions and decrees
come from other branches and bodies, including the
Cabinet Ministry, the Ministry of Environment, and
the President’s Office. Several other government
entities have a mandate related to wildlife trade and
at least some regulatory power to further
implement that authority. They include the Ministry
of Justice (EcoCrimes Division of the Police), the
General Intelligence Agency, and the Ministry of
Finance (General Customs Authority).
Mongolia’s framework of laws relevant to wildlife
trade has a foundation in virtually every level of the
legal hierarchy. One of the goals of the analysis is to
show where in the framework particular aspects of
wildlife trade are regulated, to identify areas of
known or potential interaction, and provide at least
some indication of how hierarchy may play a role in
resolving conflicts between laws.
CONFLICT OF LAW Conflicts between laws are inevitable. They can
occur between laws enacted by the same legislature,
between regions within the same country, between
agencies with overlapping authorities, even within a
single law. For a legal system to function effectively
conflicts must be anticipated and principles in place
so that judges can resolve them when they arise.
In Mongolia, however, there are few legal provisions
concerning the resolution of such conflicts. The
Civil Code itself is mostly silent on the question.
Article 10.5 allows courts to apply international
norms that ‘do not conflict with the Constitution of
Mongolia.’ Article 10.7 of the same Code states
further that courts may not ‘refuse to apply a norm
of legislation on the grounds that laws are in
conflict, unfair or contrary to the universally
accepted ethical norms.’ It is not clear from the 375 E.g., Environmental Protection Law, Art. 2; Law on Fauna, Art. 2; Special Protected Areas Law, Art. 2.

137
structure of the sentence in 10.7 whether it refers
to laws in conflict with each other, or in only
conflict with ‘universally accepted ethical norms.’ In
any event, neither 10.5 nor 10.7 are instructive on
how to resolve disputes when there is a conflict
between national laws.
INTERPRETATION OF LAW In Mongolian jurisprudence, the ‘interpretation’ of
law and its ‘application’ are considered separate
powers, the first being reserved by the Constitution
exclusively to the Supreme Court.376 Unlike all other
court decisions, Supreme Court interpretations
(issued in the form of a resolution) become part of
the law,377 and in that sense have precedent for the
further application of law in the lower courts.
Pursuant to the Civil Code, the remaining courts are
instructed to just ‘apply’ the law.378 This is a critical
distinction that may seem highly legalistic and
theoretical, but has direct implications for the
successful prosecution in general and of illegal
wildlife trade cases in particular.
In many jurisdictions, these two concepts are
considered inseparable and fundamental to the
operation of any court. In other words, a judge
cannot merely ‘apply’ the law and not inevitably be
faced with the necessity of its ‘interpretation’ as
well. In any given law, some provisions will be
simple and therefore susceptible of direct
application (e.g., hunting a Very Rare species is
prohibited). However, it is often the case that the
law is silent on a particular point or ambiguous in
some way (e.g., causing damaging in a large
amount). Mongolia’s Civil Code recognizes this
reality and provides judges with certain guidelines.
The first instructs judges, ‘[i]n the absence of
apply legal norms that regulate similar relations.’379
In other words, judges may apply analogous rules
whenever the law before them has a gap.
Furthermore, in the absence of legislation, courts
are to resolve disputes in line with the
Constitution.380 And finally, courts cannot refuse to
resolve a case in the absence of a legal norm or
where ‘such norm is not clear.’381
376 The 1992 Constitution states in Article 50(1) that the Supreme Court of Mongolia is the highest judicial organ with the power to, inter alia, issue the official interpretations for correct application of all law, except for Constitution.
377 Melville, C., O. Erdenedalai, and A. Woolley (2015). Overview of the Mongolian Legal System and Laws. GlobaLex, Hauser Global Law School Program.
378 Civil Code, Art. 10.1.
379 Civil Code, Art. 10.4.
380 Id.
381 Id. at Art. 10.6.
Whether a norm is absent or ambiguous, however,
Mongolia’s courts are still instructed solely to
‘apply’ legislation, not ‘interpret’ it. This division in
authority is a foundational element in Mongolian
jurisprudence and has particular implications for
the application of law and the strength of its legal
system. As a practical matter, judges in courts of
first instance (trial courts) are the ones that actually
handle wildlife trade cases in Mongolia, with only
some cases making it to a court of appeals and
barely a dozen arriving to the Supreme Court in the
last five years. 382 Where ambiguity exists, judges
may engage in de facto interpretations. Without
guidelines, however, there is the danger of
inconsistent decisions, a result that other civil law
systems at least partially mitigate against under the
doctrine of ‘jurisprudence constante.’ 383 The only
court interpretations available for reference to
Mongolia’s judges are those issued by the Supreme
Court. Equally important, however, this limitation
also means that a case may be dismissed where the
ambiguity or gap is seen as an absence of a legal
requirement. In such instances, the court is
technically not refusing to resolve the claim, merely
deciding that no cause of action exists.
LARGE AMBIGUITIES IN SMALL WORDS Ambiguity in law arises any time language used may
be understood in more than one way by individuals
with the requisite skill and knowledge to
understand them. How ambiguities are resolved
differs between jurisdictions and can be a complex
area of jurisprudence. The goal here is only to
highlight ambiguities of particular relevance to the
prosecution of wildlife trade crimes in Mongolia.
With respect to wildlife trade, Mongolia’s 2002
Criminal Code, 384 contained undefined terms that
posed problems for investigators and prosecutors.
One of the clauses, Article 175, applied criminal
penalties to the attempted smuggling of wildlife
parts (governed by Art. 18.5 after 2015 Criminal
Code entered into force). A portion of that article is
quoted below with the language of concern
bracketed. Article 175.1 stated that:
382 Online Database of Supreme Court Cases (Supremecourt.mn)
383 The legal doctrine in civil law jurisdictions holding that a series of previous decisions applying a particular legal principle or rule is highly persuasive, although not controlling in subsequent cases dealing with similar or identical issues of law.
384 Mongolia passed a new Criminal Code in 2015, which was supposed to enter into force in September of that year. This was delayed until the middle of 2017 to allow for necessary organizational restructuring, training of public officials, and public awareness. The 2002 version of the Criminal Code, therefore, has continuing relevance to the analyses in this report, since it was the applicable law during the decade 2006-2015 this report focuses on.

138
restricted animals or currency or other valuables
[in a large amount
At the same time, Article 295 of the Customs Law
applied administrative penalties to the same act,
but only if the Criminal Code did not cover the
incident (now governed by Article 10.20 of the Law
on Infringements).385 The relevant portion of Article
295.1 stated:
of restricted goods [does not qualify as a criminal
offence 386
As both laws covered the smuggling of ‘restricted
goods,’ the threshold question for the application of
the Criminal Code was therefore whether the
incident involved ‘a large amount,’ a term that
could not be applied without interpretation.
As seen in the Customs Agency’s enforcement
records, it likely resulted in some inconsistency in
the prosecution of offenses as either criminal or
administrative. The Customs Agency, for example,
reported the attempted smuggling of one frozen
wolf on two occasions as a criminal incident.
However, it also treated the attempted smuggling of
15 wolf skins in 4 incidents and 49 wolf anklebones
(representing the taking of at least 12 wolves) in
two separate incidents as administrative offenses.
The 2015 Criminal Code has eliminated this
undefined term, applying criminal penalties for
attempted smuggling without reference to the size
of the attempt.
THE SPECIAL CASE OF ‘AND’ AND ‘OR’ The use of connectors is a separate problem that
neither the new version of the Criminal Code, nor
the Law on Infringements fully eliminates, although
there have certainly been significant advances.
At the risk of being technical, understanding how
connectors like ‘and’ (болон) and ‘or’ (буюу) can
cause legal ambiguities needs some explanation. For
starters, these terms have the same function in the
Mongolian language as they do in other languages;
they can be used as ‘conjunctive’ or ‘disjunctive’
connectors. In other words, they tell the reader
whether the items contained in a list of things must
be considered together (conjunctive) or may be
treated as one, among two or more alternatives
(disjunctive). The problem is that ‘and’ can actually
385 This provision has since been superseded by the Law on Penalties, but remains relevant to the analysis as it governed the division between administrative and criminal violations of the Customs law until September 2016. From this point, the Law on Penalties applies, but it maintain the basic format in that administrative fines are applied to the extent the violation in question is not otherwise covered by the Criminal Code.
386 Unofficial translation by Legal Atlas.
perform both functions (whether in Mongolian or in
English) and ‘or’ can be either ‘exclusive’ (one item,
and only one, among the listed alternatives) or
‘inclusive’ (one item or more among alternatives). In
many instances, it is the context of the text that
helps us determine which function is intended; and,
for the most part, context is all you need.
The best way to show how the problem manifests
itself is first to dive into some simplified, mock
examples. These examples are for illustration
purposes only and are not found in Mongolian law;
actual examples follow.
a. Using ‘and’ in the conjunctive sense: ‘It is
illegal to be in a protected area and carry a
gun.’ The context tells us that these two
things must happen together (conjunctively)
in order for a violation to occur. It is not
illegal just to be in a protected area; and it is
presumably not illegal just to carry a gun.
However, it is illegal for these two things to
occur at the same time; i.e., conjunctively.
b. Using ‘and’ in the disjunctive sense: ‘It is
illegal to hunt at a prohibited time and in a
prohibited place.’ In this instance, both things
may be considered independently
(disjunctively) as illegal. You can be found
guilty of hunting at a prohibited time; and
you can be found guilty of hunting in a
prohibited area. Hunting in a prohibited place
and at a prohibited time do not have to
happen at the same time.
The term ‘or’ is not as easily used in anything other
than a disjunctive sense. However, it can be used as
an exclusive ‘or’ (denoting “one and only one among
alternatives”), or an inclusive ‘or’ (denoting “one or
more, among alternatives”). In texts where
ambiguity cannot be permitted (especially true in
legal texts), often other words are used to indicate
which of the two (inclusive or exclusive) is intended
(e.g., “one or the other, but not both”).
Using ‘or’ in the exclusive sense: ‘It is legal to
catch and keep two fish per day or six fish per
week.’ In this instance, context tells us that
the ‘or’ operates as an exclusive connector.
While an individual may catch two fish per
day, they cannot continue catching two per
day, every day of the week, as this would
clearly cause them to be in violation of the
‘six per week’ limitation. The legal limit of six
per week is thus exclusive of the legal limit of
two per day.
Using ‘or’ in the inclusive sense: ‘In this river,
it is legal to fish for lenok or for whitefish.’ In
this instance, the ‘or’ is intended as an

139
inclusive connector. An individual may legally
fish for lenok and whitefish in the indicated
place.
In Mongolian legal drafting, connectors are
sometimes not used, or are used much less than
might be expected. It is not uncommon, for
instance, for a sentence in a law to contain a list, or
series of elements that constitute a crime separated
by commas, but where no connector is used. In the
recently adopted Law on Infringements, for
example, the first part of a key provision on wildlife
trade (Article 6.6.2) reads:
Ан агнах, загас барих гэрээ, тусгай зөвшөөрөл, эрхийн бичгийг бусдад шилжүүлсэн … бол
Observing the non-use of connectors, it would be
translated like this:
There is nothing problematic with this sentence.
The context alone tells the reader that the transfer
of any of the listed items constitutes an
infringement by itself, whether the connector ‘and’
or ‘or’ is used. It is simply a typical phrase in a
Mongolian law where the connection has to be
assumed by the reader. A standard translation of
the same sentence into English automatically adds
at least one connector to the list.
Assuming connectors may be common practice, but
is something that cannot always be done safely
when it comes to the application or interpretation
of law. An example of this comes from a primary
clause used in criminal prosecutions in the prior
Criminal Code (Article 203), which applied criminal
penalties to various aspects of illegal hunting. A
portion of that article is quoted below. Each of the
elements of the crime in the article has been
bracketed for reference. For those unfamiliar with
criminal prosecution, each ‘element’ represents a
separately identifiable part of the crime that,
depending on how the list is structured, would
potentially need to be supported by evidence before
an accused may be found guilty. The elements are
in essence the building blocks of a case. Article
203.1 stated in relevant part:
203.1. [Causing damage] [in a large amount] [by
hunting or catching animals]) [without an
appropriate permission] [during prohibited time]
[at prohibited place] [with prohibited weapons,
Depending on how the sentence is deconstructed,
there are least seven separate conditions listed. It is
clear that a combination of factors is intended and,
for the most part, context is probably enough to
understand. It is probably not a requirement, for
example, that an individual be found 1) hunting
without a permit and 2) during a prohibited and 3)
at a prohibited place for a penalty to be applied.
Any one of these is probably an independent cause
of action. There is however, a question concerning
the first two elements and whether either one of
these may operate independently. In other words, is
hunting ‘in a large amount’ without a permit
actionable on its own without also having to prove
that it ‘caused damage’? Conversely, can guilt be
predicated on ‘causing damage’ by hunting without
a permit, or must both ‘causing damage’ and ‘in a
large amount’ be proven before guilt may be
established?
The problem caused by the lack of connectors is
something the new Criminal Code and Law on
Infringements have taken pains to correct. Several
provisions explicitly use the term ‘or’ (эсхүл) to
indicate the exclusivity of elements and the
penalties that may be applied. There remain,
however, instances where connectors combined
with complex sentence structures open the door to
ambiguities. Article 24.5.1 of the 2015 Criminal
Code, for example, contains a list of several
elements, which again have no connector. Without
suggesting that this provision in fact presents an
issue, the fact remains that the drafting style is still
used and should be carefully considered in
legislative development exercises. Where
ambiguities exist, the risk of inconsistent
interpretations or dismissal of cases remains.
Conclusion In conclusion, the prosecution of wildlife crime in
Mongolia over the last decade needs to continue
improving. In the field, enforcement personnel in
hunting areas lack operational capacity and
investigative powers; while customs officials may
give priority to the smuggling of taxable items such
as tobacco and alcohol; and Eco-crimes Division of
the Police mostly target mining crimes, which
implicate the government’s collection of mining
royalties. As a result, a relatively tiny number of
wildlife crimes were detected, which, due to a
myriad of problems (e.g., structural, procedural, and
logistical problems in evidence collection and
handling, the lack of expert capacity to care for
seized wildlife, inadequate forensic testing,
insufficient coordination between domestic and
foreign enforcement authorities), have all translated
into a small number of cases being brought to court
with the potential for many offenders to escape

140
justice. 387 Even where court sentences were firm,
prison sentences were usually appealed under the
Amnesty Law, and economic penalties were likely
not paid in full as suggested by the effective
damage payment ratios shown in Figure 19.
The end result is that illegal hunting and trade in
Mongolia are still today, unfortunately, a low risk
activity which is difficult to detect or result in either
financial or criminal penalties. While the most
recent legal reforms are increasing penalties and
explicitly criminalizing more wildlife related
activities, raising hopes of higher conviction rates,
continued reform is required.
387
Key Stakeholder Interview (UB Prosecutors Office)

CHAPTER V Wildlife Take
and Trade
142
Wildlife Take
Estimating Hunters and Fishers More than a decade ago, the combination of
relaxed controls on weapons, cheap ammunition,
and sparse enforcement helped fuel a wildlife
harvesting spree of unequaled proportions. In
2005, over 30% of men over the age 15 claimed to
participate in wildlife harvesting, almost all of
them as hunters and very few as fishers. The
results for 2015 show a similar number of
individuals engaged in hunting, but also a high
degree of reluctance to self-report. It also shows a
substantial increase in the number of fishers.
REPLICATING 2005 ESTIMATION
METHOD To obtain results comparable to the 2005 survey,
this reports replicates the same method for
estimating the number of hunters. In 2005, as no
women claimed to hunt or fish, the estimate first
selected only male respondents. Extrapolating
results obtained exclusively from males and
applying it to females would have distorted
estimates substantially. This reduced the original
sample from 4,021 to 2,995 individuals (74% of the
original sample) and was the base for calculating
the percentage of hunters from each class age. The
2005 estimate also excluded respondents below
the ages of 15 and above 65 (n=4), as they were age
classes with insufficient observations for analysis.
The percentages of hunters by age class were then
used to derive age class estimates. The results for
2015 using this method follow.
FISHERS To estimate the number of fishers, the survey
replicates the method used in 2005 and uses only
the results from the direct questioning in the
survey (6%) and is does not correct for assumed
under-reporting as is done with hunter estimates.
It uses the responses obtained in the direct
questioning to extrapolate the number of people
that fish and estimate total harvest volumes. For
fishers, the survey did not anticipate either the
increase in those participating in this activity, or
the reluctance to self-report. Results from the
direct questioning, however, demonstrate a
significant increase compared to 2005; while the
household survey indicated some level of
reluctance to report income generated from fishing
activity. None of those questioned, for example,
claimed to sell any of the fish they caught, even
though harvest levels for some were suggestive of
commercial fishing (e.g., 500 lenok per year). At
the same time, a significant number of households
claimed to purchase fish on the market. In
addition, some restaurants claimed to obtain fish
directly from fishers. In other words, both the
household and market surveys point to some level
of commercial activity associated with individual
fishers, none of whom self-reported this in the
direct questioning.
Table 1 provides the breakdown of this estimate by
age class, with a total estimate of 69,988
individuals.
For fishers, the survey did not anticipate either the
increase in those participating in this activity, or
the reluctance to self-report. Results from the
direct questioning, however, demonstrate a
significant increase compared to 2005; while the
household survey indicated some level of
reluctance to report income generated from fishing
activity. None of those questioned, for example,
claimed to sell any of the fish they caught, even
though harvest levels for some were suggestive of
commercial fishing (e.g., 500 lenok per year). At
the same time, a significant number of households
claimed to purchase fish on the market. In
addition, some restaurants claimed to obtain fish
directly from fishers. In other words, both the
household and market surveys point to some level
of commercial activity associated with individual
fishers, none of whom self-reported this in the
direct questioning.

143
Table 1. Fisher estimates by age class for 2015.
HUNTERS In 2015, the estimate of hunters is roughly the
same as it was in 2005 in absolute terms at almost
quarter of a million persons. To arrive at the
estimate and to allow for comparison with the
2005 results (i.e., with a principal focus on the
number of hunters), a two-pronged approach was
used. The first involved the use of direct survey
questioning and the replication of the 2005
extrapolation method. The second involved
indirect questioning (in the form of Unmatched
Count Technique questions) introduced to
compensate for the reluctance of respondents to
self-report hunting activities.
Table 2. Hunter estimates by age class for 2005 and
2015.
Under the first approach, female respondents (nf =
1,552) were excluded (although five did claim to
hunt or fish), reducing the sample from 4,070 to
2,518 individuals (62% of the original sample).
Males under 15 and over 65 (n15>m<65 = 204) were
similarly removed for a final sample of 2,314 (or
52% of the original sample). Age classes were then
stratified using the same 2005 divisions,
percentages for each class were calculated, and
age-classes derived. The national estimate sums
the age-class estimates, which in this case came to
43,038, or just 4% of the male population over 15
(see Table 2).
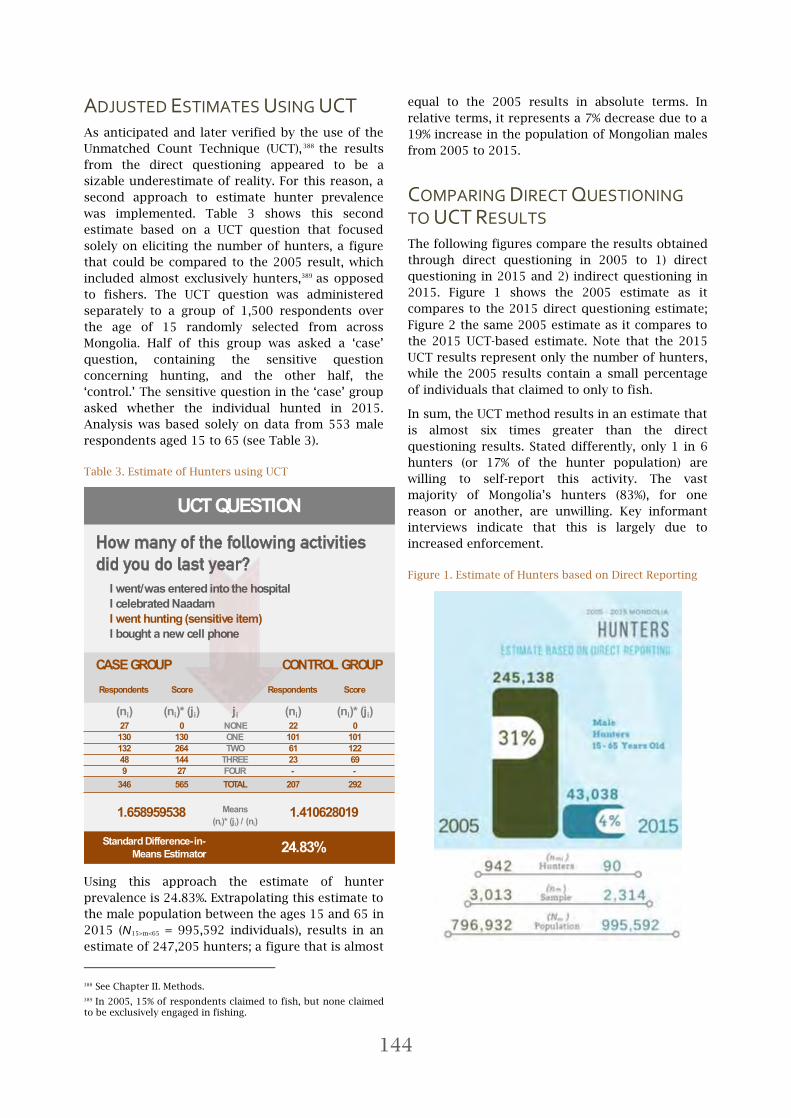
144
ADJUSTED ESTIMATES USING UCT As anticipated and later verified by the use of the
Unmatched Count Technique (UCT), 388 the results
from the direct questioning appeared to be a
sizable underestimate of reality. For this reason, a
second approach to estimate hunter prevalence
was implemented. Table 3 shows this second
estimate based on a UCT question that focused
solely on eliciting the number of hunters, a figure
that could be compared to the 2005 result, which
included almost exclusively hunters,389 as opposed
to fishers. The UCT question was administered
separately to a group of 1,500 respondents over
the age of 15 randomly selected from across
Mongolia. Half of this group was asked a ‘case’
question, containing the sensitive question
concerning hunting, and the other half, the
‘control.’ The sensitive question in the ‘case’ group
asked whether the individual hunted in 2015.
Analysis was based solely on data from 553 male
respondents aged 15 to 65 (see Table 3).
Table 3. Estimate of Hunters using UCT
Using this approach the estimate of hunter
prevalence is 24.83%. Extrapolating this estimate to
the male population between the ages 15 and 65 in
2015 (N15>m<65 = 995,592 individuals), results in an
estimate of 247,205 hunters; a figure that is almost
388 See Chapter II. Methods.
389 In 2005, 15% of respondents claimed to fish, but none claimed to be exclusively engaged in fishing.
equal to the 2005 results in absolute terms. In
relative terms, it represents a 7% decrease due to a
19% increase in the population of Mongolian males
from 2005 to 2015.
COMPARING DIRECT QUESTIONING
TO UCT RESULTS The following figures compare the results obtained
through direct questioning in 2005 to 1) direct
questioning in 2015 and 2) indirect questioning in
2015. Figure 1 shows the 2005 estimate as it
compares to the 2015 direct questioning estimate;
Figure 2 the same 2005 estimate as it compares to
the 2015 UCT-based estimate. Note that the 2015
UCT results represent only the number of hunters,
while the 2005 results contain a small percentage
of individuals that claimed to only to fish.
In sum, the UCT method results in an estimate that
is almost six times greater than the direct
questioning results. Stated differently, only 1 in 6
hunters (or 17% of the hunter population) are
willing to self-report this activity. The vast
majority of Mongolia’s hunters (83%), for one
reason or another, are unwilling. Key informant
interviews indicate that this is largely due to
increased enforcement.
Figure 1. Estimate of Hunters based on Direct Reporting
I went/was entered into the hospital I celebrated Naadam I went hunting (sensitive item) I bought a new cell phone
Respondents Score Respondents Score
(ni) (ni)* (ji) ji (ni) (ni)* (ji)27 0 NONE 22 0130 130 ONE 101 101132 264 TWO 61 12248 144 THREE 23 699 27 FOUR - -
346 565 TOTAL 207 292
Means(ni)* (ji) / (ni)
1.410628019
Standard Difference-in-Means Estimator 24.83%
UCT QUESTION
CASE GROUP CONTROL GROUP
1.658959538

145
Figure 2. Estimate of Hunters based on Indirect Reporting
For purposes of extrapolating related results, the
report uses the 2015 UCT estimate of 247,504.
However, this too, as high as it is, may be an
underestimate for two reasons.
The first reason is the degree to which the
sensitive question is obvious to the respondent.
The UCT is a recognized technique for eliciting a
higher percentage of truthful answers to sensitive
questions. However, depending on how it is
administered, it may still result in either under or
over estimations. One factor that may result in
underestimates is the degree to which the sensitive
question stands out; in other words how obvious is
the sensitive question to the respondent. As
designed in this survey, the only question in the
list that is sensitive is about hunting. Given the
enforcement environment and the extreme
reluctance documented by surveyors and the
Household survey results, it is plausible that an
unknown percentage of respondents were still
reluctant to answer the question truthfully. As a
result, some bias may have been introduced
because of the obviousness of the question.
The second reason is due to the way the question
was phrased. As stated, it is intended only to refer
to hunting activities, not fishing. The survey
revealed that an important portion of wildlife
harvesting is by fishers and that there is some
reluctance to self-report as well. As previously
noted, other elements of the Household and
Markets surveys point to some level of commercial
fishing activity by individuals, and yet none of the
respondents claimed to sell any of the fish they
caught. It is likely that if the question had included
hunting and fishing last year, the percentage would
have increased.
Limitations of the UCT Questions
As structured in this survey, the UCT question was
limited in its application solely to estimating the
number of people actively hunting. Any further
results, for example, the estimate of the percentage
of individuals that target a particular species, are
drawn solely from the direct questioning; e.g., the
estimated 19% of hunters that target marmots
comes from the responses of the 90 hunters that
were willing to respond in the Household Survey.
As explained in detail in the following section, this
19% is applied to the corrected estimate of the
total number of hunters to arrive at an estimate of
46,969 hunters targeting marmots nationwide.
That they take on average seven (7) Siberian
marmots is similarly derived from the responses to
the direct questions.
Whether there is an impact or not, however, the
results are still useful as they represent at least
minimum values. In other words, if reluctance had
an impact, it means that the numbers presented in
this report are underestimates. There are also
several areas where absolute numbers are less
important, e.g., whether a particular species is in
fact targeted, whether it is harvested in a particular
season, etc. Wherever appropriate, the base results
are used to advance the understanding of legal and
illegal wildlife harvests.
To compensate for the impacts of anticipated
respondent reluctance, the survey design included
from the beginning numerous additional
quantitative and qualitative methods in the form of
key informant interviews, stakeholder interviews,
observation sheets, follow-up calls, surveyor
debriefings, as well as wildlife trade related data
from management and enforcement agencies. The
combined weight of that information indicates that
there are indeed more hunters active than those
admitting to it in direct questioning, and possibly
in the context of the UCT.
Variety of Species Targeted Based solely on the responses to the Household
Survey, 24 different species were reported as being
harvested in 2015. Of these, 10 are mammals, 3
birds, and 11 fish. Not only the absolute number,
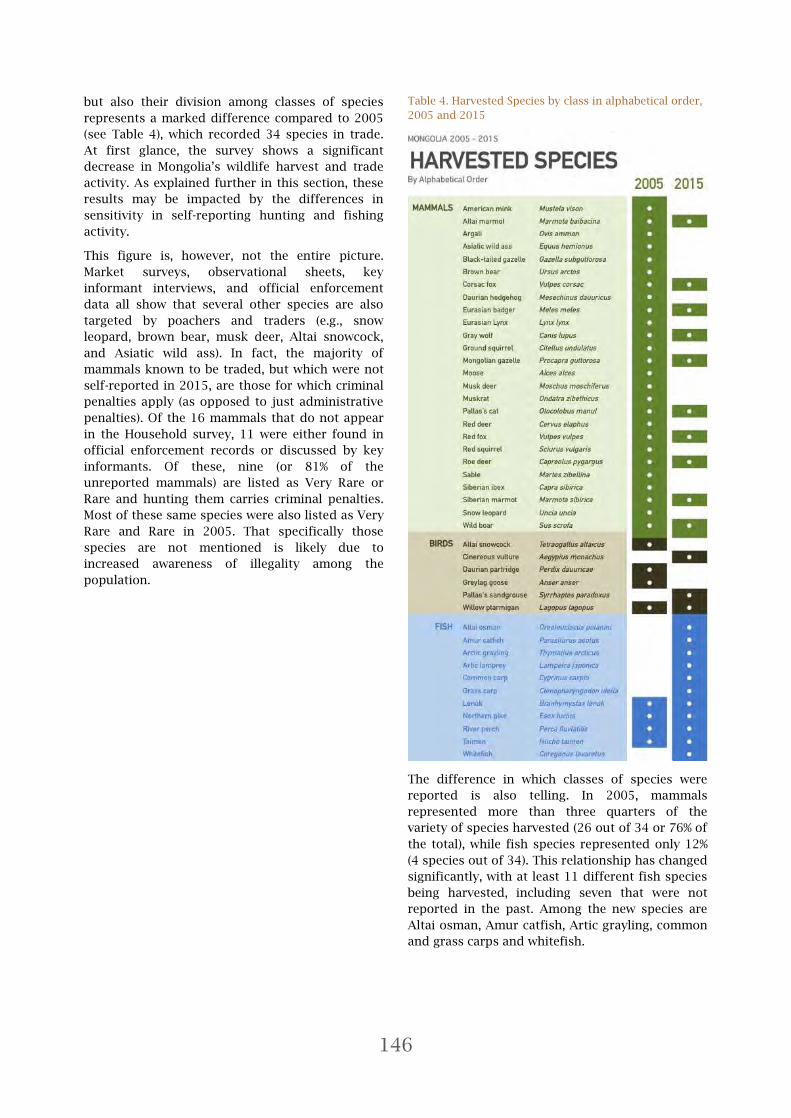
146
but also their division among classes of species
represents a marked difference compared to 2005
(see Table 4), which recorded 34 species in trade.
At first glance, the survey shows a significant
decrease in Mongolia’s wildlife harvest and trade
activity. As explained further in this section, these
results may be impacted by the differences in
sensitivity in self-reporting hunting and fishing
activity.
This figure is, however, not the entire picture.
Market surveys, observational sheets, key
informant interviews, and official enforcement
data all show that several other species are also
targeted by poachers and traders (e.g., snow
leopard, brown bear, musk deer, Altai snowcock,
and Asiatic wild ass). In fact, the majority of
mammals known to be traded, but which were not
self-reported in 2015, are those for which criminal
penalties apply (as opposed to just administrative
penalties). Of the 16 mammals that do not appear
in the Household survey, 11 were either found in
official enforcement records or discussed by key
informants. Of these, nine (or 81% of the
unreported mammals) are listed as Very Rare or
Rare and hunting them carries criminal penalties.
Most of these same species were also listed as Very
Rare and Rare in 2005. That specifically those
species are not mentioned is likely due to
increased awareness of illegality among the
population.
Table 4. Harvested Species by class in alphabetical order,
2005 and 2015
The difference in which classes of species were
reported is also telling. In 2005, mammals
represented more than three quarters of the
variety of species harvested (26 out of 34 or 76% of
the total), while fish species represented only 12%
(4 species out of 34). This relationship has changed
significantly, with at least 11 different fish species
being harvested, including seven that were not
reported in the past. Among the new species are
Altai osman, Amur catfish, Artic grayling, common
and grass carps and whitefish.
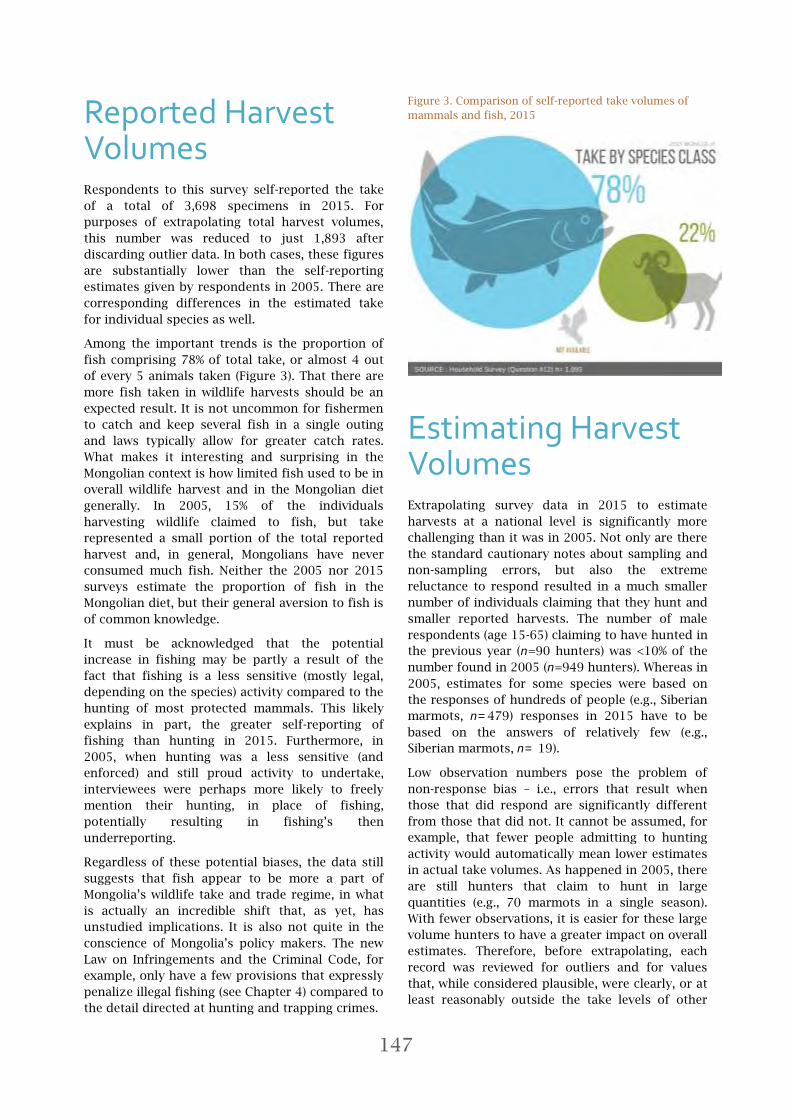
147
Reported Harvest Volumes Respondents to this survey self-reported the take
of a total of 3,698 specimens in 2015. For
purposes of extrapolating total harvest volumes,
this number was reduced to just 1,893 after
discarding outlier data. In both cases, these figures
are substantially lower than the self-reporting
estimates given by respondents in 2005. There are
corresponding differences in the estimated take
for individual species as well.
Among the important trends is the proportion of
fish comprising 78% of total take, or almost 4 out
of every 5 animals taken (Figure 3). That there are
more fish taken in wildlife harvests should be an
expected result. It is not uncommon for fishermen
to catch and keep several fish in a single outing
and laws typically allow for greater catch rates.
What makes it interesting and surprising in the
Mongolian context is how limited fish used to be in
overall wildlife harvest and in the Mongolian diet
generally. In 2005, 15% of the individuals
harvesting wildlife claimed to fish, but take
represented a small portion of the total reported
harvest and, in general, Mongolians have never
consumed much fish. Neither the 2005 nor 2015
surveys estimate the proportion of fish in the
Mongolian diet, but their general aversion to fish is
of common knowledge.
It must be acknowledged that the potential
increase in fishing may be partly a result of the
fact that fishing is a less sensitive (mostly legal,
depending on the species) activity compared to the
hunting of most protected mammals. This likely
explains in part, the greater self-reporting of
fishing than hunting in 2015. Furthermore, in
2005, when hunting was a less sensitive (and
enforced) and still proud activity to undertake,
interviewees were perhaps more likely to freely
mention their hunting, in place of fishing,
potentially resulting in fishing’s then
underreporting.
Regardless of these potential biases, the data still
suggests that fish appear to be more a part of
Mongolia’s wildlife take and trade regime, in what
is actually an incredible shift that, as yet, has
unstudied implications. It is also not quite in the
conscience of Mongolia’s policy makers. The new
Law on Infringements and the Criminal Code, for
example, only have a few provisions that expressly
penalize illegal fishing (see Chapter 4) compared to
the detail directed at hunting and trapping crimes.
Figure 3. Comparison of self-reported take volumes of
mammals and fish, 2015
Estimating Harvest Volumes Extrapolating survey data in 2015 to estimate
harvests at a national level is significantly more
challenging than it was in 2005. Not only are there
the standard cautionary notes about sampling and
non-sampling errors, but also the extreme
reluctance to respond resulted in a much smaller
number of individuals claiming that they hunt and
smaller reported harvests. The number of male
respondents (age 15-65) claiming to have hunted in
the previous year (n=90 hunters) was <10% of the
number found in 2005 (n=949 hunters). Whereas in
2005, estimates for some species were based on
the responses of hundreds of people (e.g., Siberian
marmots, n=479) responses in 2015 have to be
based on the answers of relatively few (e.g.,
Siberian marmots, n= 19).
Low observation numbers pose the problem of
non-response bias – i.e., errors that result when
those that did respond are significantly different
from those that did not. It cannot be assumed, for
example, that fewer people admitting to hunting
activity would automatically mean lower estimates
in actual take volumes. As happened in 2005, there
are still hunters that claim to hunt in large
quantities (e.g., 70 marmots in a single season).
With fewer observations, it is easier for these large
volume hunters to have a greater impact on overall
estimates. Therefore, before extrapolating, each
record was reviewed for outliers and for values
that, while considered plausible, were clearly, or at
least reasonably outside the take levels of other
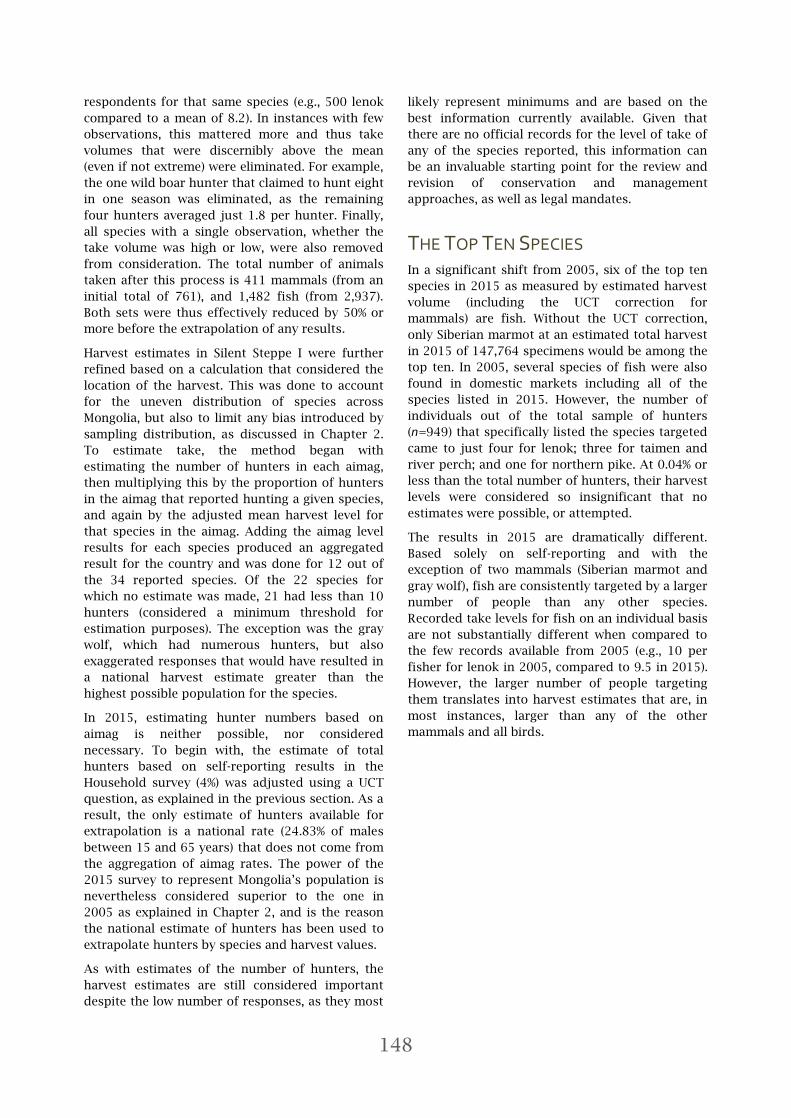
148
respondents for that same species (e.g., 500 lenok
compared to a mean of 8.2). In instances with few
observations, this mattered more and thus take
volumes that were discernibly above the mean
(even if not extreme) were eliminated. For example,
the one wild boar hunter that claimed to hunt eight
in one season was eliminated, as the remaining
four hunters averaged just 1.8 per hunter. Finally,
all species with a single observation, whether the
take volume was high or low, were also removed
from consideration. The total number of animals
taken after this process is 411 mammals (from an
initial total of 761), and 1,482 fish (from 2,937).
Both sets were thus effectively reduced by 50% or
more before the extrapolation of any results.
Harvest estimates in Silent Steppe I were further
refined based on a calculation that considered the
location of the harvest. This was done to account
for the uneven distribution of species across
Mongolia, but also to limit any bias introduced by
sampling distribution, as discussed in Chapter 2.
To estimate take, the method began with
estimating the number of hunters in each aimag,
then multiplying this by the proportion of hunters
in the aimag that reported hunting a given species,
and again by the adjusted mean harvest level for
that species in the aimag. Adding the aimag level
results for each species produced an aggregated
result for the country and was done for 12 out of
the 34 reported species. Of the 22 species for
which no estimate was made, 21 had less than 10
hunters (considered a minimum threshold for
estimation purposes). The exception was the gray
wolf, which had numerous hunters, but also
exaggerated responses that would have resulted in
a national harvest estimate greater than the
highest possible population for the species.
In 2015, estimating hunter numbers based on
aimag is neither possible, nor considered
necessary. To begin with, the estimate of total
hunters based on self-reporting results in the
Household survey (4%) was adjusted using a UCT
question, as explained in the previous section. As a
result, the only estimate of hunters available for
extrapolation is a national rate (24.83% of males
between 15 and 65 years) that does not come from
the aggregation of aimag rates. The power of the
2015 survey to represent Mongolia’s population is
nevertheless considered superior to the one in
2005 as explained in Chapter 2, and is the reason
the national estimate of hunters has been used to
extrapolate hunters by species and harvest values.
As with estimates of the number of hunters, the
harvest estimates are still considered important
despite the low number of responses, as they most
likely represent minimums and are based on the
best information currently available. Given that
there are no official records for the level of take of
any of the species reported, this information can
be an invaluable starting point for the review and
revision of conservation and management
approaches, as well as legal mandates.
THE TOP TEN SPECIES In a significant shift from 2005, six of the top ten
species in 2015 as measured by estimated harvest
volume (including the UCT correction for
mammals) are fish. Without the UCT correction,
only Siberian marmot at an estimated total harvest
in 2015 of 147,764 specimens would be among the
top ten. In 2005, several species of fish were also
found in domestic markets including all of the
species listed in 2015. However, the number of
individuals out of the total sample of hunters
(n=949) that specifically listed the species targeted
came to just four for lenok; three for taimen and
river perch; and one for northern pike. At 0.04% or
less than the total number of hunters, their harvest
levels were considered so insignificant that no
estimates were possible, or attempted.
The results in 2015 are dramatically different.
Based solely on self-reporting and with the
exception of two mammals (Siberian marmot and
gray wolf), fish are consistently targeted by a larger
number of people than any other species.
Recorded take levels for fish on an individual basis
are not substantially different when compared to
the few records available from 2005 (e.g., 10 per
fisher for lenok in 2005, compared to 9.5 in 2015).
However, the larger number of people targeting
them translates into harvest estimates that are, in
most instances, larger than any of the other
mammals and all birds.
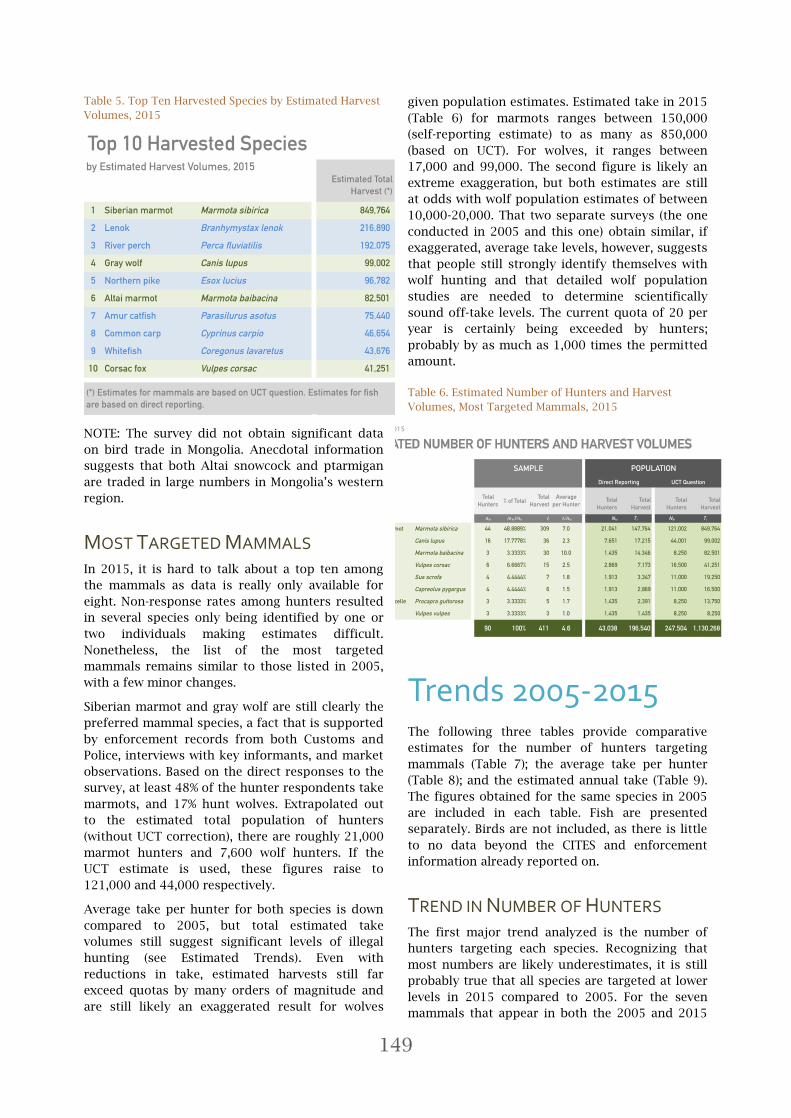
149
Table 5. Top Ten Harvested Species by Estimated Harvest
Volumes, 2015
NOTE: The survey did not obtain significant data
on bird trade in Mongolia. Anecdotal information
suggests that both Altai snowcock and ptarmigan
are traded in large numbers in Mongolia’s western
region.
MOST TARGETED MAMMALS In 2015, it is hard to talk about a top ten among
the mammals as data is really only available for
eight. Non-response rates among hunters resulted
in several species only being identified by one or
two individuals making estimates difficult.
Nonetheless, the list of the most targeted
mammals remains similar to those listed in 2005,
with a few minor changes.
Siberian marmot and gray wolf are still clearly the
preferred mammal species, a fact that is supported
by enforcement records from both Customs and
Police, interviews with key informants, and market
observations. Based on the direct responses to the
survey, at least 48% of the hunter respondents take
marmots, and 17% hunt wolves. Extrapolated out
to the estimated total population of hunters
(without UCT correction), there are roughly 21,000
marmot hunters and 7,600 wolf hunters. If the
UCT estimate is used, these figures raise to
121,000 and 44,000 respectively.
Average take per hunter for both species is down
compared to 2005, but total estimated take
volumes still suggest significant levels of illegal
hunting (see Estimated Trends). Even with
reductions in take, estimated harvests still far
exceed quotas by many orders of magnitude and
are still likely an exaggerated result for wolves
given population estimates. Estimated take in 2015
(Table 6) for marmots ranges between 150,000
(self-reporting estimate) to as many as 850,000
(based on UCT). For wolves, it ranges between
17,000 and 99,000. The second figure is likely an
extreme exaggeration, but both estimates are still
at odds with wolf population estimates of between
10,000-20,000. That two separate surveys (the one
conducted in 2005 and this one) obtain similar, if
exaggerated, average take levels, however, suggests
that people still strongly identify themselves with
wolf hunting and that detailed wolf population
studies are needed to determine scientifically
sound off-take levels. The current quota of 20 per
year is certainly being exceeded by hunters;
probably by as much as 1,000 times the permitted
amount.
Table 6. Estimated Number of Hunters and Harvest
Volumes, Most Targeted Mammals, 2015
Trends 2005-2015 The following three tables provide comparative
estimates for the number of hunters targeting
mammals (Table 7); the average take per hunter
(Table 8); and the estimated annual take (Table 9).
The figures obtained for the same species in 2005
are included in each table. Fish are presented
separately. Birds are not included, as there is little
to no data beyond the CITES and enforcement
information already reported on.
TREND IN NUMBER OF HUNTERS The first major trend analyzed is the number of
hunters targeting each species. Recognizing that
most numbers are likely underestimates, it is still
probably true that all species are targeted at lower
levels in 2015 compared to 2005. For the seven
mammals that appear in both the 2005 and 2015

150
survey results, the estimated number of hunters is
down between 13% and 87%. For three species
among the top ten in 2005 (red deer, red squirrel,
and Eurasian lynx), there is no hunting activity
reported in 2015.
Table 7. Estimated trend in number of hunters, 2005 to
2015
TREND IN AVERAGE TAKE The second notable trend is related to the average
take per hunter. After removing outliers, numbers
appear to be down for all mammals roughly 70%-
80%. In the case of Siberian marmots, the
estimated drop in average take by hunter is 70%;
estimated at just 10 in 2015 compared to 24 in
2005. Average take for Altai marmot is down 79%;
Mongolian gazelle, 74%; red fox, 79%; corsac fox,
75%. Although not listed in the table, a similar
drop is true for wolves (32%) going from an
estimated 3.4 in 2005 to 2.3 in 2015.
There is an underlying suspicion that all of these
values are as affected by the general reluctance to
self-report as is the number of people that admit
hunting in the first place. They may in fact be
significantly higher, as the outliers removed were
in some instances only marginally above the mean
even though they were consistent with reports
from other respondents in the survey. All take of
marmots, for example, above thirty were removed
despite there being several that reported taking 40
and 50 animals each. In other words, some of the
higher reported take volumes may in fact have
been part of the normal pattern, but have not been
included for purposes of estimating average take.
Table 8. Estimated trend in average take per hunter, 2005
to 2015
TREND IN TOTAL TAKE Even with these substantially lower numbers
compared to 2005, estimates of the total take still
exceed anything permitted by Mongolia’s hunting
and trade laws. Marmot is the most extreme
example. As there was no quota for Siberian
marmots in 2015, whether using the direct
reporting estimate of 150,000 or the UCT corrected
estimate of 800,000+, all harvest is illegal. The
same is true for roe deer whose 2015 quota was
just 10 animals for the entire country. Estimated
take is in the thousands. Total wolf take in 2005
could not be estimated and this may be the case in
2015, but there is still a difference in the numbers
obtained. According to the UCT corrected
numbers, wolf hunters are down 41% (est. 44,000)
from 2005 (est. 75,000), but may be down as much
as 90% (est. 7,600) based on direct reporting. Using
the direct reporting estimate and the average take
of 2.3, the number of wolves that may have been
hunted in 2015 is almost 2,000 times more than
the national quota of 20 for the same year. There is
in fact, no species that is not being hunted, and in
many instances traded, in volumes that still exceed
permissible levels and likely represent continuing
threats to their survival.

151
Table 9. Estimated trend in annual take, 2005 to 2015

152
Table 10. Estimated Number of fishers by species, 2015
Table 11. Estimated Harvest Volumes for fish, 2015

153
Harvest Seasons Harvest activity is spread across the year, although
summer and fall are the two most active seasons,
with 17 and 20 species targeted respectively.
Winter is the next most active season with 14
species; followed by the spring with 12 species
targeted. Take volumes drop substantially in
spring, but in all seasons there is a percentage of
hunters and fishermen declaring to be engaged in
some level of wildlife take.
Figure 4. 2015 Harvest seasons for reported species
When compared to the open and closed seasons as
established in the Law on Fauna, even without
knowing total numbers of hunters or levels of take,
it is clear that poaching is essentially constant for
most targeted species. Out of season hunting
impacts, for example, roe deer (permitted only in
fall, but hunted all four seasons); corsac fox
(permitted in two seasons-late fall through the
winter, with some claiming to hunt all year despite
it being known that fur quality is poor out of
season); Siberian and Altai marmot (permitted late
summer through the fall, but reported year round,
including during the Altai marmot’s winter
hibernation); Taimen (permitted summer and fall,
taken in all four seasons). For further reference to
open and closed seasons for all species in the Law
on Fauna see Chapter 4.
A normal part of hunting is the oscillation of
harvest volumes, as reported in Mongolia. As
expected, fall is the peak season for mammals and
birds, while summer is the peak for fish. Relative
to other seasons, harvest numbers in the spring
are almost insignificant.
Figure 5. Take volume by season, 2015
Old Times, New Times The respect that Mongolians have for the
environment is an oft-repeated theme. They are
taught from the earliest ages about the spirits that
protect the trees, the rivers, lakes and mountains;
and about the respect that must be shown to keep
bad luck from following. No wonder the stories
told by elders about the hunting traditions they
grew up with sound like a magical tale.
Remembering their hunting teachers with
devotion, elders in this survey shared stories of
their childhood hunting trips, as early as 9 years
old. Early mornings, silent days; long cold hours of
waiting; and finally the prayers after each animal

154
was harvested are common memories. They
recalled the teachings from their masters while
horse and camel riding, of weather patterns, and
the use of guns and traps. Their masters taught
them to identify the oldest and the weakest within
a group to minimize hunting impacts. For some
species, they learned also to distinguish males
from females at a distance, avoiding in this way
harming population growth rates by targeting
males only. Hunting in the past, as told through
the stories of elders, was a hard, physical activity
requiring substantial skill and personal
commitment to nature.
It is this past experience that causes many of them
to express dismay at today’s hunting methods.
Horses, they say, have been widely substituted by
motorbikes and cars as a primary means of
hunting, and with them, the arrival of a new era of
effortless and ‘skill-less’ hunting. They lament that
it is no longer about the hunt, but about the kill
and the money that can be made. It is also a more
elitist era, where hunters lacking vehicles and the
budgets necessary for gas are at a clear
disadvantage as wildlife populations dwindle in
many areas. Elders see today’s younger generations
of hunters as mostly disconnected from nature,
uncommitted to sustainability, and having a
frivolous attitude toward wildlife.
Illegal Hunting Methods Taking Over Indeed, this survey documents a disturbing trend
in the use of illegal and highly destructive hunting
methods that not many years ago were rare or even
unheard of. Among them are intentional vehicle-
wildlife collisions and the use of cars to run
animals to exhaustion. The wide-open and
relatively flat ground in Mongolia’s vast steppe and
desert regions make both methods possible. The
first is what it sounds like, and does not
necessarily occur on established roads. Instead,
animals are chased across the ground wherever
they happen to be and if the ground permits; on or
off road. After being hit, animals on the ground are
finished off with axes or knives. This method was
repeatedly reported for hunting Mongolian gazelle
using motorbikes. Chasing animals until
exhaustion is a practice for hunting faster species
such as antelope, black-tailed gazelle, red fox,
corsac fox, and gray wolf. After long-term pursuits,
the animal eventually collapses from exhaustion
and the hunter requires little effort to collect the
collapsed individual.
Figure 6. Images of gazelle reportedly killed by deliberate
collision with vehicles
Intentional collisions were identified as an
emerging practice for Saiga antelope hunting in
Silent Steppe I. Ten years later, multiple key
informants refer to the method in this survey.
Illegal vehicle-based methods are now so
widespread in Mongolia that many admit that they
may have become one of the top hunting methods.
One GASI Inspector390 in Dornod aimag estimates
that at least 70% of all hunting may be based on
motorbikes or cars chasing and deliberately
colliding with animals; and that actually shooting
animals may represent less than 20% of the
hunting.
Night lighting is another illegal technique
mentioned by informants. This particular illegal
method was pre-identified during the survey
development phase as a candidate for the UCT
survey to help develop a quantitative estimate of at
least one banned hunting method. Results from
the UCT suggest that over 8% of hunters use night
390 Key Informant Interview #6.7 (Dornod-GASI Inspector).

155
lighting. This extrapolates to 10,790 hunters at the
national level.
The degree to which firearms are still a prevalent
factor in hunting, however, is difficult to
confidently assess. Only 58% of the hunters
claimed to have a firearm. This is a dramatic
change from 2005, where almost all hunters (96%)
claimed to own a firearm. This level of change can
be partially explained by increased seizures, but
seems unlikely to explain it all. Seizures in
Mongolia tend not to be permanent, with the same
confiscated items finding their way back to the
offenders or into the hands of others. Restrictions
on gun permits, and difficulties with the legal
purchase of ammunition at the local level are more
likely factors pushing the transition in take
methods, at least partially explaining why motor
vehicles may be overtaking firearms as a
widespread hunting method.
More likely related to the transition from firearms
is the distinct increase in the ownership of traps.
In 2005, the reported rate of trap ownership
among those harvesting wildlife was 8%. In 2015,
this percentage had increased to 21%.
Corroborating this result is the increase in the
import of traps identified by a Mongolian Customs
official. This individual was so concerned about
this trend that it was suggested that regulations
should be drafted. This opinion is not consistent
with other informants who commented on the
decline of trapping activities, particularly with
respect to marmot and wolf hunting.
Figure 7. Sample of the guns encountered by the field
team during Household and Market Surveys.
Figure 8 shows images of what appear to be leg
hold traps confiscated in Khovd aimag. No
information was provided concerning the wildlife
targeted by the individual. In general, this type of
trap is used on fur bearing animals and placed on
paths where such animals are expected to pass.
The trap is designed to restrain the animal by the
leg without damaging the fur for later use or sale.
In Mongolia, known targeted furbearers include red
fox, corsac fox, lynx, snow leopard, and wolves.
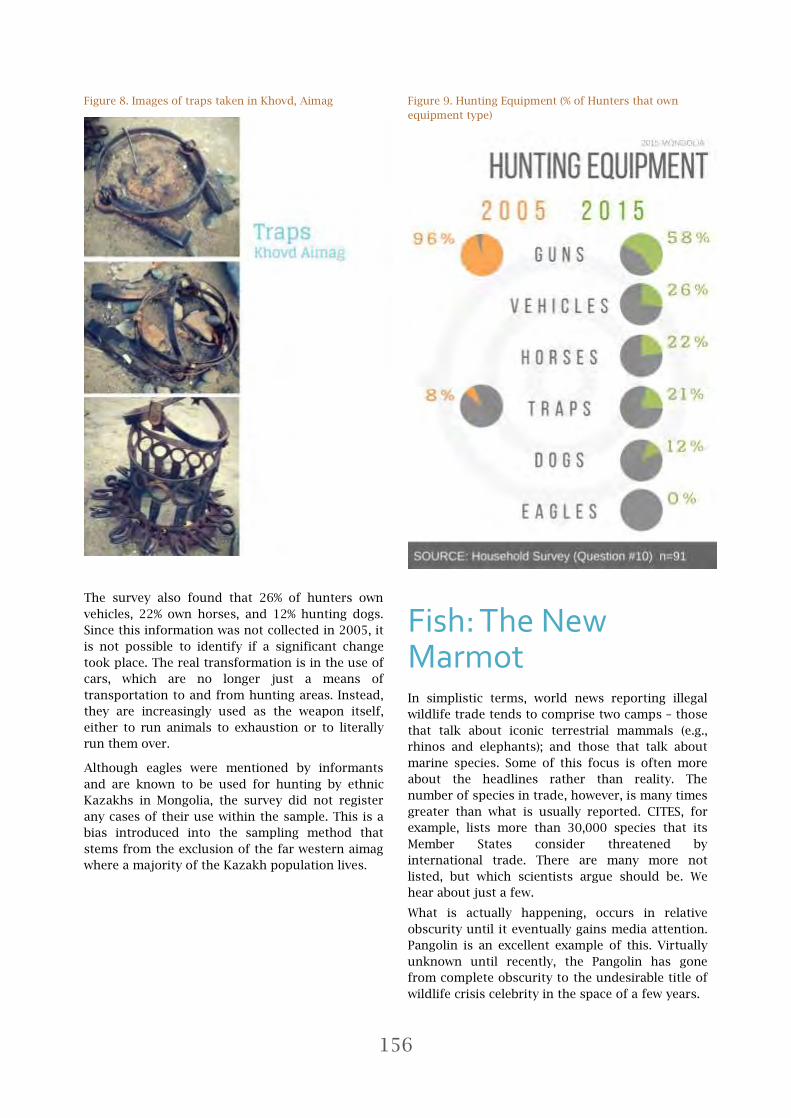
156
Figure 8. Images of traps taken in Khovd, Aimag
The survey also found that 26% of hunters own
vehicles, 22% own horses, and 12% hunting dogs.
Since this information was not collected in 2005, it
is not possible to identify if a significant change
took place. The real transformation is in the use of
cars, which are no longer just a means of
transportation to and from hunting areas. Instead,
they are increasingly used as the weapon itself,
either to run animals to exhaustion or to literally
run them over.
Although eagles were mentioned by informants
and are known to be used for hunting by ethnic
Kazakhs in Mongolia, the survey did not register
any cases of their use within the sample. This is a
bias introduced into the sampling method that
stems from the exclusion of the far western aimag
where a majority of the Kazakh population lives.
Figure 9. Hunting Equipment (% of Hunters that own
equipment type)
Fish: The New Marmot In simplistic terms, world news reporting illegal
wildlife trade tends to comprise two camps – those
that talk about iconic terrestrial mammals (e.g.,
rhinos and elephants); and those that talk about
marine species. Some of this focus is often more
about the headlines rather than reality. The
number of species in trade, however, is many times
greater than what is usually reported. CITES, for
example, lists more than 30,000 species that its
Member States consider threatened by
international trade. There are many more not
listed, but which scientists argue should be. We
hear about just a few.
What is actually happening, occurs in relative
obscurity until it eventually gains media attention.
Pangolin is an excellent example of this. Virtually
unknown until recently, the Pangolin has gone
from complete obscurity to the undesirable title of
wildlife crisis celebrity in the space of a few years.

157
Marmot is Mongolia’s first version of the Pangolin,
albeit on a much smaller scale and still only of
concern to national news outlets. Similar to
Pangolin, marmots can occur in large numbers and
while known to some, they are typically not
thought of when discussing hunting. Although
overhunting may have been mentioned by few
people in the mid-90s, the issue was otherwise
rarely discussed – until it was considered a crisis
and frequented Mongolia’s headlines. Now, they
are the subject of significant regulatory and
enforcement attention in the form of stricter
quotas, complete and partial bans, with some
visible enforcement results.
Fish may be ‘the new marmot.’ With the potential
exception of the Taimen, it would be fair to say
that Mongolia’s fish draw little attention. They are,
however, a major part of the new wildlife story in
Mongolia, a critical part of its biodiversity heritage,
and an increasingly important part of local diets.
As widely documented in this survey and report,
fish are being taken and traded in increasing
numbers, and at levels never before seen –
including Rare species like the Taimen. Many more
people now claim to fish, with volumes of take
approaching those of species like the marmot a
decade ago. The question is, how long it will take
for fish to gain the attention required to prevent
another wildlife crisis.
‘We Fish Like Thieves…’ Currently, fishing in Mongolia is occurring in
relative obscurity. Granted, there are a few studies
on fish, but as a whole, little is known about the
overall resource and the levels of take that may or
may not be sustainable. 391 Furthermore, little is
known about the degree of illegal fishing currently
occurring. The wildlife enforcement and
prosecution efforts discussed in Chapter 4 indicate
that almost all criminal cases brought to court
involve mammals.
What this survey found is that violations are
widespread or as one fisher put it ‘we fish like
thieves.’ Interviewees complain that because
obtaining a permit is difficult, if not impossible,
they essentially have little option but to fish
illegally. If information obtained from restaurant,
retail shop, and outdoor market surveys are any
391 A. Dulmaa. 1999. Fish and Fisheries in Mongolia. in Fish and Fisheries at Higher Altitudes: Asia. FAO Fisheries Technical Paper No. 385. by T. Petr Toowoomba, Queensland 4350 Australia.
indication, a lack of permits is not a yet a serious
impediment to fishing activities.
Fishing uses modern techniques and equipment
and is no longer a low-yield recreational activity.
Figure 10 presents the results of the survey,
showing the overwhelming ownership of rods
(74%) over hand made equipment (15%), and
artisanal nets (13%).

158
Figure 10. Fishing Equipment (% of Fishers owning
equipment type)
Visits to shops in UB supplying a variety of top
brands and world-class imported fishing
equipment and supplies, provide some
observational evidence consistent with the survey’s
results. The fishing value chain today includes
commercial supply partners that could play a role
in management schemes of fishing resources,
something that did not exist in the past.
Among the 74% of fisherman who own fishing
rods, it was common to find persons possessing
more than one (27% of the total who fish). On
average, fishermen own 1.6 rods each. These
overall results are in alignment with statements by
informants, which suggest that methods like
dynamite-fishing may have fallen out of practice
over the past 7-8 years (although this is
questionable), and that only illegal fishermen and
those dedicated to commercial fishing are using
nets as the standard fishing method. Household
fishing is primarily conducted with rods. Not
surprisingly, car ownership among fishermen is
substantially lower - three times lower – when
compared to hunters.
Hunter and Fisher Profiles Non-response bias is of greater concern when
trying to describe hunter and fisher profiles than it
is for estimating hunter numbers. The fact that a
large percentage did not admit to hunting in the
direct questioning only results in lower estimates
of the number of hunters. With respect to
reporting on the profile of these individuals,
however, the low response rate has greater
implications. To obtain results with a confidence
interval of 95% and a margin of error of 5%, the
sample size required for a population of 247,504
(the number of hunters estimated by the UCT
survey) would be 384. In 2005, the survey exceeded
this sample size by almost 300%. In 2015, the

159
sample of 195 hunters and fishers falls short and
leaves a margin of error of 7.02%, or just over 2%
more than the accepted standard for statistical
analyses.
In simpler terms, the issue is that the profile of
those that responded could be different from
those that did not. Estimates based only on those
that responded could therefore miss important
elements of the actual profile associated with
hunters and fishers. Results are nonetheless
presented as they highlight potential changes in
profiles that fit with the overall pattern of less
hunting and more fishing.
First of all, looking only at the direct responses
(ignoring for a moment the UCT survey) the results
show that 32% of the sample (of n=195) exclusively
hunt; 13% hunt and fish; and 55% only fish. As
stated previously, extrapolating this out to the
entire population gives an estimate of 43,038
hunters and 69,988 fishers. The UCT results
already demonstrate that the number of hunters is
likely significantly more at over 247,504. However,
the more important part of this result may be that,
despite underreporting, it confirms that a
significant portion of those engaged in wildlife
harvesting are fishers, and not hunters. The
number of fishers in 2005 was considered so
small, it could not be fairly estimated. Again, the
implications of this shift have not been adequately
studied.
Another result that seems to reaffirm the general
shift from hunting to fishing comes from the
average years of experience. According to the
survey, those that hunt have more years of
experience (on average 12 years) compared to
those that fish (8 years) (Figure 11). More telling is
the percentage in each group of those with less
than 5 years of experience, representing the
newcomers to the activity. For hunters, this figure
is 38% of the group; for fishers, it is 68%. In other
words, both in relative and absolute terms many
more people have entered the world of wildlife
take and trade as fishers in recent years than as
hunters. In 2005, hunter age quartiles showed 44%
of all hunters were between the ages of 15 and 28.
In 2015, those aged 15 to 30 are only 30% of the
total. Reflecting the shift in average years of
experience, the bulk of the hunting population
(41%) is now older and between the ages of 31 and
50.
Figure 11. Experience of hunters and fishermen, 2015
Consistent with key informant interviews and
market surveys, the hunter profile statistics also
indicate that a large percentage of the hunting and
fishing population is based in UB (41%) compared
to the remainder of the country (59%) (Figure 12).
The total number of respondents in this instance is
nevertheless too small to engage in any serious
assessments. These numbers suggest, but in no
way confirm, that wildlife harvesting is more and
more an activity of the wealthiest, the very local, or
the professional.

160
Figure 12. Division of hunters and fisher between UB and
rest of country

161
Wildlife Trade Markets
Household Sales
VOLUMES Contrary to the 2005 results, households rarely
declared selling any of the wildlife they harvested.
The preceding quote is the single exception among
a sample of almost 1,000 people that self-reported
fishing activity. Self-reporting of purchases
(described in a separate section), however, tells an
entirely different story, as do observations in
markets, restaurants, and retail shops. While the
household sales data obtained during the survey
are presented here, it is clear that the enforcement
environment has had an impact on respondents
involved at this end of the trade chain. The entire
fish take volume, for example, was claimed as
household consumption only. As previously
presented in Error! Reference source not found.,
this would correspond to as many as 736,000
locally caught fish consumed by roughly 30,000
households, for an average of 24 fish per
household. With these numbers, the households
involved would be eating fish almost every other
day during the summer months when fishing is
permitted, and at its peak. The consumption of
fish certainly appears to be increasing, but this
level is suspect, when every indication is that fish
consumption in Mongolia is still very low across
the country; e.g., less than 1 kg per person per
year.392
This part of the analysis initially considered
n=1,893 specimens after removing outliers. This
was further cleaned to discard an additional six
observations that did not have information on use,
bringing the total sample to n=1,887. Despite clear
trade in several mammals and birds, only marmots
and wolf were reported as being sold, and even
then only in small amounts compared to what was
claimed as household consumption. Only 4% of the
marmots (Siberian marmot) and 10% of wolfs skins
were reported as sold. Using these percentages
over the estimated number of specimens taken
nationally in a year (see Table 12), household sales
would extrapolate to just 15,431 marmots and
4,422 wolves for 2015.
Table 12. Household Wildlife Sales Amounts
PRICING Estimating the market value of these household
sales was calculated using information on
purchase prices provided in the same household
survey.
For Siberian marmot, the survey captured 279
price observations across the country with an
average price close to MNT 32,000 (equivalent to
USD 14) and a price range between MNT 7,000 and
MNT 70,000 per marmot. The high variability in
prices appears to be associated with multiple
factors including:
392 Dulmaa, A., 1999. Fish and fisheries in Mongolia. p. 187-236. In T. Petr (ed.) Fish and fisheries at higher altitudes: Asia. FAO Fish. Tech. Pap. No. 385.

162
i) seasonality, ii) weight of the animal, iv) whether
the meat is purchased raw or prepared, v) the
number of intermediaries involved and v) location.
In general, prices increase in soum and aimag
centers, and were highest in UB. In UB, households
are paying an average close to 35,000 MNT per
marmot while outside the capital the average the
price is close to 25,000 MNT, starting as low as
7,000 MNT. This variability and range in prices was
also confirmed by qualitative data collected from
informants.
For wolf skins, the survey collected only five price
observations, with average prices close to MNT
150,000 (equivalent to USD 63). Informants
confirmed this as the average price for hunters,
with prices ranging between MNT 100,000 and
MNT 250,000. The case study for the wolf
presented towards the end of this Chapter
provides further detail on prices of wolf skin along
the value chain. For household analysis purposes,
the lower price associated with the hunter is used
for extrapolation.
Figure 13. Images of marmot and wild boar hunted for
personal consumption
ESTIMATED TOTAL SALES VALUES Total sales for households as self-reported by
respondents barely reached half a million dollars
(Table 13). Using an average figure of USD 14 per
marmot, the 15,431 marmots estimated as total
annual take for Mongolia would result in a
household income around USD 216,000, while the
4,422 wolves would result in around USD 280,000
additional income derived from trade in skins at
USD 63 per wolf.
Table 13. Household Wildlife Sales Values
Household Purchases
VOLUMES The results for household purchases of wildlife
present a substantially different perspective of
wildlife trade at the household level. While hunters
only claimed to have sold two species (wolf and
marmot), households reported purchasing a total
of 34 different species. Where only 60 out of 4,070
households declared selling wildlife (1.5%), a total
of 791 households (19%) shared information
regarding their wildlife purchases. Obviously, when
it comes to reporting purchases (even banned
species such as marmots), respondents felt more
secure. The assumed reason for this is that only
recently has Mongolia imposed strong penalties for
these parts of the trade chain, including the
procurement, use, and storage of illegally
harvested wildlife. In other words, there is less
awareness of the illegality and therefore sensitivity
to this line of questioning.
In general, the participation of households in
wildlife purchase appears to be active. For
extrapolation purposes, location was taken into
account since the average of households

163
purchasing wildlife in UB was 22% while outside UB
this proportion drops to 18%. Using the total
number of households registered by the official
census in 2015, more than 170,000 households or
20% of the total are engaged in purchasing wildlife
(Figure 14).
Figure 14. Household Wildlife Purchases, No. of
Purchasing Households
To further refine estimates and the understanding
of wildlife purchasing patterns, household
purchases were analyzed to account for the
purchase power of households. Results are
presented in Figure 15. For this analysis, the
survey used the five official census categories
classifying household purchase power. These
categories do not refer to quantitative amounts of
income, but refer to the ability of households to
cover different levels of expenses, from basic daily
needs, to clothing, to the purchase of valuables,
and finally the ability to generate savings. As this
approach does not ask about specific values, it
results in higher response rates and a greater
percentage of true answers, especially in
economies with a certain degree of domestic
consumption of its own wildlife resources, as is the
case in Mongolia. This survey had 100% response
rate to this question and representativeness from
each category that significantly aligns with official
records.
Figure 15 shows that as households increase their
purchase power and are able to spend money
beyond basic needs, the percentage of households
purchasing wildlife also increases. Where only 11%
of the poorest households buy wildlife, this
percentage steadily increases as purchase power
rises with 34% of the wealthiest households
purchasing wildlife.
Figure 15. Household Wildlife Purchases by Income Level
This wildlife purchasing behavior is important to
consider when forecasting future trends in wildlife
consumption. Economic development, including
urbanization and increased income, has
traditionally being understood as “an essential first
step to win–win solutions for poverty alleviation
and biodiversity conservation by breaking rural
reliance on wildlife.”393 However, different studies
393 Brashares, Justin & Golden, Christopher & Z Weinbaum, Karen & Barrett, Christopher & V Okello, Grace. (2011). Economic and geographic drivers of wildlife consumption in Africa. Proceedings of the National Academy of Sciences of the United States of America. 108. 13931-6. 10.1073/pnas.1011526108.
2015 MONGOLIA
Extrapolation of Purchasing Households
n
No. Households Purchasing
Wildlife N
Estimated No. of Households
Purchasing Wildlife
Outside UB 1,771 18% 376,419 67,755
Inside UB 2,299 22% 482,687 106,191
4,070 859,106 173,947
100% 20%
SAMPLE POPULATION
20% of Mongolia's Households Purchase Wildlife
2015 MONGOLIA
Insuficient Incomefor Daily Basic Needs
Barely Suficient Incomefor Daily Basic Needs
Suficient Incomefor Daily Basic Needsand Clothing
Suficient Incomefor All Needsand Valuables
Suficient Incomefor All NeedsValuablesand Savings
n = 4,070
11%
17%
25%
27%
34%
Insuficient Incomefor Daily Basic Needs
Barely Suficient Incomefor Daily Basic Needs
Suficient Incomefor Daily Basic Needsand Clothing
Suficient Incomefor All Needsand Valuables
Suficient Incomefor All NeedsValuablesand Savings

164
across the world in native populations in Latin
America and Africa are reporting that “increases in
wealth may accelerate consumption and extend the
scale and efficiency of wildlife harvest.” 394 This
pattern appears to be occurring in Mongolia.
Mimicking its neighbor China, urbanization and
wealth appear positively correlated with increased
wildlife consumption, reflecting a society where
wildlife consumption is a status symbol. It is not
clear to what extent these trends (the increase in
wealth and wildlife consumption) will continue in
Mongolia. There are, however, indications of
continuing urbanization, as well as increasing
wealth based principally on the strength of the
mining sector.
SPECIES AND PARTS In the proceeding questions for those that claimed
to purchase wildlife, the survey inquired about the
specific parts purchased. From these responses,
trade terms and values were derived for 31 of the
34 species purchased by households and are
presented in Table 18, including 16 mammals, 7
birds, and 11 fish species. Food consumption is the
most common use of wildlife, with animals being
purchased whole or per kilogram of meat and also
raw or processed (i.e. cooked marmots, smoked
fish). The purchase of skins or furs and oil are the
next most common trade terms. Purchase of
internal organs such as bile, brains, stomachs or
livers appear in the survey for three species (gray
wolf, European badger and brown bear). Taimen, a
catch-and-release-only species, was reported
purchased during 2015, both for its meat and for
its oil.
394 Id.
ESTIMATING TOTAL PURCHASES Estimation of trade value of household purchases
from the survey and extrapolation to the entire
household population is detailed in three separate
tables; mammals (Table 15), birds (Table 16) and
fish (Table 17). Respondents provided information
on prices and amounts purchased for a total of 31
species of the 34 traded. No estimation of trade
value was possible for Dalmatian pelican,
American mink and great bustard. In addition,
some parts, such as wolf tongue or Siberian
marmot liver, also did not have values associated
and are therefore also missing from the analysis.
The tables detail how many households engaged in
the purchase of each species, the total amounts
acquired and the total value of the species
purchases. This value results from the aggregation
of the expenditures made by each household for
each species, derived from the multiplication of
the amount purchased and the prices reported.
The average annual expenditure per household is
offered in MNT and in USD. The top five mammals
being purchased are marmots, gray wolf,
Mongolian gazelle, roe deer and wild boar. The top
five fish species are whitefish, lenok, carp, perch,
and taimen.
For extrapolation purposes, the analysis calculates
the percentage of households purchasing a
particular species out of the total number of
households surveyed (n=4,070). This percentage is
applied to the total number of households at the
national level (n=859,106) to extrapolate how many
households nationally purchase any given species.
Using the average annual purchase value per
household per species, the annual expenditure of
all households is extrapolated for each species.
The aggregated value at the national level is close
to 4 million dollars annually.
The results in this instance, although higher than
the estimates obtained from sales, should still be
viewed with caution. This section of the survey was
tedious in the number of follow-up questions for
each species about trade parts, prices, and
amounts. It is possible that respondents limited
the number of species they reported in response to
the burden of the questionnaire, avoiding the
effort to recall so many details concerning
purchases. The fact that only 11% of respondents
provided information of more than one species
purchased calls for caution and for understanding
that this aggregated value may be a significant
underestimation.
One notable result visible in the tables is that the
total household wildlife purchases are roughly

165
eight times the total household wildlife sales,
which only came to USD 0.5 million around. This
speaks to the degree of underreporting clearly
associated with sales and probably associated with
purchases. Sales are a clear underestimate as they
can be directly compared to purchases. Given
reluctance overall, there is also likely a degree of
underreporting on purchases as well. The disparity
in the self-reporting of sales and purchases also
underscores the impact of an uneven regulatory
approach. Even when hunters show extreme
reluctance, households openly report the purchase
of illegally harvested wildlife in an environment
where the use, purchase, and consumption of
those products is still not illegal.
The other notable result is the significant
concentration of household purchases of relatively
few species out of the 35 species in trade. Table 14
presents the top ten, comprised of those with the
highest total purchase values after aggregating all
values for the different parts traded. These top ten
represent 90% of the total trade value. Of these,
just three species (marmot, wolf, and Mongolian or
white-tailed gazelle) represent 60% of all wildlife
purchases. Of the remaining seven species (all
fish), just two, whitefish and lenok, constitute
another almost 25% of total trade value. In the end,
three mammals and two fish represent almost 85%
of all trade – a pattern so embedded in cultural
practices and emerging trends that it does not
appear likely to change in the near future.
Table 14. Top 10 Species Purchased by Annual
Expenditure Estimates
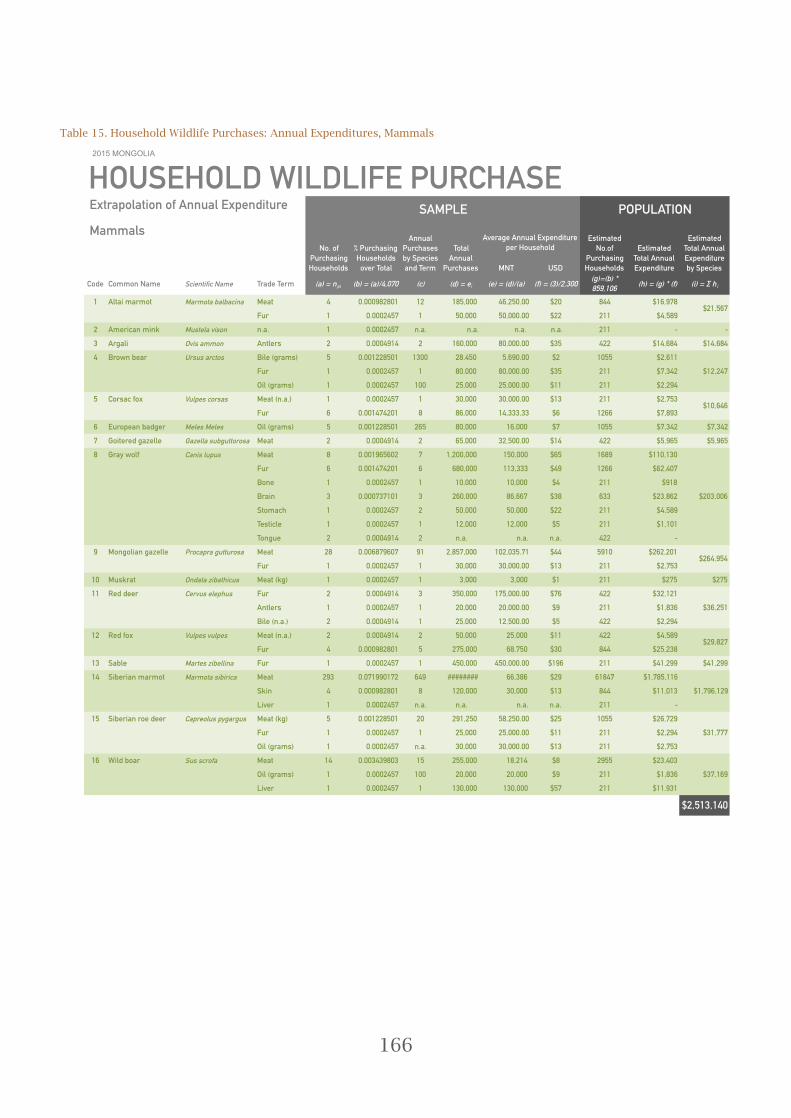
166
Table 15. Household Wildlife Purchases: Annual Expenditures, Mammals

167
Table 16. Household Wildlife Purchases: Annual Expenditures, Aves
Table 17. Household Wildlife Purchases: Annual Expenditures, Fish
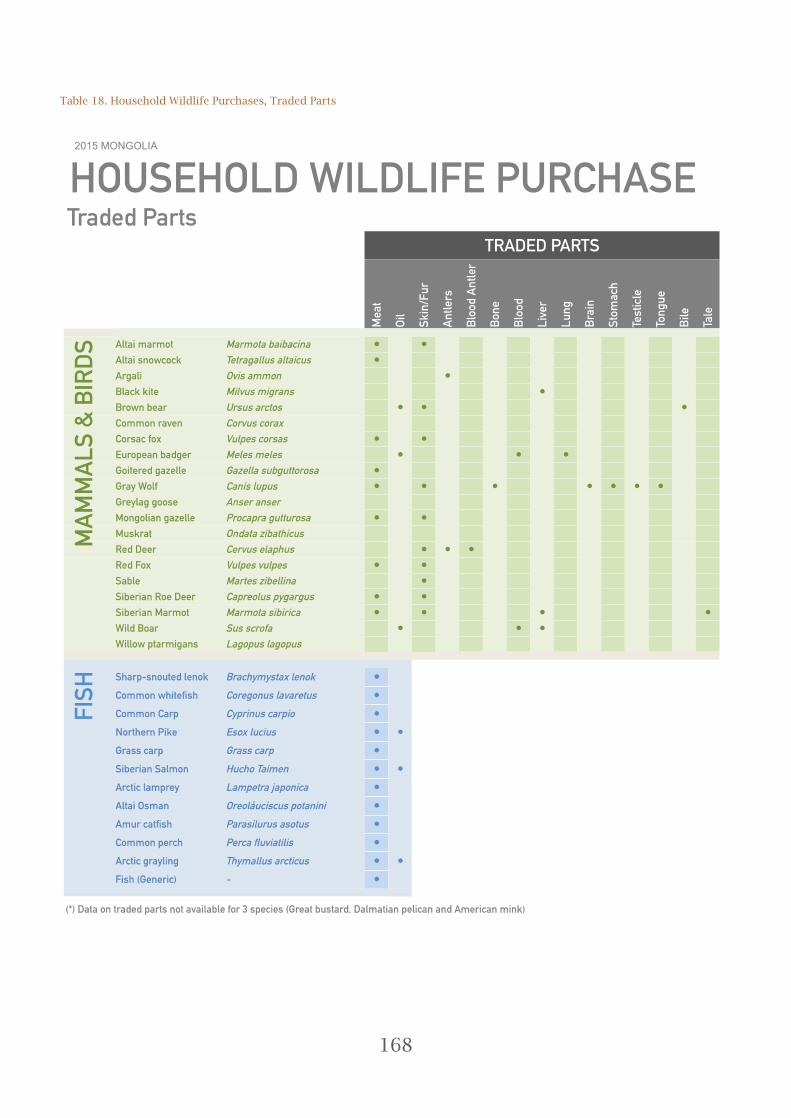
168
Table 18. Household Wildlife Purchases, Traded Parts
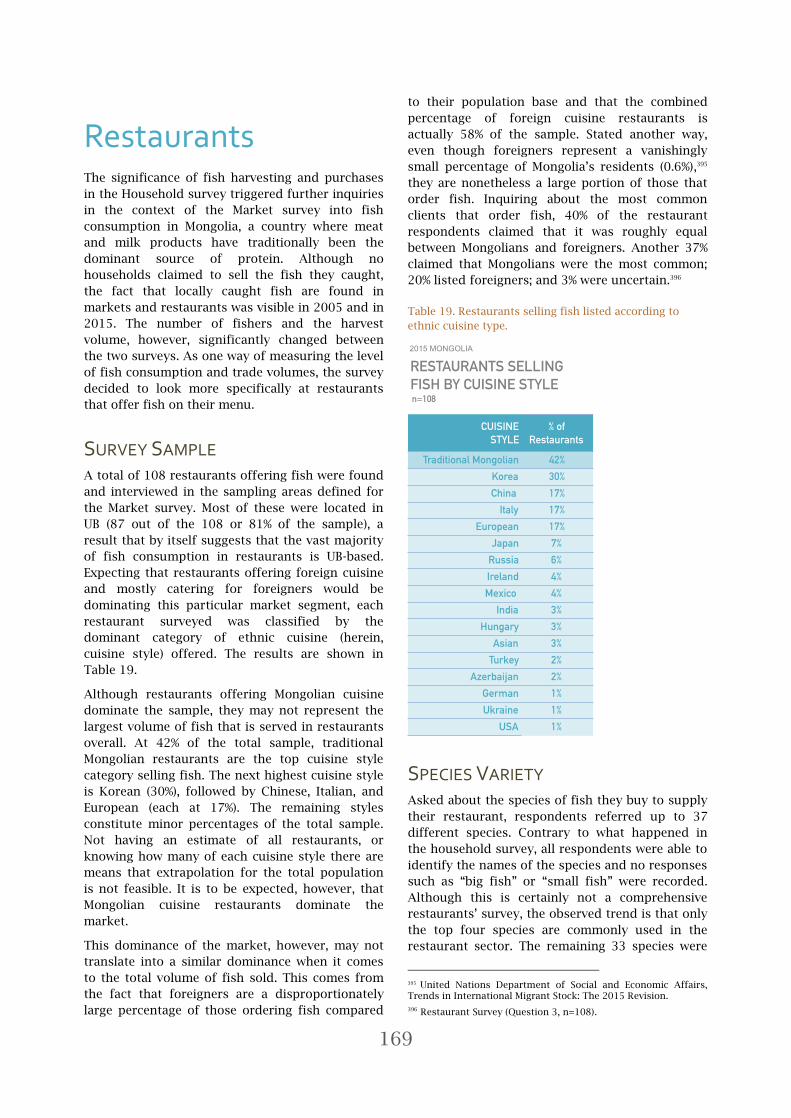
169
Restaurants The significance of fish harvesting and purchases
in the Household survey triggered further inquiries
in the context of the Market survey into fish
consumption in Mongolia, a country where meat
and milk products have traditionally been the
dominant source of protein. Although no
households claimed to sell the fish they caught,
the fact that locally caught fish are found in
markets and restaurants was visible in 2005 and in
2015. The number of fishers and the harvest
volume, however, significantly changed between
the two surveys. As one way of measuring the level
of fish consumption and trade volumes, the survey
decided to look more specifically at restaurants
that offer fish on their menu.
SURVEY SAMPLE A total of 108 restaurants offering fish were found
and interviewed in the sampling areas defined for
the Market survey. Most of these were located in
UB (87 out of the 108 or 81% of the sample), a
result that by itself suggests that the vast majority
of fish consumption in restaurants is UB-based.
Expecting that restaurants offering foreign cuisine
and mostly catering for foreigners would be
dominating this particular market segment, each
restaurant surveyed was classified by the
dominant category of ethnic cuisine (herein,
cuisine style) offered. The results are shown in
Table 19.
Although restaurants offering Mongolian cuisine
dominate the sample, they may not represent the
largest volume of fish that is served in restaurants
overall. At 42% of the total sample, traditional
Mongolian restaurants are the top cuisine style
category selling fish. The next highest cuisine style
is Korean (30%), followed by Chinese, Italian, and
European (each at 17%). The remaining styles
constitute minor percentages of the total sample.
Not having an estimate of all restaurants, or
knowing how many of each cuisine style there are
means that extrapolation for the total population
is not feasible. It is to be expected, however, that
Mongolian cuisine restaurants dominate the
market.
This dominance of the market, however, may not
translate into a similar dominance when it comes
to the total volume of fish sold. This comes from
the fact that foreigners are a disproportionately
large percentage of those ordering fish compared
to their population base and that the combined
percentage of foreign cuisine restaurants is
actually 58% of the sample. Stated another way,
even though foreigners represent a vanishingly
small percentage of Mongolia’s residents (0.6%),395
they are nonetheless a large portion of those that
order fish. Inquiring about the most common
clients that order fish, 40% of the restaurant
respondents claimed that it was roughly equal
between Mongolians and foreigners. Another 37%
claimed that Mongolians were the most common;
20% listed foreigners; and 3% were uncertain.396
Table 19. Restaurants selling fish listed according to
ethnic cuisine type.
SPECIES VARIETY Asked about the species of fish they buy to supply
their restaurant, respondents referred up to 37
different species. Contrary to what happened in
the household survey, all respondents were able to
identify the names of the species and no responses
such as “big fish” or “small fish” were recorded.
Although this is certainly not a comprehensive
restaurants’ survey, the observed trend is that only
the top four species are commonly used in the
restaurant sector. The remaining 33 species were
395 United Nations Department of Social and Economic Affairs, Trends in International Migrant Stock: The 2015 Revision.
396 Restaurant Survey (Question 3, n=108).
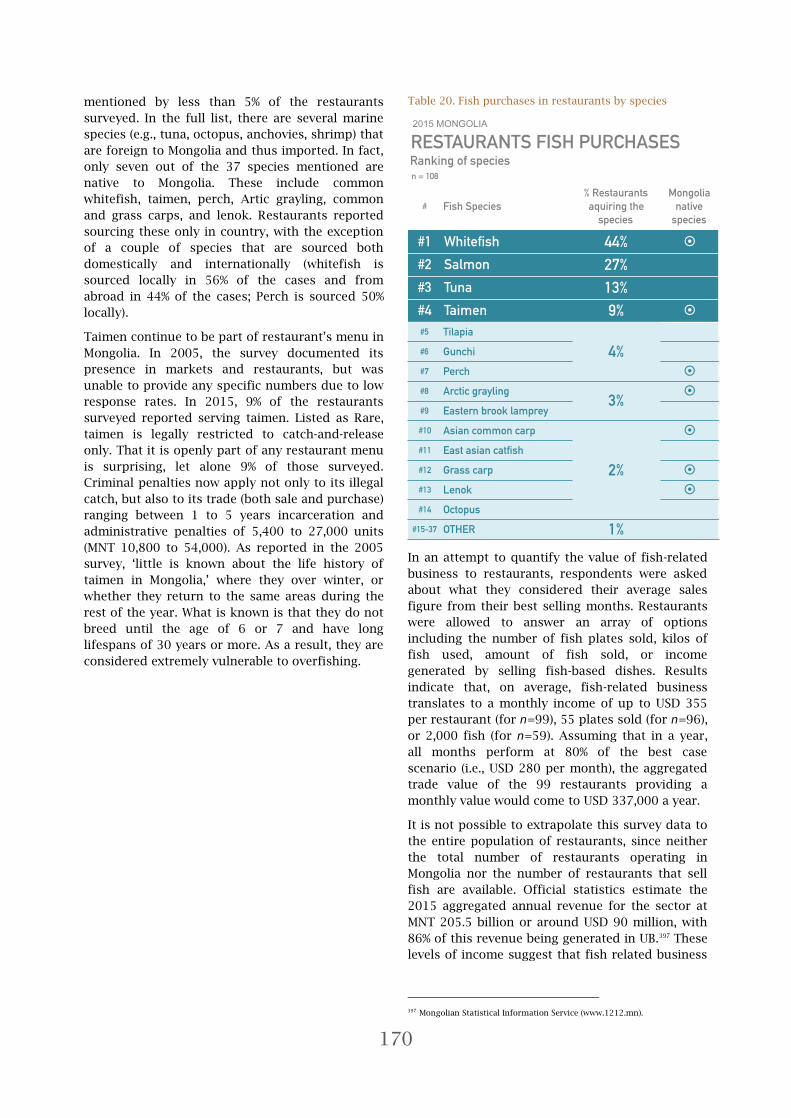
170
mentioned by less than 5% of the restaurants
surveyed. In the full list, there are several marine
species (e.g., tuna, octopus, anchovies, shrimp) that
are foreign to Mongolia and thus imported. In fact,
only seven out of the 37 species mentioned are
native to Mongolia. These include common
whitefish, taimen, perch, Artic grayling, common
and grass carps, and lenok. Restaurants reported
sourcing these only in country, with the exception
of a couple of species that are sourced both
domestically and internationally (whitefish is
sourced locally in 56% of the cases and from
abroad in 44% of the cases; Perch is sourced 50%
locally).
Taimen continue to be part of restaurant’s menu in
Mongolia. In 2005, the survey documented its
presence in markets and restaurants, but was
unable to provide any specific numbers due to low
response rates. In 2015, 9% of the restaurants
surveyed reported serving taimen. Listed as Rare,
taimen is legally restricted to catch-and-release
only. That it is openly part of any restaurant menu
is surprising, let alone 9% of those surveyed.
Criminal penalties now apply not only to its illegal
catch, but also to its trade (both sale and purchase)
ranging between 1 to 5 years incarceration and
administrative penalties of 5,400 to 27,000 units
(MNT 10,800 to 54,000). As reported in the 2005
survey, ‘little is known about the life history of
taimen in Mongolia,’ where they over winter, or
whether they return to the same areas during the
rest of the year. What is known is that they do not
breed until the age of 6 or 7 and have long
lifespans of 30 years or more. As a result, they are
considered extremely vulnerable to overfishing.
Table 20. Fish purchases in restaurants by species
In an attempt to quantify the value of fish-related
business to restaurants, respondents were asked
about what they considered their average sales
figure from their best selling months. Restaurants
were allowed to answer an array of options
including the number of fish plates sold, kilos of
fish used, amount of fish sold, or income
generated by selling fish-based dishes. Results
indicate that, on average, fish-related business
translates to a monthly income of up to USD 355
per restaurant (for n=99), 55 plates sold (for n=96),
or 2,000 fish (for n=59). Assuming that in a year,
all months perform at 80% of the best case
scenario (i.e., USD 280 per month), the aggregated
trade value of the 99 restaurants providing a
monthly value would come to USD 337,000 a year.
It is not possible to extrapolate this survey data to
the entire population of restaurants, since neither
the total number of restaurants operating in
Mongolia nor the number of restaurants that sell
fish are available. Official statistics estimate the
2015 aggregated annual revenue for the sector at
MNT 205.5 billion or around USD 90 million, with
86% of this revenue being generated in UB.397 These
levels of income suggest that fish related business
397 Mongolian Statistical Information Service (www.1212.mn).

171
could be several times greater than the survey
results.
SEASONALITY OF PURCHASES Analysis of purchase seasonality reveals that local
markets offer fish across all seasons, and
restaurants are able to source their local fish all
year. Only Arctic grayling and Altai osman appear
to be restricted in the market to the spring, and
Arctic grayling again to the fall. As most, if not all
of the fish procured by restaurants is reportedly
frozen (see next section), it is possible that the
seasons of sale do not match up with catches. The
frequency of purchases and the fact that even
frozen product is not kept for long periods suggest
that at least a portion of the fish sold have been
harvested outside of the legally permitted season.
Fishing seasons for all but Taimen are generally
long, extending for most species from early
summer through the winter. The frequency of fish
purchases completed daily by 4% of the
restaurants, weekly by 55%, and monthly by the
36%. Only 11% declare to buy fish depending on
the season. Taimen, for example, apart from being
a catch-and-release only species, is apparently sold
in every season when the open season is restricted
to summer and fall.
Figure 16. Seasonality of fish purchases by restaurants
PROCESSED FORM Frozen fish is the dominant form purchased by the
restaurants in the sample. Among all the fish
purchases reported (n=159), 70% involved frozen
fish (see Figure 17) including all eight Mongolian
species. Fresh fish is the second most important
form, but constitute just 13% of all purchases. Five
of the Mongolian species were reported among
fresh fish procurements. These species are Arctic
whitefish, grayling, taimen, lenok and osman.
Without refrigerated shipping capacity, fresh fish
procurements indicate at least some degree of
proximity to harvesting locations. The next form of
fish procurement is canned fish, constituting 8% of
total purchases. No Mongolian fish were found in
relation to canned purchases. This is also true for
pickled fish, a processed form representing 4% of
the purchases. Both canned and pickled forms
require more sophisticated equipment that does
not yet seem to be available for the fish sector in
Mongolia. Purchases of smoked fish, a more
rudimentary process that is possible to produce
even at the household level, constitute 6% of
purchases and includes three Mongolian species;
Arctic whitefish, taimen, and pike.
Figure 17. Restaurant fish purchases by processed form

172
PURCHASE SOURCES The following figures reveal that, when examining
the sourcing of Mongolian species, suppliers to
restaurants are mostly wholesalers (67% of the
purchases), with direct purchasing from fishermen
relatively low (15%) and similar to that of retail
traders (17%). The assumption is that UB
restaurants are mostly sourcing from wholesalers,
while outside UB restaurants may have greater
opportunities to purchase directly from fishers. It
is worth remembering that none of the fishermen
interviewed in the household survey admitted
selling any of their capture.
Figure 18. Suppliers of Mongolian Fish to Restaurants
Concerning the supply of foreign fish species,
restaurants buy directly from importers in 55% of
the cases, from wholesalers in 33% of the cases,
and directly from foreign exporters in 12% of the
cases.
Figure 19. Suppliers of Foreign Fish to Restaurants
All of this data describes a supply chain for fish
products that is relatively mature and includes
many actors. Prices and product presentations,
however, reflect a certain market immaturity with
national fish being sold by the piece and not by the
kilo, resulting in a pricing system that is not
entirely objective or transparent. Restaurants
report paying between MNT 5,000 and MNT 60,000
(USD 2.17 and USD 26.08) for locally sourced Artic
whitefish, with the price more dependent on the
size than on its processing (fresh, frozen or
smoked, n=38). For taimen, purchase prices can
range between MNT 17,000 and MNT 48,000 (USD
7.39 and USD 20.87).
Image 1. Fresh fish procured directly from fisher by a
restaurant in Uvs aimag
Traditional Medicine Mongolian Traditional Medicine Hospitals and
practitioners rely primarily on herbal preparations
for their treatments, with wildlife fauna playing a
distinct, but minor role by comparison. A long list
of health issues are handled by TM practitioners
using flora-based preparations to treat internal
organ diseases, as affecting for example, the heart,
kidneys, liver, bile, lungs and stomach. They are
also used to treat certain diseases related to bones,
blood, colds, arthritis, and neurological problems.
Flora-based remedies are also prescribed for
general health prevention (hair strengthening,
healthy sleep, or internal cleansing), as well as
natural painkillers. Both practitioners and end
users usually pick their own supply to do the
preparations, with almost all parts of the plant (i.e.
seeds, stems, leafs, roots and flowers) used.

173
Fauna-based products, on the other hand, were
reported by just over half (55%, n=34) of the TM
survey respondents. The survey identified six
species of fauna as the most commonly used.
Information was vague on the origin of the wildlife,
as TM practitioners appeared to be more familiar
with their uses than their place of origin. Evidence
was collected about imported and locally prepared
TM product types though pictures, but no
purchase volumes or prices were collected in the
survey. The results nonetheless offer information
on the wildlife parts used and their properties.
Species are listed according to the number of times
they were mentioned.
Image 2. Imported Russian TM products
Brown Bear. Brown bear oil and brown bear bile
are used to treat joint pain, chronic diseases,
inflammations, skin burns, and stomach
problems. Respondents unanimously mentioned
the client preference for brown bear products of
Mongolian origin, but that more affordable
Russian TM products are also commonplace on
the market.
Eurasian Badger. The use of Eurasian badger oil
to treat skin burns, stomach ulcers, and colon
inflammations were mentioned as common in UB
and Selenge.
Marmot. Marmot oil was cited as used in cases of
stomach ulcers and joint problems (arthritis pain
and bone calcification).
Red Fox. Red Fox lung was mentioned to treat
lung problems.
Gray Wolf. Two respondents identified gray wolf
meat as a product commonly used in UB for
preventing diseases, and for treating cold and
lung inflammation. Respondents mentioned
Sukhbaatar as the source aimag and local traders
as the suppliers.
Musk Deer. Respondents from UB identified
musk deer products (testicles and wombs) as
used in the capital, although not commonly.
These products are used for preventing diseases
and boosting the immune system, they are also
used for the treatment of neurological diseases,
paralysis, and inflammatory processes.
Image 3. Mongolian homemade TM products

174
Retail Markets
SURVEY SAMPLE The retail market survey was conducted in 106
stores trading wildlife, 63% of them located in UB.
The survey team targeted many types of stores,
including those selling gifts and souvenirs,
clothing, antiques, traditional medicine products,
household decorations, fish vendors, and jewelry
stores. Rather than try to identify and quantify
sales for all wildlife trade products, the focus was
on what stores self-reported as their top sellers.
When asked about top sellers, shops reported
information on 64 different products in total. Of
these, several shops reported that more than one
was considered a top seller resulting in 175
observations in 106 shops.
Image 4. Wildlife-based clothing and jewelry found in
Mongolia’s retail shops
Table 21 presents the complete list of wildlife
related products, organized by market segment.
These include 1) clothing and shoes, 2) jewelry, 3)
food products, 4) medicinal products, 5) gifts and
souvenirs, 6) religious artifacts, and 7) furniture
and decoration. In addition to the column listing
the wildlife product, another eight columns record:
the number of shops reporting the product as a bestseller
the percentage of all stores surveyed that
were active in a particular market segment
the country of origin for each product listed,
including Mongolia, Russia, China, and Other
the combined ‘best month’ sales for all stores
that identified a particular product as a top
seller; e.g., 13 stores self-reported their ‘best
month’ sales volume for fox fur hats; the sum
of all estimates for this product is listed in
this column.
the average sale price
the estimated maximum monthly income for
each product, aggregated result for all stores,
the percentage this revenue represents of the
total sales from all wildlife products in all
segments
ESTIMATING SALES VOLUMES Estimating sales volumes is based entirely on
respondent recall. No additional observations or
data were requested or recorded. Stores were
asked about the maximum number of items sold
(units) for a given wildlife product in a month, with
results registered in the seventh column. The same
column sums the total number of units sold for
the 106 respondents (n=1,860 products). Some
were not able to provide a number and in those
cases, the table shows not available (n.a.). The total
in this column references only the number of price
‘observations’ relative to the sample size. It is not
intended for use to estimate total sales either for
individual products or the market as a whole.
PRICING AND SALES VALUES To estimate the total sales value for each product
and market segment within the survey, stores were
asked to state the average price for the product
identified as a best seller. As happened for several
products, when more than one shop was found to
sell the same product, an average price was
calculated using only the observations available.
Because total sales volumes could not be readily
verified, averaging of the prices does not account
for differences in volume of items sold, only the
price per unit. This information was used to make
a rough estimate of the aggregated monthly trade
value for these best sellers.
For the shops surveyed and including all market
segments, the total came to almost MNT 170
175
million or USD 74,000 a month. Extrapolated out
for the entire year, sales were estimated at
$888,000 for the top selling products, including
Mongolian and foreign sources.
As noted, this figure only accounts for the
bestsellers in each shop; mostly one product, but
on some occasions two were recorded. In most
instances, however, surveyors observed many more
products, suggesting that the total income for this
part of the survey is much higher. Another factor
that would likely increase the current estimate
substantially is that the 106 shops surveyed were
located in UB and another eight aimags. The
remaining 13 aimags were not surveyed and
therefore no further figures were presented. As
with the restaurant survey, extrapolation of these
results is not possible as the total number of shops
in each category in Mongolia that trade wildlife-
based products is not known.
TOP SELLERS As a whole, the top selling market segments within
the sample are, in order of prevalence:
Clothing and Shoes: Among the shops
surveyed, this is by far the most important
category. Just over half (54%) of the shops
claim that wildlife-based apparel is one of
their best selling products. Based on
estimated maximum monthly sales, this
market segment also represents 83% of the
revenue generated by all market segments
combined.
Clothing articles reported include hats, coats,
jackets, and boots. The most commonly used
wildlife for these products are wolf, sable,
reindeer, and badger. With the exception of
two product types (crocodile skin boots and
snake skin shoes), all of the wildlife in this
market segment occurs in Mongolia. In most
cases, stores also claim sourcing wildlife
locally. Some stores also stocked imported
apparel from China and Russia, in particular
fox and sable fur products.
Jewelry: The next most common top seller is
jewelry, with 40% of the sample self-reporting
this as an important category. As a function
of overall revenue generation, it runs a distant
second at just 8.76% of the revenue generated
by all market segments.
Unlike clothing, however, all products
reported by retail shops include wildlife
sourced exclusively in Mongolia. In order of
the frequency of observations, they are gray
wolf (canines and ankles), followed by eagle,
buzzard and vulture claws, wild boar canines,
bear canines, and saker falcon claws.
Fish: Already reported in the Restaurant
survey, fish is another important wildlife
trade segment in Mongolia’s retail shops. Just
under one third (28%) of the shops surveyed
sell fish. With mostly low prices, overall
revenue, however, is just 2.16% of the
combined sales results.
Of the 13 species identified by the shops,
eight of them are sourced in Mongolia. The
only species with a clear prevalence above all
others is locally-sourced lenok.
Traditional Medicinal Products: Not as
common as other market segments,
nonetheless 16% of stores reported TM
products as top selling items. This portion of
the survey described some of the same
species and products revealed in the survey
of TM hospitals (e.g., bear oil). Similar to the
hospital survey, the actual species and
sources were not always known (e.g., in some
instances only ‘fish’, ‘bird’, and ‘bear’ are
mentioned). Species specifically identified
include red deer, Altai snowcock, and
Eurasian badger.
Sources of TM products are predominantly
Mongolian, with the exception of bear oil that
was reported as a top seller in two shops, but
where the source in both cases is classified as
‘other.’
Gifts and Souvenirs: Present in 13% of the
stores, this category is another important
market segment. Total sales volumes,
however could not be estimated as no
information was offered for three of the four
Mongolia sourced products.
Of note in this market segment is the open
sale of wildlife listed as Very Rare and Rare,
including snow leopard and argali products.
The last two segments, Religious Artifacts (10%)
and Furniture and Decoration (4%) comprise
another 14% of the observed wildlife trade in retail
shops. With the exception of Peafowl feathers, all
species in these segments are sourced locally and
include wolf, fox, marmot, red deer, and Mongolian
gazelle. Several other species and parts are known
to be on the market, but were not independently
verifiable by surveyors. These include, in
particular, bird feathers from eagle owl, raven,
saker falcon, steppe and golden eagles, and ruddy
shelducks.

176
Table 21. Wildlife products, sources, prices, and sales in retail shops398
398 Vulture talons may be misidentified eagle talons.

177

178
Outdoor Markets Apart from formal retail stores, the survey also
visited well-known outdoor wildlife markets, some
of which have been in continuous operation since
the original Silent Steppe survey. Within the
sampling area, this included outdoor markets in
selected soums, six markets in the capital
(including Kharkhorin, Naraan Tuul, Nomin,
Bayanzurkh Market, Khuchit Shonkhor, and Bars),
and three more trading locations on the outskirts
of UB (Emeelt, Baganuur, and Nalaikh).
Figure 20. Wildlife products observed by team surveyors
on display in outdoor markets across Mongolia
To ensure the field team’s safety, these visits were
not conducted with researchers acting as surveyors
nor posing as actual buyers. Instead, team
members acted simply as mystery shoppers,
wandering around and randomly requesting
information on products and prices as they came
across them. Photographic evidence was collected
only on a few occasions, again for safety reasons
(see Figure 20 and Image 5)
Two facts were clear throughout the visits to the
outdoor markets. The first is that law enforcement
has succeeded in putting some degree of pressure
on traders, pushing wildlife trade toward the black
market. Traders did not always offer their
products openly and usually only a limited amount
of product –one or two- were available on site,
hidden in black bags with traders affirming that
more were available in a different location if the
buyer was interested. On several occasions,
mystery shoppers were invited to visit homes or
private spaces close to the market to see the entire
product offering. Secrecy was the norm.
The second fact is that illegal wildlife trade in
Mongolia has become an ‘on-demand’ enterprise.
Mystery shoppers were asked repeatedly about the
amount of product they wanted to purchase. Many
traders insisted on the fact they could get any
amount requested, including wolf, red fox, sable,
and marmot. In one instance, surveyors were able
to engage in some follow-up by calling a phone
number provided to one of the secret buyers,
which put them in contact with a dealer in Zamiin-
Uud. This trader explained that he could get others
to hunt on demand any amount and kind of fur the
client may request. This on demand trade was also
captured in some formal retail shops in UB. These
interactions were the closest the survey team came
to the organized criminal networks discussed
when outlining the bigger picture related to IWT in
Chapter 3.
The field survey recorded a total of 258 outdoor
markets’ price observations during September and
October of 2016, with 124 gathered in UB (48%)
and 134 in the aimags (52%). Data records included
the specific trading site, species being traded, their
parts, and prices. The analysis took into account
only 122 of the price observations (around 50% of
the total) after discarding outliers and all foreign
imported products (mostly fish species and fur
clothing coming from China and Russia) to focus
solely on Mongolia sourced products. The analysis
focused on raw material and also discarded
observations of processed items representing
unique pieces, which presented difficulties in
aggregating observations into homogeneous
categories (i.e. unique souvenirs or pieces of
jewelry). The result is a price analysis based on a
low number of observations, but the results are
mostly consistent with price information offered
by both households, restaurants, and other market
segments and are considered appropriate for
purposes of estimating trade values.
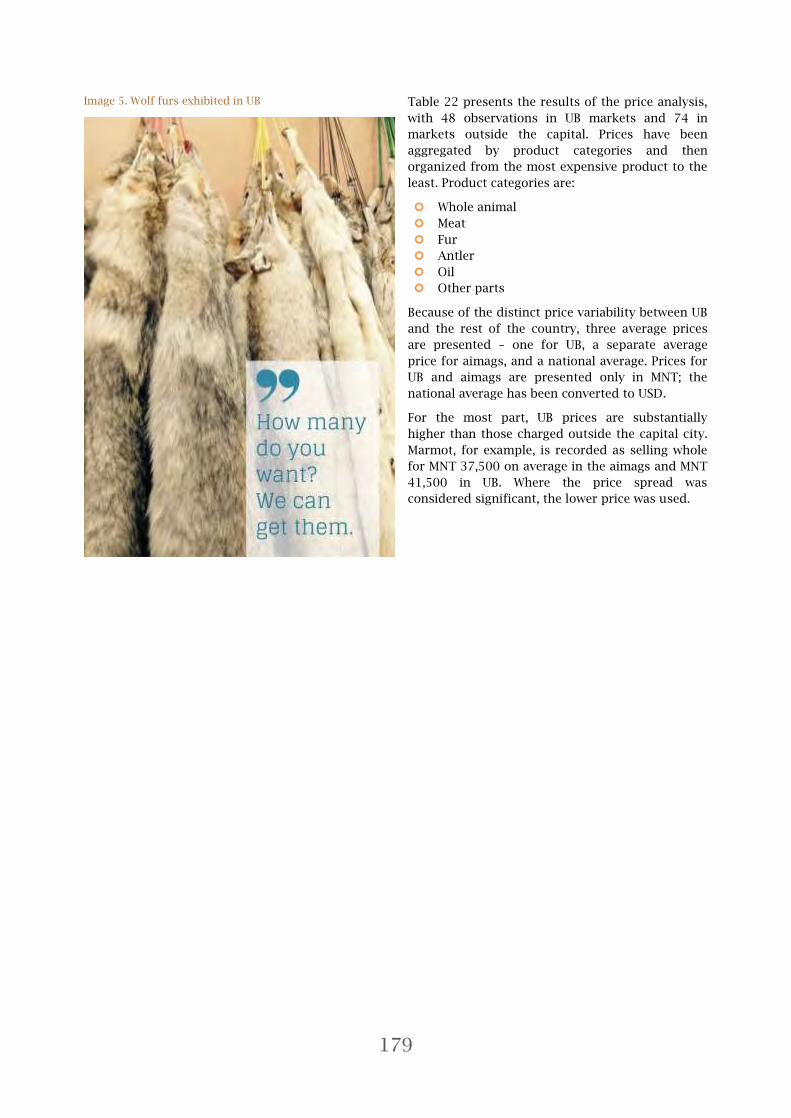
179
Image 5. Wolf furs exhibited in UB
Table 22 presents the results of the price analysis,
with 48 observations in UB markets and 74 in
markets outside the capital. Prices have been
aggregated by product categories and then
organized from the most expensive product to the
least. Product categories are:
Whole animal
Meat
Fur
Antler
Oil
Other parts
Because of the distinct price variability between UB
and the rest of the country, three average prices
are presented – one for UB, a separate average
price for aimags, and a national average. Prices for
UB and aimags are presented only in MNT; the
national average has been converted to USD.
For the most part, UB prices are substantially
higher than those charged outside the capital city.
Marmot, for example, is recorded as selling whole
for MNT 37,500 on average in the aimags and MNT
41,500 in UB. Where the price spread was
considered significant, the lower price was used.

180
Table 22. Wildlife products and prices in outdoor markets, 2015
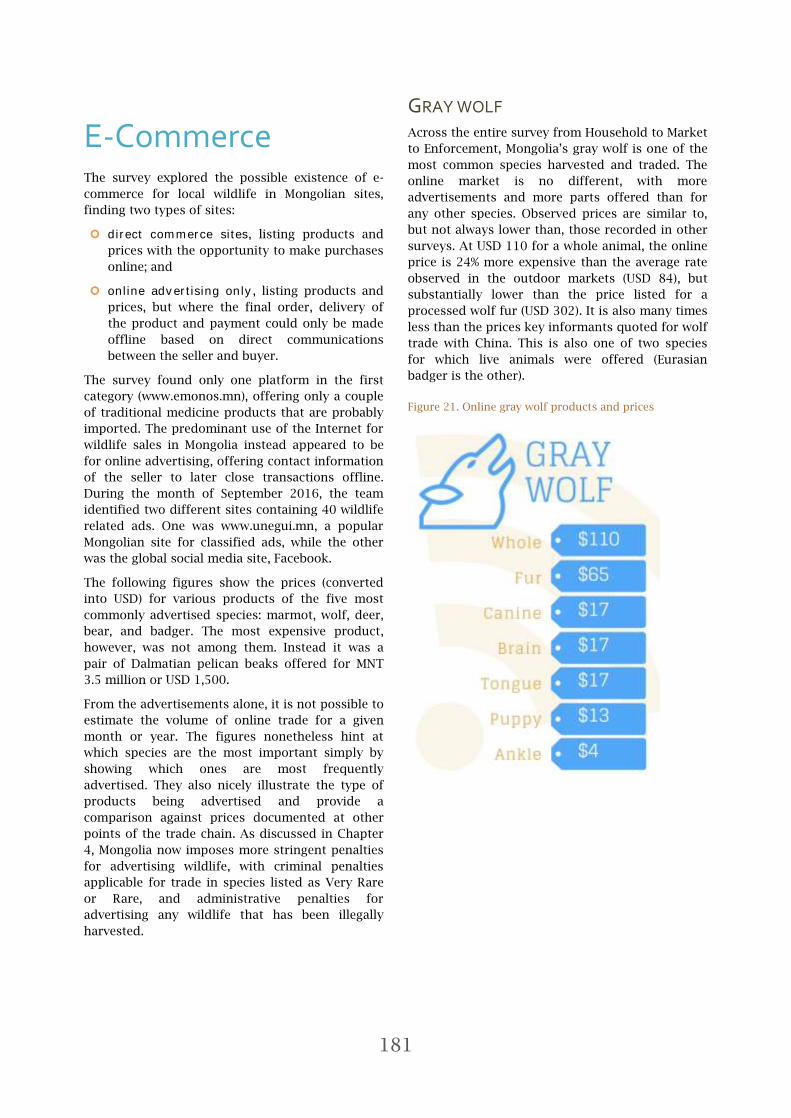
181
E-Commerce The survey explored the possible existence of e-
commerce for local wildlife in Mongolian sites,
finding two types of sites:
direct commerce sites, listing products and
prices with the opportunity to make purchases
online; and
online advertising only, listing products and
prices, but where the final order, delivery of
the product and payment could only be made
offline based on direct communications
between the seller and buyer.
The survey found only one platform in the first
category (www.emonos.mn), offering only a couple
of traditional medicine products that are probably
imported. The predominant use of the Internet for
wildlife sales in Mongolia instead appeared to be
for online advertising, offering contact information
of the seller to later close transactions offline.
During the month of September 2016, the team
identified two different sites containing 40 wildlife
related ads. One was www.unegui.mn, a popular
Mongolian site for classified ads, while the other
was the global social media site, Facebook.
The following figures show the prices (converted
into USD) for various products of the five most
commonly advertised species: marmot, wolf, deer,
bear, and badger. The most expensive product,
however, was not among them. Instead it was a
pair of Dalmatian pelican beaks offered for MNT
3.5 million or USD 1,500.
From the advertisements alone, it is not possible to
estimate the volume of online trade for a given
month or year. The figures nonetheless hint at
which species are the most important simply by
showing which ones are most frequently
advertised. They also nicely illustrate the type of
products being advertised and provide a
comparison against prices documented at other
points of the trade chain. As discussed in Chapter
4, Mongolia now imposes more stringent penalties
for advertising wildlife, with criminal penalties
applicable for trade in species listed as Very Rare
or Rare, and administrative penalties for
advertising any wildlife that has been illegally
harvested.
GRAY WOLF Across the entire survey from Household to Market
to Enforcement, Mongolia’s gray wolf is one of the
most common species harvested and traded. The
online market is no different, with more
advertisements and more parts offered than for
any other species. Observed prices are similar to,
but not always lower than, those recorded in other
surveys. At USD 110 for a whole animal, the online
price is 24% more expensive than the average rate
observed in the outdoor markets (USD 84), but
substantially lower than the price listed for a
processed wolf fur (USD 302). It is also many times
less than the prices key informants quoted for wolf
trade with China. This is also one of two species
for which live animals were offered (Eurasian
badger is the other).
Figure 21. Online gray wolf products and prices

182
MARMOT Marmot was not surprisingly the other most
frequently advertised species. As in the case of the
wolf, marmot had a prominent role across the
survey as one of the top harvested and traded
species. In one instance, a seller offered 300
marmot ankles in a single ad for $5/ankle. The
only other product advertised was for whole
marmot at $17/animal. This price is consistent
with the average price observed in the market
survey and only slightly less than the average price
observed in UB. The Law on Advertisements
prohibits advertising for the sale of “organs or raw
materials” from wild animals that are not legally
harvested, with administrative penalties defined in
the Law on Infringements. However, unless there is
a complete ban on hunting marmot, there is no
way to know whether the ankles, (which
presumably constitute ‘raw materials’) are in fact
being advertised illegally as well.
Figure 22. Online marmot products and prices
RED DEER Red deer ranked among the top ten targeted
species identified in 2005 and appears again in
2015 among the top targeted species. Low levels of
hunter responses, however, have affected the
ability to estimate total take and trade of red deer
in both surveys. Internet trade of red deer,
however, was not known in 2005. Along with the
other primary targets, red deer parts are now
available online. Article 14 of the Law on
Advertisements expressly prohibits advertising for
the ‘supply, trade, and purchase of rare and
endangered species of fauna,’ specifically
identifying red deer antlers, genitals, etc. All of the
products advertised therefore should be illegal.
Internet prices are hard to compare with those
found elsewhere as the units are not standardized.
Whole antlers were offered for USD 110, which is
more than the USD 89 found for reindeer antlers.
Figure 23. Online red deer products and prices
BROWN BEAR Not among the top ten in 2005, Mongolia’s brown
bear is nonetheless among the few species found
in the Internet trade research of this survey.
Population surveys conducted in 1986 estimated 1
bear for every 100 km2, or roughly 500 bears in
total nationwide. Anecdotal information and some
of the survey’s recorded prices suggest that there
may be few left. A set of paws that sold for USD
100 in 2005 is now advertised for USD 750; bear
oil sold for roughly USD 0.90/liter in 2005 and is
now advertised at USD 60/liter. This one
advertisement on the Internet may not be
representative of an entire market, but it is similar
to the average price found in Mongolia’s outdoor
markets of USD 100/liter for bear oil. In either
case, prices for brown bear have effectively
increased 60 to 100 times in the last ten years,
which would be consistent with suspected scarcity.
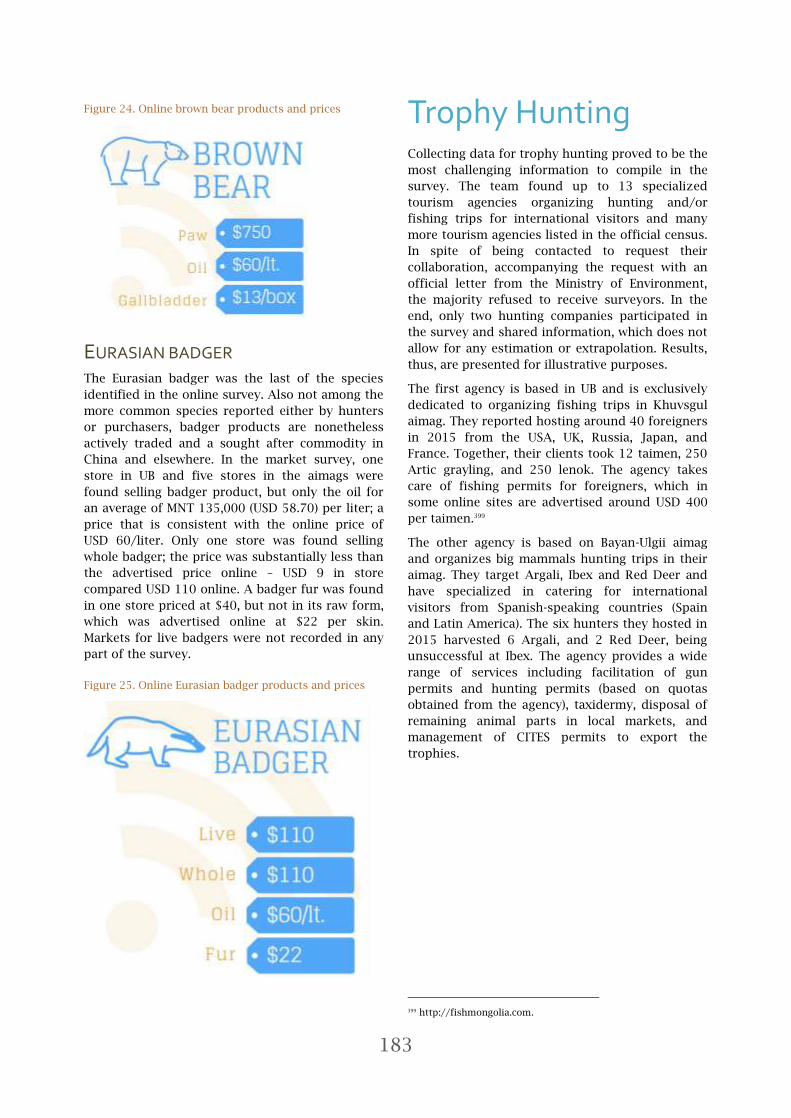
183
Figure 24. Online brown bear products and prices
EURASIAN BADGER The Eurasian badger was the last of the species
identified in the online survey. Also not among the
more common species reported either by hunters
or purchasers, badger products are nonetheless
actively traded and a sought after commodity in
China and elsewhere. In the market survey, one
store in UB and five stores in the aimags were
found selling badger product, but only the oil for
an average of MNT 135,000 (USD 58.70) per liter; a
price that is consistent with the online price of
USD 60/liter. Only one store was found selling
whole badger; the price was substantially less than
the advertised price online – USD 9 in store
compared USD 110 online. A badger fur was found
in one store priced at $40, but not in its raw form,
which was advertised online at $22 per skin.
Markets for live badgers were not recorded in any
part of the survey.
Figure 25. Online Eurasian badger products and prices
Trophy Hunting Collecting data for trophy hunting proved to be the
most challenging information to compile in the
survey. The team found up to 13 specialized
tourism agencies organizing hunting and/or
fishing trips for international visitors and many
more tourism agencies listed in the official census.
In spite of being contacted to request their
collaboration, accompanying the request with an
official letter from the Ministry of Environment,
the majority refused to receive surveyors. In the
end, only two hunting companies participated in
the survey and shared information, which does not
allow for any estimation or extrapolation. Results,
thus, are presented for illustrative purposes.
The first agency is based in UB and is exclusively
dedicated to organizing fishing trips in Khuvsgul
aimag. They reported hosting around 40 foreigners
in 2015 from the USA, UK, Russia, Japan, and
France. Together, their clients took 12 taimen, 250
Artic grayling, and 250 lenok. The agency takes
care of fishing permits for foreigners, which in
some online sites are advertised around USD 400
per taimen.399
The other agency is based on Bayan-Ulgii aimag
and organizes big mammals hunting trips in their
aimag. They target Argali, Ibex and Red Deer and
have specialized in catering for international
visitors from Spanish-speaking countries (Spain
and Latin America). The six hunters they hosted in
2015 harvested 6 Argali, and 2 Red Deer, being
unsuccessful at Ibex. The agency provides a wide
range of services including facilitation of gun
permits and hunting permits (based on quotas
obtained from the agency), taxidermy, disposal of
remaining animal parts in local markets, and
management of CITES permits to export the
trophies.
399 http://fishmongolia.com.
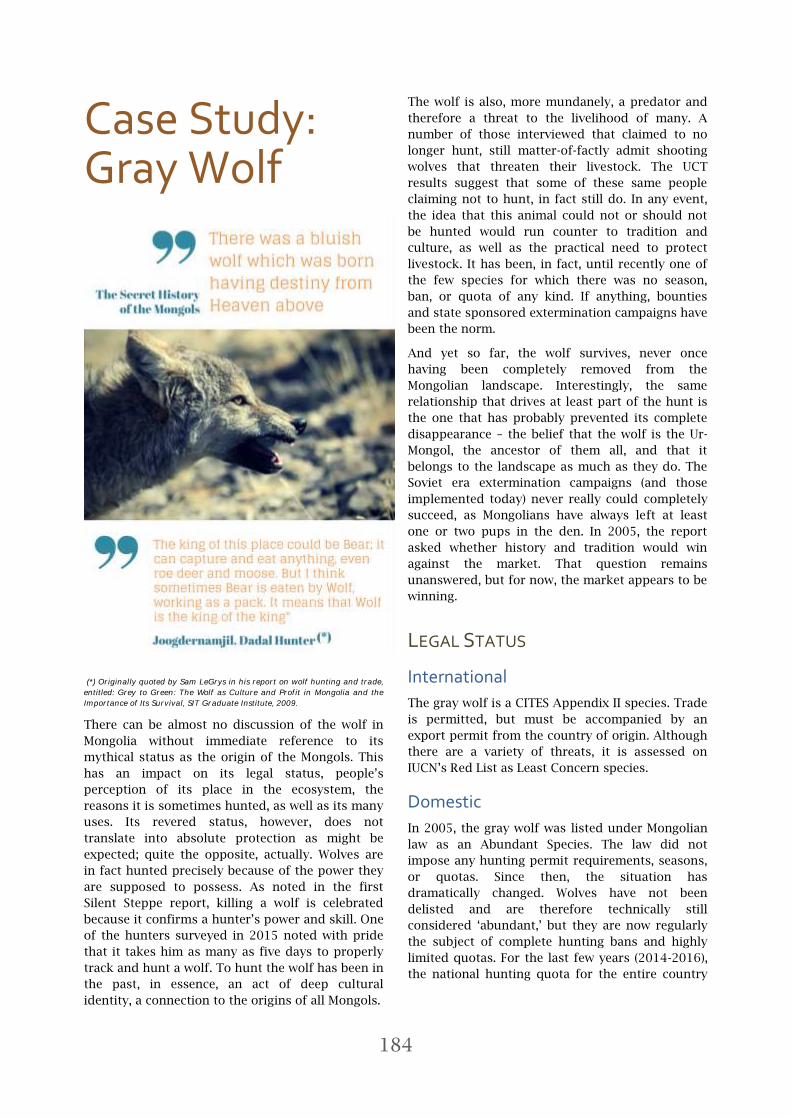
184
Case Study: Gray Wolf
(*) Originally quoted by Sam LeGrys in his report on wolf hunting and trade,
entitled: Grey to Green: The Wolf as Culture and Profit in Mongolia and the
Importance of Its Survival, SIT Graduate Institute, 2009.
There can be almost no discussion of the wolf in
Mongolia without immediate reference to its
mythical status as the origin of the Mongols. This
has an impact on its legal status, people’s
perception of its place in the ecosystem, the
reasons it is sometimes hunted, as well as its many
uses. Its revered status, however, does not
translate into absolute protection as might be
expected; quite the opposite, actually. Wolves are
in fact hunted precisely because of the power they
are supposed to possess. As noted in the first
Silent Steppe report, killing a wolf is celebrated
because it confirms a hunter’s power and skill. One
of the hunters surveyed in 2015 noted with pride
that it takes him as many as five days to properly
track and hunt a wolf. To hunt the wolf has been in
the past, in essence, an act of deep cultural
identity, a connection to the origins of all Mongols.
The wolf is also, more mundanely, a predator and
therefore a threat to the livelihood of many. A
number of those interviewed that claimed to no
longer hunt, still matter-of-factly admit shooting
wolves that threaten their livestock. The UCT
results suggest that some of these same people
claiming not to hunt, in fact still do. In any event,
the idea that this animal could not or should not
be hunted would run counter to tradition and
culture, as well as the practical need to protect
livestock. It has been, in fact, until recently one of
the few species for which there was no season,
ban, or quota of any kind. If anything, bounties
and state sponsored extermination campaigns have
been the norm.
And yet so far, the wolf survives, never once
having been completely removed from the
Mongolian landscape. Interestingly, the same
relationship that drives at least part of the hunt is
the one that has probably prevented its complete
disappearance – the belief that the wolf is the Ur-
Mongol, the ancestor of them all, and that it
belongs to the landscape as much as they do. The
Soviet era extermination campaigns (and those
implemented today) never really could completely
succeed, as Mongolians have always left at least
one or two pups in the den. In 2005, the report
asked whether history and tradition would win
against the market. That question remains
unanswered, but for now, the market appears to be
winning.
LEGAL STATUS
International
The gray wolf is a CITES Appendix II species. Trade
is permitted, but must be accompanied by an
export permit from the country of origin. Although
there are a variety of threats, it is assessed on
IUCN’s Red List as Least Concern species.
Domestic
In 2005, the gray wolf was listed under Mongolian
law as an Abundant Species. The law did not
impose any hunting permit requirements, seasons,
or quotas. Since then, the situation has
dramatically changed. Wolves have not been
delisted and are therefore technically still
considered ‘abundant,’ but they are now regularly
the subject of complete hunting bans and highly
limited quotas. For the last few years (2014-2016),
the national hunting quota for the entire country
185
has been set at just 20 specimens. 400 Complete
hunting bans have also been in place in multiple
locations beginning in 2010, although no
nationwide ban has yet been instituted.401
DISTRIBUTION AND POPULATION Historically, wolves were one of the most widely
distributed mammals, found virtually everywhere
north of 15°N latitude. Today, populations can be
found in more than 60 northern countries and, as a
whole, the species does not meet the criteria for
listing as a threatened species. There are,
nonetheless, populations that are particularly
threatened and that have been separately listed as
endangered, e.g., the Western-Central Alps
population.
There are few published surveys of gray wolf
populations in Mongolia. In 1980, the Mongolian
Academy of Sciences estimated a population of
30,000 specimens. In 2004, Mech and Boitani
suggested there may be as few as 10,000. The 2005
survey, using population densities observed in
Alaska, hypothesized that there could be as many
as 20,000 to 30,000. The most that can be said is
that they occur throughout the territory and that
all indications are that their numbers are much
reduced over prior years. Maps of range and
distribution created by Mongolian biologists in the
1970s were highly generalized depicting effectively
uniform distribution across the entire territory
with no indication of population levels. Experts
suspect, however, that the officially sanctioned and
decades-long extermination campaigns and
bounties contributed to significant population
fluctuations. Concerns over declines eventually
lead to a complete hunting ban from 1976 to 1980.
In 2015, despite renewed efforts to ban hunting
and trade, there is reason to believe that wolf
population may again be low enough to warrant
serious attention.
Running counter to these estimates is the
entrenched perception that wolves have increased
in some areas and are responsible for observed
declines in prey species, for example ibex
populations in the Gobi Gurvan Saikhan National
Park.402 This opinion was present during the 2005
survey at a time when trade levels were certainly
400 Cabinet Ministry Resolutions, No. 122, 2014, No. 377, 2014, and No. 463, 2015.
401 See for example Ministry of Environment Resolution, No. 411, 2009 prohibiting the hunting of wolves for a period of two years in several soums within 3 aimags, Khentii (12 soums), Dornod (7 soums), and Sukhbaatar (12 soums). This ban was continued in 2012 for another two years by Ministry of Environment Resolution, A-06, 2012.
402 Key informant interview – local ranger.
high, even if not perfectly quantifiable. These
observational opinions of reduced prey
populations, or that of prey switching behavior by
wolves as an indicator of a healthy, if not, growing
wolf population, contradicts persistently low
documented population levels of wolves in
Mongolia.
Without studies to confirm these claims, however,
perceived increases are still being combatted with
wolf hunts, even in protected areas. In Umnugobi
aimag, for example, local protected area
authorities were planning to cull wolves in an
effort to increase Ibex and Argali populations. In
another aimag, the governor announced a wolf
hunting campaign. And in yet another instance, a
wolf hunting campaign was organized and named
after a parliament member.
TAKE
History of Take
According to the research conducted during the
first Silent Steppe report, Mongolia had official
programs to control wolf numbers since the 1920s;
official harvests were in excess of 5,300 per
annum, and a peak harvest of 18,000 was recorded
in 1933.
The 2005 report was unable to make an accurate
estimate of the number of wolves hunted due to
the apparent inflation in self-reported take levels.
It was, nonetheless, the second most targeted
species (40% of all hunters; or 321 of 949 hunter
respondents) after the Siberian marmot with 675
of 949 respondents claiming to hunt the species.
Estimating Current Take
Despite bans and quotas, the wolf was the second
most targeted mammal after the marmot in 2015,
although all of the numbers are now much lower
than those captured in 2005. Of the 91 hunters
that responded to the survey, just over 20% (19)
claimed to hunt wolves, for a nationwide estimate
of 44,000 hunters (based on UCT results). The
combined take of the survey respondents came to
47, or 2.5 per hunter. This compares to 40% of
hunters claiming to hunt wolves in 2005 with a
mean of 3.4 animals harvested per hunter. Total
estimates of take in 2005 were considered
questionable, however, as there appeared to be
significant inflation of the annual offtake numbers.
Very rough estimates of 20,000 to 30,000 were
calculated, with a potential market value of USD 7
million.

186
The ability to accurately estimate total take from
the 2016 survey is hindered not by hunters
overstating their activity, but by the opposite; a
deliberate reluctance to discuss hunting activity. If
anything, the current estimates of hunter
prevalence and levels of take probably
underrepresent reality. Offtake for wolves,
however, still appears to be high compared to
population estimates. Based only on the direct
responses to the survey, 21% of the hunter
respondents hunt wolves. Extrapolated out to the
estimated total population of hunters, there may
be as many as 21,000 wolf hunters. The average
take per hunter dropped 32% in 2015, estimated at
2.5 compared to 3.4 in 2005.
Even with these reductions, estimated take levels
still far exceed quotas by many orders of
magnitude and are still likely too high in the case
of wolves given the available population estimates.
Estimated national take in 2015 for wolves comes
to 45,000, which is at odds with total population
estimates of between 10,000-20,000. That two
separate surveys obtained similarly inflated take
levels, however, is at least an indicator of the
prevalence of this kind of hunting, if not an
accurate estimate of offtake. It also highlights the
need for detailed wolf population studies to
identify scientifically sound off-take levels. The
current 20 per year quota is certainly being
exceeded by hunters and probably by as much as
1,000 times the permitted amount.
Take Methods and Patterns
Although the species occurs throughout Mongolia,
geographical and seasonal patterns associated with
wolf hunting as documented in the survey are
uneven, likely a function of several factors
including bans, trading opportunities, and possibly
the presence/absence of the species in a given
area.
Regions where surveyors confirmed wolf as a
primary target include:
Selenge Sukhbaatar Dornod
Khovd Uvs403
Interestingly, the first three aimags mentioned
have been the same aimags with bans in place for
the past several years. As the bans only covered
part of their territories, it may be that the bans in
those areas are being respected. However, in those
with no bans in place, surveyors were told that
403 Surveyor debriefings.
almost every family hunts wolf. This does not
mean that every family actually takes a wolf every
year. Based on the overall estimates compared to
the estimates from 2005, there does seem to be a
decline in hunting for this species.
Not only do the take numbers suggest this, but
also those interviewed related stories that
indicated less opportunity and, therefore the
dedication of less time to hunting. One hunter,
typical of many, described a more active hunting
life seven to ten years ago, but that has since
transitioned to use of his gun solely for livestock
protection.
TRADE Despite the hunting limits and bans in eastern
aimags, this survey again suggests that the gray
wolf is still being harvested and traded in
significant numbers both domestically and
internationally.
Domestic Market
Even if there are no exact population and take
figures to document declines, the market suggests
this is the case. Since 2005, prices for wolf pelts on
the domestic and international markets have
increased roughly 47%. In 2005, the highest price
recorded for a wolf pelt was USD 150, and lesser
quality pelts at USD 50. In 2015, the high prices
were as much as USD 302 (MNT 695,000) and the
lower prices around USD 87 (MNT 200,000).
Surveyors were offered in the State Department
Store the price of USD 157 (MNT 360,000) for a
single pelt and a discounted price of USD 139
(MNT 320,000) if purchased in large quantities. In
Umnugobi and Dornod aimags, prices were roughly
USD 152 (MNT 350,000).
Other parts of the wolf are used and sold separate
from the skin. In domestic markets and shops
throughout Mongolia, wolf canine jewelry and
pendants, associated with mysticism and power,
can be found in a majority of shops.404 Prices vary
substantially based principally on the adornment
as opposed to the canine; although size plays a
role in pricing. Ankles are also a popular trade
item selling for as much as USD 11 (MNT 25,000).
Used for religious and medicinal purposes,
virtually all parts of the wolf are consumed
including meat, lung, tongue, kidney, spleen,
stomach and bones. Including all parts, one gray 404
Although there is a small chance that some of these canine
teeth were from dogs as well, it is safe to assume many tooth pendants were effectively from wolves, as per shop owners appreciation.

187
wolf might be worth as much as USD 400-450 on
the domestic market in 2015, roughly 30%-40%
more than in 2005.405
International Trade
The international market seems to be a primary
driver. Since the country joined CITES, which
classifies wolf among the non-restricted for trade
in Appendix II, export permits associated with gray
wolf have been at the top of the ranking (totaling
290 CITES export permits over the total 987
permits issued for the period 1996-2015). This
represents 29% of total permits for legal wildlife
trade and as discussed in Chapter 3, included
1,904 skins, 317 specimens, and 309 trophies as
the top trade categories.
The primary international trade partner for wolves
has not changed since 2005. China dominates the
market almost entirely, offering prices not
reported on the border with Russia. According to
those interviewed, wolves are the ‘most useful
species on the border,’ during Tsagaan Sar, the
Mongolia New Year celebration that falls close to
but does not overlap with the Chinese New Year.
Combined with the CITES permitted trade and the
stories of officials of it being highly traded at the
border with China, it is safe to say that the quota is
not respected and that many more than 20 wolves
are hunted each year.
Traded either whole or by parts, wolves are also
sometimes traded in bulk, suggesting not just
some trade, but a booming market. Across the
border in China, interviewees related a standard
price of USD 295 (CNY 2,000; or MNT 678,500) for
a single wolf. Others said, however, that “f wolf can
enter Chinese border, it’s purchased at such a high
price,” in apparent exuberance at the market. In
one instance, the price of a whole wolf was
estimated at between 15-20 thousand yuan (USD
2,215 to USD 2,954). A high quality pelt goes for a
more sober price of 1,500 yuan (USD 221); and a
wolf ankle, 300 yuan (USD 44).
Enforcement
At the domestic level, enforcement could be
improved. Wolf pelts, anklebones, and canines are
all openly traded in virtually all shops. The
quantities observed just in the State Department
Store easily exceeded the annual limit of 20
animals. Image 5 is a cropped version of a photo
taken by surveyors at the State Department Store
in 2016. There are more than 15 wolf pelts visible
405 Silent Steppe I: “One gray wolf is thus worth as much as US$ 300 to US$ 350 on the market in Mongolia.”
in the original photo and it still only shows a small
portion of the pelts actually on display. Staff were
initially a little guarded in their responses to
informal inquiries, but eventually shared their
ability to obtain wolf pelts on demand and did not
seem concerned about limits.
The openness of this trade compared to the
obvious reluctance of hunters makes it clear that
enforcement, to the extent it exists, is focused
more at the resource exploitation stage (e.g. wolf
hunting) of the trade chain. Despite improvements
to the law to specifically cover other areas of the
trade chain (i.e., transportation, storage, sale, etc.),
the openness suggests there is still not enough
focus on domestic markets themselves.
There is, nonetheless, some enforcement evident at
the international border. As an example, a large
seizure of more than 140 wolves, often given
whole and frozen as gifts in China, was made near
the Mongolian border in February 2016;406 a seizure
that was seven times greater than the annual
nationwide quota. Data from Customs and Police
indicate that wolf has been for several years one of
the top items seized.
Across the border in China is a similar picture.
Among the seizures that have reportedly occurred
there:
30-40 wolf furs
300 wolf ankle bones (equal to 75 wolves)
200-300 wolf carcasses (seized in Baita
port)
In other words, the illegal trade volume of just
three seizures (that made it past Mongolia’s
Customs into China), is 20 times the annual quota.
Recorded prices and levels of trade both indicate
the difficulty in reducing hunting and curbing
demand. Smaller wolf products are easily hidden
and smuggled across the border with apparent
ease. Wolf canines, for example, are simply put
into garbage black bags. Whole carcasses have
been found hidden in wheels, and other
compartments large enough to hold a wolf.
406 China Police Seize 148 Wolf Skins and Carcasses on the Border, Daily Mail UK.

188
Case Study: Marmot
In Sukhbaatar, the practice of making items from
locally sourced marmot skins has significantly
decreased. We now bring industrial goods from
Ulaanbaatar to sell.
The first Silent Steppe report included an extensive
case study on marmots for several reasons, but
primarily because it was the centerpiece of
Mongolia’s wildlife take and trade at the time.
Although harvest and sales now appear to be
lower, it is still the preferred species and to this
extent warrants continued attention. This case
study repeats some of the information from the
first report, as it still remains valid today.
Both species that occur in Mongolia, M. baibacina
(Altai marmot) and M. sibirica (Siberian marmot)
are a traditional source of protein, medicine, and
fur, with annual fur trade exceeding 1.2 million
skins on average since the late 1800s. Harvest
volumes were estimated at 1-1.5 million in 1999,
over 3 million in 2004 by the first Silent Steppe
survey, and as much 850,000 in 2015 by this
survey.
The most common of the two species is the
Siberian marmot, inhabiting Mongolia’s vast steppe
and grasslands stretching from the far eastern
steppe to the Altai mountains of the west. The
Altai marmot’s range in Mongolia extends from the
Altai to the west, an area that was only partially
surveyed in the 2005 and 2015 surveys. The
results for this species are therefore based on
relatively few observations compared to Siberian
marmot. That said, the Altai marmot is still among
the top species targeted and many of the issues
discussed with respect to Siberian marmot are
likely applicable to the Altai marmot.
LEGAL STATUS
International
In 2005, neither Siberian nor Altai marmot
conservation was regulated by international, multi-
lateral or bi-lateral agreements. The IUCN Red List
(1996) classified both as Lower Risk/Least
Concern. The Siberian marmot has since been
relisted as Endangered based on documented
declines of greater than 50% over the past three
generations caused by overexploitation. The Altai
marmot is still listed as Least Concern and its
population trend is unknown.
National
Prior to 2005, Mongolia’s hunting law allowed
hunting of Siberian and Altai marmots from
August 10 to October 16. Each hunter was allowed
take three marmots. Beginning in 1999, but more
seriously in 2005, marmots have been the subject
of successive hunting bans and other regulatory
efforts, examples include bans from:
2005-2008 – nationwide ban
2010-2011 – nationwide ban407
2012-2013 – nationwide ban408
DISTRIBUTION AND POPULATION Occurring between the elevations of 600-3,000
meters above sea level, the Siberian marmot
occupies Mongolia’s open grasslands, alpine
meadows, pastures, and forest edges (Nowak
1999). Historically, its range extended from the
edge of the northern taiga forest regions south
through Mongolia’s steppe to the edge of the Gobi
desert; from the base of the Nomrog mountains in
the east to the Altai mountains in the west.409 The
Altai marmot resides in high elevation alpine
meadows. It may be found in the northern
Mongolian Altai, and along the same mountain
range in southwestern Siberia, eastern Kazakhstan,
Kyrgyzstan, and Sinkiang.410
407 Байгаль Орчин, Аялал Жуулчлалын Сайдын Тушаал, 411, December
2009.
408 Монгол Улсын Байгаль Орчин, Аялал Жуулчлалын Сайдын Тушаал Агнуурын Зарим Амьтныг Агнах Барихыг Хориглох, Ан Амьтны Хууль Бус Агналт, Ашиглалтад Тавих Хяналтыг Чангатгах Тухай, A-06, 2012. 409 Adiya, 2000.
410 Nowak 1999; Adiya 2000.

189
Recent reports and anecdotal information suggest
that both populations have disappeared from
many areas where they were once numerous. In the
1970s, range and distribution were believed to
cover approximately 68% of Mongolia’s territory, or
roughly 1.07 million km2. In 2002, studies
conducted in the eastern steppe region estimated a
substantially reduced distribution over much of
the territory,411 with only 5% of existing burrows
active and perhaps as few as 159,000 remaining in
the region, including Dornod, Sukhbaatar and
Khentii aimags.412 Surveys undertaken from 2007-
2009413 estimated the total marmot population size
in Mongolia at eight million with 88% (7 million) of
the total being Siberian marmot and the remaining
12% (930,000), Altai marmot. According to this
same report, this estimated 8 million is just one-
third the maximum population (est. 21 million)
that Mongolia’s environment might support under
optimal conditions.414
The primary factor suspected of causing
population declines for both species is hunting,
including the direct impact of the total number
hunted as well as the secondary impacts caused by
hunting methods and seasons.
TAKE
History of Take
Exported almost exclusively to Russia from the
1920s to 1991, the 2005 survey documented the
bulk of marmot fur trade flowing south to China,
with a small percentage heading to Russia.
Harvests in excess of 2 million animals happened
on several occasions since records were kept
(1906-1910, 1927, 1929, and 1946-1954), with a
record high of 3.2 million animals taken in 1910. In
1999, the Eastern Steppe Biodiversity Project
estimated total harvest volumes between 1 and 1.5
million animals.
The first Silent Steppe study estimated 2004
harvest levels at between 3 and 4 million, with
mean harvest levels of Siberian marmot 54 per
hunter and 46 per hunter for Altai marmots.
411 Batbold 2002.
412 Townsend S.E. & Zahler P. 2006. Marmots in the Eastern Steppe: Evidence of a severe decline. Mongolian Journal of Biological Sciences 4: 37-44.
413 Y. Adiya and O. Brandler (2011). Status of Marmot Populations in Mongolia, Steppe Bulletin, No. 31, Winter 2011.
414 Mongolia Mammals Red List.
Estimating Current Take
Looking only at the number of hunters targeting a
given species, Siberian marmot remains the most
targeted species of all mammals hunted in
Mongolia. In 2005, 60% (or n=675 hunters) of those
surveyed indicated that they hunt marmot. In
2015, of the hunters questioned in the wildlife
trade survey, 44 (of 91) or 49% said they hunt
marmot. Based solely on direct responses, this
translates into at least 21,000 hunters nationwide.
Corrected using the UCT results, the total number
of marmot hunters may be as many as 120,000.
This constitutes a drop of 13%, which is the
smallest reduction in hunter numbers of any
species assessed in the survey. For all other
species, the estimated number of active hunters
has been reduced anywhere from 23% (Corsac fox)
to 87% (Red fox).
After removing outliers, the aggregate number of
animals taken by those self-reporting in the survey
was 309; averaging 7 per hunter for Siberian
marmot and 10 per hunter for Altai marmot. Their
individual take is a substantial drop (70-80%)
compared to 2005 estimates, which were 24 and 47
respectively. These per hunter take levels still
make them the first and third most targeted
mammals. As a function of total take, their
position is similar to 2005, with Siberian marmot
total harvest estimated at roughly 850,000 (using
the UCT results) and at 82,000 for Altai marmot,
the first and fourth most harvested species
respectively (see Table 5, pg. 148).
This dramatic decrease is consistent with seizure
data that report volumes in the hundreds of
specimens, compared to thousands and tens of
thousands a decade ago. In 2003, for example, just
two seizures of marmots destined for China
contained more than 37,000 skins. In 2005,
authorities had already seized 26,000 skins before
the end of August; a few months after marmots
emerge from hibernation, but still a full month
before legal hunting would start. Seizures in the
past few years are barely a fraction of the prior
levels. The EcoCrimes Division of the Police, for
example, reports seizures of just 1,152 (in 2013)
and 5,181 (in 2014) for the entire year. Customs
reports similarly small numbers for the period
2014 to 2016, when only one seizure of 74 skins
was reported as a criminal incident.
Seasons
Siberian and Altai marmot hunting is permitted by
the Law on Fauna from late summer through the
fall. According to the self-reporting of hunters
190
interviewed, both species are taken during three
seasons of the year. Siberian marmot is taken
Spring, Summer and Fall. Altai marmot was
recorded for Summer, Fall, and early winter before
hibernation – suggesting that the purpose of the
hunt was not for fur trade (which would mean
Spring hunting), but for food and medicinal
purposes.
In the first Silent Steppe report, some hunters
reported a preference for spring hunting because
the fur is denser at that time and can be sold for
more. This preference has not been independently
confirmed either in the 2005 or the current survey.
It is certain, however, that marmots are easier to
hunt in the spring when they spend more time out
of their dens feeding compared to later in the
season.
TRADE As predicted in 2005, the bans have not completely
stopped trade. Hunters continue to target the
species without licenses and trade remains
reasonably visible. While the hunting and trade
numbers appear to have dropped significantly, this
has probably not happened solely due to increased
enforcement. Trade, even at reduced levels, was
still surprisingly common and evident to surveyors
without significant effort. Surveyors found
marmot, for example, being offered in places as
accessible as the front of the State Department
Store. A more likely explanation is that marmot
populations have suffered substantial decreases,
and with official reports and anecdotal information
indicating that they are essentially absent from the
landscape in many areas that they occupied only
10 to 20 years ago.
Domestic Market
The results of the survey documenting the
domestic market bare witness to the increased
enforcement environment and growing scarcity of
the resource. According to the 2005 results, close
to 30% of Mongolians older than 15 years
(n=445,000 in 2005) used some form of marmot
product on a regular basis. The primary use for the
majority was meat (85%, 370,000 people); followed
by marmot oil (5%), kidney (3%), lung and stomach
at 1% each. Most of this product was obtained
either through hunting or on the local market. Just
25% (110,000) obtained marmot product from
hunter friends and relatives. On average,
consumers spent US$ 25 annually for marmot,
with an estimated annual domestic trade value of
US$ 4 million.
In 2015, the self-reported uses remain essentially
the same, but self-reported sales have dropped
from the 25% in 2005 to just 4% in 2015. Likely, a
portion of this observed decrease is a result of
respondent reluctance. Just as likely, however,
some of the reduction is due to a dwindling
resource.
As with results obtained for all species, other
sources, including online sales and self-reported
purchases, tell a different story. Marmot, for
example, was one of the most frequently
advertised species in online markets. In one
instance, a seller offered 300 marmot ankles in a
single ad for $5/ankle (MNT 11,500). The only
other product advertised was for whole marmot at
$17/animal (MNT 39,100). The whole marmot price
is consistent with the average price observed in the
market survey in some areas (e.g., Khentii and
Dornod aimags), and a little more than the average
price observed in UB (MNT 34,940). The Law on
Advertisements prohibits advertising for the sale
of “organs or raw materials” from wild animals
that are not legally harvested, with administrative
penalties defined in the Law on Infringements.
However, unless there is a complete ban on
hunting marmot, there is no way to know whether
the ankles and whole marmots offered (which
presumably constitute ‘raw materials’) are in fact
being advertised illegally as well.
For Siberian marmot, the survey captured 653
price observations across the country with an
average price close to MNT 32,000 (equivalent to
USD 14) and a highly variable price range starting
at a low of MNT 7,000 and a high of MNT 70,000
per marmot. The high variability in prices appears
to be associated with multiple factors including:
i) seasonality,
ii) weight of the animal,
iii) whether the meat is purchased raw or
prepared,
iv) the number of intermediaries involved,
and
v) location.
Table 23 lists the price observations by aimag for
the 14 aimags that were targeted during the
market surveys. The majority of these observations
come from Ulaanbaatar (41%; n=268 of 653), with
the next highest number of observations from
Bayankhongor (10%; n=68), Uvurkhangai (9%;
n=62), and Zavkhan (8%; n=53). In Dornod, only six
observations of marmot sales were made, despite
being an area with historically strong marmot
populations and well-documented trade. Surveyors
suspected that marmot dealers were present in all
of the black markets, but especially in the central

191
black market of the city. They found no stores that
specialized in the sale of marmots or marmot
products.
Table 23. Geographical distribution of observed sales of
marmot
Geographical distribution
of observed marmot sales
No. Sold % Ulaanbaatar 268 41%
Bayankhongor 68 10%
Uvurkhangai 62 9%
Zavkhan 53 8%
Govi-Altai 47 7%
Khentii 40 6%
Arkhangai 39 6%
Khovd 27 4%
Khuvsgul 15 2%
Darkhan-Uul 13 2%
Uvs 9 1%
Dornod 6 1%
Umnugobi 5 1%
Tuv 1 0%
As for pricing, in general there is an observable
increase in soum and aimag centers. Prices were
highest in Khentii aimag (MNT 44,375), Dornod
(MNT 40,000) and UB (39,940), coinciding with
areas of documented scarcity and continuing
demand. Outside these areas and the capital, the
average price is closer to MNT 25,000, starting as
low as MNT 7,000. This variability and range in
prices was also confirmed by qualitative data
collected from informants.
The increase in price is also a strong indicator of a
resource that is becoming scarcer, although
enforcement risk may factor in as well. The only
places with prices similar to or below 2005 prices
are in the west and likely apply to Altai marmot.
The remaining areas registered prices anywhere
from 200% to 400% higher than they were ten years
ago.
In general, the vast differences in prices between
regions and seasons make an accurate estimate of
the total sales values difficult. The averages
calculated in this survey are just above MNT
30,000, but in certain areas can be as low as MNT
10,000 (Uvs aimag) and as high as MNT 45,000
(Khentii aimag). Using an average figure of USD 14
per marmot, the 15,431 marmots estimated as
total annual take for Mongolia would result in an
aggregated national household income of around
USD 216,000.
Table 24. Geographical distribution of observed sales of
marmot
Regional and National Price Averages
for Marmot Meat in (MNT)
Khentii 44,375 National
average Dornod 40,000
Ulaanbaatar 34,940 30,795
Darkhan-Uul 30,000
Bayankhongor 27,941
Arkhangai 27,436
Uvurkhangai 25,161
Tov 25,000
Zavkhan 23,679
Umnugobi 20,000
Govi-Altai 16,511
Khuvsgul 15,667
Khovd 15,000
Uvs 10,000
All indications from the market survey are that
marmot populations have significantly decreased.
During debriefing sessions, surveyors reported
that marmots were so rare in Sukhbaatar and
Dornod provinces that sales of any kind were a
surprise. Surveyors were directly told that there
are few marmots remaining in the northern parts
of Dornod, but speculators still actively sell them.
They met only one speculator who quoted a
common price for a Siberian marmot of MNT
40,000, consistent with the prices otherwise
independently observed. Similarly attesting to
scarcity, surveyors were also informed that
marmots supposedly coming from Khentii aimag
were likely trafficked from outside the region. In
Sukhbaatar, the former practice of making items
from locally sourced marmot skins has
significantly decreased. Local residents stated that
“we now bring industrial goods from Ulaanbaatar
to sell.” It was not known where any of the
marmots observed in the market came from.
And yet trade continues driven by local and
international demand. Despite the scarcity, key
informants indicated that dealers are still
interested in both skins and furs.

192
Enforcement
Other than the records of seizures already
reported on, little information was available to
surveyors and researchers concerning
enforcement. The only direct comment concerning
enforcement specific to this species was offered by
a ranger who stated that “marmot poaching has a
legal sentence twice the penalty charged for fraud.
But the penalty is so hard to pay given low
earnings in the countryside that the law is not
implemented.”

193
Bibliography Actman, Jani. Four Tons of ‘Plastic’ Discovered to Be Smuggled Pangolin Scales. (Jun. 26, 2016). In National Geographic: Wildlife Watch. http://news.nationalgeographic.com.
Block, B. Illegal Pangolin Trade Threatens Rare Species. WorldWatch Institute. (2017). Eye on Earth online news service.
China Daily, Fur Farming Industry, (Aug. 20, 2016) http://www.chinadaily.com.cn/business/2015-08/20/content_21659731.htm.
Chimed-Ochir B., Hertzman T., Batsaikhan N., Batbold D., Santjmyatav ., Onon Yo, and Munhchuluun B. WWF Mongolia Report 2010: Filling the Gaps to Protect the Biodiversity of Mongolia. (2010). WWF Mongolia Programme Office.
Chow, A., Cheung, S. and Yip, P. (n.d.). Wildlife Markets in South China. (Spring 2014). Human-Wildlife Interactions 8(1), 108-112. How CITES Works. CITES. https://cites.org.
CITES Trade Database (https://trade.cites.org)
Clark, Emma L. and Munkhbat, J., Dulamtseren, S., Baillie, J. E. M., Batsaikhan, N., King, S. R. B., Samiya, R., and Stubbe, M. (compilers and editors). (2006). Summary Conservation Action Plan for Mongolian Mammals. London: Zoological Society of London.
Conniff, R. (2016). Chinese Investors Are Driving the Slaughter of Rhinos. TakePart. Available at www.takepart.com. Convention on International Trade in Endangered Species of Wild Fauna and Flora. Programme for the Conservation and Sustainable Use of Falco Cherrug in Mongolia. Twenty-fifth meeting of the Animals Committee. Geneva, Switzerland. (18-22 July 2011). COP17, CITES COP17 Proposals https://cites.org. Coutts, E. and Jann, B. (2008). Sensitive Questions in Online Surveys: Experimental Results for the Randomized Response Technique (RRT) and the Unmatched Count Technique (UCT). ETH Zurich Sociology Working Paper, No. 3.
Decision 15/2: African Common Strategy on Combating Illegal Trade in Wild Fauna and Flora. available at http://web.unep.org.
Dixon, A., Nyambayar, B. Purev-Ochir, G., and Fox, N. (2011). Developing a Sustainable Harvest of Saker Falcons (Falco Cherrug) for Falconry in Mongolia. Environment Agency, Abu-Dhabi and Mongolian Ministry of Nature, Environment, and Tourism.
Dizikes, Peter. (Dec. 16, 2013). The Surprising Story of Mongolian Shamanism. MIT News Office. http://news.mit.edu. Donegan, John. (Nov. 2013). Traditional Medicine in Mongolia: Contrast and Continuity. The Acupuncturist, 8-9. Available at http://thepindoctor.blogspot.com. Drews, Carlos. (2001). Wild Animals and Other Pets Kept in Costa Rican Households: Incidence, Species, and Numbers. Society and Animals, 9:2. Koninklijke Brill NV: Leiden. Droitcour, J., R. A. Caspar, M. L. Hubbard, T. L. Parsley, W. Visscher, and T. M. Ezzati. P. P. Biemer, R. M. Groves, L. E. Lyberg, N. A. Mathiowetz, and S. Sudman, editors. (1991). The item count technique as a method of indirect questioning: a review of its development and a case study application. In Measurement errors in surveys, 185–210. John Wiley: New York. Duffy, Rosaleen & Dr. St. John, Freya. (Jun. 2013). Poverty, Poaching and Trafficking: What are the links? Evidence on Demand, 3. Enterprise Surveys 2013, available at http://www.enterprisesurveys.org/data/exploreeconomies/2013/mongolia European Commission, The EU Approach to Combat Wildlife Trafficking, http://ec.europa.eu Farmed Fur, Int ’ l Fur Trade Fed ’ n, ; We Are Fur, Fur Farming, www.wearefur.com. Fernquest, Jon. (March 5, 2013). Rhino Horn Smuggling: Caught on Suvarnabhumi Video. Bangkok Post. Available at www.bangkokpost.com. Fijn, Natasha. (Apr. 2011). Living with Herds: Human-Animal Coexistence in Mongolia: The Domestic and the Wild. Cambridge University Press, 213. Foley, K., Stengel, C., & Shepherd, C. (2011). Pills, Powders, Vials, and Flakes: The Bear /Bile Trade in Asia. TRAFFIC Southeast Asia Report.
194
Glanfield, Emma. (Mar. 27, 2014). Poaching Gang Caught Slicing Off Frogs' Legs and Selling Them To French Chefs on the Black Market. DailyMail UK. http://www.dailymail.co.uk. Glynn, A.N. (2013). What can we learn with statistical truth serum? Design and analysis of the list experiment. Public Opin. Quart., 77(S1), 159-172. Gratwicke, Brian, Mills, Judy, Dutton, Adam, Gabriel, Grace, Long, Barney, Seidensticker, John, Wright, Belinda, You, Wang and Zhang, Li. (July 2, 2008). Attitudes Toward Consumption and Conservation of Tigers in China. Plos One, 3(7). Haken, Jeremy. (February 2011). Transnational Crime in the Developing World. Global Financial Integrity 11. http://www.gfintegrity.org. Harper, Jennifer. (May 2015). $60K a Pound: Illegal Rhino Horn Now Declared More Valuable than Gold, Diamonds, and Cocaine. Washington Times. Hastie, Jo and Tania McCrea-Steele. (2014). Wanted- Dead or Alive: Exposing Online Wildlife Trade. International Fund for Animal Welfare. Hinsley, A., Nuno, A., Ridout, M., St John, F., and Roberts, D. (Oct 2016). Estimating the Extent of CITES Noncompliance among Traders and End-Consumers: Lessons from the Global Orchid Trade. Conservation Letters, 00(0). 1–8. IUCN Red List, www.iucnredlist.org. Jagodinski G. 2001. “Region 3 News. e Federal Wildlife Officer.” Federal Wildlife Officers Associa- tion, Inc. 15 (1) (Winter). Jenkins, Anna, Neil Bridgland, Rachel Hembery, Ulrich Malessa, James Hewitt, and Chen Hin Keong. Chatham House Workshop: Tackling the Trade in Illegal Precious Woods. April 23-24, 2012. Background Paper 1: “Precious Woods: Exploitation of the Finest Timber.” Jila, N. (2006). Myths and Traditional Beliefs about the Wolf and the Crow in Central Asia Examples from the Turkic Wu-Sun and the Mongols. Asian Folklore Studies, 65, 169. Kaczensky, Petra, Namtar Enksaikhan, Oyunsaikhan Ganbaatar, and Chris Walzer. (2008). The Great Gobi B Strictly Protected Area in Mongolia- Refuge or Sink for Wolves Canis Lupus in the Gobi. Wildlife Biology, 14(4). Kimenyi, Mwangi S. March 6, 2015. The Dilemma of Destroying Ivory as an Anti-Poaching Strategy.
Kuklinski, Cobb, and Gilens. (1997). Legal Atlas. http://www.legal-atlas.net. LeGrys, Sam. Grey to Green: The Wolf as Culture and Profit in Mongolia and the Importance of Its Survival, SIT Graduate Institute, 2009. Linnel, D., A. Trouwborst, L. Boitani, P. Kacenzsky, D. Huber, S. Relijc, J. Kusak, A. Majic, T. Skrbinesk, H. Potocnik, M. Hayward, E.J. Milner-Gulland, B. Buuveibaatar, and U. Breitenmoser (2016). Border Security Fencing and Wildlife: The End of the Transboundary Paradigm in Eurasia?. https://doi.org/10.1371/journal.pbio.1002483 Lkhagvasuren, B, Y. Adiya, G. Tsogtjargal, G. Amgalanbaatar, and R. Harris. (2016) "Current Status and Conservation of Mountain Ungulates in Mongolia" (2016). Erforschung biologischer Ressourcen der Mongolei / Exploration into the Biological Resources of Mongolia, ISSN 0440-1298. Martini, Maira, U4 Expert Answer: Wildlife Crime and Corruption, U4 Anti-Corruption Resource Centre (Feb. 15, 2013) (5). Mongolian Government. 2015. National Biodiversity Program (2015-2025). Mongolian Ministry of Environment, Green Development, and Tourism, World Wildlife Federation, United Nations Environment Program, GEF. Mongolian Hunting Quota (2016): Дугаар 463 ТУСГАЙ ЗОРИУЛАЛТААР 2016 ОНД АГНАХ АГНУУРЫН АМЬТНЫ ТООГ ТОГТООХ ТУХАЙ. McConnell, Tristan. October 29, 2015. “The Ivory-Funded Terrorism Myth.” Melville, C., O. Erdenedalai, and A. Woolley (2015). Overview of the Mongolian Legal System and Laws. GlobaLex, Hauser Global Law School Program "Монгол кирил үсгийн латин хөрвүүлгийн шинэ стандарт батлагдлаа" [New latinization standard for Mongolian cyrillic script approved]. 18 February 2012 (in Mongolian). GoGo.mn. Retrieved 16 January February 2017.
Mongolia. (January 12, 2017). CIA World Factbook.
Mongolia Customs General Authority at http://customs.gov.mn
Mongolia General Authority for Border Protection at http://bpo.gov.mn
Mongolia Government at http://zasag.mn
Mongolia Tax Authority at http://mta.mn

195
Mongolia Supreme Court at http://supremecourt.com
Mongolia. Border Troops / Border Forces. Global Security (www.globalsecurity.org)
Mongolia. Trafficking in Persons Report 2016. US State Department (July 1, 2016).
Mongolia’s Nesting Program Helps Save the Prized Saker Falcon. (Jul 2016). Al Jazeera. video available at http://video.aljazeera.com. Mongolian Statistical Information System (www.1212.mn) Myagmaruren, Sh., Gombobaatar, S., Munkhjargal, M., Conaboy, N. (2014). The Fifth National CITES Report of Mongolia. (p. 54). ( National Statistical Office of Mongolia. (2010). Population and Housing Census of Mongolia. Statistical Database. www.1212.mn) Neme, Laurel. (Jun. 27, 2014). For Rangers on the Front Lines of Anti-Poaching Wars, Daily Trauma. National Geographic. (Jun 27, 2014) Nixon, Ron and Davenport, Coral. (October 5, 2015). Environmentalists Praise Wildlife Measures in Trans-Pacific Wildlife Pact. Nixon, Ron. December 22, 2015. “U.S. Pours Millions into Fighting Poachers in South Africa.” Nowell, Kristin, Juan Li, Mikhail Paltsyn, and Rishi Kumar Sharma. October 2016. “An Ounce of Prevention: Snow Leopard Crime Revisited.” TRAFFIC.
Odaga, D. (2016) Where an Owl Egg Is Worth More Than Ivory or Rhino Horn, Explorers Journal on October 4, 2016 – citing cost of ivory in China in November 2015. Citing rhino horn prices in Vietnam in September of 2016.
Official Statistics Key to China’s Fur Farming Industry. (Aug. 20, 2016). China Daily. http://www.chinadaily.com.
Only 7 Full Time Park Rangers Patrol 14 Million Hectares of Protected Areas in British Columbia. (Jun. 30, 2016). BCGEU. Otgonsaikhan, N. The Current Situation for Mongolian Foreign Trade and Cooperation with Northeast Asian Countries, Erina Report 127 (Dec. 2015) (8), available at http://www.erina.or. Oxford Business Group. Mongolia builds new partnerships in trade and investment, with
China and Russia and beyond. Accessed online at https://www.oxfordbusinessgroup.com/overview/mongolia-builds-new-partnerships-trade-and-investment-china-and-russia-and-beyond-0 Parkinson, Andrew M., Odonchimeg Nyamtseren, Tuvshinjargal D., Amanda Fine. May 2008. “World Bank FLEG Ulaanbatar Wildlife Trade Survey: Wildlife Conservation Society Report.” Wildlife Conservation Society. Peru Seizes 8 Million Seahorses Illegally Bound for Asia On Chinese-Flagged Vessel [Television broadcast]. (2016, June 22). In ABC News Australia. AFP/ABC. Plumer, Brad. November 6, 2013. Washington Post. Wonkblog. “The Grisly Eonomics of Elephant Poaching.” Plumptre AJ, RA Fuller, A Rwetsiba, F Wanyama, D Kujirakwinja, M Driciru, G Nangendo, JEM Watson & HP Possingham, Efficiently Targeting Resources to Deter Illegal Activities in Protected Areas. Journal of Applied Ecology (79) (2014) doi: 10.1111/1365-2664.12227. Poppick, L. (2014). The Women Who Removed Birds From People's Hats. Popular Science. Available at http://www.popsci.com/blog-network/ladybits/women-who-removed-birds-peoples-hats. Post “General Authority for Border Protection and WWF Mongolia have a Memorandum of Understanding” on June 10, 2011 at WWF Mongolia site (http://mongolia.panda.org/en/?200594/Ge) Prices of Exotic Animals and Wildlife. Harvoscope Global Black Market Information. Raghavarao, D. and W. T. Federer (1979). Block Total Response as an Alternative to the Randomized Response Method in Surveys. Journal of the Royal Statistical Society, Series B. 41 (1): 40–45. Relations Between the Netherlands and Mongolia. Government of Netherlands: International Relations. https://www.government.nl. Report on the Review of Vietnam’s Wildlife Trade Policy. 2008. CITES Scientific Authority of Vietnam. Sellars, J. (2017) What Wildlife Trade Enforcement Can Learn from Drugs and Arms Enforcement. Global Initiative Against Transnational Organized Crime.

196
Shepherd, C., Eaton, J., & Chng, S. C. L. Pittas for Pittance: Observations on the Little Known Illegal Trade in Pittadae in West Indonesia, BirdingASIA 24(2015): 18-20, available at http://www.traffic.org. Sindelar, Daisy. (December 9, 2009). Mongolian Democracy: From Post-Soviet Success to Post-Transition Struggle. Radio Free Europe/Radio Liberty. Shagdar, Enkhbayar, Recent Trends in Mongolian Foreign Trade with Northeast Asian Countries, Purdue: Global Trade Analysis Project (Apr. 2010), available at https://www.gtap.agecon.purdue.edu. Smith, David, Chinese 'Ivory Queen' Charged with Smuggling 706 Elephant Tusks, The Guardian (Oct. 8, 2015), https://www.theguardian.com. Sneath, David, Russia’s Borders: Mongolia Looks to Its Old Big Brother to Counterbalance China, The Conversation (Jan. 27, 2015), https://theconversation.com. "Socialist Legal Systems" at http://lawin.org. 07, 2013. Steyn, Paul. May 26, 2015. National Geographic. “As Animal Poaching Surges, Organized Crime Plays Bigger Role.” Available at news.nationalgeographic.com. Stibich, Mark, Use of Traditional Medicine in Mongolia: A Survey. Contemporary Therapies in Medicine (Mar. 2002) (43). “Summary of Reports and Other Documents, Delivered to the World Bank Mongolia Office During Preparation and Implementation of Mongolia Ungulate Surveys, which was Supported by the NEMO II Project.” TanzaniaInvest.com, Tanzania Tourism Sector Report 2015: Record Of Arrivals In 2014, (Dec. 14, 2015) The Conversation, The Changing World of Perfume and Why Some Chemicals are Being Taken Out, (Nov. 27, 2014) https://theconversation.com. Thin Green Line Foundation, What We Do, https://www.thingreenline.org.au/. The Guardian, African Elephants Could Be Extinct in Wild Within Decades, Experts Say, (Mar. 24, 2015). The Mongolist Blog, Rethinking Ulaanbaatar’s Population (May, 2014) quoting Data from table “Хүн амын тоо, хүйсээр, оны эхэнд, мянган
хүн” at: http://ubstat.mn/StatTable=11, available at http://www.themongolist.com. The Mongolist Blog, Rethinking Ulaanbaatar’s Population (May, 2014), available at http://www.themongolist.com/blog/society/89-rethinking-ulaanbaatar-s- The White House. National Strategy for Combating Wildlife Trafficking, https://www.whitehouse.gov. Theunissen, Tirza, Poverty, Inequality, and the Negative Effects of Mongolia’s Economic Downturn, The Asia Foundation (Jun. 25, 2014). Thin Green Line Foundation, What We Do, https://www.thingreenline.org.au/. TRAFFIC. May 1997. “Rhinoceros Horn and Tiger Bone in China: An Investigation of Trade Since the 1993 Ban.” TRAFFIC. July 3, 2014. “Market Survey Finds Disturbing Increase in Thai Ivory Market.” TRAFFIC, Background: Trade, http://www.traffic.org/trade Tsuchiya, Hirai, and Ono 2007; Holbrook and Krosnick 2010; Coutts and Jann 2011. UN Chronicle Vol. LI No. 2 2014. UNEP. Emerging Issues Update: Illegal Trade in Wildlife. Available at http://www.unep.org/yearbook/2014/PDF/chapt4.pdf UNEP’s illegal Trade in Wildlife Factsheet from May 2016, available at http://www.unep.org. UNDP. 2011. Mongolian Human Development Report 2011. Ulaanbaatar, Mongolia: Government of Mongolia, United Nations Development Programme Mongolia, and Swedish International Cooperation Agency. (Available at mn.undp.org) UNDP, Inequality in Mongolia, (Aug. 13, 2015), http://www.mn.undp.org. United Nations, New York. United Nations Department of Social and Economic Affairs, Trends in International Migrant Stock: The 2015 Revision. United Nations Economic and Social Council resolution 2013/40, Crime prevention and criminal justice responses to illicit trafficking in protected species of wild fauna and flora, E/RES/2013/40 (25 July 2013), available from https://www.unodc.org.
197
United for Wildlife, What is SMART?, available at http://www.unitedforwildlife.org. UNODC, Estimating Illicit Financial Flows Resulting From Drug Trafficking and Other Transnational Organized Crimes, Oct. 2011 (38). https://www.unodc.org. UNODC. 2016. World Wildlife Crime Report: Trafficking in Protected Species. USAID (2004). Assessment of Mongolia’s Free Trade Zone Program and Site Evaluation. Mongolia Economic Policy Reform and Competitiveness Project (EPRC). USAID: Mongolia (Apr. 16, 2016), https://www.usaid.gov/mongolia. U.S. Fish & Wildlife Service International Affairs, US Conservation Laws: Lacey Act, https://www.fws.gov. Vallianas, Christina. 2014. “Rhino Horn Demand.” WildAid. Vallianos, Christina. “Ivory Demand in China 2012-2014.” WildAid. Voice of America. November 2, 2009. “Thailand calls for Wildlife Trade Enforcement.” Wassener, Bettina. March 12, 2013. “No Species is Safe from Burgeoning Wildlife Trade.” Waymer, J. (2014) Could Sharks Be Headed for Extinction? (Aug. 13, 2014) Wildlife and Science Conservation Center of Mongolia, Cinereous Vulture Research and Conservation, http://www.wscc.org. Wildlife Conservation Society. March 31, 2009. “Protecting Mongolia’s Wildlife through Wildlife Trade Law Enforcement.” Wilford, N. 2005. In Mongolia, an Extinction Crisis Looms. The New York Times. Science Section. Available at http://www.nytimes.com/2005/12/06/science/in-mongolia-an-extinction-crisis-looms.html Winchester, Levi, Rhinos 'Could Become Extinct in Just Over 10 Years Time' if Poaching Continues, UK Express Mail (Jan. 17, 2015) Wingard, J and P. Zahler. (2006) Silent Steppe: The Illegal Wildlife Trade Crisis in Mongolia. Wildlife Conservation Society. Wong, Chun Han. December 31, 2016. “China to Shut Down Ivory Trade by End of 2017.”
World Atlas, The 10 Least Densely Populated Places in the World (2016) http://www.worldatlas.com World Bank. 2010. Mongolia Economic Retrospective 2008-2010. World Bank. World Bank, WB Update Says 10 Countries Move Up in Income Bracket (Jul. 1, 2015), http://www.worldbank.org. World Customs Organization. Guidelines For The Procurement And Deployment Of Scanning/NII Equipment. April 2015. World Customs Organization, Illicit Trade Report 2012, (2013) 36. World Integrated Trade Solution. The World Bank. www.wits.worldbank.org World Trade Organization Trade Policy Review of Mongolia, WT/TPR/G/297, 2014. World Wildlife Fund, Asia: China and Mongolia, http://www.worldwildlife.org. Yellowstone National Park, Wolf Reintroduction Changes Ecosystem, http://www.yellowstonepark.com.

198
ANNEX I. Research Questions
Conservation 01. Have populations of different species
increased or decreased in Mongolia since
2005? (In volumes and value.)
02. Have hunting quotas for different species
increased of decreased since 2005?
03. Which conservation-related programs or
investments have been implemented since
2005? Which one of those included species
targeted by illegal hunting and trade?
04. Have incentives been created to encourage
local community involvement in
management of wildlife? If so, are those
incentives considered successful and why?
05. Has there been any improvement in funding
scientific research on wildlife?
06. Is illegal hunting still the main challenge for
wildlife conservation or are there new
challenges like urban development, mining,
grazing land, etc.?
07. Scientists predicted the loss of the wild ass
in ten years in 2005 (this information was
quoted in the 2005 report), did that happen?
If not, why not?
Take 08. Are there more or less hunters in Mongolia
since 2005? (both in relative and absolute
terms.)
09. Is there a preference of species by the
hunters and what factors contribute to that
preference?
10. Has there been a change in the volume of
wildlife harvested per hunter?
11. Have hunters gone “pro”? Has there been a
change in who is hunting (amateur versus
professional)? How can hunters be classified-
e.g.,: weekend, occasional hunter, pro hunter,
tour guide hunter etc.?
12. What is the perception of hunters in relation
to the population of different species?
13. Has the purpose of hunting started to
change– such as for sport/pleasure– not just
for earnings/subsistence?
14. Has there been a change in the number of
trophy hunts? Has there been an increase in
companies and other infrastructure
surrounding the business of trophy hunting?
Which nationalities are the trophy hunters?
Is there any difference in which species are
hunted by different nationalities?
15. How does Mongolia’s take compare/contrast
to known trophy hunting markets? Has the
volume of wildlife harvested as part of
trophy hunting changed (increased or
decreased)? (Illegal and legal trophy hunting
can both be considered in these figures.)
16. Is there a connection between mining
development and illegal hunting? Does the
development of a mining site increase
poaching in a given area – are mine workers
poaching?
17. Has IWT developed larger-scale operations?
Are there organized crime enforcement units
dealing with illegal wildlife trade?
Trade 18. What are the major trade interfaces for
wildlife: markets, person-person, internet,
newspapers, friends & family, medicine
shops, dark web, social media, hospital
vendors?
19. Are hunters receiving more or less income
from their hunting activity in comparison
with 2005?
20. Has the % of wildlife income/total household
income increased or decreased since 2005?
21. What groups are involved in trade and
transport that may not be directly involved
in hunting and end-point sale? e.g., truck
drivers.
22. How is wildlife trade transported across the
border? Which border/custom agencies
concentrate the highest trade volumes? Has
there been a major change in the number of
border trade posts? Do these border points
have improved detection techniques? Is
anyone using trained dogs?
23. Is there a value added to the WLT chain in
199
Mongolia (such as processing, carving, fur,
medicine, etc.)? What is this value chain?
24. What are the international trade
volumes/average prices for CITES protected
species in Mongolia?
25. Who are the main exporters and importers
of the top species from Mongolia?
26. How have the volumes/values of
domestically traded wildlife evolved since
2005?
27. How have export volumes/values of wildlife
trade from Mongolia evolved since 2005?
28. How have import volumes/values of wildlife
trade to Mongolia evolved since 2005?
29. How does the WLT market in Mongolia
compare to other international markets?
Legal Framework 30. What are the main changes in the legal
framework since 2005? (Note the large
number of addendums and regulations in the
Mongolian system)
31. How complete is the legal framework
compared to everything that needs to be
covered?
32. How good are the laws in actually providing
a solid foundation for implementing CITES?
33. Have new bans on hunting been created
since 2005?
34. Have there been any new listings in CITES
Appendix I and II affecting Mongolian
species since 2005? Has Mongolia used
Appendix III since 2005?
35. Which activities are not directly addressed
by the law? What form would a law take to
address that problem?
36. Among those laws that have been enacted to
address management, enforcement, etc. of
wildlife, are they effective? If a law is
ineffective, how can it be modified to
increase its efficacy?
37. What additional laws or provisions related to
enforcement or punishment should be
adopted to increase the effective
implementation of existing laws?
Enforcement 38. What is the current institutional landscape
involved in wildlife management? What are
the institutions, their roles, legal powers,
personnel, budgets, and geographical
footprint? What part of the wildlife chain is
covered by each one?
39. What have been the main changes to the
institutional landscape since 2005?
40. Since 2005, have the State Specialized
Inspection Agency, State Border Defense
Agency, the Mongolian Central Customs
Authority increased their
monitoring/enforcement activity?
41. Since 2005, have there been any new
methods developed for monitoring and
detecting trade? Has effective cross-border
cooperation with China and Russia been
established?
42. Since 2005, has the State Police increased
control of weapons and ammunition
entering the country?
43. Are Mongolia’s institutions in a position to
do the job needed? Are there gaps in the
areas to cover? e.g., no one responsible for
managing on line trade, restaurants, TCM.
Are there gaps in the species covered? (e.g.
there’s really no one responsible for fish).
Are there geographical gaps? (Almost
)
44. What are the success stories? (e.g., the anti-
poaching units busting large illicit hunting
units; better quota setting; customs
authorities have better equipment, etc.).
45. How many seizures have there been of illegal
wildlife trade in the last decade? (Types,
volumes, trade stage.)
46. What is the endpoint for the seizures
(stockpiles, destruction, rehabilitation, etc.)?
What protocols are in place for handling
wildlife once it is seized? Have there been
problems maintaining chain of custody and
presenting as evidence in prosecutions?
47. How many administrative fines/penalties
have been collected and on what basis? How
do these get implemented?
48. How many criminal prosecutions and prison
sentences have been decided in the last
decade? How does this compare to the total
number of WLT cases (success
rate/percentage of convictions)? What does
the prosecution of a wildlife trade case look
200
like?
49. Has there been an increase in awareness
among law enforcement and
judges/prosecutors of WLT?
50. Is urban or rural law enforcement more
effective? Why?
51. Is there a correlation between a law
implemented and a change in trade in a
particular product?
Markets 52. What are the main species demanded in the
domestic market (prices, volumes)? Are
there changes since 2005?
53. What are the main Mongolian species
demanded in the international market
(prices, volumes)? Are there changes since
2005?
54. Characterization of traditional Chinese
medicine products in Mongolia.
55. What are the most common uses of Mongolia
wildlife (fur, perfumes, medicine, etc)? What
are the most common uses for each
hunted/traded species?
56. Has the international market for fish
increased/decreased? Any changes to nature
of international market aside from volume?
57. Has the domestic fish market
increased/decreased? Any other changes to
domestic fish market?
58. Is the game meat trade still limited to the
domestic market?
59. Is the international market still primarily for
traditional medicine? Furs?
60. Is Mongolia an important transit country for
WLT to Russia, China, Kazakhstan, or
beyond? How important is it as a transit
country compared to other routes?
Public Awareness 61. What kind of media coverage has there been
for wildlife and wildlife trade over the last
year in Mongolia?
62. What is the public understanding of the
current legal framework for specific species?
63. What is the public understanding of the
wildlife law? Does the public know about
fines and the likelihood of being caught?
Socio-Economic Context 64. What are the main population changes since
2005 in terms of number and population
distribution by age, sex, urban/rural and
geographical location?
65. What are the main economic changes in
Mongolia since 2005 in terms of GDP, GDP
per capital, HDI, trade balance?
66. What are the main political changes since
2005?
67. How has the export and import matrix
changed since 2005?
68. Are there different or new countries involved
in the international market for Mongolian
products? Is there a decrease in trade to
certain countries? Increase in trade to
others? If new countries are involved, what
are their interests in Mongolian wildlife
products? Have demands for certain
products/species changed based on the
source and purpose of the demand?
69. What are the demographics of users of WLT
products?
70. How does the socio-economic status of
households relate to consumption and use
of wildlife products?

201
ANNEX II. Household Survey
Household Socio-Economics Question #1
How old are you?
Menu Choices: 15 to 100
Question #2
How many people is part of your household at
the present time? (NSO definition: All persons
living under one roof or occupying a separate
housing unit, having either direct access to the
outside (or to a public area) or a separate
cooking facility. Where the members of a
household are related by blood or law, they
constitute a family)
Menu Choices: 1 to 15
Question #3
Was this Aimag your residence in 2015? If not,
where was your residence in 2015?
Menu Choices: 21 Aimags and UB
Question #4
What is the highest level of education you
completed?
Menu Choices: Uneducated, Primary, Secondary,
High School, Primary (vocational), Secondary
(vocational), Undergraduate, Graduate
Question #5
Did your household benefit from any of the
following sources of income last year?
Menu Choices: Yes, No
Statements: Salary/Wage/Labor Livestock (sell/used) Agro business, Business Pension Benefit/disabled or orphan income Human Development Fund Received from others without compensation Loans Savings
Other income
Question #6
How do you consider the level of income of
your household in general?
Menu Choices: Insufficient to cover basic needs,
Barely sufficient for basic needs, Sufficient for
basic needs and clothing, Covers basic things
and valuables, Covers all needs and savings.
Question #7
How many of the following assets were
available in your household during any
moment of last year?
Menu Choices: From 0 to 1,000
Statements: Horses Camels
Sheep Goats Cows Yaks Vehicles Bank Accounts Land Living Spaces
Wildlife Take Question #8
Did you hunt, trap or fish last year?
Menu Choices: Yes, No
Question #9
Menu Choices: 1 to 50
Question #10
How many pieces of the following equipment
Menu Choices: 1 to
Statements: Guns
Traps
Fishing rods
Fishing nets
Hand-Made fishing equipment
Horses
Eagles
Vehicles
Question #11
We would like to know your opinion of hunting
permits? I will read some statements and can
you tell me if you consider them to be true or
false?
Menu Choices: True, False
202
Statements: Permits are useful to ensure
wildlife do not go extinct
Most hunters know about permit
requirements
Obtaining a permit is easy and
fast
Permit prices are fair
Most hunters obtain their
permits
Nothing happens if you hunt
with no permit
Question #12
harvested last year. Can you list them?
Menu Choices: list of 65 species, Others
(Loop starts for each species)
Question #12a
In what province(s) did you
Menu Choices: 21 Aimags
Question #12b
species)?
Menu choices: Spring, Summer, Fall, Autumn
Question #12c
How many specimens did you take last
year?
Menu Choices: 1 to -
Question #13 UCT question-
How many of these 5 (or 4) equipment types
did you ever use to hunt?
Menu Choices: 1 to 4 (or 5)
Statements: Guns
Binoculars
Night Lights
Camouflage (only for cases)
Vehicles
Question #14 UCT question-
How many of these 4 (or 3) techniques or
methods have you used to hunt?
Menu Choices: 1 to 4 (or 5)
Statements: Driving animals
Tracking in fresh snow
(Shooting from vehicle)
Hunting in group
Wildlife Use & Trade Question #15
Lets talk now about the use you gave to the
species you/somebody else in the household
harvested last year?
Question #15a
Did you use at home?
Menu Choices: Yes, No
Question #15b
For what purposes?
Menu Choices: Meat, Furs, Live,
Medicinal
Question #15c
Did you trade it?
Menu Choices: Yes, No
Question #15d
For what purposes?
Menu Choices: Meat, Furs, Live,
Medicinal
Question #15e
Can you recall amounts you used and
amounts you sold?
Question #15f
Can you recall the prices?
Wildlife Purchases Question #16
Did you buy wildlife products during the last
year? What species?
Menu Choices: list of 65 species, Others
Question #16a
What did you buy (species name) for?
Menu Choices: Meat, Furs, Live, Medicinal,
Others
Question #16b
Do you remember the amounts you
acquired during the last year?
Question #16c
And the average price?
Question #17
Menu Choices: Abundant, Rare or Very rare.

203
Statements: 10 Years Ago?
5 Years ago?
Last year?
Question #18
In your opinion, how important is the
conservation of Mongolian wildlife?
Menu Choices: From 1 (not important at all) to
10 (extremely important)
Question #19
How
to prevent wildlife crime?
Menu Choices: From 1 (very poor) to 10
(excellent)
Question #20
How frequently do you see wildlife issues
covered in the news?
Menu Choices: Very Often, Often, Sometimes,
Never
Question #21
In your opinion, would the following measures
contribute or not to a better conservation of
wildlife in Mongolia?
Menu Choices: They would, They would Not
Statements:
Establish bans for some species and/or
areas
Increase involvement of communities
with wildlife management
Improve legislation to prevent wildlife
crime
Increase fines and penalties
Hire more rangers
Increase public awareness
Have more vehicle inspections on the
road
Improve the controls over hunting
weapons
Support for alternative livelihoods to
reduce reliance on wildlife

204
ANNEX III. Observational Sheet
Date
Location
Species
Story
Images

205
ANNEX IV. Retail Shop Survey Question #1
What are the top 3 wildlife-related products
you sell at your store?
(Loop starts)
Question #1a
To what category does this product
belong?
Menu choices: Food, Furniture & Decoration,
Medical Products, Clothing & Shoes,
Antiques & Art pieces, Religious Artifact,
Jewelry, Gifts & Souvenirs
Question#1b
From what wildlife species is it made?
Menu choices: list of 65 species, Others.
Question #1c
What is the origin of the wildlife for this
product?
Menu choices: Mongolia, China, Russia, Other
I do not know
Question #1d Where did the processing from raw wildlife to final product take place jewelry making, tailoring of clothes, smoking of meat, etc.? Menu choices: Mongolia, Abroad, I don’t
know.
Question #1e
What is the price of this product?
Question #1f
What is the maximum number of items of
this product you remember having sold in
a single month?

206
ANNEX V. Tourism Agency Survey
Clientele Question #1
From what country are the majority of your
clients?
Menu Choices: Mongolia, China, USA, UK,
France, Russia, Ukraine, Germany, Japan,
Australia, Italy, Kazakhstan.
Question #2.
How many clients did you approximately
have last year?
Question #3
What percentage of those clients in your
opinion came to Mongolia because of
Mongolian wildlife?
General Opinions Question #4
In your opinion, how did the Mongolian
tourism sector change in the last ten years?
Menu Choices: Increased, Decreased, Steady.
Statements:
The number of travellers coming to Mongolia
has…
The travel options available (destinations
and activities) have…
The number of competitors in the market
(other tourism agencies) has…
The profits in the tourism agency sector
have…
The government support to the sector has…
Question #5
In your opinion, how abundant was wildlife in
Mongolia
Menu Choices: Abundant, Rare, Very Rare
Statements:
10 Years ago?
5 Years ago?
Last year?
Question #6
How
to prevent wildlife crime?
Menu choices: From 1(very poor) to 10
(excellent)
Question #7
In your opinion, how important is the
conservation of wildlife to the tourist
industry in Mongolia?
Menu Choices: From 1(not important at all) to
10 (extremely important)
Question #8
In your opinion, would the following
measures contribute or not to a better
conservation of wildlife in Mongolia?
Menu Choices: Yes, No
Statements:
Establish bans for some species and/ or
areas?
Increase involvement of communities in
wildlife management?
Improve legislation to prevent wildlife
crime?
Increase fines and penalties?
Hire more rangers?
Increase Public awareness?
Have more vehicle inspections on the road?
Improve the controls over hunting weapons?
Support for alternative livelihoods to reduce
reliance on wildlife?
Wildlife Take Question #9
Does your company organize hunting or
fishing activities?
Menu Choices: Yes, Not
(If Yes, a loop starts for each on species)
Question #9a What were the species your clients targeted or were most interested in last year?
Question #9b How many specimens did your clients catch/hunt last year in total for that species?

207
Question #89c To what aimags do you bring clients to hunt for this species?
Question #10
What is the role of your company in relation
to hunting guns?
Menu Choices: We are involved, We are not
involved
Statements:
We facilitate guns to foreign hunters
We facilitate gun permits to foreigners
bringing to Mongolia their own weapons
Question #11
What is the role of your company in relation
of hunting permits?
Menu Choices: We are involved, We are not
involved
Statements:
We facilitate hunting permits to foreign
hunters on an individual basis
We facilitate hunting permits based on our
quota allowance
We inform foreigners how to obtain permits
and they get them on their own
Question #12
What is the role of your company in relation
of the specimens hunted?
Menu Choices: We are involved, We are not
involved
Statements:
We take care of preparing the trophies for
clients to bring home
We take care of obtaining CITES permits to
export client’s trophies
We take care of the shipment/export of
client’s trophies to their home countries
We take care of disposing of the remaining
parts for local consumption

208
ANNEX VI. Restaurant Survey Question #1
What type of restaurant is this?
Menu Choices: Korea, Japan, China, Russia,
Turkey, Ireland, Italy, Mexico, India, Traditional,
Mongolian, Fast food, Other.
Question #2
What species of fish are for sale in the
restaurant?
(Loop starts)
Question #2a. What is the origin of this fish species?
Menu Choices: Mongolia, Foreign, I do not
know
Question #2b. In what form do you buy it?
Menu Choices: Live, Fresh, Frozen, Smoked,
Canned, Pickled, and Other.
Question #2c. Where do you get/buy them?
Menu Choices: Directly from fishermen, from
Fish farmers, Local Traders and Individuals,
Wholesale markets, Importers, Exporters
from other countries, and Other.
Question #2d. When do you buy it?
Menu Choices: Spring, Summer, Fall, and
Winter.
Question #2e. How often do you buy (on average)?
Menu Choices: Everyday, Daily, per month,
per season
Question #2f. At what price do you buy (on average)?
Question #3
Who are the most common clients ordering
fish dishes in this restaurant?
Menu choices: Mongolians, Foreigners/Tourists, I
don’t know
Question #4
What is the maximum amount of fish you have
ever sold in the restaurant in a month?
Menu choices: Amount in fish plates, Amount in
fish Kilos, Amount in Tugriks of sales
Question #5
In your opinion, compare with 5 years
) is increasing, decreasing, or
stable.
Statements: Number of customers ordering fish
is…, Preference for fish by Mongolians is…,
Number of competitors (other restaurants)
selling fish is…, The purchases of fish in the
future in this restaurant will…

209
ANNEX VII. Traditional Medicine Survey Question #1
What wildlife species are used for TCM in this
area
Menu choices: list of 65 species, Others.
(Loop starts)
Question #1a
What Aimag is it from?
Menu choices: list of 21 Aimags
Question #1b
Which parts of this species are being used?
Menu choices: Meat, Furs, Oil, Antler, Blood
Antler, Brain, Liver, Tongue, Lung, Stomach,
Tail, Testicles, Blood, Femur, Bones, Bile,
Glands, Womb, Seed, Stem, Leaf, Stem,
Flower
Question #1c
Where you can get/buy it?
Menu Choices: TCM practitioner, Directly
from hunters, Local traders and individuals,
Markets, Importers from other countries.
Question #1d
What kinds of heath problems are treated
with the products from this species?
Question #1f
What is the preference for this
product/species in this area?
Menu Choices: Mongolian products, Chinese
products, Russian products, Other countries’
products, No preference, I do not know
Question #1g
In your opinion, how common is the use of
this TM product/species in your
community?
Menu Choices: Very common, Common, Not
common, I don’t know

210
ANNEX VIII. Price Report
Date
Location
Species
Part
Price
Unit
Notes

211
ANNEX IX. Key Informant Interview
Products The objective is to get information to help
characterize the illegal wildlife products being
traded in the area
What are the wildlife species being hunted/traded here?
What are the amounts being hunted/traded?
Are they traded as whole animals, by parts (which parts), smoked/fresh (if fish)?
When are they traded, why?
How is the quality? When is it best, when is it the worst? Is it improving or getting worse?
What is the product used for in the market?
Actors The objective is to get information to assist help
characterize the actors involved in the illegal
wildlife trade chain
Who hunts? (Individual hunters, organized poachers, people with or without permits, Mongolians or foreigners,
Who is transporting the wildlife?
Who are the traders? Where are they located?
Who are the final buyers –owner of restaurants, traders, transporters, importers from China, etc.?
Are government officials involved; if so, how are they involved (e.g., bribes)?
Means & Methods The objective is to get information to help
characterize how wildlife is illegally taken from
the wild.
For each species, what is the most common method – guns, traps, and nets?
What other tools or techniques are used (such as night lighting, chasing animals with vehicles, explosives)
Economics The objective is to get information to help
characterize the economics behind the illegal
wildlife business
What are the prices along the chain (for hunters, traders, transporters, exporters, etc.)?
What are the profits?
How are the profits distributed along the chain?
What are the salaries of rangers?
What are the fines?
Logistics The objective is to get information to help
characterize the logistics of the business or how
the illegal wildlife product is moved from the
hunting areas to the final markets
In what type of vehicles is the product moved across the country?
What routes are used to move the wildlife products?
How is it moved across borders?
Are there storage facilities for wildlife trade?
Enforcement The objective is to get information to help
understand how the government is enforcing
laws in the area?
Is enforcement having an impact?
Have there been seizures in the area? Of wildlife, guns? Have people been arrested?

212
How do people avoid rangers/officials/enforcement personnel?
What is the general attitude towards enforcement?
What are the enforcement measures in the area? Are there patrols?
How many rangers are in the area? What are their salaries? Their resources/equipment?
How are permits and quotas being defined and allocated in the soum?

213
ANNEX X. Management Authorities Questionnaire
Institutional Landscape What is the current institutional landscape
involved in wildlife management? What are the
institutions, their roles, legal powers, personnel,
budgets, and geographical footprint? What part
of the wildlife chain is covered by each one?
What are the main changes of the institutional
landscape since 2005?
Legal Landscape What are the main legal developments related to
the management of wildlife since 2005? Who
promoted the legal developments? What were
the causes triggering new legal developments?
What is the opinion on the effectiveness and
efficacy of those legal developments?
Wildlife-Related Investment Programs Which conservation or wildlife-related
programs/investments have been implemented
since 2005? Which one of those included species
were targeted by illegal hunting and trade? Has
foreign technical assistance been received to
build new capacity?
Community Engagement Have incentives been created to encourage local
community involvement in management of
wildlife? If so, are those incentives considered
successful and why? Do any programs
incorporate nomadic herders? What about
landowners?
Wildlife Value Chain Is there a value added to the WLT chain in
Mongolia (such as processing, carving, fur,
medicine, etc.)? What is this value chain?
Hunting Permits And Quotas Have hunting quotas for different species
increased of decreased since 2005? What were
the primary reasons for these changes? How
about permits?
Finances How are resources assigned today? Are there
enough? What are the financial constrains in
order to proper manage wildlife? What are the
budgetary gaps?
214
ANNEX XI Enforcement Authorities Questionnaire
Institutional Landscape Since 2005, have the State Specialized Inspection
Agency, State Border Defense Agency, and the
Mongolian Central Customs Authority increased
their monitoring/enforcement activity? Have they
increase their capacity through increased
equipment, technical cooperation, additional staff,
etc.? Are there any institutional gaps? Have
authorities considered partnering with and/or
requesting a study via UNODC from the Wildlife
and Forest Crime Analytical Toolkit?
Legal Landscape Have new bans on hunting been created since
2005? If so (or if not) what were the primary
reasons for the new bans or for dropping bans?
How much have these new bans been enforced and
implemented? (if applicable). Among those laws
that have been enacted to address management,
enforcement, etc. of wildlife, are they effective? If a
law is ineffective, how can it be modified to
increase its efficacy? What additional laws or
provisions related to enforcement or punishment
should be adopted to increase the effective
implementation of existing laws?
Seizures Is urban or rural law enforcement more effective?
Why? How many seizures of illegal wildlife trade
have there been in the last decade? (Types,
volumes, trade stage), What kind of follow-up and
investigations have there been following a major
seizure? Were there any surprising or new species
reported in recent seizures? Were there any
success stories to share? What is the endpoint for
the seizures (stockpiles, destruction,
rehabilitation, etc.)?, Which protocols are in place
for handling wildlife once it is seized? Have there
been problems maintaining chain of custody and
presenting evidence in prosecutions?
Administrative Penalties How many administrative fines/penalties have
been collected and on what basis?, How do these
get implemented?
Criminal Penalties How many criminal prosecutions and prison
sentences have been decided in the last decade?
How does this compare to the total number of
WLT cases (success rate/percentage of
convictions)?, What does the prosecution of a
wildlife trade case look like?
Mining & Poaching Does the development of a mining site increase
poaching in a given area? Are mine workers
poaching? Is it worse with certain companies? Are
any of the mining companies Mongolian SOEs?
What about Chinese SOEs? Are local Mongolians
the primary employees of the majority of the
mines or are they foreign nationals?
Weapons Control Since 2005, has the State Police increased control
of weapons and ammunition entering the country?
What form of control has this taken?
Organized Crime Have WLT groups developed larger-scale
operations with TOC? Are there organized crime
enforcement units dealing with illegal wildlife

215
trade?, Has Mongolia become more involved within
UNTOC? (Recognizing the linkages to WLT)
Cross-Border Cooperation Has effective cross-border cooperation with China
and Russia been established? How would you
define this cooperation as effective? E.g. are there
joint operations? Intelligence sharing?
Wildlife Trade Who are the main exporters and importers of the
top species from Mongolia? I.e.- primarily
individuals, hunting outfits, identified TOC
groups?, Since 2005, have there been any new
methods developed for monitoring and detecting
trade?, What has been the most effective new
method of monitoring trade?, Has the international
market for fish increased/decreased?, Any changes
to nature of international market aside from
volume?, Has the domestic fish market
increased/decreased?, Any other changes to
domestic fish market?, Is the game meat trade still
limited to the domestic market?, Is the
international market still primarily for traditional
medicine? Furs?, Are there different or new
countries involved in the international market for
Mongolian products?, Is there a decrease in trade
to certain countries? Increase in trade to others?, If
new countries are involved, what are their interests
in Mongolian wildlife products?, Have demands for
certain products/species changed based on the
source and purpose of the demand?
216
ANNEX XII. Scientific Authorities & Academia Questionnaire
Quotas Have hunting quotas for different species
increased or decreased since 2005? Primary
reasons for the quota changes? How are quotas
set in Mongolia?
Conservation Scientists predicted the loss of the wild ass in
ten years in 2005 (2005 report), Did that
happen? If not, why not? Has there been any
other significant total loss or decline of other
species?
Research Do scientific/academic institutions have enough
funding to conduct conservation studies? What
are the studies conducted in the last decade?
What are the necessary studies that are
unfunded?
Legal Landscape Among those laws that have been enacted to
address management, enforcement, etc. of
wildlife, are they effective? Which ones are most
effective and why? If a law is ineffective, how can
it be modified to increase its efficacy? What
additional laws or provisions related to
enforcement or punishment should be adopted
to increase the effective implementation of
existing laws?
Institutional Landscape Are Mongolia’s institutions in a position to do
the job needed? Are there gaps in the areas to
cover? e.g., no one responsible for managing on
line trade, restaurants, TCM. Are there gaps in
the species covered? (e.g. there’s no one
responsible for fish). Are there geographical
gaps? ( )
What are the success stories?
Markets Has the international market for fish
increased/decreased? Any changes to nature of
international market aside from volume? Has the
domestic fish market increased/decreased? Any
other changes to the domestic fish market? Is
the game meat trade still limited to the domestic
market? Is international market still primarily
for traditional medicine? Furs?
Public Awareness What kind of media coverage has there been for
wildlife and wildlife trade over the last year in
Mongolia? How has it been received by the
public? What is the public understanding of the
current legal framework for specific species?
What is the public understanding of the wildlife
law? Does the public know about fines and the
likelihood of being caught?
Trade Are there different or new countries involved in
the international market for Mongolian
products? Is there a decrease in trade to certain
countries? Increase in trade to others? If new
countries are involved, what are their interests in
Mongolian wildlife products? Have demands for
certain products/species changed based on the
source and purpose of the demand?

217
ANNEX XIII. NGOs and International Organizations Questionnaire
Conservation Is wildlife conservation a problem in Mongolia? If
yes, does it have the political attention it requires?
Scientists predicted the loss of the wild ass in ten
years in 2005 (2005 report), Did that happen? If not,
why not? Has there been any other significant total
loss or decline of other species? Is illegal hunting
still the main challenge for wildlife conservation or
are there new ones like urban development, mining,
grazing land, etc.?
Institutional Landscape Are Mongolia’s institutions in a position to do the
job needed? Are there gaps in the areas to cover?
e.g., no one responsible for managing online trade,
restaurants, TCM. Are there gaps in the species
covered? (e.g. there’s really no one responsible for
fish). Are there geographical gaps? (Almost certainly
) What are the success
stories?
Legal Landscape Among those laws that have been enacted to address
management, enforcement, etc. of wildlife, are they
effective? Which ones are most effective and why? If
a law is ineffective, how can it be modified to
increase its efficacy? What additional laws or
provisions related to enforcement or punishment
should be adopted to increase the effective
implementation of existing laws?
Community Engagement Have incentives been created to encourage local
community involvement in management of wildlife?
If so, are those incentives considered successful and
why? Do any programs incorporate nomadic
herders? What about landowners?
Wildlife-Related Investment Programs Which conservation or wildlife-related
programs/investments have been implemented since
2005? Which of those included species are targeted
by illegal hunting and trade? Has foreign technical
assistance been received to build new capacity? What
additional programs are needed?
Research Do scientific/academic institutions have enough
funding to conduct conservation studies? What are
the studies that have been conducted in the last
decade? What are the necessary studies that are
unfunded?
Public-Private Partnerships Is the government partnering with private entities
(national and international) to boost its capacity to
manage wildlife? Are innovative approaches being
created as a result?, Synergies?
Public Awareness What kind of media coverage has there been for
wildlife and wildlife trade over the last year in
Mongolia? How has it been received by the public?
What is the public understanding of the current legal
218
framework for specific species? What is the public
understanding of the wildlife law? Does the public
know about fines and the likelihood of being caught?
Has there been an increase in awareness among law
enforcement and judges/prosecutors of WLT?
Wildlife Trade What are the major trade interfaces for wildlife:
markets, person-person, internet, newspapers,
friends & family, medicine shops, dark web, social
media, hospital vendors? Is there a value added to
the WLT chain in Mongolia (such as processing,
carving, fur, medicine, etc.)? What is this value chain?
Significant change/increase in last 10 years? How
does the WLT market in Mongolia compare to other
international markets? Is Mongolia an important
transit country for WLT to Russia, China,
Kazakhstan, or beyond? How important is it as a
transit country compared to other routes? Are there
different or new countries involved in the
international market for Mongolian products? Is
there a decrease in trade to certain countries?
Increase in trade to others? If new countries are
involved, what are their interests in Mongolian
wildlife products? Have demands for certain
products/species changed based on the source and
purpose of the demand?
Illegal Wildlife Trade Have WLT groups developed larger-scale operations
with TOC? Are there organized crime enforcement
units in place dealing with illegal wildlife trade? Has
there been more government involvement with
UNTOC? Which activities related to illegal take are
not directly addressed by the law?