
Language and Literacy with African American Young Men Django Paris Michigan State University.

International Journal of
Environmental Research
and Public Health
Article
Money Protects White but Not African American Men againstDiscrimination: Comparison of African American and WhiteMen in the Same Geographic Areas
Shervin Assari 1,2, Susan D. Cochran 2,3,4 and Vickie M. Mays 2,5,6,*
�����������������
Citation: Assari, S.; Cochran, S.D.;
Mays, V.M. Money Protects White but
Not African American Men against
Discrimination: Comparison of
African American and White Men in
the Same Geographic Areas. Int. J.
Environ. Res. Public Health 2021, 18,
2706. https://doi.org/10.3390/
ijerph18052706
Academic Editor: Paul B. Tchounwou
Received: 14 January 2021
Accepted: 5 February 2021
Published: 8 March 2021
Publisher’s Note: MDPI stays neutral
with regard to jurisdictional claims in
published maps and institutional affil-
iations.
Copyright: © 2021 by the authors.
Licensee MDPI, Basel, Switzerland.
This article is an open access article
distributed under the terms and
conditions of the Creative Commons
Attribution (CC BY) license (https://
creativecommons.org/licenses/by/
4.0/).
1 Department of Family Medicine, Charles Drew University, Los Angeles, CA 90059, USA;[email protected]
2 UCLA BRITE Center for Science, Research and Policy, University of California,Los Angeles (UCLA), Los Angeles, CA 90095-1563, USA; [email protected]
3 Department of Epidemiology, Fielding School of Public Health, University of California, Los Angeles (UCLA),Los Angeles, CA 90095-1772, USA
4 Department of Statistics, University of California, Los Angeles (UCLA), Los Angeles, CA 90095-1554, USA5 Department of Health Policy and Management, Fielding School of Public Health, University of California,
Los Angeles (UCLA), Los Angeles, CA 90095-1772, USA6 Department of Psychology, University of California, Los Angeles (UCLA), Los Angeles, CA 90095-1563, USA* Correspondence: [email protected]; Tel.: +1-310-206-5159
Abstract: To compare African American (AA) and non-Hispanic White men living in same residentialareas for the associations between educational attainment and household income with perceiveddiscrimination (PD). The National Survey of American Life (NSAL), a nationally representativestudy, included 1643 men who were either African American (n = 1271) or non-Hispanic White(n = 372). We compared the associations between the two race groups using linear regression. In thetotal sample, high household income was significantly associated with lower levels of PD. Therewere interactions between race and household income, suggesting that the association betweenhousehold income and PD significantly differs for African American and non-Hispanic White men.For non-Hispanic White men, household income was inversely associated with PD. For AfricanAmerican men, however, household income was not related to PD. While higher income offersgreater protection for non-Hispanic White men against PD, African American men perceive higherlevels of discrimination compared to White males, regardless of income levels. Understanding therole this similar but unequal experience plays in the physical and mental health of African Americanmen is worth exploring. Additionally, developing an enhanced understanding of the drivers for high-income African American men’s cognitive appraisal of discrimination may be useful in anticipatingand addressing the health impacts of that discrimination. Equally important to discerning howsocial determinants work in high-income African American men’s physical and mental health maybe investigating the impact of the mental health and wellbeing of deferment based on perceiveddiscrimination of dreams and aspirations associated with achieving high levels of education andincome attainment of Black men.
Keywords: discrimination; perceived discrimination; socioeconomic status; income; education; racism
1. Introduction
While socioeconomic status (SES) indicators such as educational attainment andhousehold income protect most populations from poor health [1], African Americans (AA)experience smaller returns from their SES relative to Whites [2], a phenomenon calledMinorities’ Diminishing Returns (MDRs) [3,4]. For African American individuals, restrictedprotective effects of education attainment and income have been shown for a wide rangeof physical and mental health outcomes [2]. These patterns are robust as they are observedfor children, youth, adults, and older adults, and replicated regardless of cohorts and
Int. J. Environ. Res. Public Health 2021, 18, 2706. https://doi.org/10.3390/ijerph18052706 https://www.mdpi.com/journal/ijerph

Int. J. Environ. Res. Public Health 2021, 18, 2706 2 of 12
settings [2]. One manifestation of MDRs is that high education and income may operate asrisk factors for depression for African American men and boys [5].
As noted in the “Black –White wealth gap” arguments by Oliver and Shapiro [6]as well as Hamilton and Darity [7], a considerable racial wealth gap persists betweenAfrican American and White individuals with similar education and income profiles.This has sometimes been alluded to as the Black tax, which refers to the hidden costs ofbeing African American in the US [8]. While much work has focused on the contributionof institutional and structural racism in the economic and labor market in reducing thebenefits of educational and income attainment for African American individuals, less workhas focused on the role of perceived discrimination (PD) in this regard. We know even lessabout the experiences of African American men who despite PD manage to acquire highlevels of education and income [9].
At least for three reasons, PD might be one of the plausible mechanisms that canexplain diminished returns of SES for African Americans who manage to obtain high levelsof education and income [2,9]. First, PD is one of the major contributors of racial/ethnichealth disparities in the United States. As shown by multiple review papers [10,11], PDincreases risk of multiple physical and mental health outcomes. Second, some evidencesuggests that high-SES African American people report more, not less PD [9], which is inpart due to an increased contact with Whites [12]. High-SES African American individualswho live in a predominantly White context may also have less access to the AfricanAmerican community, which could provide social support. Third, research suggests thatthe social patterning of PD is different for African American and White individuals [12–14].While for White Americans, PD is less common among high-SES individuals [15], high-SESAfrican American individuals report more, but not less, PD, compared to their low-SEScounterparts [9,13].
Although PD can be considered a plausible explanation for MDRs, there are veryfew studies that have specifically compared non-Hispanic White and African Americanindividuals for differences in the associations between SES and PD. In a recent study, Colenand colleagues [13] used data from the National Longitudinal Survey of Youth (NLSY). ForWhites, income gain over time was associated with less exposure to chronic discrimination.Upwardly mobile African American people, however, reported more PD compared to theirsocioeconomically stable counterparts. In this study, differential exposure to PD explaineda substantial proportion of the gap between African American and White individualsin self-rated health [13]. Most other studies suggesting that high-SES African Americanpeople experience high levels of discrimination [14] have been limited to African Americanindividuals only; thus, they do not provide information on differential effects of educationalattainment or income on PD between non-Hispanic White and African American people,particularly those living in the same areas. The positive association between SES andPD among African American individuals may be more pronounced for males, probablybecause African American men are the main target of discrimination by non-HispanicWhite men [16].
Aims
To better understand the role of PD in MDRs [2–4], this study used a national sample tocompare African American and non-Hispanic White men for the associations of educationattainment and household income with PD. We hypothesized inverse associations betweeneducational attainment and income with PD for non-Hispanic White men but not forAfrican American men.
2. Materials and Methods2.1. Design
Data from the National Survey of American Life (NSAL-Adults), a nationally repre-sentative mental health survey of non-Hispanic White and African American adults [17],

Int. J. Environ. Res. Public Health 2021, 18, 2706 3 of 12
were used. Although NSAL methodology is well explained elsewhere [17], we brieflydescribe the study here.
2.2. Participants and Sampling
The NSAL used household probability sampling methods to draw a nationally rep-resentative sample of African American and non-Hispanic White adults who reside inthe same areas [17]. The multistage sampling design produced a core national sample ofWhite and African American adults, almost identical to the earlier National Survey of BlackAmericans (NSBA). In NSAL, non-Hispanic White and African American participantswere selected from the same context and geographic areas, so non-Hispanic Whites arerepresentative to the geographic areas of the US in which there are at least 10% AfricanAmerican residing. In other words, the non-Hispanic White sample in the NSAL is notrepresentative of all non-Hispanic Whites in the U.S. as they are drawn from proximity toAfrican American people compared to all non-Hispanic Whites in the U.S. [18]. Partici-pants were adults (age ≥ 18 years) who lived in the coterminous U.S. (48 states). All werenon-institutionalized individuals who could complete a structured interview administeredin English. These excluded individuals residing in long-term medical care settings, nursinghomes, prisons, or jails [18]. We restrict our analytical sample to the 1643 male participantswho were either non-Hispanic White (n = 372) or African American (n = 1271).
2.3. Data Collection
The NSAL administered a structured interview in English. About 82% of total in-terviews were face-to-face, while the remaining 14% were conducted over the telephone.Computer-assisted personal interview (CAPI) methods were used. These methods en-hance data quality in long and complex surveys such as the NSAL due to its complex skippatterns. Interviews averaged 140 min in length. The response rate was 71% for AfricanAmerican and 70% for non-Hispanic White respondents.
2.4. Measures
For the current study, we used the following variables from the NSAL:
2.4.1. Race/Ethnicity
In the NSAL, race/ethnicity was self-identified. For the current study, all partici-pants identified themselves as either African American or non-Hispanic White. AfricanAmerican participants were restricted to individuals without any ancestral ties to theCaribbean countries.
2.4.2. Educational Attainment
Educational attainment was measured using self-report. Levels of educational attain-ment were coded as: (1) 11 years or less (less than high school diploma), (2) 12 years (highschool graduate), (3) 13–15 years (some college but did not complete college), and (4) 16+years (college graduate). We treated educational attainment as three dummy variables:(1) 12 years (high school graduate), (2) 13–15 years (some college but did not completecollege), and (3) 16+ years (college graduate). As such, our omitted category was lessthan high-school diploma (11 years or less). For sensitivity analysis, we used educationalattainment as a continuous measure (years of schooling).
2.4.3. Household Income
Household income was assessed using self-report. Annual household income wascollected as a continuous measure, which had a normal distribution. We used quartilesfor the total sample, regardless of race/ethnicity, rather than race/ethnic-specific incomethresholds, so similar to education attainment, income levels were comparable acrossrace/ethnic groups. The thresholds were as bellow: 15,000 (1.4–1.5) for the 1st quantile,28,000 (27,500–29,000) for the 2nd quantile (50th percentile), and 47,000 (45,000–48,000) for

Int. J. Environ. Res. Public Health 2021, 18, 2706 4 of 12
the 3rd quantile (75th percentile). We included three dummy variables for data analysiswith missing category being the lowest income level. For sensitivity analysis, we usedincome as a continuous measure.
2.4.4. Perceived Discrimination (PD)
PD was measured using David Williams’ Everyday Discrimination Scale (EDS) [18].This scale uses ten items to assess routine, chronic, daily, and less overt discriminatoryexperiences over the past year [19]. Sample items include “In your day-to-day, life howoften have any of the following things happened to you?” Sample items include: “beingfollowed around in stores”, “people acting as if they think you are dishonest”, “receivingpoorer service than other people at restaurants”, and “being called names or insulted”.Responses are given on a Likert scale ranging from 1 (“never”) to 6 (“almost every day”).For the 10 items, we calculated a summary score ranging from 0 to 50; a higher score reflectsmore frequent experiences with discriminatory events over the past year (Cronbach’s α inthis study = 0.86).
2.5. Statistical Analysis
We used Stata 16.0 to analyze the data taking into account the complex samplingdesign and study weights. As a result, analytic inferences and rates are generalizable tothe US population of similar adult men. To prepare for linear regression analyses, wefirst evaluated possible multicollinearity between educational attainment and householdincome particularly among the Non-Hispanic White sample where education and incomeare likely to have a stronger correlation. We also tested the assumption of linearity ofthe distribution of residuals (errors) before we fit our linear regression models. In all themodels that we estimated, educational attainment (three dummy variables) and householdincome (three dummy variables) were the main independent variables, perceived (daily)discrimination was the dependent variable, and age, marital status, employment status,and household size were the covariates. We decided to control for these variables becauseAfrican American men are more likely to be unemployed, be unmarried, and live with ahigher number of individuals in the household.
We first report results of descriptive analyses comparing males by race. For thesecomparisons, we used unadjusted regression analysis, which is more robust than t testto unequal variance (due to imbalanced sample size across racial groups). Next, weestimated linear regressions regressing PD on our two major SES predictors, educationalattainment, and household income, treated as dummy variables, while controlling forconfounding due to age, marital status, employment status, and household size. We didthis in 4 steps. First, we used the pooled sample to estimate a regression model predictingPD reports using main effects of race, educational attainment, household income, andcovariates but no interaction terms (Model 1). Next, we added interactions to our regressionmodel: educational attainment × race and household income × race/ethnicity (Model2). We then estimated similar stratified models for African American (Model 3) and Non-Hispanic White (Model 4) men separately. For sensitivity analyses, we treated educationalattainment and household income as interval variables. As the results lead to identicalinferences, we did not report the results of replication here; however, they are availablefrom the authors. We reported regression coefficients (b), their standard errors (SEs),associated 95% confidence intervals (CIs), and p-values. A p-value of less than 0.05 wasconsidered significant.
3. Results3.1. Descriptive Statistics
Of the 1643 participating men who entered this analysis, 1271 were African Americanand 372 were Non-Hispanic White. As shown in Table 1, African American men wereyounger, had lower educational attainment, were less likely to be married, and were more

Int. J. Environ. Res. Public Health 2021, 18, 2706 5 of 12
likely to be unemployed and reported lower household income than White men were.African American men also reported higher levels of PD than Non-Hispanic White men.
Table 1. Descriptive characteristics in the pooled sample by race among non-Hispanic African American and Non-HispanicWhite men in the National Survey of American Life.
Sociodemographics& PD
Total Sample (n = 1643) African American Men (n = 1271) Non-Hispanic White Men (n = 372)
Proportion(SE) 95% CI Proportion
(SE) 95% CI Proportion (SE) 95% CI
NHW 53.23 (3.45) 46.28–60.05AA 46.77 (3.45) 39.95–53.72
Household Income *
1st quantile 15.60 (1.54) 12.74–18.96 20.19 (1.70) 16.95–23.87 11.57 (2.47) 7.25–17.962nd quantile 18.83 (2.16) 14.87–23.55 18.91 (1.19) 16.61–21.46 18.75 (3.92) 11.77–28.533rd quantile 27.42 (2.20) 23.22–32.05 30.01 (1.51) 27.04–33.15 25.14 (3.83) 17.88–34.134th quantile 38.16 (3.60) 31.23–45.60 30.89 (2.16) 26.69–35.44 44.54 (6.41) 31.60–58.27
Educational Attainment *
0–11 Years 19.27 (1.77) 15.96–23.07 23.11 (1.58) 20.06–26.48 15.88 (3.02) 10.44–23.4312 Years 36.58 (3.09) 30.62–42.98 39.57 (1.78) 36.02–43.25 33.94 (5.60) 23.18–46.6713–15 Years 22.72 (1.45) 19.93–25.76 22.95 (1.63) 19.82–26.43 22.50 (2.30) 17.98–27.7916+ Years 21.44 (3.71) 14.91–29.83 14.36 (1.52) 11.54–17.72 27.67 (6.67) 15.82–43.76
Employment Status *
Employed 94.27 (0.87) 92.26–95.78 91.24 (1.01) 88.96–93.08 96.93 (1.16) 93.23–98.64Unemployed 5.73 (0.87) 4.22–7.74 8.76 (1.01) 6.92–11.04 3.07 (1.16) 1.36–6.77
Marital Status *
Not Married 44.85 (2.55) 39.80–50.00 50.62 (1.65) 47.27–53.96 39.77 (4.31) 31.03–49.23Married 55.15 (2.55) 50.00–60.20 49.38 (1.65) 46.04–52.73 60.23 (4.31) 50.77–68.97
Mean (SE) 95% CI Mean (SE) 95% CI Mean (SE) 95% CI
Age (Years) * 44.15 (0.76) 42.63–45.68 41.76 (0.65) 40.44–43.09 46.22 (1.31) 43.44–49.01Household Size * 2.53 (0.09) 2.36–2.70 2.73 (0.06) 2.61–2.86 2.36 (0.15) 2.03–2.69PerceivedDiscrimination * 11.21 (0.33) 10.54–11.87 13.76 (0.48) 12.79–14.73 9.00 (0.32) 8.32–9.68
Notes: Source: National Survey of American Life (NSAL 2001–2003), CI: Confidence Interval; PD: perceived discrimination; SE: StandardError, * p < 0.05.
3.2. Pooled Sample
In Table 2, we summarize the results of two linear regressions with PD as the outcome.Results from Model 1 indicated that being African American as opposed to being Non-Hispanic White, being younger, and reporting lower levels of household income wereassociated with higher level of PD. Educational attainment, however, was not associatedwith PD.
When interaction terms were added to the model (Model 2), the main effect ofrace/ethnicity attenuated with the variance of the effect being reflected in the interac-tion terms between race/ethnicity and household income. Comparisons of estimate meansthat higher income has a larger protective (inverse) effect on PD for Non-Hispanic Whitemen than African American men.

Int. J. Environ. Res. Public Health 2021, 18, 2706 6 of 12
Table 2. Summary of linear regression on the effects of educational attainment and household income on perceiveddiscrimination in the pooled sample of African American and Non-Hispanic White men in the National Survey of AmericanLife.
Sociodemographics
Total Sample(n = 1643)
Model 1Main Effects
Model 2M1 + Interactions
b (SE) 95% CI p b (SE) 95% CI p
All
Race (AfricanAmericans) 3.83 (0.53) 2.76–4.89 <0.001 *** −1.40 (2.60) −6.64–3.83 0.592
Age −0.14 (0.01) −0.16–0.11 <0.001 *** −0.14 (0.01) −0.16–0.11 <0.001 ***HH Size −0.10 (0.23) −0.56–0.37 0.684 −0.03 (0.22) −0.47–0.40 0.875Unemployed 2.45 (1.51) −0.59–5.49 0.112 2.52 (1.45) −0.40–5.44 0.089Married −0.56 (0.46) −1.48–0.37 0.232 −0.55 (0.47) −1.50–0.39 0.245
Educational attainment
0–1112 years −0.38 (0.81) −2.00–1.24 0.639 −0.65 (1.14) −2.93–1.63 0.57113–15 years 1.14 (1.04) −0.94–3.23 0.275 0.72 (1.63) −2.57–4.00 0.66216 + years −0.39 (1.14) −2.69–1.91 0.732 −0.59 (1.55) −3.70–2.53 0.705
Household income
1st quantile2nd quantile −2.58 (1.51) −5.63–0.46 0.095 −6.02 (2.67) −11.40–0.65 0.0293rd quantile −3.30 (1.24) −5.79–0.80 0.011 * −6.31 (2.14) −10.60–2.02 0.005 **4th quantile −2.20 (1.04) −4.30–0.11 0.040 −5.38 (1.80) −9.00–1.75 0.004 **
Race × Education (12years) 0.69 (1.51) −2.34–3.72 0.648
Race × Education(13–15 years) 1.00 (1.90) −2.83–4.82 0.604
Race × Education(16+ years) 0.79 (1.88) −2.99–4.58 0.675
Race × Income (2ndquantile) 6.02 (2.85) 0.29–11.75 0.040
Race × Income (3rdquantile) 4.95 (2.44) 0.05–9.85 0.048
Race × Income (4thquantile) 5.40 (2.07) 1.24–9.56 0.012 *
Intercept 18.01 (1.89) 14.20–21.81 <0.001 *** 20.95 (2.35) 16.22–25.67 <0.001 ***
Notes: Source: National Survey of American Life (NSAL 2001–2003), Outcome: Discrimination (Everyday), Independent variables treatedas dummy variables. CI: Confidence Interval; SE: Standard Error. * p < 0.05, ** p < 0.01, *** p < 0.001.
3.3. Stratified Models
In Table 3, we present the results of the race-stratified regression models. AmongAfrican American men (Model 3), high household income was uncorrelated with PD(p = 0.71). For White men (Model 4), however, higher household income was associatedwith less PD (b = −0.91 p = 0.009). For none of the groups was educational attainmentassociated with PD (p > 0.05 for both races).

Int. J. Environ. Res. Public Health 2021, 18, 2706 7 of 12
Table 3. Summary of linear regression on the effects of education attainment and household income on perceived discrimi-nation by race among men in the National Survey of American Life (NSAL).
Characteristics
Total Sample(n = 1643)
Model 3African American Men
Model 4Non-Hispanic White Men
b (SE) 95% CI p b (SE) 95% CI p
All
Age −0.12 (0.02) −0.15–0.09 <0.001 *** −0.16 (0.03) −0.22–0.10 <0.001 ***HH Size 0.37 (0.20) −0.04–0.78 0.074 −0.60 (0.46) −1.57–0.38 0.211Unemployed 1.51 (1.35) −1.24–4.26 0.272 4.85 (3.45) −2.49–12.19 0.180Married −1.15 (0.70) −2.58–0.28 0.113 0.25 (0.70) −1.24–1.74 0.725
Educational attainment
0–1112 years 0.15 (1.00) −1.89–2.19 0.884 −0.47 (1.11) −2.83–1.89 0.67913–15 years 1.87 (1.02) −0.20–3.94 0.075 0.76 (1.65) −2.76–4.28 0.65216+ years 0.39 (1.11) −1.86–2.64 0.729 −0.71 (1.62) −4.16–2.73 0.665
Household income
1st quantile2nd quantile 0.04 (1.02) −2.03–2.12 0.966 −5.71 (2.75) −11.58–0.15 0.0553rd quantile −1.40 (1.23) −3.91–1.10 0.263 −6.12 (2.19) −10.79–1.44 0.014 *4th quantile −0.16 (1.27) −2.73–2.42 0.903 −5.14 (1.93) −9.25–1.03 0.018 *
Intercept 18.01 (1.55) 14.85–21.17 <0.001 *** 22.51 (2.65) 16.87–28.15 <0.001 ***
Notes: Source: National Survey of American Life (NSAL 2001–2003), Outcome: Discrimination (Everyday), Independent variables treatedas dummy variables. Confidence Interval (CI); Standard Error (SE). * p < 0.05, *** p < 0.001.
3.4. Robustness Check
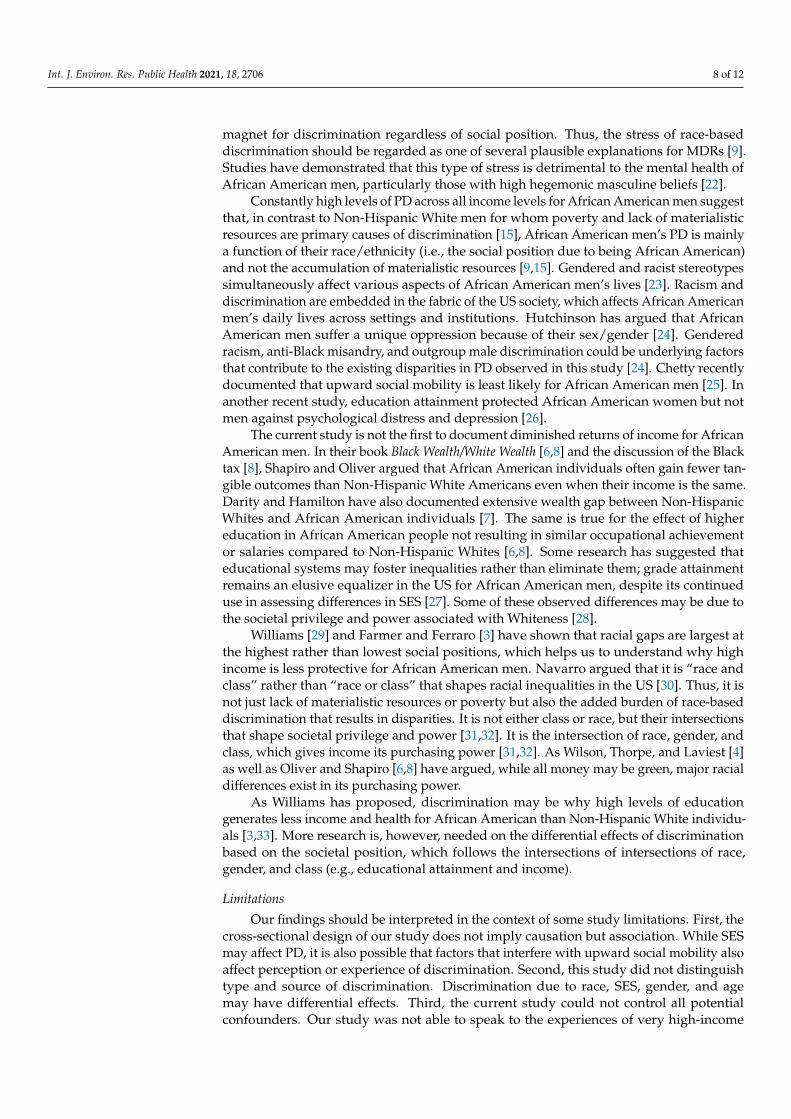
While our main models used parental education and household income as threedummy variables, we also ran replication models with educational attainment and house-hold income as continuous/interval measures. Similar to our main analysis, educationattainment did not have a main effect or interaction with race/ethnicity, while householdincome had a protective effect and also showed interaction with race/ethnicity, suggestingweaker protective effect of household income for African American than Non-HispanicWhite men (Figure A1, Tables A1 and A2).
4. Discussion
Two major results were found. First, high household income but not high educationalattainment was protective against PD in the overall sample of American men. Second, aprotective effect of household income against PD was only detectable for Non-HispanicWhite but not African American men. That is, although high-income Non-Hispanic Whitemen are protected against PD, African American men report high levels of PD at allincome levels.
At least three recent studies have documented related findings. In the first study,Colen and colleagues [13] showed that for Whites, income gain over time was associatedwith less exposure to PD. Upwardly mobile African American people, however, reportedmore PD compared to their socioeconomically stable counterparts [13]. In the second study,while income improved self-rated mental health for Whites, African American individualsreported poor self-rated mental health across all income levels [20]. A third study showedthat upward and downward educational mobility were associated with an increase instressful life events for Non-Hispanic Whites; however, African American individualsreported high levels of stressful life events, regardless of their social mobility status [21].Thus, for African American individuals, various types of stress are not reduced as a resultof occupying a higher status in society. Instead, race/ethnicity appears to serve as a steady
Int. J. Environ. Res. Public Health 2021, 18, 2706 8 of 12
magnet for discrimination regardless of social position. Thus, the stress of race-baseddiscrimination should be regarded as one of several plausible explanations for MDRs [9].Studies have demonstrated that this type of stress is detrimental to the mental health ofAfrican American men, particularly those with high hegemonic masculine beliefs [22].
Constantly high levels of PD across all income levels for African American men suggestthat, in contrast to Non-Hispanic White men for whom poverty and lack of materialisticresources are primary causes of discrimination [15], African American men’s PD is mainlya function of their race/ethnicity (i.e., the social position due to being African American)and not the accumulation of materialistic resources [9,15]. Gendered and racist stereotypessimultaneously affect various aspects of African American men’s lives [23]. Racism anddiscrimination are embedded in the fabric of the US society, which affects African Americanmen’s daily lives across settings and institutions. Hutchinson has argued that AfricanAmerican men suffer a unique oppression because of their sex/gender [24]. Genderedracism, anti-Black misandry, and outgroup male discrimination could be underlying factorsthat contribute to the existing disparities in PD observed in this study [24]. Chetty recentlydocumented that upward social mobility is least likely for African American men [25]. Inanother recent study, education attainment protected African American women but notmen against psychological distress and depression [26].
The current study is not the first to document diminished returns of income for AfricanAmerican men. In their book Black Wealth/White Wealth [6,8] and the discussion of the Blacktax [8], Shapiro and Oliver argued that African American individuals often gain fewer tan-gible outcomes than Non-Hispanic White Americans even when their income is the same.Darity and Hamilton have also documented extensive wealth gap between Non-HispanicWhites and African American individuals [7]. The same is true for the effect of highereducation in African American people not resulting in similar occupational achievementor salaries compared to Non-Hispanic Whites [6,8]. Some research has suggested thateducational systems may foster inequalities rather than eliminate them; grade attainmentremains an elusive equalizer in the US for African American men, despite its continueduse in assessing differences in SES [27]. Some of these observed differences may be due tothe societal privilege and power associated with Whiteness [28].
Williams [29] and Farmer and Ferraro [3] have shown that racial gaps are largest atthe highest rather than lowest social positions, which helps us to understand why highincome is less protective for African American men. Navarro argued that it is “race andclass” rather than “race or class” that shapes racial inequalities in the US [30]. Thus, it isnot just lack of materialistic resources or poverty but also the added burden of race-baseddiscrimination that results in disparities. It is not either class or race, but their intersectionsthat shape societal privilege and power [31,32]. It is the intersection of race, gender, andclass, which gives income its purchasing power [31,32]. As Wilson, Thorpe, and Laviest [4]as well as Oliver and Shapiro [6,8] have argued, while all money may be green, major racialdifferences exist in its purchasing power.
As Williams has proposed, discrimination may be why high levels of educationgenerates less income and health for African American than Non-Hispanic White individu-als [3,33]. More research is, however, needed on the differential effects of discriminationbased on the societal position, which follows the intersections of intersections of race,gender, and class (e.g., educational attainment and income).
Limitations
Our findings should be interpreted in the context of some study limitations. First, thecross-sectional design of our study does not imply causation but association. While SESmay affect PD, it is also possible that factors that interfere with upward social mobility alsoaffect perception or experience of discrimination. Second, this study did not distinguishtype and source of discrimination. Discrimination due to race, SES, gender, and agemay have differential effects. Third, the current study could not control all potentialconfounders. Our study was not able to speak to the experiences of very high-income

Int. J. Environ. Res. Public Health 2021, 18, 2706 9 of 12
level individuals/households because they were not captured in the National Survey ofAmerican Life. Fourth, this study used household rather than personal income. While theunit of analysis in this study was household rather than the individual, household incomemay better reflect all the resources that a person has to bring to bear in their social position.
5. Conclusions
Focusing the research agenda to answer the many unanswered research questionsraised in our study would enhance efforts to better identify and address the unique waysthat African American men face higher levels of negative mental and physical healthoutcomes in the United States. Our results showed that social patterning of PD based onhousehold income differs for African American men from that of Non-Hispanic Whitemen. That is, race/ethnicity and income have nonlinear and intersectional effects on thedistribution of PD, with higher-income African American men not having equal upliftingof their disadvantage in ways Non-Hispanic White men benefit from income and educationOur findings may potentially explain why African American men do not gain muchphysical and mental health protection against negative health outcomes in the face ofincreasing attainment of income and education. In the United States, where the ideologyof individualism is prevalent, it is believed that hard work in the face of opportunitycan facilitate an individual reaching the American dream. It is believed that through theattainment of higher levels of income and educational attainment, greater relief will befound against being treated differently, badly, or unfairly [34]. This belief carries withit the idea that pathways to achievement can be accomplished regardless of race, class,gender, age, or national origin [34]. Results of our study show that this is clearly not thecase for many African American men. It is therefore important to acknowledge that thepath to reducing health disparities for African American men cannot be only throughindividual economic or behavioral changes alone but must address the subtle and not sosubtle ways in which structural barriers limit and bound the benefits of African Americanmen’s economic achievements. African American men’s dreams deferred is an experiencethat should be examined relative to their poor physical and mental health outcomes [35].
Author Contributions: S.A. conceptualized and designed the work, analyzed the data, and preparedthe first draft of the manuscript. V.M.M. contributed to the conceptualization and design of the work,interpretation of the results, and revisions of this paper. S.D.C. participated in the analytic plan anddevelopment of tables and editing of the manuscript. All authors approved the final draft of themanuscript. All authors have read and agreed to the published version of the manuscript.
Funding: The NSAL (including NSAL-A) was mostly supported by the National Institute of MentalHealth, with grant U01-MH57716 to James S. Jackson. Other support came from the Office ofBehavioral and Social Science Research at the National Institutes of Health and the University ofMichigan. This manuscript was partially supported by the National Institute for Minority Healthand Health Disparities (MD006932) and the National Institute of Mental Health (MH115344).
Institutional Review Board Statement: The University of Michigan (UM) Institute Review Board(IRB) approved the NSAL study protocol. However, the data in this manuscript was exempt from IRB.
Informed Consent Statement: Written informed consent was received from all the participants.Respondents received financial compensation for their time.
Data Availability Statement: This data is available through the University of Michigan ICPSR.
Conflicts of Interest: The authors declare no conflict of interest.
Int. J. Environ. Res. Public Health 2021, 18, 2706 10 of 12
Appendix A
Table A1. Summary of linear regressions on the effects of educational attainment and household income as interval variableson perceived discrimination in African American and Non-Hispanic White men in the National Survey of American Life(sensitivity analysis).
Characteristics
African American Men(n = 1271)
White Men(n = 372)
Model 3 Model 4
b (SE) 95% CI p b (SE) 95% CI p
Age −0.14 (0.01) *** −0.17–0.11 <0.001 −0.15 (0.02) *** −0.19–0.11 <0.001Educational attainment 0.31 (0.35) −0.40–1.01 0.381 −0.14 (0.58) −1.38–1.10 0.817
Household income −0.10 (0.27) −0.66–0.45 0.707 −0.91 (0.31) ** −1.56–0.26 0.009Intercept 19.00 (1.15) *** 16.65–21.34 <0.001 19.59 (2.31) *** 14.67–24.52 <0.001
Notes: Source: National Survey of American Life (NSAL 2001–2003), Outcome: Discrimination (Everyday), Independent variables treatedas interval measures. Household income measured as (1) 0–9999 USD, (2) 10,000 USD–19,999 USD, (3) 20,000 USD–39,999 USD, and (4)40,000 USD or more. Education attainment measured as (1) equal or less than 11 years, (2) 12 years, (3) 13 to 15 years, and (4) 16+ years.Confidence Interval (CI); Standard Error (SE). ** p < 0.01, *** p < 0.001.
Int. J. Environ. Res. Public Health 2021, 18, x 10 of 12
Appendix A
Table A1. Summary of linear regressions on the effects of educational attainment and household income as interval vari-ables on perceived discrimination in African American and Non-Hispanic White men in the National Survey of American Life (sensitivity analysis).
Characteristics
African American Men (n = 1271)
White Men (n = 372)
Model 3 Model 4 b (SE) 95% CI p b (SE) 95% CI p
Age −0.14 (0.01) *** −0.17−0.11 <0.001 −0.15 (0.02) *** −0.19−0.11 <0.001 Educational at-
tainment 0.31 (0.35) −0.40–1.01 0.381 −0.14 (0.58) −1.38–1.10 0.817
Household in-come
−0.10 (0.27) −0.66–0.45 0.707 −0.91 (0.31) ** −1.56−0.26 0.009
Intercept 19.00 (1.15) *** 16.65–21.34 <0.001 19.59 (2.31) *** 14.67–24.52 <0.001 Notes: Source: National Survey of American Life (NSAL 2001–2003), Outcome: Discrimination (Everyday), Independent variables treated as interval measures. Household income measured as (1) 0–9999 USD, (2) 10,000 USD–19,999 USD, (3) 20,000 USD–39,999 USD, and (4) 40,000 USD or more. Education attainment measured as (1) equal or less than 11 years, (2) 12 years, (3) 13 to 15 years, and (4) 16+ years. Confidence Interval (CI); Standard Error (SE). ** p < 0.01, *** p < 0.001.
Figure A1. Interaction between race and income on perceived discrimination in White (solid line) and African American (dotted line) men. Source: National Survey of American Life.
Appendix B
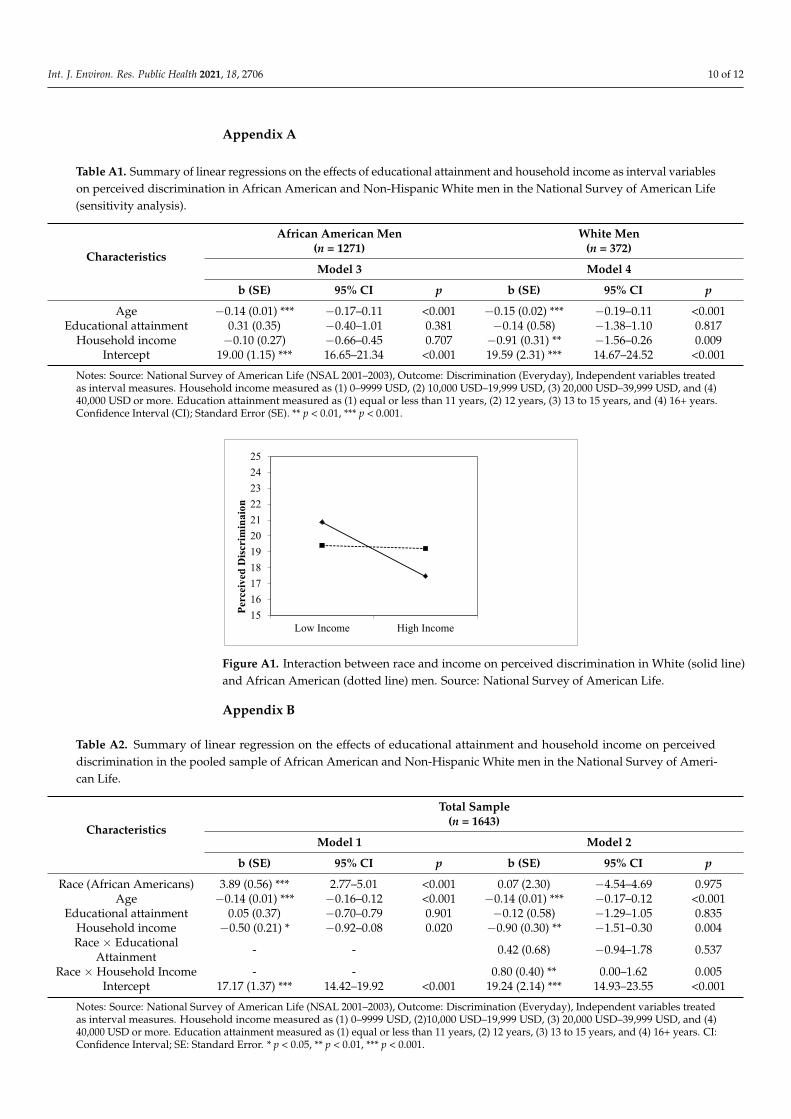
Table A2. Summary of linear regression on the effects of educational attainment and household income on perceived discrimination in the pooled sample of African American and Non-Hispanic White men in the National Survey of Amer-ican Life.
Characteristics
Total Sample (n = 1643)
Model 1 Model 2 b (SE) 95% CI p b (SE) 95% CI p
Race (African Americans) 3.89 (0.56) *** 2.77–5.01 <0.001 0.07 (2.30) −4.54–4.69 0.975 Age −0.14 (0.01) *** −0.16−0.12 <0.001 −0.14 (0.01) *** −0.17−0.12 <0.001
Educational attainment 0.05 (0.37) −0.70–0.79 0.901 −0.12 (0.58) −1.29–1.05 0.835 Household income −0.50 (0.21) * −0.92−0.08 0.020 −0.90 (0.30) ** −1.51−0.30 0.004
Race × Educational Attainment - - 0.42 (0.68) −0.94–1.78 0.537
1516171819202122232425
Low Income High Income
Perc
eive
d D
iscri
min
aion
Figure A1. Interaction between race and income on perceived discrimination in White (solid line)and African American (dotted line) men. Source: National Survey of American Life.
Appendix B
Table A2. Summary of linear regression on the effects of educational attainment and household income on perceiveddiscrimination in the pooled sample of African American and Non-Hispanic White men in the National Survey of Ameri-can Life.
Characteristics
Total Sample(n = 1643)
Model 1 Model 2
b (SE) 95% CI p b (SE) 95% CI p
Race (African Americans) 3.89 (0.56) *** 2.77–5.01 <0.001 0.07 (2.30) −4.54–4.69 0.975Age −0.14 (0.01) *** −0.16–0.12 <0.001 −0.14 (0.01) *** −0.17–0.12 <0.001
Educational attainment 0.05 (0.37) −0.70–0.79 0.901 −0.12 (0.58) −1.29–1.05 0.835Household income −0.50 (0.21) * −0.92–0.08 0.020 −0.90 (0.30) ** −1.51–0.30 0.004Race × Educational
Attainment - - 0.42 (0.68) −0.94–1.78 0.537
Race × Household Income - - 0.80 (0.40) ** 0.00–1.62 0.005Intercept 17.17 (1.37) *** 14.42–19.92 <0.001 19.24 (2.14) *** 14.93–23.55 <0.001
Notes: Source: National Survey of American Life (NSAL 2001–2003), Outcome: Discrimination (Everyday), Independent variables treatedas interval measures. Household income measured as (1) 0–9999 USD, (2)10,000 USD–19,999 USD, (3) 20,000 USD–39,999 USD, and (4)40,000 USD or more. Education attainment measured as (1) equal or less than 11 years, (2) 12 years, (3) 13 to 15 years, and (4) 16+ years. CI:Confidence Interval; SE: Standard Error. * p < 0.05, ** p < 0.01, *** p < 0.001.

Int. J. Environ. Res. Public Health 2021, 18, 2706 11 of 12
References1. Phelan, J.C.; Link, B.G.; Tehranifar, P. Social conditions as fundamental causes of health inequalities: Theory, evidence, and policy
implications. J. Health Soc. Behav. 2010, 51, S28–S40. [CrossRef] [PubMed]2. Assari, S. Health disparities due to blacks’ diminished return: Public policy solutions. Soc. Issues Policy Rev. 2018, 12, 112–145.
[CrossRef]3. Farmer, M.M.; Ferraro, K.F. Are racial disparities in health conditional on socioeconomic status? Soc. Sci. Med. 2005, 60, 191–204.
[CrossRef] [PubMed]4. Wilson, K.B.; Thorpe, R.J., Jr.; LaVeist, T.A. Dollar for dollar: Racial and ethnic inequalities in health and health-related outcomes
among persons with very high income. Prev. Med. 2017, 96, 149–153. [CrossRef]5. Assari, S.; Caldwell, C.H. High risk of depression in high-income African American boys. J. Racial Ethn. Health Disparities 2018, 5,
808–819. [CrossRef]6. Oliver, M.; Shapiro, T. Black Wealth/White Wealth: A New Perspective on Racial Inequality; Routledge: New York, NY, USA, 2013.7. Hamilton, D.; Darity, W., Jr. Race, Wealth, and Intergenerational Poverty: There will never be a post-racial America if the wealth
gap persists. Am. Prospect 2009, 20, A10–A12.8. Shapiro, T.M. The Hidden Cost of Being African American: How Wealth Perpetuates Inequality; Oxford University Press: Cary, NC,
USA, 2004.9. Assari, S.; Lankarani, M.M.; Caldwell, C.H. Does discrimination explain high risk of depression among high-income African
American men? Behav. Sci 2018, 8, 40. [CrossRef]10. Pascoe, E.A.; Smart, R.L. Perceived discrimination and health: A meta-analytic review. Psychol. Bull. 2009, 35, 531–554. [CrossRef]11. Mays, V.M.; Cochran, S.D.; Barnes, N.W. Race, race-based discrimination, and health outcomes among African Americans. Annu.
Rev. Psychol. 2007, 58, 201–225. [CrossRef]12. Assari, S.; Moghani, L.M. Workplace racial composition explains high perceived discrimination of high socioeconomic status
African American men. Brain Sci. 2018, 8, 139. [CrossRef]13. Colen, C.G.; Ramey, D.M.; Cooksey, E.C.; Williams, D.R. Racial disparities in health among nonpoor African Americans and
Hispanics: The role of acute and chronic discrimination. Soc. Sci. Med. 2018, 199, 167–180. [CrossRef]14. Hudson, D.L.; Puterman, E.; Bibbins-Domingo, K.; Matthews, K.A.; Adler, N.E. Race, life course socioeconomic position, racial
discrimination, depressive symptoms and self-rated health. Soc. Sci. Med. 2013, 97, 7–14. [CrossRef]15. Fuller-Rowell, T.E.; Curtis, D.S.; Chae, D.H.; Ryff, C.D. Longitudinal health consequences of socioeconomic disadvantage:
Examining perceived discrimination as a mediator. Health Psychol. 2018, 37, 491–500. [CrossRef]16. Assari, S. Interaction between race and gender on implicit racial bias against Blacks. Int. J. Epidemiol. Res. 2018, 5, 43–49.
[CrossRef]17. Jackson, J.S.; Neighbors, H.W.; Nesse, R.M.; Trierweiler, S.J.; Torres, M. Methodological innovations in the National Survey of
American Life. Int. J. Methods Psychiatr. Res. 2004, 13, 289–298. [CrossRef] [PubMed]18. Nazroo, J.; Jackson, S.; Karlsen, S.; Torres, M. The black diaspora and health inequalities in the US and in England: Does where
you go and how you get there make a difference? Soc. Health Illn. 2007, 29, 811–830. [CrossRef] [PubMed]19. Williams, D.R.; Yu, Y.; Jackson, J.S.; Anderson, N.B. Racial differences in physical and mental health socio-economic status, stress
and discrimination. J. Health Psychol. 1997, 2, 335–351. [CrossRef]20. Assari, S.; Lapeyrouse, L.M.; Neighbors, H.W. Income and self-rated mental health: Diminished returns for high income black
Americans. Behav. Sci. 2018, 8, 50. [CrossRef] [PubMed]21. Assari, S. Race, intergenerational social mobility and stressful life events. Behav. Sci. 2018, 8, 86. [CrossRef] [PubMed]22. Hammond, W.P. Taking it like a man: Masculine role norms as moderators of the racial discrimination-depressive symptoms
association among African American men. Am. J. Public Health 2012, 102, S232–S241. [CrossRef] [PubMed]23. Sidanius, J.; Pratto, F. Social Dominance: An Intergroup Theory of Social Hierarchy and Oppression; Cambridge University Press: New
York, NY, USA, 1999.24. Hutchinson, D.L. Identity crisis: Intersectionality, multidimensionality, and the development of an adequate theory of subordina-
tion. Mich. J. Race L. 2000, 6, 285.25. Chetty, R.; Hendren, N.; Jones, M.R.; Porter, S.R. Race and economic opportunity in the United States: An intergenerational
perspective (No. w24441). Q. J. Econ. 2020, 135, 711–783. [CrossRef]26. Assari, S. Educational attainment better protects African American women than African American men against depressive
symptoms and psychological distress. Brain Sci. 2018, 8, 182. [CrossRef]27. Zajacova, A.; Rogers, R.G.; Johnson-Lawrence, V. Glitch in the gradient: Additional education does not uniformly equal better
health. Soc. Sci. Med. 2012, 75, 2007–2012. [CrossRef] [PubMed]28. Pearson, J.A. Can’t buy me whiteness: New lessons from the Titanic on race, ethnicity, and health. Du Bois Rev. Soc. Sci. Res. Race
2008, 5, 27–47. [CrossRef]29. Williams, D.R.; Sternthal, M. Understanding racial-ethnic disparities in health: Sociological contributions. J. Health Soc. Behav.
2010, 51, S15–S27. [CrossRef] [PubMed]30. Navarro, V. Race or class, or race and class. Int. J. Health Serv. 1989, 19, 311–314. [CrossRef]

Int. J. Environ. Res. Public Health 2021, 18, 2706 12 of 12
31. Carbado, D.W.; Crenshaw, K.W.; Mays, V.M.; Tomlinson, B. Intersectionality: Mapping the movements of a theory. Du Bois Rev.2013, 10, 303–312. [CrossRef]
32. Mays, V.M.; Ghavami, N. History, aspirations, and transformations of intersectionality: Focusing on gender. In APA Handbook ofthe Psychology of Women: History, Theory, and Battlegrounds; Travis, C.B., White, J.W., Rutherford, A., Williams, W.S., Cook, S.L.,Wyche, K.F., Eds.; American Psychological Association: Washington, DC, USA, 2018; pp. 541–566.
33. Williams, D.R. Race, socioeconomic status, and health. The added effects of racism and discrimination. Ann. N. Y. Acad. Sci. 1999,896, 173–188. [CrossRef]
34. Shelton, J.E. A dream deferred? Privileged Blacks’ and Whites’ beliefs about racial inequality. Du Bois Rev. Soc. Sci. Res. Race 2017,14, 73–91. [CrossRef]
35. Hughes, L. Harlem. In Montage of a Dream Deferred; Holt: New York, NY, USA, 1951.


