Monetary Policy Report October 2015
36
MONETARY POLICY REPORT October 2015
-
Upload
mortgage-resources -
Category
Documents
-
view
306 -
download
1
description
Monetary Policy Report October 2015 . The Bank of Canada today announced that it is maintaining its target for the overnight rate at 1/2 per cent. The Bank Rate is correspondingly 3/4 per cent and the deposit rate is 1/4 per cent.
Transcript of Monetary Policy Report October 2015
MONETARYPOLICYREPORTOctober 2015
The Monetary Policy Report is available on the Bank of Canada’s website at bankofcanada.ca.
For further information, contact:
Public InformationCommunications DepartmentBank of Canada234 Laurier Avenue WestOttawa, Ontario K1A 0G9
Telephone: 613-782-8111; 1-800-303-1282 (toll-free in North America)Email: [email protected]; Website: bankofcanada.ca
ISSN 1201-8783 (Print)ISSN 1490-1234 (Online)© Bank of Canada 2015
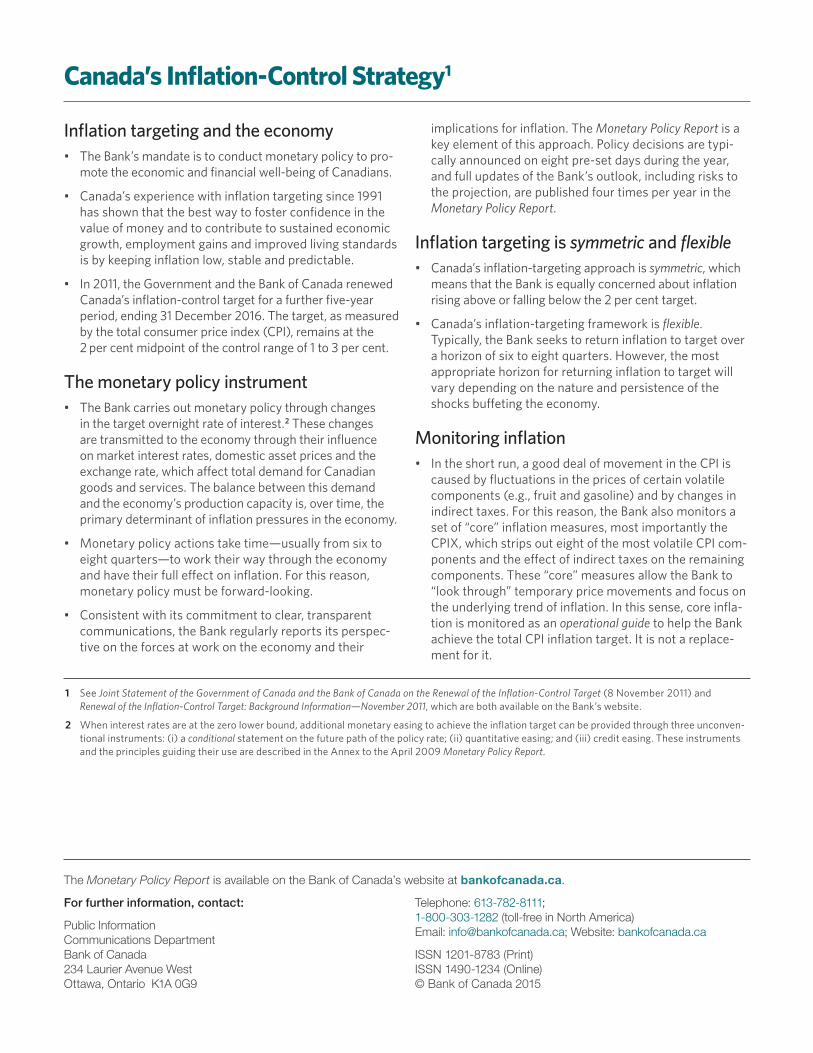
Canada’s Infl ation-Control Strategy1
Infl ation targeting and the economy• the Bank’s mandate is to conduct monetary policy to pro-
mote the economic and fi nancial well-being of Canadians .
• Canada’s experience with infl ation targeting since 1991has shown that the best way to foster confi dence in thevalue of money and to contribute to sustained economicgrowth, employment gains and improved living standardsis by keeping infl ation low, stable and predictable .
• In 2011, the Government and the Bank of Canada renewedCanada’s infl ation-control target for a further fi ve-yearperiod, ending 31 December 2016 . the target, as measuredby the total consumer price index (CPI), remains at the2 per cent midpoint of the control range of 1 to 3 per cent .
The monetary policy instrument• the Bank carries out monetary policy through changes
in the target overnight rate of interest .2 these changesare transmitted to the economy through their infl uenceon market interest rates, domestic asset prices and theexchange rate, which aff ect total demand for Canadiangoods and services . the balance between this demandand the economy’s production capacity is, over time, theprimary determinant of infl ation pressures in the economy .
• Monetary policy actions take time—usually from six toeight quarters—to work their way through the economyand have their full eff ect on infl ation . For this reason,monetary policy must be forward-looking .
• Consistent with its commitment to clear, transparentcommunications, the Bank regularly reports its perspec-tive on the forces at work on the economy and their
implications for infl ation . the Monetary Policy Report is a key element of this approach . Policy decisions are typi-cally announced on eight pre-set days during the year, and full updates of the Bank’s outlook, including risks to the projection, are published four times per year in the Monetary Policy Report .
Infl ation targeting is symmetric and fl exible• Canada’s infl ation-targeting approach is symmetric, which
means that the Bank is equally concerned about infl ationrising above or falling below the 2 per cent target .
• Canada’s infl ation-targeting framework is fl exible . typically, the Bank seeks to return infl ation to target overa horizon of six to eight quarters . However, the mostappropriate horizon for returning infl ation to target willvary depending on the nature and persistence of theshocks buff eting the economy .
Monitoring infl ation• In the short run, a good deal of movement in the CPI is
caused by fl uctuations in the prices of certain volatilecomponents (e .g ., fruit and gasoline) and by changes inindirect taxes . For this reason, the Bank also monitors aset of “core” infl ation measures, most importantly theCPIX, which strips out eight of the most volatile CPI com-ponents and the eff ect of indirect taxes on the remainingcomponents . these “core” measures allow the Bank to“look through” temporary price movements and focus onthe underlying trend of infl ation . In this sense, core infl a-tion is monitored as an operational guide to help the Bankachieve the total CPI infl ation target . It is not a replace-ment for it .
1 See Joint Statement of the Government of Canada and the Bank of Canada on the Renewal of the Infl ation-Control Target (8 November 2011) andRenewal of the Infl ation-Control Target: Background Information—November 2011, which are both available on the Bank’s website .
2 When interest rates are at the zero lower bound, additional monetary easing to achieve the infl ation target can be provided through three unconven-tional instruments: (i) a conditional statement on the future path of the policy rate; (ii) quantitative easing; and (iii) credit easing . these instruments and the principles guiding their use are described in the Annex to the April 2009 Monetary Policy Report .
Monetary Policy ReportOctober 2015
This is a report of the Governing Council of the Bank of Canada: Stephen S. Poloz, Carolyn Wilkins, Timothy Lane, Agathe Côté, Lawrence Schembri and Lynn Patterson.

“The resource sector is continuing to adjust to lower prices, and…these complex adjustments will take considerable time. Our inflation-targeting regime will help facilitate these adjustments. Canada has seen this movie before—we’ve managed it well in the past, and I’m confident we will continue to manage it well in the future.”
—Stephen S. Poloz
Governor, Bank of CanadaCalgary, Alberta21 September 2015
ContentsGlobal Economy . . . . . . . . . . . . . . . . . . . . . . . . . . . . . . . . . . . . . . . . . . . . . . . . . . . . . . . . . . . . 1
United States . . . . . . . . . . . . . . . . . . . . . . . . . . . . . . . . . . . . . . . . . . . . . . . . . . . . . . . . . . . . 3
China . . . . . . . . . . . . . . . . . . . . . . . . . . . . . . . . . . . . . . . . . . . . . . . . . . . . . . . . . . . . . . . . . . . . . 5
Other emerging-market economies . . . . . . . . . . . . . . . . . . . . . . . . . . . . . . . . . . . . . . 6
Global financial conditions . . . . . . . . . . . . . . . . . . . . . . . . . . . . . . . . . . . . . . . . . . . . . . . 7
Oil prices . . . . . . . . . . . . . . . . . . . . . . . . . . . . . . . . . . . . . . . . . . . . . . . . . . . . . . . . . . . . . . . . . 9
Non-energy commodity prices . . . . . . . . . . . . . . . . . . . . . . . . . . . . . . . . . . . . . . . . . .11
Summary . . . . . . . . . . . . . . . . . . . . . . . . . . . . . . . . . . . . . . . . . . . . . . . . . . . . . . . . . . . . . . . .11
Canadian Economy . . . . . . . . . . . . . . . . . . . . . . . . . . . . . . . . . . . . . . . . . . . . . . . . . . . . . . . . 13
Inflation . . . . . . . . . . . . . . . . . . . . . . . . . . . . . . . . . . . . . . . . . . . . . . . . . . . . . . . . . . . . . . . . . 14
Recent developments . . . . . . . . . . . . . . . . . . . . . . . . . . . . . . . . . . . . . . . . . . . . . . . . . . . 16
Capacity pressures . . . . . . . . . . . . . . . . . . . . . . . . . . . . . . . . . . . . . . . . . . . . . . . . . . . . . . 18
Economic outlook . . . . . . . . . . . . . . . . . . . . . . . . . . . . . . . . . . . . . . . . . . . . . . . . . . . . . . .20
Box 1: Measuring Capacity During Structural Reallocation . . . . . . . . . . . . . . . 21
Potential output . . . . . . . . . . . . . . . . . . . . . . . . . . . . . . . . . . . . . . . . . . . . . . . . . . . . . . . . .22
Canadian financial conditions . . . . . . . . . . . . . . . . . . . . . . . . . . . . . . . . . . . . . . . . . . .23
Exports . . . . . . . . . . . . . . . . . . . . . . . . . . . . . . . . . . . . . . . . . . . . . . . . . . . . . . . . . . . . . . . . .24
Business investment . . . . . . . . . . . . . . . . . . . . . . . . . . . . . . . . . . . . . . . . . . . . . . . . . . . .26
Household spending . . . . . . . . . . . . . . . . . . . . . . . . . . . . . . . . . . . . . . . . . . . . . . . . . . . .27
Inflation outlook . . . . . . . . . . . . . . . . . . . . . . . . . . . . . . . . . . . . . . . . . . . . . . . . . . . . . . . .28
Risks to the Inflation Outlook . . . . . . . . . . . . . . . . . . . . . . . . . . . . . . . . . . . . . . . . . . . . 31
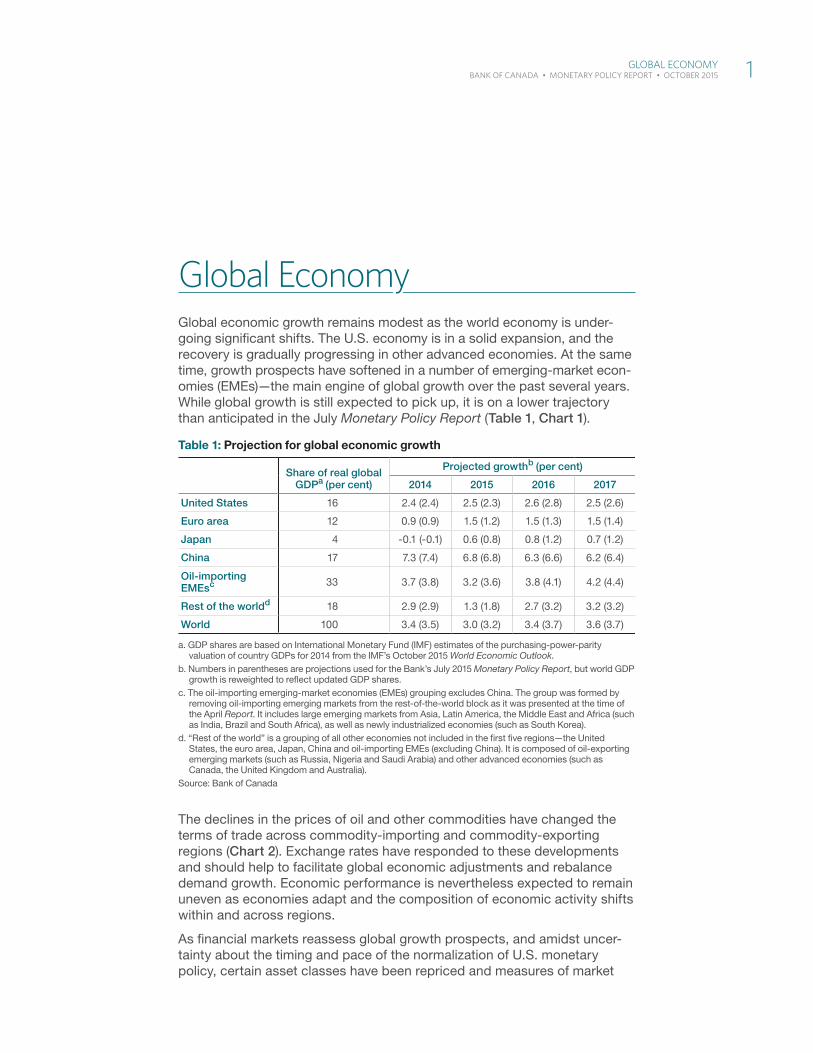
Global EconomyGlobal economic growth remains modest as the world economy is under-going significant shifts. The U.S. economy is in a solid expansion, and the recovery is gradually progressing in other advanced economies. At the same time, growth prospects have softened in a number of emerging-market econ-omies (EMEs)—the main engine of global growth over the past several years. While global growth is still expected to pick up, it is on a lower trajectory than anticipated in the July Monetary Policy Report (Table 1, Chart 1).
The declines in the prices of oil and other commodities have changed the terms of trade across commodity-importing and commodity-exporting regions (Chart 2). Exchange rates have responded to these developments and should help to facilitate global economic adjustments and rebalance demand growth. Economic performance is nevertheless expected to remain uneven as economies adapt and the composition of economic activity shifts within and across regions.
As financial markets reassess global growth prospects, and amidst uncer-tainty about the timing and pace of the normalization of U.S. monetary policy, certain asset classes have been repriced and measures of market
Table 1: Projection for global economic growth
Share of real global GDPa (per cent)
Projected growthb (per cent)
2014 2015 2016 2017
United States 16 2.4 (2.4) 2.5 (2.3) 2.6 (2.8) 2.5 (2.6)
Euro area 12 0.9 (0.9) 1.5 (1.2) 1.5 (1.3) 1.5 (1.4)
Japan 4 -0.1 (-0.1) 0.6 (0.8) 0.8 (1.2) 0.7 (1.2)
China 17 7.3 (7.4) 6.8 (6.8) 6.3 (6.6) 6.2 (6.4)
Oil-importing EMEsc 33 3.7 (3.8) 3.2 (3.6) 3.8 (4.1) 4.2 (4.4)
Rest of the worldd 18 2.9 (2.9) 1.3 (1.8) 2.7 (3.2) 3.2 (3.2)
World 100 3.4 (3.5) 3.0 (3.2) 3.4 (3.7) 3.6 (3.7)
a. GDP shares are based on International Monetary Fund (IMF) estimates of the purchasing-power-parity valuation of country GDPs for 2014 from the IMF’s October 2015 World Economic Outlook.
b. Numbers in parentheses are projections used for the Bank’s July 2015 Monetary Policy Report, but world GDP growth is reweighted to refl ect updated GDP shares.
c. The oil-importing emerging-market economies (EMEs) grouping excludes China. The group was formed by removing oil-importing emerging markets from the rest-of-the-world block as it was presented at the time of the April Report. It includes large emerging markets from Asia, Latin America, the Middle East and Africa (such as India, Brazil and South Africa), as well as newly industrialized economies (such as South Korea).
d. “Rest of the world” is a grouping of all other economies not included in the fi rst fi ve regions—the United States, the euro area, Japan, China and oil-importing EMEs (excluding China). It is composed of oil-exporting emerging markets (such as Russia, Nigeria and Saudi Arabia) and other advanced economies (such as Canada, the United Kingdom and Australia).
Source: Bank of Canada
Global EConoMy 1 BANK OF CANADA • MONEtARy POlICy REPORt • OCtOBER 2015
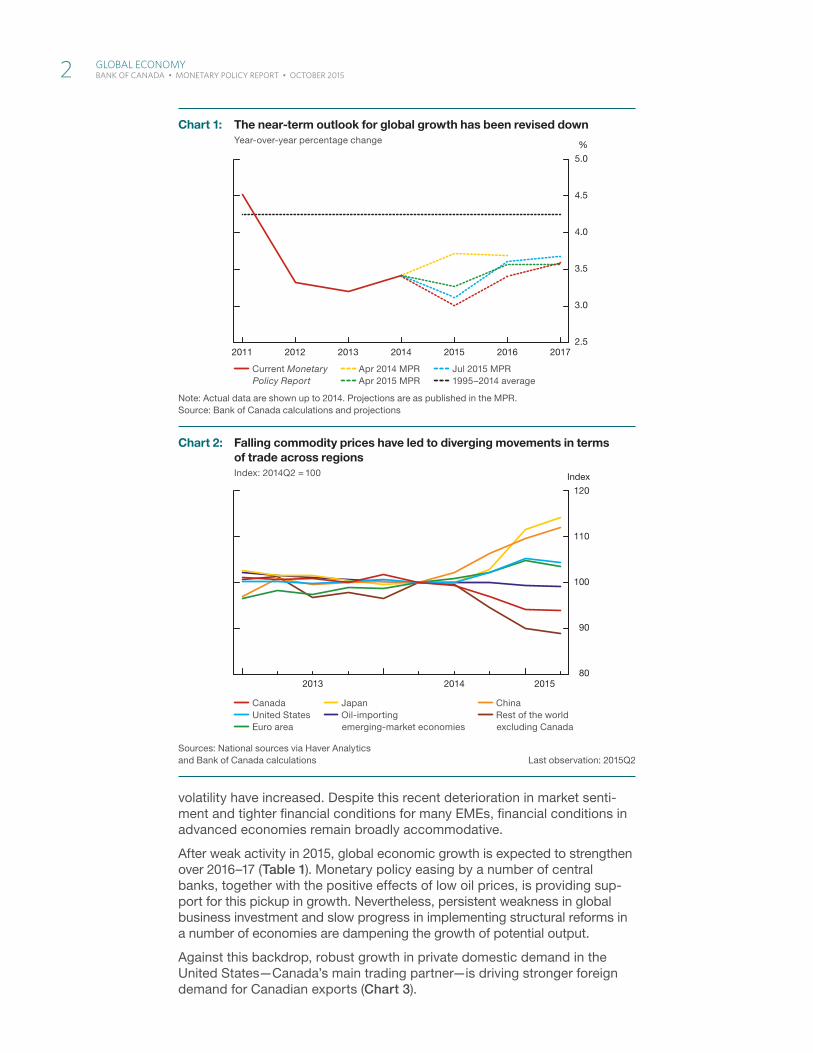
volatility have increased. Despite this recent deterioration in market senti-ment and tighter financial conditions for many EMEs, financial conditions in advanced economies remain broadly accommodative.
After weak activity in 2015, global economic growth is expected to strengthen over 2016–17 (Table 1). Monetary policy easing by a number of central banks, together with the positive effects of low oil prices, is providing sup-port for this pickup in growth. Nevertheless, persistent weakness in global business investment and slow progress in implementing structural reforms in a number of economies are dampening the growth of potential output.
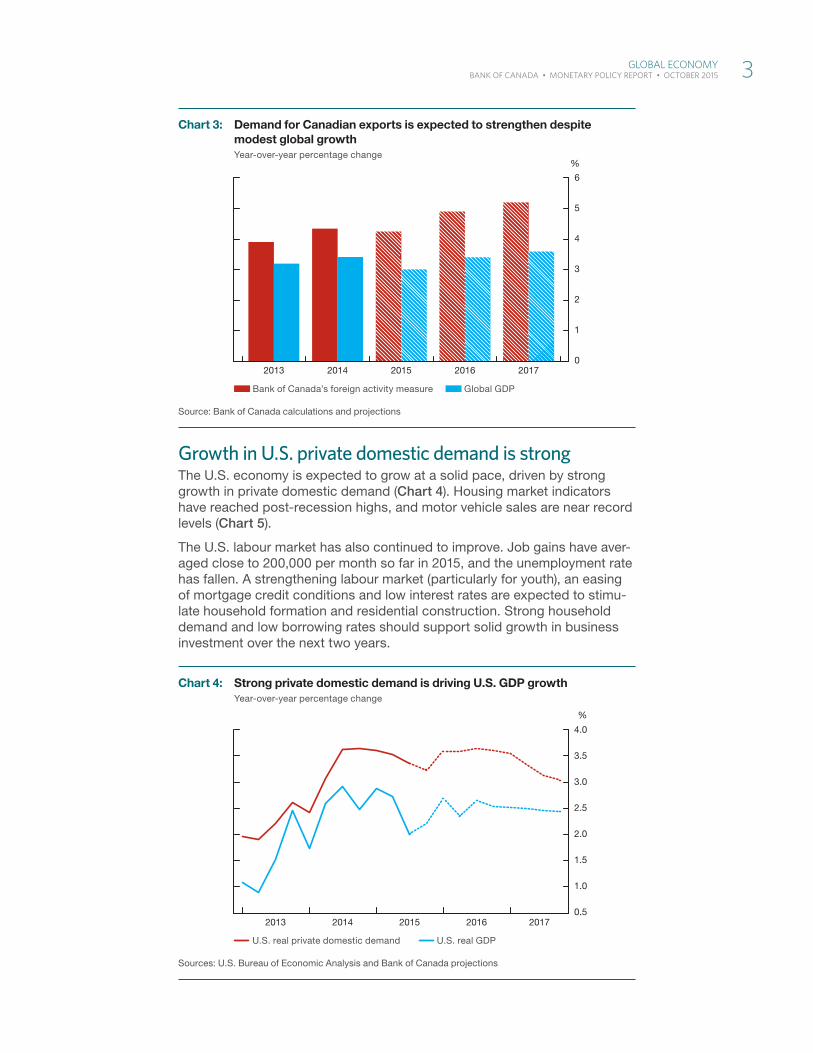
Against this backdrop, robust growth in private domestic demand in the United States—Canada’s main trading partner—is driving stronger foreign demand for Canadian exports (Chart 3).
File information (for internal use only): Falling commodity prices -- EN.indd
Last output: 04:57:34 PM; Oct 19, 2015
Sources: National sources via Haver Analytics and Bank of Canada calculations Last observation: 2015Q2
Canada United States Euro area
Japan Oil-importing emerging-market economies
China Rest of the world excluding Canada
80
90
100
110
120
2013 2014 2015
Index
Chart 2: Falling commodity prices have led to diverging movements in terms of trade across regionsIndex: 2014Q2 = 100
File information (for internal use only): Outlook for global growth -- EN.indd
Last output: 12:11:48 PM; Oct 20, 2015
Note: Actual data are shown up to 2014. Projections are as published in the MPR.Source: Bank of Canada calculations and projections
Current Monetary Policy Report
Apr 2014 MPR Apr 2015 MPR
Jul 2015 MPR 1995–2014 average
2011 2012 2013 2014 2015 2016 2017
%
2.5
3.0
3.5
4.0
4.5
5.0
Chart 1: The near-term outlook for global growth has been revised downYear-over-year percentage change
2 Global EConoMy BANK OF CANADA • MONEtARy POlICy REPORt • OCtOBER 2015
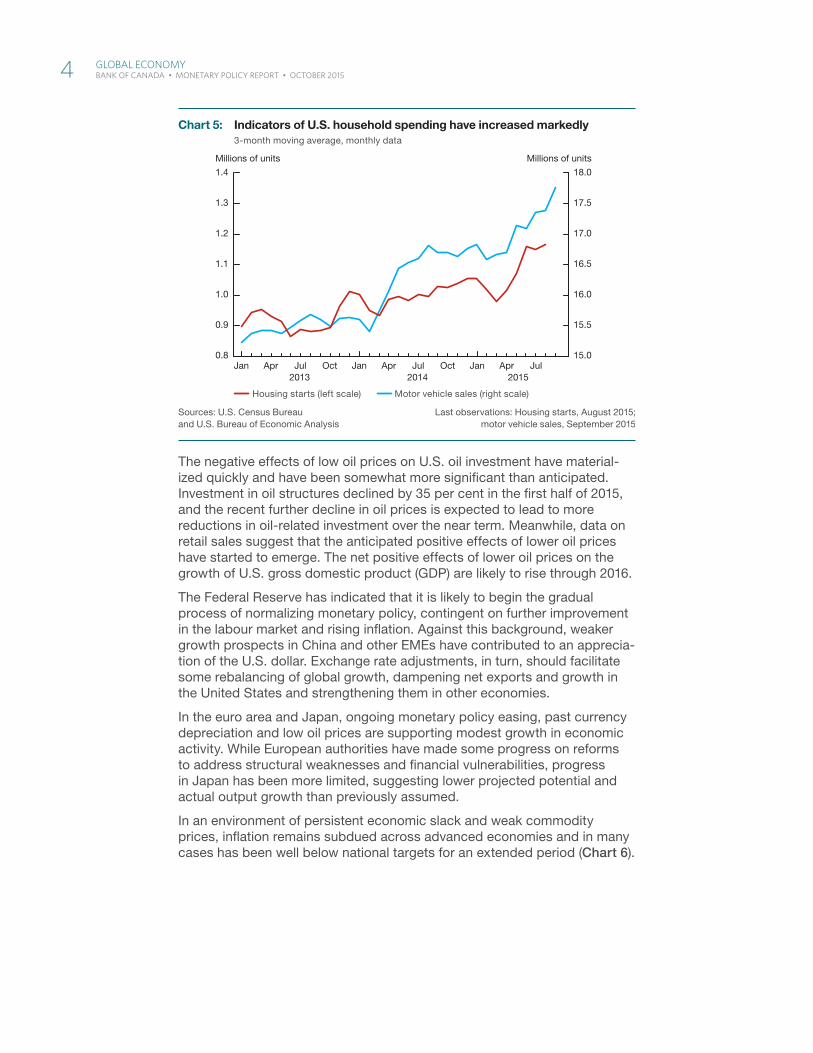
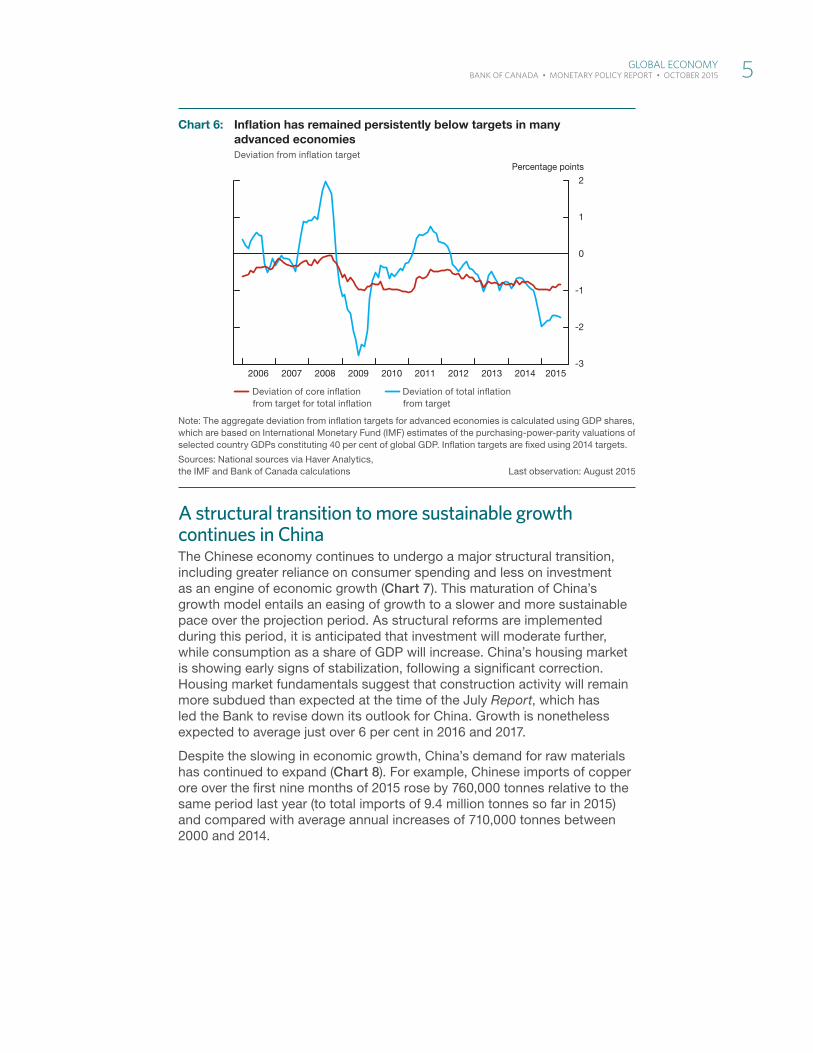
Growth in U.S. private domestic demand is strongThe U.S. economy is expected to grow at a solid pace, driven by strong growth in private domestic demand (Chart 4). Housing market indicators have reached post-recession highs, and motor vehicle sales are near record levels (Chart 5).
The U.S. labour market has also continued to improve. Job gains have aver-aged close to 200,000 per month so far in 2015, and the unemployment rate has fallen. A strengthening labour market (particularly for youth), an easing of mortgage credit conditions and low interest rates are expected to stimu-late household formation and residential construction. Strong household demand and low borrowing rates should support solid growth in business investment over the next two years.
File information (for internal use only): Canadian exports -- EN.indd
Last output: 03:02:11 PM; Oct 20, 2015
Source: Bank of Canada calculations and projections
Bank of Canada’s foreign activity measure Global GDP
0
1
2
3
4
5
6
2013 2014 2015 2016 2017
%
Chart 3: Demand for Canadian exports is expected to strengthen despite modest global growthYear-over-year percentage change
File information (for internal use only): Private domestic demand -- EN.indd
Last output: 12:13:34 PM; Oct 20, 2015
Sources: U.S. Bureau of Economic Analysis and Bank of Canada projections
U.S. real private domestic demand U.S. real GDP
2013 2014 2015 2016 2017
%
0.5
1.0
1.5
2.0
2.5
3.0
3.5
4.0
Chart 4: Strong private domestic demand is driving U.S. GDP growthYear-over-year percentage change
Global EConoMy 3 BANK OF CANADA • MONEtARy POlICy REPORt • OCtOBER 2015
The negative effects of low oil prices on U.S. oil investment have material-ized quickly and have been somewhat more significant than anticipated. Investment in oil structures declined by 35 per cent in the first half of 2015, and the recent further decline in oil prices is expected to lead to more reductions in oil-related investment over the near term. Meanwhile, data on retail sales suggest that the anticipated positive effects of lower oil prices have started to emerge. The net positive effects of lower oil prices on the growth of U.S. gross domestic product (GDP) are likely to rise through 2016.
The Federal Reserve has indicated that it is likely to begin the gradual process of normalizing monetary policy, contingent on further improvement in the labour market and rising inflation. Against this background, weaker growth prospects in China and other EMEs have contributed to an apprecia-tion of the U.S. dollar. Exchange rate adjustments, in turn, should facilitate some rebalancing of global growth, dampening net exports and growth in the United States and strengthening them in other economies.
In the euro area and Japan, ongoing monetary policy easing, past currency depreciation and low oil prices are supporting modest growth in economic activity. While European authorities have made some progress on reforms to address structural weaknesses and financial vulnerabilities, progress in Japan has been more limited, suggesting lower projected potential and actual output growth than previously assumed.
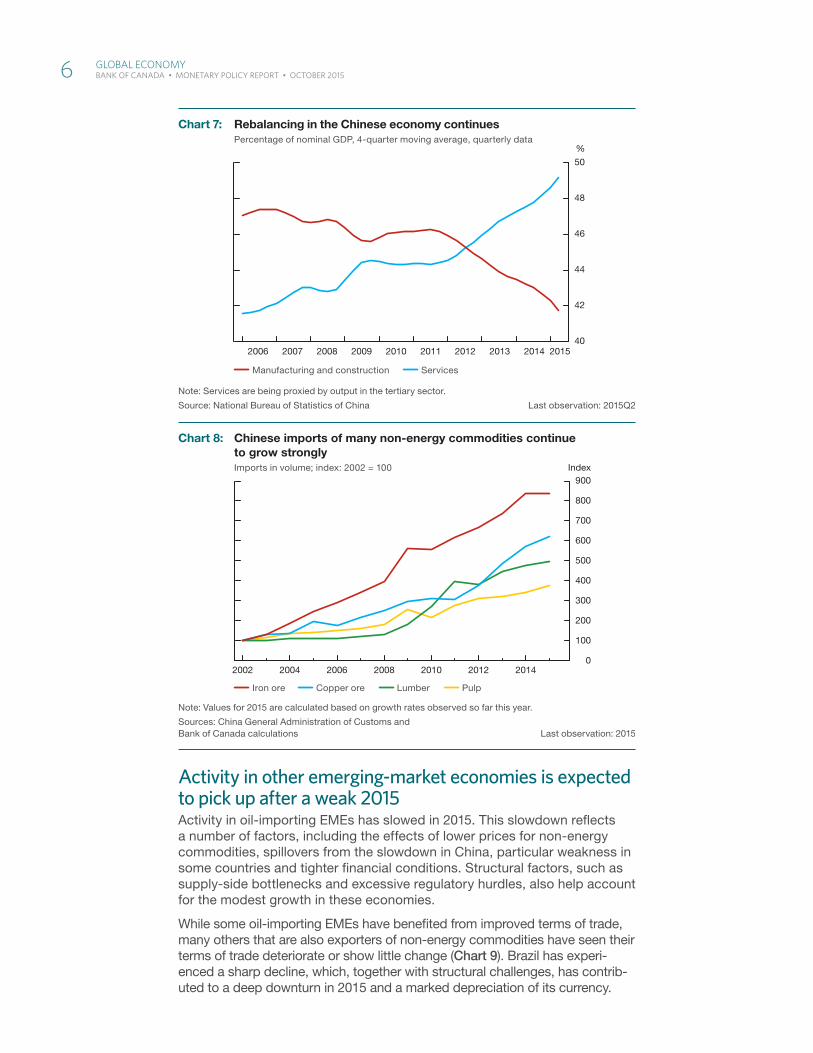
In an environment of persistent economic slack and weak commodity prices, inflation remains subdued across advanced economies and in many cases has been well below national targets for an extended period (Chart 6).
File information (for internal use only): US Household Spending -- EN.indd
Last output: 04:08:14 PM; Oct 20, 2015
Sources: U.S. Census Bureau Last observations: Housing starts, August 2015; and U.S. Bureau of Economic Analysis motor vehicle sales, September 2015
Housing starts (left scale) Motor vehicle sales (right scale)
2013 2014 2015
15.0
15.5
16.0
16.5
17.0
17.5
18.0
0.8
0.9
1.0
1.1
1.2
1.3
1.4
Jan Apr Jul Oct Jan Apr Jul Oct Jan Apr Jul
Millions of unitsMillions of units
Chart 5: Indicators of U.S. household spending have increased markedly 3-month moving average, monthly data
4 Global EConoMy BANK OF CANADA • MONEtARy POlICy REPORt • OCtOBER 2015
A structural transition to more sustainable growth continues in ChinaThe Chinese economy continues to undergo a major structural transition, including greater reliance on consumer spending and less on investment as an engine of economic growth (Chart 7). This maturation of China’s growth model entails an easing of growth to a slower and more sustainable pace over the projection period. As structural reforms are implemented during this period, it is anticipated that investment will moderate further, while consumption as a share of GDP will increase. China’s housing market is showing early signs of stabilization, following a significant correction. Housing market fundamentals suggest that construction activity will remain more subdued than expected at the time of the July Report, which has led the Bank to revise down its outlook for China. Growth is nonetheless expected to average just over 6 per cent in 2016 and 2017.
Despite the slowing in economic growth, China’s demand for raw materials has continued to expand (Chart 8). For example, Chinese imports of copper ore over the first nine months of 2015 rose by 760,000 tonnes relative to the same period last year (to total imports of 9.4 million tonnes so far in 2015) and compared with average annual increases of 710,000 tonnes between 2000 and 2014.
File information (for internal use only): Persistently Below Targets -- EN.indd
Last output: 04:57:34 PM; Oct 19, 2015
Note: The aggregate deviation from infl ation targets for advanced economies is calculated using GDP shares, which are based on International Monetary Fund (IMF) estimates of the purchasing-power-parity valuations of selected country GDPs constituting 40 per cent of global GDP. Infl ation targets are fi xed using 2014 targets.
Sources: National sources via Haver Analytics, the IMF and Bank of Canada calculations Last observation: August 2015
Deviation of core infl ation from target for total infl ation
Deviation of total infl ation from target
-3
-2
-1
0
1
2
2006 2007 2008 2009 2010 2011 2012 2013 2014 2015
Percentage points
Chart 6: Infl ation has remained persistently below targets in many advanced economiesDeviation from infl ation target
Global EConoMy 5 BANK OF CANADA • MONEtARy POlICy REPORt • OCtOBER 2015
Activity in other emerging-market economies is expected to pick up after a weak 2015Activity in oil-importing EMEs has slowed in 2015. This slowdown reflects a number of factors, including the effects of lower prices for non-energy commodities, spillovers from the slowdown in China, particular weakness in some countries and tighter financial conditions. Structural factors, such as supply-side bottlenecks and excessive regulatory hurdles, also help account for the modest growth in these economies.
While some oil-importing EMEs have benefited from improved terms of trade, many others that are also exporters of non-energy commodities have seen their terms of trade deteriorate or show little change (Chart 9). Brazil has experi-enced a sharp decline, which, together with structural challenges, has contrib-uted to a deep downturn in 2015 and a marked depreciation of its currency.
File information (for internal use only): Rebalancing in the Chinese -- EN.indd
Last output: 12:16:22 PM; Oct 20, 2015
Note: Services are being proxied by output in the tertiary sector.
Source: National Bureau of Statistics of China Last observation: 2015Q2
Manufacturing and construction Services
40
42
44
46
48
50
2006 2007 2008 2009 2010 2011 2012 2013 2014 2015
%
Chart 7: Rebalancing in the Chinese economy continues Percentage of nominal GDP, 4-quarter moving average, quarterly data
File information (for internal use only): Chinese Imports -- EN.indd
Last output: 04:08:37 PM; Oct 20, 2015
Note: Values for 2015 are calculated based on growth rates observed so far this year.
Sources: China General Administration of Customs and Bank of Canada calculations Last observation: 2015
Iron ore Copper ore Lumber Pulp
0
100
200
300
400
500
600
700
800
900
2002 2004 2006 2008 2010 2012 2014
Index
Chart 8: Chinese imports of many non-energy commodities continue to grow stronglyImports in volume; index: 2002 = 100
6 Global EConoMy BANK OF CANADA • MONEtARy POlICy REPORt • OCtOBER 2015
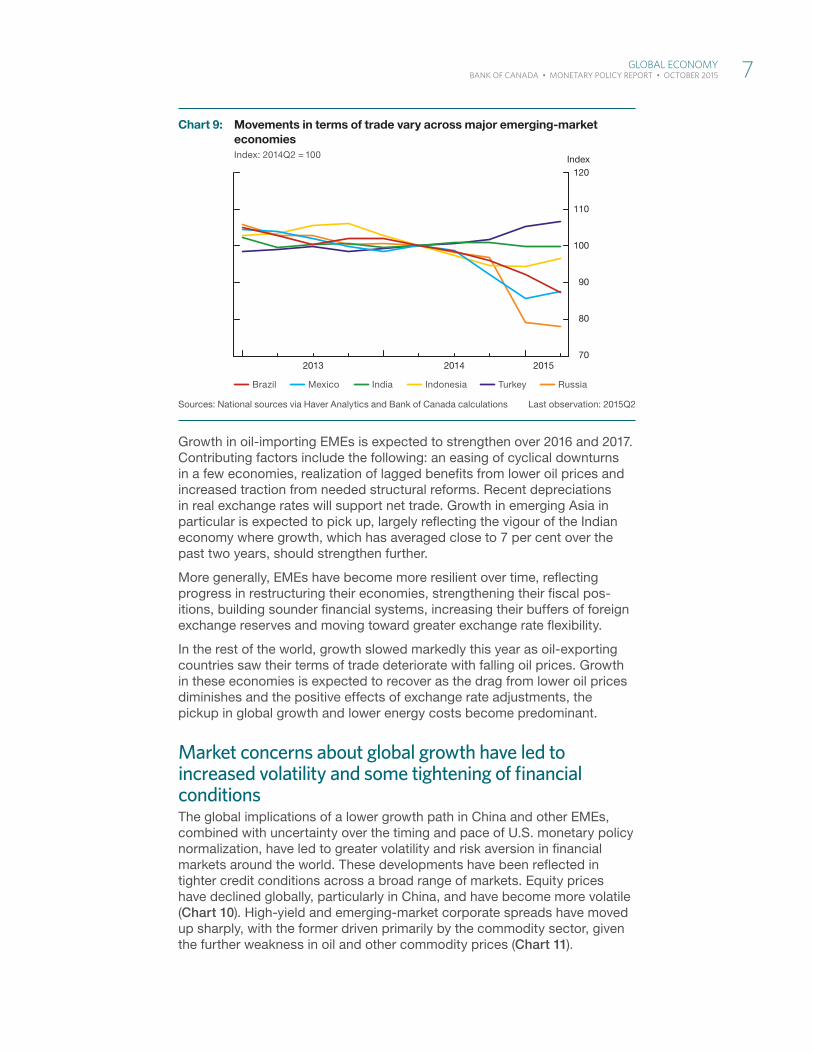
Growth in oil-importing EMEs is expected to strengthen over 2016 and 2017. Contributing factors include the following: an easing of cyclical downturns in a few economies, realization of lagged benefits from lower oil prices and increased traction from needed structural reforms. Recent depreciations in real exchange rates will support net trade. Growth in emerging Asia in particular is expected to pick up, largely reflecting the vigour of the Indian economy where growth, which has averaged close to 7 per cent over the past two years, should strengthen further.
More generally, EMEs have become more resilient over time, reflecting progress in restructuring their economies, strengthening their fiscal pos-itions, building sounder financial systems, increasing their buffers of foreign exchange reserves and moving toward greater exchange rate flexibility.
In the rest of the world, growth slowed markedly this year as oil-exporting countries saw their terms of trade deteriorate with falling oil prices. Growth in these economies is expected to recover as the drag from lower oil prices diminishes and the positive effects of exchange rate adjustments, the pickup in global growth and lower energy costs become predominant.
Market concerns about global growth have led to increased volatility and some tightening of financial conditionsThe global implications of a lower growth path in China and other EMEs, combined with uncertainty over the timing and pace of U.S. monetary policy normalization, have led to greater volatility and risk aversion in financial markets around the world. These developments have been reflected in tighter credit conditions across a broad range of markets. Equity prices have declined globally, particularly in China, and have become more volatile (Chart 10). High-yield and emerging-market corporate spreads have moved up sharply, with the former driven primarily by the commodity sector, given the further weakness in oil and other commodity prices (Chart 11).
File information (for internal use only): Terms of trade movements -- EN.indd
Last output: 04:57:35 PM; Oct 19, 2015
Sources: National sources via Haver Analytics and Bank of Canada calculations Last observation: 2015Q2
Brazil Mexico India Indonesia Turkey Russia
70
80
90
100
110
120
2013 2014 2015
Index
Chart 9: Movements in terms of trade vary across major emerging-market economies Index: 2014Q2 = 100
Global EConoMy 7 BANK OF CANADA • MONEtARy POlICy REPORt • OCtOBER 2015
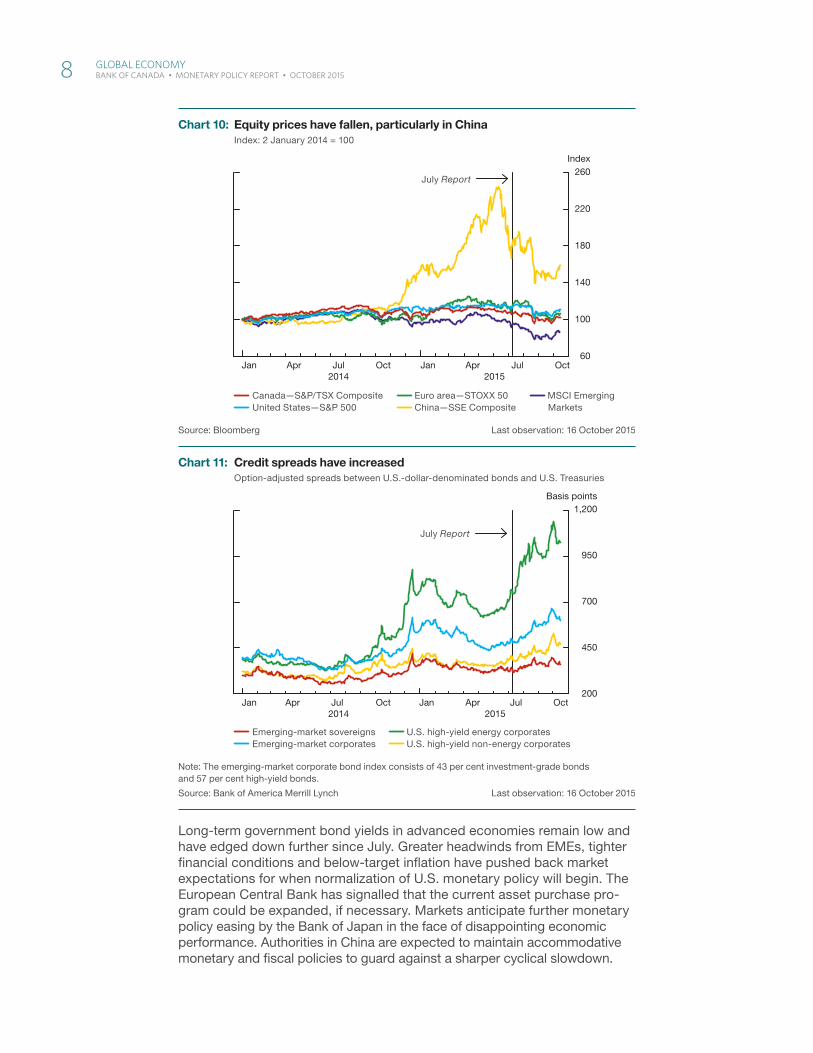
Long-term government bond yields in advanced economies remain low and have edged down further since July. Greater headwinds from EMEs, tighter financial conditions and below-target inflation have pushed back market expectations for when normalization of U.S. monetary policy will begin. The European Central Bank has signalled that the current asset purchase pro-gram could be expanded, if necessary. Markets anticipate further monetary policy easing by the Bank of Japan in the face of disappointing economic performance. Authorities in China are expected to maintain accommodative monetary and fiscal policies to guard against a sharper cyclical slowdown.
File information (for internal use only): Equity prices -- EN.indd
Last output: 04:57:35 PM; Oct 19, 2015
Source: Bloomberg Last observation: 16 October 2015
Canada—S&P/TSX Composite United States—S&P 500
Euro area—STOXX 50 China—SSE Composite
MSCI Emerging Markets
60
100
140
180
220
260
2014 2015
Index
Jan Apr Jul Oct Jan Apr Jul Oct
July Report
Chart 10: Equity prices have fallen, particularly in China Index: 2 January 2014 = 100
File information (for internal use only): High yield -- EN.indd
Last output: 12:31:49 PM; Oct 20, 2015
Note: The emerging-market corporate bond index consists of 43 per cent investment-grade bonds and 57 per cent high-yield bonds.
Source: Bank of America Merrill Lynch Last observation: 16 October 2015
Emerging-market sovereigns Emerging-market corporates
U.S. high-yield energy corporates U.S. high-yield non-energy corporates
200
450
700
950
2014 2015Jan Apr Jul Oct Jan Apr Jul Oct
Basis points1,200
July Report
Chart 11: Credit spreads have increasedOption-adjusted spreads between U.S.-dollar-denominated bonds and U.S. Treasuries
8 Global EConoMy BANK OF CANADA • MONEtARy POlICy REPORt • OCtOBER 2015
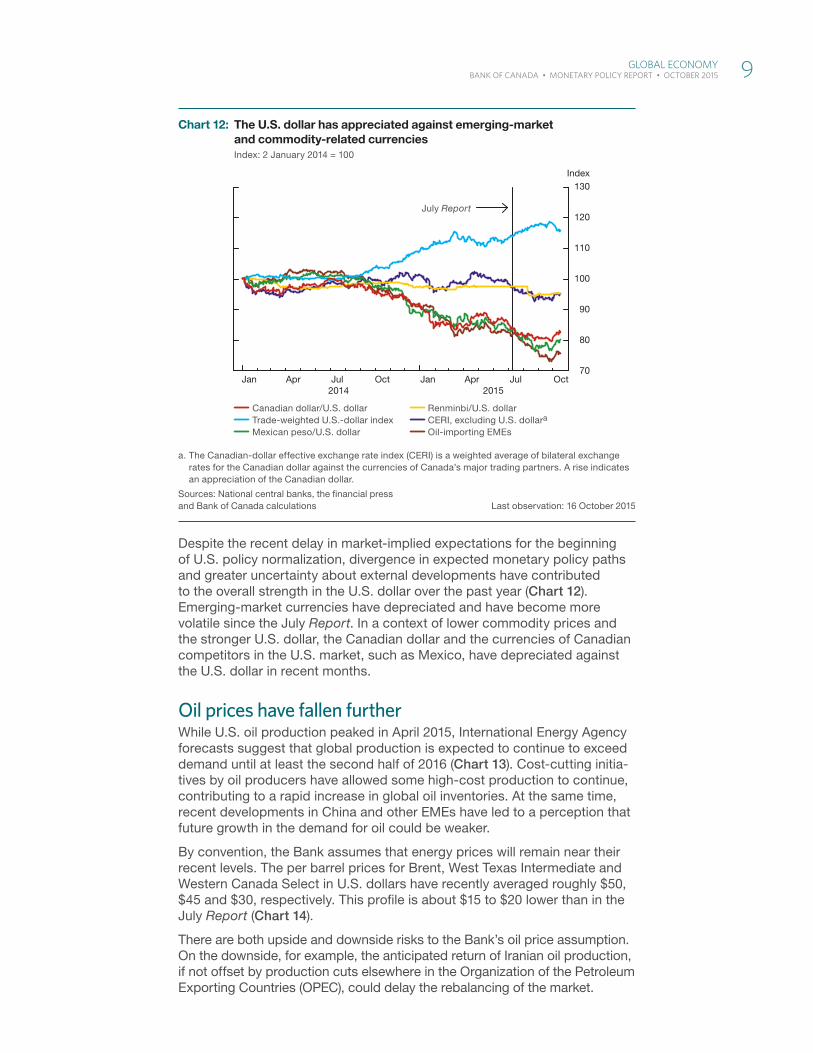
Despite the recent delay in market-implied expectations for the beginning of U.S. policy normalization, divergence in expected monetary policy paths and greater uncertainty about external developments have contributed to the overall strength in the U.S. dollar over the past year (Chart 12). Emerging-market currencies have depreciated and have become more volatile since the July Report. In a context of lower commodity prices and the stronger U.S. dollar, the Canadian dollar and the currencies of Canadian competitors in the U.S. market, such as Mexico, have depreciated against the U.S. dollar in recent months.
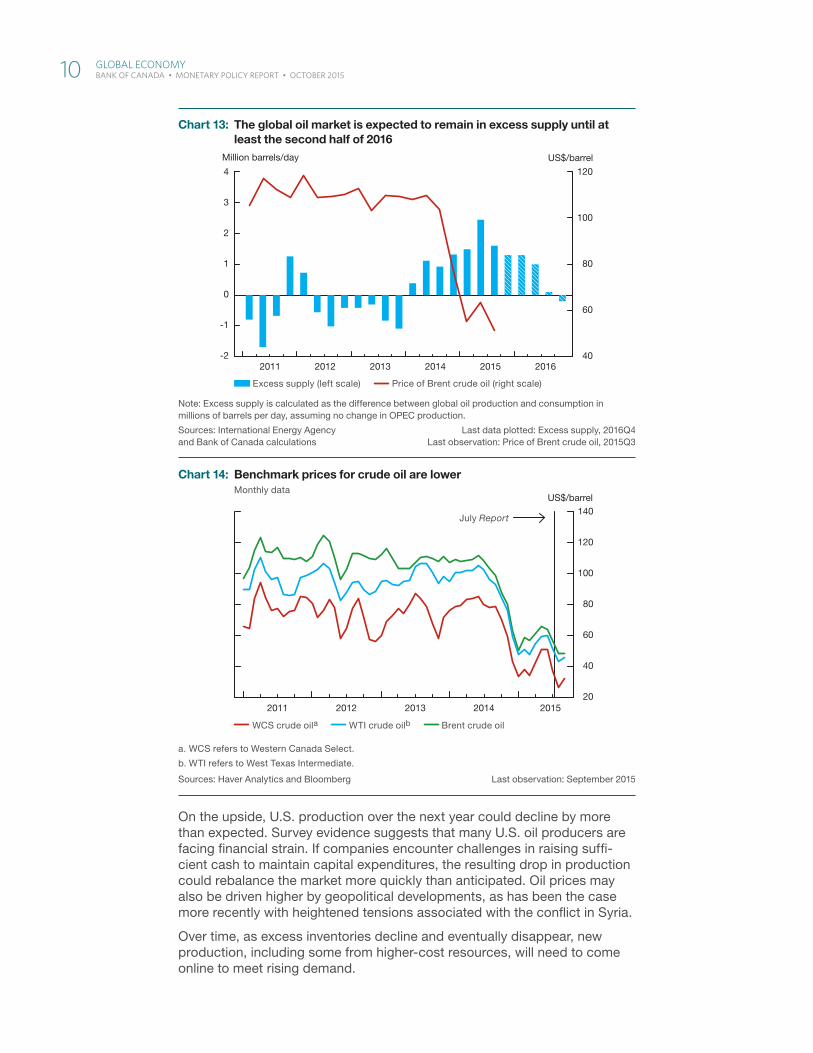
Oil prices have fallen furtherWhile U.S. oil production peaked in April 2015, International Energy Agency forecasts suggest that global production is expected to continue to exceed demand until at least the second half of 2016 (Chart 13). Cost-cutting initia-tives by oil producers have allowed some high-cost production to continue, contributing to a rapid increase in global oil inventories. At the same time, recent developments in China and other EMEs have led to a perception that future growth in the demand for oil could be weaker.
By convention, the Bank assumes that energy prices will remain near their recent levels. The per barrel prices for Brent, West Texas Intermediate and Western Canada Select in U.S. dollars have recently averaged roughly $50, $45 and $30, respectively. This profile is about $15 to $20 lower than in the July Report (Chart 14).
There are both upside and downside risks to the Bank’s oil price assumption. On the downside, for example, the anticipated return of Iranian oil production, if not offset by production cuts elsewhere in the Organization of the Petroleum Exporting Countries (OPEC), could delay the rebalancing of the market.
File information (for internal use only): Commodity currencies -- EN.indd
Last output: 03:01:45 PM; Oct 20, 2015
a. The Canadian-dollar effective exchange rate index (CERI) is a weighted average of bilateral exchange rates for the Canadian dollar against the currencies of Canada’s major trading partners. A rise indicates an appreciation of the Canadian dollar.
Sources: National central banks, the fi nancial press and Bank of Canada calculations Last observation: 16 October 2015
Canadian dollar/U.S. dollar Trade-weighted U.S.-dollar index Mexican peso/U.S. dollar
Renminbi/U.S. dollar CERI, excluding U.S. dollara
Oil-importing EMEs
2014 2015
70
80
90
100
110
120
130
Jan Apr Jul Oct Jan Apr Jul Oct
Index
July Report
Chart 12: The U.S. dollar has appreciated against emerging-market and commodity-related currenciesIndex: 2 January 2014 = 100
Global EConoMy 9 BANK OF CANADA • MONEtARy POlICy REPORt • OCtOBER 2015
On the upside, U.S. production over the next year could decline by more than expected. Survey evidence suggests that many U.S. oil producers are facing financial strain. If companies encounter challenges in raising suffi-cient cash to maintain capital expenditures, the resulting drop in production could rebalance the market more quickly than anticipated. Oil prices may also be driven higher by geopolitical developments, as has been the case more recently with heightened tensions associated with the conflict in Syria.
Over time, as excess inventories decline and eventually disappear, new production, including some from higher-cost resources, will need to come online to meet rising demand.
Note: Excess supply is calculated as the difference between global oil production and consumption in millions of barrels per day, assuming no change in OPEC production.
Sources: International Energy Agency and Bank of Canada calculations
Last data plotted: Excess supply, 2016Q4Last observation: Price of Brent crude oil, 2015Q3
Excess supply (left scale) Price of Brent crude oil (right scale)
2011 2012 2013 2014 2015 201640
60
80
100
120
-2
-1
0
1
2
3
4
US$/barrelMillion barrels/day
Chart 13: The global oil market is expected to remain in excess supply until at least the second half of 2016
File information (for internal use only): Benchmark prices for crude oil -- EN.indd
Last output: 12:46:20 PM; Oct 20, 2015
a. WCS refers to Western Canada Select.
b. WTI refers to West Texas Intermediate.
Sources: Haver Analytics and Bloomberg Last observation: September 2015
WCS crude oila WTI crude oilb Brent crude oil
2015201420132012201120
40
60
80
100
120
140US$/barrel
Chart 14: Benchmark prices for crude oil are lowerMonthly data
July Report
10 Global EConoMy BANK OF CANADA • MONEtARy POlICy REPORt • OCtOBER 2015
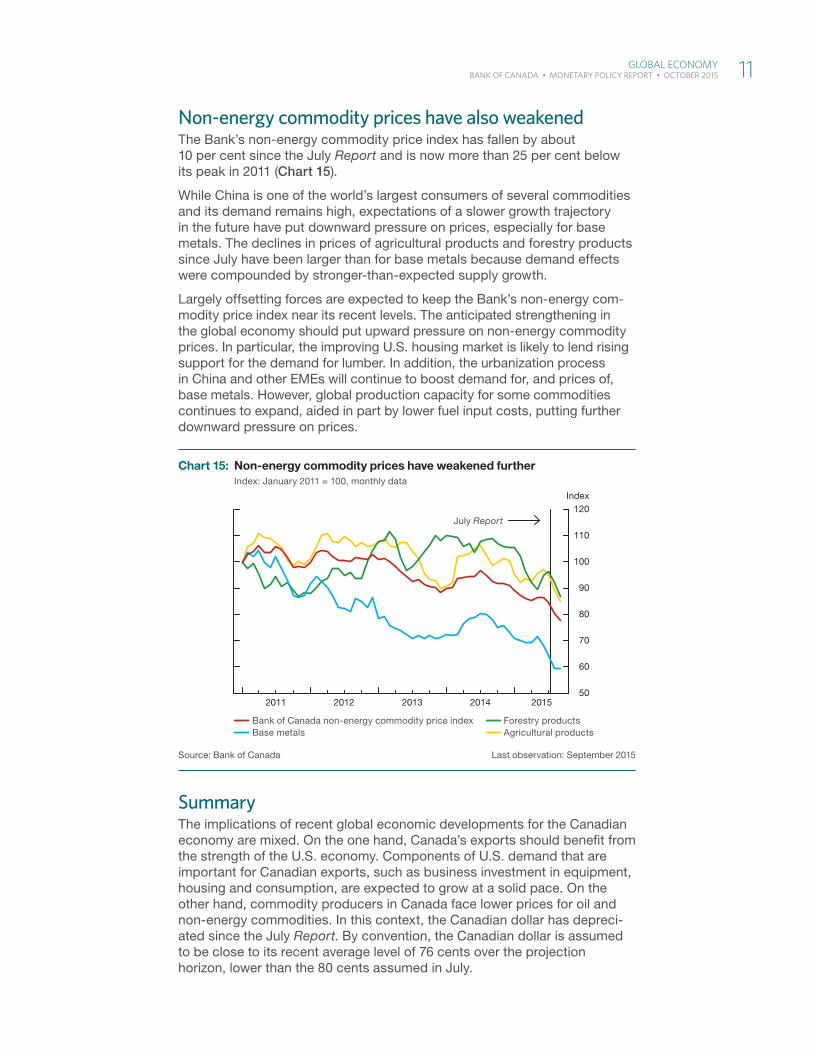
Non-energy commodity prices have also weakenedThe Bank’s non-energy commodity price index has fallen by about 10 per cent since the July Report and is now more than 25 per cent below its peak in 2011 (Chart 15).
While China is one of the world’s largest consumers of several commodities and its demand remains high, expectations of a slower growth trajectory in the future have put downward pressure on prices, especially for base metals. The declines in prices of agricultural products and forestry products since July have been larger than for base metals because demand effects were compounded by stronger-than-expected supply growth.
Largely offsetting forces are expected to keep the Bank’s non-energy com-modity price index near its recent levels. The anticipated strengthening in the global economy should put upward pressure on non-energy commodity prices. In particular, the improving U.S. housing market is likely to lend rising support for the demand for lumber. In addition, the urbanization process in China and other EMEs will continue to boost demand for, and prices of, base metals. However, global production capacity for some commodities continues to expand, aided in part by lower fuel input costs, putting further downward pressure on prices.
SummaryThe implications of recent global economic developments for the Canadian economy are mixed. On the one hand, Canada’s exports should benefit from the strength of the U.S. economy. Components of U.S. demand that are important for Canadian exports, such as business investment in equipment, housing and consumption, are expected to grow at a solid pace. On the other hand, commodity producers in Canada face lower prices for oil and non-energy commodities. In this context, the Canadian dollar has depreci-ated since the July Report. By convention, the Canadian dollar is assumed to be close to its recent average level of 76 cents over the projection horizon, lower than the 80 cents assumed in July.
File information (for internal use only): Commodity prices have weakened -- EN.indd
Last output: 12:27:10 PM; Oct 20, 2015
Source: Bank of Canada Last observation: September 2015
Bank of Canada non-energy commodity price index Base metals
Forestry products Agricultural products
50
60
70
80
90
100
110
120
2011 2012 2013 2014 2015
Index
July Report
Chart 15: Non-energy commodity prices have weakened further Index: January 2011 = 100, monthly data
Global EConoMy 11 BANK OF CANADA • MONEtARy POlICy REPORt • OCtOBER 2015

Canadian EconomyThe Canadian economy continues to adjust to lower prices for oil and other commodities. The required reallocation of labour and capital across sectors and regions is a complex process that will take time to unfold, particularly in view of the need to rebuild non-commodity-exporting capacity.
Several important factors are helping to facilitate these adjustments. The stimulative effects of previous monetary policy easing are working their way through the Canadian economy, supporting household spending in particular. Non-commodity exports are being boosted by solid growth in the U.S. economy. In addition, the depreciation of the Canadian dollar associated with the decline in commodity prices is improving Canada’s international competitiveness, increasing net exports.
Economic activity and inflation in Canada are evolving largely as expected in the July Report. Economic momentum is rebuilding, and real GDP growth is estimated to have rebounded to about 2 per cent in the second half of 2015, following a modest contraction in the first half of the year. On an average annual basis, real GDP is expected to grow by just over 1 per cent this year, before firming to about 2 per cent in 2016 and about 2 1/2 per cent in 2017 (Table 2). Since July, the Bank has marked down modestly its projection for economic activity in 2016–17, in response to the further decline in the prices for oil and other commodities and the additional downgrade of investment intentions by energy firms.
Table 2: Contributions to average annual real GDP growthPercentage pointsa, b
2014 2015 2016 2017
Consumption 1.5 (1.5) 1.2 (1.2) 1.1 (1.2) 1.0 (1.1)
Housing 0.2 (0.2) 0.3 (0.2) 0.0 (0.1) 0.0 (0.0)
Government -0.1 (-0.1) 0.2 (0.1) 0.1 (0.2) 0.2 (0.2)
Business fi xed investment 0.0 (0.0) -0.9 (-0.9) -0.2 (0.4) 0.7 (0.8)
Subtotal: Final domestic demand 1.6 (1.6) 0.8 (0.6) 1.0 (1.9) 1.9 (2.1)
Exports 1.7 (1.7) 0.9 (0.6) 1.7 (1.6) 1.7 (1.7)
Imports -0.5 (-0.5) -0.3 (-0.3) -0.6 (-0.8) -1.1 (-1.2)
Subtotal: Net exports 1.1 (1.1) 0.6 (0.3) 1.1 (0.8) 0.6 (0.5)
Inventories -0.3 (-0.3) -0.3 (0.2) -0.1 (-0.4) 0.0 (0.0)
GDP 2.4 (2.4) 1.1 (1.1) 2.0 (2.3) 2.5 (2.6)
Memo items:
Range for potential outputc 2.0–2.2 1.6–2.0 1.4–2.2 1.3–2.3
Real gross domestic income (GDI) 2.0 (2.0) -1.2 (-0.7) 1.2 (2.2) 2.5 (2.6)
a. Numbers in parentheses are from the projection in the previous Report.b. Numbers may not add to total because of rounding.c. Numbers are from the Appendix of the April 2015 Monetary Policy Report.
Canadian EConoMy 13 BANK OF CANADA • MONEtARy POlICy REPORt • OCtOBER 2015
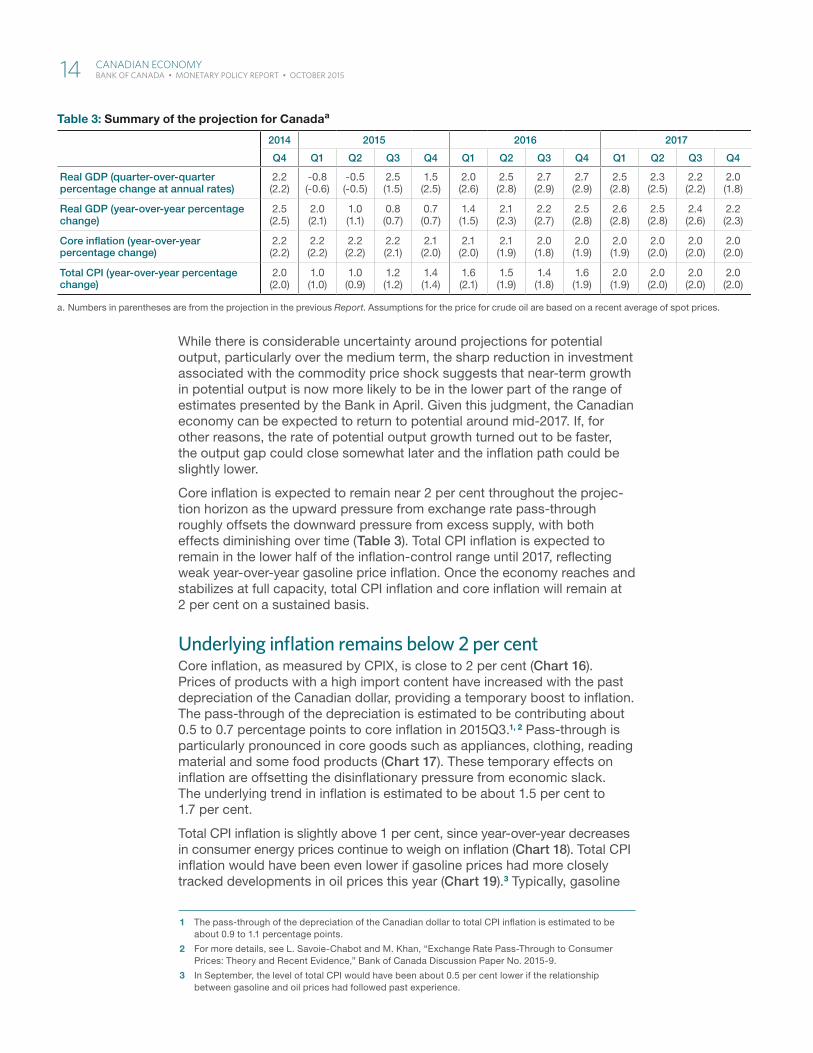
While there is considerable uncertainty around projections for potential output, particularly over the medium term, the sharp reduction in investment associated with the commodity price shock suggests that near-term growth in potential output is now more likely to be in the lower part of the range of estimates presented by the Bank in April. Given this judgment, the Canadian economy can be expected to return to potential around mid-2017. If, for other reasons, the rate of potential output growth turned out to be faster, the output gap could close somewhat later and the inflation path could be slightly lower.
Core inflation is expected to remain near 2 per cent throughout the projec-tion horizon as the upward pressure from exchange rate pass-through roughly offsets the downward pressure from excess supply, with both effects diminishing over time (Table 3). Total CPI inflation is expected to remain in the lower half of the inflation-control range until 2017, reflecting weak year-over-year gasoline price inflation. Once the economy reaches and stabilizes at full capacity, total CPI inflation and core inflation will remain at 2 per cent on a sustained basis.
Underlying inflation remains below 2 per centCore inflation, as measured by CPIX, is close to 2 per cent (Chart 16). Prices of products with a high import content have increased with the past depreciation of the Canadian dollar, providing a temporary boost to inflation. The pass-through of the depreciation is estimated to be contributing about 0.5 to 0.7 percentage points to core inflation in 2015Q3.1, 2 Pass-through is particularly pronounced in core goods such as appliances, clothing, reading material and some food products (Chart 17). These temporary effects on inflation are offsetting the disinflationary pressure from economic slack. The underlying trend in inflation is estimated to be about 1.5 per cent to 1.7 per cent.
Total CPI inflation is slightly above 1 per cent, since year-over-year decreases in consumer energy prices continue to weigh on inflation (Chart 18). Total CPI inflation would have been even lower if gasoline prices had more closely tracked developments in oil prices this year (Chart 19).3 Typically, gasoline
1 The pass-through of the depreciation of the Canadian dollar to total CPI inflation is estimated to be about 0.9 to 1.1 percentage points.
2 For more details, see L. Savoie-Chabot and M. Khan, “Exchange Rate Pass-Through to Consumer Prices: Theory and Recent Evidence,” Bank of Canada Discussion Paper No. 2015-9.
3 In September, the level of total CPI would have been about 0.5 per cent lower if the relationship between gasoline and oil prices had followed past experience.
Table 3: Summary of the projection for Canadaa
2014 2015 2016 2017
Q4 Q1 Q2 Q3 Q4 Q1 Q2 Q3 Q4 Q1 Q2 Q3 Q4
Real GDP (quarter-over-quarter percentage change at annual rates)
2.2 (2.2)
-0.8 (-0.6)
-0.5 (-0.5)
2.5 (1.5)
1.5 (2.5)
2.0 (2.6)
2.5 (2.8)
2.7 (2.9)
2.7 (2.9)
2.5 (2.8)
2.3 (2.5)
2.2 (2.2)
2.0 (1.8)
Real GDP (year-over-year percentage change)
2.5 (2.5)
2.0 (2.1)
1.0 (1.1)
0.8 (0.7)
0.7 (0.7)
1.4 (1.5)
2.1 (2.3)
2.2 (2.7)
2.5 (2.8)
2.6 (2.8)
2.5 (2.8)
2.4 (2.6)
2.2 (2.3)
Core infl ation (year-over-year percentage change)
2.2 (2.2)
2.2 (2.2)
2.2 (2.2)
2.2 (2.1)
2.1 (2.0)
2.1 (2.0)
2.1 (1.9)
2.0 (1.8)
2.0 (1.9)
2.0 (1.9)
2.0 (2.0)
2.0 (2.0)
2.0 (2.0)
Total CPI (year-over-year percentage change)
2.0 (2.0)
1.0 (1.0)
1.0 (0.9)
1.2 (1.2)
1.4 (1.4)
1.6 (2.1)
1.5 (1.9)
1.4 (1.8)
1.6 (1.9)
2.0 (1.9)
2.0 (2.0)
2.0 (2.0)
2.0 (2.0)
a. Numbers in parentheses are from the projection in the previous Report. Assumptions for the price for crude oil are based on a recent average of spot prices.
14 Canadian EConoMy BANK OF CANADA • MONEtARy POlICy REPORt • OCtOBER 2015
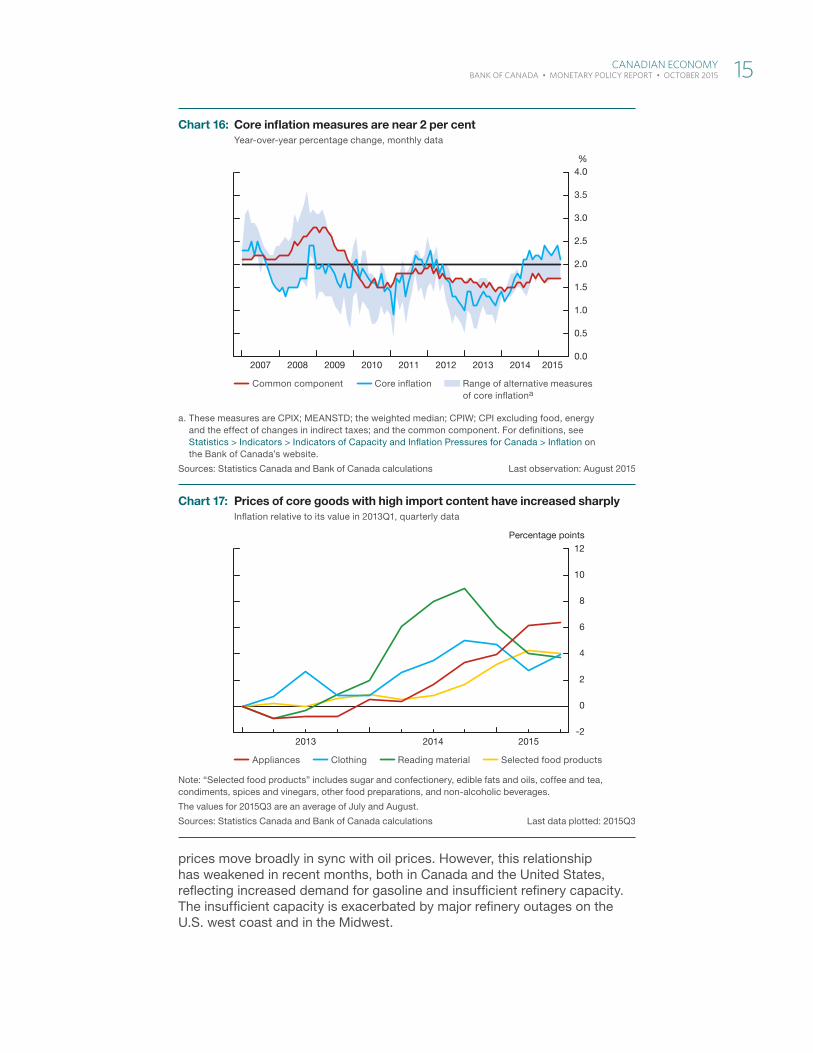
prices move broadly in sync with oil prices. However, this relationship has weakened in recent months, both in Canada and the United States, reflecting increased demand for gasoline and insufficient refinery capacity. The insufficient capacity is exacerbated by major refinery outages on the U.S. west coast and in the Midwest.
File information (for internal use only): Core inflation -- EN.indd
Last output: 09:39:14 AM; Oct 20, 2015
a. These measures are CPIX; MEANSTD; the weighted median; CPIW; CPI excluding food, energy and the effect of changes in indirect taxes; and the common component. For defi nitions, see Statistics > Indicators > Indicators of Capacity and Infl ation Pressures for Canada > Infl ation on the Bank of Canada’s website.
Sources: Statistics Canada and Bank of Canada calculations Last observation: August 2015
Common component Core infl ation Range of alternative measures of core infl ationa
%
2007 2008 2009 2010 2011 2012 2013 2014 20150.0
0.5
1.0
1.5
2.0
2.5
3.0
3.5
4.0
Chart 16: Core infl ation measures are near 2 per centYear-over-year percentage change, monthly data
File information (for internal use only): Core goods -- EN.indd
Last output: 04:09:28 PM; Oct 20, 2015
Note: “Selected food products” includes sugar and confectionery, edible fats and oils, coffee and tea, condiments, spices and vinegars, other food preparations, and non-alcoholic beverages.
The values for 2015Q3 are an average of July and August.
Sources: Statistics Canada and Bank of Canada calculations Last data plotted: 2015Q3
Appliances Clothing Reading material Selected food products
-2
0
2
4
6
8
10
12
2013 2014 2015
Percentage points
Chart 17: Prices of core goods with high import content have increased sharply Infl ation relative to its value in 2013Q1, quarterly data
Canadian EConoMy 15BANK OF CANADA • MONEtARy POlICy REPORt • OCtOBER 2015
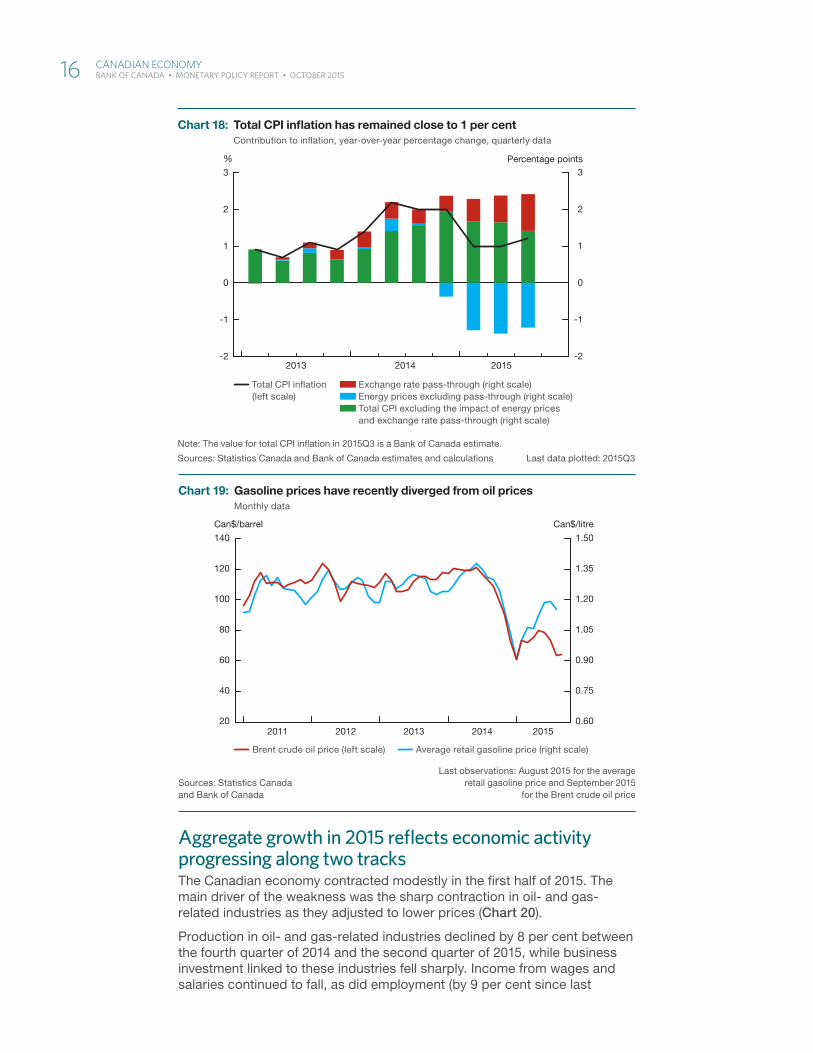
Aggregate growth in 2015 reflects economic activity progressing along two tracksThe Canadian economy contracted modestly in the first half of 2015. The main driver of the weakness was the sharp contraction in oil- and gas-related industries as they adjusted to lower prices (Chart 20).
Production in oil- and gas-related industries declined by 8 per cent between the fourth quarter of 2014 and the second quarter of 2015, while business investment linked to these industries fell sharply. Income from wages and salaries continued to fall, as did employment (by 9 per cent since last
File information (for internal use only): CPI infl ation -- EN.indd
Last output: 11:11:33 AM; Oct 20, 2015
Note: The value for total CPI infl ation in 2015Q3 is a Bank of Canada estimate.
Sources: Statistics Canada and Bank of Canada estimates and calculations Last data plotted: 2015Q3
Total CPI infl ation(left scale)
Exchange rate pass-through (right scale) Energy prices excluding pass-through (right scale) Total CPI excluding the impact of energy prices and exchange rate pass-through (right scale)
-2
-1
0
1
2
3
-2
-1
0
1
2
3
%
2013 2014 2015
Percentage points
Chart 18: Total CPI infl ation has remained close to 1 per cent Contribution to infl ation, year-over-year percentage change, quarterly data
File information (for internal use only): Gasoline prices -- EN.indd
Last output: 04:57:36 PM; Oct 19, 2015
Sources: Statistics Canada and Bank of Canada
Last observations: August 2015 for the average retail gasoline price and September 2015
for the Brent crude oil price
Brent crude oil price (left scale) Average retail gasoline price (right scale)
20
40
60
80
100
120
140
2011 2012 2013 2014 20150.60
0.75
0.90
1.05
1.20
1.35
1.50
Can$/litreCan$/barrel
Chart 19: Gasoline prices have recently diverged from oil pricesMonthly data
16 Canadian EConoMy BANK OF CANADA • MONEtARy POlICy REPORt • OCtOBER 2015
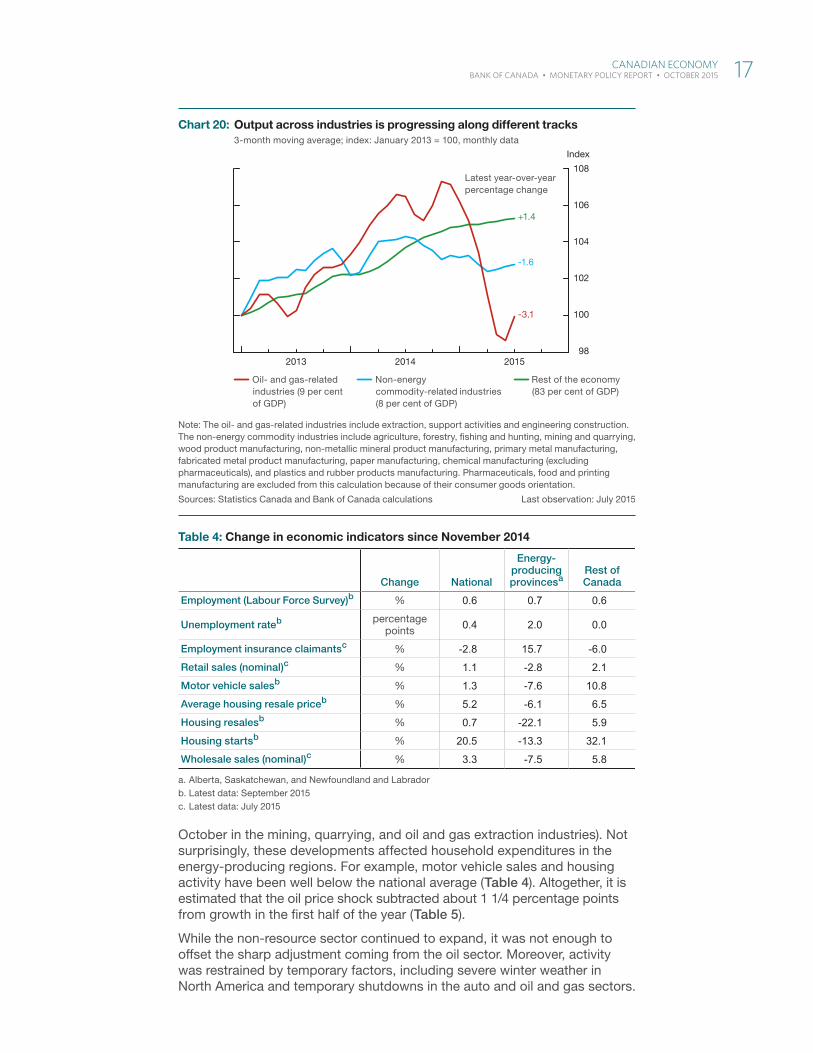
October in the mining, quarrying, and oil and gas extraction industries). Not surprisingly, these developments affected household expenditures in the energy-producing regions. For example, motor vehicle sales and housing activity have been well below the national average (Table 4). Altogether, it is estimated that the oil price shock subtracted about 1 1/4 percentage points from growth in the first half of the year (Table 5).
While the non-resource sector continued to expand, it was not enough to offset the sharp adjustment coming from the oil sector. Moreover, activity was restrained by temporary factors, including severe winter weather in North America and temporary shutdowns in the auto and oil and gas sectors.
File information (for internal use only): Output across industries -- EN.indd
Last output: 11:48:43 AM; Oct 20, 2015
Note: The oil- and gas-related industries include extraction, support activities and engineering construction. The non-energy commodity industries include agriculture, forestry, fi shing and hunting, mining and quarrying, wood product manufacturing, non-metallic mineral product manufacturing, primary metal manufacturing, fabricated metal product manufacturing, paper manufacturing, chemical manufacturing (excluding pharmaceuticals), and plastics and rubber products manufacturing. Pharmaceuticals, food and printing manufacturing are excluded from this calculation because of their consumer goods orientation.
Sources: Statistics Canada and Bank of Canada calculations Last observation: July 2015
Oil- and gas-related industries (9 per cent of GDP)
Non-energy commodity-related industries (8 per cent of GDP)
Rest of the economy (83 per cent of GDP)
98
100
102
104
106
108
2013 2014 2015
Index
Latest year-over-year percentage change
+1.4
-1.6
-3.1
Chart 20: Output across industries is progressing along different tracks3-month moving average; index: January 2013 = 100, monthly data
Table 4: Change in economic indicators since November 2014
Change National
Energy-producing provincesa
Rest of Canada
Employment (Labour Force Survey)b % 0.6 0.7 0.6
Unemployment rateb percentage points 0.4 2.0 0.0
Employment insurance claimantsc % -2.8 15.7 -6.0
Retail sales (nominal)c % 1.1 -2.8 2.1
Motor vehicle salesb % 1.3 -7.6 10.8
Average housing resale priceb % 5.2 -6.1 6.5
Housing resalesb % 0.7 -22.1 5.9
Housing startsb % 20.5 -13.3 32.1
Wholesale sales (nominal)c % 3.3 -7.5 5.8
a. Alberta, Saskatchewan, and Newfoundland and Labradorb. Latest data: September 2015c. Latest data: July 2015
Canadian EConoMy 17 BANK OF CANADA • MONEtARy POlICy REPORt • OCtOBER 2015
Real GDP is expected to rebound in the second half of the year as the impact of the oil price shock on growth in the oil and gas sectors moderates and the rest of the economy strengthens, supported by previous monetary policy easing and the lower value of the Canadian dollar. In particular, pro-duction in the non-resource sector is expected to increase (Chart 20) as foreign demand for Canadian exports strengthens. Meanwhile, the resilience in employment outside the resource sector is likely to continue to support household expenditures. Indeed, even in the second quarter, there was evidence of renewed momentum: excluding the drag on real GDP growth associated with the change in inventory investment, final sales expanded by 0.7 per cent, compared with a 1.8 per cent drop in the first quarter.
Activity in the second half of the year will also be initially boosted by the unwinding of the temporary negative factors that affected the first half of 2015 and the positive impact on consumption of the retroactive payments of the Universal Child Care Benefit. Growth in the second half of the year is expected to average close to 2 per cent, despite the ongoing but moder-ating drag from the resource sector. For 2015 as a whole, the decline in oil prices is estimated to subtract about three-quarters of a percentage point from growth, in line with previous expectations.
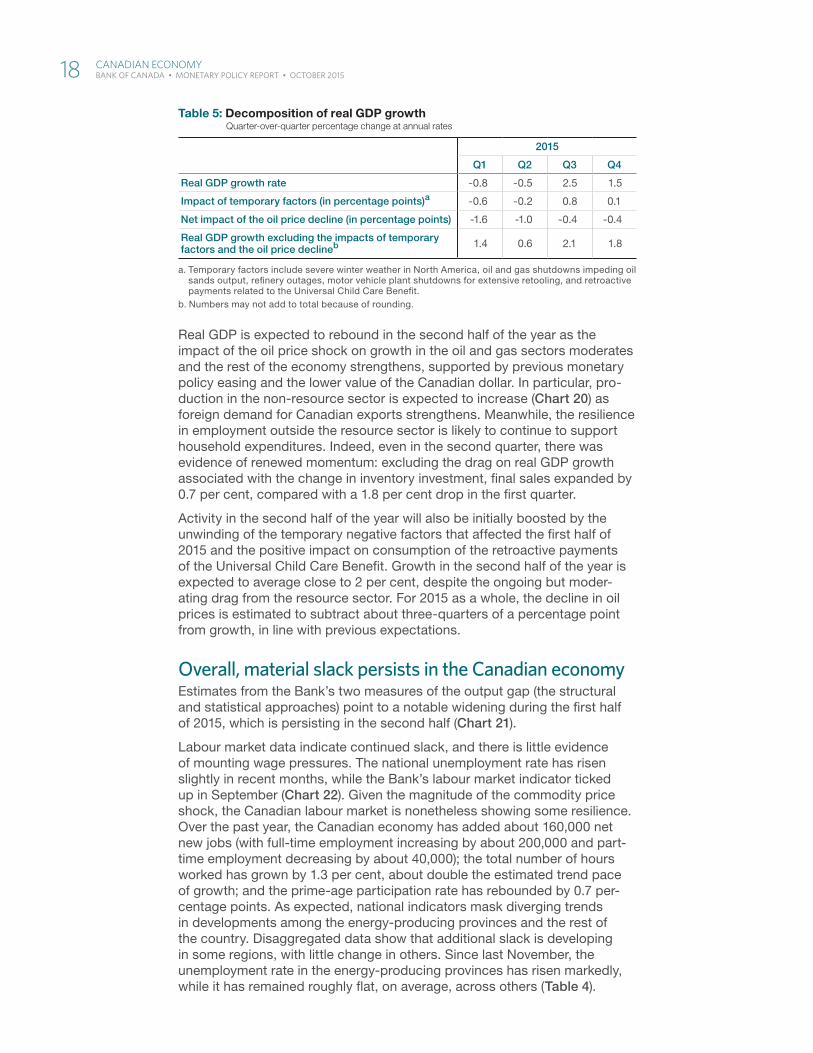
Overall, material slack persists in the Canadian economyEstimates from the Bank’s two measures of the output gap (the structural and statistical approaches) point to a notable widening during the first half of 2015, which is persisting in the second half (Chart 21).
Labour market data indicate continued slack, and there is little evidence of mounting wage pressures. The national unemployment rate has risen slightly in recent months, while the Bank’s labour market indicator ticked up in September (Chart 22). Given the magnitude of the commodity price shock, the Canadian labour market is nonetheless showing some resilience. Over the past year, the Canadian economy has added about 160,000 net new jobs (with full-time employment increasing by about 200,000 and part-time employment decreasing by about 40,000); the total number of hours worked has grown by 1.3 per cent, about double the estimated trend pace of growth; and the prime-age participation rate has rebounded by 0.7 per-centage points. As expected, national indicators mask diverging trends in developments among the energy-producing provinces and the rest of the country. Disaggregated data show that additional slack is developing in some regions, with little change in others. Since last November, the unemployment rate in the energy-producing provinces has risen markedly, while it has remained roughly flat, on average, across others (Table 4).
Table 5: Decomposition of real GDP growthQuarter-over-quarter percentage change at annual rates
2015
Q1 Q2 Q3 Q4
Real GDP growth rate -0.8 -0.5 2.5 1.5
Impact of temporary factors (in percentage points)a -0.6 -0.2 0.8 0.1
Net impact of the oil price decline (in percentage points) -1.6 -1.0 -0.4 -0.4
Real GDP growth excluding the impacts of temporary factors and the oil price declineb 1.4 0.6 2.1 1.8
a. Temporary factors include severe winter weather in North America, oil and gas shutdowns impeding oil sands output, refi nery outages, motor vehicle plant shutdowns for extensive retooling, and retroactive payments related to the Universal Child Care Benefi t.
b. Numbers may not add to total because of rounding.
18 Canadian EConoMy BANK OF CANADA • MONEtARy POlICy REPORt • OCtOBER 2015
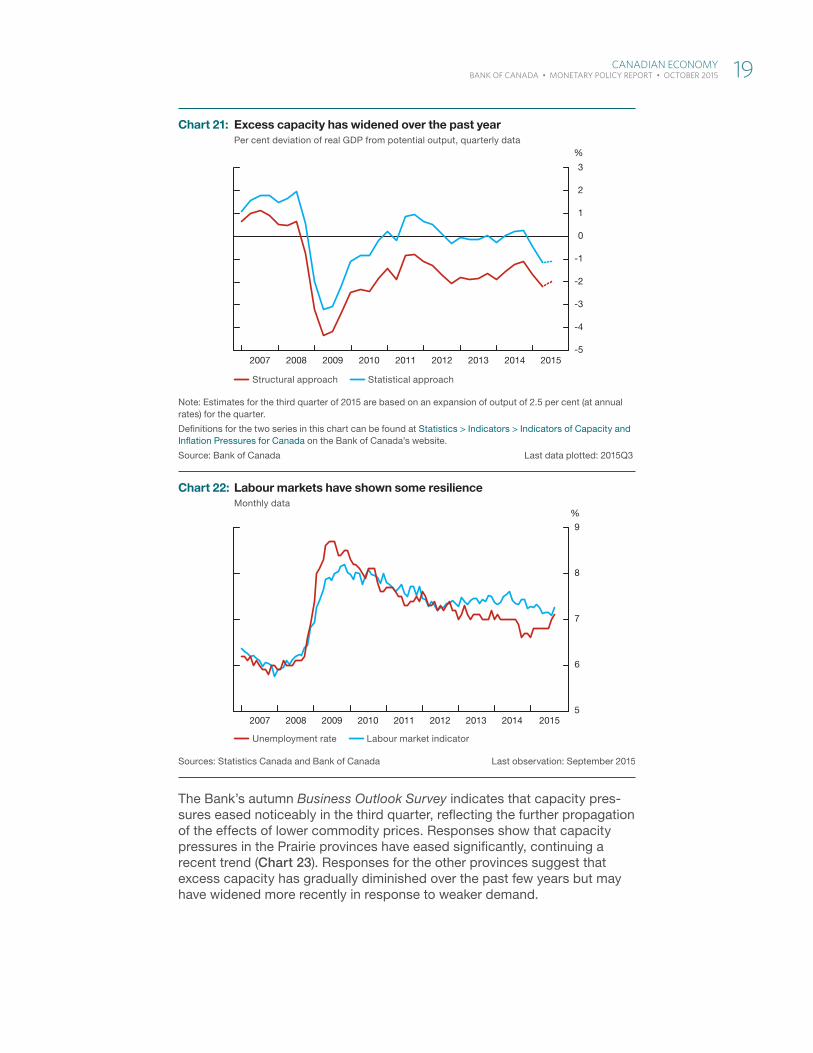
The Bank’s autumn Business Outlook Survey indicates that capacity pres-sures eased noticeably in the third quarter, reflecting the further propagation of the effects of lower commodity prices. Responses show that capacity pressures in the Prairie provinces have eased significantly, continuing a recent trend (Chart 23). Responses for the other provinces suggest that excess capacity has gradually diminished over the past few years but may have widened more recently in response to weaker demand.
File information (for internal use only): Excess capacity -- EN.indd
Last output: 04:57:37 PM; Oct 19, 2015
Note: Estimates for the third quarter of 2015 are based on an expansion of output of 2.5 per cent (at annual rates) for the quarter.
Defi nitions for the two series in this chart can be found at Statistics > Indicators > Indicators of Capacity and Infl ation Pressures for Canada on the Bank of Canada’s website.
Source: Bank of Canada Last data plotted: 2015Q3
Structural approach Statistical approach
-5
-4
-3
-2
-1
0
1
2
3
2007 2008 2009 2010 2011 2012 2013 2014 2015
%
Chart 21: Excess capacity has widened over the past yearPer cent deviation of real GDP from potential output, quarterly data
File information (for internal use only): Labour markets -- EN.indd
Last output: 04:57:37 PM; Oct 19, 2015
Sources: Statistics Canada and Bank of Canada Last observation: September 2015
Unemployment rate Labour market indicator
5
6
7
8
9
2007 2008 2009 2010 2011 2012 2013 2014 2015
%
Chart 22: Labour markets have shown some resilienceMonthly data
Canadian EConoMy 19 BANK OF CANADA • MONEtARy POlICy REPORt • OCtOBER 2015
The contraction in the first half of the year points to weak domestic demand conditions, but because of the sharp declines in investment, it also has negative implications for potential output. Overall, the Bank judges that the amount of excess capacity widened substantially during the first half of 2015 and has remained material in the second half, at between 1 and 2 per cent.4
Adjustments to lower commodity prices will continue to temper economic activityThe Canadian economy is undergoing a complex set of adjustments. A prolonged period of deteriorating competitiveness, punctuated by the Great Recession, led to the destruction of many firms and depressed business investment outside the energy sector, resulting in significantly reduced capacity in the non-resource sector. It is in this context that the Canadian economy has to adjust to lower commodity prices.
From a macroeconomic point of view, full adjustment is expected to take several years, since investment, including through the creation of new firms, is needed to build the capacity to absorb the reallocated labour into the non-resource sector (Box 1). Household expenditures will also take a long time to adjust and will depend on the ultimate impact of the lower terms of trade on national wealth and labour income.
While the adjustment is still in its early stages, there are already signs of the reallocation of labour and capital. Looking first to labour markets, the job vacancy rate in the oil-producing provinces has fallen sharply since the autumn of 2014, while it has increased in the rest of Canada since March of this year. On the supply side, net total migration to Alberta and Saskatchewan from the rest of Canada and international locations slowed to about 11,000 on average per quarter in the first half of this year, less than half of the strong pace of about 24,000 recorded between 2012 and 2013.
4 The projection is constructed around an assumed value for the output gap of -1.4 per cent in the third quarter of 2015, compared with the July assumption of -1.7 per cent for the second quarter.
File information (for internal use only): Capacity pressures -- EN.indd
Last output: 11:06:09 AM; Oct 20, 2015
Note: Responses to the Business Outlook Survey question on capacity pressures. Percentage of fi rms indicating that they would have either some or signifi cant diffi culty meeting an unanticipated increase in demand.
Source: Bank of Canada Last observation: 2015Q3
Prairies Rest of Canada
20
30
40
50
60
70
80
90
2002 2004 2006 2008 2010 2012 2014
%
Chart 23: Capacity pressures have eased noticeably in the Prairies4-quarter moving average, quarterly data
20 Canadian EConoMy BANK OF CANADA • MONEtARy POlICy REPORt • OCtOBER 2015
Box 1
Measuring Capacity During Structural Reallocationlarge and persistent variations in the prices of commodities are major drivers of reallocation of capital and labour across sectors and regions .1 While every fi rm is diff erent and there is considerable uncertainty about how each fi rm will respond to such large shocks, the discussion below describes some of the more important macroeconomic aspects of the adjustment .
Elevated commodity prices: Construction of capacity in the resource sector and destruction of capacity in non-commodity exportsthe resource sector benefi ted from rising and strong com-modity prices for over a decade, dating back to December 2001 and China’s entry into the World trade Organization and its subsequent industrialization . With robust economic growth in China persistently boosting commodity prices, strong investment growth in the resource extraction sector increased capacity, and the related supply chain expanded as well . Strong investment and production in this sector increased labour demand and raised wages, attracting workers from other sectors and regions . As a result, considerable production capacity was built in commodity-rich regions of Canada, and employment increased to support this production .
Over the same period, the non-resource sector, particularly non-commodity exporters, faced very diff erent pressures . the appreciation of the Canadian dollar reduced the price competitiveness of exporting (and import-competing) fi rms . Firms were forced to fi nd ways to innovate, cut costs or exit . In the non-resource traded-goods sector, fi rm exit was wide-spread and some physical capacity was destroyed, which would therefore not be available for subsequent expansion . Meanwhile, with consolidation among non-commodity exporters and their supply chains, job losses led to the emer-gence of labour market slack . the migration of workers to the resource sector helped mitigate the widening of the labour gap in this sector .
Low commodity prices: Construction of capacity in non-commodity exports and destruction of capacity in the resource sectorthe recent large decline in commodity prices is expected to be persistent, and structural adjustment is already under way in Canada . to a certain extent, the earlier challenges that confronted the resource sector and non-commodity exporters are now reversed .
With low commodity prices, the resource sector has excess capacity . Investment had been based on expectations
1 Box 1 in the October 2014 Monetary Policy Report (available at http://www .bankofcanada .ca/2014/10/mpr-2014-10-22) describes the phases of destruction and rebuilding of physical capacity during and after a destructive recession and explains the evolution of labour and capital gaps .
that commodity prices would persist at an elevated level . Consequently, with lower commodity prices, some capacity and many investment projects are not profi table . the response of the resource sector has been swift: fi rms have curtailed investment markedly, found ways to innovate and reduce costs, and scaled back some production facilities . through this initial period of adjustment, employment has declined and a labour gap has begun to open up in the commodity-producing regions .
In contrast, with the depreciation of the Canadian dollar asso-ciated with the fall in commodity prices, as well as the solid momentum of the U .S . economy, the non-resource sector has seen steady growth, and prospects are likely to continue to improve . However, the destruction of capacity since the 2008–09 recession has reduced excess capacity; additional investment and new fi rm creation will be needed to build capacity . At the same time, labour slack is likely to continue for some time, since the starting point for reallocation is one of excess labour supply . In addition, employment opportunities will attract labour from the resource-producing regions .
Capacity destruction and aggregate slackEstimates of potential output and economic slack in the aggregate economy are subject to greater uncertainty during periods of capacity destruction, particularly in relation to the need for investment . While innovation and cost-cutting initiatives can improve the sustainability of operations, some physical capacity may be allowed to depreciate or be temp-orarily or permanently shut down . Permanent reductions in capacity, including through fi rm exit, result in the loss of some capacity for future production . Moreover, excess physical capacity in some sectors cannot be easily trans-ferred for use in other sectors . thus, tightening capacity in the expanding sectors requires investment in new capacity and new fi rm creation . In comparison, labour markets are more fl exible . While there are costs associated with worker retraining and relocation (if required), past experience sug-gests that labour can transfer relatively easily across sectors and regions to satisfy emergent demand .
In the current environment, declines in investment in the resource sector are occurring faster than increases in invest-ment in other sectors that are expected to occur with strength-ening foreign demand and improvements in competitiveness . the diff erences in the timing of the response of investment, combined with other costs of adjustment, imply that, in the near term, potential output growth is more likely to be in the lower part of the range of estimates that the Bank presented in the April Report .
Canadian EConoMy 21 BANK OF CANADA • MONEtARy POlICy REPORt • OCtOBER 2015
Firms are starting to adjust through a variety of mechanisms: in the Bank’s autumn Business Outlook Survey, some firms that are part of the oil and gas supply chain reported reorienting their client base following declining sales. Other firms are adapting by restructuring and refocusing their efforts, in some cases amid an ongoing consolidation in their industry, for example, through innovation or by developing their online sales.
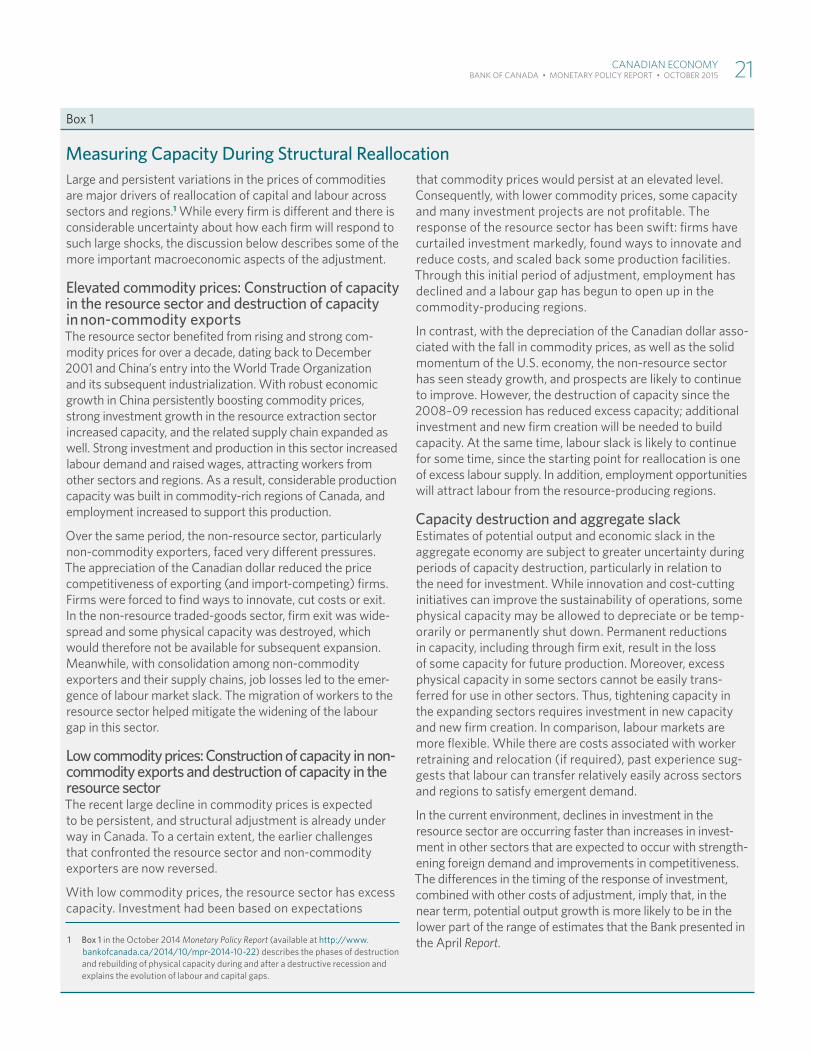
Data on Canadian firm creation also reveal adjustments. Growth in the population of firms in the economy has been on a gradual upward trend since late 2012 (Chart 24), but recent developments indicate divergence across industries. The number of firms in the mining, quarrying, and oil and gas extraction industries contracted by 1.1 per cent (year-over-year) in the first quarter of this year and 3.0 per cent in the second quarter. Outside this sector, growth in the population of firms picked up during these quarters.
Overall, while investment spending in the oil and gas extraction industries is expected to continue to decline for several quarters, strengthening activity in the non-resource sector should underpin solid growth through the adjust-ment process. Real GDP is expected to increase by about 2 per cent in 2016 and about 2 1/2 per cent in 2017.
The contraction of investment spending is weighing on potential outputThis projection incorporates a further decline in the prices for oil and other commodities since July, which has resulted in a downward revision to busi-ness investment and exports. While the adverse impact of these shocks on GDP raises the risk that the output gap could take longer to close than previously expected, the weaker investment profile suggests that potential output growth in the near term is more likely to be in the lower part of the Bank’s range of estimates (Table 2).5 Given this judgment, the Canadian economy can be expected to return to potential around mid-2017.
Overall, there is much uncertainty about the magnitude and timing of the effects of the commodity price shock on potential output, particularly over the medium term. In addition to the direct impact of weaker investment,
5 The Bank’s most recent comprehensive assessment of potential output was in April 2015.
File information (for internal use only): Growth of fi rms -- EN.indd
Last output: 04:57:37 PM; Oct 19, 2015
Source: Statistics Canada Last observation: 2015Q2
-1
0
1
2
3
4
2007 2008 2009 2010 2011 2012 2013 2014 2015
%
Chart 24: The population growth of fi rms has been picking upYear-over-year percentage change, quarterly data
22 Canadian EConoMy BANK OF CANADA • MONEtARy POlICy REPORt • OCtOBER 2015
potential output is affected by the reallocation of resources across sectors (Box 1). The costs associated with structural reallocation imply that the level and growth rate of potential output could be weaker. Other dampening factors include the shifting of production away from relatively high-productivity resource extraction industries and costs associated with relocating or retraining labour, including implicit costs such as temporary underemployment and increased numbers of discouraged workers. However, innovation and the exit of low-productivity firms could contribute to higher potential output.
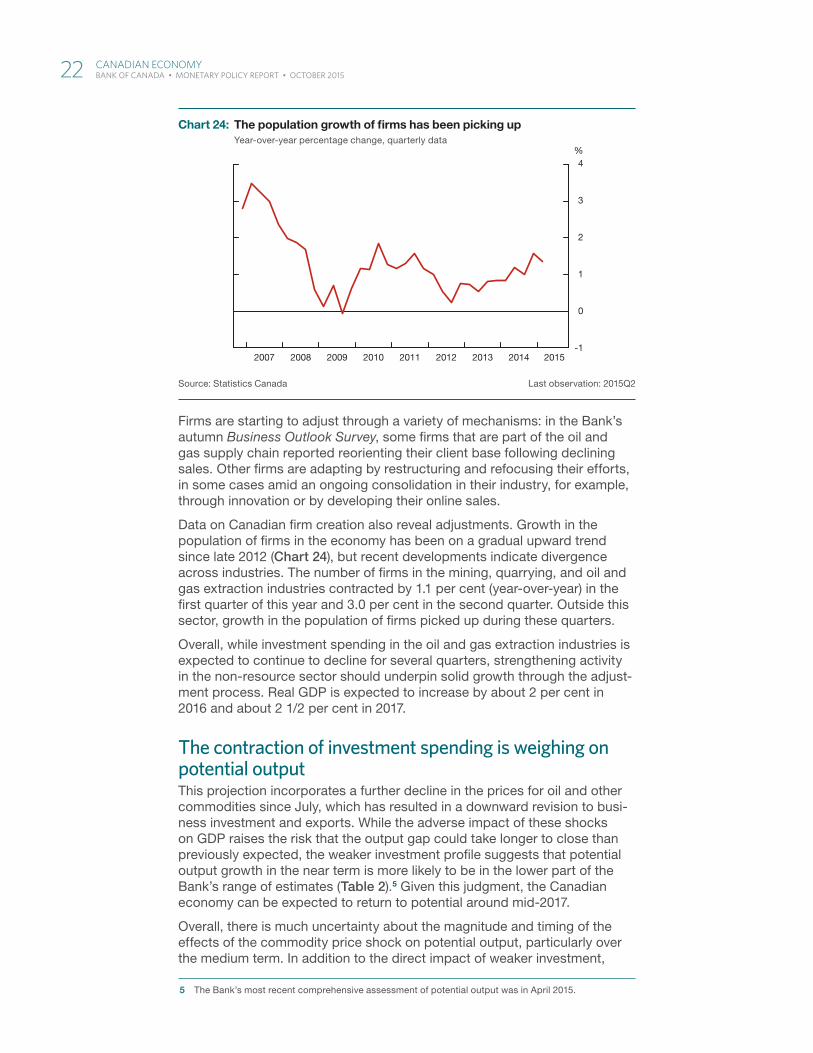
Stimulative financial conditions are helping to support adjustmentsCanadian financial conditions remain highly accommodative. Reductions in the policy rate in January and July have helped to offset some of the global tightening of financial conditions. For example, 10-year government bond yields in Canada have declined modestly since the July Report and are about 50 basis points lower than their average level in the fourth quarter of 2014. Similarly, effective borrowing rates for both households and busi-nesses remain at or near historically low levels (Chart 25). Mortgage rates are at record lows, both for fixed- and variable-rate mortgages, and growth in mortgage credit has picked up.
Nevertheless, credit conditions in some segments of the economy have deteriorated recently in an environment of increased market volatility and with a decline in the valuations of risky assets globally. Notably, credit spreads on corporate bonds for financial and non-financial issuers have increased, par-ticularly for issuers in the energy and resource sectors.
Business credit growth has slowed in recent months, to a rate approaching the historical average. The weaker loan creation is consistent with results from the Bank’s latest Senior Loan Officer Survey, which indicate that non-price lending conditions continue to tighten in the oil sector. Results from the Bank’s autumn Business Outlook Survey also point to a tightening of credit conditions, particularly in regions and sectors that are adversely affected by the oil price shock.
File information (for internal use only): Borrowing rates -- EN.indd
Last output: 04:57:37 PM; Oct 19, 2015
Note: For more information on the series, see Statistics > Credit Conditions > Financial Conditions on the Bank of Canada’s website.
Source: Bank of Canada Last observation: 16 October 2015
Effective business interest rate Effective household interest rate
%
2013 2014 20152.5
3.0
3.5
4.0
Chart 25: Borrowing rates remain very lowWeekly data
Canadian EConoMy 23 BANK OF CANADA • MONEtARy POlICy REPORt • OCtOBER 2015
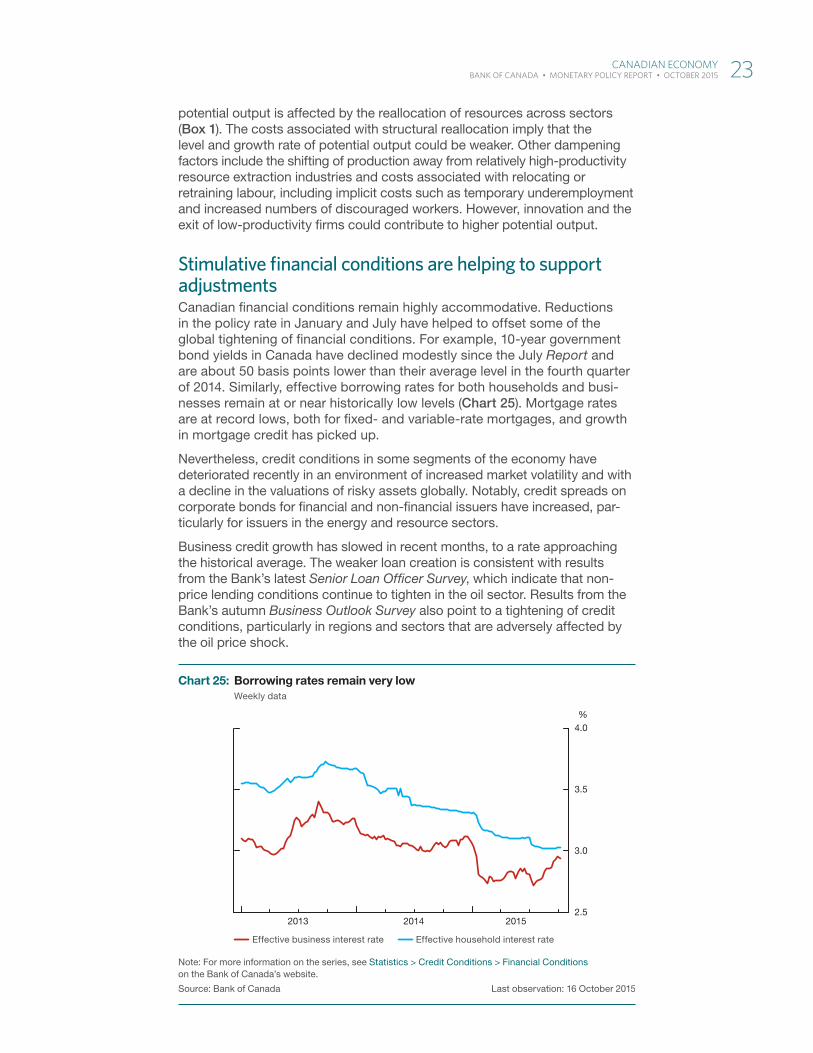
Exports are regaining momentum…Commodity exports are expected to increase at a moderate pace over the projection horizon (Chart 26). Cuts to capital expenditures will temper future production and exports in the oil sector. Similarly, expectations of low prices and competitiveness issues will weigh on activity in the mining and related sectors (particularly for intermediate metal products). In contrast, lumber exports should benefit from an improving U.S. housing market, and agricultural exports are projected to pick up in response to increasing global demand for food and a bounce back in production after the 2015 drought.
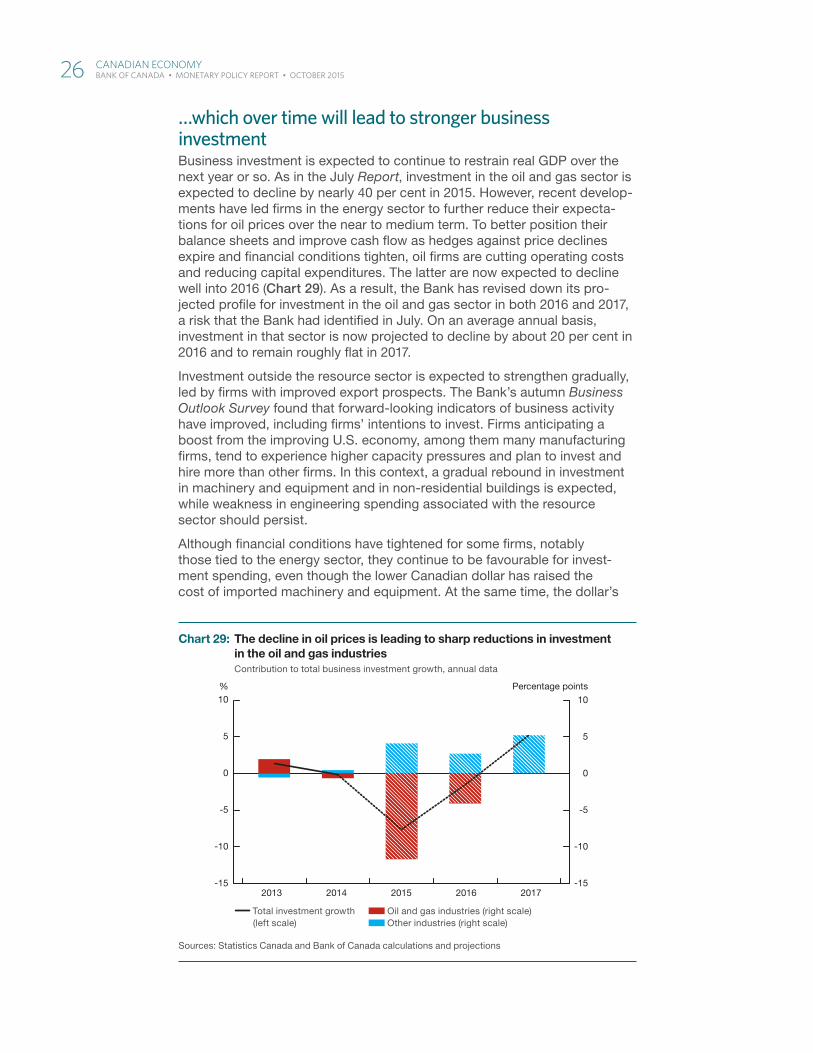
Following a rebound in recent months, non-commodity exports are expected to grow at a solid pace, boosted by the strong growth in U.S. private domestic demand and the depreciation of the Canadian dollar. Export growth is being led by components sensitive to the exchange rate, roughly two-thirds of which are showing positive momentum and are significantly outperforming those that are less exchange rate sensitive (Chart 27). On the services side, travel services have been particularly robust, supported by the lower Canadian dollar. The number of international visitors to Canada has picked up, while the number of Canadians going abroad has declined noticeably (Chart 28).
Bank analysis shows that many of the categories of exports that were expected to lead the recovery have maintained momentum. In particular, building materials, fabricated metal and non-metallic mineral products have posted robust growth in recent months. These industries are expected to contribute materially to Canada’s export performance. Drawing across all export categories, more granular analysis reveals new sources of export growth (such as steel forms and some food products), which rose from essentially zero in 2010 to more than $500 million in total in 2014. While these new sales constitute only a small proportion of overall exports, they demonstrate that many Canadian firms can adapt to changing economic circumstances.6
6 For more details, see A. Binette, D. de Munnik and J. Melanson, “An Update – Canadian Non-Energy Exports: Past Performance and Future Prospects,” Bank of Canada Discussion Paper No. 2015-10.
File information (for internal use only): Non-energy -- EN.indd
Last output: 11:05:27 AM; Oct 20, 2015
Sources: Statistics Canada and Bank of Canada calculations and projections
Energy exports Non-energy commodity exports Non-commodity exports
95
100
105
110
115
120
125
130
2013 2014 2015 2016 2017
Index
Chart 26: Non-energy exports are projected to gain momentum Index 2013Q1 = 100, quarterly data
24 Canadian EConoMy BANK OF CANADA • MONEtARy POlICy REPORt • OCtOBER 2015
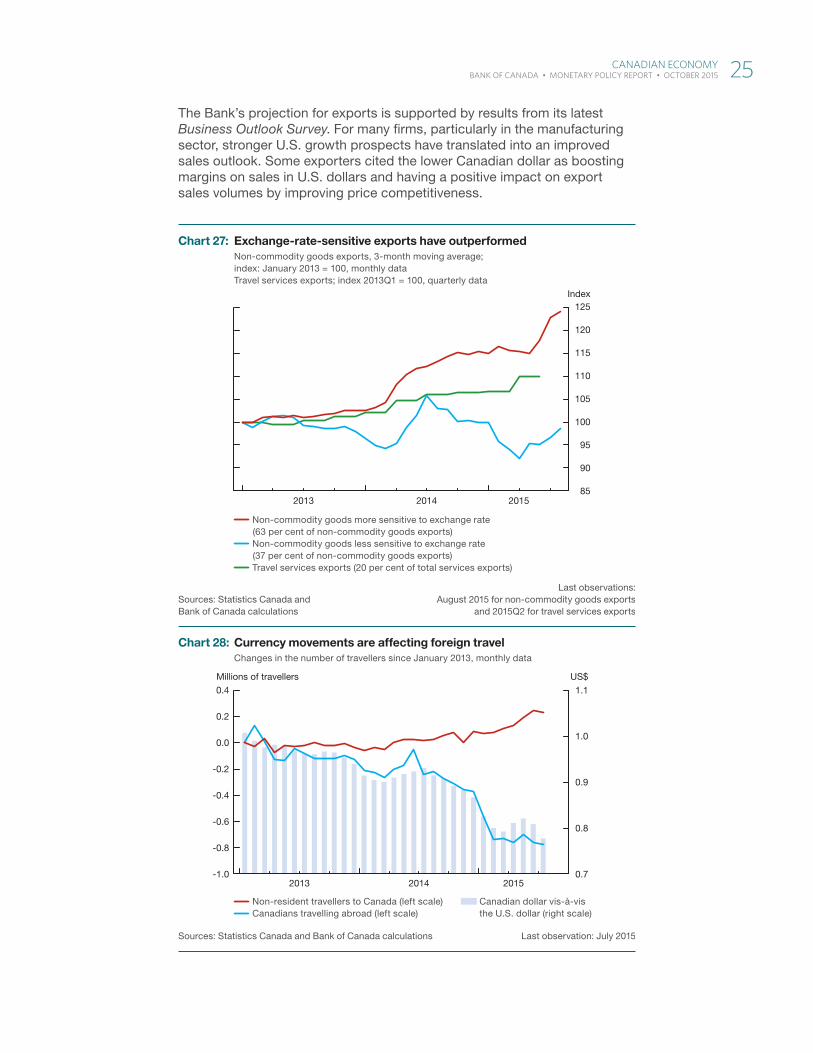
The Bank’s projection for exports is supported by results from its latest Business Outlook Survey. For many firms, particularly in the manufacturing sector, stronger U.S. growth prospects have translated into an improved sales outlook. Some exporters cited the lower Canadian dollar as boosting margins on sales in U.S. dollars and having a positive impact on export sales volumes by improving price competitiveness.
File information (for internal use only): Exchange rate -- EN.indd
Last output: 11:04:45 AM; Oct 20, 2015
Sources: Statistics Canada and Bank of Canada calculations
Last observations: August 2015 for non-commodity goods exports
and 2015Q2 for travel services exports
Non-commodity goods more sensitive to exchange rate(63 per cent of non-commodity goods exports)
Non-commodity goods less sensitive to exchange rate(37 per cent of non-commodity goods exports)
Travel services exports (20 per cent of total services exports)
85
90
95
100
105
110
115
120
125
2013 2014 2015
Index
Chart 27: Exchange-rate-sensitive exports have outperformed Non-commodity goods exports, 3-month moving average; index: January 2013 = 100, monthly dataTravel services exports; index 2013Q1 = 100, quarterly data
File information (for internal use only): Currency Movements -- EN.indd
Last output: 11:03:38 AM; Oct 20, 2015
Sources: Statistics Canada and Bank of Canada calculations Last observation: July 2015
Non-resident travellers to Canada (left scale) Canadians travelling abroad (left scale)
Canadian dollar vis-à-vis the U.S. dollar (right scale)
2013 2014 20150.7
0.8
0.9
1.0
1.1
-1.0
-0.8
-0.6
-0.4
-0.2
0.0
0.2
0.4US$Millions of travellers
Chart 28: Currency movements are affecting foreign travel Changes in the number of travellers since January 2013, monthly data
Canadian EConoMy 25 BANK OF CANADA • MONEtARy POlICy REPORt • OCtOBER 2015
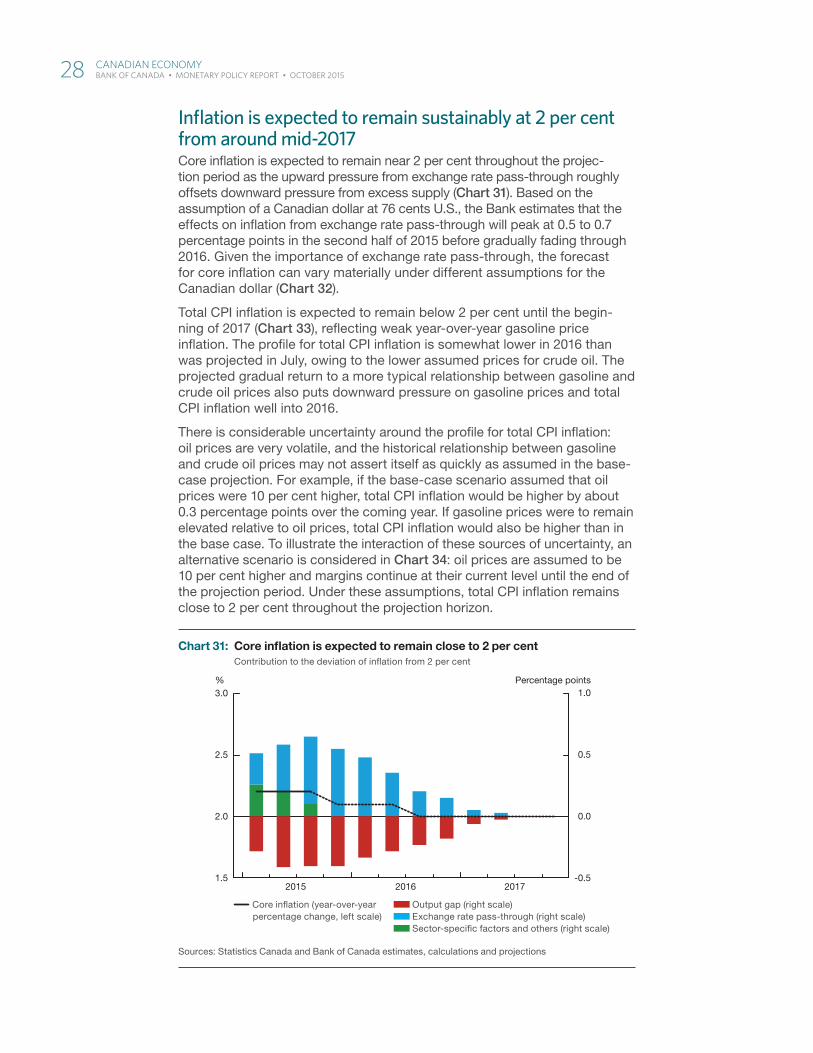
…which over time will lead to stronger business investmentBusiness investment is expected to continue to restrain real GDP over the next year or so. As in the July Report, investment in the oil and gas sector is expected to decline by nearly 40 per cent in 2015. However, recent develop-ments have led firms in the energy sector to further reduce their expecta-tions for oil prices over the near to medium term. To better position their balance sheets and improve cash flow as hedges against price declines expire and financial conditions tighten, oil firms are cutting operating costs and reducing capital expenditures. The latter are now expected to decline well into 2016 (Chart 29). As a result, the Bank has revised down its pro-jected profile for investment in the oil and gas sector in both 2016 and 2017, a risk that the Bank had identified in July. On an average annual basis, investment in that sector is now projected to decline by about 20 per cent in 2016 and to remain roughly flat in 2017.
Investment outside the resource sector is expected to strengthen gradually, led by firms with improved export prospects. The Bank’s autumn Business Outlook Survey found that forward-looking indicators of business activity have improved, including firms’ intentions to invest. Firms anticipating a boost from the improving U.S. economy, among them many manufacturing firms, tend to experience higher capacity pressures and plan to invest and hire more than other firms. In this context, a gradual rebound in investment in machinery and equipment and in non-residential buildings is expected, while weakness in engineering spending associated with the resource sector should persist.
Although financial conditions have tightened for some firms, notably those tied to the energy sector, they continue to be favourable for invest-ment spending, even though the lower Canadian dollar has raised the cost of imported machinery and equipment. At the same time, the dollar’s
File information (for internal use only): Decline in Oil Prices -- EN.indd
Last output: 04:57:38 PM; Oct 19, 2015
Sources: Statistics Canada and Bank of Canada calculations and projections
Total investment growth (left scale)
Oil and gas industries (right scale) Other industries (right scale)
-15
-10
-5
0
5
10
-15
-10
-5
0
5
10
2013 2014 2015 2016 2017
Percentage points%
Chart 29: The decline in oil prices is leading to sharp reductions in investment in the oil and gas industriesContribution to total business investment growth, annual data
26 Canadian EConoMy BANK OF CANADA • MONEtARy POlICy REPORt • OCtOBER 2015
depreciation in the wake of the decline in commodity prices has had mixed effects on margins and corporate cash flow. For many exporters, the lower exchange rate has boosted margins and cash flow expressed in Canadian dollars. In contrast, for domestic firms with relatively higher import content in their production processes, the higher Canadian-dollar cost of imports is potentially squeezing margins and cash flow.
Household expenditures continue to underpin overall economic activityHousehold expenditures are expected to continue to grow at a moderate pace over the projection period. While the further deterioration in the terms of trade and associated income and wealth prospects will have a damp-ening effect, a resilient labour market will help to support demand growth. The lower dollar will shift domestic consumption, including travel spending, toward domestically produced goods and services.
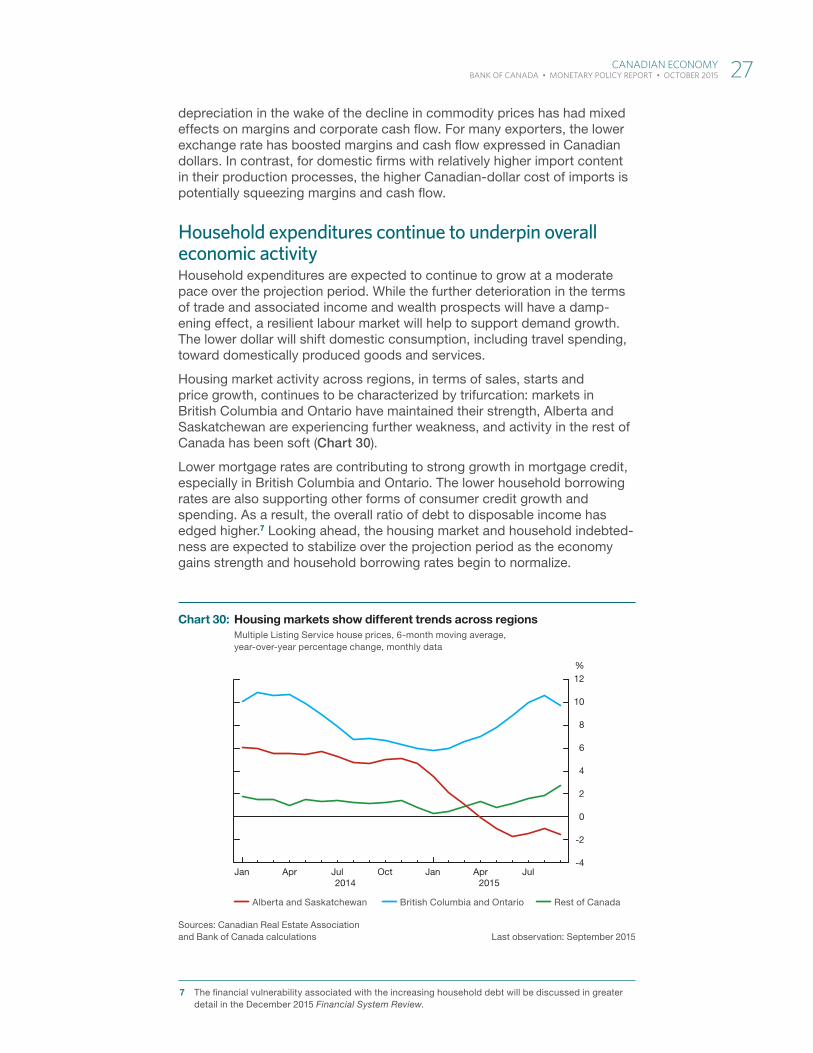
Housing market activity across regions, in terms of sales, starts and price growth, continues to be characterized by trifurcation: markets in British Columbia and Ontario have maintained their strength, Alberta and Saskatchewan are experiencing further weakness, and activity in the rest of Canada has been soft (Chart 30).
Lower mortgage rates are contributing to strong growth in mortgage credit, especially in British Columbia and Ontario. The lower household borrowing rates are also supporting other forms of consumer credit growth and spending. As a result, the overall ratio of debt to disposable income has edged higher.7 Looking ahead, the housing market and household indebted-ness are expected to stabilize over the projection period as the economy gains strength and household borrowing rates begin to normalize.
7 The financial vulnerability associated with the increasing household debt will be discussed in greater detail in the December 2015 Financial System Review.
File information (for internal use only): Housing markets -- EN.indd
Last output: 10:51:21 AM; Oct 20, 2015
Sources: Canadian Real Estate Association and Bank of Canada calculations Last observation: September 2015
Alberta and Saskatchewan British Columbia and Ontario Rest of Canada
-4
-2
0
2
4
6
8
10
12%
2014 2015Jan Apr Jul Oct Jan Apr Jul
Chart 30: Housing markets show different trends across regionsMultiple Listing Service house prices, 6-month moving average, year-over-year percentage change, monthly data
Canadian EConoMy 27 BANK OF CANADA • MONEtARy POlICy REPORt • OCtOBER 2015
Inflation is expected to remain sustainably at 2 per cent from around mid-2017Core inflation is expected to remain near 2 per cent throughout the projec-tion period as the upward pressure from exchange rate pass-through roughly offsets downward pressure from excess supply (Chart 31). Based on the assumption of a Canadian dollar at 76 cents U.S., the Bank estimates that the effects on inflation from exchange rate pass-through will peak at 0.5 to 0.7 percentage points in the second half of 2015 before gradually fading through 2016. Given the importance of exchange rate pass-through, the forecast for core inflation can vary materially under different assumptions for the Canadian dollar (Chart 32).
Total CPI inflation is expected to remain below 2 per cent until the begin-ning of 2017 (Chart 33), reflecting weak year-over-year gasoline price inflation. The profile for total CPI inflation is somewhat lower in 2016 than was projected in July, owing to the lower assumed prices for crude oil. The projected gradual return to a more typical relationship between gasoline and crude oil prices also puts downward pressure on gasoline prices and total CPI inflation well into 2016.
There is considerable uncertainty around the profile for total CPI inflation: oil prices are very volatile, and the historical relationship between gasoline and crude oil prices may not assert itself as quickly as assumed in the base-case projection. For example, if the base-case scenario assumed that oil prices were 10 per cent higher, total CPI inflation would be higher by about 0.3 percentage points over the coming year. If gasoline prices were to remain elevated relative to oil prices, total CPI inflation would also be higher than in the base case. To illustrate the interaction of these sources of uncertainty, an alternative scenario is considered in Chart 34: oil prices are assumed to be 10 per cent higher and margins continue at their current level until the end of the projection period. Under these assumptions, total CPI inflation remains close to 2 per cent throughout the projection horizon.
File information (for internal use only): Core infl ation is expected -- EN.indd
Last output: 04:57:38 PM; Oct 19, 2015
Sources: Statistics Canada and Bank of Canada estimates, calculations and projections
Core infl ation (year-over-year percentage change, left scale)
Output gap (right scale) Exchange rate pass-through (right scale) Sector-specifi c factors and others (right scale)
%
2015 2016 2017-0.5
0.0
0.5
1.0
1.5
2.0
2.5
3.0Percentage points
Chart 31: Core infl ation is expected to remain close to 2 per centContribution to the deviation of infl ation from 2 per cent
28 Canadian EConoMy BANK OF CANADA • MONEtARy POlICy REPORt • OCtOBER 2015
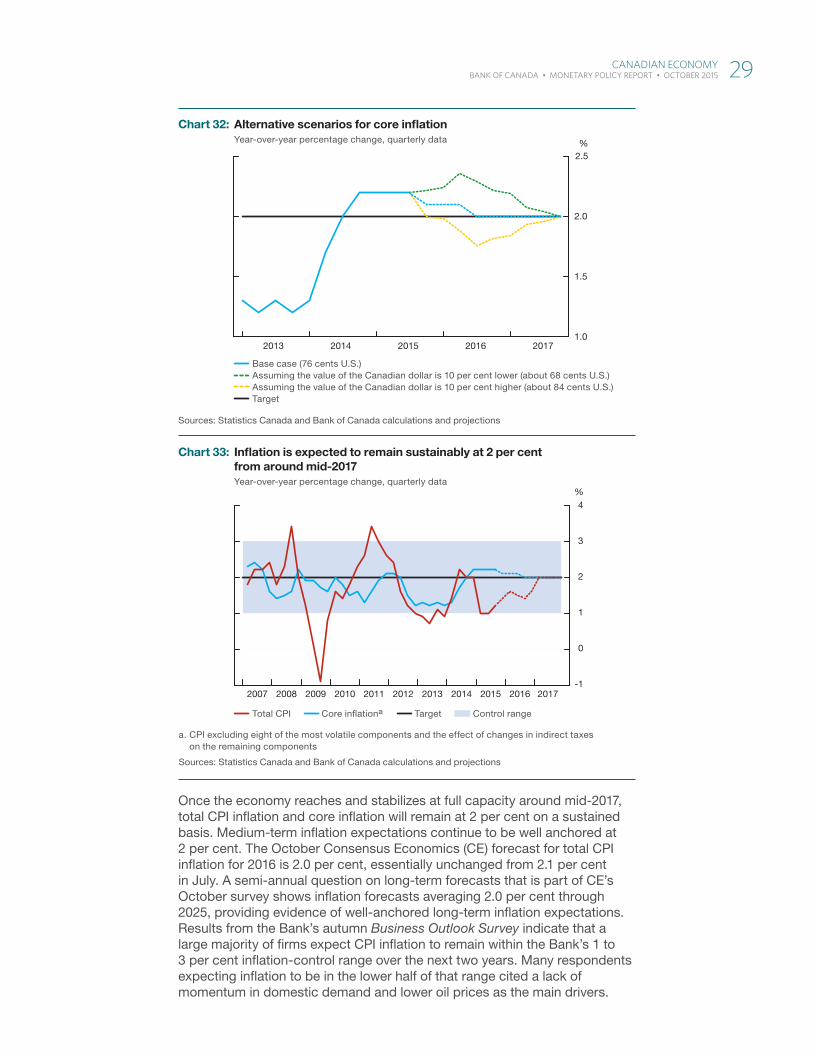
Once the economy reaches and stabilizes at full capacity around mid-2017, total CPI inflation and core inflation will remain at 2 per cent on a sustained basis. Medium-term inflation expectations continue to be well anchored at 2 per cent. The October Consensus Economics (CE) forecast for total CPI inflation for 2016 is 2.0 per cent, essentially unchanged from 2.1 per cent in July. A semi-annual question on long-term forecasts that is part of CE’s October survey shows inflation forecasts averaging 2.0 per cent through 2025, providing evidence of well-anchored long-term inflation expectations. Results from the Bank’s autumn Business Outlook Survey indicate that a large majority of firms expect CPI inflation to remain within the Bank’s 1 to 3 per cent inflation-control range over the next two years. Many respondents expecting inflation to be in the lower half of that range cited a lack of momentum in domestic demand and lower oil prices as the main drivers.
File information (for internal use only): Alt Scenarios for Core Infl ation -- EN.indd
Last output: 09:38:33 AM; Oct 20, 2015
Sources: Statistics Canada and Bank of Canada calculations and projections
Base case (76 cents U.S.) Assuming the value of the Canadian dollar is 10 per cent lower (about 68 cents U.S.) Assuming the value of the Canadian dollar is 10 per cent higher (about 84 cents U.S.) Target
2013 2014 2015 2016 20171.0
1.5
2.0
2.5%
Chart 32: Alternative scenarios for core infl ationYear-over-year percentage change, quarterly data
File information (for internal use only): Infl ation is expected to return -- EN.indd
Last output: 04:57:38 PM; Oct 19, 2015
a. CPI excluding eight of the most volatile components and the effect of changes in indirect taxes on the remaining components
Sources: Statistics Canada and Bank of Canada calculations and projections
Total CPI Core infl ationa Target Control range
-1
0
1
2
3
4
2007 2008 2009 2010 2011 2012 2013 2014 2015 2016 2017
%
Chart 33: Infl ation is expected to remain sustainably at 2 per cent from around mid-2017Year-over-year percentage change, quarterly data
Canadian EConoMy 29 BANK OF CANADA • MONEtARy POlICy REPORt • OCtOBER 2015
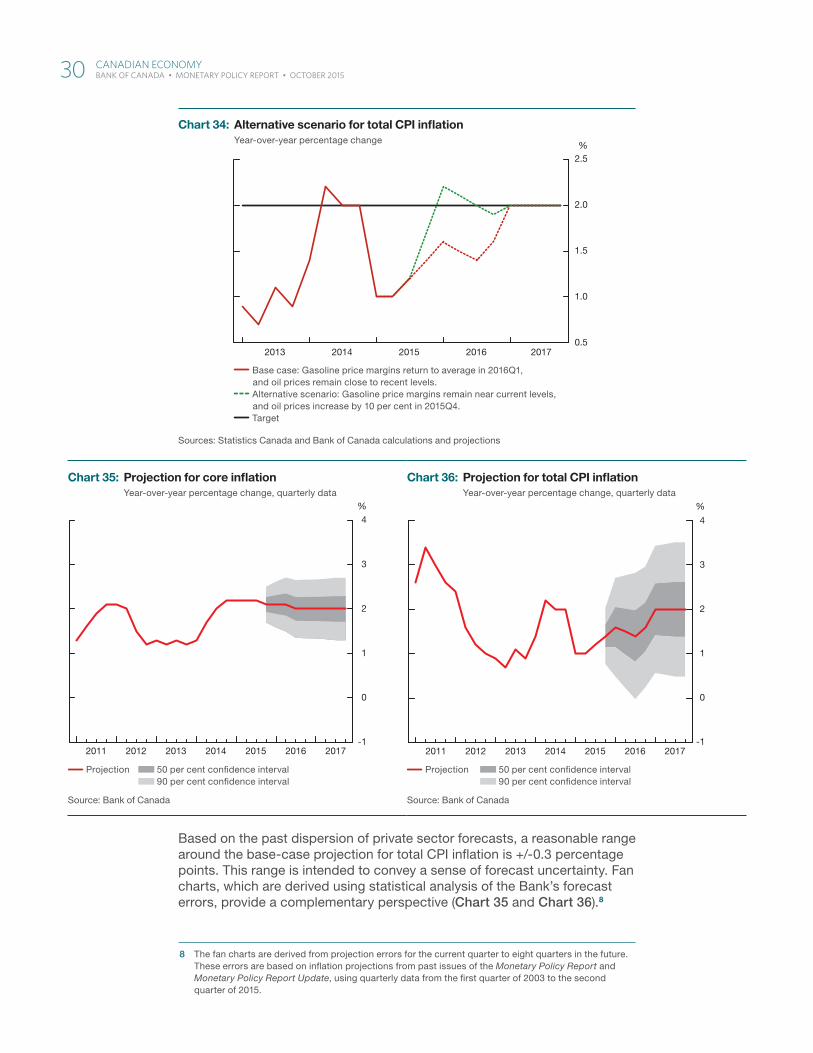
Based on the past dispersion of private sector forecasts, a reasonable range around the base-case projection for total CPI inflation is +/-0.3 percentage points. This range is intended to convey a sense of forecast uncertainty. Fan charts, which are derived using statistical analysis of the Bank’s forecast errors, provide a complementary perspective (Chart 35 and Chart 36).8
8 The fan charts are derived from projection errors for the current quarter to eight quarters in the future. These errors are based on inflation projections from past issues of the Monetary Policy Report and Monetary Policy Report Update, using quarterly data from the first quarter of 2003 to the second quarter of 2015.
File information (for internal use only): Alt Projections for Total CPI Infl ation -- EN.indd
Last output: 11:05:12 AM; Oct 20, 2015
Sources: Statistics Canada and Bank of Canada calculations and projections
Base case: Gasoline price margins return to average in 2016Q1, and oil prices remain close to recent levels.
Alternative scenario: Gasoline price margins remain near current levels, and oil prices increase by 10 per cent in 2015Q4.
Target
201520142013 2016 2017
1.0
0.5
1.5
2.0
2.5%
Chart 34: Alternative scenario for total CPI infl ationYear-over-year percentage change
File information (for internal use only): File: FAN Core CPI -- EN.indd
Last output: 04:57:38 PM; Oct 19, 2015
Source: Bank of Canada
Projection 50 per cent confi dence interval 90 per cent confi dence interval
%
-1
0
1
2
3
4
2011 2012 2013 2014 2015 2016 2017
Chart 35: Projection for core infl ationYear-over-year percentage change, quarterly data
File information (for internal use only): File: FAN Total CPI -- EN.indd
Last output: 04:39:35 PM; Oct 20, 2015
Source: Bank of Canada
Projection 50 per cent confi dence interval 90 per cent confi dence interval
-1
0
1
2
3
4
2011 2012 2013 2014 2015 2016 2017
%
Chart 36: Projection for total CPI infl ationYear-over-year percentage change, quarterly data
30 Canadian EConoMy BANK OF CANADA • MONEtARy POlICy REPORt • OCtOBER 2015
Risks to the inflation outlookThe outlook for inflation is subject to several risks emanating from both the external environment and the domestic economy. The Bank judges that the risks to the projected path for inflation are roughly balanced.
(i) Weaker Canadian exports and investmentAfter weakness earlier in the year, non-commodity exports have shown renewed momentum, boosted by the firming of U.S. economic growth and the past depreciation of the Canadian dollar. While the Bank’s projection for exports is cautious, there is a risk that exports will fall short of expectations, given continuing competitiveness chal-lenges. For example, the competitiveness of Canadian firms in the U.S. market may not improve materially relative to that of exporters from other regions, whose currencies have also depreciated against the U.S. dollar. Firms may also be responding to greater foreign demand by expanding their offshore production capacity rather than exporting from Canada. Weaker exports would have negative implications for business investment since firms would hold back on expanding domestic capacity.
In the oil and gas sector, there is still considerable uncertainty around firms’ adjustment to the lower price environment. If price expectations remain low or fall further, firms may revise their spending plans down-ward yet again.
(ii) Imbalances in the Canadian household sectorHousing activity remains robust, especially in the Greater Toronto and Vancouver areas. Recent indicators, such as resales, housing starts and prices, point to continued momentum. At the same time, consumption has been resilient, despite the shock to incomes from lower commodity prices. Persistent strength in household spending would provide a near-term boost to economic activity, but it would also further exacerbate existing imbalances in the household sector, increasing the likelihood and potential severity of a correction later on. Vulnerabilities in the household sector are continuing to edge higher. Although the most likely scenario is one in which these imbalances unwind gradually as the economy improves, a disorderly unwinding, such as one that might be triggered by further weakness in the resource sector or a rapid rise in global interest rates, could have sizable negative effects on the economy.
Risks to thE inflation outlook 31 BANK OF CANADA • MONEtARy POlICy REPORt • OCtOBER 2015
(iii) Higher non-energy commodity pricesIt is possible that markets have overreacted to slower growth in China, perceiving recent data as indicative of substantially weaker activity and commodity demand. In this context, there is a risk that markets could revise these expectations significantly based on incoming data, leading to an upward adjustment in non-energy commodity prices and Canada’s terms of trade.
(iv) Stronger U.S. private demandThe strong pickup in U.S. private domestic demand could trigger a larger-than-expected increase in business investment as firms become more confident about economic prospects. Consumer con-fidence could also strengthen further with improvements in employ-ment and income prospects, resulting in greater acceleration in household spending. The subsequent boost to private demand could generate positive spillovers to growth in the rest of the world, lifting global confidence more generally and raising demand for Canada’s exports.
(v) Financial market stress in emerging-market economiesFinancial conditions have tightened in EMEs, and volatility has risen since July as markets have reassessed the growth prospects in these economies. Financial conditions could deteriorate further, for example, in the event of an outsized market reaction to the expected normalization of U.S. monetary policy or more significant financial stress in China. The ensuing financial market turmoil could expose debt risks in those EMEs that have issued significant amounts of sovereign and corporate debt denominated in U.S. dollars, leading to a further tightening in financial conditions and greater volatility.
32 Risks to thE inflation outlook BANK OF CANADA • MONEtARy POlICy REPORt • OCtOBER 2015