MONETARY POLICY REPORT JANUARY 2007s3.amazonaws.com/zanran_storage/ fileiii MONETARY POLICY REPORT...
49
i The Monetary Policy Report is published quarterly by Bank Indonesia after the Board of Governors» Meetings in April, July, October, and December. In addition to fulfilling the mandate of article 58 of Act Number 23 of 1999 concerning Bank Indonesia, amended by Act No. 3 of 2004, the report has two main purposes: (i) to function as a tangible product of a forward-looking working framework in which formulation of monetary policy is based on economic and inflation forecasts; and (ii) as a medium for the Board of Governors of Bank Indonesia to present to the public the various policy considerations underlying its monetary policy decisions. The Board of Governors Burhanuddin Abdullah Governor Miranda S. Goeltom Senior Deputy Governor Bun Bunan E.J. Hutapea Deputy Governor Aslim Tadjuddin Deputy Governor Hartadi A. Sarwono Deputy Governor Siti Ch. Fadjrijah Deputy Governor S. Budi Rochadi Deputy Governor Muliaman D. Hadad Deputy Governor MONETARY POLICY REPORT JANUARY 2007
Transcript of MONETARY POLICY REPORT JANUARY 2007s3.amazonaws.com/zanran_storage/ fileiii MONETARY POLICY REPORT...
i
MONETARY POLICY REPORTBANK INDONESIA
The Monetary Policy Report is published quarterly by Bank Indonesia after the Board of
Governors» Meetings in April, July, October, and December. In addition to fulfilling the
mandate of article 58 of Act Number 23 of 1999 concerning Bank Indonesia, amended
by Act No. 3 of 2004, the report has two main purposes: (i) to function as a tangible
product of a forward-looking working framework in which formulation of monetary
policy is based on economic and inflation forecasts; and (ii) as a medium for the Board of
Governors of Bank Indonesia to present to the public the various policy considerations
underlying its monetary policy decisions.
The Board of Governors
Burhanuddin Abdullah Governor
Miranda S. Goeltom Senior Deputy Governor
Bun Bunan E.J. Hutapea Deputy Governor
Aslim Tadjuddin Deputy Governor
Hartadi A. Sarwono Deputy Governor
Siti Ch. Fadjrijah Deputy Governor
S. Budi Rochadi Deputy Governor
Muliaman D. Hadad Deputy Governor
MONETARY POLICY REPORTJANUARY 2007

ii
MONETARY POLICY REPORTBANK INDONESIA
iii
MONETARY POLICY REPORTBANK INDONESIA
Monetary Policy Strategy
Basic Principles
• With the ITF, inflation target is the overriding objective and nominal anchor of monetary policy. In this regard, BankIndonesia will apply a forward-looking strategy to steer present monetary policy towards achievement of the medium-term inflation target.
Inflation
• Application of the ITF does not mean that monetary policy will not take account of economic growth. This policy willretain the fundamental paradigm of monetary policy in striking an optimal balance between inflation and economicgrowth in both the establishment of the inflation target and in monetary policy response, which will be targetedtowards low, stable inflation in the medium and long-term.
The Inflation Target
• The Government, after consultation with Bank Indonesia, has established and announced targets for CPI inflationtargets at 8%±1%, 6%±1%, and 5%±1% for 2006, 2007, and 2008 (Based on press release on 17 March 2006from the Office of Coordinator Ministry of Economics) . These inflation targets are consistent with the process ofgradual disinflation towards a medium to long-term inflation target of about 3%, competitive with other nations.
Instruments and Monetary Operations
• The BI Rate is used to convey the monetary policy stance and operational targets. The BI Rate is a one-monthinterest rate regularly announced by Bank Indonesia for a specific time frame.
• The BI Rate is implemented through open market operations (OMO) using 1-month SBIs. To strengthen theeffectiveness of liquidity control on the market, Fine Tune Operations (FTO) will be carried out on a daily basis usingSBIs and Government Securities as underlying instruments.
Policymaking Process
• The BI Rate is determined by the Board of Governors in the quarterly Board of Governors» Meeting held eachJanuary, April, July, and October. Under certain conditions, if necessary, the BI Rate may be adjusted in the Board ofGovernors» Meeting convened in other months. Changes in the BI Rate are indicative of Bank Indonesia»s assessmentof the inflation forecast in relation to the established inflation target.
Transparency
• From time to time, monetary policy will be communicated through customary media communications, such asstatements to the press and market players, the website, and the publication of the Monetary Policy Report (MPR).This transparency is intended to strengthen understanding and build public expectations of the economic outlookand future inflation as well as the monetary policy response pursued by Bank Indonesia.
Coordination with the Government
• To provide coordination in inflation targeting, monitoring, and control, the Government and Bank Indonesia haveset up a team made up of officials from various relevant agencies. In the course of its work, the Team deliberatesand issues recommendations concerning the necessary policies for both the Government and Bank Indonesia incurbing inflationary pressure to achieve the established inflation target.
New and Enhanced Monetary Policy MeasuresUnder Inflation Targeting Framework
In July 2005, Bank Indonesia implemented a new and enhanced monetary policy measures within the Inflation TargetingFramework (ITF) which encompasses four main areas: the use of the BI rate as an operational target, enhanced decisionmaking process, more transparent communications strategy, and strengthened policy coordination with the Government.The more is intended to strengthen the effectiveness and to provide good governance to its monetary policy making toachieve the price stability needed to support suistainable economic growth and attain social welfare.

iv
MONETARY POLICY REPORTBANK INDONESIA
vv
MONETARY POLICY REPORTBANK INDONESIA
Foreword
The Governor of Bank Indonesia
Indonesia»s economic gains in Q4/2006 alongside stable macroeconomic conditions give us much cause
for thanks. It is no exaggeration to say now that Indonesia»s economic machinery is on the right track.
Economic growth in Q4/2006 is estimated the highest for any quarter in 2006. In other important areas,
the balance of payments posted a surplus, the exchange rate maintained an appreciating trend and
inflation recorded steady decline. These achievements were supported by a generally stable financial
sector as demonstrated in the performance of the stock market, capital market and money market. All of
this has combined to create a window of opportunity. If Indonesians from all walks of life are able to join
forces, work shoulder-to-shoulder and devote even greater effort to the needed tasks, there is hope for
realising the needed improvements in all areas of life.
The achievement of macroeconomic stability has paved the way for the economy to chart more broad-
based growth. In Q3/2006, the economy visibly entered an expansion phase, despite lack of equilibrium
due to the various impediments in the investment climate and the high costs of doing business. Invest-
ment growth was slower compared to the previous year, while exports and private consumer demand
continued to provide the primary driving force for economic growth throughout 2006. In Q4/2006, we
began to witness a rise in credit expansion followed by a fiscal stimulus from accelerated government
expenditures, bringing estimated 2006 growth to 5.5% (y-o-y).
The balance of payments recorded a hefty surplus in Q4/2006, which bolstered the stability of the rupiah
throughout the quarter. International reserves thus mounted to USD42.4 billion, equivalent to about 4.6
months of imports and official debt payments. At this level, reserves were well up from the previous year.
With relative stability in the rupiah, inflation remained subdued and on a downward trend to the end of
December 2006. Measured annually, CPI inflation at end-2006 reached 6.60% (y-o-y), down sharply
from 17.11% (y-o-y) in 2005. Inflation thus came in below the prescribed target of 8.0% ± 1%.
With macroeconomic aggregates well under control, Bank Indonesia saw that there was sufficient leeway
to proceed with gradual reductions in the BI Rate. During the quarter, the BI Rate was lowered 3 times,
representing a total rate cut of 150 bps to 9.75%. The sustained reductions in the interest rate were
welcomed by business and met with positive response from market actors. Reflecting this were steadily
rising share prices with the stock index closing at 1,805, decline in long-term bond yield and renewed

vivi
MONETARY POLICY REPORTBANK INDONESIA
growth in consumer confidence. Despite this, the reductions in the BI Rate have only seen limited trans-
mission to lending rates.
For the future, Bank Indonesia is optimistic that Indonesia will be able to achieve higher economic growth
in 2007 alongside sustained macroeconomic stability. Growth in 2007 is predicted to reach 5.7%-6.3%,
up from the 5.5% growth rate estimated for 2006. On 4 January 2007, the Bank Indonesia Board of
Governors decided to lower the BI Rate by 25 bps to 9.50%. This decision took into account the objective
information presented in the 2007 economic forecast, the various risks that lie ahead and the likelihood
of achieving the future inflation targets of 6%±1% and 5%±1% for 2007 and 2008.
With Indonesia entering 2007, it is Bank Indonesia»s view that co-ordination and co-operation with other
agencies possessing the relevant powers, functions, expertise and policy instruments will do much to
resolve the various problems confronting our economy. In the monetary sector, policy will remain focused
on achievement of macroeconomic stability in support of sustainable economic growth. In the banking
system, Bank Indonesia will keep working to strengthen the banking intermediary function to ensure
effectiveness in availability of financing to meet business needs.
Jakarta, January 2007
The Governor of Bank IndonesiaThe Governor of Bank IndonesiaThe Governor of Bank IndonesiaThe Governor of Bank IndonesiaThe Governor of Bank Indonesia
Burhanuddin AbdullahBurhanuddin AbdullahBurhanuddin AbdullahBurhanuddin AbdullahBurhanuddin Abdullah

BANK INDONESIAFor further information, please contact:Economic Outlook & Policy DisseminationEconomic Outlook & Policy DisseminationEconomic Outlook & Policy DisseminationEconomic Outlook & Policy DisseminationEconomic Outlook & Policy DisseminationBureau of Monetary PolicyBureau of Monetary PolicyBureau of Monetary PolicyBureau of Monetary PolicyBureau of Monetary PolicyDirectorate of Economic Research and Monetary PolicyDirectorate of Economic Research and Monetary PolicyDirectorate of Economic Research and Monetary PolicyDirectorate of Economic Research and Monetary PolicyDirectorate of Economic Research and Monetary Policy
Telepon : +62 61 3818171+62 21 3818233
Fax. : +62 21 3452489E-mail : [email protected] : http://www.bi.go.id
Monetary Policy Report - Quarter III 2005Contents
MONETARY POLICY REPORTBANK INDONESIA
vii
Contents
1. Overview ..................................................................................... 1
2. Macroeconomic Performance ..................................................... 4
Economic Growth .......................................................................... 4
Balance of Payments ...................................................................... 9
Macroeconomic Policy ................................................................... 10
3. Monetary Indicators and Policy Q IV-2006 ................................ 13
Inflation ......................................................................................... 13
Rupiah Exchange Rate.................................................................... 15
Monetary Policy ............................................................................. 17
4. Economic Outlook for 2007 ........................................................ 22
Assumptions and Scenarios ............................................................ 22
Outlook for Economic Growth ....................................................... 25
Inflation Forecast ........................................................................... 29
Risks .............................................................................................. 30
5. Monetary Policy Response Q I-2007 .......................................... 31
Statistics .......................................................................................... 32

Overview
1
1. Overview
Overall, Indonesia»s economic performance in Q4/2006 showed steady improvementOverall, Indonesia»s economic performance in Q4/2006 showed steady improvementOverall, Indonesia»s economic performance in Q4/2006 showed steady improvementOverall, Indonesia»s economic performance in Q4/2006 showed steady improvementOverall, Indonesia»s economic performance in Q4/2006 showed steady improvement
accompanied by stable macroeconomic conditions.accompanied by stable macroeconomic conditions.accompanied by stable macroeconomic conditions.accompanied by stable macroeconomic conditions.accompanied by stable macroeconomic conditions. Economic growth during this
quarter is estimated to be the highest recorded in 2006. Positive trends were also
visible in a range of macro indicators, such as the balance of payments surplus,
appreciating exchange rate and falling inflation. These achievements were supported
by a generally stable financial sector as demonstrated in the performance of the
stock market, capital market and money market. On 4 January 2007, the Bank
Indonesia Board of Governors decided to lower the BI Rate by 25 bps to 9.5%. This
decision took into account the economic and monetary outlook, the various risks
that lie ahead and the likelihood of achieving the future inflation targets of 6%±1%
and 5%±1% for 2007 and 2008.
In Q4/2006, economic growth reached an estimated 6.5% (y-o-y), ahead of theIn Q4/2006, economic growth reached an estimated 6.5% (y-o-y), ahead of theIn Q4/2006, economic growth reached an estimated 6.5% (y-o-y), ahead of theIn Q4/2006, economic growth reached an estimated 6.5% (y-o-y), ahead of theIn Q4/2006, economic growth reached an estimated 6.5% (y-o-y), ahead of the
preceding three quarters.preceding three quarters.preceding three quarters.preceding three quarters.preceding three quarters. This brought economic growth for 2006 overall to about
5.5%. Key factors driving the growth were the sustained strong performance in
exports and rising consumption. Also contributing to growth was a rise in investment,
although only on a modest scale. Growth was recorded across almost all economic
sectors. Nevertheless, the most important contributions to growth came from the
trade, hotels and restaurants sector and the manufacturing sector.
Stronger export performance did much to bolster Indonesia»s balance of paymentsStronger export performance did much to bolster Indonesia»s balance of paymentsStronger export performance did much to bolster Indonesia»s balance of paymentsStronger export performance did much to bolster Indonesia»s balance of paymentsStronger export performance did much to bolster Indonesia»s balance of payments
surplus.surplus.surplus.surplus.surplus. In Q4/2006, Indonesia recorded a hefty balance of payments surplus, mainly
due to the surplus in the current account. Key to the current account surplus was
robust non-oil and gas export growth, with export performance buoyed by persistent
strong world demand and high international commodity prices. At the same time,
import growth was largely flat, due to continued weak domestic demand. The
capital and financial account, however, recorded a deficit, partly from capital outflows
with residents shifting more financial placements to offshore banks. At the same
time, portfolio investment flows remained strong, reflected in increased foreign
holdings of securities such as Bank Indonesia Certificates (SBIs) and stocks. With
the sizeable current account surplus, international reserves climbed to USD42.4
billion, equivalent to about 4.6 months of imports and payments of official debt.
At this level, reserves were well up from the previous year.
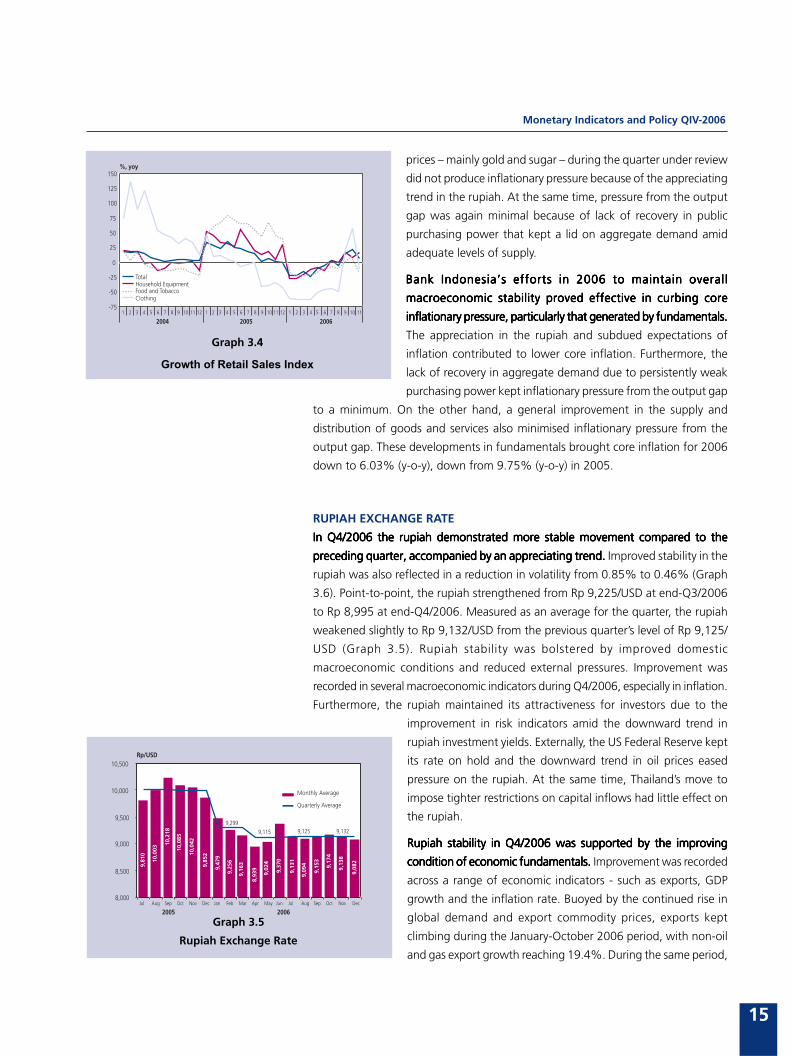
The improved balance of payments, steady yields on rupiah placements andThe improved balance of payments, steady yields on rupiah placements andThe improved balance of payments, steady yields on rupiah placements andThe improved balance of payments, steady yields on rupiah placements andThe improved balance of payments, steady yields on rupiah placements and
improvement in risks all contributed to greater stability in the rupiah during theimprovement in risks all contributed to greater stability in the rupiah during theimprovement in risks all contributed to greater stability in the rupiah during theimprovement in risks all contributed to greater stability in the rupiah during theimprovement in risks all contributed to greater stability in the rupiah during the
period under review.period under review.period under review.period under review.period under review. Point-to-point, the rupiah appreciated to Rp 8,995 in Q4/
2006, up from Rp 9,225 in the preceding quarter. This appreciation was also
accompanied by improved exchange rate stability, with volatility down at 0.46%
compared to 0.85% one quarter earlier.
With relative stability in the rupiah, inflation remained subdued to the end ofWith relative stability in the rupiah, inflation remained subdued to the end ofWith relative stability in the rupiah, inflation remained subdued to the end ofWith relative stability in the rupiah, inflation remained subdued to the end ofWith relative stability in the rupiah, inflation remained subdued to the end of
December 2006 while maintaining a declining trend. December 2006 while maintaining a declining trend. December 2006 while maintaining a declining trend. December 2006 while maintaining a declining trend. December 2006 while maintaining a declining trend. Measured annually, CPI inflation
Monetary Policy Report - Quarter IV 2006
2
at end-2006 reached 6.60% (y-o-y), down sharply from 17.11% (y-o-y) in 2005.
Inflation thus came in below the prescribed target of 8.0% ± 1%. Core inflation
and administered prices inflation were also down. Annualised core inflation eased
from the previous quarter to 6.03% (y-o-y), consistent with the subdued movement
in fundamentals.
Having achieved macro stability and kept inflation within the inflation targetingHaving achieved macro stability and kept inflation within the inflation targetingHaving achieved macro stability and kept inflation within the inflation targetingHaving achieved macro stability and kept inflation within the inflation targetingHaving achieved macro stability and kept inflation within the inflation targeting
range, Bank Indonesia launched a series of cuts in the BI Rate.range, Bank Indonesia launched a series of cuts in the BI Rate.range, Bank Indonesia launched a series of cuts in the BI Rate.range, Bank Indonesia launched a series of cuts in the BI Rate.range, Bank Indonesia launched a series of cuts in the BI Rate. During Q4/2006, the
BI Rate was lowered 3 times, representing a total rate cut of 150 bps to 9.75%.
The sustained reductions in the interest rate were welcomed by business and met
with positive response from market actors. Reflecting this were steadily rising share
prices with the stock index closing the year at 1,805, decline in long-term bond
yield and renewed growth in consumer confidence. Despite this, the reductions in
the BI Rate have only seen limited transmission to lending rates.
For the future, Bank Indonesia is optimistic that Indonesia will be able to achieveFor the future, Bank Indonesia is optimistic that Indonesia will be able to achieveFor the future, Bank Indonesia is optimistic that Indonesia will be able to achieveFor the future, Bank Indonesia is optimistic that Indonesia will be able to achieveFor the future, Bank Indonesia is optimistic that Indonesia will be able to achieve
higher economic growth in 2007 alongside sustained macroeconomic stability.higher economic growth in 2007 alongside sustained macroeconomic stability.higher economic growth in 2007 alongside sustained macroeconomic stability.higher economic growth in 2007 alongside sustained macroeconomic stability.higher economic growth in 2007 alongside sustained macroeconomic stability.
Growth in 2007 is predicted to reach 5.7%-6.3%, up from the 5.5% growth rate
estimated for 2006. During the first half of 2007, economic growth will be driven
mainly by consumption, while private investment is not expected to see significant
expansion. Economic growth is predicted to gather momentum in the second half
of the year, with significant expansion in private investment and hefty increases in
government capital expenditures. In fiscal management, prompt and properly
targeted government expenditures are expected to deliver an effective growth
stimulus. On the external front, the robust expansion in exports is predicted to
continue, despite a slowing trend as a result of less vigorous world economic growth
compared to 2006. At the same time, imports of goods and services are expected
to mount higher as domestic demand gathers momentum. These conditions are
expected to influence the balance of payments in 2007, which is again predicted to
record a surplus and thus support stability in the rupiah.
The renewed economic momentum is not expected to generate excessive upwardThe renewed economic momentum is not expected to generate excessive upwardThe renewed economic momentum is not expected to generate excessive upwardThe renewed economic momentum is not expected to generate excessive upwardThe renewed economic momentum is not expected to generate excessive upward
pressure on overall prices.pressure on overall prices.pressure on overall prices.pressure on overall prices.pressure on overall prices. CPI inflation in 2007 is predicted to come within the
government-set target range of 6+1%. Increased demand in line with rising
economic growth will still be adequately offset by supply side improvements, thus
alleviating pressure on core inflation. The CPI inflation forecast for 2007 is also
supported by low pressure in administered prices components in the absence of
government plans for increases in strategic administered prices. Added to this,
inflationary pressure from volatile foods is also expected to remain low, with the
government committed to ensure smooth distribution of foods and especially of
staple goods.
Nevertheless, Bank Indonesia is also aware of various external and internal risksNevertheless, Bank Indonesia is also aware of various external and internal risksNevertheless, Bank Indonesia is also aware of various external and internal risksNevertheless, Bank Indonesia is also aware of various external and internal risksNevertheless, Bank Indonesia is also aware of various external and internal risks
that could impact the economy in 2007.that could impact the economy in 2007.that could impact the economy in 2007.that could impact the economy in 2007.that could impact the economy in 2007. Externally, Bank Indonesia is constantly
vigilant against the likelihood of slow global economic growth and changes in
global investment preferences. Within Indonesia, structural issues such as delays in
Overview
3
implementing the investment climate, infrastructure and financial policy packages
are risks that call for close monitoring, in addition to other issues such as the
possibilities of disruptions to domestic distribution of goods and of a capital market
bubble. If these risks can be addressed properly, economic growth in 2007 may
climb beyond the forecasted level.
Having considered the objective information presented in the 2007 economicHaving considered the objective information presented in the 2007 economicHaving considered the objective information presented in the 2007 economicHaving considered the objective information presented in the 2007 economicHaving considered the objective information presented in the 2007 economic
forecast, Bank Indonesia sees the need for intensified efforts and closer co-ordinationforecast, Bank Indonesia sees the need for intensified efforts and closer co-ordinationforecast, Bank Indonesia sees the need for intensified efforts and closer co-ordinationforecast, Bank Indonesia sees the need for intensified efforts and closer co-ordinationforecast, Bank Indonesia sees the need for intensified efforts and closer co-ordination
from relevant agencies at the policymaking level and in policy implementation infrom relevant agencies at the policymaking level and in policy implementation infrom relevant agencies at the policymaking level and in policy implementation infrom relevant agencies at the policymaking level and in policy implementation infrom relevant agencies at the policymaking level and in policy implementation in
the field.the field.the field.the field.the field. Likewise, the active role of all economic participants will be crucial to
achieving higher levels of quality economic growth. In the monetary sector, policy
will remain focused on achievement of macroeconomic stability in support of
sustainable economic growth. In the banking system, Bank Indonesia will keep
working to strengthen the banking intermediary function to ensure effectiveness
in availability of financing to meet business needs.
4
Monetary Policy Report - Quarter IV 2006
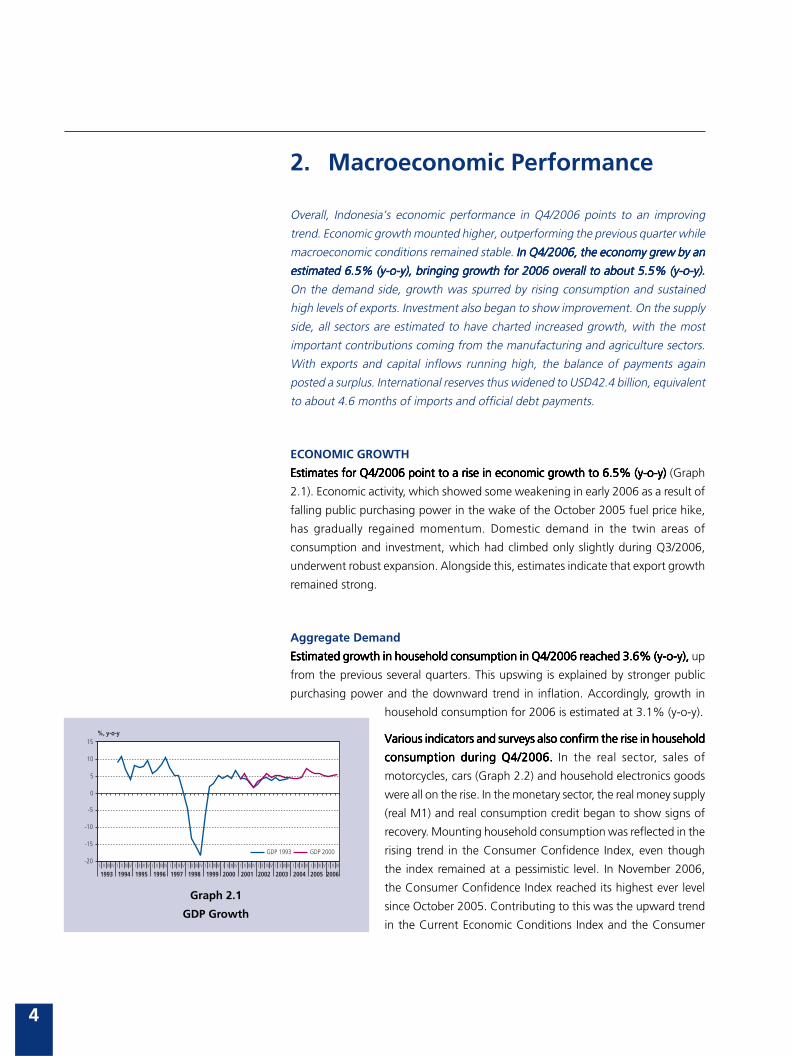
Graph 2.1
GDP Growth
2. Macroeconomic Performance
Overall, Indonesia»s economic performance in Q4/2006 points to an improving
trend. Economic growth mounted higher, outperforming the previous quarter while
macroeconomic conditions remained stable. In Q4/2006, the economy grew by anIn Q4/2006, the economy grew by anIn Q4/2006, the economy grew by anIn Q4/2006, the economy grew by anIn Q4/2006, the economy grew by an
estimated 6.5% (y-o-y), bringing growth for 2006 overall to about 5.5% (y-o-y).estimated 6.5% (y-o-y), bringing growth for 2006 overall to about 5.5% (y-o-y).estimated 6.5% (y-o-y), bringing growth for 2006 overall to about 5.5% (y-o-y).estimated 6.5% (y-o-y), bringing growth for 2006 overall to about 5.5% (y-o-y).estimated 6.5% (y-o-y), bringing growth for 2006 overall to about 5.5% (y-o-y).
On the demand side, growth was spurred by rising consumption and sustained
high levels of exports. Investment also began to show improvement. On the supply
side, all sectors are estimated to have charted increased growth, with the most
important contributions coming from the manufacturing and agriculture sectors.
With exports and capital inflows running high, the balance of payments again
posted a surplus. International reserves thus widened to USD42.4 billion, equivalent
to about 4.6 months of imports and official debt payments.
ECONOMIC GROWTH
Estimates for Q4/2006 point to a rise in economic growth to 6.5% (y-o-y)Estimates for Q4/2006 point to a rise in economic growth to 6.5% (y-o-y)Estimates for Q4/2006 point to a rise in economic growth to 6.5% (y-o-y)Estimates for Q4/2006 point to a rise in economic growth to 6.5% (y-o-y)Estimates for Q4/2006 point to a rise in economic growth to 6.5% (y-o-y) (Graph
2.1). Economic activity, which showed some weakening in early 2006 as a result of
falling public purchasing power in the wake of the October 2005 fuel price hike,
has gradually regained momentum. Domestic demand in the twin areas of
consumption and investment, which had climbed only slightly during Q3/2006,
underwent robust expansion. Alongside this, estimates indicate that export growth
remained strong.
Aggregate Demand
Estimated growth in household consumption in Q4/2006 reached 3.6% (y-o-y),Estimated growth in household consumption in Q4/2006 reached 3.6% (y-o-y),Estimated growth in household consumption in Q4/2006 reached 3.6% (y-o-y),Estimated growth in household consumption in Q4/2006 reached 3.6% (y-o-y),Estimated growth in household consumption in Q4/2006 reached 3.6% (y-o-y), up
from the previous several quarters. This upswing is explained by stronger public
purchasing power and the downward trend in inflation. Accordingly, growth in
household consumption for 2006 is estimated at 3.1% (y-o-y).
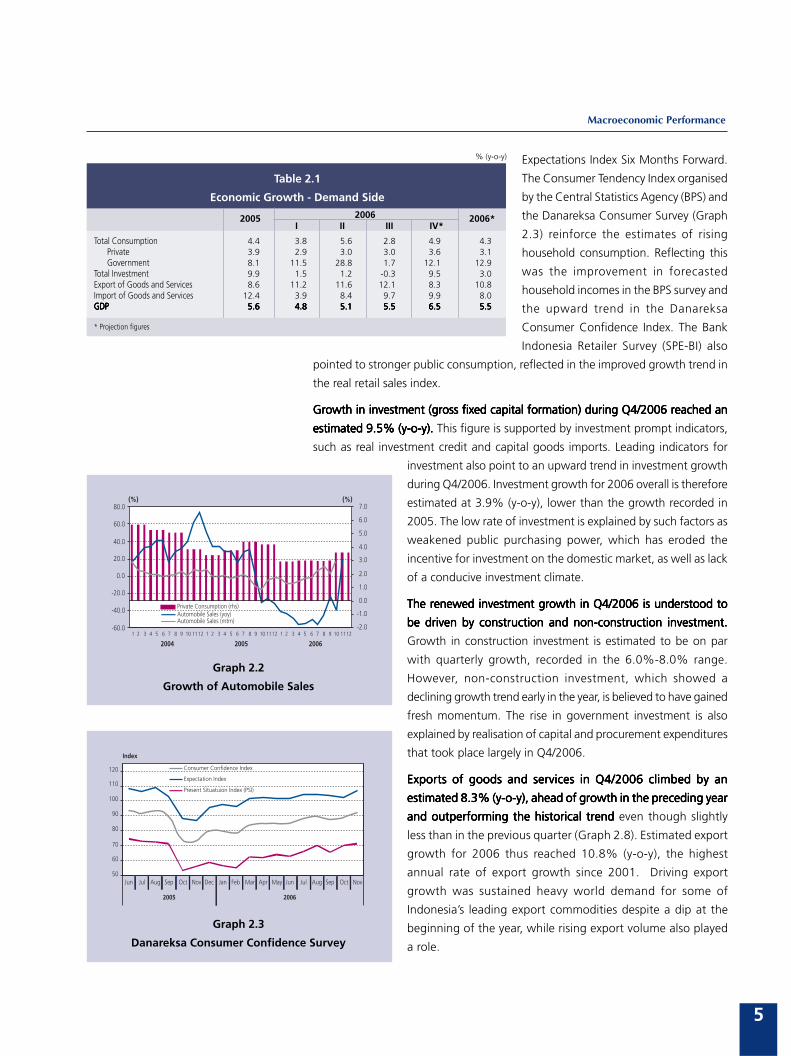
Various indicators and surveys also confirm the rise in householdVarious indicators and surveys also confirm the rise in householdVarious indicators and surveys also confirm the rise in householdVarious indicators and surveys also confirm the rise in householdVarious indicators and surveys also confirm the rise in household
consumption during Q4/2006.consumption during Q4/2006.consumption during Q4/2006.consumption during Q4/2006.consumption during Q4/2006. In the real sector, sales of
motorcycles, cars (Graph 2.2) and household electronics goods
were all on the rise. In the monetary sector, the real money supply
(real M1) and real consumption credit began to show signs of
recovery. Mounting household consumption was reflected in the
rising trend in the Consumer Confidence Index, even though
the index remained at a pessimistic level. In November 2006,
the Consumer Confidence Index reached its highest ever level
since October 2005. Contributing to this was the upward trend
in the Current Economic Conditions Index and the Consumer
-20
-15
-10
-5
0
5
10
15
1993 1994 1995 1996 1997 1998 1999 2000 2001 2002 2003 2004 2005 2006
%, y-o-y
GDP 1993 GDP 2000
I II III IV I II III IV I II III IV I II III IV I II III IV I II III IV I II III IV I II III IV I II III IV I II III IV I II III IV I II III IV I II III IV I II III
5
Macroeconomic Performance
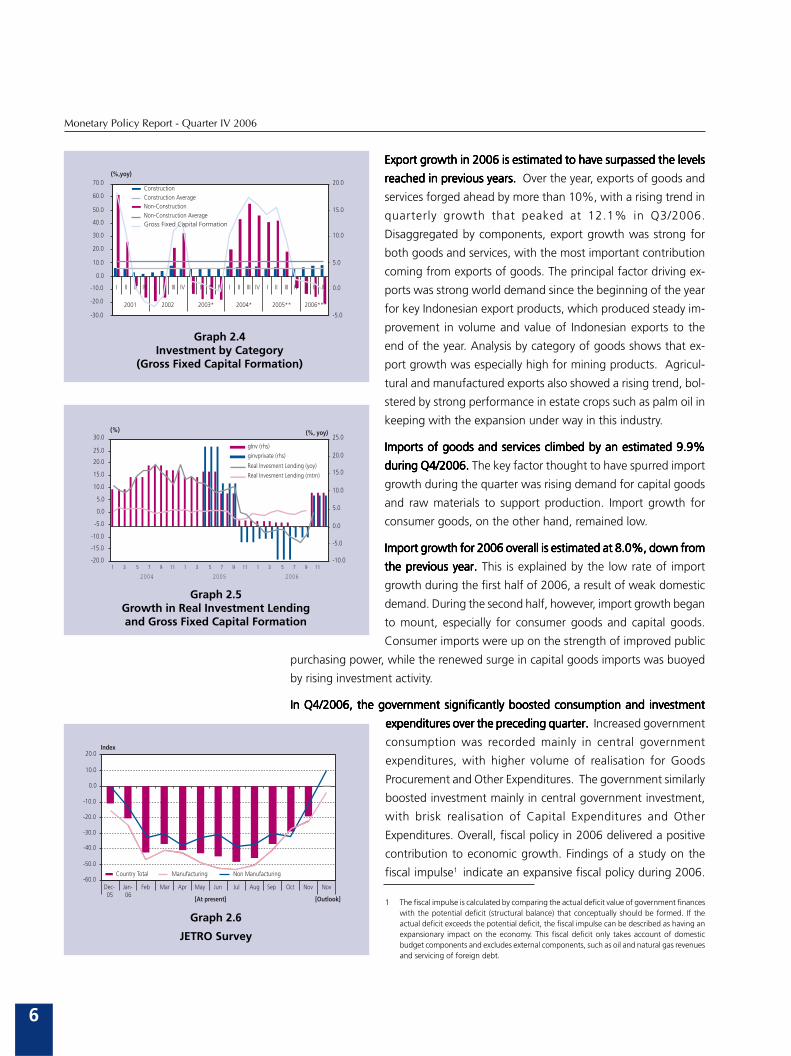
Expectations Index Six Months Forward.
The Consumer Tendency Index organised
by the Central Statistics Agency (BPS) and
the Danareksa Consumer Survey (Graph
2.3) reinforce the estimates of rising
household consumption. Reflecting this
was the improvement in forecasted
household incomes in the BPS survey and
the upward trend in the Danareksa
Consumer Confidence Index. The Bank
Indonesia Retailer Survey (SPE-BI) also
pointed to stronger public consumption, reflected in the improved growth trend in
the real retail sales index.
Growth in investment (gross fixed capital formation) during Q4/2006 reached anGrowth in investment (gross fixed capital formation) during Q4/2006 reached anGrowth in investment (gross fixed capital formation) during Q4/2006 reached anGrowth in investment (gross fixed capital formation) during Q4/2006 reached anGrowth in investment (gross fixed capital formation) during Q4/2006 reached an
estimated 9.5% (y-o-y).estimated 9.5% (y-o-y).estimated 9.5% (y-o-y).estimated 9.5% (y-o-y).estimated 9.5% (y-o-y). This figure is supported by investment prompt indicators,
such as real investment credit and capital goods imports. Leading indicators for
investment also point to an upward trend in investment growth
during Q4/2006. Investment growth for 2006 overall is therefore
estimated at 3.9% (y-o-y), lower than the growth recorded in
2005. The low rate of investment is explained by such factors as
weakened public purchasing power, which has eroded the
incentive for investment on the domestic market, as well as lack
of a conducive investment climate.
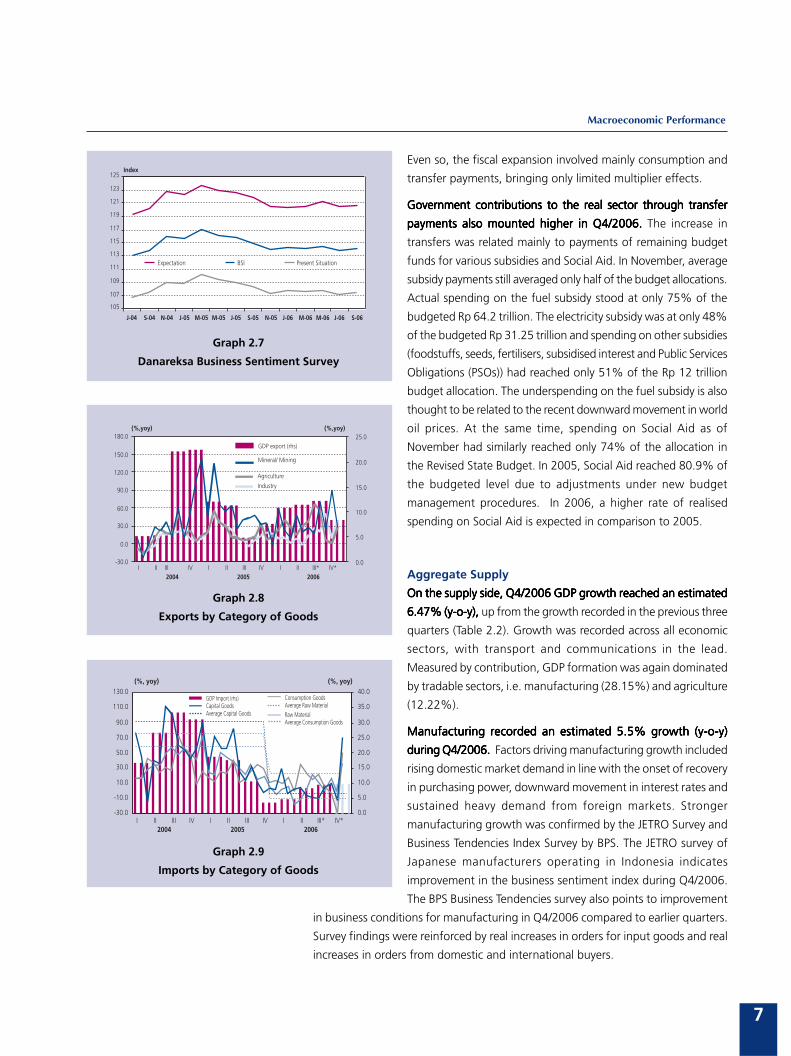
The renewed investment growth in Q4/2006 is understood toThe renewed investment growth in Q4/2006 is understood toThe renewed investment growth in Q4/2006 is understood toThe renewed investment growth in Q4/2006 is understood toThe renewed investment growth in Q4/2006 is understood to
be driven by construction and non-construction investment.be driven by construction and non-construction investment.be driven by construction and non-construction investment.be driven by construction and non-construction investment.be driven by construction and non-construction investment.
Growth in construction investment is estimated to be on par
with quarterly growth, recorded in the 6.0%-8.0% range.
However, non-construction investment, which showed a
declining growth trend early in the year, is believed to have gained
fresh momentum. The rise in government investment is also
explained by realisation of capital and procurement expenditures
that took place largely in Q4/2006.
Exports of goods and services in Q4/2006 climbed by anExports of goods and services in Q4/2006 climbed by anExports of goods and services in Q4/2006 climbed by anExports of goods and services in Q4/2006 climbed by anExports of goods and services in Q4/2006 climbed by an
estimated 8.3% (y-o-y), ahead of growth in the preceding yearestimated 8.3% (y-o-y), ahead of growth in the preceding yearestimated 8.3% (y-o-y), ahead of growth in the preceding yearestimated 8.3% (y-o-y), ahead of growth in the preceding yearestimated 8.3% (y-o-y), ahead of growth in the preceding year
and outperforming the historical trendand outperforming the historical trendand outperforming the historical trendand outperforming the historical trendand outperforming the historical trend even though slightly
less than in the previous quarter (Graph 2.8). Estimated export
growth for 2006 thus reached 10.8% (y-o-y), the highest
annual rate of export growth since 2001. Driving export
growth was sustained heavy world demand for some of
Indonesia»s leading export commodities despite a dip at the
beginning of the year, while rising export volume also played
a role.
Graph 2.2
Growth of Automobile Sales
Graph 2.3
Danareksa Consumer Confidence Survey
2005 2006*
% (y-o-y)
Table 2.1
Economic Growth - Demand Side
2006 I II III IV*
Total Consumption 4.4 3.8 5.6 2.8 4.9 4.3Private 3.9 2.9 3.0 3.0 3.6 3.1Government 8.1 11.5 28.8 1.7 12.1 12.9
Total Investment 9.9 1.5 1.2 -0.3 9.5 3.0Export of Goods and Services 8.6 11.2 11.6 12.1 8.3 10.8Import of Goods and Services 12.4 3.9 8.4 9.7 9.9 8.0GDPGDPGDPGDPGDP 5.65.65.65.65.6 4.84.84.84.84.8 5.15.15.15.15.1 5.55.55.55.55.5 6.56.56.56.56.5 5.55.55.55.55.5
* Projection figures
-60.0
-40.0
-20.0
0.0
20.0
40.0
60.0
80.0
1 2 3 4 5 6 7 8 9 10 1112 1 2 3 4 5 6 7 8 9 10 1112 1 2 3 4 5 6 7 8 9 10 1112
2004 2005 2006
-2.0
-1.0
0.0
1.0
2.0
3.0
4.0
5.0
6.0
7.0
Private Consumption (rhs)Automobile Sales (yoy)Automobile Sales (mtm)
(%) (%)
50
60
70
80
90
100
110
120
Jun Jul Aug Sep Oct Nov Dec Jan Feb Mar Apr May Jun Jul Aug Sep Oct Nov
2005 2006
Index
Present Situatuion Index (PSI)
Consumer Confidence Index
Expectation Index
6
Monetary Policy Report - Quarter IV 2006
Export growth in 2006 is estimated to have surpassed the levelsExport growth in 2006 is estimated to have surpassed the levelsExport growth in 2006 is estimated to have surpassed the levelsExport growth in 2006 is estimated to have surpassed the levelsExport growth in 2006 is estimated to have surpassed the levels
reached in previous years. reached in previous years. reached in previous years. reached in previous years. reached in previous years. Over the year, exports of goods and
services forged ahead by more than 10%, with a rising trend in
quarterly growth that peaked at 12.1% in Q3/2006.
Disaggregated by components, export growth was strong for
both goods and services, with the most important contribution
coming from exports of goods. The principal factor driving ex-
ports was strong world demand since the beginning of the year
for key Indonesian export products, which produced steady im-
provement in volume and value of Indonesian exports to the
end of the year. Analysis by category of goods shows that ex-
port growth was especially high for mining products. Agricul-
tural and manufactured exports also showed a rising trend, bol-
stered by strong performance in estate crops such as palm oil in
keeping with the expansion under way in this industry.
Imports of goods and services climbed by an estimated 9.9%Imports of goods and services climbed by an estimated 9.9%Imports of goods and services climbed by an estimated 9.9%Imports of goods and services climbed by an estimated 9.9%Imports of goods and services climbed by an estimated 9.9%
during Q4/2006.during Q4/2006.during Q4/2006.during Q4/2006.during Q4/2006. The key factor thought to have spurred import
growth during the quarter was rising demand for capital goods
and raw materials to support production. Import growth for
consumer goods, on the other hand, remained low.
Import growth for 2006 overall is estimated at 8.0%, down fromImport growth for 2006 overall is estimated at 8.0%, down fromImport growth for 2006 overall is estimated at 8.0%, down fromImport growth for 2006 overall is estimated at 8.0%, down fromImport growth for 2006 overall is estimated at 8.0%, down from
the previous year. the previous year. the previous year. the previous year. the previous year. This is explained by the low rate of import
growth during the first half of 2006, a result of weak domestic
demand. During the second half, however, import growth began
to mount, especially for consumer goods and capital goods.
Consumer imports were up on the strength of improved public
purchasing power, while the renewed surge in capital goods imports was buoyed
by rising investment activity.
In Q4/2006, the government significantly boosted consumption and investmentIn Q4/2006, the government significantly boosted consumption and investmentIn Q4/2006, the government significantly boosted consumption and investmentIn Q4/2006, the government significantly boosted consumption and investmentIn Q4/2006, the government significantly boosted consumption and investment
expenditures over the preceding quarter. expenditures over the preceding quarter. expenditures over the preceding quarter. expenditures over the preceding quarter. expenditures over the preceding quarter. Increased government
consumption was recorded mainly in central government
expenditures, with higher volume of realisation for Goods
Procurement and Other Expenditures. The government similarly
boosted investment mainly in central government investment,
with brisk realisation of Capital Expenditures and Other
Expenditures. Overall, fiscal policy in 2006 delivered a positive
contribution to economic growth. Findings of a study on the
fiscal impulse1 indicate an expansive fiscal policy during 2006.
Graph 2.4Investment by Category
(Gross Fixed Capital Formation)
Graph 2.5Growth in Real Investment Lendingand Gross Fixed Capital Formation
Graph 2.6
JETRO Survey
1 The fiscal impulse is calculated by comparing the actual deficit value of government financeswith the potential deficit (structural balance) that conceptually should be formed. If theactual deficit exceeds the potential deficit, the fiscal impulse can be described as having anexpansionary impact on the economy. This fiscal deficit only takes account of domesticbudget components and excludes external components, such as oil and natural gas revenuesand servicing of foreign debt.
-30.0
-20.0
-10.0
0.0
10.0
20.0
30.0
40.0
50.0
60.0
70.0
I II III IV I II III IV I II III IV I II III IV I II III IV I II III
2001 2002 2003* 2004* 2005** 2006***
-5.0
0.0
5.0
10.0
15.0
20.0(%,yoy)
Construction
Non-ConstructionConstruction Average
Non-Construction AverageGross Fixed Capital Formation
-20.0
-15.0
-10.0
-5.0
0.0
5.0
10.0
15.0
20.0
25.0
30.0
1 3 5 7 9 11 1 3 5 7 9 11 1 3 5 7 9 11
2004 2005 2006
-10.0
-5.0
0.0
5.0
10.0
15.0
20.0
25.0gInv (rhs)ginvprivate (rhs)
Real Invesment Lending (yoy)
Real Invesment Lending (mtm)
(%) (%, yoy)
-60.0
-50.0
-40.0
-30.0
-20.0
-10.0
0.0
10.0
20.0
Dec-05
Jan-06
Feb Mar Apr May Jun Jul Aug Sep Oct Nov Nov
[At present] [Outlook]
Country Total Manufacturing Non Manufacturing
Index
7
Macroeconomic Performance
Even so, the fiscal expansion involved mainly consumption and
transfer payments, bringing only limited multiplier effects.
Government contributions to the real sector through transferGovernment contributions to the real sector through transferGovernment contributions to the real sector through transferGovernment contributions to the real sector through transferGovernment contributions to the real sector through transfer
payments also mounted higher in Q4/2006.payments also mounted higher in Q4/2006.payments also mounted higher in Q4/2006.payments also mounted higher in Q4/2006.payments also mounted higher in Q4/2006. The increase in
transfers was related mainly to payments of remaining budget
funds for various subsidies and Social Aid. In November, average
subsidy payments still averaged only half of the budget allocations.
Actual spending on the fuel subsidy stood at only 75% of the
budgeted Rp 64.2 trillion. The electricity subsidy was at only 48%
of the budgeted Rp 31.25 trillion and spending on other subsidies
(foodstuffs, seeds, fertilisers, subsidised interest and Public Services
Obligations (PSOs)) had reached only 51% of the Rp 12 trillion
budget allocation. The underspending on the fuel subsidy is also
thought to be related to the recent downward movement in world
oil prices. At the same time, spending on Social Aid as of
November had similarly reached only 74% of the allocation in
the Revised State Budget. In 2005, Social Aid reached 80.9% of
the budgeted level due to adjustments under new budget
management procedures. In 2006, a higher rate of realised
spending on Social Aid is expected in comparison to 2005.
Aggregate Supply
On the supply side, Q4/2006 GDP growth reached an estimatedOn the supply side, Q4/2006 GDP growth reached an estimatedOn the supply side, Q4/2006 GDP growth reached an estimatedOn the supply side, Q4/2006 GDP growth reached an estimatedOn the supply side, Q4/2006 GDP growth reached an estimated
6.47% (y-o-y),6.47% (y-o-y),6.47% (y-o-y),6.47% (y-o-y),6.47% (y-o-y), up from the growth recorded in the previous three
quarters (Table 2.2). Growth was recorded across all economic
sectors, with transport and communications in the lead.
Measured by contribution, GDP formation was again dominated
by tradable sectors, i.e. manufacturing (28.15%) and agriculture
(12.22%).
Manufacturing recorded an estimated 5.5% growth (y-o-y)Manufacturing recorded an estimated 5.5% growth (y-o-y)Manufacturing recorded an estimated 5.5% growth (y-o-y)Manufacturing recorded an estimated 5.5% growth (y-o-y)Manufacturing recorded an estimated 5.5% growth (y-o-y)
during Q4/2006. during Q4/2006. during Q4/2006. during Q4/2006. during Q4/2006. Factors driving manufacturing growth included
rising domestic market demand in line with the onset of recovery
in purchasing power, downward movement in interest rates and
sustained heavy demand from foreign markets. Stronger
manufacturing growth was confirmed by the JETRO Survey and
Business Tendencies Index Survey by BPS. The JETRO survey of
Japanese manufacturers operating in Indonesia indicates
improvement in the business sentiment index during Q4/2006.
The BPS Business Tendencies survey also points to improvement
in business conditions for manufacturing in Q4/2006 compared to earlier quarters.
Survey findings were reinforced by real increases in orders for input goods and real
increases in orders from domestic and international buyers.
Graph 2.7
Danareksa Business Sentiment Survey
Graph 2.8
Exports by Category of Goods
Graph 2.9
Imports by Category of Goods
105
107
109
111
113
115
117
119
121
123
125
J-04 S-04 N-04 J-05 M-05 M-05 J-05 S-05 N-05 J-06 M-06 M-06 J-06 S-06
Expectation BSI Present Situation
Index
-30.0
0.0
30.0
60.0
90.0
120.0
150.0
180.0
I II III IV I II III IV I II III* IV*2004 2005 2006
0.0
5.0
10.0
15.0
20.0
25.0(%,yoy)
GDP export (rhs)
Agriculture
Mineral/ Mining
Industry
(%,yoy)
-30.0
-10.0
10.0
30.0
50.0
70.0
90.0
110.0
130.0
I II III IV I II III IV I II III* IV*2004 2005 2006
0.0
5.0
10.0
15.0
20.0
25.0
30.0
35.0
40.0(%, yoy)
GDP Import (rhs)Capital GoodsAverage Capital Goods
Consumption GoodsAverage Raw MaterialRaw MaterialAverage Consumption Goods
(%, yoy)
8
Monetary Policy Report - Quarter IV 2006
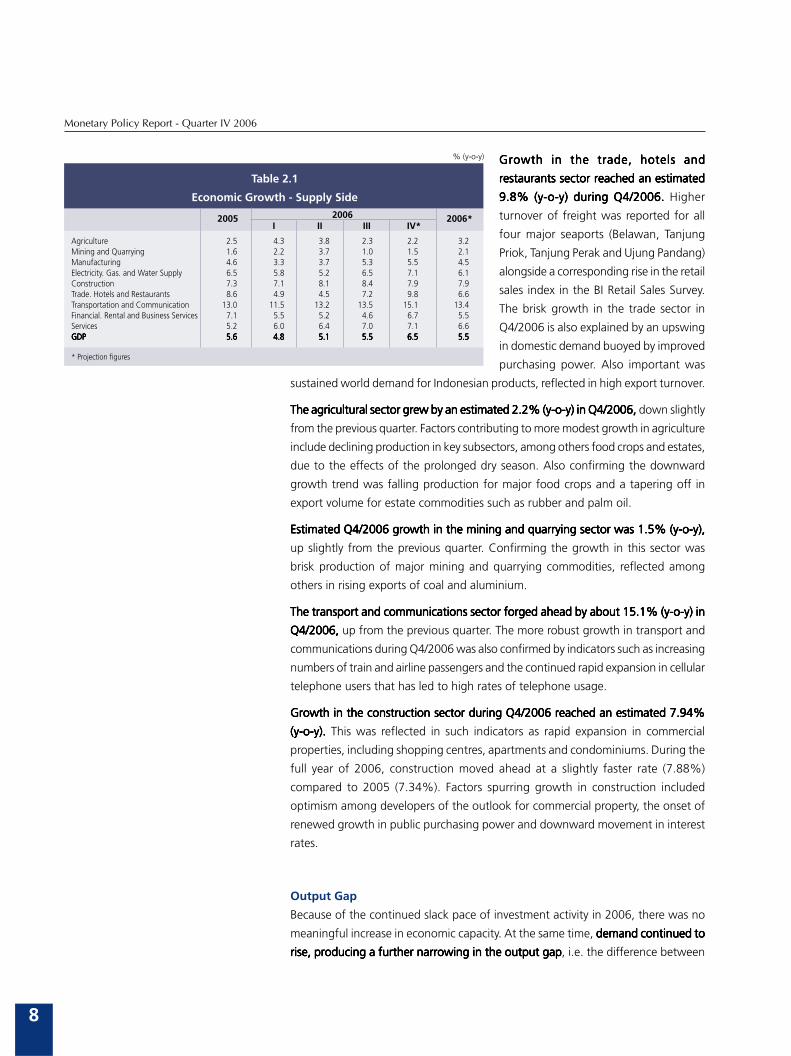
Growth in the trade, hotels andGrowth in the trade, hotels andGrowth in the trade, hotels andGrowth in the trade, hotels andGrowth in the trade, hotels and
restaurants sector reached an estimatedrestaurants sector reached an estimatedrestaurants sector reached an estimatedrestaurants sector reached an estimatedrestaurants sector reached an estimated
9.8% (y-o-y) during Q4/2006.9.8% (y-o-y) during Q4/2006.9.8% (y-o-y) during Q4/2006.9.8% (y-o-y) during Q4/2006.9.8% (y-o-y) during Q4/2006. Higher
turnover of freight was reported for all
four major seaports (Belawan, Tanjung
Priok, Tanjung Perak and Ujung Pandang)
alongside a corresponding rise in the retail
sales index in the BI Retail Sales Survey.
The brisk growth in the trade sector in
Q4/2006 is also explained by an upswing
in domestic demand buoyed by improved
purchasing power. Also important was
sustained world demand for Indonesian products, reflected in high export turnover.
The agricultural sector grew by an estimated 2.2% (y-o-y) in Q4/2006,The agricultural sector grew by an estimated 2.2% (y-o-y) in Q4/2006,The agricultural sector grew by an estimated 2.2% (y-o-y) in Q4/2006,The agricultural sector grew by an estimated 2.2% (y-o-y) in Q4/2006,The agricultural sector grew by an estimated 2.2% (y-o-y) in Q4/2006, down slightly
from the previous quarter. Factors contributing to more modest growth in agriculture
include declining production in key subsectors, among others food crops and estates,
due to the effects of the prolonged dry season. Also confirming the downward
growth trend was falling production for major food crops and a tapering off in
export volume for estate commodities such as rubber and palm oil.
Estimated Q4/2006 growth in the mining and quarrying sector was 1.5% (y-o-y),Estimated Q4/2006 growth in the mining and quarrying sector was 1.5% (y-o-y),Estimated Q4/2006 growth in the mining and quarrying sector was 1.5% (y-o-y),Estimated Q4/2006 growth in the mining and quarrying sector was 1.5% (y-o-y),Estimated Q4/2006 growth in the mining and quarrying sector was 1.5% (y-o-y),
up slightly from the previous quarter. Confirming the growth in this sector was
brisk production of major mining and quarrying commodities, reflected among
others in rising exports of coal and aluminium.
The transport and communications sector forged ahead by about 15.1% (y-o-y) inThe transport and communications sector forged ahead by about 15.1% (y-o-y) inThe transport and communications sector forged ahead by about 15.1% (y-o-y) inThe transport and communications sector forged ahead by about 15.1% (y-o-y) inThe transport and communications sector forged ahead by about 15.1% (y-o-y) in
Q4/2006,Q4/2006,Q4/2006,Q4/2006,Q4/2006, up from the previous quarter. The more robust growth in transport and
communications during Q4/2006 was also confirmed by indicators such as increasing
numbers of train and airline passengers and the continued rapid expansion in cellular
telephone users that has led to high rates of telephone usage.
Growth in the construction sector during Q4/2006 reached an estimated 7.94%Growth in the construction sector during Q4/2006 reached an estimated 7.94%Growth in the construction sector during Q4/2006 reached an estimated 7.94%Growth in the construction sector during Q4/2006 reached an estimated 7.94%Growth in the construction sector during Q4/2006 reached an estimated 7.94%
(y-o-y).(y-o-y).(y-o-y).(y-o-y).(y-o-y). This was reflected in such indicators as rapid expansion in commercial
properties, including shopping centres, apartments and condominiums. During the
full year of 2006, construction moved ahead at a slightly faster rate (7.88%)
compared to 2005 (7.34%). Factors spurring growth in construction included
optimism among developers of the outlook for commercial property, the onset of
renewed growth in public purchasing power and downward movement in interest
rates.
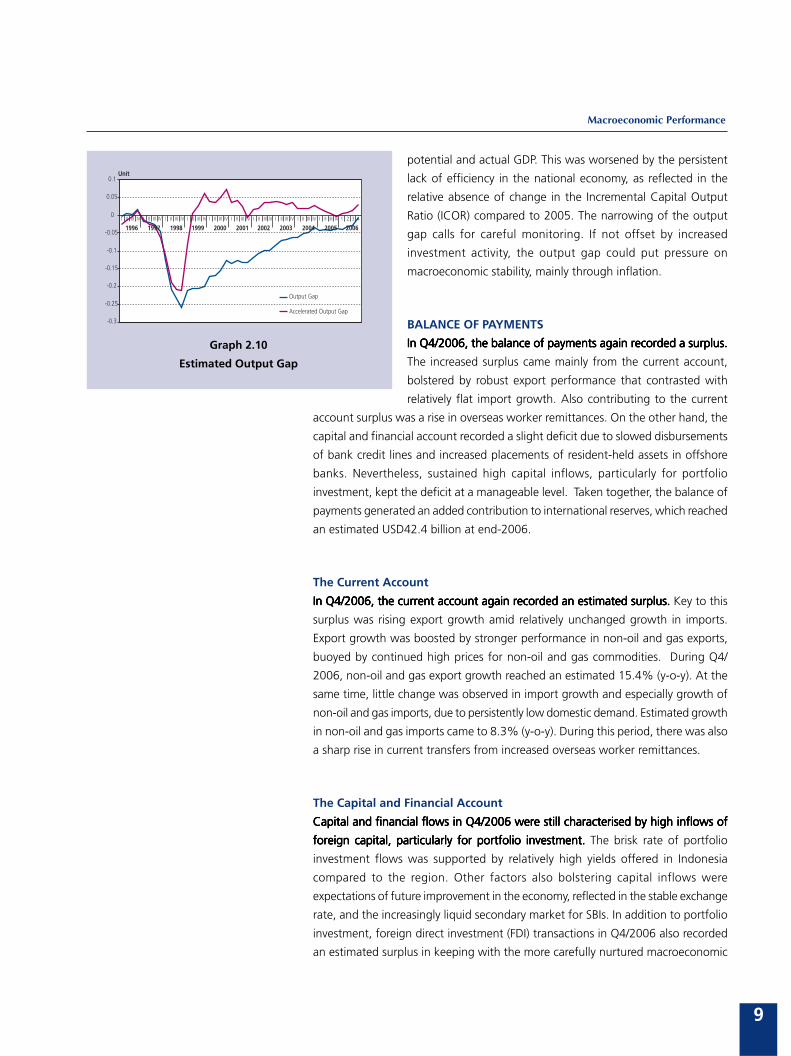
Output Gap
Because of the continued slack pace of investment activity in 2006, there was no
meaningful increase in economic capacity. At the same time, demand continued todemand continued todemand continued todemand continued todemand continued to
rise, producing a further narrowing in the output gaprise, producing a further narrowing in the output gaprise, producing a further narrowing in the output gaprise, producing a further narrowing in the output gaprise, producing a further narrowing in the output gap, i.e. the difference between
2005 2006*
% (y-o-y)
Table 2.1
Economic Growth - Supply Side
2006 I II III IV*
Agriculture 2.5 4.3 3.8 2.3 2.2 3.2Mining and Quarrying 1.6 2.2 3.7 1.0 1.5 2.1Manufacturing 4.6 3.3 3.7 5.3 5.5 4.5Electricity. Gas. and Water Supply 6.5 5.8 5.2 6.5 7.1 6.1Construction 7.3 7.1 8.1 8.4 7.9 7.9Trade. Hotels and Restaurants 8.6 4.9 4.5 7.2 9.8 6.6Transportation and Communication 13.0 11.5 13.2 13.5 15.1 13.4Financial. Rental and Business Services 7.1 5.5 5.2 4.6 6.7 5.5Services 5.2 6.0 6.4 7.0 7.1 6.6GDPGDPGDPGDPGDP 5.65.65.65.65.6 4.84.84.84.84.8 5.15.15.15.15.1 5.55.55.55.55.5 6.56.56.56.56.5 5.55.55.55.55.5
* Projection figures
9
Macroeconomic Performance
potential and actual GDP. This was worsened by the persistent
lack of efficiency in the national economy, as reflected in the
relative absence of change in the Incremental Capital Output
Ratio (ICOR) compared to 2005. The narrowing of the output
gap calls for careful monitoring. If not offset by increased
investment activity, the output gap could put pressure on
macroeconomic stability, mainly through inflation.
BALANCE OF PAYMENTS
In Q4/2006, the balance of payments again recorded a surplus.In Q4/2006, the balance of payments again recorded a surplus.In Q4/2006, the balance of payments again recorded a surplus.In Q4/2006, the balance of payments again recorded a surplus.In Q4/2006, the balance of payments again recorded a surplus.
The increased surplus came mainly from the current account,
bolstered by robust export performance that contrasted with
relatively flat import growth. Also contributing to the current
account surplus was a rise in overseas worker remittances. On the other hand, the
capital and financial account recorded a slight deficit due to slowed disbursements
of bank credit lines and increased placements of resident-held assets in offshore
banks. Nevertheless, sustained high capital inflows, particularly for portfolio
investment, kept the deficit at a manageable level. Taken together, the balance of
payments generated an added contribution to international reserves, which reached
an estimated USD42.4 billion at end-2006.
The Current Account
In Q4/2006, the current account again recorded an estimated surplus.In Q4/2006, the current account again recorded an estimated surplus.In Q4/2006, the current account again recorded an estimated surplus.In Q4/2006, the current account again recorded an estimated surplus.In Q4/2006, the current account again recorded an estimated surplus. Key to this
surplus was rising export growth amid relatively unchanged growth in imports.
Export growth was boosted by stronger performance in non-oil and gas exports,
buoyed by continued high prices for non-oil and gas commodities. During Q4/
2006, non-oil and gas export growth reached an estimated 15.4% (y-o-y). At the
same time, little change was observed in import growth and especially growth of
non-oil and gas imports, due to persistently low domestic demand. Estimated growth
in non-oil and gas imports came to 8.3% (y-o-y). During this period, there was also
a sharp rise in current transfers from increased overseas worker remittances.
The Capital and Financial Account
Capital and financial flows in Q4/2006 were still characterised by high inflows ofCapital and financial flows in Q4/2006 were still characterised by high inflows ofCapital and financial flows in Q4/2006 were still characterised by high inflows ofCapital and financial flows in Q4/2006 were still characterised by high inflows ofCapital and financial flows in Q4/2006 were still characterised by high inflows of
foreign capital, particularly for portfolio investment. foreign capital, particularly for portfolio investment. foreign capital, particularly for portfolio investment. foreign capital, particularly for portfolio investment. foreign capital, particularly for portfolio investment. The brisk rate of portfolio
investment flows was supported by relatively high yields offered in Indonesia
compared to the region. Other factors also bolstering capital inflows were
expectations of future improvement in the economy, reflected in the stable exchange
rate, and the increasingly liquid secondary market for SBIs. In addition to portfolio
investment, foreign direct investment (FDI) transactions in Q4/2006 also recorded
an estimated surplus in keeping with the more carefully nurtured macroeconomic
Graph 2.10
Estimated Output Gap
I II III IV I II III IV I II III IV I II III IV I II III IV I II III IV I II III IV I II III IV I II III IV I II III IV 1 2 3 4
19971996 1998 1999 2000 2001 2002 2003 2004 2005 2006
-0.3
-0.25
-0.2
-0.15
-0.1
-0.05
0
0.05
0.1
Output Gap
Accelerated Output Gap
Unit
10
Monetary Policy Report - Quarter IV 2006
stability. The other investment account, however, recorded an estimated deficit.
This deficit is explained largely by increased offshore asset placements by residents,
with much of these funds held savings deposits and call money. In addition, residents
also held overseas asset placements in trade credit, a development consistent with
the ongoing rise in exports.
International Reserves
In response to these various developments, the balance of payments in Q4/2006
recorded an estimated surplus. The balance of payments surplus thus boosted
international reserves to USD42.4 billion at end-2006, equivalent to about 4.6
months of imports and official debt payments. International reserves were therefore
up 22.1% from the end-2005 position recorded at USD34.7 billion. The more robust
international reserves will also make a positive contribution to future macroeconomic
stability.
MACROECONOMIC POLICY
During Q4/2006, the government introduced few significant policy changes inDuring Q4/2006, the government introduced few significant policy changes inDuring Q4/2006, the government introduced few significant policy changes inDuring Q4/2006, the government introduced few significant policy changes inDuring Q4/2006, the government introduced few significant policy changes in
comparison to policies issued in previous quarters.comparison to policies issued in previous quarters.comparison to policies issued in previous quarters.comparison to policies issued in previous quarters.comparison to policies issued in previous quarters. Concerning improvements to
the investment climate, only 35 of the planned 49 action items were completed as
of November 2006. These items covered the following areas: general reforms (14
items), taxation (4 items), customs (7 items), labour (6 items) and MSMEs (4 items).
In the area of infrastructure policy, as of October 2006 the government had
completed 55 out of a total of 120 action items.
Progress was slow in the area of structural policies and actions, especially forProgress was slow in the area of structural policies and actions, especially forProgress was slow in the area of structural policies and actions, especially forProgress was slow in the area of structural policies and actions, especially forProgress was slow in the area of structural policies and actions, especially for
improvement of the investment climate and infrastructure.improvement of the investment climate and infrastructure.improvement of the investment climate and infrastructure.improvement of the investment climate and infrastructure.improvement of the investment climate and infrastructure. The principal reasons
for slow progress on action on the investment climate include poor co-ordination
and the legislative process at Parliament that has delayed the completion of legislative
products crucial to progress on other action items, such as the Investment Law and
Taxation Law. Work is also stalled on the Labour Law. Concerning infrastructure,
progress has been held up by lack of co-ordination and uncertainties over risk
sharing and returns on projects to be financed.
With only limited progress in completion of action items, the reforms so farWith only limited progress in completion of action items, the reforms so farWith only limited progress in completion of action items, the reforms so farWith only limited progress in completion of action items, the reforms so farWith only limited progress in completion of action items, the reforms so far
have had little impact on structural policies.have had little impact on structural policies.have had little impact on structural policies.have had little impact on structural policies.have had little impact on structural policies. Some members of the business
community believe that the policy packages have still had only minimal impact.
Problems cited by business include: public inadequately informed of the actions
taken by the government; policies not fully implemented by officials in the
field, giving rise to impressions of inconsistency; rampant practices that drive
up costs for business, especially at ports; and the excessively slow pace of
government actions. On its part, the government recognises that one of the
difficulties responsible for slow action in completion of action items and
application of policies for improvement of the investment climate is problems
11
Macroeconomic Performance
with co-ordination. At the regional level √ according to survey findings and
sampling of a number of regency level administrations √ the investment climate
in any particular region is determined to a great extent by the head of the
regional government. Areas in which local government leaders have a pro-
business vision tend to have a better investment climate and succeed in
attracting more investors.
On a sectoral level, the policies pursued by the government have sought mainly to
remove hurdles to boosting efficiency and productivity. In the industry and tradeIn the industry and tradeIn the industry and tradeIn the industry and tradeIn the industry and trade
sectorsectorsectorsectorsector, new policies/incentives issued by the government include process of VAT
refunds within 1 month; tariff harmonisation to reduce trading scheme distortions;
removal of multipurpose electricity billing rates; the Customs Law; delegation of
power from the Minister of Law and Human Rights to Regional Offices for Law and
Human Rights for validation of the incorporation of limited liability companies;
amendments to 8 laws and regulations concerning trade licensing; various
regulations to expedite the movement of goods (Director General of Customs and
Excise and the Minister of Finance); 30 minute target release time in the green
lane, and 3 day release time for the red lane; reduction in use of red lane to 10% by
end-2006; use of priority lane to be expanded to 130 importers by end-2006. In
addition to these policies, the government also issued specific policies for certain
industries, such as Regulation of the Minister of Finance No. 79/PMK.010/2006
concerning Import Duty Exemption for Automotive Parts and Components Used in
Production of Exported Vehicles.
Progress in policy reforms for agriculture has also been limited.Progress in policy reforms for agriculture has also been limited.Progress in policy reforms for agriculture has also been limited.Progress in policy reforms for agriculture has also been limited.Progress in policy reforms for agriculture has also been limited. The (macro) policy
for revitalisation of agriculture, fisheries and forestry, launched in July 2005, has
been beset by delays. Some observers claim that these delays can be partly attributed
to the excessively broad goal of the policy, which is to raise living standards and
competitiveness through revitalisation of agriculture. During 2006, the government
took other measures including a 10%-15% rise in official retail prices for subsidised
fertilisers (May 2006).
In the mining sector, policies launched thus far have failed to stimulate investment.In the mining sector, policies launched thus far have failed to stimulate investment.In the mining sector, policies launched thus far have failed to stimulate investment.In the mining sector, policies launched thus far have failed to stimulate investment.In the mining sector, policies launched thus far have failed to stimulate investment.
Mining sector policies issued by the government have so far been only piecemeal.
One example is Regulation of the Minister of Finance No. 97/PMK.010/2006
concerning import duty exemptions for equipment used in upstream oil and gas
production. Overall, there have been only limited policy reforms in the mining sector,
offering little incentive for investors. Investment in mining has also been held up
by conflicting provisions in other ministerial regulations, such as Regulation of the
Minister of Forestry No. P.14/Menhut-II/2006 concerning lease and use of forest
areas, regulations on regional autonomy and the delays in promulgation of the
Law on Mining of Minerals and Coal.
In the area of labour reforms, no structural changes took place during 2006.In the area of labour reforms, no structural changes took place during 2006.In the area of labour reforms, no structural changes took place during 2006.In the area of labour reforms, no structural changes took place during 2006.In the area of labour reforms, no structural changes took place during 2006. The
planned passage of the new Draft Labour Law designed to replace Act No. 13 of
2003 has met with fierce opposition from trade unions and workers, and it is
12
Monetary Policy Report - Quarter IV 2006
impossible to predict when the law will reach completion. In 2006, work was
completed on the following action items on labour issues:
(1) On the domestic front, new policies were issued on skills development for the
unemployed in the regions through revitalisation of Vocational Training Centres
(BLK); launching of a nationwide movement on combating unemployment at the
village, subdistrict and regency level; and operation of job centres in each province.
(2) Regarding overseas workers, new policies were issued on reform of the systems
for recruitment and protection of overseas workers, including reduction in bureau-
cratic processing for overseas workers from 40 desks to 11 desks; improved treat-
ment of overseas workers through provision of special departure and arrival areas;
decentralisation of licensing and services for overseas workers to the regions, espe-
cially through the development of one-roof services; reductions in the costs borne
by overseas workers by elimination of charges on worker ID cards, removal of the
exit tax requirement and 60% reduction in cost structures; registration of overseas
worker recruitment companies and revocation of licences for 104 companies; sig-
nature of MoUs with destination countries; campaign for the right of children of
overseas workers in Malaysia to attend school; and unloading of 80 thousand tons
of overseas worker belongings held up at Cengkareng since 2001.
Besides policies issued by the government, new policies issued by trading partnersBesides policies issued by the government, new policies issued by trading partnersBesides policies issued by the government, new policies issued by trading partnersBesides policies issued by the government, new policies issued by trading partnersBesides policies issued by the government, new policies issued by trading partners
during 2006 offer opportunities for boosting exports of some Indonesian products.during 2006 offer opportunities for boosting exports of some Indonesian products.during 2006 offer opportunities for boosting exports of some Indonesian products.during 2006 offer opportunities for boosting exports of some Indonesian products.during 2006 offer opportunities for boosting exports of some Indonesian products.
These policies include incentives offered by the European Union, which has revoked
Anti Dumping Charges on Indonesian polyester staple fibre. In addition, China has
removed its import tariff on Indonesian cocoa, formerly set at 10%-25%.
13
Monetary Indicators and Policy QIV-2006
3. Monetary Indicators and PolicyQIV-2006
During Q4/2006, monetary conditions maintained an improving trend. During Q4/2006, monetary conditions maintained an improving trend. During Q4/2006, monetary conditions maintained an improving trend. During Q4/2006, monetary conditions maintained an improving trend. During Q4/2006, monetary conditions maintained an improving trend. Reflecting
this was falling inflation, an appreciating trend in the rupiah accompanied by reduced
volatility and adequate liquidity to support economic activities. The improvement
in monetary conditions alongside optimism over the economic outlook and rising
confidence in future inflation control offered room for further reductions in the BI
Rate. During Q4/2006, the BI Rate was lowered three times in a total rate cut of
150 bps to 9.75% at end-2006, bringing the overall reduction in the BI Rate from
the beginning to the end of 2006 to 300 bps. The rate cuts began in May 2006 in
a move that also signified a change in the monetary policy stance from tight biased
to cautious easing.
The sustained reductions in the interest rate were welcomed by business and metThe sustained reductions in the interest rate were welcomed by business and metThe sustained reductions in the interest rate were welcomed by business and metThe sustained reductions in the interest rate were welcomed by business and metThe sustained reductions in the interest rate were welcomed by business and met
with positive response from market actors. with positive response from market actors. with positive response from market actors. with positive response from market actors. with positive response from market actors. Reflecting this were steadily rising share
prices with the stock index closing at 1,805, decline in long-term bond yield and
renewed growth in consumer confidence. In the banking sector, the Indonesian
banking system showed overall improvement in the operation of the intermediary
function. As of November 2006, credit expansion reached Rp 78.2 billion (10.7%),
bringing total bank lending to RpΩ806.3 trillion. Funding this credit expansion was
a Rp 123 trillion (10.9%) rise in depositor funds to a cumulative Rp 1,251 trillion.
INFLATION
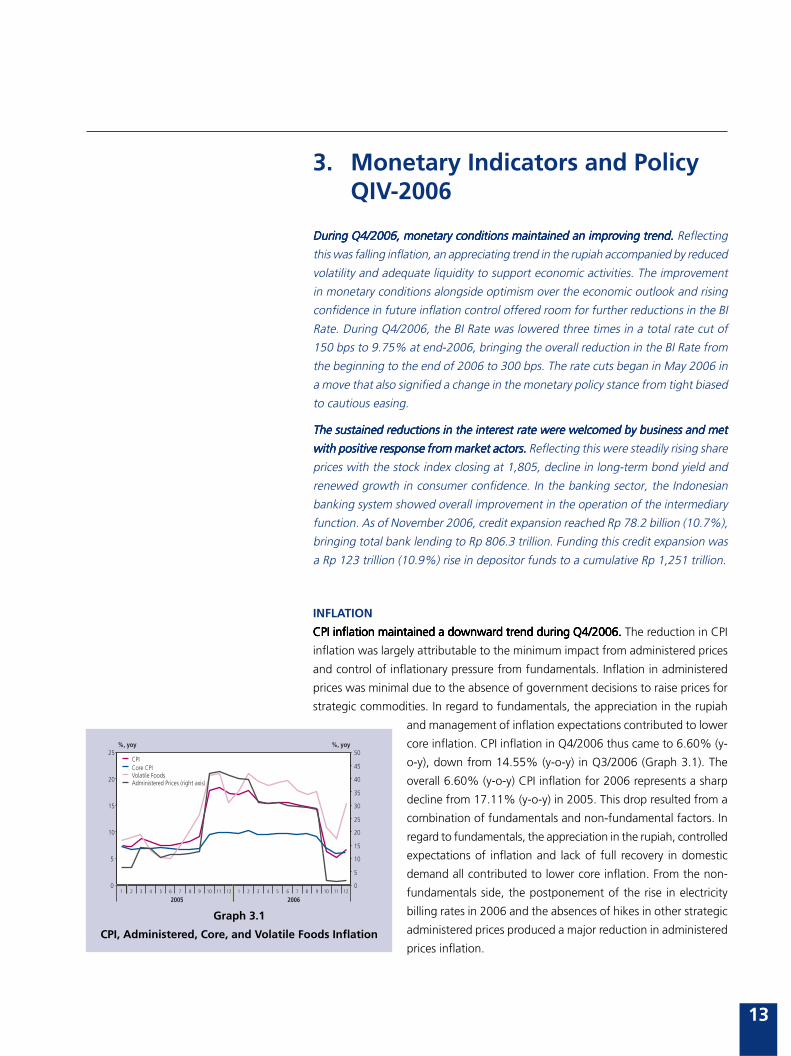
CPI inflation maintained a downward trend during Q4/2006.CPI inflation maintained a downward trend during Q4/2006.CPI inflation maintained a downward trend during Q4/2006.CPI inflation maintained a downward trend during Q4/2006.CPI inflation maintained a downward trend during Q4/2006. The reduction in CPI
inflation was largely attributable to the minimum impact from administered prices
and control of inflationary pressure from fundamentals. Inflation in administered
prices was minimal due to the absence of government decisions to raise prices for
strategic commodities. In regard to fundamentals, the appreciation in the rupiah
and management of inflation expectations contributed to lower
core inflation. CPI inflation in Q4/2006 thus came to 6.60% (y-
o-y), down from 14.55% (y-o-y) in Q3/2006 (Graph 3.1). The
overall 6.60% (y-o-y) CPI inflation for 2006 represents a sharp
decline from 17.11% (y-o-y) in 2005. This drop resulted from a
combination of fundamentals and non-fundamental factors. In
regard to fundamentals, the appreciation in the rupiah, controlled
expectations of inflation and lack of full recovery in domestic
demand all contributed to lower core inflation. From the non-
fundamentals side, the postponement of the rise in electricity
billing rates in 2006 and the absences of hikes in other strategic
administered prices produced a major reduction in administered
prices inflation.
Graph 3.1
CPI, Administered, Core, and Volatile Foods Inflation
0
5
10
15
20
25
1 2 3 4 5 6 7 8 9 10 11 12 1 2 3 4 5 6 7 8 9 10 11 12
2005 2006
0
5
10
15
20
25
30
35
40
45
50%, yoy %, yoy
CPICore CPIVolatile FoodsAdministered Prices (right axis)
14
Monetary Policy Report - Quarter IV 2006
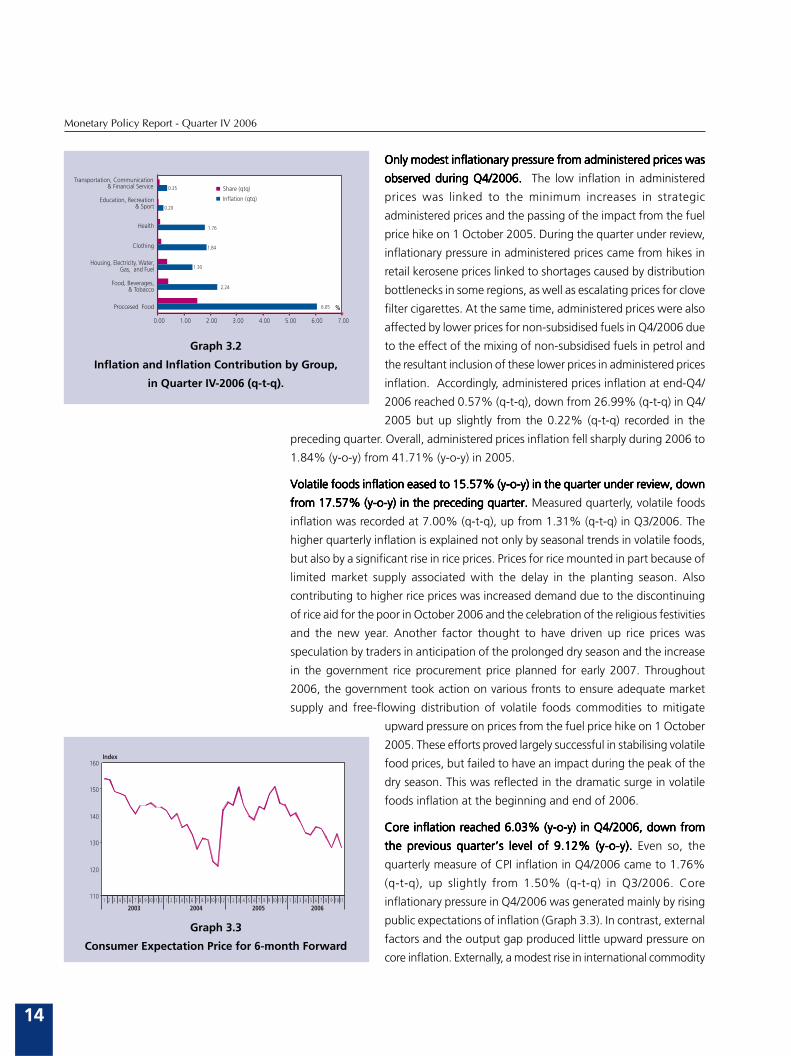
Only modest inflationary pressure from administered prices wasOnly modest inflationary pressure from administered prices wasOnly modest inflationary pressure from administered prices wasOnly modest inflationary pressure from administered prices wasOnly modest inflationary pressure from administered prices was
observed during Q4/2006. observed during Q4/2006. observed during Q4/2006. observed during Q4/2006. observed during Q4/2006. The low inflation in administered
prices was linked to the minimum increases in strategic
administered prices and the passing of the impact from the fuel
price hike on 1 October 2005. During the quarter under review,
inflationary pressure in administered prices came from hikes in
retail kerosene prices linked to shortages caused by distribution
bottlenecks in some regions, as well as escalating prices for clove
filter cigarettes. At the same time, administered prices were also
affected by lower prices for non-subsidised fuels in Q4/2006 due
to the effect of the mixing of non-subsidised fuels in petrol and
the resultant inclusion of these lower prices in administered prices
inflation. Accordingly, administered prices inflation at end-Q4/
2006 reached 0.57% (q-t-q), down from 26.99% (q-t-q) in Q4/
2005 but up slightly from the 0.22% (q-t-q) recorded in the
preceding quarter. Overall, administered prices inflation fell sharply during 2006 to
1.84% (y-o-y) from 41.71% (y-o-y) in 2005.
Volatile foods inflation eased to 15.57% (y-o-y) in the quarter under review, downVolatile foods inflation eased to 15.57% (y-o-y) in the quarter under review, downVolatile foods inflation eased to 15.57% (y-o-y) in the quarter under review, downVolatile foods inflation eased to 15.57% (y-o-y) in the quarter under review, downVolatile foods inflation eased to 15.57% (y-o-y) in the quarter under review, down
from 17.57% (y-o-y) in the preceding quarter.from 17.57% (y-o-y) in the preceding quarter.from 17.57% (y-o-y) in the preceding quarter.from 17.57% (y-o-y) in the preceding quarter.from 17.57% (y-o-y) in the preceding quarter. Measured quarterly, volatile foods
inflation was recorded at 7.00% (q-t-q), up from 1.31% (q-t-q) in Q3/2006. The
higher quarterly inflation is explained not only by seasonal trends in volatile foods,
but also by a significant rise in rice prices. Prices for rice mounted in part because of
limited market supply associated with the delay in the planting season. Also
contributing to higher rice prices was increased demand due to the discontinuing
of rice aid for the poor in October 2006 and the celebration of the religious festivities
and the new year. Another factor thought to have driven up rice prices was
speculation by traders in anticipation of the prolonged dry season and the increase
in the government rice procurement price planned for early 2007. Throughout
2006, the government took action on various fronts to ensure adequate market
supply and free-flowing distribution of volatile foods commodities to mitigate
upward pressure on prices from the fuel price hike on 1 October
2005. These efforts proved largely successful in stabilising volatile
food prices, but failed to have an impact during the peak of the
dry season. This was reflected in the dramatic surge in volatile
foods inflation at the beginning and end of 2006.
Core inflation reached 6.03% (y-o-y) in Q4/2006, down fromCore inflation reached 6.03% (y-o-y) in Q4/2006, down fromCore inflation reached 6.03% (y-o-y) in Q4/2006, down fromCore inflation reached 6.03% (y-o-y) in Q4/2006, down fromCore inflation reached 6.03% (y-o-y) in Q4/2006, down from
the previous quarter»s level of 9.12% (y-o-y).the previous quarter»s level of 9.12% (y-o-y).the previous quarter»s level of 9.12% (y-o-y).the previous quarter»s level of 9.12% (y-o-y).the previous quarter»s level of 9.12% (y-o-y). Even so, the
quarterly measure of CPI inflation in Q4/2006 came to 1.76%
(q-t-q), up slightly from 1.50% (q-t-q) in Q3/2006. Core
inflationary pressure in Q4/2006 was generated mainly by rising
public expectations of inflation (Graph 3.3). In contrast, external
factors and the output gap produced little upward pressure on
core inflation. Externally, a modest rise in international commodity
Graph 3.2
Inflation and Inflation Contribution by Group,
in Quarter IV-2006 (q-t-q).
2.24
1.30
1.76
0.20
0.35
6.05
1.84
0.00 1.00 2.00 3.00 4.00 5.00 6.00 7.00
Proccesed Food
Food, Beverages,& Tobacco
Housing, Electricity, Water,Gas, and Fuel
Clothing
Health
Education, Recreation& Sport
Transportation, Communication& Financial Service Share (qtq)
Inflation (qtq)
%
Graph 3.3
Consumer Expectation Price for 6-month Forward
110
120
130
140
150
160
1 2 3 4 5 6 7 8 9 10 11 12 1 2 3 4 5 6 7 8 9 10 11 12 1 2 3 4 5 6 7 8 9 10 11 12 1 2 3 4 5 6 7 8 9 10 11
2003 2004 2005 2006
Index
15
Monetary Indicators and Policy QIV-2006
Graph 3.5
Rupiah Exchange Rate
prices √ mainly gold and sugar √ during the quarter under review
did not produce inflationary pressure because of the appreciating
trend in the rupiah. At the same time, pressure from the output
gap was again minimal because of lack of recovery in public
purchasing power that kept a lid on aggregate demand amid
adequate levels of supply.
Bank Indonesia»s efforts in 2006 to maintain overallBank Indonesia»s efforts in 2006 to maintain overallBank Indonesia»s efforts in 2006 to maintain overallBank Indonesia»s efforts in 2006 to maintain overallBank Indonesia»s efforts in 2006 to maintain overall
macroeconomic stability proved effective in curbing coremacroeconomic stability proved effective in curbing coremacroeconomic stability proved effective in curbing coremacroeconomic stability proved effective in curbing coremacroeconomic stability proved effective in curbing core
inflationary pressure, particularly that generated by fundamentals.inflationary pressure, particularly that generated by fundamentals.inflationary pressure, particularly that generated by fundamentals.inflationary pressure, particularly that generated by fundamentals.inflationary pressure, particularly that generated by fundamentals.
The appreciation in the rupiah and subdued expectations of
inflation contributed to lower core inflation. Furthermore, the
lack of recovery in aggregate demand due to persistently weak
purchasing power kept inflationary pressure from the output gap
to a minimum. On the other hand, a general improvement in the supply and
distribution of goods and services also minimised inflationary pressure from the
output gap. These developments in fundamentals brought core inflation for 2006
down to 6.03% (y-o-y), down from 9.75% (y-o-y) in 2005.
RUPIAH EXCHANGE RATE
In Q4/2006 the rupiah demonstrated more stable movement compared to theIn Q4/2006 the rupiah demonstrated more stable movement compared to theIn Q4/2006 the rupiah demonstrated more stable movement compared to theIn Q4/2006 the rupiah demonstrated more stable movement compared to theIn Q4/2006 the rupiah demonstrated more stable movement compared to the
preceding quarter, accompanied by an appreciating trend.preceding quarter, accompanied by an appreciating trend.preceding quarter, accompanied by an appreciating trend.preceding quarter, accompanied by an appreciating trend.preceding quarter, accompanied by an appreciating trend. Improved stability in the
rupiah was also reflected in a reduction in volatility from 0.85% to 0.46% (Graph
3.6). Point-to-point, the rupiah strengthened from Rp 9,225/USD at end-Q3/2006
to Rp 8,995 at end-Q4/2006. Measured as an average for the quarter, the rupiah
weakened slightly to Rp 9,132/USD from the previous quarter»s level of Rp 9,125/
USD (Graph 3.5). Rupiah stability was bolstered by improved domestic
macroeconomic conditions and reduced external pressures. Improvement was
recorded in several macroeconomic indicators during Q4/2006, especially in inflation.
Furthermore, the rupiah maintained its attractiveness for investors due to the
improvement in risk indicators amid the downward trend in
rupiah investment yields. Externally, the US Federal Reserve kept
its rate on hold and the downward trend in oil prices eased
pressure on the rupiah. At the same time, Thailand»s move to
impose tighter restrictions on capital inflows had little effect on
the rupiah.
Rupiah stability in Q4/2006 was supported by the improvingRupiah stability in Q4/2006 was supported by the improvingRupiah stability in Q4/2006 was supported by the improvingRupiah stability in Q4/2006 was supported by the improvingRupiah stability in Q4/2006 was supported by the improving
condition of economic fundamentals.condition of economic fundamentals.condition of economic fundamentals.condition of economic fundamentals.condition of economic fundamentals. Improvement was recorded
across a range of economic indicators - such as exports, GDP
growth and the inflation rate. Buoyed by the continued rise in
global demand and export commodity prices, exports kept
climbing during the January-October 2006 period, with non-oil
and gas export growth reaching 19.4%. During the same period,
Graph 3.4
Growth of Retail Sales Index
-75
-50
-25
0
25
50
75
100
125
150
1 2 3 4 5 6 7 8 9 10 11 12 1 2 3 4 5 6 7 8 9 10 11 12 1 2 3 4 5 6 7 8 9 10 11
2004 2005 2006
TotalHousehold EquipmentFood and TobaccoClothing
%, yoy
9,299
9,115 9,125 9,132
8,000
8,500
9,000
9,500
10,000
10,500
Monthly Average
Quarterly Average
Rp/USD
Jul Aug Sep Oct Nov Dec Jan Feb Mar Apr May Jun Jul Aug Sep Oct Nov Dec
9,81
0
10,0
03
10,2
18
10,0
85
10,0
42
9,85
2
9,47
9
9,25
6
9,16
3
8,93
9
9,02
4
9,37
0
9,13
1
9,09
4
9,15
3
9,17
4
9,13
8
9,08
2
2005 2006
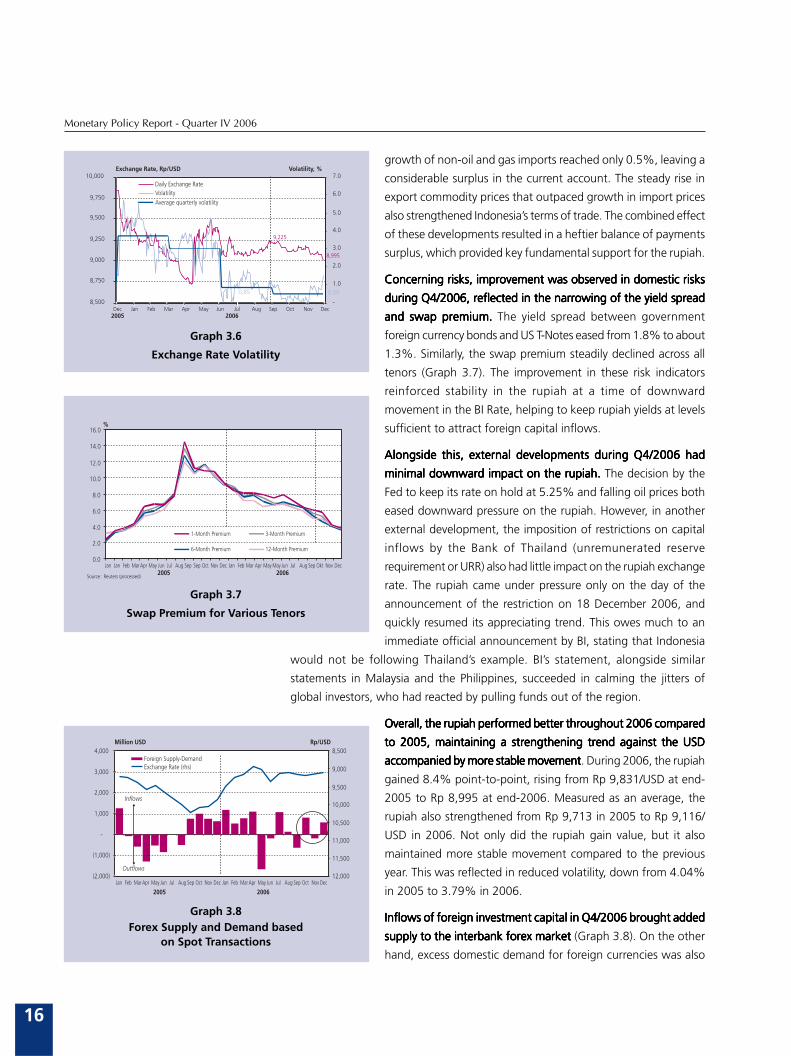
16
Monetary Policy Report - Quarter IV 2006
growth of non-oil and gas imports reached only 0.5%, leaving a
considerable surplus in the current account. The steady rise in
export commodity prices that outpaced growth in import prices
also strengthened Indonesia»s terms of trade. The combined effect
of these developments resulted in a heftier balance of payments
surplus, which provided key fundamental support for the rupiah.
Concerning risks, improvement was observed in domestic risksConcerning risks, improvement was observed in domestic risksConcerning risks, improvement was observed in domestic risksConcerning risks, improvement was observed in domestic risksConcerning risks, improvement was observed in domestic risks
during Q4/2006, reflected in the narrowing of the yield spreadduring Q4/2006, reflected in the narrowing of the yield spreadduring Q4/2006, reflected in the narrowing of the yield spreadduring Q4/2006, reflected in the narrowing of the yield spreadduring Q4/2006, reflected in the narrowing of the yield spread
and swap premium.and swap premium.and swap premium.and swap premium.and swap premium. The yield spread between government
foreign currency bonds and US T-Notes eased from 1.8% to about
1.3%. Similarly, the swap premium steadily declined across all
tenors (Graph 3.7). The improvement in these risk indicators
reinforced stability in the rupiah at a time of downward
movement in the BI Rate, helping to keep rupiah yields at levels
sufficient to attract foreign capital inflows.
Alongside this, external developments during Q4/2006 hadAlongside this, external developments during Q4/2006 hadAlongside this, external developments during Q4/2006 hadAlongside this, external developments during Q4/2006 hadAlongside this, external developments during Q4/2006 had
minimal downward impact on the rupiah.minimal downward impact on the rupiah.minimal downward impact on the rupiah.minimal downward impact on the rupiah.minimal downward impact on the rupiah. The decision by the
Fed to keep its rate on hold at 5.25% and falling oil prices both
eased downward pressure on the rupiah. However, in another
external development, the imposition of restrictions on capital
inflows by the Bank of Thailand (unremunerated reserve
requirement or URR) also had little impact on the rupiah exchange
rate. The rupiah came under pressure only on the day of the
announcement of the restriction on 18 December 2006, and
quickly resumed its appreciating trend. This owes much to an
immediate official announcement by BI, stating that Indonesia
would not be following Thailand»s example. BI»s statement, alongside similar
statements in Malaysia and the Philippines, succeeded in calming the jitters of
global investors, who had reacted by pulling funds out of the region.
Overall, the rupiah performed better throughout 2006 comparedOverall, the rupiah performed better throughout 2006 comparedOverall, the rupiah performed better throughout 2006 comparedOverall, the rupiah performed better throughout 2006 comparedOverall, the rupiah performed better throughout 2006 compared
to 2005, maintaining a strengthening trend against the USDto 2005, maintaining a strengthening trend against the USDto 2005, maintaining a strengthening trend against the USDto 2005, maintaining a strengthening trend against the USDto 2005, maintaining a strengthening trend against the USD
accompanied by more stable movementaccompanied by more stable movementaccompanied by more stable movementaccompanied by more stable movementaccompanied by more stable movement. During 2006, the rupiah
gained 8.4% point-to-point, rising from Rp 9,831/USD at end-
2005 to Rp 8,995 at end-2006. Measured as an average, the
rupiah also strengthened from Rp 9,713 in 2005 to Rp 9,116/
USD in 2006. Not only did the rupiah gain value, but it also
maintained more stable movement compared to the previous
year. This was reflected in reduced volatility, down from 4.04%
in 2005 to 3.79% in 2006.
Inflows of foreign investment capital in Q4/2006 brought addedInflows of foreign investment capital in Q4/2006 brought addedInflows of foreign investment capital in Q4/2006 brought addedInflows of foreign investment capital in Q4/2006 brought addedInflows of foreign investment capital in Q4/2006 brought added
supply to the interbank forex marketsupply to the interbank forex marketsupply to the interbank forex marketsupply to the interbank forex marketsupply to the interbank forex market (Graph 3.8). On the other
hand, excess domestic demand for foreign currencies was also
Graph 3.6
Exchange Rate Volatility
Graph 3.7
Swap Premium for Various Tenors
8,995
9,225
0.500,85
8,500
8,750
9,000
9,250
9,500
9,750
10,000
-
1.0
2.0
3.0
4.0
5.0
6.0
7.0Daily Exchange RateVolatility
Average quarterly volatility
Exchange Rate, Rp/USD Volatility, %
Dec Jan Feb Mar Apr May Jun Jul Aug Sep Oct Nov Dec2005 2006
Graph 3.8Forex Supply and Demand based
on Spot Transactions
0.0
2.0
4.0
6.0
8.0
10.0
12.0
14.0
16.0
1-Month Premium 3-Month Premium
6-Month Premium 12-Month Premium
Source : Reuters (processed)
Jan Jan Feb MarApr May Jun Jul Aug Sep Sep Oct Nov Dec Jan Feb Mar Apr May May Jun Jul Aug Sep Okt Nov Dec
%
2005 2006
(2,000)
(1,000)
-
1,000
2,000
3,000
4,000 8,500
9,000
9,500
10,000
10,500
11,000
11,500
12,000
Foreign Supply-DemandExchange Rate (rhs)
Million USD
Inflows
Outflows
Rp/USD
Jan Feb Mar Apr May Jun Jul Aug Sep Oct Nov Dec Jan Feb Mar Apr May Jun Jul Aug Sep Oct Nov Dec
2005 2006
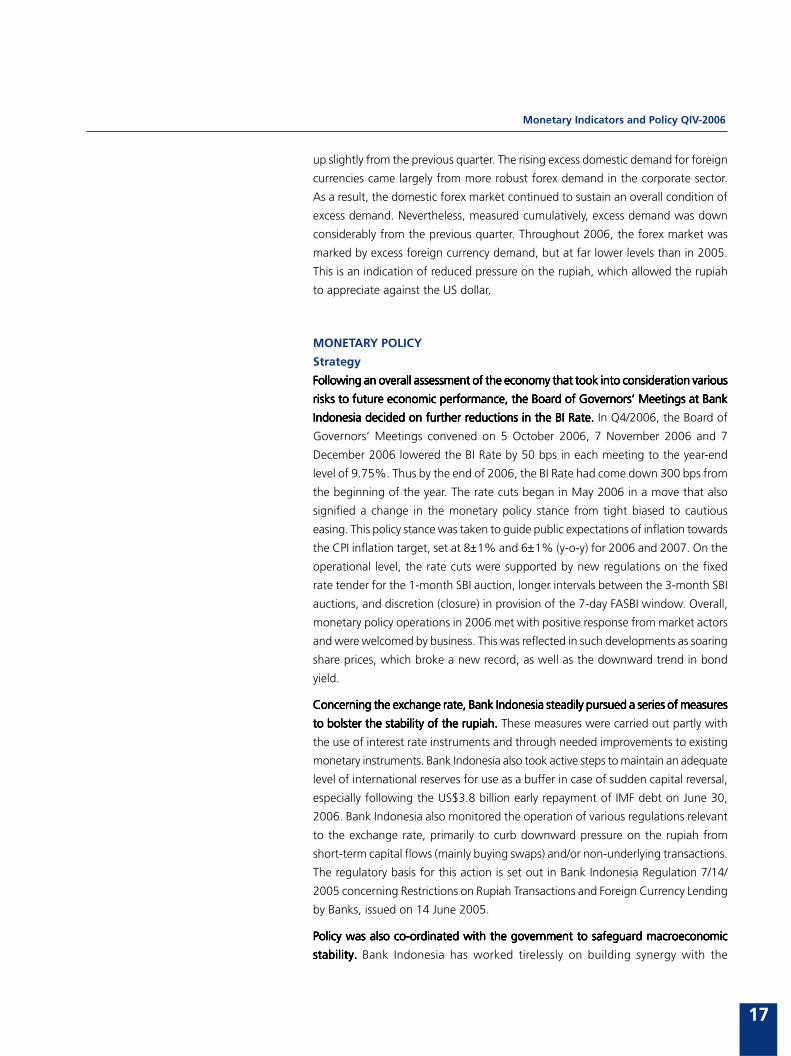
17
Monetary Indicators and Policy QIV-2006
up slightly from the previous quarter. The rising excess domestic demand for foreign
currencies came largely from more robust forex demand in the corporate sector.
As a result, the domestic forex market continued to sustain an overall condition of
excess demand. Nevertheless, measured cumulatively, excess demand was down
considerably from the previous quarter. Throughout 2006, the forex market was
marked by excess foreign currency demand, but at far lower levels than in 2005.
This is an indication of reduced pressure on the rupiah, which allowed the rupiah
to appreciate against the US dollar.
MONETARY POLICY
Strategy
Following an overall assessment of the economy that took into consideration variousFollowing an overall assessment of the economy that took into consideration variousFollowing an overall assessment of the economy that took into consideration variousFollowing an overall assessment of the economy that took into consideration variousFollowing an overall assessment of the economy that took into consideration various
risks to future economic performance, the Board of Governors» Meetings at Bankrisks to future economic performance, the Board of Governors» Meetings at Bankrisks to future economic performance, the Board of Governors» Meetings at Bankrisks to future economic performance, the Board of Governors» Meetings at Bankrisks to future economic performance, the Board of Governors» Meetings at Bank
Indonesia decided on further reductions in the BI Rate.Indonesia decided on further reductions in the BI Rate.Indonesia decided on further reductions in the BI Rate.Indonesia decided on further reductions in the BI Rate.Indonesia decided on further reductions in the BI Rate. In Q4/2006, the Board of
Governors» Meetings convened on 5 October 2006, 7 November 2006 and 7
December 2006 lowered the BI Rate by 50 bps in each meeting to the year-end
level of 9.75%. Thus by the end of 2006, the BI Rate had come down 300 bps from
the beginning of the year. The rate cuts began in May 2006 in a move that also
signified a change in the monetary policy stance from tight biased to cautious
easing. This policy stance was taken to guide public expectations of inflation towards
the CPI inflation target, set at 8±1% and 6±1% (y-o-y) for 2006 and 2007. On the
operational level, the rate cuts were supported by new regulations on the fixed
rate tender for the 1-month SBI auction, longer intervals between the 3-month SBI
auctions, and discretion (closure) in provision of the 7-day FASBI window. Overall,
monetary policy operations in 2006 met with positive response from market actors
and were welcomed by business. This was reflected in such developments as soaring
share prices, which broke a new record, as well as the downward trend in bond
yield.
Concerning the exchange rate, Bank Indonesia steadily pursued a series of measuresConcerning the exchange rate, Bank Indonesia steadily pursued a series of measuresConcerning the exchange rate, Bank Indonesia steadily pursued a series of measuresConcerning the exchange rate, Bank Indonesia steadily pursued a series of measuresConcerning the exchange rate, Bank Indonesia steadily pursued a series of measures
to bolster the stability of the rupiah.to bolster the stability of the rupiah.to bolster the stability of the rupiah.to bolster the stability of the rupiah.to bolster the stability of the rupiah. These measures were carried out partly with
the use of interest rate instruments and through needed improvements to existing
monetary instruments. Bank Indonesia also took active steps to maintain an adequate
level of international reserves for use as a buffer in case of sudden capital reversal,
especially following the US$3.8 billion early repayment of IMF debt on June 30,
2006. Bank Indonesia also monitored the operation of various regulations relevant
to the exchange rate, primarily to curb downward pressure on the rupiah from
short-term capital flows (mainly buying swaps) and/or non-underlying transactions.
The regulatory basis for this action is set out in Bank Indonesia Regulation 7/14/
2005 concerning Restrictions on Rupiah Transactions and Foreign Currency Lending
by Banks, issued on 14 June 2005.
Policy was also co-ordinated with the government to safeguard macroeconomicPolicy was also co-ordinated with the government to safeguard macroeconomicPolicy was also co-ordinated with the government to safeguard macroeconomicPolicy was also co-ordinated with the government to safeguard macroeconomicPolicy was also co-ordinated with the government to safeguard macroeconomic
stability. stability. stability. stability. stability. Bank Indonesia has worked tirelessly on building synergy with the
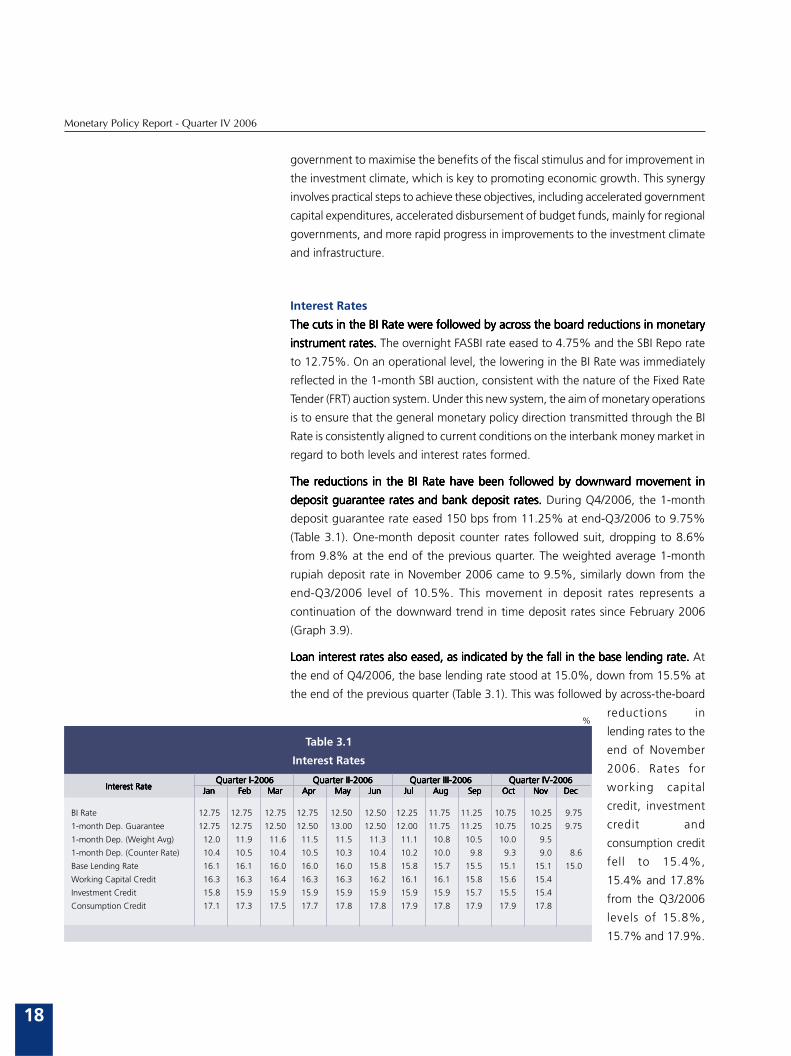
18
Monetary Policy Report - Quarter IV 2006
government to maximise the benefits of the fiscal stimulus and for improvement in
the investment climate, which is key to promoting economic growth. This synergy
involves practical steps to achieve these objectives, including accelerated government
capital expenditures, accelerated disbursement of budget funds, mainly for regional
governments, and more rapid progress in improvements to the investment climate
and infrastructure.
Interest Rates
The cuts in the BI Rate were followed by across the board reductions in monetaryThe cuts in the BI Rate were followed by across the board reductions in monetaryThe cuts in the BI Rate were followed by across the board reductions in monetaryThe cuts in the BI Rate were followed by across the board reductions in monetaryThe cuts in the BI Rate were followed by across the board reductions in monetary
instrument rates. instrument rates. instrument rates. instrument rates. instrument rates. The overnight FASBI rate eased to 4.75% and the SBI Repo rate
to 12.75%. On an operational level, the lowering in the BI Rate was immediately
reflected in the 1-month SBI auction, consistent with the nature of the Fixed Rate
Tender (FRT) auction system. Under this new system, the aim of monetary operations
is to ensure that the general monetary policy direction transmitted through the BI
Rate is consistently aligned to current conditions on the interbank money market in
regard to both levels and interest rates formed.
The reductions in the BI Rate have been followed by downward movement inThe reductions in the BI Rate have been followed by downward movement inThe reductions in the BI Rate have been followed by downward movement inThe reductions in the BI Rate have been followed by downward movement inThe reductions in the BI Rate have been followed by downward movement in
deposit guarantee rates and bank deposit rates.deposit guarantee rates and bank deposit rates.deposit guarantee rates and bank deposit rates.deposit guarantee rates and bank deposit rates.deposit guarantee rates and bank deposit rates. During Q4/2006, the 1-month
deposit guarantee rate eased 150 bps from 11.25% at end-Q3/2006 to 9.75%
(Table 3.1). One-month deposit counter rates followed suit, dropping to 8.6%
from 9.8% at the end of the previous quarter. The weighted average 1-month
rupiah deposit rate in November 2006 came to 9.5%, similarly down from the
end-Q3/2006 level of 10.5%. This movement in deposit rates represents a
continuation of the downward trend in time deposit rates since February 2006
(Graph 3.9).
Loan interest rates also eased, as indicated by the fall in the base lending rate.Loan interest rates also eased, as indicated by the fall in the base lending rate.Loan interest rates also eased, as indicated by the fall in the base lending rate.Loan interest rates also eased, as indicated by the fall in the base lending rate.Loan interest rates also eased, as indicated by the fall in the base lending rate. At
the end of Q4/2006, the base lending rate stood at 15.0%, down from 15.5% at
the end of the previous quarter (Table 3.1). This was followed by across-the-board
reductions in
lending rates to the
end of November
2006. Rates for
working capital
credit, investment
credit and
consumption credit
fell to 15.4%,
15.4% and 17.8%
from the Q3/2006
levels of 15.8%,
15.7% and 17.9%.
Quarter I-2Quarter I-2Quarter I-2Quarter I-2Quarter I-2006006006006006 Quarter II-2Quarter II-2Quarter II-2Quarter II-2Quarter II-2006006006006006 Quarter III-2Quarter III-2Quarter III-2Quarter III-2Quarter III-2006006006006006 Quarter IV-2Quarter IV-2Quarter IV-2Quarter IV-2Quarter IV-2006006006006006JanJanJanJanJan FebFebFebFebFeb MarMarMarMarMar AprAprAprAprApr MayMayMayMayMay JunJunJunJunJun JulJulJulJulJul AugAugAugAugAug SepSepSepSepSep OctOctOctOctOct NovNovNovNovNov DecDecDecDecDec
Table 3.1
Interest Rates
BI Rate 12.75 12.75 12.75 12.75 12.50 12.50 12.25 11.75 11.25 10.75 10.25 9.75
1-month Dep. Guarantee 12.75 12.75 12.50 12.50 13.00 12.50 12.00 11.75 11.25 10.75 10.25 9.75
1-month Dep. (Weight Avg) 12.0 11.9 11.6 11.5 11.5 11.3 11.1 10.8 10.5 10.0 9.5
1-month Dep. (Counter Rate) 10.4 10.5 10.4 10.5 10.3 10.4 10.2 10.0 9.8 9.3 9.0 8.6
Base Lending Rate 16.1 16.1 16.0 16.0 16.0 15.8 15.8 15.7 15.5 15.1 15.1 15.0
Working Capital Credit 16.3 16.3 16.4 16.3 16.3 16.2 16.1 16.1 15.8 15.6 15.4
Investment Credit 15.8 15.9 15.9 15.9 15.9 15.9 15.9 15.9 15.7 15.5 15.4
Consumption Credit 17.1 17.3 17.5 17.7 17.8 17.8 17.9 17.8 17.9 17.9 17.8
Interest RateInterest RateInterest RateInterest RateInterest Rate
%
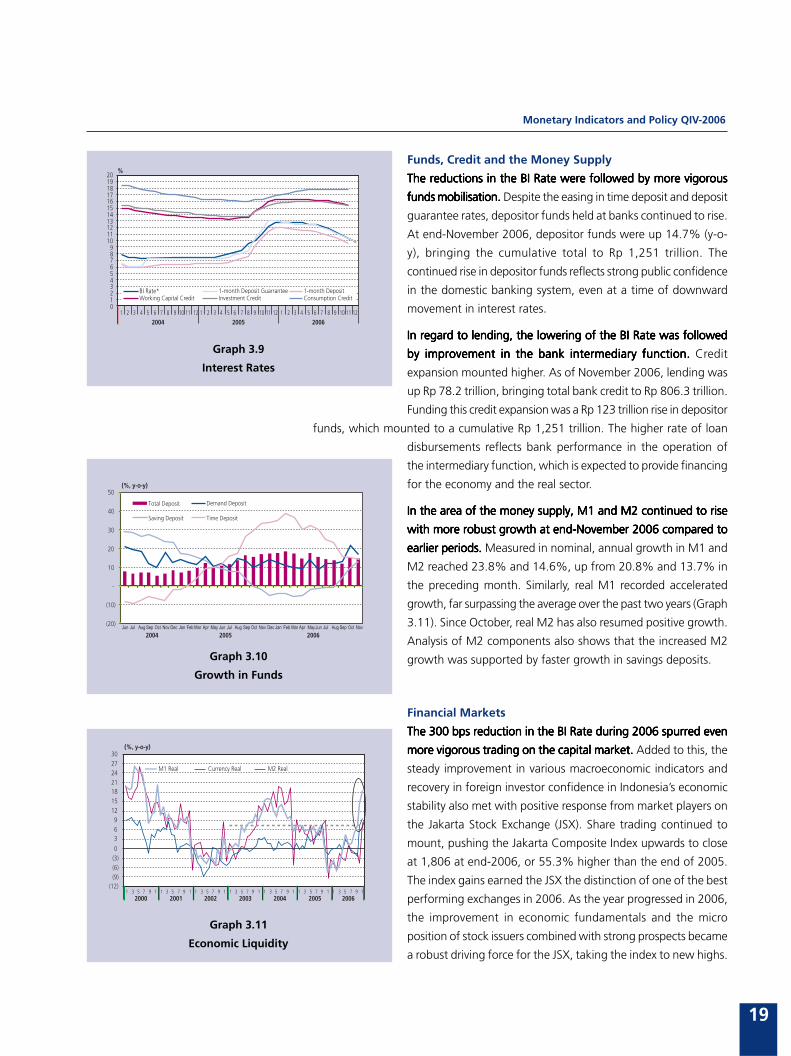
19
Monetary Indicators and Policy QIV-2006
Funds, Credit and the Money Supply
The reductions in the BI Rate were followed by more vigorousThe reductions in the BI Rate were followed by more vigorousThe reductions in the BI Rate were followed by more vigorousThe reductions in the BI Rate were followed by more vigorousThe reductions in the BI Rate were followed by more vigorous
funds mobilisation. funds mobilisation. funds mobilisation. funds mobilisation. funds mobilisation. Despite the easing in time deposit and deposit
guarantee rates, depositor funds held at banks continued to rise.
At end-November 2006, depositor funds were up 14.7% (y-o-
y), bringing the cumulative total to Rp 1,251 trillion. The
continued rise in depositor funds reflects strong public confidence
in the domestic banking system, even at a time of downward
movement in interest rates.
In regard to lending, the lowering of the BI Rate was followedIn regard to lending, the lowering of the BI Rate was followedIn regard to lending, the lowering of the BI Rate was followedIn regard to lending, the lowering of the BI Rate was followedIn regard to lending, the lowering of the BI Rate was followed
by improvement in the bank intermediary function. by improvement in the bank intermediary function. by improvement in the bank intermediary function. by improvement in the bank intermediary function. by improvement in the bank intermediary function. Credit
expansion mounted higher. As of November 2006, lending was
up Rp 78.2 trillion, bringing total bank credit to RpΩ806.3 trillion.
Funding this credit expansion was a Rp 123 trillion rise in depositor
funds, which mounted to a cumulative Rp 1,251 trillion. The higher rate of loan
disbursements reflects bank performance in the operation of
the intermediary function, which is expected to provide financing
for the economy and the real sector.
In the area of the money supply, M1 and M2 continued to riseIn the area of the money supply, M1 and M2 continued to riseIn the area of the money supply, M1 and M2 continued to riseIn the area of the money supply, M1 and M2 continued to riseIn the area of the money supply, M1 and M2 continued to rise
with more robust growth at end-November 2006 compared towith more robust growth at end-November 2006 compared towith more robust growth at end-November 2006 compared towith more robust growth at end-November 2006 compared towith more robust growth at end-November 2006 compared to
earlier periods.earlier periods.earlier periods.earlier periods.earlier periods. Measured in nominal, annual growth in M1 and
M2 reached 23.8% and 14.6%, up from 20.8% and 13.7% in
the preceding month. Similarly, real M1 recorded accelerated
growth, far surpassing the average over the past two years (Graph
3.11). Since October, real M2 has also resumed positive growth.
Analysis of M2 components also shows that the increased M2
growth was supported by faster growth in savings deposits.
Financial Markets
The 300 bps reduction in the BI Rate during 2006 spurred evenThe 300 bps reduction in the BI Rate during 2006 spurred evenThe 300 bps reduction in the BI Rate during 2006 spurred evenThe 300 bps reduction in the BI Rate during 2006 spurred evenThe 300 bps reduction in the BI Rate during 2006 spurred even
more vigorous trading on the capital market.more vigorous trading on the capital market.more vigorous trading on the capital market.more vigorous trading on the capital market.more vigorous trading on the capital market. Added to this, the
steady improvement in various macroeconomic indicators and
recovery in foreign investor confidence in Indonesia»s economic
stability also met with positive response from market players on
the Jakarta Stock Exchange (JSX). Share trading continued to
mount, pushing the Jakarta Composite Index upwards to close
at 1,806 at end-2006, or 55.3% higher than the end of 2005.
The index gains earned the JSX the distinction of one of the best
performing exchanges in 2006. As the year progressed in 2006,
the improvement in economic fundamentals and the micro
position of stock issuers combined with strong prospects became
a robust driving force for the JSX, taking the index to new highs.
Graph 3.9
Interest Rates
Graph 3.10
Growth in Funds
Graph 3.11
Economic Liquidity
0123456789
1011121314151617181920
2004 2005 2006
BI Rate* 1-month Deposit Guarrantee 1-month DepositWorking Capital Credit Investment Credit Consumption Credit
%
1 2 3 4 5 6 7 8 9 10 11 12 1 2 3 4 5 6 7 8 9 10 11 12 1 2 3 4 5 6 7 8 9 10 11 12
(20)
(10)
-
10
20
30
40
50
Total Deposit Demand Deposit
Saving Deposit Time Deposit
(%, y-o-y)
Jun Jul Aug Sep Oct Nov Dec Jan Feb Mar Apr May Jun Jul Aug Sep Oct Nov Dec Jan Feb Mar Apr MayJun Jul Aug Sep Oct Nov
2004 2005 2006
(12)(9)(6)(3)0
369
12151821242730
2000 2001 2002 2003 2004 2005 2006
(%, y-o-y)
1 3 5 7 9 1 1 3 5 7 9 1 1 3 5 7 9 1 1 3 5 7 9 1 1 3 5 7 9 1 1 3 5 7 9 1 1 3 5 7 9 1
M1 Real Currency Real M2 Real
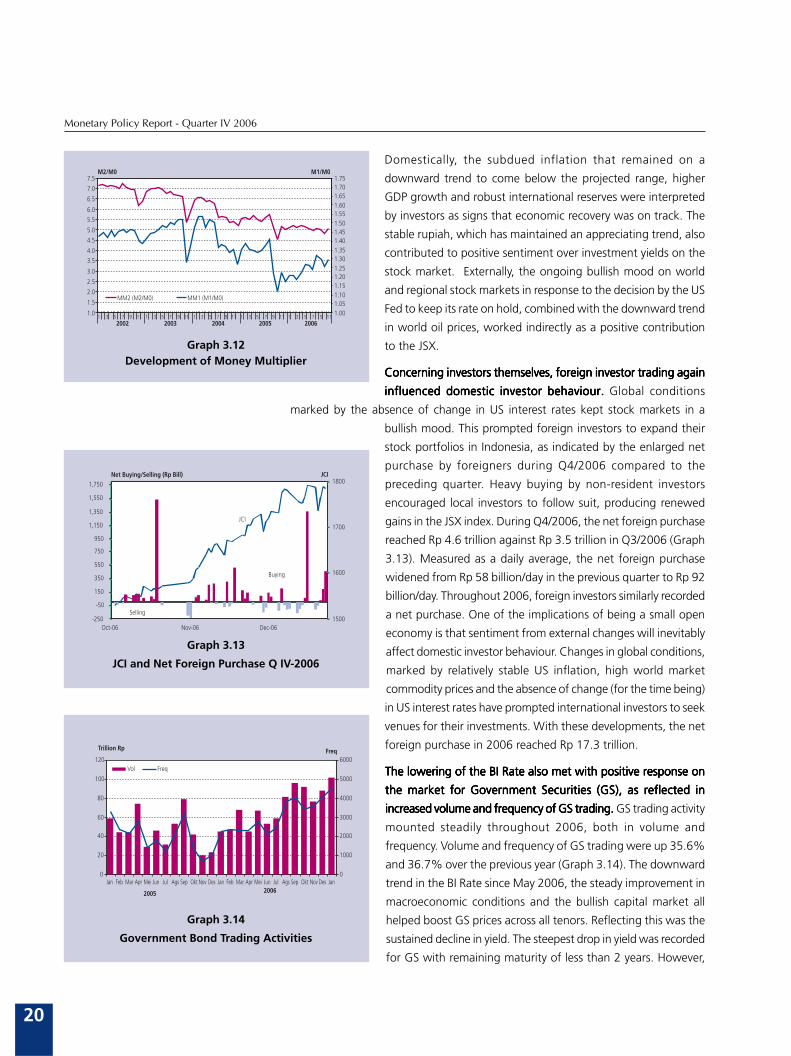
20
Monetary Policy Report - Quarter IV 2006
Domestically, the subdued inflation that remained on a
downward trend to come below the projected range, higher
GDP growth and robust international reserves were interpreted
by investors as signs that economic recovery was on track. The
stable rupiah, which has maintained an appreciating trend, also
contributed to positive sentiment over investment yields on the
stock market. Externally, the ongoing bullish mood on world
and regional stock markets in response to the decision by the US
Fed to keep its rate on hold, combined with the downward trend
in world oil prices, worked indirectly as a positive contribution
to the JSX.
Concerning investors themselves, foreign investor trading againConcerning investors themselves, foreign investor trading againConcerning investors themselves, foreign investor trading againConcerning investors themselves, foreign investor trading againConcerning investors themselves, foreign investor trading again
influenced domestic investor behaviour.influenced domestic investor behaviour.influenced domestic investor behaviour.influenced domestic investor behaviour.influenced domestic investor behaviour. Global conditions
marked by the absence of change in US interest rates kept stock markets in a
bullish mood. This prompted foreign investors to expand their
stock portfolios in Indonesia, as indicated by the enlarged net
purchase by foreigners during Q4/2006 compared to the
preceding quarter. Heavy buying by non-resident investors
encouraged local investors to follow suit, producing renewed
gains in the JSX index. During Q4/2006, the net foreign purchase
reached Rp 4.6 trillion against Rp 3.5 trillion in Q3/2006 (Graph
3.13). Measured as a daily average, the net foreign purchase
widened from Rp 58 billion/day in the previous quarter to Rp 92
billion/day. Throughout 2006, foreign investors similarly recorded
a net purchase. One of the implications of being a small open
economy is that sentiment from external changes will inevitably
affect domestic investor behaviour. Changes in global conditions,
marked by relatively stable US inflation, high world market
commodity prices and the absence of change (for the time being)
in US interest rates have prompted international investors to seek
venues for their investments. With these developments, the net
foreign purchase in 2006 reached Rp 17.3 trillion.
The lowering of the BI Rate also met with positive response onThe lowering of the BI Rate also met with positive response onThe lowering of the BI Rate also met with positive response onThe lowering of the BI Rate also met with positive response onThe lowering of the BI Rate also met with positive response on
the market for Government Securities (GS), as reflected inthe market for Government Securities (GS), as reflected inthe market for Government Securities (GS), as reflected inthe market for Government Securities (GS), as reflected inthe market for Government Securities (GS), as reflected in
increased volume and frequency of GS trading.increased volume and frequency of GS trading.increased volume and frequency of GS trading.increased volume and frequency of GS trading.increased volume and frequency of GS trading. GS trading activity
mounted steadily throughout 2006, both in volume and
frequency. Volume and frequency of GS trading were up 35.6%
and 36.7% over the previous year (Graph 3.14). The downward
trend in the BI Rate since May 2006, the steady improvement in
macroeconomic conditions and the bullish capital market all
helped boost GS prices across all tenors. Reflecting this was the
sustained decline in yield. The steepest drop in yield was recorded
for GS with remaining maturity of less than 2 years. However,
Graph 3.12Development of Money Multiplier
Graph 3.13
JCI and Net Foreign Purchase Q IV-2006
Graph 3.14
Government Bond Trading Activities
1.0
1.5
2.0
2.5
3.0
3.5
4.0
4.5
5.0
5.5
6.0
6.5
7.0
7.5
1 3 5 7 9 11 1 3 5 7 9 11 1 3 5 7 9 11 1 3 5 7 9 11 1 3 5 7 9 112002 2003 2004 2005 2006
1.001.051.101.151.201.251.301.351.401.451.501.551.601.651.701.75
MM2 (M2/M0) MM1 (M1/M0)
M1/M0M2/M0
0
20
40
60
80
100
120
Trillion Rp
0
1000
2000
3000
4000
5000
6000Freq
Vol Freq
2005 2006Jan Feb Mar Apr Mei Jun Jul Ags Sep Okt Nov Des Jan Feb Mar Apr Mei Jun Jul Ags Sep Okt Nov Des Jan
-250
-50
150
350
550
750
950
1,150
1,350
1,550
1,750
Oct-06 Nov-06 Dec-061500
1600
1700
1800
Buying
Selling
JCI
Net Buying/Selling (Rp Bill) JCI
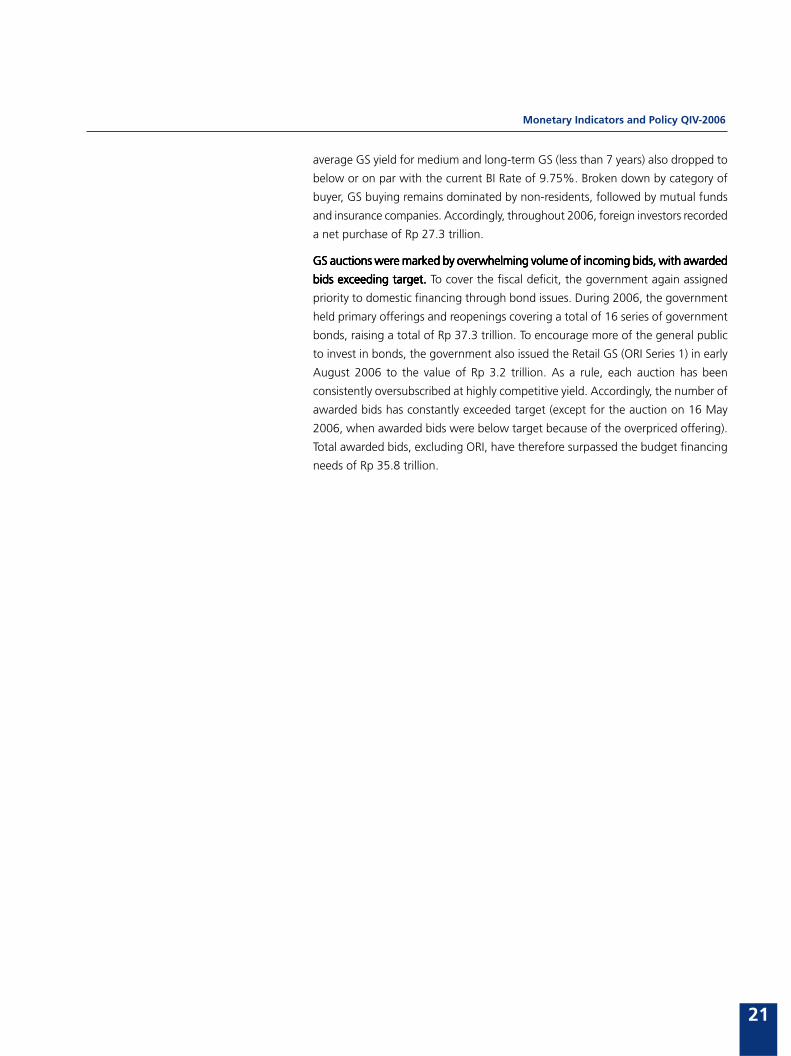
21
Monetary Indicators and Policy QIV-2006
average GS yield for medium and long-term GS (less than 7 years) also dropped to
below or on par with the current BI Rate of 9.75%. Broken down by category of
buyer, GS buying remains dominated by non-residents, followed by mutual funds
and insurance companies. Accordingly, throughout 2006, foreign investors recorded
a net purchase of Rp 27.3 trillion.
GS auctions were marked by overwhelming volume of incoming bids, with awardedGS auctions were marked by overwhelming volume of incoming bids, with awardedGS auctions were marked by overwhelming volume of incoming bids, with awardedGS auctions were marked by overwhelming volume of incoming bids, with awardedGS auctions were marked by overwhelming volume of incoming bids, with awarded
bids exceeding target.bids exceeding target.bids exceeding target.bids exceeding target.bids exceeding target. To cover the fiscal deficit, the government again assigned
priority to domestic financing through bond issues. During 2006, the government
held primary offerings and reopenings covering a total of 16 series of government
bonds, raising a total of Rp 37.3 trillion. To encourage more of the general public
to invest in bonds, the government also issued the Retail GS (ORI Series 1) in early
August 2006 to the value of Rp 3.2 trillion. As a rule, each auction has been
consistently oversubscribed at highly competitive yield. Accordingly, the number of
awarded bids has constantly exceeded target (except for the auction on 16 May
2006, when awarded bids were below target because of the overpriced offering).
Total awarded bids, excluding ORI, have therefore surpassed the budget financing
needs of Rp 35.8 trillion.
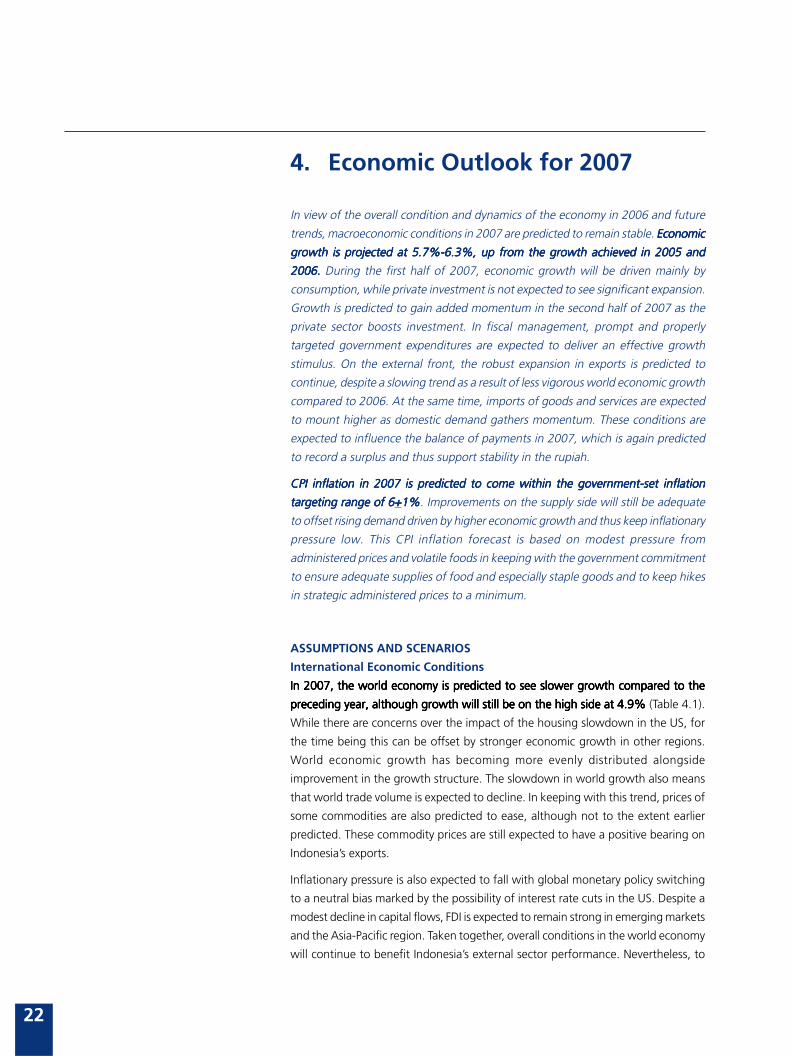
22
Monetary Policy Report - Quarter IV 2006
4. Economic Outlook for 2007
In view of the overall condition and dynamics of the economy in 2006 and future
trends, macroeconomic conditions in 2007 are predicted to remain stable. EconomicEconomicEconomicEconomicEconomic
growth is projected at 5.7%-6.3%, up from the growth achieved in 2005 andgrowth is projected at 5.7%-6.3%, up from the growth achieved in 2005 andgrowth is projected at 5.7%-6.3%, up from the growth achieved in 2005 andgrowth is projected at 5.7%-6.3%, up from the growth achieved in 2005 andgrowth is projected at 5.7%-6.3%, up from the growth achieved in 2005 and
2006.2006.2006.2006.2006. During the first half of 2007, economic growth will be driven mainly by
consumption, while private investment is not expected to see significant expansion.
Growth is predicted to gain added momentum in the second half of 2007 as the
private sector boosts investment. In fiscal management, prompt and properly
targeted government expenditures are expected to deliver an effective growth
stimulus. On the external front, the robust expansion in exports is predicted to
continue, despite a slowing trend as a result of less vigorous world economic growth
compared to 2006. At the same time, imports of goods and services are expected
to mount higher as domestic demand gathers momentum. These conditions are
expected to influence the balance of payments in 2007, which is again predicted
to record a surplus and thus support stability in the rupiah.
CPI inflation in 2007 is predicted to come within the government-set inflationCPI inflation in 2007 is predicted to come within the government-set inflationCPI inflation in 2007 is predicted to come within the government-set inflationCPI inflation in 2007 is predicted to come within the government-set inflationCPI inflation in 2007 is predicted to come within the government-set inflation
targeting range of 6targeting range of 6targeting range of 6targeting range of 6targeting range of 6+++++1%1%1%1%1%. Improvements on the supply side will still be adequate
to offset rising demand driven by higher economic growth and thus keep inflationary
pressure low. This CPI inflation forecast is based on modest pressure from
administered prices and volatile foods in keeping with the government commitment
to ensure adequate supplies of food and especially staple goods and to keep hikes
in strategic administered prices to a minimum.
ASSUMPTIONS AND SCENARIOS
International Economic Conditions
In 2007, the world economy is predicted to see slower growth compared to theIn 2007, the world economy is predicted to see slower growth compared to theIn 2007, the world economy is predicted to see slower growth compared to theIn 2007, the world economy is predicted to see slower growth compared to theIn 2007, the world economy is predicted to see slower growth compared to the
preceding year, although growth will still be on the high side at 4.9%preceding year, although growth will still be on the high side at 4.9%preceding year, although growth will still be on the high side at 4.9%preceding year, although growth will still be on the high side at 4.9%preceding year, although growth will still be on the high side at 4.9% (Table 4.1).
While there are concerns over the impact of the housing slowdown in the US, for
the time being this can be offset by stronger economic growth in other regions.
World economic growth has becoming more evenly distributed alongside
improvement in the growth structure. The slowdown in world growth also means
that world trade volume is expected to decline. In keeping with this trend, prices of
some commodities are also predicted to ease, although not to the extent earlier
predicted. These commodity prices are still expected to have a positive bearing on
Indonesia»s exports.
Inflationary pressure is also expected to fall with global monetary policy switching
to a neutral bias marked by the possibility of interest rate cuts in the US. Despite a
modest decline in capital flows, FDI is expected to remain strong in emerging markets
and the Asia-Pacific region. Taken together, overall conditions in the world economy
will continue to benefit Indonesia»s external sector performance. Nevertheless, to
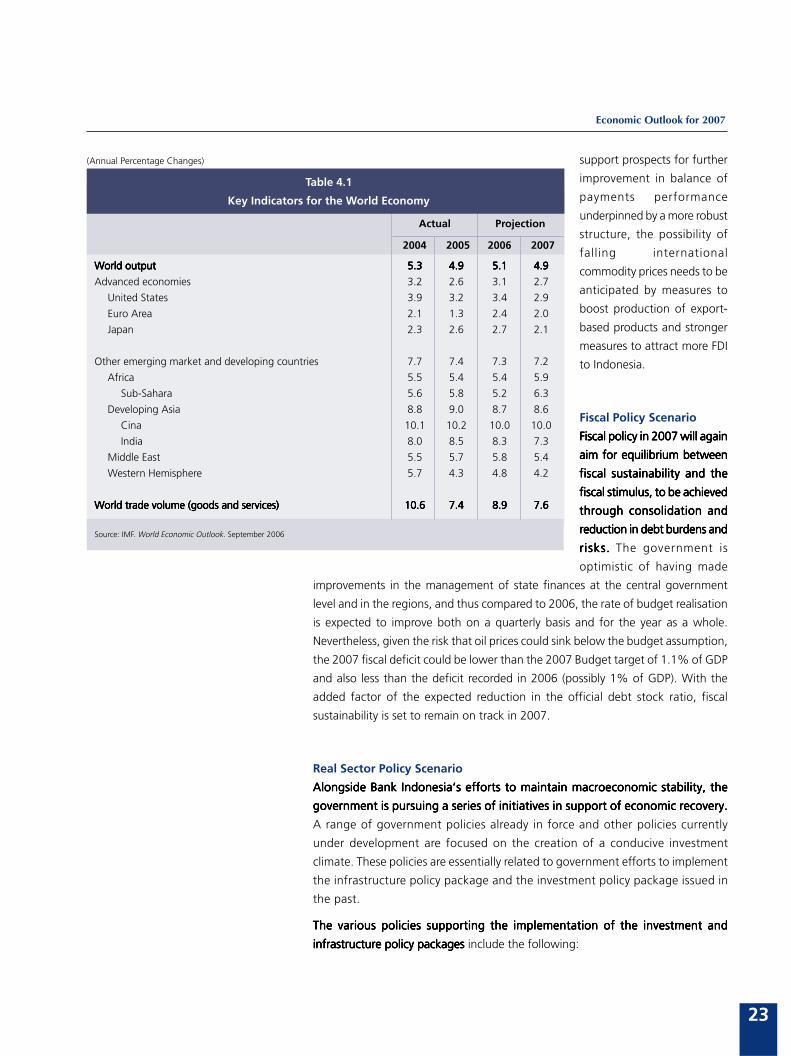
23
Economic Outlook for 2007
support prospects for further
improvement in balance of
payments performance
underpinned by a more robust
structure, the possibility of
falling international
commodity prices needs to be
anticipated by measures to
boost production of export-
based products and stronger
measures to attract more FDI
to Indonesia.
Fiscal Policy Scenario
Fiscal policy in 2007 will againFiscal policy in 2007 will againFiscal policy in 2007 will againFiscal policy in 2007 will againFiscal policy in 2007 will again
aim for equilibrium betweenaim for equilibrium betweenaim for equilibrium betweenaim for equilibrium betweenaim for equilibrium between
fiscal sustainability and thefiscal sustainability and thefiscal sustainability and thefiscal sustainability and thefiscal sustainability and the
fiscal stimulus, to be achievedfiscal stimulus, to be achievedfiscal stimulus, to be achievedfiscal stimulus, to be achievedfiscal stimulus, to be achieved
through consolidation andthrough consolidation andthrough consolidation andthrough consolidation andthrough consolidation and
reduction in debt burdens andreduction in debt burdens andreduction in debt burdens andreduction in debt burdens andreduction in debt burdens and
risks.risks.risks.risks.risks. The government is
optimistic of having made
improvements in the management of state finances at the central government
level and in the regions, and thus compared to 2006, the rate of budget realisation
is expected to improve both on a quarterly basis and for the year as a whole.
Nevertheless, given the risk that oil prices could sink below the budget assumption,
the 2007 fiscal deficit could be lower than the 2007 Budget target of 1.1% of GDP
and also less than the deficit recorded in 2006 (possibly 1% of GDP). With the
added factor of the expected reduction in the official debt stock ratio, fiscal
sustainability is set to remain on track in 2007.
Real Sector Policy Scenario
Alongside Bank Indonesia»s efforts to maintain macroeconomic stability, theAlongside Bank Indonesia»s efforts to maintain macroeconomic stability, theAlongside Bank Indonesia»s efforts to maintain macroeconomic stability, theAlongside Bank Indonesia»s efforts to maintain macroeconomic stability, theAlongside Bank Indonesia»s efforts to maintain macroeconomic stability, the
government is pursuing a series of initiatives in support of economic recovery.government is pursuing a series of initiatives in support of economic recovery.government is pursuing a series of initiatives in support of economic recovery.government is pursuing a series of initiatives in support of economic recovery.government is pursuing a series of initiatives in support of economic recovery.
A range of government policies already in force and other policies currently
under development are focused on the creation of a conducive investment
climate. These policies are essentially related to government efforts to implement
the infrastructure policy package and the investment policy package issued in
the past.
The various policies supporting the implementation of the investment andThe various policies supporting the implementation of the investment andThe various policies supporting the implementation of the investment andThe various policies supporting the implementation of the investment andThe various policies supporting the implementation of the investment and
infrastructure policy packagesinfrastructure policy packagesinfrastructure policy packagesinfrastructure policy packagesinfrastructure policy packages include the following:
2004 2005 2006 2007
Actual Projection
World outputWorld outputWorld outputWorld outputWorld output 5.35.35.35.35.3 4.94.94.94.94.9 5.15.15.15.15.1 4.94.94.94.94.9
Advanced economies 3.2 2.6 3.1 2.7
United States 3.9 3.2 3.4 2.9
Euro Area 2.1 1.3 2.4 2.0
Japan 2.3 2.6 2.7 2.1
Other emerging market and developing countries 7.7 7.4 7.3 7.2
Africa 5.5 5.4 5.4 5.9
Sub-Sahara 5.6 5.8 5.2 6.3
Developing Asia 8.8 9.0 8.7 8.6
Cina 10.1 10.2 10.0 10.0
India 8.0 8.5 8.3 7.3
Middle East 5.5 5.7 5.8 5.4
Western Hemisphere 5.7 4.3 4.8 4.2
World trade volume (goods and services)World trade volume (goods and services)World trade volume (goods and services)World trade volume (goods and services)World trade volume (goods and services) 10.610.610.610.610.6 7.47.47.47.47.4 8.98.98.98.98.9 7.67.67.67.67.6
Source: IMF. World Economic Outlook. September 2006
Table 4.1
Key Indicators for the World Economy
(Annual Percentage Changes)
24
Monetary Policy Report - Quarter IV 2006
• Government equity participation in non-SOE companies operating in infrastructure.Government equity participation in non-SOE companies operating in infrastructure.Government equity participation in non-SOE companies operating in infrastructure.Government equity participation in non-SOE companies operating in infrastructure.Government equity participation in non-SOE companies operating in infrastructure.
This policy is related to the government plan for urgent implementation of Act
No. 1 of 2004 concerning the State Treasury, which permits the government to
invest state funds in entities other than SOEs. Government equity in non-SOE
entities will be invested under almost the same mechanism as the Investment
Funds Account policy. State funds invested in non-SOE entities have not so far
been included in the 2007 State Budget, but the instruments and supporting
policies are targeted for completion in 2007 to enable this form of investment to
proceed. The Law on the State Treasury allows the government a free hand to
engage in long-term investments other than government equity in SOEs.
• Concerning the institutional framework, the government has established twoestablished twoestablished twoestablished twoestablished two
new agencies, the Directorate of Investment Funds Management and the Risknew agencies, the Directorate of Investment Funds Management and the Risknew agencies, the Directorate of Investment Funds Management and the Risknew agencies, the Directorate of Investment Funds Management and the Risknew agencies, the Directorate of Investment Funds Management and the Risk
Management Unit, Management Unit, Management Unit, Management Unit, Management Unit, which also manages investment risk. This policy has been
pursued to strengthen the public-private partnership. Thus if the government
wishes to invest capital in a venture or project, there is an agency that makes
the necessary calculations to prevent and overcome risk of project failure. The
investment funds will be allocated to various designated vehicles, such as the
infrastructure fund and green fund. The Public Services Agency in charge of
land expropriation funds serves as one legal umbrella. Once all instruments are
in place, the government will invest on the capital market or in other forms of
capital investment.
• Enforcement of Presidential Decree No. 80 of 2003 concerning Guidelines forEnforcement of Presidential Decree No. 80 of 2003 concerning Guidelines forEnforcement of Presidential Decree No. 80 of 2003 concerning Guidelines forEnforcement of Presidential Decree No. 80 of 2003 concerning Guidelines forEnforcement of Presidential Decree No. 80 of 2003 concerning Guidelines for
Government Procurement of Goods and ServicesGovernment Procurement of Goods and ServicesGovernment Procurement of Goods and ServicesGovernment Procurement of Goods and ServicesGovernment Procurement of Goods and Services, which requires investors to
use local components in all government projects. Commencing in early 2007,
all government agencies will be required to comply with rules prioritising the
use of local components, following the issuance of Decree of the Minister of
Industry No. 11/M-IND/PER/3/2006 concerning Technical Guidelines for Use of
Domestic Products, which comprises instructions for implementation of the
Presidential Decree. The use of local components will ensure that average national
manufacturing growth of 8.5% in the 2005-2009 period will be achieved.
• A Government Regulation has been issued stipulating that government unitsA Government Regulation has been issued stipulating that government unitsA Government Regulation has been issued stipulating that government unitsA Government Regulation has been issued stipulating that government unitsA Government Regulation has been issued stipulating that government units
not holding certificates are permitted to draw on budget fundsnot holding certificates are permitted to draw on budget fundsnot holding certificates are permitted to draw on budget fundsnot holding certificates are permitted to draw on budget fundsnot holding certificates are permitted to draw on budget funds. With this ruling,
the project tender process in 2007 is expected to be free of delays.
• Establishment of business clustersEstablishment of business clustersEstablishment of business clustersEstablishment of business clustersEstablishment of business clusters for improvement of product quality and access
to the local and export markets.
• The government is encouraging the reutilisation of dormant footwear plantsreutilisation of dormant footwear plantsreutilisation of dormant footwear plantsreutilisation of dormant footwear plantsreutilisation of dormant footwear plants in
order to expedite the investment realisation process.
• Establishment of the Taiwanese Investment DeskEstablishment of the Taiwanese Investment DeskEstablishment of the Taiwanese Investment DeskEstablishment of the Taiwanese Investment DeskEstablishment of the Taiwanese Investment Desk and provision of an investment
tax allowance or investment rebate of 30% to be refunded over six years, or
alternatively a 5% reduction on tax each year as an incentive for investment
from Taiwan.
25
Economic Outlook for 2007
On the sectoral level, various government policies in 2007 will remain focused on
enhancing efficiency and productivity. In the industry and trade sectors, In the industry and trade sectors, In the industry and trade sectors, In the industry and trade sectors, In the industry and trade sectors, government
is expected to launch more policies/incentives aimed at boosting industry
performance in 2007, including VAT exemptions for primary commodities and an
amendment to Government Regulation No. 148/2000. In the agricultural sectorIn the agricultural sectorIn the agricultural sectorIn the agricultural sectorIn the agricultural sector,
the government will support efforts to improve rice cultivation through provision
of seeds at prices discounted up to 75% of normal, seedling subsidies for 8.2
million hectares of arable land, improvements in irrigation channels and other
support. These actions are expected to raise productivity from the current average
of 4.5 tons per hectare. In the mining sectorIn the mining sectorIn the mining sectorIn the mining sectorIn the mining sector, Act No. 13 of 1967 concerning Mining
will be amended in early 2007 by the Draft Law on Mining of Minerals and Coal.
The government and Parliament have reached agreement on the difficult areas of
the draft, such as contracts with investors to be made by legal entities yet to be
established.
In labour relationsIn labour relationsIn labour relationsIn labour relationsIn labour relations, the government will move ahead with efforts to amend the
Labour Law. The amendment will be made through the harmonisation of three
legal products: the Laws on Worker Social Security (Jamsostek), National Social
Security System and Labour. The harmonisation will begin in January 2007 with the
amendment to Act No. 3 of 1993 concerning Worker Social Security and Act No.
40 of 2004 concerning the National Social Security System and will be followed by
amendment to Act No. 13 of 2003 concerning Labour. In the case of the Labour
Law, the amendment will be agreed in a tripartite forum, particularly in regard to
severance pay and pensions. Harmonisation of the three laws is targeted for
completion in 2007, and this is expected to encourage more labour-intensive
investments.
OUTLOOK FOR ECONOMIC GROWTH
Economic activity is expected to gather fresh momentum in 2007, following a yearEconomic activity is expected to gather fresh momentum in 2007, following a yearEconomic activity is expected to gather fresh momentum in 2007, following a yearEconomic activity is expected to gather fresh momentum in 2007, following a yearEconomic activity is expected to gather fresh momentum in 2007, following a year
of weak public purchasing power in 2006.of weak public purchasing power in 2006.of weak public purchasing power in 2006.of weak public purchasing power in 2006.of weak public purchasing power in 2006. In the first half of 2007, the primary
engine of economic activity will be private consumption. Investment, on the other
hand, is predicted to remain low. Improvement in purchasing power from increases
in civil servant salaries and Provincial Minimum Wages is expected to boost private
consumption. Even stronger economic activity is forecasted for the second half of
2007, buoyed by significant widening of investment. In addition to improved
realisation of government capital expenditures, strong growth is predicted in private
investment. Private investors are expected to acquire stronger expectations of the
outlook for future growth in economic activity. These expectations alongside the
downward trend in bank interest rates will provide more room for private investors
to realise their investments in 2007. Externally, slowing world demand is predicted
to lead to reduced growth in exports of goods and services, while imports of goods
and services will in fact mount in response to increased economic activity. Analysed
by sector, the improvement in domestic economic activity will be buoyed by high
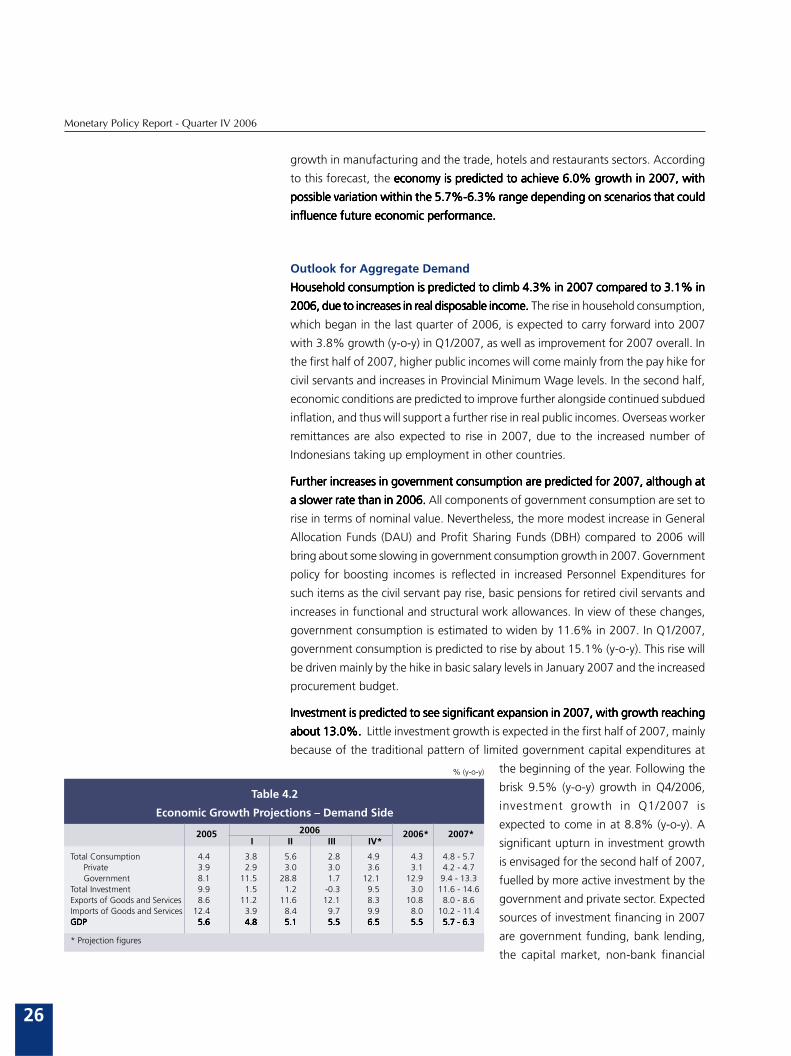
26
Monetary Policy Report - Quarter IV 2006
growth in manufacturing and the trade, hotels and restaurants sectors. According
to this forecast, the economy is predicted to achieve 6.0% growth in 2007, witheconomy is predicted to achieve 6.0% growth in 2007, witheconomy is predicted to achieve 6.0% growth in 2007, witheconomy is predicted to achieve 6.0% growth in 2007, witheconomy is predicted to achieve 6.0% growth in 2007, with
possible variation within the 5.7%-6.3% range depending on scenarios that couldpossible variation within the 5.7%-6.3% range depending on scenarios that couldpossible variation within the 5.7%-6.3% range depending on scenarios that couldpossible variation within the 5.7%-6.3% range depending on scenarios that couldpossible variation within the 5.7%-6.3% range depending on scenarios that could
influence future economic performance.influence future economic performance.influence future economic performance.influence future economic performance.influence future economic performance.
Outlook for Aggregate Demand
Household consumption is predicted to climb 4.3% in 2007 compared to 3.1% inHousehold consumption is predicted to climb 4.3% in 2007 compared to 3.1% inHousehold consumption is predicted to climb 4.3% in 2007 compared to 3.1% inHousehold consumption is predicted to climb 4.3% in 2007 compared to 3.1% inHousehold consumption is predicted to climb 4.3% in 2007 compared to 3.1% in
2006, due to increases in real disposable income.2006, due to increases in real disposable income.2006, due to increases in real disposable income.2006, due to increases in real disposable income.2006, due to increases in real disposable income. The rise in household consumption,
which began in the last quarter of 2006, is expected to carry forward into 2007
with 3.8% growth (y-o-y) in Q1/2007, as well as improvement for 2007 overall. In
the first half of 2007, higher public incomes will come mainly from the pay hike for
civil servants and increases in Provincial Minimum Wage levels. In the second half,
economic conditions are predicted to improve further alongside continued subdued
inflation, and thus will support a further rise in real public incomes. Overseas worker
remittances are also expected to rise in 2007, due to the increased number of
Indonesians taking up employment in other countries.
Further increases in government consumption are predicted for 2007, although atFurther increases in government consumption are predicted for 2007, although atFurther increases in government consumption are predicted for 2007, although atFurther increases in government consumption are predicted for 2007, although atFurther increases in government consumption are predicted for 2007, although at
a slower rate than in 2006.a slower rate than in 2006.a slower rate than in 2006.a slower rate than in 2006.a slower rate than in 2006. All components of government consumption are set to
rise in terms of nominal value. Nevertheless, the more modest increase in General
Allocation Funds (DAU) and Profit Sharing Funds (DBH) compared to 2006 will
bring about some slowing in government consumption growth in 2007. Government
policy for boosting incomes is reflected in increased Personnel Expenditures for
such items as the civil servant pay rise, basic pensions for retired civil servants and
increases in functional and structural work allowances. In view of these changes,
government consumption is estimated to widen by 11.6% in 2007. In Q1/2007,
government consumption is predicted to rise by about 15.1% (y-o-y). This rise will
be driven mainly by the hike in basic salary levels in January 2007 and the increased
procurement budget.
Investment is predicted to see significant expansion in 2007, with growth reachingInvestment is predicted to see significant expansion in 2007, with growth reachingInvestment is predicted to see significant expansion in 2007, with growth reachingInvestment is predicted to see significant expansion in 2007, with growth reachingInvestment is predicted to see significant expansion in 2007, with growth reaching
about 13.0%. about 13.0%. about 13.0%. about 13.0%. about 13.0%. Little investment growth is expected in the first half of 2007, mainly
because of the traditional pattern of limited government capital expenditures at
the beginning of the year. Following the
brisk 9.5% (y-o-y) growth in Q4/2006,
investment growth in Q1/2007 is
expected to come in at 8.8% (y-o-y). A
significant upturn in investment growth
is envisaged for the second half of 2007,
fuelled by more active investment by the
government and private sector. Expected
sources of investment financing in 2007
are government funding, bank lending,
the capital market, non-bank financial
2005 2006* 2007*
% (y-o-y)
Table 4.2
Economic Growth Projections √ Demand Side
2006 I II III IV*
Total Consumption 4.4 3.8 5.6 2.8 4.9 4.3 4.8 - 5.7Private 3.9 2.9 3.0 3.0 3.6 3.1 4.2 - 4.7Government 8.1 11.5 28.8 1.7 12.1 12.9 9.4 - 13.3
Total Investment 9.9 1.5 1.2 -0.3 9.5 3.0 11.6 - 14.6Exports of Goods and Services 8.6 11.2 11.6 12.1 8.3 10.8 8.0 - 8.6Imports of Goods and Services 12.4 3.9 8.4 9.7 9.9 8.0 10.2 - 11.4GDPGDPGDPGDPGDP 5.65.65.65.65.6 4.84.84.84.84.8 5.15.15.15.15.1 5.55.55.55.55.5 6.56.56.56.56.5 5.55.55.55.55.5 5.7 - 6.35.7 - 6.35.7 - 6.35.7 - 6.35.7 - 6.3
* Projection figures
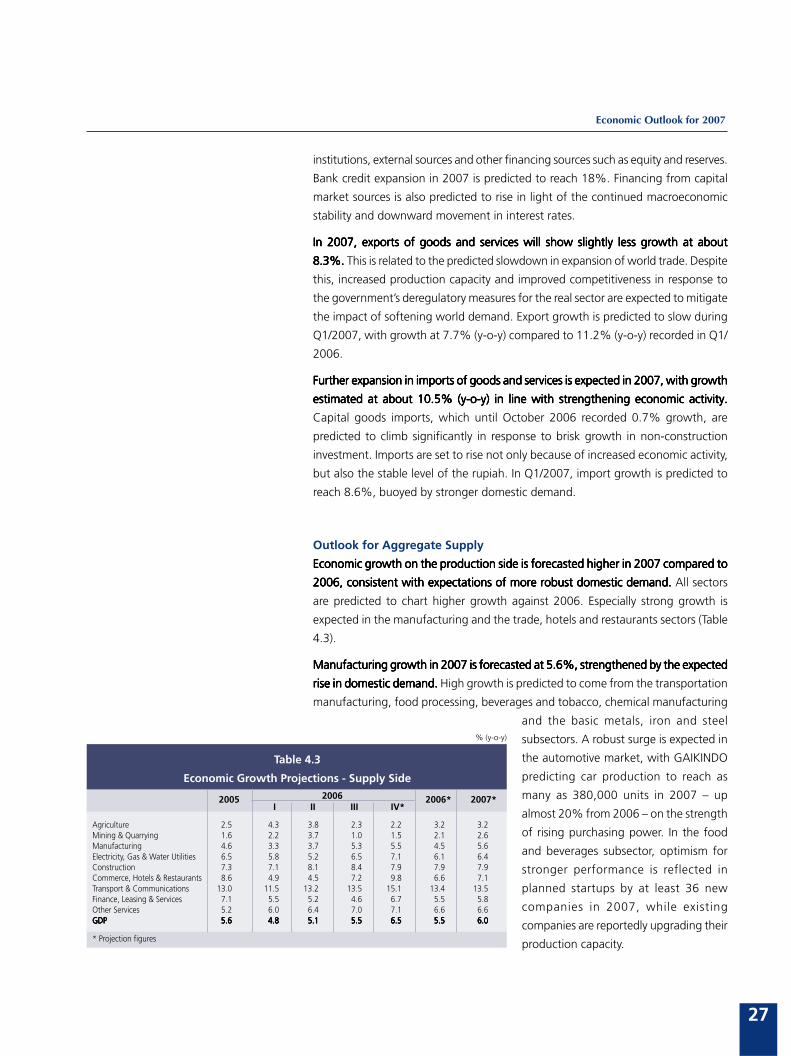
27
Economic Outlook for 2007
institutions, external sources and other financing sources such as equity and reserves.
Bank credit expansion in 2007 is predicted to reach 18%. Financing from capital
market sources is also predicted to rise in light of the continued macroeconomic
stability and downward movement in interest rates.
In 2007, exports of goods and services will show slightly less growth at aboutIn 2007, exports of goods and services will show slightly less growth at aboutIn 2007, exports of goods and services will show slightly less growth at aboutIn 2007, exports of goods and services will show slightly less growth at aboutIn 2007, exports of goods and services will show slightly less growth at about
8.3%.8.3%.8.3%.8.3%.8.3%. This is related to the predicted slowdown in expansion of world trade. Despite
this, increased production capacity and improved competitiveness in response to
the government»s deregulatory measures for the real sector are expected to mitigate
the impact of softening world demand. Export growth is predicted to slow during
Q1/2007, with growth at 7.7% (y-o-y) compared to 11.2% (y-o-y) recorded in Q1/
2006.
Further expansion in imports of goods and services is expected in 2007, with growthFurther expansion in imports of goods and services is expected in 2007, with growthFurther expansion in imports of goods and services is expected in 2007, with growthFurther expansion in imports of goods and services is expected in 2007, with growthFurther expansion in imports of goods and services is expected in 2007, with growth
estimated at about 10.5% (y-o-y) in line with strengthening economic activity.estimated at about 10.5% (y-o-y) in line with strengthening economic activity.estimated at about 10.5% (y-o-y) in line with strengthening economic activity.estimated at about 10.5% (y-o-y) in line with strengthening economic activity.estimated at about 10.5% (y-o-y) in line with strengthening economic activity.
Capital goods imports, which until October 2006 recorded 0.7% growth, are
predicted to climb significantly in response to brisk growth in non-construction
investment. Imports are set to rise not only because of increased economic activity,
but also the stable level of the rupiah. In Q1/2007, import growth is predicted to
reach 8.6%, buoyed by stronger domestic demand.
Outlook for Aggregate Supply
Economic growth on the production side is forecasted higher in 2007 compared toEconomic growth on the production side is forecasted higher in 2007 compared toEconomic growth on the production side is forecasted higher in 2007 compared toEconomic growth on the production side is forecasted higher in 2007 compared toEconomic growth on the production side is forecasted higher in 2007 compared to
2006, consistent with expectations of more robust domestic demand.2006, consistent with expectations of more robust domestic demand.2006, consistent with expectations of more robust domestic demand.2006, consistent with expectations of more robust domestic demand.2006, consistent with expectations of more robust domestic demand. All sectors
are predicted to chart higher growth against 2006. Especially strong growth is
expected in the manufacturing and the trade, hotels and restaurants sectors (Table
4.3).
Manufacturing growth in 2007 is forecasted at 5.6%, strengthened by the expectedManufacturing growth in 2007 is forecasted at 5.6%, strengthened by the expectedManufacturing growth in 2007 is forecasted at 5.6%, strengthened by the expectedManufacturing growth in 2007 is forecasted at 5.6%, strengthened by the expectedManufacturing growth in 2007 is forecasted at 5.6%, strengthened by the expected
rise in domestic demand.rise in domestic demand.rise in domestic demand.rise in domestic demand.rise in domestic demand. High growth is predicted to come from the transportation
manufacturing, food processing, beverages and tobacco, chemical manufacturing
and the basic metals, iron and steel
subsectors. A robust surge is expected in
the automotive market, with GAIKINDO
predicting car production to reach as
many as 380,000 units in 2007 √ up
almost 20% from 2006 √ on the strength
of rising purchasing power. In the food
and beverages subsector, optimism for
stronger performance is reflected in
planned startups by at least 36 new
companies in 2007, while existing
companies are reportedly upgrading their
production capacity.
2005 2006* 2007*
% (y-o-y)
Table 4.3
Economic Growth Projections - Supply Side
2006 I II III IV*
Agriculture 2.5 4.3 3.8 2.3 2.2 3.2 3.2Mining & Quarrying 1.6 2.2 3.7 1.0 1.5 2.1 2.6Manufacturing 4.6 3.3 3.7 5.3 5.5 4.5 5.6Electricity, Gas & Water Utilities 6.5 5.8 5.2 6.5 7.1 6.1 6.4Construction 7.3 7.1 8.1 8.4 7.9 7.9 7.9Commerce, Hotels & Restaurants 8.6 4.9 4.5 7.2 9.8 6.6 7.1Transport & Communications 13.0 11.5 13.2 13.5 15.1 13.4 13.5Finance, Leasing & Services 7.1 5.5 5.2 4.6 6.7 5.5 5.8Other Services 5.2 6.0 6.4 7.0 7.1 6.6 6.6GDPGDPGDPGDPGDP 5.65.65.65.65.6 4.84.84.84.84.8 5.15.15.15.15.1 5.55.55.55.55.5 6.56.56.56.56.5 5.55.55.55.55.5 6.06.06.06.06.0
* Projection figures
28
Monetary Policy Report - Quarter IV 2006
Stronger domestic demand is also expected to spur growth in the chemicals andStronger domestic demand is also expected to spur growth in the chemicals andStronger domestic demand is also expected to spur growth in the chemicals andStronger domestic demand is also expected to spur growth in the chemicals andStronger domestic demand is also expected to spur growth in the chemicals and
steel industries.steel industries.steel industries.steel industries.steel industries. Key to the higher growth are plans for substantial expansion in
production capacity in 2007. Higher steel production will also be driven by world
demand, with demand in India and China predicted to rise by 5%. In the textiles
and textile products subsector, more robust growth will be supported by the
government-sponsored machinery restructuring programme in which companies
purchasing new machines will benefit from an interest subsidy. The allocation for
this subsidy in the 2007 State Budget is Rp 285 billion, an amount slated for regular
increases in future years. Stronger performance in the manufacturing sector will be
supported by the government amendment of Government Regulation No. 148 of
2000, which offers tax incentives for 15 business sectors. These tax incentives are
expected to promote stronger growth in the industrial sector.
Growth in the trade, hotels and restaurants sector is forecasted to surpass theGrowth in the trade, hotels and restaurants sector is forecasted to surpass theGrowth in the trade, hotels and restaurants sector is forecasted to surpass theGrowth in the trade, hotels and restaurants sector is forecasted to surpass theGrowth in the trade, hotels and restaurants sector is forecasted to surpass the
7.1% recorded in the past year.7.1% recorded in the past year.7.1% recorded in the past year.7.1% recorded in the past year.7.1% recorded in the past year. While retail business will benefit from stronger
demand, prospects in 2007 are also brighter because of lower interest rates.
The hotels and restaurants subsector is also expected to perform better due
to the improved image of tourism in Indonesia and various government-
sponsored promotions. In 2007, Indonesia will host the PATA (Pacific Asia
Travel Association) Mart, which will support efforts to rebuild the number of
international tourists visiting Indonesia. In 2007, the government has set a
target of 6 million foreign tourist arrivals, up about 20% from 2006. Domestic
tourism is also targeted at 190 million journeys, ahead of the estimated 180
million in 2006.
The agricultural sector is predicted to grow by about 3.2%.The agricultural sector is predicted to grow by about 3.2%.The agricultural sector is predicted to grow by about 3.2%.The agricultural sector is predicted to grow by about 3.2%.The agricultural sector is predicted to grow by about 3.2%. Key to higher agricultural
production will be the foodstuffs subsector, and particularly the rice crop. The Ministry
of Agriculture targets national rice production at 56.47 million tons in 2007 on a
total planted area estimated at 12.7 million hectares. This rice production target is
also higher than the 2006 rice output recorded at 54.66 million tons (ARAM III). To
boost production, the government will support rice cultivation through provision
of such items as low-rice seeds, seedling subsidies for 8.2 million hectares and
repairs to irrigation channels. High growth is also predicted for the estates subsector,
which will benefit from the government commitment to a Rp 1 trillion interest
subsidy for smallholder farmers applying to banks for loans for biofuel development
and revitalisation of estates.
The transport and communications sector in 2007 will again chart high growth atThe transport and communications sector in 2007 will again chart high growth atThe transport and communications sector in 2007 will again chart high growth atThe transport and communications sector in 2007 will again chart high growth atThe transport and communications sector in 2007 will again chart high growth at
13.5%. 13.5%. 13.5%. 13.5%. 13.5%. Mounting activity in manufacturing and trade will in turn boost activity in
cargo and freight. At the same time, the communications subsector will see another
year of vigorous growth spurred by the rapid pace of technological developments
and various innovations in communications. PT Telkom √ Indonesia»s largest
communications operator √ will invest Rp 17 trillion in capital expenditures during
2007. This investment will be used to expand investment in the cellular business,
wireless fixed-line phones and other telecommunications infrastructure.
29
Economic Outlook for 2007
The mining sector will see an estimated 2.6% growth, up from the previous year.The mining sector will see an estimated 2.6% growth, up from the previous year.The mining sector will see an estimated 2.6% growth, up from the previous year.The mining sector will see an estimated 2.6% growth, up from the previous year.The mining sector will see an estimated 2.6% growth, up from the previous year.
Higher growth in this sector will be supported by increased production in the non-
oil and gas mining subsector, including coal. The Indonesian Coal Society predicts
continued high demand in the coming year. Increased demand within Indonesia
will come from the accelerated completion of the 10,000 MW coal-fired power
plant. On the export market, demand will be spurred by the Central Electricity
Authority of India construction of a 42,000-47,000 MW coal-fired power plant in
2007-2012. Also boosting growth in the mining sector will be the government
programme for accelerated development of 11 mining projects currently held up
by forestry regulations (oil and gas drilling). The overall investment value of these
projects is estimated at US$9 billion.
The construction sector is predicted to grow by a robust 7.9% in 2007.The construction sector is predicted to grow by a robust 7.9% in 2007.The construction sector is predicted to grow by a robust 7.9% in 2007.The construction sector is predicted to grow by a robust 7.9% in 2007.The construction sector is predicted to grow by a robust 7.9% in 2007. The
downward trend in interest rates since the middle of the year is also seen likely to
boost activity in construction. Further impetus for growth in construction during
2007 will come from the government incentives offered through the Indonesia
Infrastructure Fund. At this time, the Ministry of Public Works has set aside Rp 2
trillion in incentive funds for infrastructure projects that include the development
of roads, water utilities and housing through to 2009.
Financial sector growth in 2007 is predicted at 5.8%, up from 5.5% in 2006.Financial sector growth in 2007 is predicted at 5.8%, up from 5.5% in 2006.Financial sector growth in 2007 is predicted at 5.8%, up from 5.5% in 2006.Financial sector growth in 2007 is predicted at 5.8%, up from 5.5% in 2006.Financial sector growth in 2007 is predicted at 5.8%, up from 5.5% in 2006. An
increased net interest margin is expected in the bank subsector, boosted by the
steeper downward trend in deposit rates compared to lending rates. Banks are also
expected to see stronger credit expansion fuelled by a new upturn in economic
activity. In addition, falling interest rates and mounting economic activity will also
boost performance in the non-bank financial institutions subsector, consisting mainly
of consumer finance and leasing companies.
INFLATION FORECAST
CPI inflation in 2007 is predicted to come within the government-set inflationCPI inflation in 2007 is predicted to come within the government-set inflationCPI inflation in 2007 is predicted to come within the government-set inflationCPI inflation in 2007 is predicted to come within the government-set inflationCPI inflation in 2007 is predicted to come within the government-set inflation
targeting range of 6targeting range of 6targeting range of 6targeting range of 6targeting range of 6+++++1%. 1%. 1%. 1%. 1%. Improvements on the supply side will still be adequate to
offset rising demand driven by higher economic growth and thus keep inflationary
pressure low. This CPI inflation forecast for 2007 is based on modest pressure from
administered prices and volatile foods in keeping with the government commitment
to ensure adequate supplies of food and especially staple goods and to keep hikes
in strategic administered prices to a minimum.
Public expectations of inflation are likely to rise, consistent with the improvingPublic expectations of inflation are likely to rise, consistent with the improvingPublic expectations of inflation are likely to rise, consistent with the improvingPublic expectations of inflation are likely to rise, consistent with the improvingPublic expectations of inflation are likely to rise, consistent with the improving
economic outlookeconomic outlookeconomic outlookeconomic outlookeconomic outlook (Graph 4.1). Driving higher expectations of inflation will be greater
expectations of depreciation in the rupiah and gains in public purchasing power.
Improvement in public incomes will come from such actions as the average 15%
increase in the provincial minimum wage and civil servant salaries and the forecasted
investment growth that is expected to create more jobs. This in turn will encourage
more to plan on increased consumption in the future and ultimately lead to rising
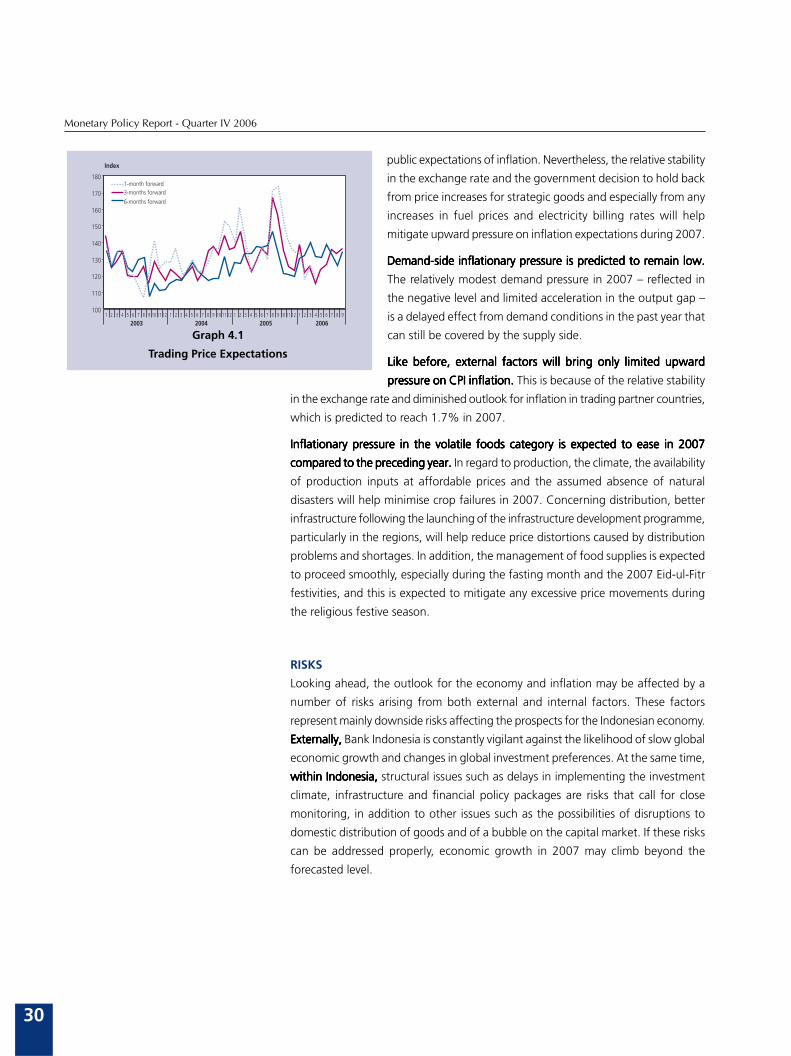
30
Monetary Policy Report - Quarter IV 2006
public expectations of inflation. Nevertheless, the relative stability
in the exchange rate and the government decision to hold back
from price increases for strategic goods and especially from any
increases in fuel prices and electricity billing rates will help
mitigate upward pressure on inflation expectations during 2007.
Demand-side inflationary pressure is predicted to remain low.Demand-side inflationary pressure is predicted to remain low.Demand-side inflationary pressure is predicted to remain low.Demand-side inflationary pressure is predicted to remain low.Demand-side inflationary pressure is predicted to remain low.
The relatively modest demand pressure in 2007 √ reflected in
the negative level and limited acceleration in the output gap √
is a delayed effect from demand conditions in the past year that
can still be covered by the supply side.
Like before, external factors will bring only limited upwardLike before, external factors will bring only limited upwardLike before, external factors will bring only limited upwardLike before, external factors will bring only limited upwardLike before, external factors will bring only limited upward
pressure on CPI inflation.pressure on CPI inflation.pressure on CPI inflation.pressure on CPI inflation.pressure on CPI inflation. This is because of the relative stability
in the exchange rate and diminished outlook for inflation in trading partner countries,
which is predicted to reach 1.7% in 2007.
Inflationary pressure in the volatile foods category is expected to ease in 2007Inflationary pressure in the volatile foods category is expected to ease in 2007Inflationary pressure in the volatile foods category is expected to ease in 2007Inflationary pressure in the volatile foods category is expected to ease in 2007Inflationary pressure in the volatile foods category is expected to ease in 2007
compared to the preceding year. compared to the preceding year. compared to the preceding year. compared to the preceding year. compared to the preceding year. In regard to production, the climate, the availability
of production inputs at affordable prices and the assumed absence of natural
disasters will help minimise crop failures in 2007. Concerning distribution, better
infrastructure following the launching of the infrastructure development programme,
particularly in the regions, will help reduce price distortions caused by distribution
problems and shortages. In addition, the management of food supplies is expected
to proceed smoothly, especially during the fasting month and the 2007 Eid-ul-Fitr
festivities, and this is expected to mitigate any excessive price movements during
the religious festive season.
RISKS
Looking ahead, the outlook for the economy and inflation may be affected by a
number of risks arising from both external and internal factors. These factors
represent mainly downside risks affecting the prospects for the Indonesian economy.
Externally, Externally, Externally, Externally, Externally, Bank Indonesia is constantly vigilant against the likelihood of slow global
economic growth and changes in global investment preferences. At the same time,
within Indonesia,within Indonesia,within Indonesia,within Indonesia,within Indonesia, structural issues such as delays in implementing the investment
climate, infrastructure and financial policy packages are risks that call for close
monitoring, in addition to other issues such as the possibilities of disruptions to
domestic distribution of goods and of a bubble on the capital market. If these risks
can be addressed properly, economic growth in 2007 may climb beyond the
forecasted level.
Graph 4.1
Trading Price Expectations
100
110
120
130
140
150
160
170
180
1 2 3 4 5 6 7 8 9 10 11 12 1 2 3 4 5 6 7 8 9 10 11 12 1 2 3 4 5 6 7 8 9 10 11 12 1 2 3 4 5 6 7 8 9
2003 2004 2005 2006
1-month forward3-months forward
6-months forward
Index
31
Monetary Policy Response Q I-2007
5. Monetary Policy ResponseQ I-2007
After an evaluation of Indonesia»s macroeconomic conditions in 2006, the eco-
nomic and monetary outlook, the various risks ahead and progress towards the
inflation target, set at 6%±1% and 5%±1% for 2007 and 2008, Bank IndonesiaBank IndonesiaBank IndonesiaBank IndonesiaBank Indonesia
decided to lower the BI Rate to 9.50%, down 25 bpsdecided to lower the BI Rate to 9.50%, down 25 bpsdecided to lower the BI Rate to 9.50%, down 25 bpsdecided to lower the BI Rate to 9.50%, down 25 bpsdecided to lower the BI Rate to 9.50%, down 25 bps from the previous level.
Bank Indonesia regards the year 2007 as a crucial year offering promise for re-
bound in the national economy. Consistency in macroeconomic policy, sharper fo-
cus in structural policies and rapid implementation of these policies will be essen-
tial to achieving better quality economic growth. For this reason, the commitment,
hard work and coordination of the entire nation will be vital to achieving higher
quality economic growth in 2007.
To create this momentum, Bank Indonesia»s monetary policy will remain focused
on building macroeconomic stability in support of sustainable economic growth
through consistent application of the Inflation Targeting Framework (ITF). On the
operational level, Bank Indonesia will also introduce various improvements to the
operational framework for monetary policy.
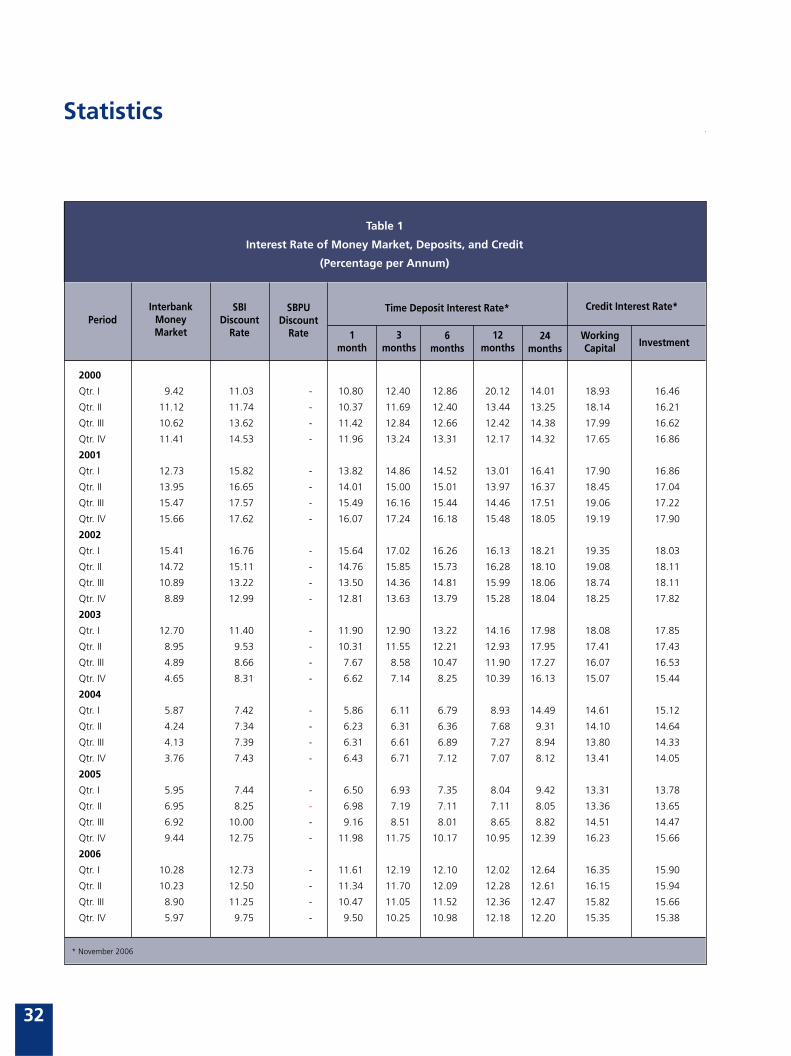
Monetary Policy Report - Quarter IV 2006
32
Statistics
Table 1
Interest Rate of Money Market, Deposits, and Credit
(Percentage per Annum)
Period
2000
Qtr. I
Qtr. II
Qtr. III
Qtr. IV
2001
Qtr. I
Qtr. II
Qtr. III
Qtr. IV
2002
Qtr. I
Qtr. II
Qtr. III
Qtr. IV
2003
Qtr. I
Qtr. II
Qtr. III
Qtr. IV
2004
Qtr. I
Qtr. II
Qtr. III
Qtr. IV
2005
Qtr. I
Qtr. II
Qtr. III
Qtr. IV
2006
Qtr. I
Qtr. II
Qtr. III
Qtr. IV
InterbankMoneyMarket
SBIDiscount
Rate
SBPUDiscount
Rate
Time Deposit Interest Rate* Credit Interest Rate*
1month
3months
6months
12months
24months
WorkingCapital Investment
9.42 11.03 - 10.80 12.40 12.86 20.12 14.01 18.93 16.46
11.12 11.74 - 10.37 11.69 12.40 13.44 13.25 18.14 16.21
10.62 13.62 - 11.42 12.84 12.66 12.42 14.38 17.99 16.62
11.41 14.53 - 11.96 13.24 13.31 12.17 14.32 17.65 16.86
12.73 15.82 - 13.82 14.86 14.52 13.01 16.41 17.90 16.86
13.95 16.65 - 14.01 15.00 15.01 13.97 16.37 18.45 17.04
15.47 17.57 - 15.49 16.16 15.44 14.46 17.51 19.06 17.22
15.66 17.62 - 16.07 17.24 16.18 15.48 18.05 19.19 17.90
15.41 16.76 - 15.64 17.02 16.26 16.13 18.21 19.35 18.03
14.72 15.11 - 14.76 15.85 15.73 16.28 18.10 19.08 18.11
10.89 13.22 - 13.50 14.36 14.81 15.99 18.06 18.74 18.11
8.89 12.99 - 12.81 13.63 13.79 15.28 18.04 18.25 17.82
12.70 11.40 - 11.90 12.90 13.22 14.16 17.98 18.08 17.85
8.95 9.53 - 10.31 11.55 12.21 12.93 17.95 17.41 17.43
4.89 8.66 - 7.67 8.58 10.47 11.90 17.27 16.07 16.53
4.65 8.31 - 6.62 7.14 8.25 10.39 16.13 15.07 15.44
5.87 7.42 - 5.86 6.11 6.79 8.93 14.49 14.61 15.12
4.24 7.34 - 6.23 6.31 6.36 7.68 9.31 14.10 14.64
4.13 7.39 - 6.31 6.61 6.89 7.27 8.94 13.80 14.33
3.76 7.43 - 6.43 6.71 7.12 7.07 8.12 13.41 14.05
5.95 7.44 - 6.50 6.93 7.35 8.04 9.42 13.31 13.78
6.95 8.25 - 6.98 7.19 7.11 7.11 8.05 13.36 13.65
6.92 10.00 - 9.16 8.51 8.01 8.65 8.82 14.51 14.47
9.44 12.75 - 11.98 11.75 10.17 10.95 12.39 16.23 15.66
10.28 12.73 - 11.61 12.19 12.10 12.02 12.64 16.35 15.90
10.23 12.50 - 11.34 11.70 12.09 12.28 12.61 16.15 15.94
8.90 11.25 - 10.47 11.05 11.52 12.36 12.47 15.82 15.66
5.97 9.75 - 9.50 10.25 10.98 12.18 12.20 15.35 15.38
* November 2006
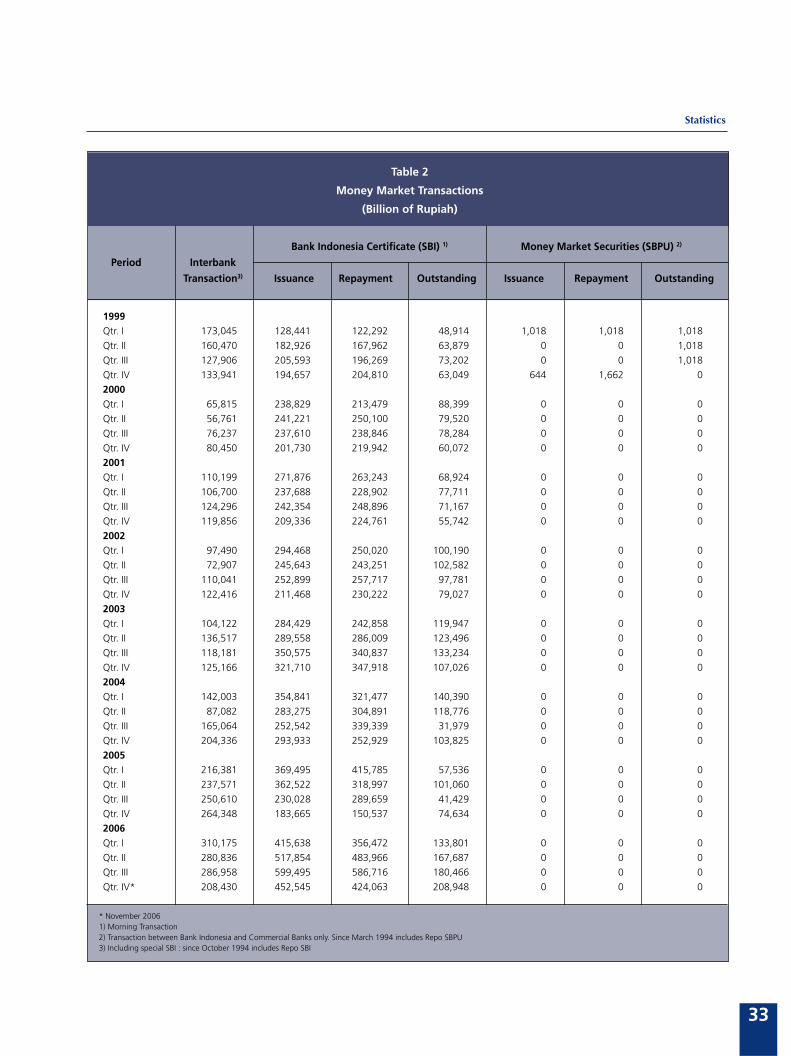
Statistics
33
Table 2
Money Market Transactions
(Billion of Rupiah)
Bank Indonesia Certificate (SBI) 1) Money Market Securities (SBPU) 2)
Period Interbank
Transaction3) Issuance Repayment Outstanding Issuance Repayment Outstanding
173,045 128,441 122,292 48,914 1,018 1,018 1,018
160,470 182,926 167,962 63,879 0 0 1,018
127,906 205,593 196,269 73,202 0 0 1,018
133,941 194,657 204,810 63,049 644 1,662 0
65,815 238,829 213,479 88,399 0 0 0
56,761 241,221 250,100 79,520 0 0 0
76,237 237,610 238,846 78,284 0 0 0
80,450 201,730 219,942 60,072 0 0 0
110,199 271,876 263,243 68,924 0 0 0
106,700 237,688 228,902 77,711 0 0 0
124,296 242,354 248,896 71,167 0 0 0
119,856 209,336 224,761 55,742 0 0 0
97,490 294,468 250,020 100,190 0 0 0
72,907 245,643 243,251 102,582 0 0 0
110,041 252,899 257,717 97,781 0 0 0
122,416 211,468 230,222 79,027 0 0 0
104,122 284,429 242,858 119,947 0 0 0
136,517 289,558 286,009 123,496 0 0 0
118,181 350,575 340,837 133,234 0 0 0
125,166 321,710 347,918 107,026 0 0 0
142,003 354,841 321,477 140,390 0 0 0
87,082 283,275 304,891 118,776 0 0 0
165,064 252,542 339,339 31,979 0 0 0
204,336 293,933 252,929 103,825 0 0 0
216,381 369,495 415,785 57,536 0 0 0
237,571 362,522 318,997 101,060 0 0 0
250,610 230,028 289,659 41,429 0 0 0
264,348 183,665 150,537 74,634 0 0 0
310,175 415,638 356,472 133,801 0 0 0
280,836 517,854 483,966 167,687 0 0 0
286,958 599,495 586,716 180,466 0 0 0
208,430 452,545 424,063 208,948 0 0 0
1999Qtr. I
Qtr. II
Qtr. III
Qtr. IV
2000Qtr. I
Qtr. II
Qtr. III
Qtr. IV
2001Qtr. I
Qtr. II
Qtr. III
Qtr. IV
2002Qtr. I
Qtr. II
Qtr. III
Qtr. IV
2003Qtr. I
Qtr. II
Qtr. III
Qtr. IV
2004Qtr. I
Qtr. II
Qtr. III
Qtr. IV
2005Qtr. I
Qtr. II
Qtr. III
Qtr. IV
2006Qtr. I
Qtr. II
Qtr. III
Qtr. IV*
* November 20061) Morning Transaction2) Transaction between Bank Indonesia and Commercial Banks only. Since March 1994 includes Repo SBPU3) Including special SBI : since October 1994 includes Repo SBI
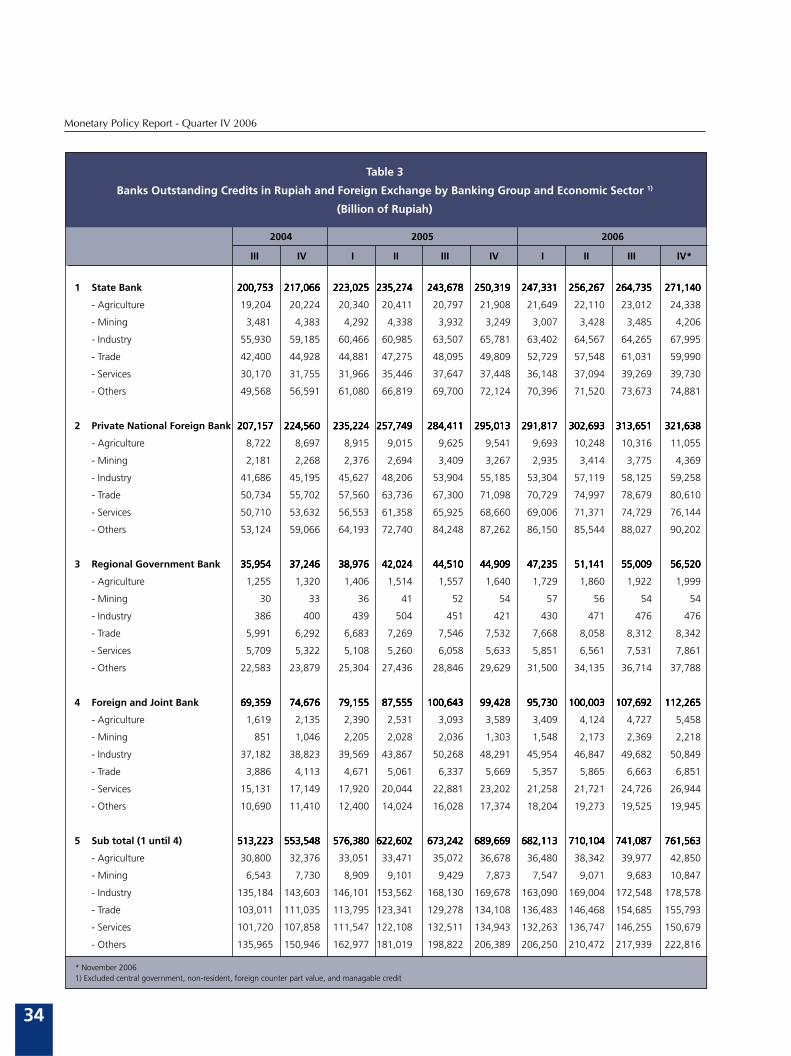
Monetary Policy Report - Quarter IV 2006
34
2004 2005 2006
III IV I II III IV I II III IV*
200,753200,753200,753200,753200,753 217,066217,066217,066217,066217,066 223,025223,025223,025223,025223,025 235,274235,274235,274235,274235,274 243,678243,678243,678243,678243,678 250,319250,319250,319250,319250,319 247,331247,331247,331247,331247,331 256,267256,267256,267256,267256,267 264,735264,735264,735264,735264,735 271,140271,140271,140271,140271,140
19,204 20,224 20,340 20,411 20,797 21,908 21,649 22,110 23,012 24,338
3,481 4,383 4,292 4,338 3,932 3,249 3,007 3,428 3,485 4,206
55,930 59,185 60,466 60,985 63,507 65,781 63,402 64,567 64,265 67,995
42,400 44,928 44,881 47,275 48,095 49,809 52,729 57,548 61,031 59,990
30,170 31,755 31,966 35,446 37,647 37,448 36,148 37,094 39,269 39,730
49,568 56,591 61,080 66,819 69,700 72,124 70,396 71,520 73,673 74,881
207,157207,157207,157207,157207,157 224,560224,560224,560224,560224,560 235,224235,224235,224235,224235,224 257,749257,749257,749257,749257,749 284,411284,411284,411284,411284,411 295,013295,013295,013295,013295,013 291,817291,817291,817291,817291,817 302,693302,693302,693302,693302,693 313,651313,651313,651313,651313,651 321,638321,638321,638321,638321,638
8,722 8,697 8,915 9,015 9,625 9,541 9,693 10,248 10,316 11,055
2,181 2,268 2,376 2,694 3,409 3,267 2,935 3,414 3,775 4,369
41,686 45,195 45,627 48,206 53,904 55,185 53,304 57,119 58,125 59,258
50,734 55,702 57,560 63,736 67,300 71,098 70,729 74,997 78,679 80,610
50,710 53,632 56,553 61,358 65,925 68,660 69,006 71,371 74,729 76,144
53,124 59,066 64,193 72,740 84,248 87,262 86,150 85,544 88,027 90,202
35,95435,95435,95435,95435,954 37,24637,24637,24637,24637,246 38,97638,97638,97638,97638,976 42,02442,02442,02442,02442,024 44,51044,51044,51044,51044,510 44,90944,90944,90944,90944,909 47,23547,23547,23547,23547,235 51,14151,14151,14151,14151,141 55,00955,00955,00955,00955,009 56,52056,52056,52056,52056,520
1,255 1,320 1,406 1,514 1,557 1,640 1,729 1,860 1,922 1,999
30 33 36 41 52 54 57 56 54 54
386 400 439 504 451 421 430 471 476 476
5,991 6,292 6,683 7,269 7,546 7,532 7,668 8,058 8,312 8,342
5,709 5,322 5,108 5,260 6,058 5,633 5,851 6,561 7,531 7,861
22,583 23,879 25,304 27,436 28,846 29,629 31,500 34,135 36,714 37,788
69,35969,35969,35969,35969,359 74,67674,67674,67674,67674,676 79,15579,15579,15579,15579,155 87,55587,55587,55587,55587,555 100,643100,643100,643100,643100,643 99,42899,42899,42899,42899,428 95,73095,73095,73095,73095,730 100,003100,003100,003100,003100,003 107,692107,692107,692107,692107,692 112,265112,265112,265112,265112,265
1,619 2,135 2,390 2,531 3,093 3,589 3,409 4,124 4,727 5,458
851 1,046 2,205 2,028 2,036 1,303 1,548 2,173 2,369 2,218
37,182 38,823 39,569 43,867 50,268 48,291 45,954 46,847 49,682 50,849
3,886 4,113 4,671 5,061 6,337 5,669 5,357 5,865 6,663 6,851
15,131 17,149 17,920 20,044 22,881 23,202 21,258 21,721 24,726 26,944
10,690 11,410 12,400 14,024 16,028 17,374 18,204 19,273 19,525 19,945
513,223513,223513,223513,223513,223 553,548553,548553,548553,548553,548 576,380576,380576,380576,380576,380 622,602622,602622,602622,602622,602 673,242673,242673,242673,242673,242 689,669689,669689,669689,669689,669 682,113682,113682,113682,113682,113 710,104710,104710,104710,104710,104 741,087741,087741,087741,087741,087 761,563761,563761,563761,563761,563
30,800 32,376 33,051 33,471 35,072 36,678 36,480 38,342 39,977 42,850
6,543 7,730 8,909 9,101 9,429 7,873 7,547 9,071 9,683 10,847
135,184 143,603 146,101 153,562 168,130 169,678 163,090 169,004 172,548 178,578
103,011 111,035 113,795 123,341 129,278 134,108 136,483 146,468 154,685 155,793
101,720 107,858 111,547 122,108 132,511 134,943 132,263 136,747 146,255 150,679
135,965 150,946 162,977 181,019 198,822 206,389 206,250 210,472 217,939 222,816
* November 20061) Excluded central government, non-resident, foreign counter part value, and managable credit
Table 3
Banks Outstanding Credits in Rupiah and Foreign Exchange by Banking Group and Economic Sector 1)
(Billion of Rupiah)
1 State Bank
- Agriculture
- Mining
- Industry
- Trade
- Services
- Others
2 Private National Foreign Bank
- Agriculture
- Mining
- Industry
- Trade
- Services
- Others
3 Regional Government Bank
- Agriculture
- Mining
- Industry
- Trade
- Services
- Others
4 Foreign and Joint Bank
- Agriculture
- Mining
- Industry
- Trade
- Services
- Others
5 Sub total (1 until 4)
- Agriculture
- Mining
- Industry
- Trade
- Services
- Others
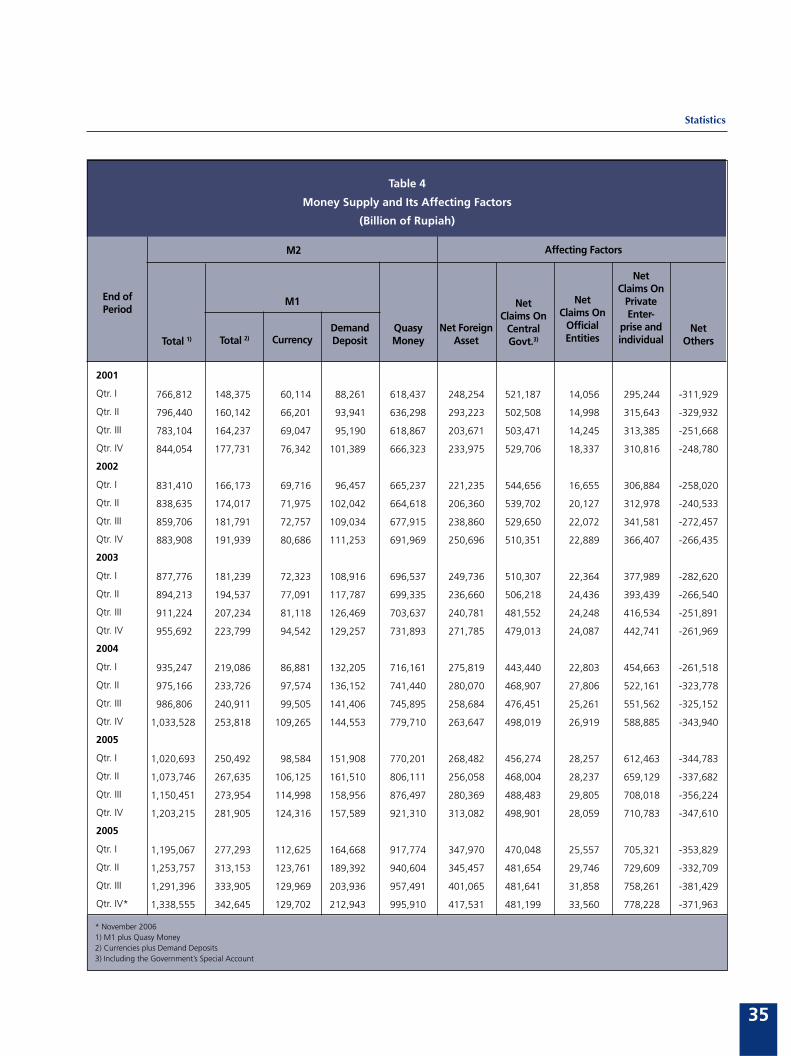
Statistics
35
Table 4
Money Supply and Its Affecting Factors
(Billion of Rupiah)
M2 Affecting Factors
End ofPeriod
Total 1) Total 2)
M1
CurrencyDemandDeposit
QuasyMoney
Net ForeignAsset
NetClaims On
CentralGovt.3)
NetClaims On
OfficialEntities
NetClaims On
PrivateEnter-
prise andindividual
2001
Qtr. I
Qtr. II
Qtr. III
Qtr. IV
2002
Qtr. I
Qtr. II
Qtr. III
Qtr. IV
2003
Qtr. I
Qtr. II
Qtr. III
Qtr. IV
2004
Qtr. I
Qtr. II
Qtr. III
Qtr. IV
2005
Qtr. I
Qtr. II
Qtr. III
Qtr. IV
2005
Qtr. I
Qtr. II
Qtr. III
Qtr. IV*
* November 20061) M1 plus Quasy Money2) Currencies plus Demand Deposits3) Including the Government»s Special Account
766,812 148,375 60,114 88,261 618,437 248,254 521,187 14,056 295,244 -311,929
796,440 160,142 66,201 93,941 636,298 293,223 502,508 14,998 315,643 -329,932
783,104 164,237 69,047 95,190 618,867 203,671 503,471 14,245 313,385 -251,668
844,054 177,731 76,342 101,389 666,323 233,975 529,706 18,337 310,816 -248,780
831,410 166,173 69,716 96,457 665,237 221,235 544,656 16,655 306,884 -258,020
838,635 174,017 71,975 102,042 664,618 206,360 539,702 20,127 312,978 -240,533
859,706 181,791 72,757 109,034 677,915 238,860 529,650 22,072 341,581 -272,457
883,908 191,939 80,686 111,253 691,969 250,696 510,351 22,889 366,407 -266,435
877,776 181,239 72,323 108,916 696,537 249,736 510,307 22,364 377,989 -282,620
894,213 194,537 77,091 117,787 699,335 236,660 506,218 24,436 393,439 -266,540
911,224 207,234 81,118 126,469 703,637 240,781 481,552 24,248 416,534 -251,891
955,692 223,799 94,542 129,257 731,893 271,785 479,013 24,087 442,741 -261,969
935,247 219,086 86,881 132,205 716,161 275,819 443,440 22,803 454,663 -261,518
975,166 233,726 97,574 136,152 741,440 280,070 468,907 27,806 522,161 -323,778
986,806 240,911 99,505 141,406 745,895 258,684 476,451 25,261 551,562 -325,152
1,033,528 253,818 109,265 144,553 779,710 263,647 498,019 26,919 588,885 -343,940
1,020,693 250,492 98,584 151,908 770,201 268,482 456,274 28,257 612,463 -344,783
1,073,746 267,635 106,125 161,510 806,111 256,058 468,004 28,237 659,129 -337,682
1,150,451 273,954 114,998 158,956 876,497 280,369 488,483 29,805 708,018 -356,224
1,203,215 281,905 124,316 157,589 921,310 313,082 498,901 28,059 710,783 -347,610
1,195,067 277,293 112,625 164,668 917,774 347,970 470,048 25,557 705,321 -353,829
1,253,757 313,153 123,761 189,392 940,604 345,457 481,654 29,746 729,609 -332,709
1,291,396 333,905 129,969 203,936 957,491 401,065 481,641 31,858 758,261 -381,429
1,338,555 342,645 129,702 212,943 995,910 417,531 481,199 33,560 778,228 -371,963
NetOthers
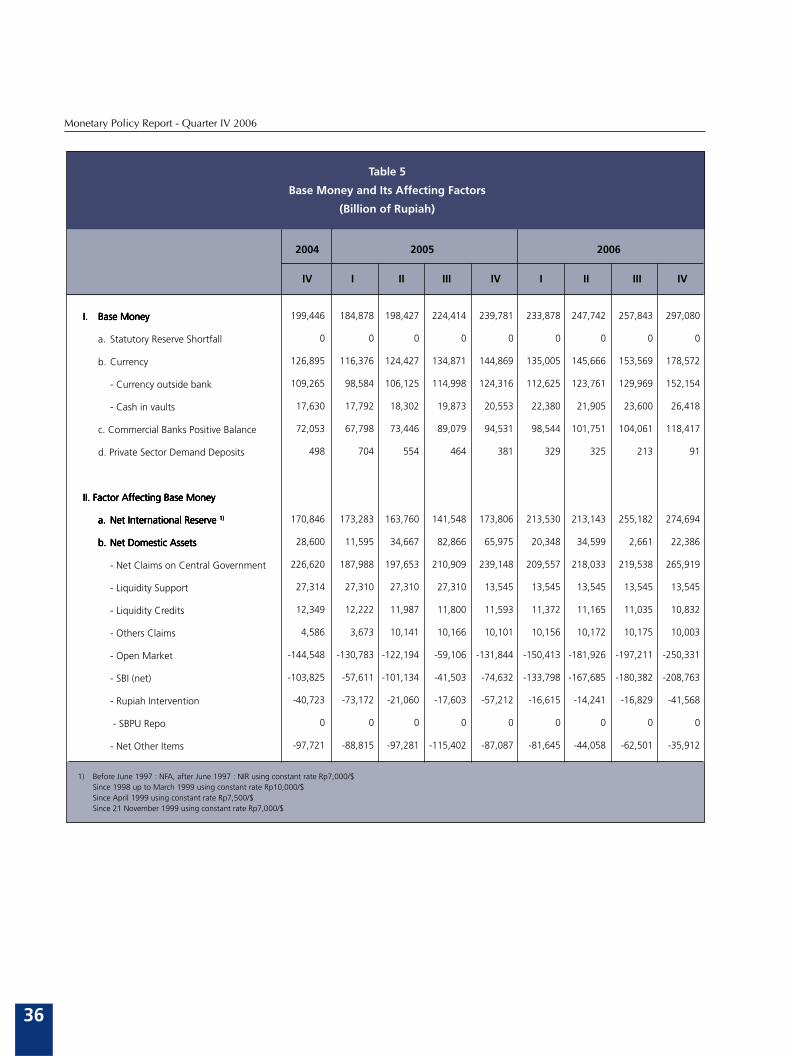
Monetary Policy Report - Quarter IV 2006
36
Table 5
Base Money and Its Affecting Factors
(Billion of Rupiah)
199,446 184,878 198,427 224,414 239,781 233,878 247,742 257,843 297,080
0 0 0 0 0 0 0 0 0
126,895 116,376 124,427 134,871 144,869 135,005 145,666 153,569 178,572
109,265 98,584 106,125 114,998 124,316 112,625 123,761 129,969 152,154
17,630 17,792 18,302 19,873 20,553 22,380 21,905 23,600 26,418
72,053 67,798 73,446 89,079 94,531 98,544 101,751 104,061 118,417
498 704 554 464 381 329 325 213 91
170,846 173,283 163,760 141,548 173,806 213,530 213,143 255,182 274,694
28,600 11,595 34,667 82,866 65,975 20,348 34,599 2,661 22,386
226,620 187,988 197,653 210,909 239,148 209,557 218,033 219,538 265,919
27,314 27,310 27,310 27,310 13,545 13,545 13,545 13,545 13,545
12,349 12,222 11,987 11,800 11,593 11,372 11,165 11,035 10,832
4,586 3,673 10,141 10,166 10,101 10,156 10,172 10,175 10,003
-144,548 -130,783 -122,194 -59,106 -131,844 -150,413 -181,926 -197,211 -250,331
-103,825 -57,611 -101,134 -41,503 -74,632 -133,798 -167,685 -180,382 -208,763
-40,723 -73,172 -21,060 -17,603 -57,212 -16,615 -14,241 -16,829 -41,568
0 0 0 0 0 0 0 0 0
-97,721 -88,815 -97,281 -115,402 -87,087 -81,645 -44,058 -62,501 -35,912
2004 2005 2006
IV I II III IV I II III IV
I.I.I.I.I. Base MoneyBase MoneyBase MoneyBase MoneyBase Money
a. Statutory Reserve Shortfall
b. Currency
- Currency outside bank
- Cash in vaults
c. Commercial Banks Positive Balance
d. Private Sector Demand Deposits
II. Factor Affecting Base MoneyII. Factor Affecting Base MoneyII. Factor Affecting Base MoneyII. Factor Affecting Base MoneyII. Factor Affecting Base Money
a.a.a.a.a. Net International Reserve Net International Reserve Net International Reserve Net International Reserve Net International Reserve 1)1)1)1)1)
b.b.b.b.b. Net Domestic AssetsNet Domestic AssetsNet Domestic AssetsNet Domestic AssetsNet Domestic Assets
- Net Claims on Central Government
- Liquidity Support
- Liquidity Credits
- Others Claims
- Open Market
- SBI (net)
- Rupiah Intervention
- SBPU Repo
- Net Other Items
1) Before June 1997 : NFA, after June 1997 : NIR using constant rate Rp7,000/$Since 1998 up to March 1999 using constant rate Rp10,000/$Since April 1999 using constant rate Rp7,500/$Since 21 November 1999 using constant rate Rp7,000/$
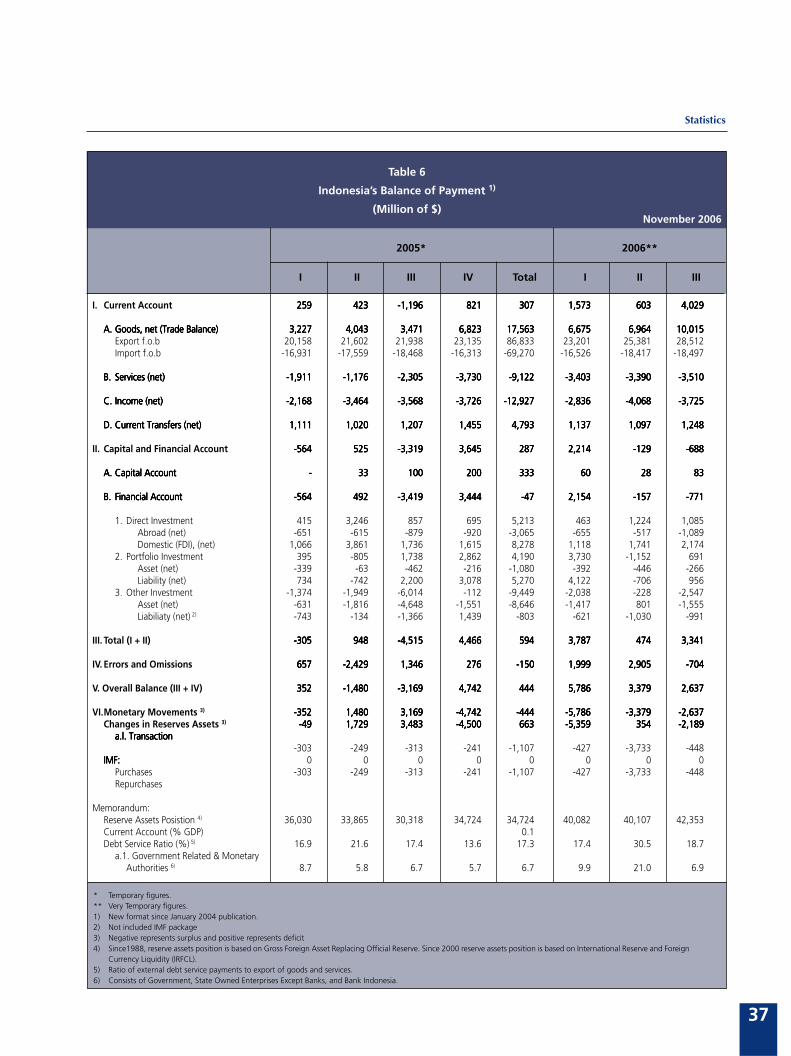
Statistics
37
Table 6
Indonesia»s Balance of Payment 1)
(Million of $)
2005* 2006**
I II III IV Total I II III
I. Current Account
A.A.A.A.A. Goods, net (Trade Balance)Goods, net (Trade Balance)Goods, net (Trade Balance)Goods, net (Trade Balance)Goods, net (Trade Balance)Export f.o.bImport f.o.b
B.B.B.B.B. Services (net)Services (net)Services (net)Services (net)Services (net)
C.C.C.C.C. Income (net)Income (net)Income (net)Income (net)Income (net)
D.D.D.D.D. Current Transfers (net)Current Transfers (net)Current Transfers (net)Current Transfers (net)Current Transfers (net)
II. Capital and Financial Account
A.A.A.A.A. Capital AccountCapital AccountCapital AccountCapital AccountCapital Account
B.B.B.B.B. Financial AccountFinancial AccountFinancial AccountFinancial AccountFinancial Account
1. Direct InvestmentAbroad (net)Domestic (FDI), (net)
2. Portfolio InvestmentAsset (net)Liability (net)
3. Other InvestmentAsset (net)Liabiliaty (net) 2)
III. Total (I + II)
IV. Errors and Omissions
V. Overall Balance (III + IV)
VI.Monetary Movements 3)
Changes in Reserves Assets 3)
a.l. Transactiona.l. Transactiona.l. Transactiona.l. Transactiona.l. Transaction
IMF:IMF:IMF:IMF:IMF:PurchasesRepurchases
Memorandum:Reserve Assets Posistion 4)
Current Account (% GDP)Debt Service Ratio (%) 5)
a.1. Government Related & MonetaryAuthorities 6)
* Temporary figures.** Very Temporary figures.1) New format since January 2004 publication.2) Not included IMF package3) Negative represents surplus and positive represents deficit4) Since1988, reserve assets position is based on Gross Foreign Asset Replacing Official Reserve. Since 2000 reserve assets position is based on International Reserve and Foreign
Currency Liquidity (IRFCL).5) Ratio of external debt service payments to export of goods and services.6) Consists of Government, State Owned Enterprises Except Banks, and Bank Indonesia.
259259259259259 423423423423423 -1,196-1,196-1,196-1,196-1,196 821821821821821 307307307307307 1,5731,5731,5731,5731,573 603603603603603 4,0294,0294,0294,0294,029
3,2273,2273,2273,2273,227 4,0434,0434,0434,0434,043 3,4713,4713,4713,4713,471 6,8236,8236,8236,8236,823 17,56317,56317,56317,56317,563 6,6756,6756,6756,6756,675 6,9646,9646,9646,9646,964 10,01510,01510,01510,01510,01520,158 21,602 21,938 23,135 86,833 23,201 25,381 28,512
-16,931 -17,559 -18,468 -16,313 -69,270 -16,526 -18,417 -18,497
-1,911-1,911-1,911-1,911-1,911 -1,176-1,176-1,176-1,176-1,176 -2,305-2,305-2,305-2,305-2,305 -3,730-3,730-3,730-3,730-3,730 -9,122-9,122-9,122-9,122-9,122 -3,403-3,403-3,403-3,403-3,403 -3,390-3,390-3,390-3,390-3,390 -3,510-3,510-3,510-3,510-3,510
-2,168-2,168-2,168-2,168-2,168 -3,464-3,464-3,464-3,464-3,464 -3,568-3,568-3,568-3,568-3,568 -3,726-3,726-3,726-3,726-3,726 -12,927-12,927-12,927-12,927-12,927 -2,836-2,836-2,836-2,836-2,836 -4,068-4,068-4,068-4,068-4,068 -3,725-3,725-3,725-3,725-3,725
1,1111,1111,1111,1111,111 1,0201,0201,0201,0201,020 1,2071,2071,2071,2071,207 1,4551,4551,4551,4551,455 4,7934,7934,7934,7934,793 1,1371,1371,1371,1371,137 1,0971,0971,0971,0971,097 1,2481,2481,2481,2481,248
-564-564-564-564-564 525525525525525 -3,319-3,319-3,319-3,319-3,319 3,6453,6453,6453,6453,645 287287287287287 2,2142,2142,2142,2142,214 -129-129-129-129-129 -688-688-688-688-688
----- 33 33 33 33 33 100 100 100 100 100 200 200 200 200 200 333333333333333 6060606060 28 28 28 28 28 83 83 83 83 83
-564-564-564-564-564 492492492492492 -3,419-3,419-3,419-3,419-3,419 3,4443,4443,4443,4443,444 -47-47-47-47-47 2,1542,1542,1542,1542,154 -157-157-157-157-157 -771-771-771-771-771
415 3,246 857 695 5,213 463 1,224 1,085-651 -615 -879 -920 -3,065 -655 -517 -1,089
1,066 3,861 1,736 1,615 8,278 1,118 1,741 2,174395 -805 1,738 2,862 4,190 3,730 -1,152 691
-339 -63 -462 -216 -1,080 -392 -446 -266734 -742 2,200 3,078 5,270 4,122 -706 956
-1,374 -1,949 -6,014 -112 -9,449 -2,038 -228 -2,547-631 -1,816 -4,648 -1,551 -8,646 -1,417 801 -1,555-743 -134 -1,366 1,439 -803 -621 -1,030 -991
-305-305-305-305-305 948948948948948 -4,515-4,515-4,515-4,515-4,515 4,4664,4664,4664,4664,466 594594594594594 3,7873,7873,7873,7873,787 474474474474474 3,3413,3413,3413,3413,341
657657657657657 -2,429-2,429-2,429-2,429-2,429 1,3461,3461,3461,3461,346 276276276276276 -150-150-150-150-150 1,9991,9991,9991,9991,999 2,9052,9052,9052,9052,905 -704-704-704-704-704
352352352352352 -1,480-1,480-1,480-1,480-1,480 -3,169-3,169-3,169-3,169-3,169 4,7424,7424,7424,7424,742 444444444444444 5,7865,7865,7865,7865,786 3,3793,3793,3793,3793,379 2,6372,6372,6372,6372,637
-352-352-352-352-352 1,4801,4801,4801,4801,480 3,1693,1693,1693,1693,169 -4,742-4,742-4,742-4,742-4,742 -444-444-444-444-444 -5,786-5,786-5,786-5,786-5,786 -3,379-3,379-3,379-3,379-3,379 -2,637-2,637-2,637-2,637-2,637-49-49-49-49-49 1,7291,7291,7291,7291,729 3,4833,4833,4833,4833,483 -4,500-4,500-4,500-4,500-4,500 663663663663663 -5,359-5,359-5,359-5,359-5,359 354354354354354 -2,189-2,189-2,189-2,189-2,189
-303 -249 -313 -241 -1,107 -427 -3,733 -4480 0 0 0 0 0 0 0
-303 -249 -313 -241 -1,107 -427 -3,733 -448
36,030 33,865 30,318 34,724 34,724 40,082 40,107 42,3530.1
16.9 21.6 17.4 13.6 17.3 17.4 30.5 18.7
8.7 5.8 6.7 5.7 6.7 9.9 21.0 6.9
November 2006
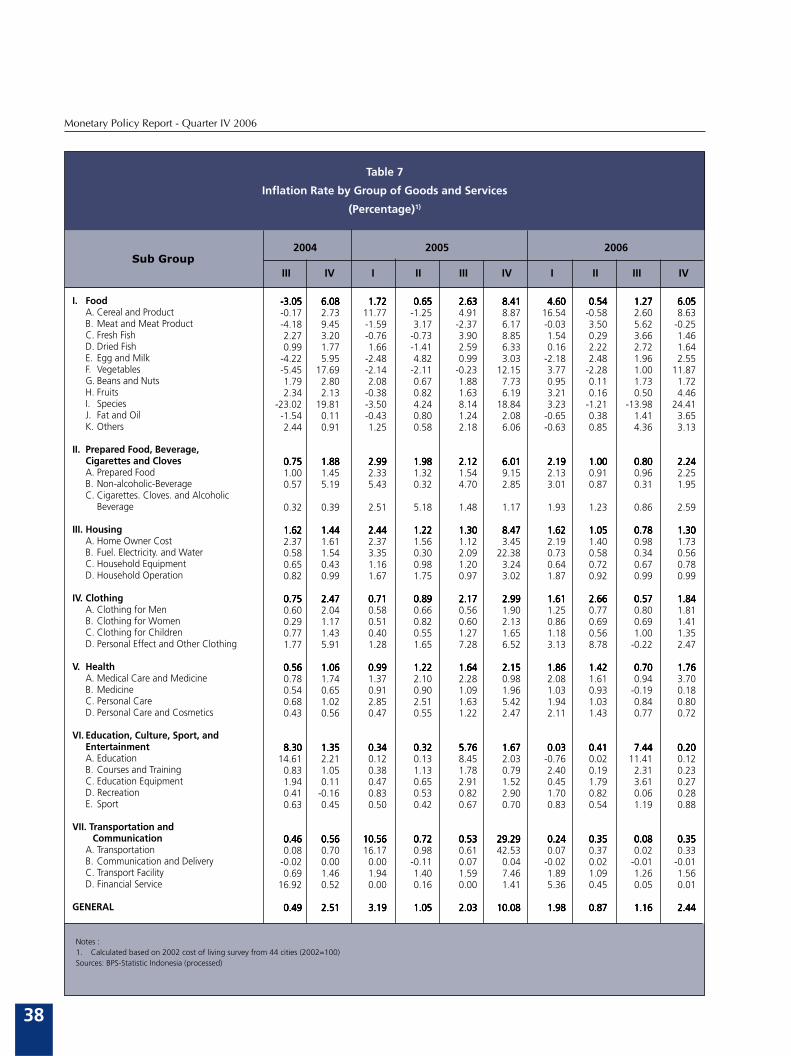
Monetary Policy Report - Quarter IV 2006
38
Table 7
Inflation Rate by Group of Goods and Services
(Percentage)1)
-3.05-3.05-3.05-3.05-3.05 6.086.086.086.086.08 1.721.721.721.721.72 0.650.650.650.650.65 2.632.632.632.632.63 8.418.418.418.418.41 4.604.604.604.604.60 0.540.540.540.540.54 1.271.271.271.271.27 6.056.056.056.056.05-0.17 2.73 11.77 -1.25 4.91 8.87 16.54 -0.58 2.60 8.63-4.18 9.45 -1.59 3.17 -2.37 6.17 -0.03 3.50 5.62 -0.252.27 3.20 -0.76 -0.73 3.90 8.85 1.54 0.29 3.66 1.460.99 1.77 1.66 -1.41 2.59 6.33 0.16 2.22 2.72 1.64
-4.22 5.95 -2.48 4.82 0.99 3.03 -2.18 2.48 1.96 2.55-5.45 17.69 -2.14 -2.11 -0.23 12.15 3.77 -2.28 1.00 11.871.79 2.80 2.08 0.67 1.88 7.73 0.95 0.11 1.73 1.722.34 2.13 -0.38 0.82 1.63 6.19 3.21 0.16 0.50 4.46
-23.02 19.81 -3.50 4.24 8.14 18.84 3.23 -1.21 -13.98 24.41-1.54 0.11 -0.43 0.80 1.24 2.08 -0.65 0.38 1.41 3.652.44 0.91 1.25 0.58 2.18 6.06 -0.63 0.85 4.36 3.13
0.750.750.750.750.75 1.881.881.881.881.88 2.992.992.992.992.99 1.981.981.981.981.98 2.122.122.122.122.12 6.016.016.016.016.01 2.192.192.192.192.19 1.001.001.001.001.00 0.800.800.800.800.80 2.242.242.242.242.241.00 1.45 2.33 1.32 1.54 9.15 2.13 0.91 0.96 2.250.57 5.19 5.43 0.32 4.70 2.85 3.01 0.87 0.31 1.95
0.32 0.39 2.51 5.18 1.48 1.17 1.93 1.23 0.86 2.59
1.621.621.621.621.62 1.441.441.441.441.44 2.442.442.442.442.44 1.221.221.221.221.22 1.301.301.301.301.30 8.478.478.478.478.47 1.621.621.621.621.62 1.051.051.051.051.05 0.780.780.780.780.78 1.301.301.301.301.302.37 1.61 2.37 1.56 1.12 3.45 2.19 1.40 0.98 1.730.58 1.54 3.35 0.30 2.09 22.38 0.73 0.58 0.34 0.560.65 0.43 1.16 0.98 1.20 3.24 0.64 0.72 0.67 0.780.82 0.99 1.67 1.75 0.97 3.02 1.87 0.92 0.99 0.99
0.750.750.750.750.75 2.472.472.472.472.47 0.710.710.710.710.71 0.890.890.890.890.89 2.172.172.172.172.17 2.992.992.992.992.99 1.611.611.611.611.61 2.662.662.662.662.66 0.570.570.570.570.57 1.841.841.841.841.840.60 2.04 0.58 0.66 0.56 1.90 1.25 0.77 0.80 1.810.29 1.17 0.51 0.82 0.60 2.13 0.86 0.69 0.69 1.410.77 1.43 0.40 0.55 1.27 1.65 1.18 0.56 1.00 1.351.77 5.91 1.28 1.65 7.28 6.52 3.13 8.78 -0.22 2.47
0.560.560.560.560.56 1.061.061.061.061.06 0.990.990.990.990.99 1.221.221.221.221.22 1.641.641.641.641.64 2.152.152.152.152.15 1.861.861.861.861.86 1.421.421.421.421.42 0.700.700.700.700.70 1.761.761.761.761.760.78 1.74 1.37 2.10 2.28 0.98 2.08 1.61 0.94 3.700.54 0.65 0.91 0.90 1.09 1.96 1.03 0.93 -0.19 0.180.68 1.02 2.85 2.51 1.63 5.42 1.94 1.03 0.84 0.800.43 0.56 0.47 0.55 1.22 2.47 2.11 1.43 0.77 0.72
8.308.308.308.308.30 1.351.351.351.351.35 0.340.340.340.340.34 0.320.320.320.320.32 5.765.765.765.765.76 1.671.671.671.671.67 0.030.030.030.030.03 0.410.410.410.410.41 7.447.447.447.447.44 0.200.200.200.200.2014.61 2.21 0.12 0.13 8.45 2.03 -0.76 0.02 11.41 0.12
0.83 1.05 0.38 1.13 1.78 0.79 2.40 0.19 2.31 0.231.94 0.11 0.47 0.65 2.91 1.52 0.45 1.79 3.61 0.270.41 -0.16 0.83 0.53 0.82 2.90 1.70 0.82 0.06 0.280.63 0.45 0.50 0.42 0.67 0.70 0.83 0.54 1.19 0.88
0.460.460.460.460.46 0.560.560.560.560.56 10.5610.5610.5610.5610.56 0.720.720.720.720.72 0.530.530.530.530.53 29.2929.2929.2929.2929.29 0.240.240.240.240.24 0.350.350.350.350.35 0.080.080.080.080.08 0.350.350.350.350.350.08 0.70 16.17 0.98 0.61 42.53 0.07 0.37 0.02 0.33
-0.02 0.00 0.00 -0.11 0.07 0.04 -0.02 0.02 -0.01 -0.010.69 1.46 1.94 1.40 1.59 7.46 1.89 1.09 1.26 1.56
16.92 0.52 0.00 0.16 0.00 1.41 5.36 0.45 0.05 0.01
0.490.490.490.490.49 2.512.512.512.512.51 3.193.193.193.193.19 1.051.051.051.051.05 2.032.032.032.032.03 10.0810.0810.0810.0810.08 1.981.981.981.981.98 0.870.870.870.870.87 1.161.161.161.161.16 2.442.442.442.442.44
Sub Group2004 2005 2006
III IV I II III IV I II III IV
I. FoodA. Cereal and ProductB. Meat and Meat ProductC. Fresh FishD. Dried FishE. Egg and MilkF. VegetablesG. Beans and NutsH. FruitsI. SpeciesJ. Fat and OilK. Others
II. Prepared Food, Beverage,Cigarettes and ClovesA. Prepared FoodB. Non-alcoholic-BeverageC. Cigarettes. Cloves. and Alcoholic
Beverage
III. HousingA. Home Owner CostB. Fuel. Electricity. and WaterC. Household EquipmentD. Household Operation
IV. ClothingA. Clothing for MenB. Clothing for WomenC. Clothing for ChildrenD. Personal Effect and Other Clothing
V. HealthA. Medical Care and MedicineB. MedicineC. Personal CareD. Personal Care and Cosmetics
VI. Education, Culture, Sport, andEntertainmentA. EducationB. Courses and TrainingC. Education EquipmentD. RecreationE. Sport
VII. Transportation and CommunicationA. TransportationB. Communication and DeliveryC. Transport FacilityD. Financial Service
GENERAL
Notes :1. Calculated based on 2002 cost of living survey from 44 cities (2002=100)Sources: BPS-Statistic Indonesia (processed)
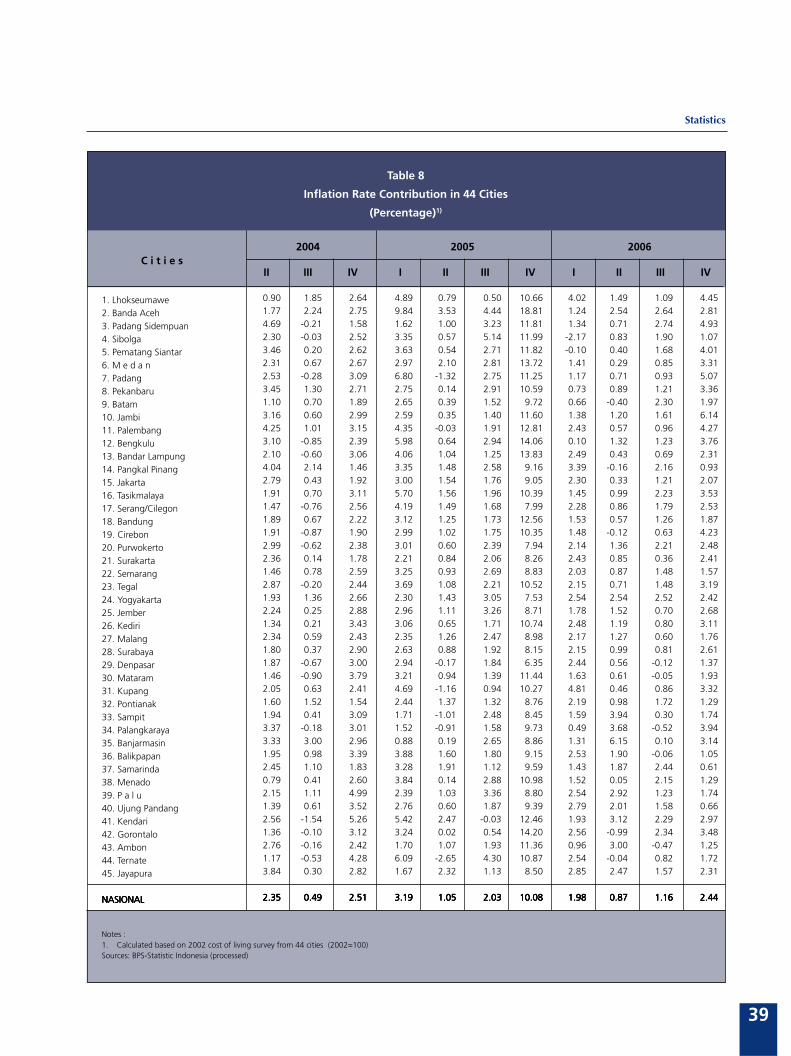
Statistics
39
Table 8
Inflation Rate Contribution in 44 Cities
(Percentage)1)
0.90 1.85 2.64 4.89 0.79 0.50 10.66 4.02 1.49 1.09 4.451.77 2.24 2.75 9.84 3.53 4.44 18.81 1.24 2.54 2.64 2.814.69 -0.21 1.58 1.62 1.00 3.23 11.81 1.34 0.71 2.74 4.932.30 -0.03 2.52 3.35 0.57 5.14 11.99 -2.17 0.83 1.90 1.073.46 0.20 2.62 3.63 0.54 2.71 11.82 -0.10 0.40 1.68 4.012.31 0.67 2.67 2.97 2.10 2.81 13.72 1.41 0.29 0.85 3.312.53 -0.28 3.09 6.80 -1.32 2.75 11.25 1.17 0.71 0.93 5.073.45 1.30 2.71 2.75 0.14 2.91 10.59 0.73 0.89 1.21 3.361.10 0.70 1.89 2.65 0.39 1.52 9.72 0.66 -0.40 2.30 1.973.16 0.60 2.99 2.59 0.35 1.40 11.60 1.38 1.20 1.61 6.144.25 1.01 3.15 4.35 -0.03 1.91 12.81 2.43 0.57 0.96 4.273.10 -0.85 2.39 5.98 0.64 2.94 14.06 0.10 1.32 1.23 3.762.10 -0.60 3.06 4.06 1.04 1.25 13.83 2.49 0.43 0.69 2.314.04 2.14 1.46 3.35 1.48 2.58 9.16 3.39 -0.16 2.16 0.932.79 0.43 1.92 3.00 1.54 1.76 9.05 2.30 0.33 1.21 2.071.91 0.70 3.11 5.70 1.56 1.96 10.39 1.45 0.99 2.23 3.531.47 -0.76 2.56 4.19 1.49 1.68 7.99 2.28 0.86 1.79 2.531.89 0.67 2.22 3.12 1.25 1.73 12.56 1.53 0.57 1.26 1.871.91 -0.87 1.90 2.99 1.02 1.75 10.35 1.48 -0.12 0.63 4.232.99 -0.62 2.38 3.01 0.60 2.39 7.94 2.14 1.36 2.21 2.482.36 0.14 1.78 2.21 0.84 2.06 8.26 2.43 0.85 0.36 2.411.46 0.78 2.59 3.25 0.93 2.69 8.83 2.03 0.87 1.48 1.572.87 -0.20 2.44 3.69 1.08 2.21 10.52 2.15 0.71 1.48 3.191.93 1.36 2.66 2.30 1.43 3.05 7.53 2.54 2.54 2.52 2.422.24 0.25 2.88 2.96 1.11 3.26 8.71 1.78 1.52 0.70 2.681.34 0.21 3.43 3.06 0.65 1.71 10.74 2.48 1.19 0.80 3.112.34 0.59 2.43 2.35 1.26 2.47 8.98 2.17 1.27 0.60 1.761.80 0.37 2.90 2.63 0.88 1.92 8.15 2.15 0.99 0.81 2.611.87 -0.67 3.00 2.94 -0.17 1.84 6.35 2.44 0.56 -0.12 1.371.46 -0.90 3.79 3.21 0.94 1.39 11.44 1.63 0.61 -0.05 1.932.05 0.63 2.41 4.69 -1.16 0.94 10.27 4.81 0.46 0.86 3.321.60 1.52 1.54 2.44 1.37 1.32 8.76 2.19 0.98 1.72 1.291.94 0.41 3.09 1.71 -1.01 2.48 8.45 1.59 3.94 0.30 1.743.37 -0.18 3.01 1.52 -0.91 1.58 9.73 0.49 3.68 -0.52 3.943.33 3.00 2.96 0.88 0.19 2.65 8.86 1.31 6.15 0.10 3.141.95 0.98 3.39 3.88 1.60 1.80 9.15 2.53 1.90 -0.06 1.052.45 1.10 1.83 3.28 1.91 1.12 9.59 1.43 1.87 2.44 0.610.79 0.41 2.60 3.84 0.14 2.88 10.98 1.52 0.05 2.15 1.292.15 1.11 4.99 2.39 1.03 3.36 8.80 2.54 2.92 1.23 1.741.39 0.61 3.52 2.76 0.60 1.87 9.39 2.79 2.01 1.58 0.662.56 -1.54 5.26 5.42 2.47 -0.03 12.46 1.93 3.12 2.29 2.971.36 -0.10 3.12 3.24 0.02 0.54 14.20 2.56 -0.99 2.34 3.482.76 -0.16 2.42 1.70 1.07 1.93 11.36 0.96 3.00 -0.47 1.251.17 -0.53 4.28 6.09 -2.65 4.30 10.87 2.54 -0.04 0.82 1.723.84 0.30 2.82 1.67 2.32 1.13 8.50 2.85 2.47 1.57 2.31
2.352.352.352.352.35 0.490.490.490.490.49 2.512.512.512.512.51 3.193.193.193.193.19 1.051.051.051.051.05 2.032.032.032.032.03 10.0810.0810.0810.0810.08 1.981.981.981.981.98 0.870.870.870.870.87 1.161.161.161.161.16 2.442.442.442.442.44
C i t i e s2004 2005 2006
II III IV I II III IV I II III IV
1. Lhokseumawe2. Banda Aceh3. Padang Sidempuan4. Sibolga5. Pematang Siantar6. M e d a n7. Padang8. Pekanbaru9. Batam10. Jambi11. Palembang12. Bengkulu13. Bandar Lampung14. Pangkal Pinang15. Jakarta16. Tasikmalaya17. Serang/Cilegon18. Bandung19. Cirebon20. Purwokerto21. Surakarta22. Semarang23. Tegal24. Yogyakarta25. Jember26. Kediri27. Malang28. Surabaya29. Denpasar30. Mataram31. Kupang32. Pontianak33. Sampit34. Palangkaraya35. Banjarmasin36. Balikpapan37. Samarinda38. Menado39. P a l u40. Ujung Pandang41. Kendari42. Gorontalo43. Ambon44. Ternate45. Jayapura
NASIONALNASIONALNASIONALNASIONALNASIONAL
Notes :1. Calculated based on 2002 cost of living survey from 44 cities (2002=100)Sources: BPS-Statistic Indonesia (processed)
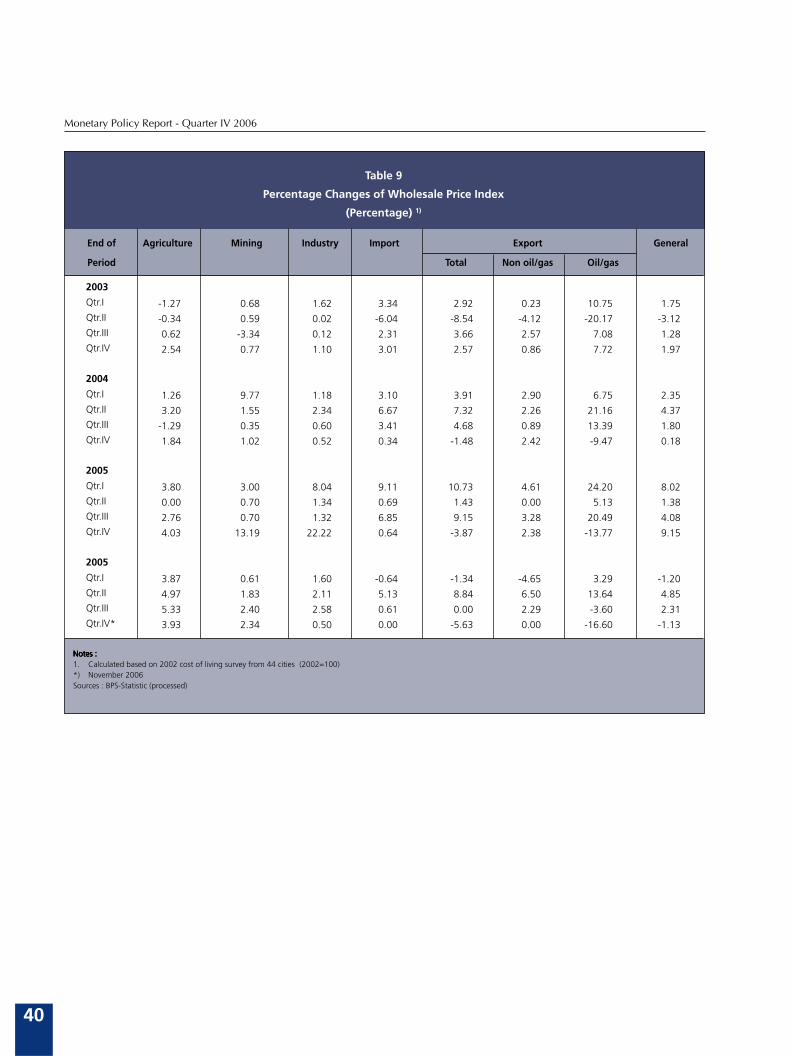
Monetary Policy Report - Quarter IV 2006
40
Table 9
Percentage Changes of Wholesale Price Index
(Percentage) 1)
-1.27 0.68 1.62 3.34 2.92 0.23 10.75 1.75
-0.34 0.59 0.02 -6.04 -8.54 -4.12 -20.17 -3.12
0.62 -3.34 0.12 2.31 3.66 2.57 7.08 1.28
2.54 0.77 1.10 3.01 2.57 0.86 7.72 1.97
1.26 9.77 1.18 3.10 3.91 2.90 6.75 2.35
3.20 1.55 2.34 6.67 7.32 2.26 21.16 4.37
-1.29 0.35 0.60 3.41 4.68 0.89 13.39 1.80
1.84 1.02 0.52 0.34 -1.48 2.42 -9.47 0.18
3.80 3.00 8.04 9.11 10.73 4.61 24.20 8.02
0.00 0.70 1.34 0.69 1.43 0.00 5.13 1.38
2.76 0.70 1.32 6.85 9.15 3.28 20.49 4.08
4.03 13.19 22.22 0.64 -3.87 2.38 -13.77 9.15
3.87 0.61 1.60 -0.64 -1.34 -4.65 3.29 -1.20
4.97 1.83 2.11 5.13 8.84 6.50 13.64 4.85
5.33 2.40 2.58 0.61 0.00 2.29 -3.60 2.31
3.93 2.34 0.50 0.00 -5.63 0.00 -16.60 -1.13
End of Agriculture Mining Industry Import Export General
Period Total Non oil/gas Oil/gas
2003
Qtr.I
Qtr.II
Qtr.III
Qtr.IV
2004
Qtr.I
Qtr.II
Qtr.III
Qtr.IV
2005
Qtr.I
Qtr.II
Qtr.III
Qtr.IV
2005
Qtr.I
Qtr.II
Qtr.III
Qtr.IV*
Notes :Notes :Notes :Notes :Notes :1. Calculated based on 2002 cost of living survey from 44 cities (2002=100)*) November 2006Sources : BPS-Statistic (processed)