Macroeconomic Policy in the Asia- Pacific GECO 6400 Monetary Policy Monetary Policy.
SVERIGES RIKSBANK
Monetary Policy Report April 2021
2
Monetary Policy Report
The Riksbank’s Monetary Policy Report is published five times a year. The
report describes the deliberations made by the Riksbank when deciding
what is an appropriate monetary policy1. The report contains a descrip-
tion of the future prospects for inflation and economic activity based on
the monetary policy that the Riksbank currently considers to be well-bal-
anced.
The purpose of the Monetary Policy Report is to summarise background
material for monetary policy decisions, and to spread knowledge about
the Riksbank’s assessments. By publishing the reports, the Riksbank aims
to make it easier for external parties to follow, understand and assess its
monetary policy.
The Riksbank must submit a written report on monetary policy to the
Riksdag (Swedish Parliament) Committee on Finance at least twice a year
(see Chapter 6, Article 4 of the Sveriges Riksbank Act (1988:1385)). Dur-
ing the spring, a specific report is submitted as a basis for the evaluation
of monetary policy. During the autumn, the Monetary Policy Report is
submitted as an account of monetary policy.
The Executive Board made a decision on the Monetary Policy Report on 26 April 2021. The report may be downloaded in PDF format from the Riksbank’s website www.riksbank.se, where more information about the Riksbank can also be found.
1 See "Monetary policy in Sweden" on the next page for a description of the monetary policy strategy and what can be regarded as an appropriate monetary policy.
3
Monetary policy in Sweden
Monetary policy strategy According to the Sveriges Riksbank Act, the objective for monetary policy is to maintain price stabil-
ity. The Riksbank has defined this as a 2 per cent annual increase in the consumer price index with a fixed interest rate (the CPIF).
At the same time as monetary policy is aimed at attaining the inflation target, it is also to support the objectives of general economic policy for the purpose of attaining sustainable growth and a high level of employment. This is achieved by the Riksbank, in addition to stabilising inflation around the inflation target, endeavouring to stabilise production and employment around paths that are sus-tainable in the long term. The Riksbank therefore conducts what is generally referred to as flexible inflation targeting. This does not mean that the Riksbank neglects the fact that the inflation target is the overriding objective.
It takes time before monetary policy has a full impact on inflation and the real economy. Monetary policy is therefore guided by forecasts for economic developments. The Riksbank’s publications in-clude an assessment of the future path for the repo rate. This repo-rate path is a forecast, not a promise.
In connection with every monetary policy decision, the Executive Board makes an assessment of the repo-rate path needed, and any potential supplementary measures necessary, for monetary policy to be well balanced. It is thus normally a question of finding an appropriate balance between stabilis-ing inflation around the inflation target and stabilising the real economy.
There is no general answer to the question of how quickly the Riksbank aims to bring the inflation rate back to 2 per cent if it deviates from the target. A rapid return may in some situations have un-desirable effects on output and employment, while a slow return may have a negative effect on con-fidence in the inflation target. The Riksbank’s ambition has generally been to adjust monetary policy so that inflation is expected to be fairly close to the target in two years’ time.
To illustrate the fact that inflation will not always be exactly 2 per cent each month, a variation band is used that stretches between 1 and 3 per cent, which captures around three quarters of the histori-cal monthly outcomes of CPIF inflation. The Riksbank always aims for 2 per cent inflation, regardless of whether inflation is initially inside or outside the variation band.
According to the Sveriges Riksbank Act, the Riksbank’s tasks also include promoting a safe and effi-cient payment system. Risks linked to developments in the financial markets are taken into account in the monetary policy decisions. With regard to preventing an unbalanced development of asset prices and indebtedness, however, well-functioning regulation and effective supervision play a cen-tral role. Monetary policy only acts as a complement to these.
In some situations, as in the financial crisis 2008–2009, the repo rate and the repo-rate path may need to be supplemented with other measures to promote financial stability and ensure that mone-tary policy is effective.
The Riksbank endeavours to ensure that its communication is open, factual, comprehensible and up-to-date. This makes it easier for economic agents to make good economic decisions. It also makes it easier to evaluate monetary policy.
Decision-making process The Executive Board of the Riksbank usually holds five monetary policy meetings per year at which it de-cides on monetary policy. A Monetary Policy Report is published in connection with these meetings. Ap-proximately two weeks after each monetary policy meeting, the Riksbank publishes minutes from the meeting, in which it is possible to follow the discussion that led to the current decision and to see the ar-guments put forward by the different Executive Board members.
Presentation of monetary policy decision The monetary policy decision is presented in a press release at 09.30 on the day following the monetary policy meeting. The press release also states how the individual Executive Board members voted and pro-vides the main motivation for any reservations entered. A press conference is held on the day following the monetary policy meeting.
4
Contents
1 Monetary policy continues to support economic developments and
inflation 6
1.1 Brighter prospects for global economic activity 6
1.2 Continued expansionary monetary policy 10
1.3 If developments take a different direction, monetary policy can be
adjusted 20
2 Continued economic recovery is impacting financial markets 23
2.1 Brighter future prospects are creating higher demand for high-risk
assets 23
2.2 Long-term inflation expectations close to pre-crisis levels 38
3 Recovery continuing despite increased spread of infection at start of
year 39
3.1 Growth in the world economy will accelerate when the restrictions
are eased 39
3.2 Swedish economy will accelerate when restrictions are eased 49
ARTICLE – Rapidly rising housing prices despite the coronavirus crisis 67
ARTICLE – Alternative scenarios for the recovery 78
Tables 85
5
IN BRIEF – Monetary policy April 2021
The recovery in the global economy is continuing, even though in-
fection has increased and restrictions have been comprehensive
over the spring. Increasing numbers of people are being vac-
cinated and, with the significant fiscal and monetary policy sup-
port, conditions are good for demand to return rapidly even in
contact-intensive services sectors, as soon as restrictions are
eased. But there is still considerable uncertainty and the speed
of the recovery varies substantially between different sectors
and countries.
Towards the summer, growth is expected to gear up both in Swe-
den and abroad. The differences between various sectors and
groups on the labour market are expected to remain high, but
overall economic activity is expected to approach more normal
levels towards the end of the year. The situation on the labour
market will strengthen even if unemployment is expected to re-
main at a somewhat higher level for a further period, as a result of
the lasting effects of the crisis.
The increasing resource utilisation creates the conditions for an
upturn in inflation, but cost pressures are expected to rise rela-
tively slowly. As during 2020, major variations in inflation are ex-
pected this year, too. It will take until the end of the forecast pe-
riod before inflation is expected to be more permanently close
to the target of 2 per cent.
Expansionary monetary policy in the years ahead is needed to
support the economy and inflation. The Riksbank is therefore con-
tinuing to purchase assets within the envelope of SEK 700 billion
and to offer liquidity within all the programmes launched. The Ex-
ecutive Board has also decided to hold the repo rate at zero per
cent and it is expected to remain at this level in the years to
come. The Riksbank will design monetary policy so that there is
extensive monetary policy assistance for as long as necessary in
order to support the recovery and inflation.
Monetary policy continues to support economic developments and inflation
6
1 Monetary policy continues to support economic developments and inflation
The recovery in the global economy is continuing, even though infection
has increased and restrictions have been comprehensive over the spring.
Increasing numbers of people are being vaccinated and, with the signifi-
cant fiscal and monetary policy support, conditions are good for demand
to return rapidly as soon as restrictions are eased. But there is still con-
siderable uncertainty and the speed of the recovery varies substantially
between different sectors and countries.
Towards the summer, growth is expected to gear up in Sweden and
abroad. The differences between various sectors and groups on the la-
bour market are expected to remain large, but overall economic activity
is expected to approach more normal levels towards the end of the year.
The situation on the labour market will strengthen and the rising re-
source utilisation is creating the conditions for a rise in inflation. How-
ever, it will take until the end of the forecast period before inflation can
be expected to be more permanently close to the target of 2 per cent.
In a time of uncertainty, the Riksbank’s measures have contributed to
keeping the level of interest rates low and ensuring the supply of credit
functions smoothly, which has mitigated the effects of the crisis on the
economy. The recovery of the Swedish economy is well on the way but
an expansionary monetary policy will be required over the next few years
to support the economy and for inflation to be close to target more per-
manently. The Riksbank is therefore continuing to purchase assets within
the envelope of SEK 700 billion and to offer liquidity within all the pro-
grammes launched. The Executive Board has also decided to hold the
repo rate at zero per cent and it is expected to remain at this level in the
years to come. The Riksbank will design monetary policy so that there is
extensive monetary policy assistance for as long as necessary in order to
support the recovery and inflation.
1.1 Brighter prospects for global economic activity
The pandemic is still holding the global economy back
It has now been over a year since the WHO established that the rapid spread of
COVID-19 across the world had developed into a pandemic. Over the year, the spread
Monetary policy continues to support economic developments and inflation
7
of infection has intensified in various countries, over partly different periods. The
measures used to prevent the spread of infection have also varied but remain com-
prehensive in most countries, which is having economic consequences. However, the
restrictions are not affecting economic activity as much now as in the spring of 2020.
While parts of the service sector are still being weighed down by them, the world
trade in goods and global industrial production has rapidly recovered after the heavy
downturn at the start of the crisis and both are now on higher levels than before the
pandemic. Some supply shocks are present in the form of delivery problems and
shortages of input goods, but confidence within the manufacturing industry has nev-
ertheless risen to historically high levels and indicates continued strong development.
There are large differences among the service sectors. Confidence has risen in service
sectors closer to corporates, while it remains lower than normal in more contact-in-
tensive service sectors. However, once more people have been vaccinated and the re-
strictions start to be eased, the production of services in more contact-intensive sec-
tors can also pick up. However, vaccination rates differ greatly, above all between rich
and poor countries, which is affecting conditions.
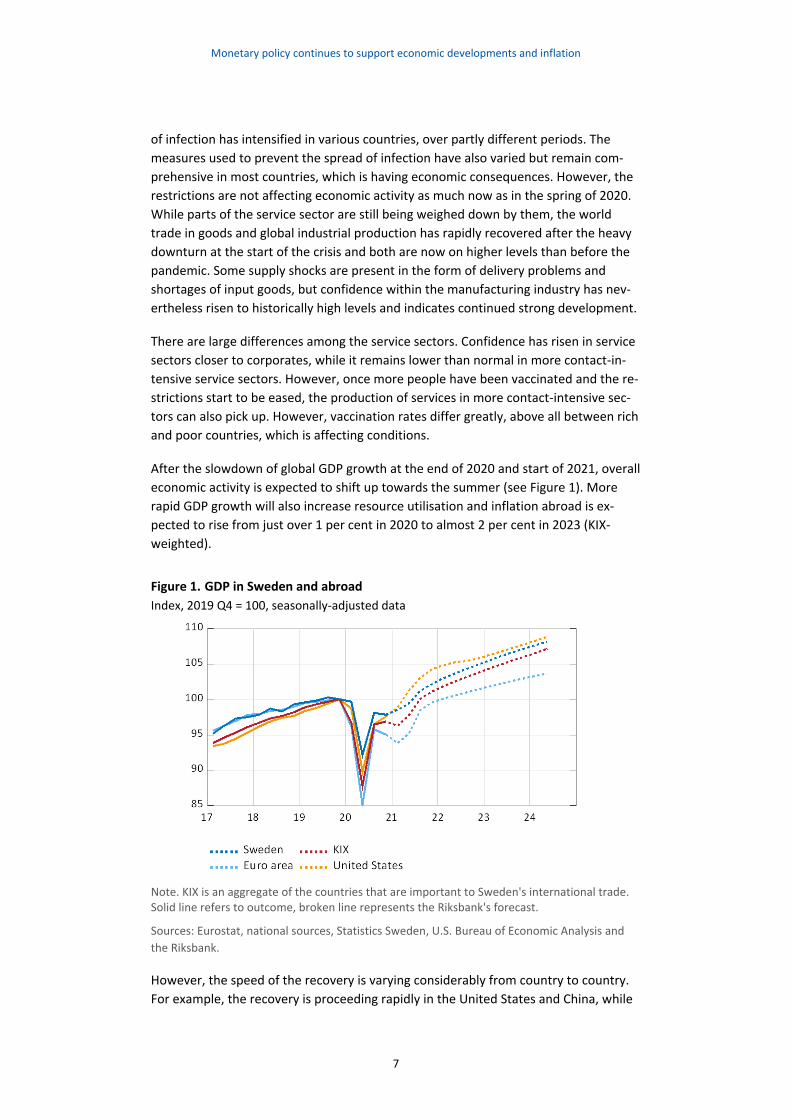
After the slowdown of global GDP growth at the end of 2020 and start of 2021, overall
economic activity is expected to shift up towards the summer (see Figure 1). More
rapid GDP growth will also increase resource utilisation and inflation abroad is ex-
pected to rise from just over 1 per cent in 2020 to almost 2 per cent in 2023 (KIX-
weighted).
Figure 1. GDP in Sweden and abroad
Index, 2019 Q4 = 100, seasonally-adjusted data
Note. KIX is an aggregate of the countries that are important to Sweden's international trade. Solid line refers to outcome, broken line represents the Riksbank's forecast.
Sources: Eurostat, national sources, Statistics Sweden, U.S. Bureau of Economic Analysis and
the Riksbank.
However, the speed of the recovery is varying considerably from country to country.
For example, the recovery is proceeding rapidly in the United States and China, while
Monetary policy continues to support economic developments and inflation
8
it is proceeding more sluggishly in the euro area and a number of emerging market
economies. The weakest development is expected to be in low-income countries with
limited access to vaccines. There are also differences in the euro area, where south-
ern European countries have a greater proportion of production in contact-intensive
service sectors, which is weighing down the recovery. For the development of the
Swedish economy, it is important that international demand rises over the coming
years.
Supported by expansionary economic policies, many countries are moving towards
what is expected to be more normal economic activity. However, developments re-
main uncertain and it is too early to comment on the more lasting effects of the crisis
on the world economy. For example, the support measures from governments and
central banks have led to many companies and states becoming heavily indebted,
making them vulnerable in the future.
The expansionary economic policy, not least the substantial fiscal policy stimulation in
the United States, is contributing to continued optimism about the conditions for an
economic recovery. Risk appetite on the financial markets therefore continues to be
high. Even though the rise in US long-term interest rates has, to some extent, spilled
over to other bond markets and other countries, including Sweden, interest rates re-
main historically low. Prices on many stock markets have also developed strongly af-
ter falling during the more acute phase of the crisis last year. The Swedish krona,
measured in terms of the KIX, has weakened slightly since the start of the year but is
still stronger than before the pandemic.
Swedish economy moving towards a more normal autumn
In Sweden, economic activity has developed relatively well despite infection having
continued to increase over the spring. On 6 March, more stringent restrictions were
introduced, including restrictions on the trade sector, bars, cafés and restaurants to
reduce crowding. Following a recommendation from the Public Health Agency of Swe-
den, the Government has extended these restrictions until 17 May. Vaccinations are
proceeding at the rate deliveries allow, which has probably contributed to the num-
ber of fatalities being low in relation to infection. The continuing recovery is a sign
that some participants in the economy have adapted in a way that has allowed pro-
duction and consumption despite the comprehensive restrictions.
Problems with vaccine deliveries have meant that the population of Sweden, like
many other countries, has been vaccinated at a slower rate than the authorities ex-
pected at the start of the year. In line with the change in the assessment of the Public
Health Agency of Sweden, the vaccination process, and thus also the suppression of
the spread of infection, is assumed to take slightly longer than forecast in February.
The Riksbank’s forecast assumes that the greater part of the adult population of Swe-
den and its most important trading partners will have been vaccinated towards the
end of the summer and it is expected to take until the second half of the year before
restrictions on social life are eased more substantially. A certain level of restrictions
Monetary policy continues to support economic developments and inflation
9
will probably remain for a longer time to come. However, as immunity increases, mo-
bility in society is expected to increase enough for demand for contact-intensive ser-
vices to approach more normal levels relatively quickly.
Despite the continued spread of infection, outcomes and indicators point to a good
recovery for GDP and rising demand for labour. The short-term work allowance has
meant that affected companies have been able to keep their employees and even sec-
tors that have been forced to lay off a large part of their workforce – such as hotels
and restaurants, transportation and culture – are expected to be able to re-employ
staff relatively quickly once restrictions are eased and demand picks up again. How-
ever, the pandemic is expected to have a number of more long-term effects and un-
employment is expected to remain at a heightened level for several years.
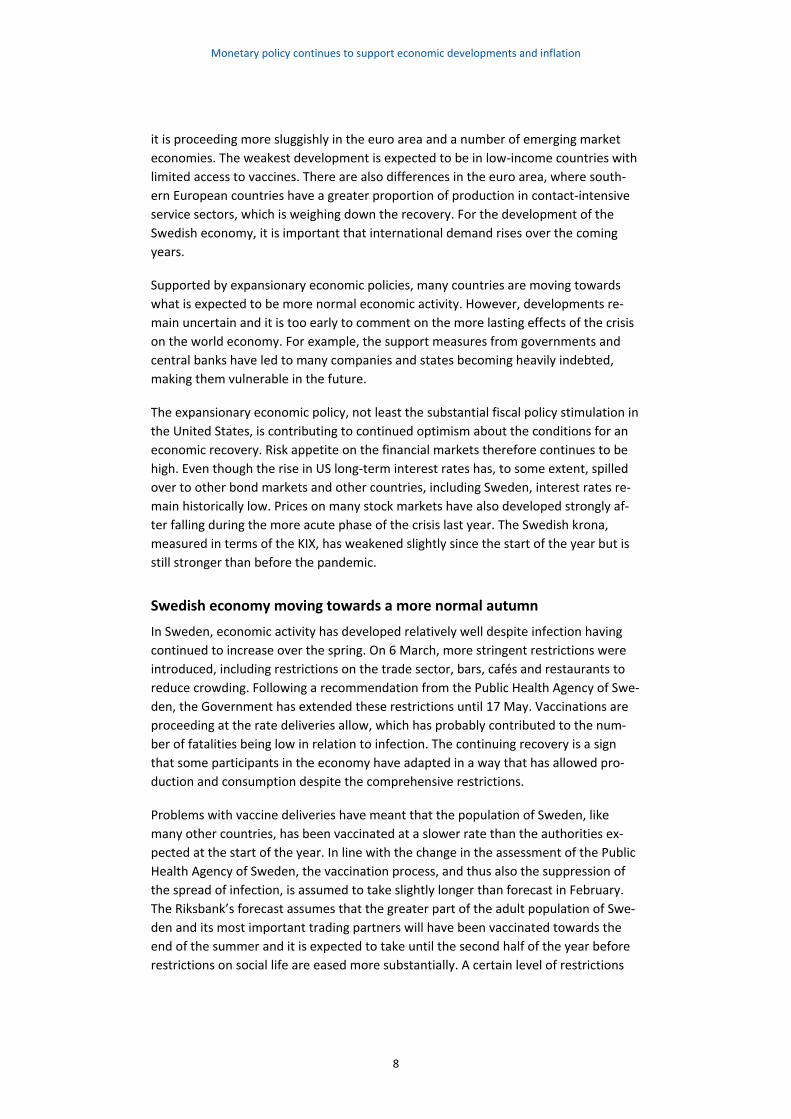
Major variation in inflation this year too
Last year was characterised by low and highly varying inflation. Reasons for this in-
cluded large fluctuations in energy prices, measurement problems and changed con-
sumption patterns during the pandemic.2 As expected, inflation rose clearly at the
start of the current year due to rapidly rising energy prices and CPIF inflation was
1.9 per cent in March, compared with 0.5 per cent in December 2020. Adjusted for
energy prices, inflation did not rise at all as much over the same period, from 1.2 to
1.4 per cent. However, even when energy prices are disregarded, inflation has varied
heavily from month to month and this will probably continue for a while longer (see
Figure 2). Towards the end of the forecast period, CPIF inflation is expected to be
more permanently close to the target of 2 per cent.
2 See the article “Changed consumption during the pandemic affects inflation” in the Monetary Policy Re-port, February 2021.
Monetary policy continues to support economic developments and inflation
10
Figure 2. CPIF and CPIF excluding energy
Annual percentage change
Sources: Statistics Sweden and the Riksbank.
1.2 Continued expansionary monetary policy
Somewhat brighter economic prospects
Since the monetary policy meeting in February, economic developments abroad have
been in line with the Riksbank’s forecast. However, infection has increased in many
countries, impeding economic activity over the first half of the year. Assumptions for
when the spread of infection will have slowed down enough for restrictions to start to
be eased have been moved back slightly in the current assessment and, for the euro
area, GDP growth has therefore been revised downwards slightly over the short term.
At the same time, the comprehensive US fiscal policy stimulation package that has
now been agreed has contributed to an upward revision of the economic outlook
abroad. Above all, this applies to the United States but also to the rest of the world as
a whole, including Sweden.
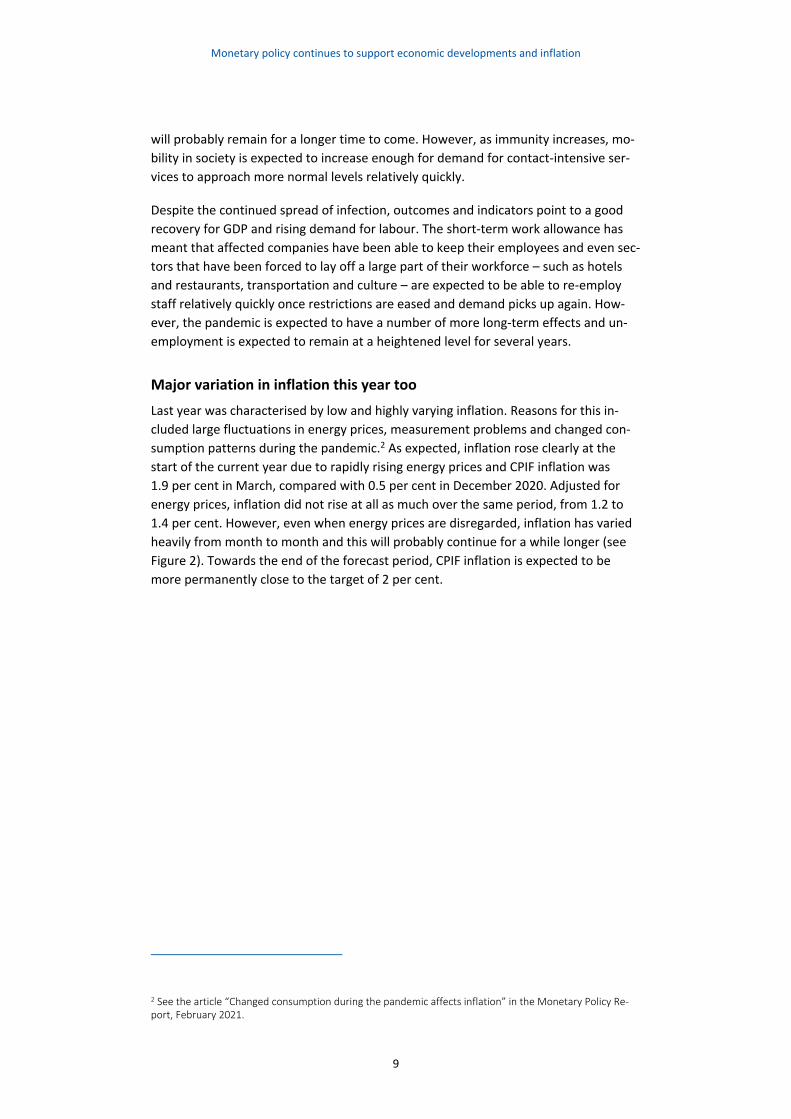
In Sweden, the economic recovery has been slightly stronger than expected. Out-
comes and indicators point to higher growth last year and in the first quarter of 2021,
and the recovery is assessed to be moving slightly quicker than in the previous assess-
ment (see Figure 3). Interpreting the development of the Swedish labour market is
more difficult due to the time series break in Statistics Sweden’s official statistics.
However, indicators and complementary statistics suggest that the development of
the labour market has been in line with the Riksbank’s February forecast and the pro-
spects for continued improvement look good. Total economic activity in the Swedish
economy is now expected to approach more normal levels towards the end of the
year, which is slightly earlier than in the previous assessment.
Monetary policy continues to support economic developments and inflation
11
Figure 3. GDP in Sweden
Index, 2019 Q4 = 100, seasonally-adjusted data
Note. Solid line represents outcome, broken line represents the Riksbank's forecast.
Sources: Statistics Sweden and the Riksbank.
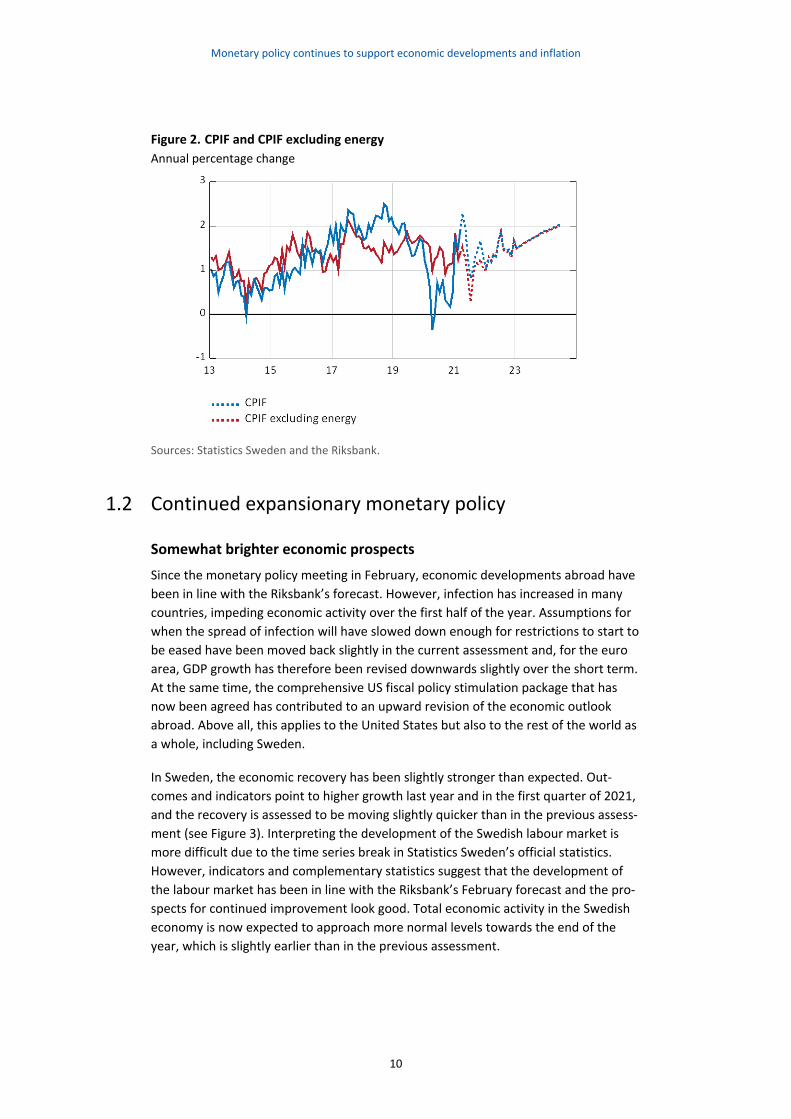
In February, inflation was lower than expected but the outcome for March brings CPIF
inflation largely into line with the Riksbank’s forecast from the Monetary Policy Re-
port in February. Compared with the earlier assessment, resource utilisation is ex-
pected to be slightly higher but overall this will only lead to marginal revisions of the
inflation forecast (see Figure 4). Cost pressures remain low and it would take an ex-
pansionary monetary policy for them to increase. As in the February forecast, it will
take until the end of the forecast period before inflation is expected to stabilise close
to 2 per cent.
Figure 4. CPIF
Annual percentage change
Note. Solid line represents outcome, broken line represents the Riksbank's forecast.
Sources: Statistics Sweden and the Riksbank.
Monetary policy continues to support economic developments and inflation
12
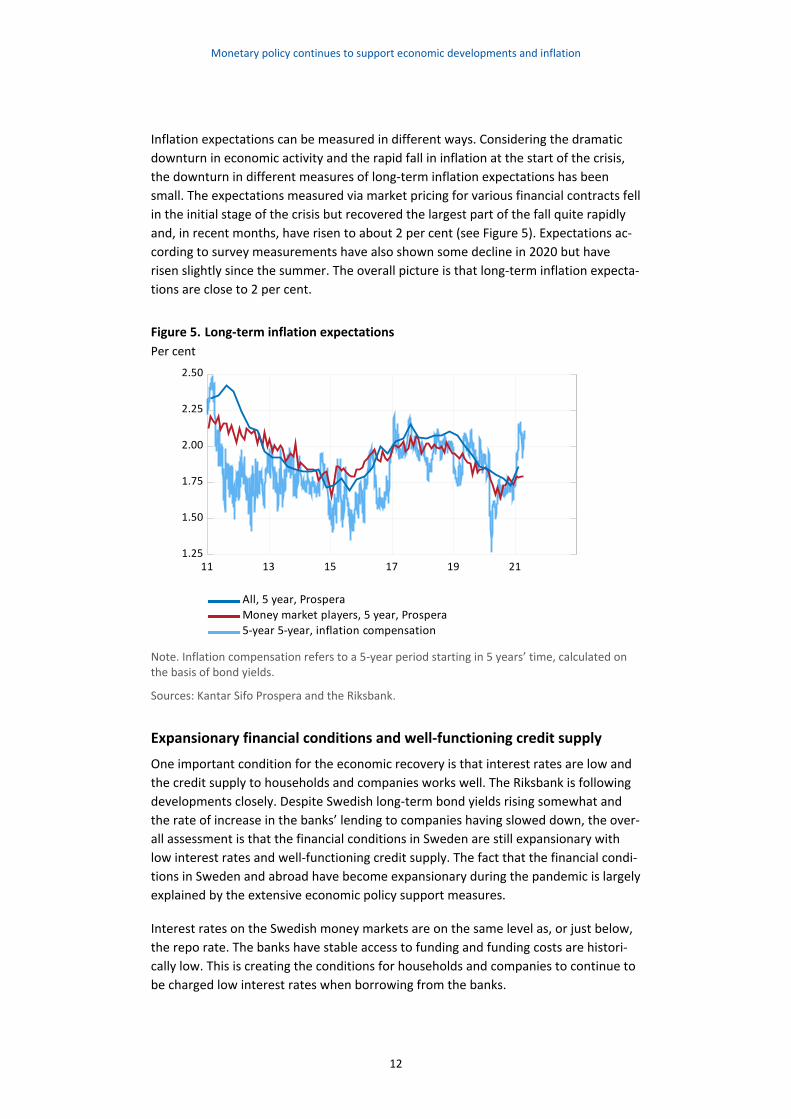
Inflation expectations can be measured in different ways. Considering the dramatic
downturn in economic activity and the rapid fall in inflation at the start of the crisis,
the downturn in different measures of long-term inflation expectations has been
small. The expectations measured via market pricing for various financial contracts fell
in the initial stage of the crisis but recovered the largest part of the fall quite rapidly
and, in recent months, have risen to about 2 per cent (see Figure 5). Expectations ac-
cording to survey measurements have also shown some decline in 2020 but have
risen slightly since the summer. The overall picture is that long-term inflation expecta-
tions are close to 2 per cent.
Figure 5. Long-term inflation expectations
Per cent
11 13 15 17 19 211.25
1.50
1.75
2.00
2.25
2.50
5-year 5-year, inflation compensation
Money market players, 5 year, Prospera
All, 5 year, Prospera
Note. Inflation compensation refers to a 5-year period starting in 5 years’ time, calculated on the basis of bond yields.
Sources: Kantar Sifo Prospera and the Riksbank.
Expansionary financial conditions and well-functioning credit supply
One important condition for the economic recovery is that interest rates are low and
the credit supply to households and companies works well. The Riksbank is following
developments closely. Despite Swedish long-term bond yields rising somewhat and
the rate of increase in the banks’ lending to companies having slowed down, the over-
all assessment is that the financial conditions in Sweden are still expansionary with
low interest rates and well-functioning credit supply. The fact that the financial condi-
tions in Sweden and abroad have become expansionary during the pandemic is largely
explained by the extensive economic policy support measures.
Interest rates on the Swedish money markets are on the same level as, or just below,
the repo rate. The banks have stable access to funding and funding costs are histori-
cally low. This is creating the conditions for households and companies to continue to
be charged low interest rates when borrowing from the banks.
Monetary policy continues to support economic developments and inflation
13
The Riksbank’s measures have also contributed to companies being able to obtain
wholesale funding at low interest rates. The rate of increase in bank lending to com-
panies has been subdued in recent months, but the downturn has been counteracted,
to a certain extent, by wholesale funding having increased. Surveys show that compa-
nies, above all within the service and construction sectors, are experiencing an im-
proved funding situation, even if it has not returned to the pre-pandemic situation.
The development of lending to households has been stable in the pandemic and has
increased slightly more rapidly in recent months, among other things due to the
strong development of prices on the housing market.
The Riksbank’s measures during the crisis
Since the coronavirus broke out, the Riksbank has launched several programmes that,
together with a policy rate of zero per cent, are aimed at holding the level of interest
rates low and facilitating the credit supply to support the development of the econ-
omy and inflation. The Riksbank’s measures during the coronavirus crisis are summa-
rised in Table 1. In its programme for corporate lending via banks, which was adjusted
slightly at the start of March, the Riksbank offers banks the opportunity to borrow up
to SEK 500 billion to stimulate their lending to Swedish non-financial corporations.3
Within the envelope for the asset-purchase programme, the Riksbank will purchase
securities until the end of 2021 for up to SEK 700 billion. In addition to bond pur-
chases, the envelope for asset purchases of SEK 700 billion covers both the Riksbank’s
holdings of treasury bills and the offer to purchase commercial paper.4 The Riksbank is
also offering the banks loans in US dollars on a monthly basis and loans in Swedish
kronor on a weekly basis in extraordinary market operations.5 In addition, the Riks-
bank has lowered the interest rate in the standing facilities and eased requirements
for collateral in loans to banks.
In light of the stabilisation of the financial markets, demand has been low in some of
the Riksbank’s programmes for a longer period. In the programme for corporate lend-
ing via the banks, for example, a large proportion of the loans have fallen due and, at
present, SEK 31 billion remains in this lending facility after a couple of banks chose to
renew their loans. The reduced demand for credit in the various lending facilities
means that the Riksbank deems that it is sufficient at present to offer the banks loans
under the framework of extraordinary market operations on a monthly basis, rather
than a weekly one. This change will enter into force as of 3 May 2021. The Riksbank
intends to make a similar change in frequency to the offer to purchase commercial pa-
per. How often the Riksbank offers different types of credit or purchases securities
3 The first funding to support corporate lending was issued on 20 March 2020 under the programme "Loans to banks for onward lending to companies". On 10 March 2021, the Executive Board decided to stop offer-ing further funding under this programme and instead start a new, similar funding for lending programme called “Funding to banks to support corporate lending (UBF)”. 4 The purchase programme thereby takes the short maturities of treasury bills and commercial paper into account. 5 The decision to offer loans in US dollars has been extended on two occasions and now applies up to and including 30 September 2021. As from 1 April 2021, auctions will take place once a month.
Monetary policy continues to support economic developments and inflation
14
will be adjusted in this way if conditions change and the frequency can rapidly be
shifted upwards again should such a need arise.
Since the pandemic started, the Riksbank has deemed it appropriate for a large part
of the surplus liquidity in the banking system to be deposited over night at the Riks-
bank. This has been achieved by restricting the volume of Riksbank Certificates of-
fered to the banks for sale. The Riksbank has thereby ensured that there is enough li-
quidity over night to prevent any frictions on the overnight loan market.
Monetary policy needs to remain enduring
Supported by the comprehensive economic policy support measures, the recovery is
making good progress. It is positive that, after the dramatic fall in GDP last spring, the
recovery is now expected to proceed slightly more rapidly than in previous assess-
ments, which could suggest that there is less need for an expansionary monetary pol-
icy. However, uncertainty over the recovery remains high and, even if resource utilisa-
tion is contributing to cost pressures rising and inflation thus gradually approaching
the target of 2 per cent, a continued expansionary monetary policy will be needed
over the next few years for inflation to become close to the inflation target more per-
manently.
While vulnerabilities may certainly accumulate under a highly expansionary monetary
policy, there are also risks associated with reducing support too early. Like many other
central banks, the Riksbank deems that the risks associated with reducing stimulation
measures too soon are greater than the risks of keeping them for slightly too long.
Zero interest rate and continued asset purchases
The Riksbank will continue, as planned, to purchase securities and offer liquidity
within all the programmes that have been launched. The Executive Board’s current as-
sessment is that the envelope for asset purchases will be fully utilised by the end of
2021. Not fully utilising the envelope could lead to an unwanted tightening of the fi-
nancial conditions. The Executive Board has also decided to hold the policy rate at
zero per cent. The repo rate is expected to remain at zero per cent for the entire fore-
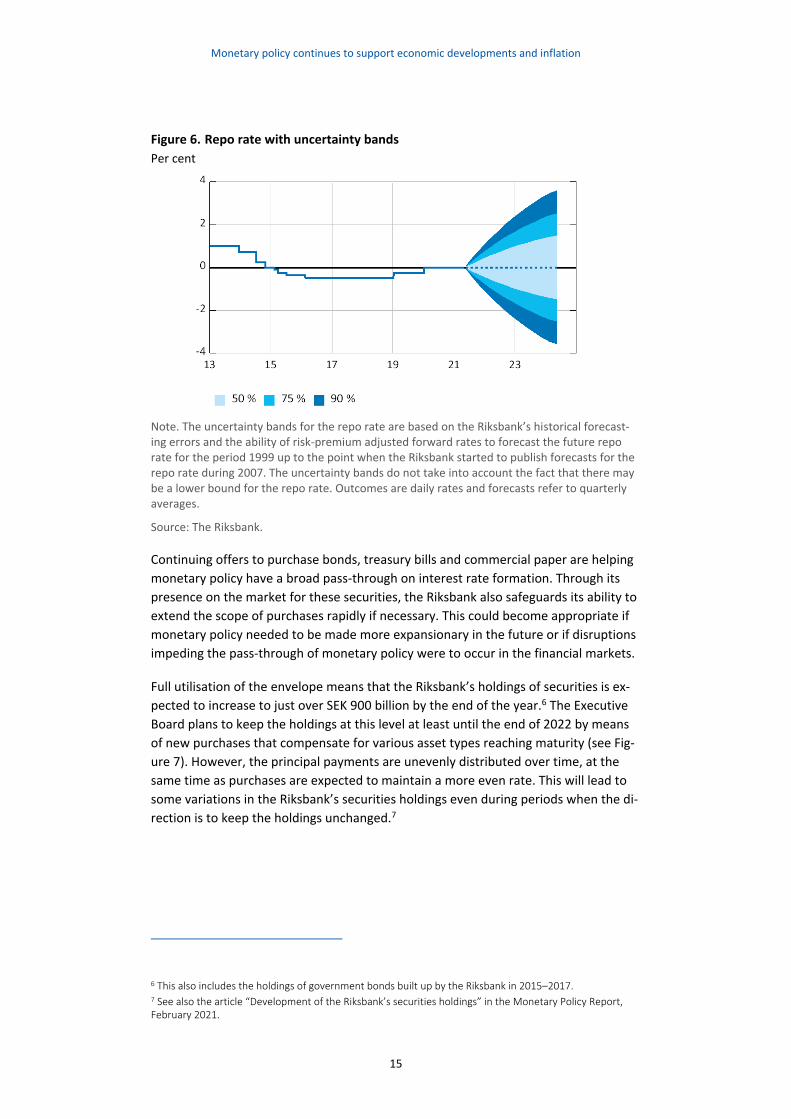
cast period (see Figure 6).
Monetary policy continues to support economic developments and inflation
15
Figure 6. Repo rate with uncertainty bands
Per cent
Note. The uncertainty bands for the repo rate are based on the Riksbank’s historical forecast-ing errors and the ability of risk-premium adjusted forward rates to forecast the future repo rate for the period 1999 up to the point when the Riksbank started to publish forecasts for the repo rate during 2007. The uncertainty bands do not take into account the fact that there may be a lower bound for the repo rate. Outcomes are daily rates and forecasts refer to quarterly averages.
Source: The Riksbank.
Continuing offers to purchase bonds, treasury bills and commercial paper are helping
monetary policy have a broad pass-through on interest rate formation. Through its
presence on the market for these securities, the Riksbank also safeguards its ability to
extend the scope of purchases rapidly if necessary. This could become appropriate if
monetary policy needed to be made more expansionary in the future or if disruptions
impeding the pass-through of monetary policy were to occur in the financial markets.
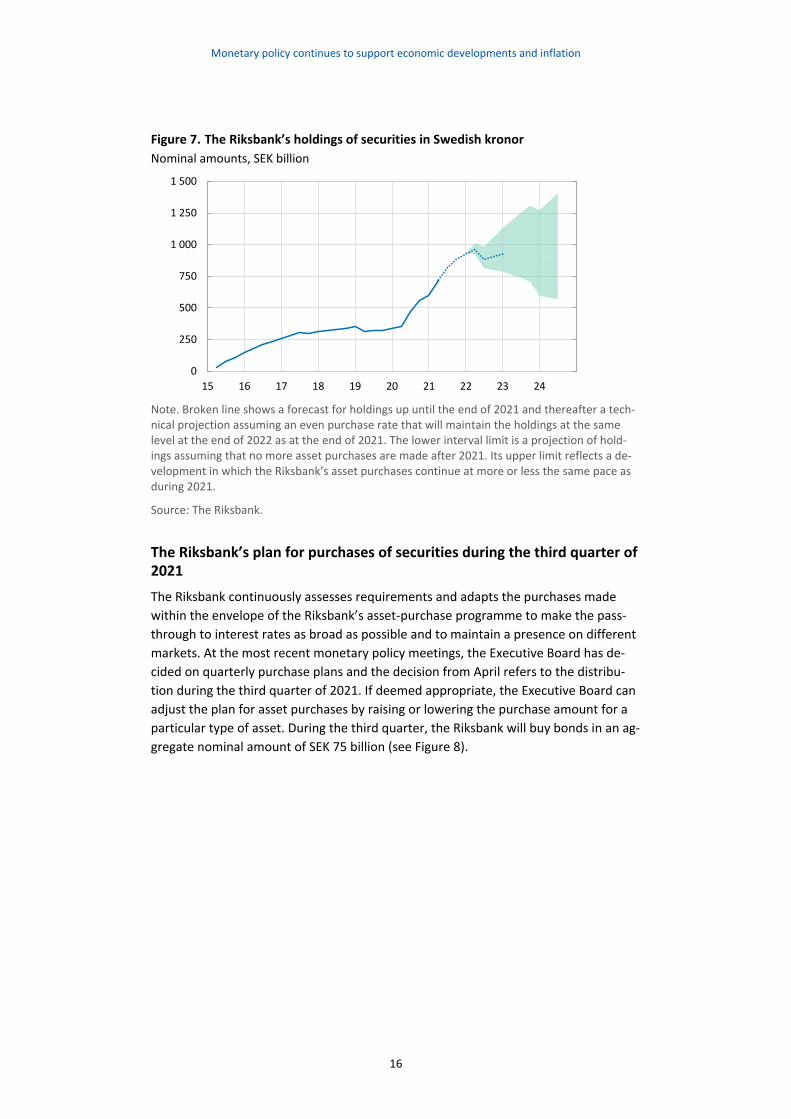
Full utilisation of the envelope means that the Riksbank’s holdings of securities is ex-
pected to increase to just over SEK 900 billion by the end of the year.6 The Executive
Board plans to keep the holdings at this level at least until the end of 2022 by means
of new purchases that compensate for various asset types reaching maturity (see Fig-
ure 7). However, the principal payments are unevenly distributed over time, at the
same time as purchases are expected to maintain a more even rate. This will lead to
some variations in the Riksbank’s securities holdings even during periods when the di-
rection is to keep the holdings unchanged.7
6 This also includes the holdings of government bonds built up by the Riksbank in 2015–2017. 7 See also the article “Development of the Riksbank’s securities holdings” in the Monetary Policy Report, February 2021.
Monetary policy continues to support economic developments and inflation
16
Figure 7. The Riksbank’s holdings of securities in Swedish kronor
Nominal amounts, SEK billion
Note. Broken line shows a forecast for holdings up until the end of 2021 and thereafter a tech-nical projection assuming an even purchase rate that will maintain the holdings at the same level at the end of 2022 as at the end of 2021. The lower interval limit is a projection of hold-ings assuming that no more asset purchases are made after 2021. Its upper limit reflects a de-velopment in which the Riksbank’s asset purchases continue at more or less the same pace as during 2021.
Source: The Riksbank.
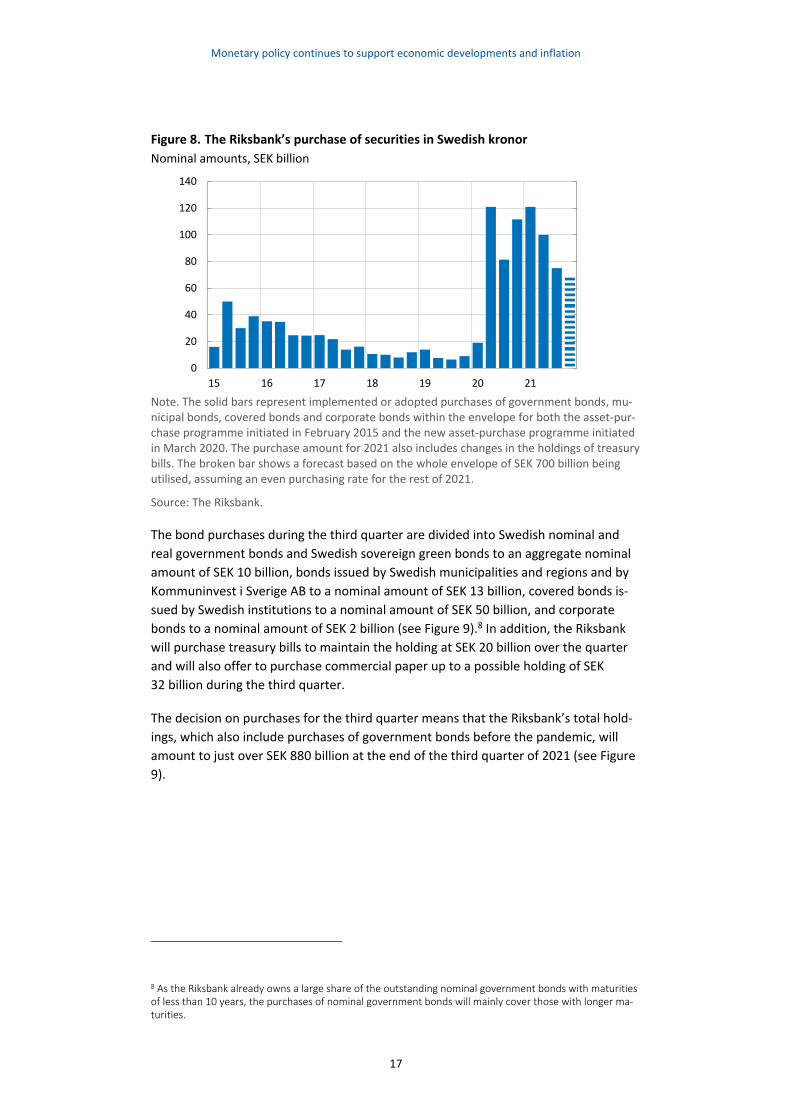
The Riksbank’s plan for purchases of securities during the third quarter of 2021
The Riksbank continuously assesses requirements and adapts the purchases made
within the envelope of the Riksbank’s asset-purchase programme to make the pass-
through to interest rates as broad as possible and to maintain a presence on different
markets. At the most recent monetary policy meetings, the Executive Board has de-
cided on quarterly purchase plans and the decision from April refers to the distribu-
tion during the third quarter of 2021. If deemed appropriate, the Executive Board can
adjust the plan for asset purchases by raising or lowering the purchase amount for a
particular type of asset. During the third quarter, the Riksbank will buy bonds in an ag-
gregate nominal amount of SEK 75 billion (see Figure 8).
0
250
500
750
1 000
1 250
1 500
15 16 17 18 19 20 21 22 23 24
Monetary policy continues to support economic developments and inflation
17
Figure 8. The Riksbank’s purchase of securities in Swedish kronor
Nominal amounts, SEK billion
Note. The solid bars represent implemented or adopted purchases of government bonds, mu-nicipal bonds, covered bonds and corporate bonds within the envelope for both the asset-pur-chase programme initiated in February 2015 and the new asset-purchase programme initiated in March 2020. The purchase amount for 2021 also includes changes in the holdings of treasury bills. The broken bar shows a forecast based on the whole envelope of SEK 700 billion being utilised, assuming an even purchasing rate for the rest of 2021.
Source: The Riksbank.
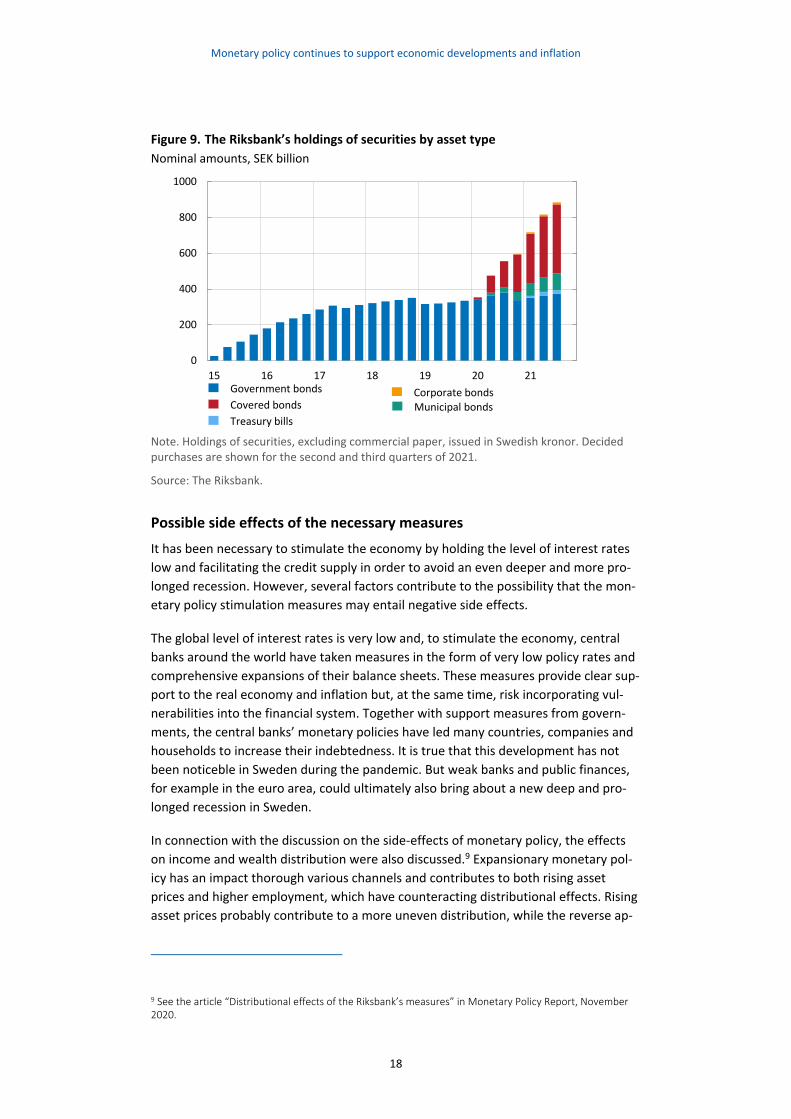
The bond purchases during the third quarter are divided into Swedish nominal and
real government bonds and Swedish sovereign green bonds to an aggregate nominal
amount of SEK 10 billion, bonds issued by Swedish municipalities and regions and by
Kommuninvest i Sverige AB to a nominal amount of SEK 13 billion, covered bonds is-
sued by Swedish institutions to a nominal amount of SEK 50 billion, and corporate
bonds to a nominal amount of SEK 2 billion (see Figure 9).8 In addition, the Riksbank
will purchase treasury bills to maintain the holding at SEK 20 billion over the quarter
and will also offer to purchase commercial paper up to a possible holding of SEK
32 billion during the third quarter.
The decision on purchases for the third quarter means that the Riksbank’s total hold-
ings, which also include purchases of government bonds before the pandemic, will
amount to just over SEK 880 billion at the end of the third quarter of 2021 (see Figure
9).
8 As the Riksbank already owns a large share of the outstanding nominal government bonds with maturities of less than 10 years, the purchases of nominal government bonds will mainly cover those with longer ma-turities.
0
20
40
60
80
100
120
140
15 16 17 18 19 20 21
Monetary policy continues to support economic developments and inflation
18
Figure 9. The Riksbank’s holdings of securities by asset type
Nominal amounts, SEK billion
Note. Holdings of securities, excluding commercial paper, issued in Swedish kronor. Decided purchases are shown for the second and third quarters of 2021.
Source: The Riksbank.
Possible side effects of the necessary measures
It has been necessary to stimulate the economy by holding the level of interest rates
low and facilitating the credit supply in order to avoid an even deeper and more pro-
longed recession. However, several factors contribute to the possibility that the mon-
etary policy stimulation measures may entail negative side effects.
The global level of interest rates is very low and, to stimulate the economy, central
banks around the world have taken measures in the form of very low policy rates and
comprehensive expansions of their balance sheets. These measures provide clear sup-
port to the real economy and inflation but, at the same time, risk incorporating vul-
nerabilities into the financial system. Together with support measures from govern-
ments, the central banks’ monetary policies have led many countries, companies and
households to increase their indebtedness. It is true that this development has not
been noticeble in Sweden during the pandemic. But weak banks and public finances,
for example in the euro area, could ultimately also bring about a new deep and pro-
longed recession in Sweden.
In connection with the discussion on the side-effects of monetary policy, the effects
on income and wealth distribution were also discussed.9 Expansionary monetary pol-
icy has an impact thorough various channels and contributes to both rising asset
prices and higher employment, which have counteracting distributional effects. Rising
asset prices probably contribute to a more uneven distribution, while the reverse ap-
9 See the article “Distributional effects of the Riksbank’s measures” in Monetary Policy Report, November 2020.
0
200
400
600
800
1000
15 16 17 18 19 20 21Government bonds
Covered bonds
Treasury bills
Corporate bondsMunicipal bonds
Monetary policy continues to support economic developments and inflation
19
plies in the case of a higher level of employment. However, over a longer period, in-
cluding both an economic downturn and an upswing, the total effect becomes
smaller, as monetary policy first becomes more expansionary and then less expan-
sionary. Monetary policy is not particularly well suited to use in redistribution policy
and neither is this the Riksbank’s task.
The Riksbank continually analyses which possible side effects monetary policy may
have for the Swedish economy. Low interest rates can create the incentive for exces-
sive risk-taking, homes and other assets can become overvalued, leading to risks be-
ing incorrectly priced and to indebtedness among various economic agents increasing
in an unsustainable manner. The Riksbank has repeatedly warned of shortcomings in
the functioning of the Swedish housing market. Vulnerabilities linked to the high in-
debtedness of Swedish households and the major exposures of banks to property
have increased further.10 In the wake of the comprehensive crisis measures, but also
due to behavioural changes among households, the downturn in housing prices many
have been expecting failed to materialise during the crisis (see the article “Rapidly ris-
ing housing prices during the coronavirus crisis”). As households largely finance their
housing purchases with mortgages, the household sector’s debts have increased fur-
ther during the pandemic, making households even more sensitive to both falling
prices on the housing market and rising interest rate costs. The Riksbank supports Fi-
nansinspektionen's proposal not to extend the possibility for an exemption to the
amortisation requirement after 31 August 2021.
The vulnerabilities and long-term risks that could accumulate through the expansion-
ary global monetary policy have been subordinated to the need to counteract the im-
mediate economic consequences of the pandemic and restrain the dramatic fall of
GDP and employment in Sweden and other countries. However, as the global econ-
omy recovers, it will be reasonable to focus more on the issue of how these vulnera-
bilities can best be managed.
Fiscal policy has important tools and responsibilities
Over the last year, monetary policy and fiscal policy have complemented each other
and thereby been able to mitigate the crisis and facilitate the recovery more effi-
ciently. The Riksbank’s measures have contributed to a well-functioning credit supply
and to low interest rates throughout the economy, at the same time as fiscal policy
has provided accurate support to sectors in which the negative effects of the pan-
demic have been particularly substantial. Interest rates are now low and public fi-
nances are strong. This makes it possible to continue to provide comprehensive eco-
nomic policy support. The Riksbank’s forecasts for the economic recovery also assume
that there is continued fiscal policy support. In addition, fiscal policy has tools for
managing the risks and vulnerabilities that the stimulation measures could build up in
the Swedish economy. For example, mitigating the risks associated with household in-
10 See also Financial Stability Report 2020:2.
Monetary policy continues to support economic developments and inflation
20
debtedness primarily requires housing and tax policy measures. Fiscal policy is also re-
sponsible for counteracting unwanted distributional effects and has the most effec-
tive distribution policy tools at its disposal.
1.3 If developments take a different direction, monetary policy can be adjusted
The high uncertainty that surrounds the Riksbank’s main scenario in both short and
long terms remains. The uncertainty stemming from the pandemic and its economic
consequences is illustrated by a better and a worse scenario in the article “Alternative
scenarios for economic developments”. The outlook for economic activity and infla-
tion is still strongly affected by the way the spread of infection is developing. One risk
is that vaccination will proceed less speedily or will be less effective against virus mu-
tations than expected in the main scenario. This could lead to a worse scenario with a
slower recovery in the service sectors as a result. On the other hand, the pent-up de-
mand may be underestimated and supply restrictions overestimated in the main sce-
nario. In a more favourable scenario, confidence among consumers and companies
may therefore increase more rapidly than expected, with higher consumption, invest-
ment and employment as a consequence. There are factors in these alternative sce-
narios that could lead to both higher and lower inflation.
This uncertainty is not exclusively linked to the development of the pandemic. Since
the start of the year, long government bond yields have risen in the United States.
This development is closely connected to the market’s expectations of stronger eco-
nomic developments and higher inflation, among other reasons due to comprehen-
sive fiscal policy stimulation measures. The upturn in long government bond yields in
the United States has spread to Europe, but the upturn here is smaller. Even if long-
term bond yields have also risen in Sweden, they remain very low from a historical
perspective. In addition, the interest rate differentials for more risky bonds in relation
to government bonds remain stable on very low levels. In a recovery phase, it is nor-
mal for investors to shift demand in the direction of more risky assets. However, if
long-term yields were to rise too quickly and by too much, this may have a tightening
effect on global financial conditions, which, in turn, could slow down the economic re-
covery, not least in certain emerging market economies with a high proportion of for-
eign loans in dollars. Tighter financial conditions worldwide would also have negative
effects on the Swedish economy.
The main scenario assumes that there will be comprehensive monetary policy stimu-
lation in the form of low interest rates and a large amount of liquidity in the banking
system for the foreseeable future. In a scenario where the need for monetary policy
stimuli increases, asset purchases and measures to promote lending in the economy
are still important tools. With a policy rate already at zero per cent, the scope for
large rate cuts is limited. But it is entirely possible that the repo rate may be cut, par-
ticularly if confidence in the inflation target were under threat. Several factors that
currently are difficult to assess will determine whether it is appropriate to cut the
repo rate to negative levels again. These factors include the development of the ex-

Monetary policy continues to support economic developments and inflation
21
change rate, how fast the supply side of the economy recovers in relation to the de-
mand side, and how a lower policy rate is assessed to affect interest rates in general
and ultimately consumption and investment. In a scenario with new downturns in the
economy, fiscal policy still has an important role to play. This applies in particular if
economic problems affect certain sectors of society harder than others.
A scenario where inflation rises more quickly during the forecast period need not be a
reason to make monetary policy less expansionary in different ways. If inflation were
to overshoot the target, this could help to anchor inflation expectations more firmly
around 2 per cent, which would be good for price-setting and wage formation.
Monetary policy continues to support economic developments and inflation
22
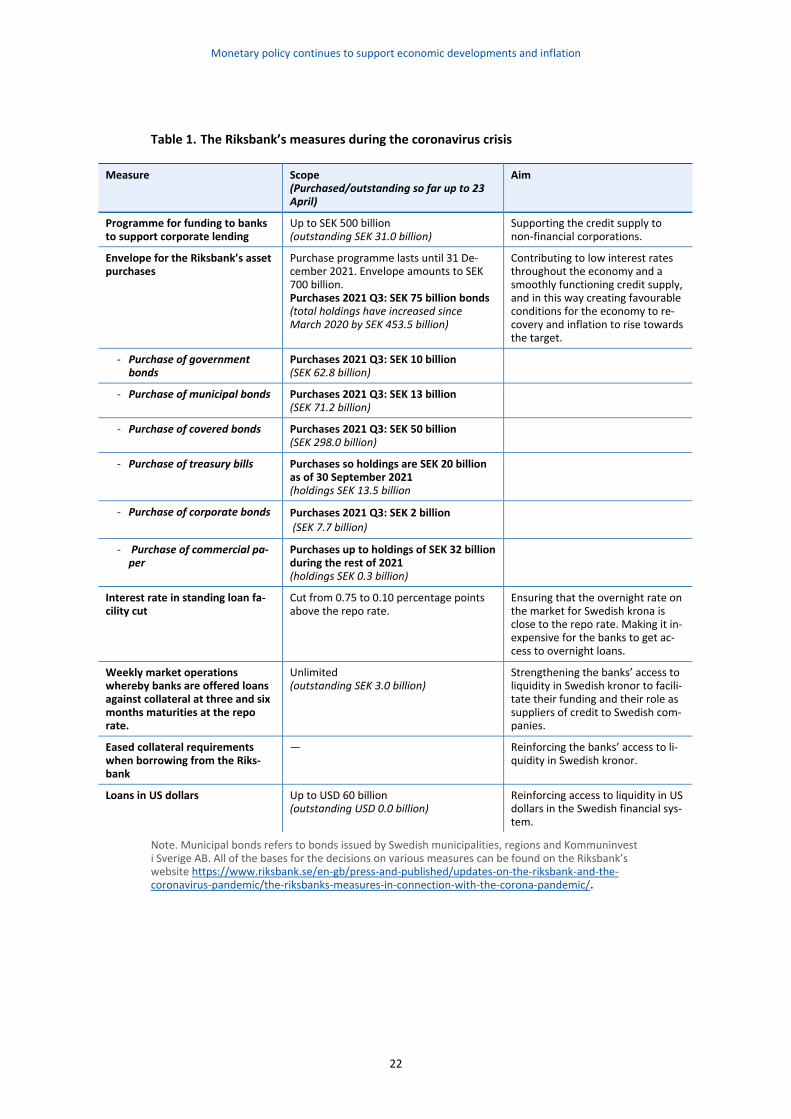
Table 1. The Riksbank’s measures during the coronavirus crisis
Note. Municipal bonds refers to bonds issued by Swedish municipalities, regions and Kommuninvest i Sverige AB. All of the bases for the decisions on various measures can be found on the Riksbank’s website https://www.riksbank.se/en-gb/press-and-published/updates-on-the-riksbank-and-the-coronavirus-pandemic/the-riksbanks-measures-in-connection-with-the-corona-pandemic/.
Measure Scope (Purchased/outstanding so far up to 23 April)
Aim
Programme for funding to banks to support corporate lending
Up to SEK 500 billion (outstanding SEK 31.0 billion)
Supporting the credit supply to non-financial corporations.
Envelope for the Riksbank’s asset purchases
Purchase programme lasts until 31 De-cember 2021. Envelope amounts to SEK 700 billion. Purchases 2021 Q3: SEK 75 billion bonds (total holdings have increased since March 2020 by SEK 453.5 billion)
Contributing to low interest rates throughout the economy and a smoothly functioning credit supply, and in this way creating favourable conditions for the economy to re-covery and inflation to rise towards the target.
- Purchase of government bonds
Purchases 2021 Q3: SEK 10 billion (SEK 62.8 billion)
- Purchase of municipal bonds Purchases 2021 Q3: SEK 13 billion (SEK 71.2 billion)
- Purchase of covered bonds Purchases 2021 Q3: SEK 50 billion (SEK 298.0 billion)
- Purchase of treasury bills Purchases so holdings are SEK 20 billion as of 30 September 2021 (holdings SEK 13.5 billion
- Purchase of corporate bonds Purchases 2021 Q3: SEK 2 billion (SEK 7.7 billion)
- Purchase of commercial pa-per
Purchases up to holdings of SEK 32 billion during the rest of 2021 (holdings SEK 0.3 billion)
Interest rate in standing loan fa-cility cut
Cut from 0.75 to 0.10 percentage points above the repo rate.
Ensuring that the overnight rate on the market for Swedish krona is close to the repo rate. Making it in-expensive for the banks to get ac-cess to overnight loans.
Weekly market operations whereby banks are offered loans against collateral at three and six months maturities at the repo rate.
Unlimited (outstanding SEK 3.0 billion)
Strengthening the banks’ access to liquidity in Swedish kronor to facili-tate their funding and their role as suppliers of credit to Swedish com-panies.
Eased collateral requirements when borrowing from the Riks-bank
— Reinforcing the banks’ access to li-quidity in Swedish kronor.
Loans in US dollars Up to USD 60 billion (outstanding USD 0.0 billion)
Reinforcing access to liquidity in US dollars in the Swedish financial sys-tem.
Continued economic recovery is impacting financial markets
23
2 Continued economic recovery is impacting financial markets
Continuing vaccination and an expansionary economic policy are creating
good conditions for the economic recovery. This has contributed to price
rises for higher risk assets, even though the spread of infection has in-
creased over the winter and spring, and the restrictions have been exten-
sive. At the same time, brighter future prospects for the US economy in
the wake of strong fiscal policy stimulus measures have led to a lower
demand for US government bonds with longer maturities. As the supply
of these bonds is also increasing as a result of the expansionary fiscal
policy, US government bond yields have risen.
To a certain extent, the rising US yields have spread to other bond mar-
kets and countries, including Sweden. However, the level of interest
rates continues to be very low and interest rates on the Swedish money
market are close to the repo rate. The Swedish stock exchange has devel-
oped strongly, while the Swedish krona has depreciated slightly since the
start of the year. Corporate bank borrowing has been slightly subdued in
recent months, but the downturn has been counteracted, to a certain ex-
tent, by rising wholesale funding. The financial conditions in Sweden and
abroad are considered to remain expansionary, largely as a result of the
economic policy support measures.
2.1 Brighter future prospects are creating higher demand for high-risk assets
Continued vaccinations and an expansionary economic policy, among other things in
the form of powerful US fiscal policy stimulus, are contributing to optimism over the
conditions for the global economic recovery. Risk appetite on the financial markets is
therefore high, even though the governments of many countries have introduced
new, tighter restrictions in response to the rapid spread of infection.
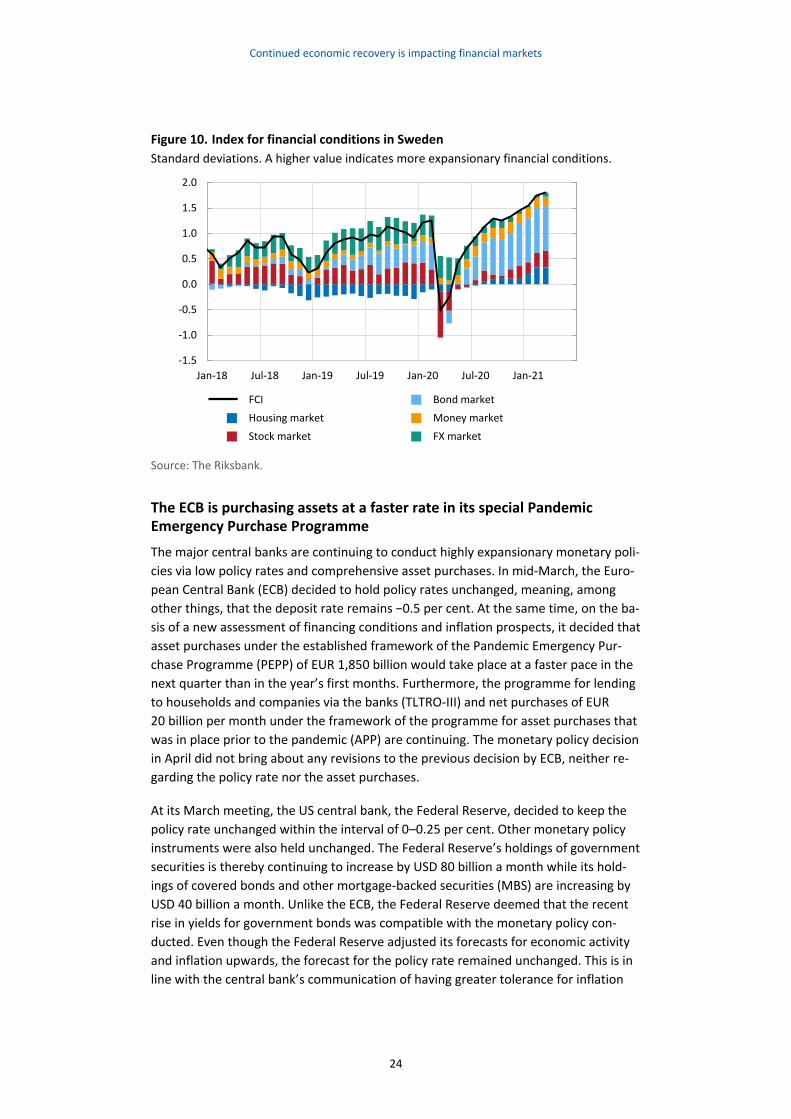
Even though the rise in US long-term interest rates has, to some extent, spread to
other bond markets and other countries, including Sweden, interest rates remain his-
torically low. The Riksbank’s index for financial conditions, which summarises the situ-
ation on various financial sub-markets in Sweden, indicates that the development of
all sub-markets is helping make conditions expansionary. This applies, in particular, to
the development of the bond markets (see Figure 10).
Continued economic recovery is impacting financial markets
24
Figure 10. Index for financial conditions in Sweden
Standard deviations. A higher value indicates more expansionary financial conditions.
Source: The Riksbank.
The ECB is purchasing assets at a faster rate in its special Pandemic Emergency Purchase Programme
The major central banks are continuing to conduct highly expansionary monetary poli-
cies via low policy rates and comprehensive asset purchases. In mid-March, the Euro-
pean Central Bank (ECB) decided to hold policy rates unchanged, meaning, among
other things, that the deposit rate remains −0.5 per cent. At the same time, on the ba-
sis of a new assessment of financing conditions and inflation prospects, it decided that
asset purchases under the established framework of the Pandemic Emergency Pur-
chase Programme (PEPP) of EUR 1,850 billion would take place at a faster pace in the
next quarter than in the year’s first months. Furthermore, the programme for lending
to households and companies via the banks (TLTRO-III) and net purchases of EUR
20 billion per month under the framework of the programme for asset purchases that
was in place prior to the pandemic (APP) are continuing. The monetary policy decision
in April did not bring about any revisions to the previous decision by ECB, neither re-
garding the policy rate nor the asset purchases.
At its March meeting, the US central bank, the Federal Reserve, decided to keep the
policy rate unchanged within the interval of 0–0.25 per cent. Other monetary policy
instruments were also held unchanged. The Federal Reserve’s holdings of government
securities is thereby continuing to increase by USD 80 billion a month while its hold-
ings of covered bonds and other mortgage-backed securities (MBS) are increasing by
USD 40 billion a month. Unlike the ECB, the Federal Reserve deemed that the recent
rise in yields for government bonds was compatible with the monetary policy con-
ducted. Even though the Federal Reserve adjusted its forecasts for economic activity
and inflation upwards, the forecast for the policy rate remained unchanged. This is in
line with the central bank’s communication of having greater tolerance for inflation
-1.5
-1.0
-0.5
0.0
0.5
1.0
1.5
2.0
Jan-18 Jul-18 Jan-19 Jul-19 Jan-20 Jul-20 Jan-21
FCI
Housing market
Stock market
Bond market
Money market
FX market
Continued economic recovery is impacting financial markets
25
periodically exceeding the inflation target. The Federal Reserve repeated that its tar-
get for employment needed to be met and that lasting higher inflation would be
needed for the interest rate to be raised. The Bank of England also held its policy rate
unchanged at its meeting in March. Neither did it make any changes to its ongoing as-
set purchase programmes.11
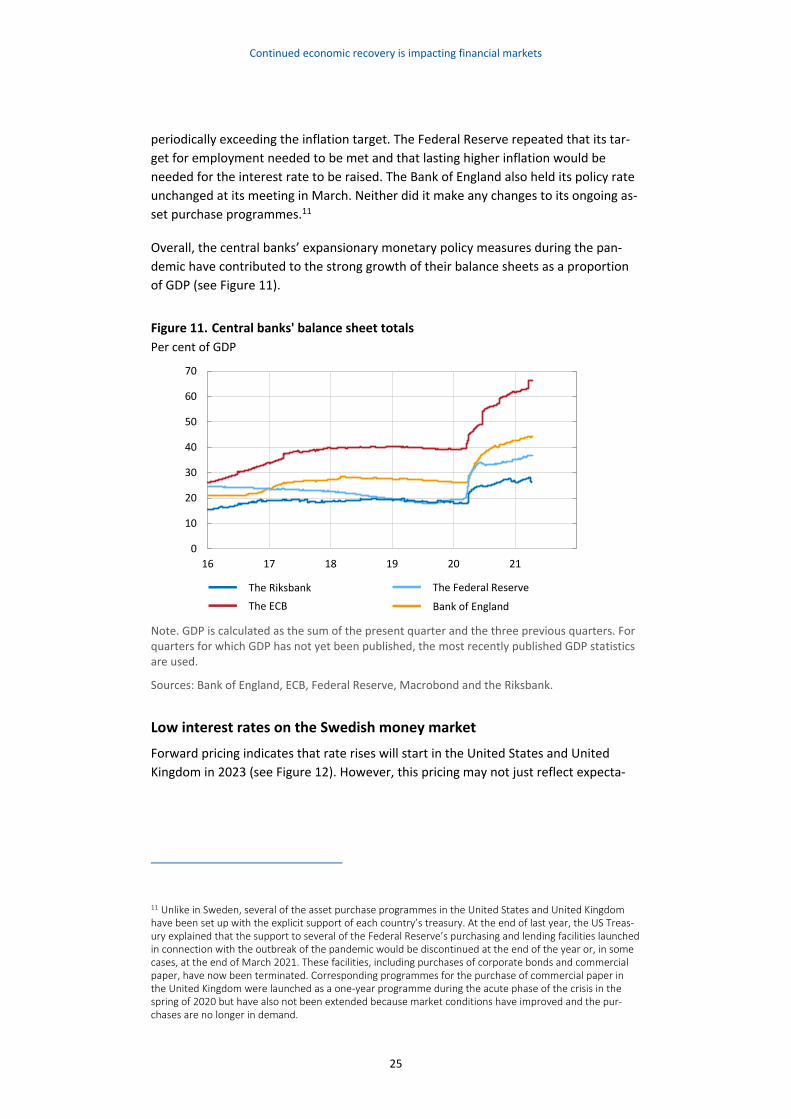
Overall, the central banks’ expansionary monetary policy measures during the pan-
demic have contributed to the strong growth of their balance sheets as a proportion
of GDP (see Figure 11).
Figure 11. Central banks' balance sheet totals
Per cent of GDP
Note. GDP is calculated as the sum of the present quarter and the three previous quarters. For quarters for which GDP has not yet been published, the most recently published GDP statistics are used.
Sources: Bank of England, ECB, Federal Reserve, Macrobond and the Riksbank.
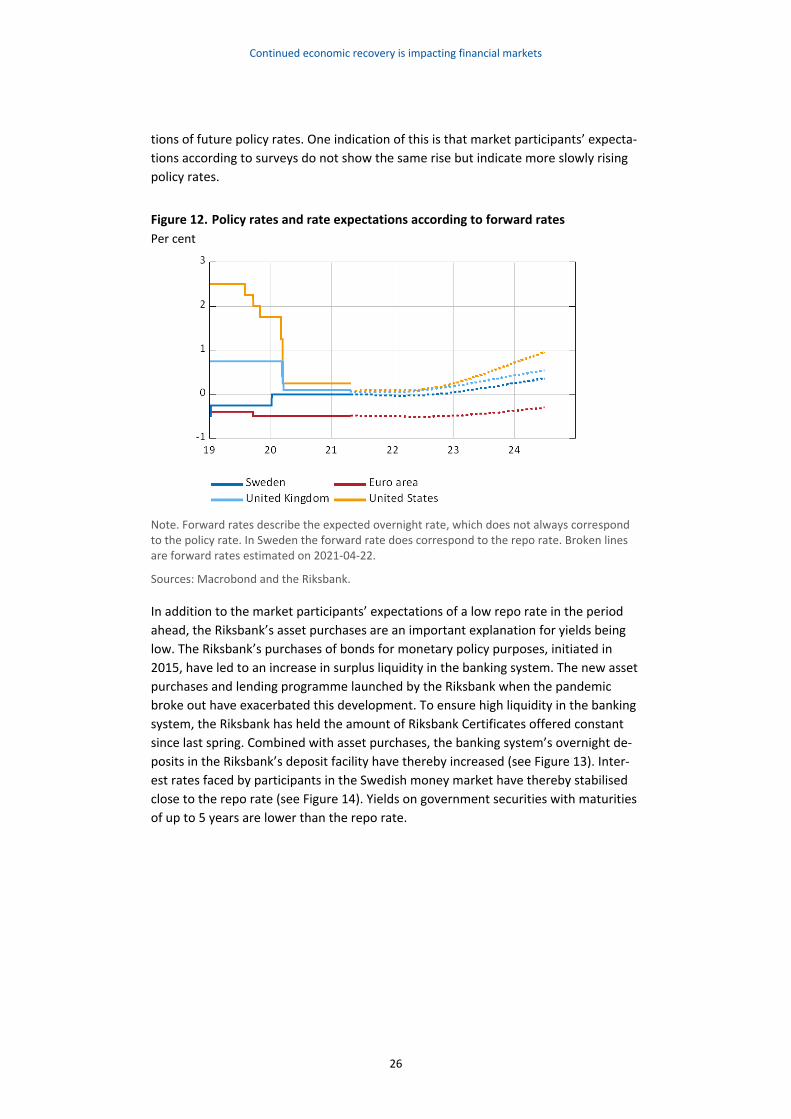
Low interest rates on the Swedish money market
Forward pricing indicates that rate rises will start in the United States and United
Kingdom in 2023 (see Figure 12). However, this pricing may not just reflect expecta-
11 Unlike in Sweden, several of the asset purchase programmes in the United States and United Kingdom have been set up with the explicit support of each country’s treasury. At the end of last year, the US Treas-ury explained that the support to several of the Federal Reserve’s purchasing and lending facilities launched in connection with the outbreak of the pandemic would be discontinued at the end of the year or, in some cases, at the end of March 2021. These facilities, including purchases of corporate bonds and commercial paper, have now been terminated. Corresponding programmes for the purchase of commercial paper in the United Kingdom were launched as a one-year programme during the acute phase of the crisis in the spring of 2020 but have also not been extended because market conditions have improved and the pur-chases are no longer in demand.
0
10
20
30
40
50
60
70
16 17 18 19 20 21
The Riksbank
The ECB
The Federal Reserve
Bank of England
Continued economic recovery is impacting financial markets
26
tions of future policy rates. One indication of this is that market participants’ expecta-
tions according to surveys do not show the same rise but indicate more slowly rising
policy rates.
Figure 12. Policy rates and rate expectations according to forward rates
Per cent
Note. Forward rates describe the expected overnight rate, which does not always correspond to the policy rate. In Sweden the forward rate does correspond to the repo rate. Broken lines are forward rates estimated on 2021-04-22.
Sources: Macrobond and the Riksbank.
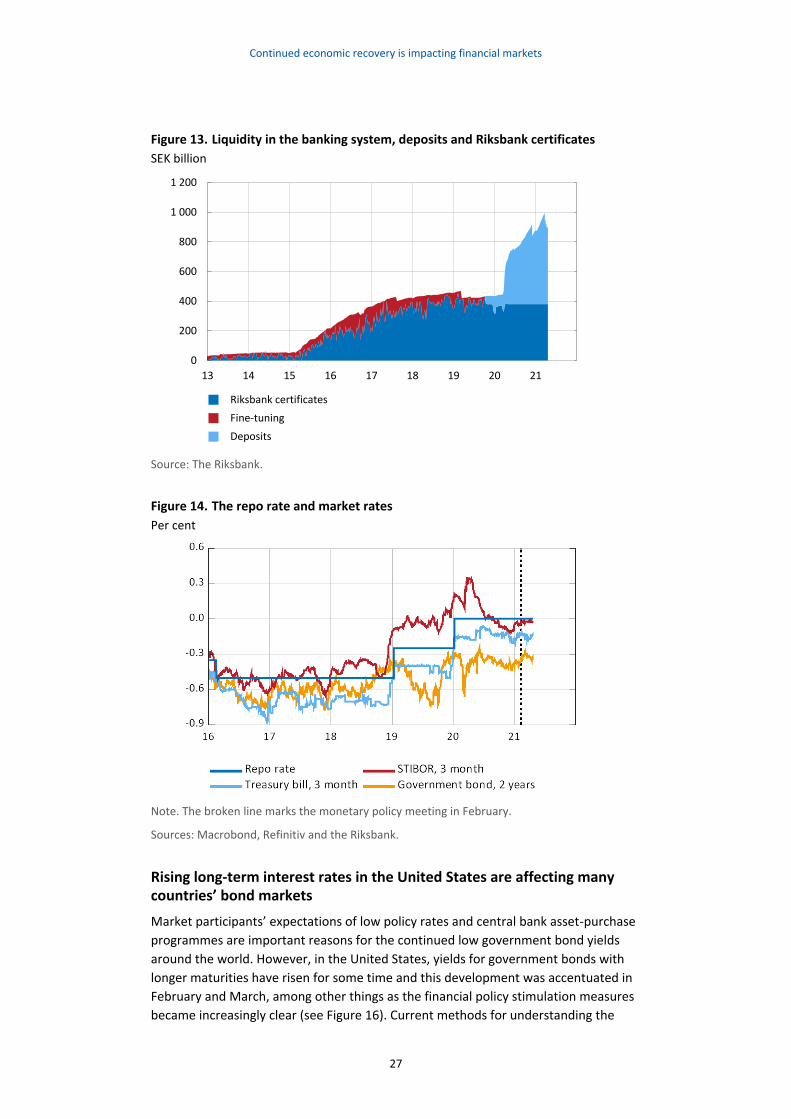
In addition to the market participants’ expectations of a low repo rate in the period
ahead, the Riksbank’s asset purchases are an important explanation for yields being
low. The Riksbank’s purchases of bonds for monetary policy purposes, initiated in
2015, have led to an increase in surplus liquidity in the banking system. The new asset
purchases and lending programme launched by the Riksbank when the pandemic
broke out have exacerbated this development. To ensure high liquidity in the banking
system, the Riksbank has held the amount of Riksbank Certificates offered constant
since last spring. Combined with asset purchases, the banking system’s overnight de-
posits in the Riksbank’s deposit facility have thereby increased (see Figure 13). Inter-
est rates faced by participants in the Swedish money market have thereby stabilised
close to the repo rate (see Figure 14). Yields on government securities with maturities
of up to 5 years are lower than the repo rate.
Continued economic recovery is impacting financial markets
27
Figure 13. Liquidity in the banking system, deposits and Riksbank certificates
SEK billion
Source: The Riksbank.
Figure 14. The repo rate and market rates
Per cent
Note. The broken line marks the monetary policy meeting in February.
Sources: Macrobond, Refinitiv and the Riksbank.
Rising long-term interest rates in the United States are affecting many countries’ bond markets
Market participants’ expectations of low policy rates and central bank asset-purchase
programmes are important reasons for the continued low government bond yields
around the world. However, in the United States, yields for government bonds with
longer maturities have risen for some time and this development was accentuated in
February and March, among other things as the financial policy stimulation measures
became increasingly clear (see Figure 16). Current methods for understanding the
0
200
400
600
800
1 000
1 200
13 14 15 16 17 18 19 20 21
Riksbank certificates
Fine-tuning
Deposits
Continued economic recovery is impacting financial markets
28
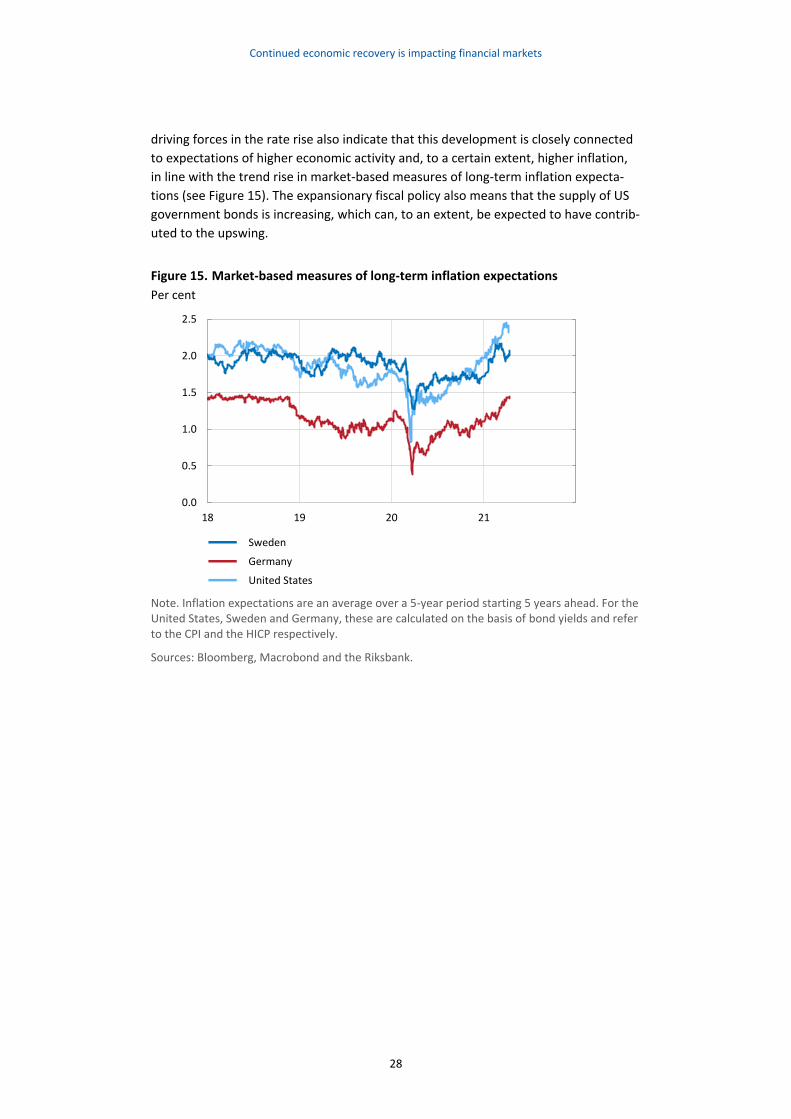
driving forces in the rate rise also indicate that this development is closely connected
to expectations of higher economic activity and, to a certain extent, higher inflation,
in line with the trend rise in market-based measures of long-term inflation expecta-
tions (see Figure 15). The expansionary fiscal policy also means that the supply of US
government bonds is increasing, which can, to an extent, be expected to have contrib-
uted to the upswing.
Figure 15. Market-based measures of long-term inflation expectations
Per cent
Note. Inflation expectations are an average over a 5-year period starting 5 years ahead. For the United States, Sweden and Germany, these are calculated on the basis of bond yields and refer to the CPI and the HICP respectively.
Sources: Bloomberg, Macrobond and the Riksbank.
0.0
0.5
1.0
1.5
2.0
2.5
18 19 20 21
Sweden
Germany
United States
Continued economic recovery is impacting financial markets
29
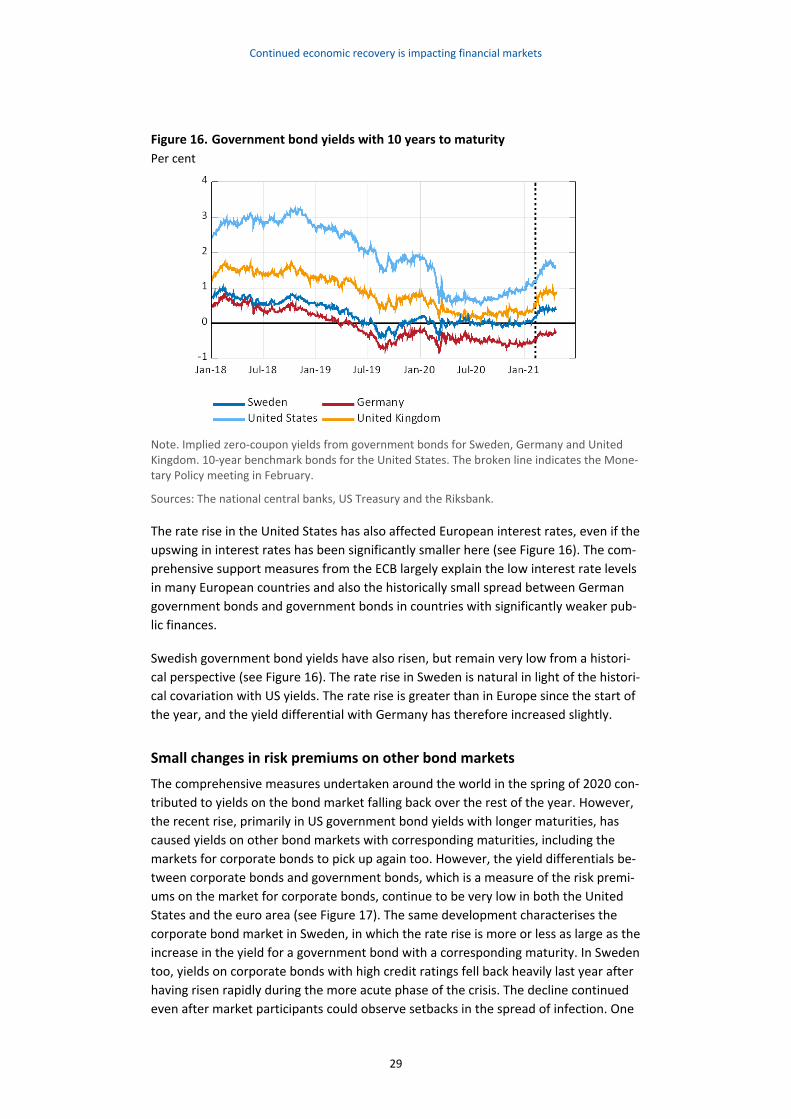
Figure 16. Government bond yields with 10 years to maturity
Per cent
Note. Implied zero-coupon yields from government bonds for Sweden, Germany and United Kingdom. 10-year benchmark bonds for the United States. The broken line indicates the Mone-tary Policy meeting in February.
Sources: The national central banks, US Treasury and the Riksbank.
The rate rise in the United States has also affected European interest rates, even if the
upswing in interest rates has been significantly smaller here (see Figure 16). The com-
prehensive support measures from the ECB largely explain the low interest rate levels
in many European countries and also the historically small spread between German
government bonds and government bonds in countries with significantly weaker pub-
lic finances.
Swedish government bond yields have also risen, but remain very low from a histori-
cal perspective (see Figure 16). The rate rise in Sweden is natural in light of the histori-
cal covariation with US yields. The rate rise is greater than in Europe since the start of
the year, and the yield differential with Germany has therefore increased slightly.
Small changes in risk premiums on other bond markets
The comprehensive measures undertaken around the world in the spring of 2020 con-
tributed to yields on the bond market falling back over the rest of the year. However,
the recent rise, primarily in US government bond yields with longer maturities, has
caused yields on other bond markets with corresponding maturities, including the
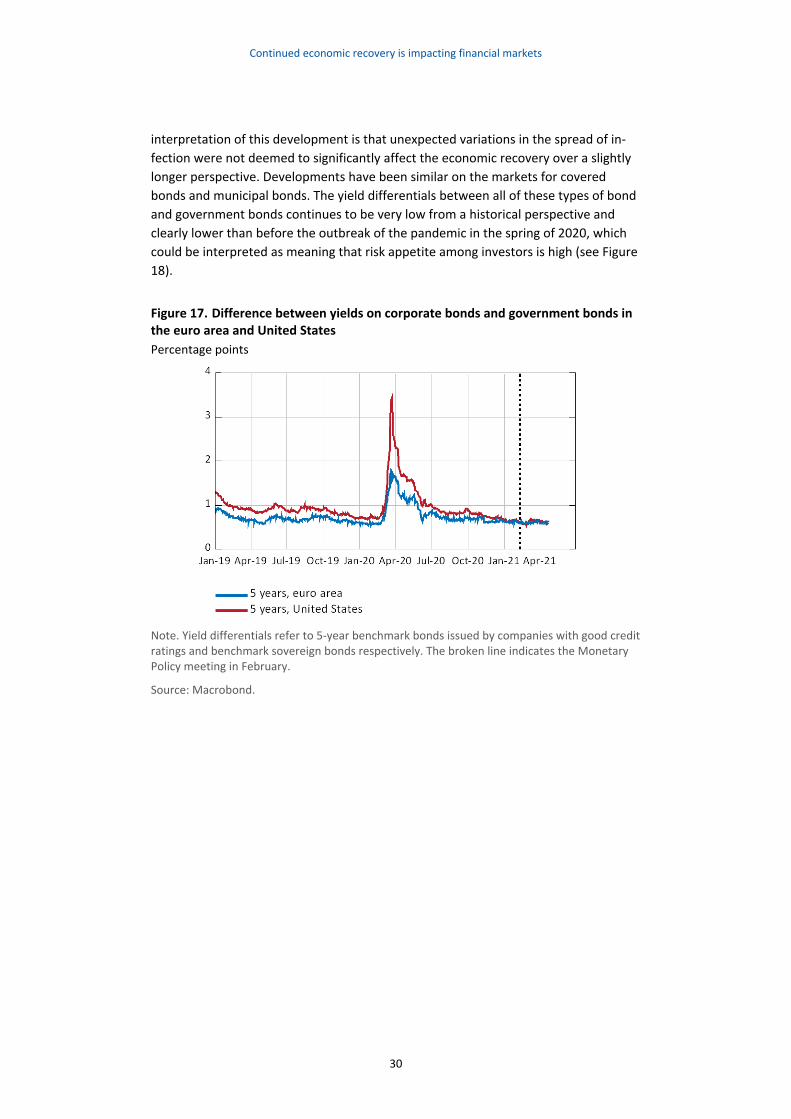
markets for corporate bonds to pick up again too. However, the yield differentials be-
tween corporate bonds and government bonds, which is a measure of the risk premi-
ums on the market for corporate bonds, continue to be very low in both the United
States and the euro area (see Figure 17). The same development characterises the
corporate bond market in Sweden, in which the rate rise is more or less as large as the
increase in the yield for a government bond with a corresponding maturity. In Sweden
too, yields on corporate bonds with high credit ratings fell back heavily last year after
having risen rapidly during the more acute phase of the crisis. The decline continued
even after market participants could observe setbacks in the spread of infection. One
Continued economic recovery is impacting financial markets
30
interpretation of this development is that unexpected variations in the spread of in-
fection were not deemed to significantly affect the economic recovery over a slightly
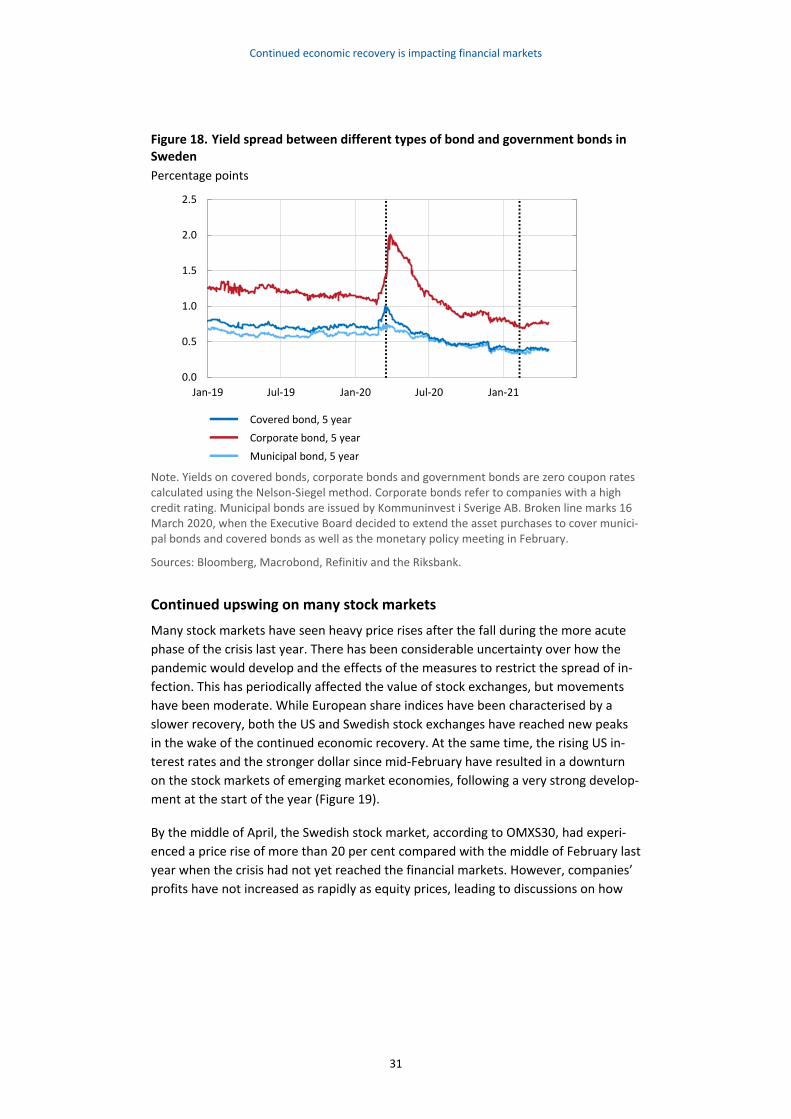
longer perspective. Developments have been similar on the markets for covered
bonds and municipal bonds. The yield differentials between all of these types of bond
and government bonds continues to be very low from a historical perspective and
clearly lower than before the outbreak of the pandemic in the spring of 2020, which
could be interpreted as meaning that risk appetite among investors is high (see Figure
18).
Figure 17. Difference between yields on corporate bonds and government bonds in the euro area and United States
Percentage points
Note. Yield differentials refer to 5-year benchmark bonds issued by companies with good credit ratings and benchmark sovereign bonds respectively. The broken line indicates the Monetary Policy meeting in February.
Source: Macrobond.
Continued economic recovery is impacting financial markets
31
Figure 18. Yield spread between different types of bond and government bonds in Sweden
Percentage points
Note. Yields on covered bonds, corporate bonds and government bonds are zero coupon rates calculated using the Nelson-Siegel method. Corporate bonds refer to companies with a high credit rating. Municipal bonds are issued by Kommuninvest i Sverige AB. Broken line marks 16 March 2020, when the Executive Board decided to extend the asset purchases to cover munici-pal bonds and covered bonds as well as the monetary policy meeting in February.
Sources: Bloomberg, Macrobond, Refinitiv and the Riksbank.
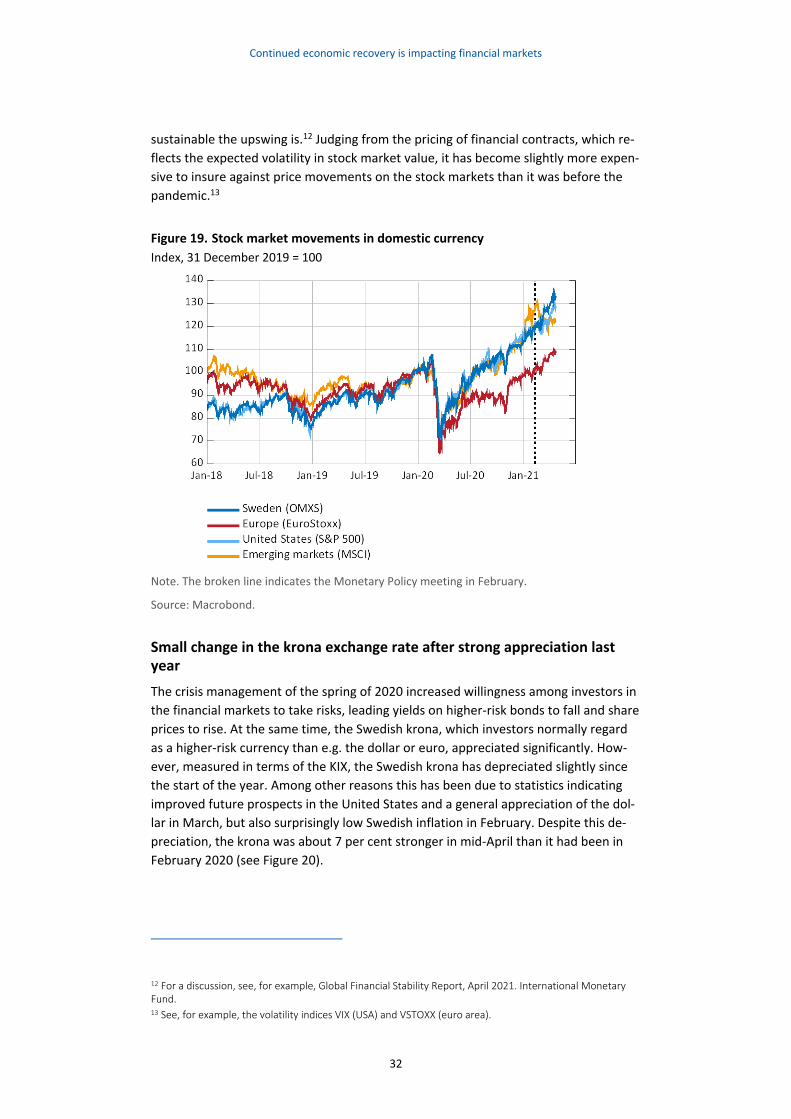
Continued upswing on many stock markets
Many stock markets have seen heavy price rises after the fall during the more acute
phase of the crisis last year. There has been considerable uncertainty over how the
pandemic would develop and the effects of the measures to restrict the spread of in-
fection. This has periodically affected the value of stock exchanges, but movements
have been moderate. While European share indices have been characterised by a
slower recovery, both the US and Swedish stock exchanges have reached new peaks
in the wake of the continued economic recovery. At the same time, the rising US in-
terest rates and the stronger dollar since mid-February have resulted in a downturn
on the stock markets of emerging market economies, following a very strong develop-
ment at the start of the year (Figure 19).
By the middle of April, the Swedish stock market, according to OMXS30, had experi-
enced a price rise of more than 20 per cent compared with the middle of February last
year when the crisis had not yet reached the financial markets. However, companies’
profits have not increased as rapidly as equity prices, leading to discussions on how
0.0
0.5
1.0
1.5
2.0
2.5
Jan-19 Jul-19 Jan-20 Jul-20 Jan-21
Covered bond, 5 year
Corporate bond, 5 year
Municipal bond, 5 year
Continued economic recovery is impacting financial markets
32
sustainable the upswing is.12 Judging from the pricing of financial contracts, which re-
flects the expected volatility in stock market value, it has become slightly more expen-
sive to insure against price movements on the stock markets than it was before the
pandemic.13
Figure 19. Stock market movements in domestic currency
Index, 31 December 2019 = 100
Note. The broken line indicates the Monetary Policy meeting in February.
Source: Macrobond.
Small change in the krona exchange rate after strong appreciation last year
The crisis management of the spring of 2020 increased willingness among investors in
the financial markets to take risks, leading yields on higher-risk bonds to fall and share
prices to rise. At the same time, the Swedish krona, which investors normally regard
as a higher-risk currency than e.g. the dollar or euro, appreciated significantly. How-
ever, measured in terms of the KIX, the Swedish krona has depreciated slightly since
the start of the year. Among other reasons this has been due to statistics indicating
improved future prospects in the United States and a general appreciation of the dol-
lar in March, but also surprisingly low Swedish inflation in February. Despite this de-
preciation, the krona was about 7 per cent stronger in mid-April than it had been in
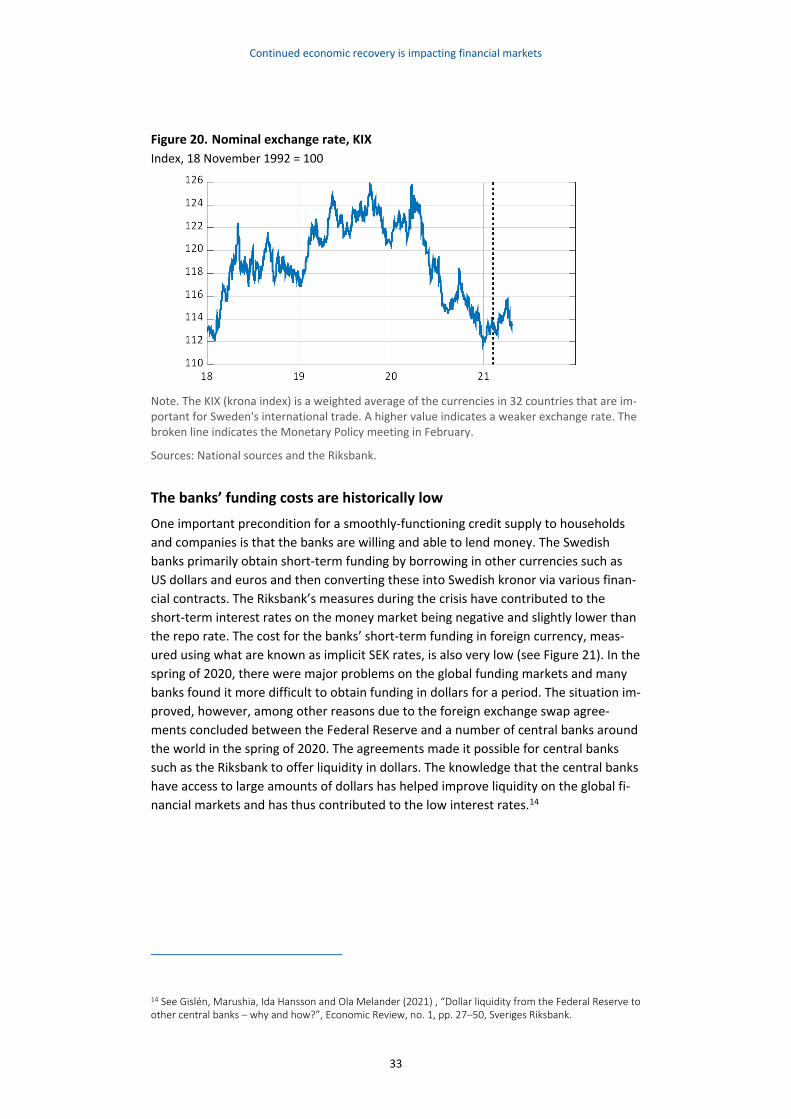
February 2020 (see Figure 20).
12 For a discussion, see, for example, Global Financial Stability Report, April 2021. International Monetary Fund. 13 See, for example, the volatility indices VIX (USA) and VSTOXX (euro area).
Continued economic recovery is impacting financial markets
33
Figure 20. Nominal exchange rate, KIX
Index, 18 November 1992 = 100
Note. The KIX (krona index) is a weighted average of the currencies in 32 countries that are im-portant for Sweden's international trade. A higher value indicates a weaker exchange rate. The broken line indicates the Monetary Policy meeting in February.
Sources: National sources and the Riksbank.
The banks’ funding costs are historically low
One important precondition for a smoothly-functioning credit supply to households
and companies is that the banks are willing and able to lend money. The Swedish
banks primarily obtain short-term funding by borrowing in other currencies such as
US dollars and euros and then converting these into Swedish kronor via various finan-
cial contracts. The Riksbank’s measures during the crisis have contributed to the
short-term interest rates on the money market being negative and slightly lower than
the repo rate. The cost for the banks’ short-term funding in foreign currency, meas-
ured using what are known as implicit SEK rates, is also very low (see Figure 21). In the
spring of 2020, there were major problems on the global funding markets and many
banks found it more difficult to obtain funding in dollars for a period. The situation im-
proved, however, among other reasons due to the foreign exchange swap agree-
ments concluded between the Federal Reserve and a number of central banks around
the world in the spring of 2020. The agreements made it possible for central banks
such as the Riksbank to offer liquidity in dollars. The knowledge that the central banks
have access to large amounts of dollars has helped improve liquidity on the global fi-
nancial markets and has thus contributed to the low interest rates.14
14 See Gislén, Marushia, Ida Hansson and Ola Melander (2021) , “Dollar liquidity from the Federal Reserve to other central banks – why and how?”, Economic Review, no. 1, pp. 27–50, Sveriges Riksbank.
Continued economic recovery is impacting financial markets
34
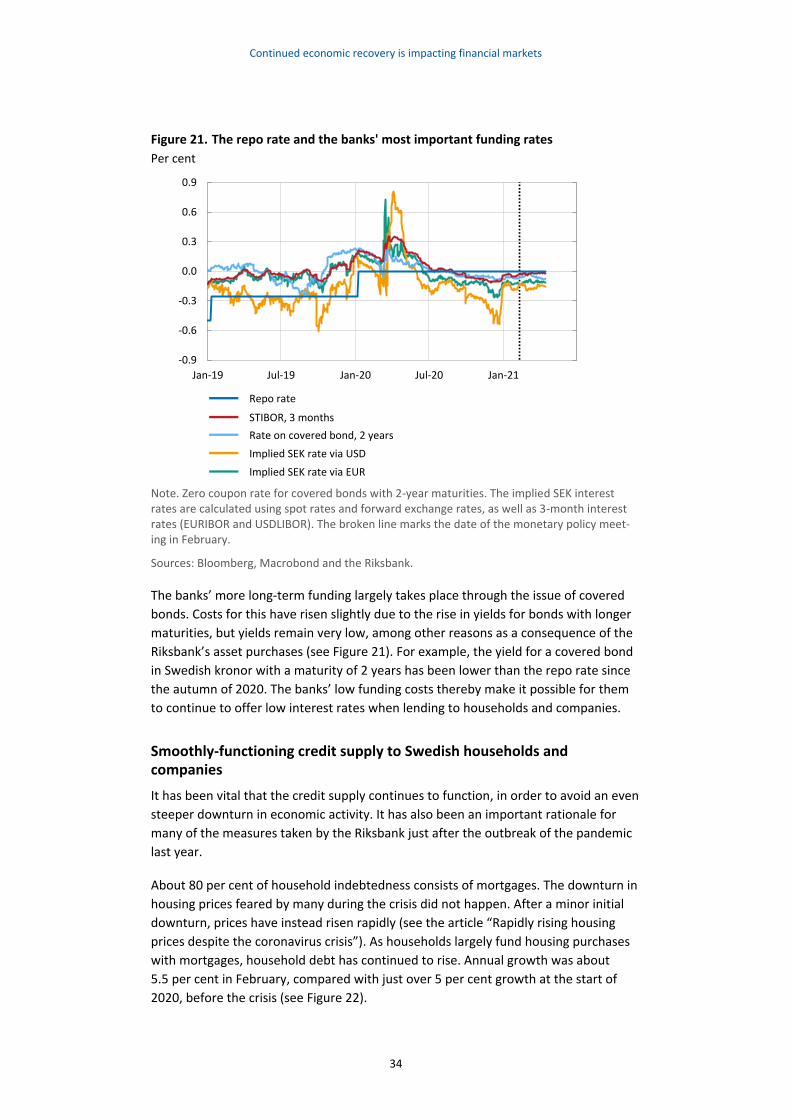
Figure 21. The repo rate and the banks' most important funding rates
Per cent
Note. Zero coupon rate for covered bonds with 2-year maturities. The implied SEK interest rates are calculated using spot rates and forward exchange rates, as well as 3-month interest rates (EURIBOR and USDLIBOR). The broken line marks the date of the monetary policy meet-ing in February.
Sources: Bloomberg, Macrobond and the Riksbank.
The banks’ more long-term funding largely takes place through the issue of covered
bonds. Costs for this have risen slightly due to the rise in yields for bonds with longer
maturities, but yields remain very low, among other reasons as a consequence of the
Riksbank’s asset purchases (see Figure 21). For example, the yield for a covered bond
in Swedish kronor with a maturity of 2 years has been lower than the repo rate since
the autumn of 2020. The banks’ low funding costs thereby make it possible for them
to continue to offer low interest rates when lending to households and companies.
Smoothly-functioning credit supply to Swedish households and companies
It has been vital that the credit supply continues to function, in order to avoid an even
steeper downturn in economic activity. It has also been an important rationale for
many of the measures taken by the Riksbank just after the outbreak of the pandemic
last year.
About 80 per cent of household indebtedness consists of mortgages. The downturn in
housing prices feared by many during the crisis did not happen. After a minor initial
downturn, prices have instead risen rapidly (see the article “Rapidly rising housing
prices despite the coronavirus crisis”). As households largely fund housing purchases
with mortgages, household debt has continued to rise. Annual growth was about
5.5 per cent in February, compared with just over 5 per cent growth at the start of
2020, before the crisis (see Figure 22).
-0.9
-0.6
-0.3
0.0
0.3
0.6
0.9
Jan-19 Jul-19 Jan-20 Jul-20 Jan-21
Repo rate
STIBOR, 3 months
Rate on covered bond, 2 years
Implied SEK rate via USD
Implied SEK rate via EUR
Continued economic recovery is impacting financial markets
35
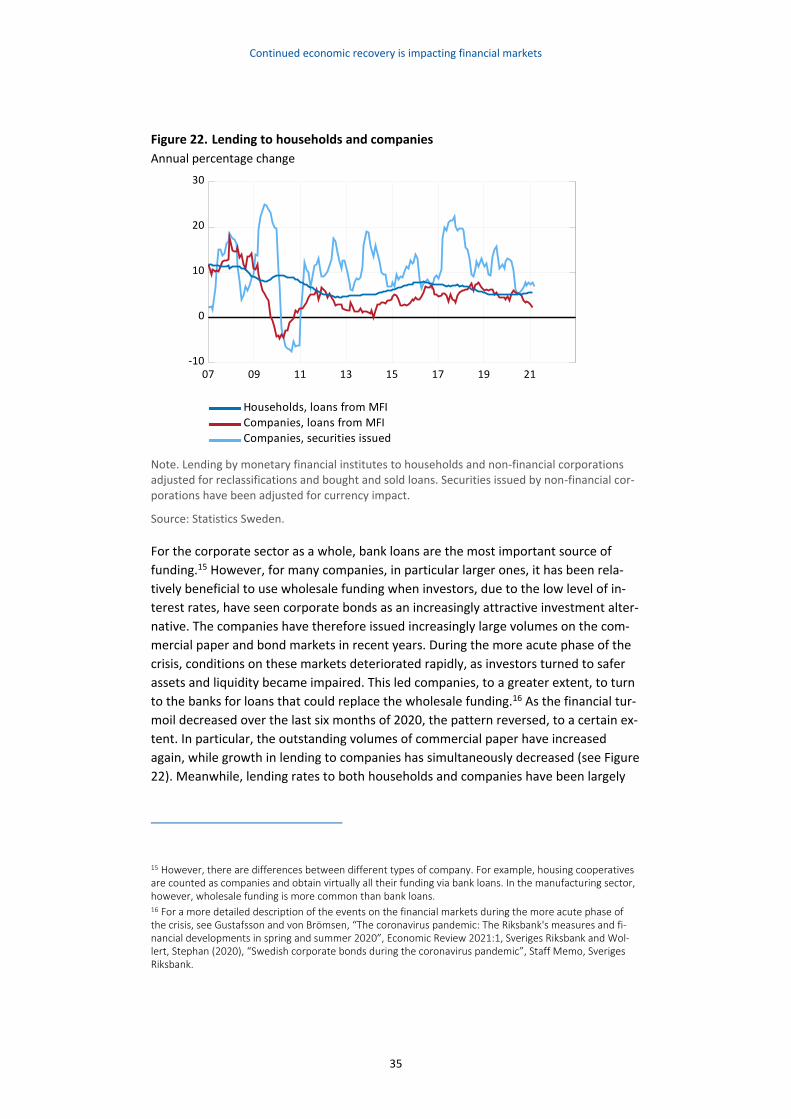
Figure 22. Lending to households and companies
Annual percentage change
07 09 11 13 15 17 19 21-10
0
10
20
30
Companies, securities issued
Companies, loans from MFI
Households, loans from MFI
Note. Lending by monetary financial institutes to households and non-financial corporations adjusted for reclassifications and bought and sold loans. Securities issued by non-financial cor-porations have been adjusted for currency impact.
Source: Statistics Sweden.
For the corporate sector as a whole, bank loans are the most important source of
funding.15 However, for many companies, in particular larger ones, it has been rela-
tively beneficial to use wholesale funding when investors, due to the low level of in-
terest rates, have seen corporate bonds as an increasingly attractive investment alter-
native. The companies have therefore issued increasingly large volumes on the com-
mercial paper and bond markets in recent years. During the more acute phase of the
crisis, conditions on these markets deteriorated rapidly, as investors turned to safer
assets and liquidity became impaired. This led companies, to a greater extent, to turn
to the banks for loans that could replace the wholesale funding.16 As the financial tur-
moil decreased over the last six months of 2020, the pattern reversed, to a certain ex-
tent. In particular, the outstanding volumes of commercial paper have increased
again, while growth in lending to companies has simultaneously decreased (see Figure
22). Meanwhile, lending rates to both households and companies have been largely
15 However, there are differences between different types of company. For example, housing cooperatives are counted as companies and obtain virtually all their funding via bank loans. In the manufacturing sector, however, wholesale funding is more common than bank loans. 16 For a more detailed description of the events on the financial markets during the more acute phase of the crisis, see Gustafsson and von Brömsen, “The coronavirus pandemic: The Riksbank's measures and fi-nancial developments in spring and summer 2020”, Economic Review 2021:1, Sveriges Riksbank and Wol-lert, Stephan (2020), “Swedish corporate bonds during the coronavirus pandemic”, Staff Memo, Sveriges Riksbank.
Continued economic recovery is impacting financial markets
36
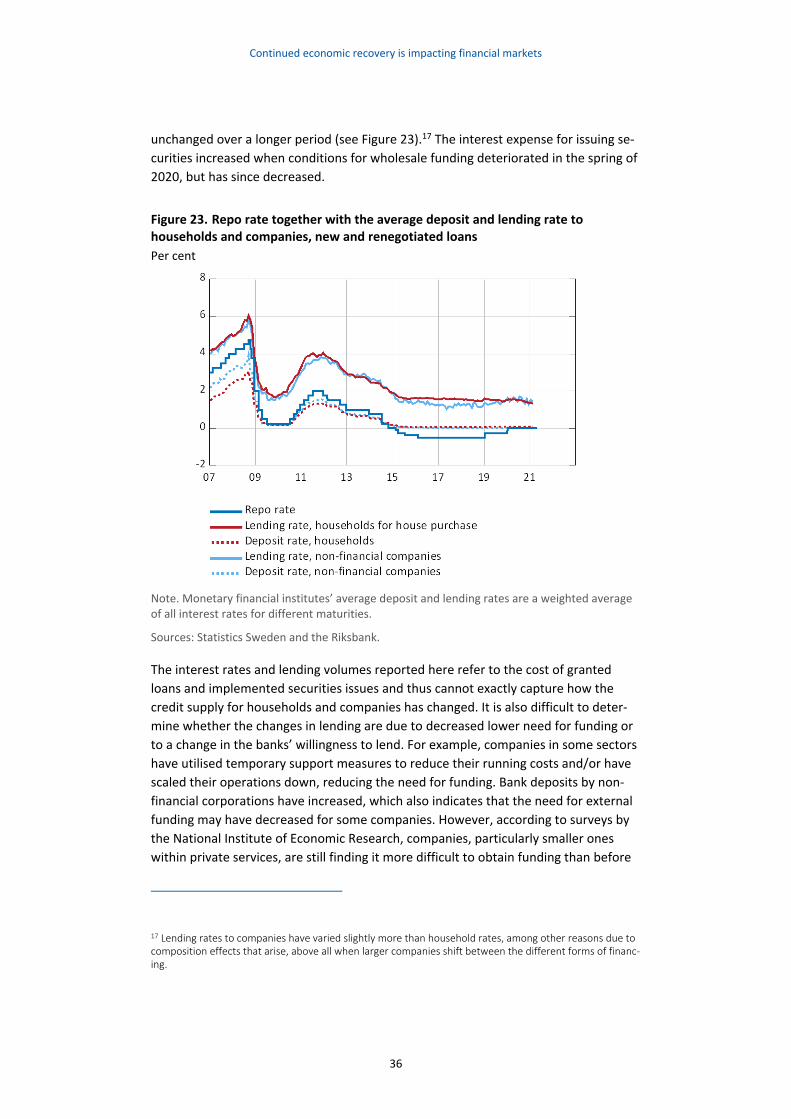
unchanged over a longer period (see Figure 23).17 The interest expense for issuing se-
curities increased when conditions for wholesale funding deteriorated in the spring of
2020, but has since decreased.
Figure 23. Repo rate together with the average deposit and lending rate to households and companies, new and renegotiated loans
Per cent
Note. Monetary financial institutes’ average deposit and lending rates are a weighted average of all interest rates for different maturities.
Sources: Statistics Sweden and the Riksbank.
The interest rates and lending volumes reported here refer to the cost of granted
loans and implemented securities issues and thus cannot exactly capture how the
credit supply for households and companies has changed. It is also difficult to deter-
mine whether the changes in lending are due to decreased lower need for funding or
to a change in the banks’ willingness to lend. For example, companies in some sectors
have utilised temporary support measures to reduce their running costs and/or have
scaled their operations down, reducing the need for funding. Bank deposits by non-
financial corporations have increased, which also indicates that the need for external
funding may have decreased for some companies. However, according to surveys by
the National Institute of Economic Research, companies, particularly smaller ones
within private services, are still finding it more difficult to obtain funding than before
17 Lending rates to companies have varied slightly more than household rates, among other reasons due to composition effects that arise, above all when larger companies shift between the different forms of financ-ing.
Continued economic recovery is impacting financial markets
37
the pandemic, even if the situation has improved substantially since the spring of
2020. The Riksbank’s overall assessment is that there are no clear signs that the banks
have tightened their lending, but it is important to monitor carefully how the credit
supply to companies develops in the period ahead.
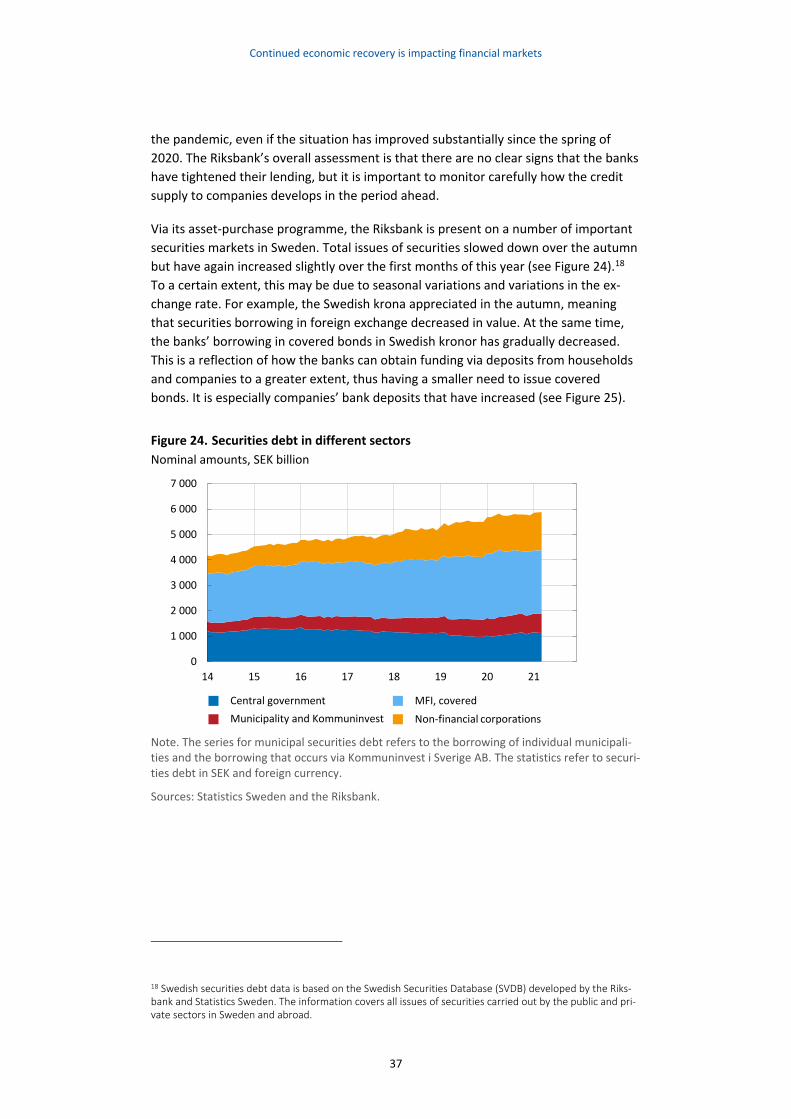
Via its asset-purchase programme, the Riksbank is present on a number of important
securities markets in Sweden. Total issues of securities slowed down over the autumn
but have again increased slightly over the first months of this year (see Figure 24).18
To a certain extent, this may be due to seasonal variations and variations in the ex-
change rate. For example, the Swedish krona appreciated in the autumn, meaning
that securities borrowing in foreign exchange decreased in value. At the same time,
the banks’ borrowing in covered bonds in Swedish kronor has gradually decreased.
This is a reflection of how the banks can obtain funding via deposits from households
and companies to a greater extent, thus having a smaller need to issue covered
bonds. It is especially companies’ bank deposits that have increased (see Figure 25).
Figure 24. Securities debt in different sectors
Nominal amounts, SEK billion
Note. The series for municipal securities debt refers to the borrowing of individual municipali-ties and the borrowing that occurs via Kommuninvest i Sverige AB. The statistics refer to securi-ties debt in SEK and foreign currency.
Sources: Statistics Sweden and the Riksbank.
18 Swedish securities debt data is based on the Swedish Securities Database (SVDB) developed by the Riks-bank and Statistics Sweden. The information covers all issues of securities carried out by the public and pri-vate sectors in Sweden and abroad.
0
1 000
2 000
3 000
4 000
5 000
6 000
7 000
14 15 16 17 18 19 20 21
Central government
Municipality and Kommuninvest
MFI, covered
Non-financial corporations
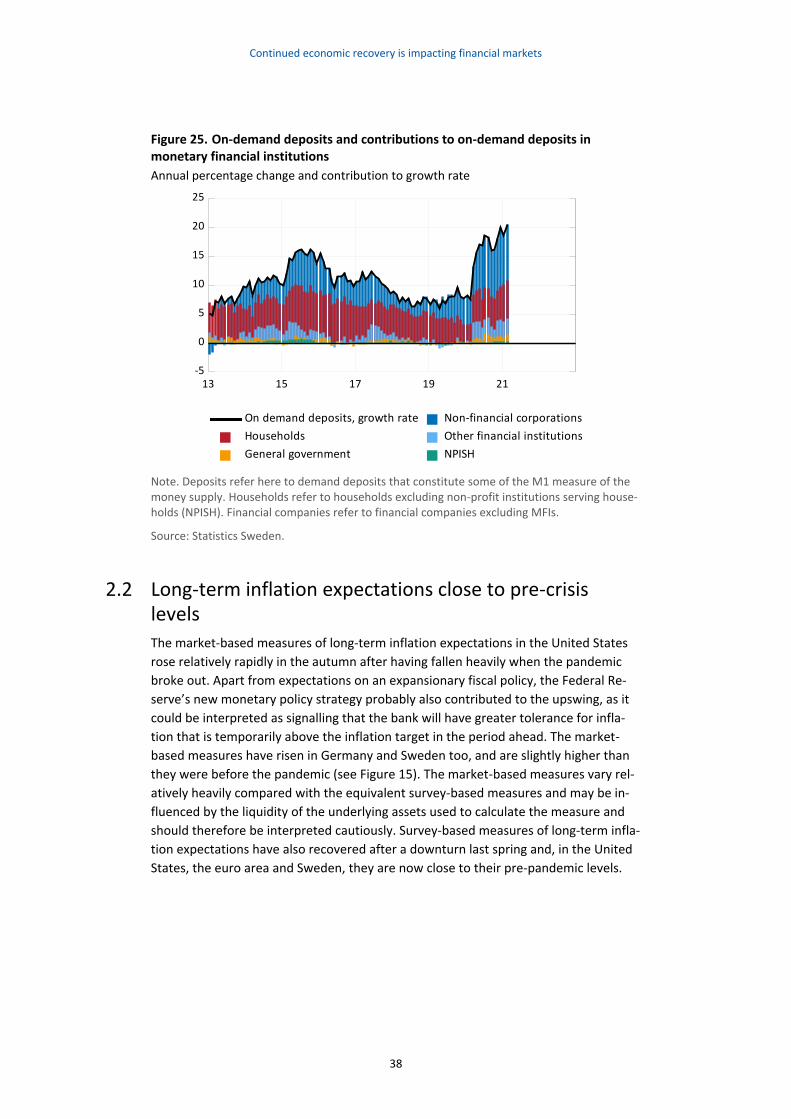
Continued economic recovery is impacting financial markets
38
Figure 25. On-demand deposits and contributions to on-demand deposits in monetary financial institutions
Annual percentage change and contribution to growth rate
13 15 17 19 21-5
0
5
10
15
20
25
NPISHGeneral government
Other financial institutionsHouseholds
Non-financial corporationsOn demand deposits, growth rate
Note. Deposits refer here to demand deposits that constitute some of the M1 measure of the money supply. Households refer to households excluding non-profit institutions serving house-holds (NPISH). Financial companies refer to financial companies excluding MFIs.
Source: Statistics Sweden.
2.2 Long-term inflation expectations close to pre-crisis levels
The market-based measures of long-term inflation expectations in the United States
rose relatively rapidly in the autumn after having fallen heavily when the pandemic
broke out. Apart from expectations on an expansionary fiscal policy, the Federal Re-
serve’s new monetary policy strategy probably also contributed to the upswing, as it
could be interpreted as signalling that the bank will have greater tolerance for infla-
tion that is temporarily above the inflation target in the period ahead. The market-
based measures have risen in Germany and Sweden too, and are slightly higher than
they were before the pandemic (see Figure 15). The market-based measures vary rel-
atively heavily compared with the equivalent survey-based measures and may be in-
fluenced by the liquidity of the underlying assets used to calculate the measure and
should therefore be interpreted cautiously. Survey-based measures of long-term infla-
tion expectations have also recovered after a downturn last spring and, in the United
States, the euro area and Sweden, they are now close to their pre-pandemic levels.
Recovery continuing despite increased spread of infection at start of year
39
3 Recovery continuing despite increased spread of infection at start of year
During the first months of the year, the spread of infection was still at a
high level in many countries, but it is assumed that the restrictions will
begin to be eased more tangibly during the second half of the year. Vac-
cination against COVID-19 has made progress, economic policy is still
very expansionary, and confidence in both the household and corporate
sectors has shown an upturn. With effect from the second quarter of
2021, KIX-weighted GDP is expected to begin rising again as mobility in
society increases and consumption and investment pick up. However, the
recovery is proceeding at different paces in different parts of the world
as a result of the differences in the share of people that have been vac-
cinated and the policy stimulus to the economy in different countries and
regions. As resource utilisation increases in the world economy, inflation
is also expected to rise going forward.
As in the rest of the world, the pandemic is continuing to affect eco-
nomic activity in Sweden in 2021. But, as vaccination continues, the
spread of infection declines, and the restrictions are eased, the condi-
tions will be right for consumption to approach the pre-crisis levels and
for a relatively rapid recovery in the service sectors that were hit hard.
Forward-looking indicators point to the labour market also improving
over the year, although some negative effects of the pandemic are ex-
pected to be more long lasting and unemployment will therefore remain
elevated for several years. During 2021, inflation will be volatile. Higher
commodity prices and freight costs will contribute to this development.
From 2022, inflation is expected to rise gradually as demand strengthens
and wages increase at a faster pace. Towards the end of the forecast pe-
riod, inflation is estimated to be more permanently close to the target of
2 per cent.
3.1 Growth in the world economy will accelerate when the restrictions are eased
During the first months of the year, the spread of infection remained at a high level in
many countries, and the restrictions remained extensive (see Figure 26). But as the
percentage of people vaccinated increases, the spread of infection is expected to de-
cline and the restrictions to be gradually eased. The vaccination process is moving at
different speeds in different countries, however, the share of the population that has
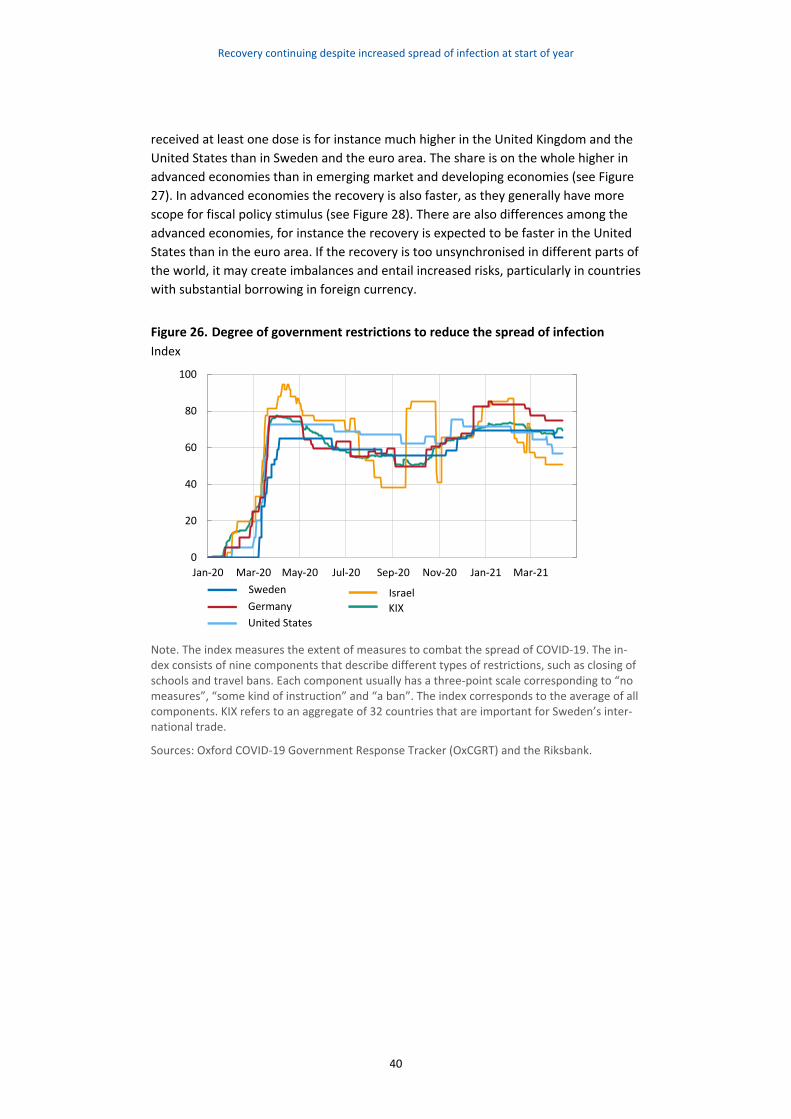
Recovery continuing despite increased spread of infection at start of year
40
received at least one dose is for instance much higher in the United Kingdom and the
United States than in Sweden and the euro area. The share is on the whole higher in
advanced economies than in emerging market and developing economies (see Figure
27). In advanced economies the recovery is also faster, as they generally have more
scope for fiscal policy stimulus (see Figure 28). There are also differences among the
advanced economies, for instance the recovery is expected to be faster in the United
States than in the euro area. If the recovery is too unsynchronised in different parts of
the world, it may create imbalances and entail increased risks, particularly in countries
with substantial borrowing in foreign currency.
Figure 26. Degree of government restrictions to reduce the spread of infection
Index
Note. The index measures the extent of measures to combat the spread of COVID-19. The in-dex consists of nine components that describe different types of restrictions, such as closing of schools and travel bans. Each component usually has a three-point scale corresponding to “no measures”, “some kind of instruction” and “a ban”. The index corresponds to the average of all components. KIX refers to an aggregate of 32 countries that are important for Sweden’s inter-national trade.
Sources: Oxford COVID-19 Government Response Tracker (OxCGRT) and the Riksbank.
0
20
40
60
80
100
Jan-20 Mar-20 May-20 Jul-20 Sep-20 Nov-20 Jan-21 Mar-21
Sweden
Germany
United States
Israel
KIX
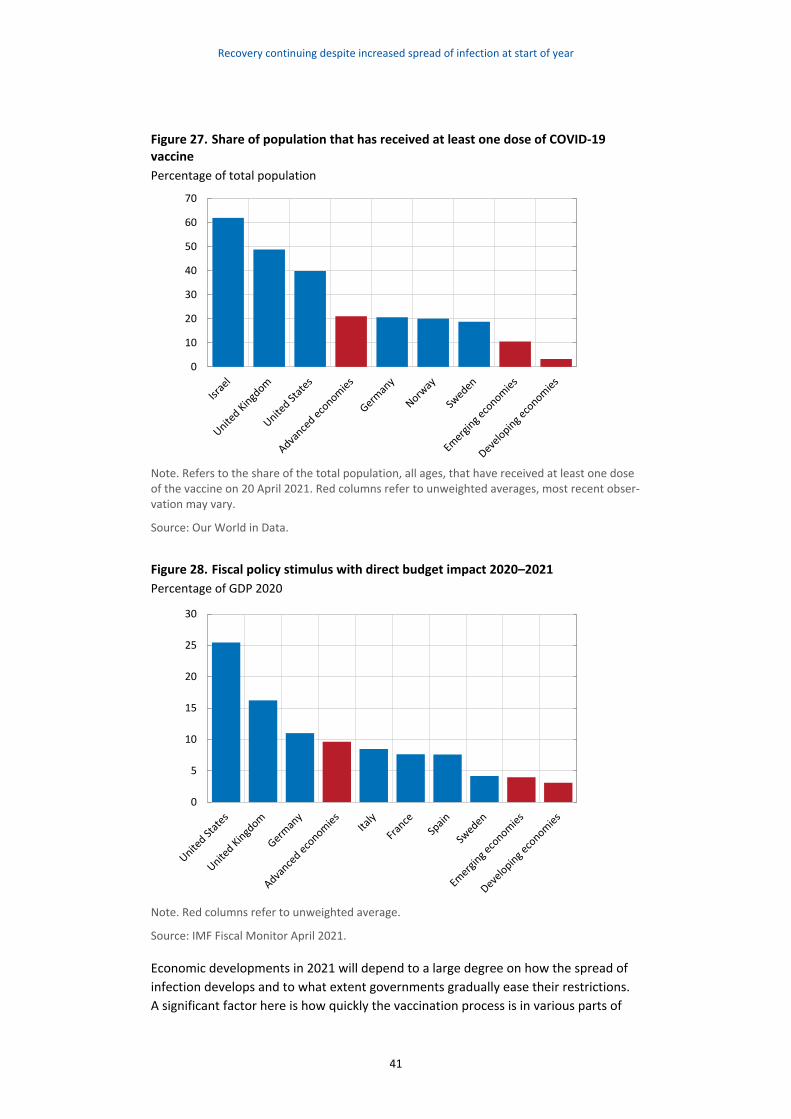
Recovery continuing despite increased spread of infection at start of year
41
Figure 27. Share of population that has received at least one dose of COVID-19 vaccine
Percentage of total population
Note. Refers to the share of the total population, all ages, that have received at least one dose of the vaccine on 20 April 2021. Red columns refer to unweighted averages, most recent obser-vation may vary.
Source: Our World in Data.
Figure 28. Fiscal policy stimulus with direct budget impact 2020–2021
Percentage of GDP 2020
Note. Red columns refer to unweighted average.
Source: IMF Fiscal Monitor April 2021.
Economic developments in 2021 will depend to a large degree on how the spread of
infection develops and to what extent governments gradually ease their restrictions.
A significant factor here is how quickly the vaccination process is in various parts of
0
10
20
30
40
50
60
70
0
5
10
15
20
25
30
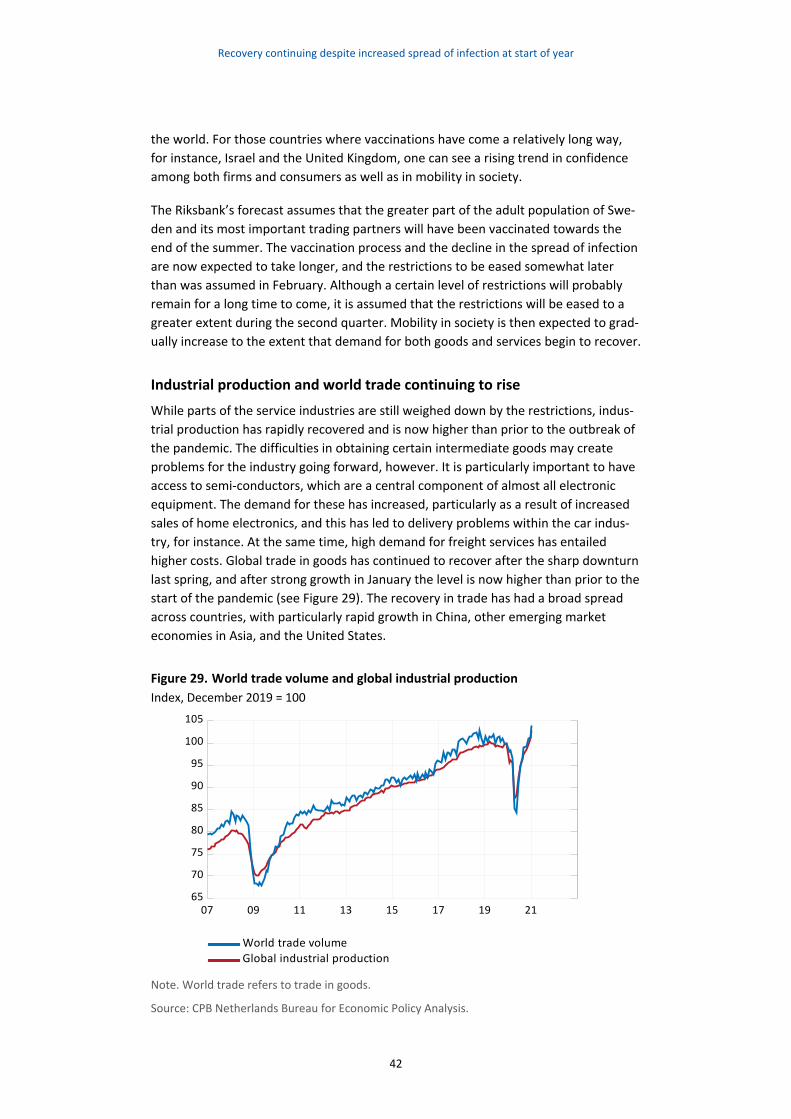
Recovery continuing despite increased spread of infection at start of year
42
the world. For those countries where vaccinations have come a relatively long way,
for instance, Israel and the United Kingdom, one can see a rising trend in confidence
among both firms and consumers as well as in mobility in society.
The Riksbank’s forecast assumes that the greater part of the adult population of Swe-
den and its most important trading partners will have been vaccinated towards the
end of the summer. The vaccination process and the decline in the spread of infection
are now expected to take longer, and the restrictions to be eased somewhat later
than was assumed in February. Although a certain level of restrictions will probably
remain for a long time to come, it is assumed that the restrictions will be eased to a
greater extent during the second quarter. Mobility in society is then expected to grad-
ually increase to the extent that demand for both goods and services begin to recover.
Industrial production and world trade continuing to rise
While parts of the service industries are still weighed down by the restrictions, indus-
trial production has rapidly recovered and is now higher than prior to the outbreak of
the pandemic. The difficulties in obtaining certain intermediate goods may create
problems for the industry going forward, however. It is particularly important to have
access to semi-conductors, which are a central component of almost all electronic
equipment. The demand for these has increased, particularly as a result of increased
sales of home electronics, and this has led to delivery problems within the car indus-
try, for instance. At the same time, high demand for freight services has entailed
higher costs. Global trade in goods has continued to recover after the sharp downturn
last spring, and after strong growth in January the level is now higher than prior to the
start of the pandemic (see Figure 29). The recovery in trade has had a broad spread
across countries, with particularly rapid growth in China, other emerging market
economies in Asia, and the United States.
Figure 29. World trade volume and global industrial production
Index, December 2019 = 100
07 09 11 13 15 17 19 2165
70
75
80
85
90
95
100
105
Global industrial production
World trade volume
Note. World trade refers to trade in goods.
Source: CPB Netherlands Bureau for Economic Policy Analysis.
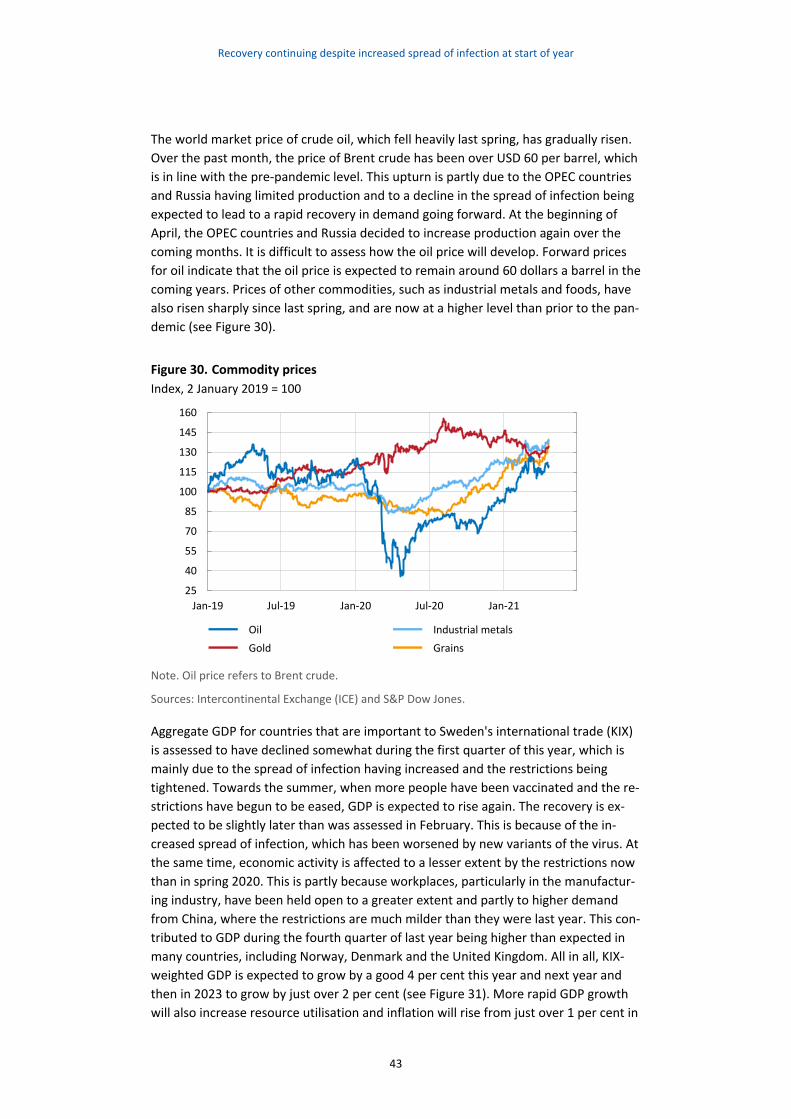
Recovery continuing despite increased spread of infection at start of year
43
The world market price of crude oil, which fell heavily last spring, has gradually risen.
Over the past month, the price of Brent crude has been over USD 60 per barrel, which
is in line with the pre-pandemic level. This upturn is partly due to the OPEC countries
and Russia having limited production and to a decline in the spread of infection being
expected to lead to a rapid recovery in demand going forward. At the beginning of
April, the OPEC countries and Russia decided to increase production again over the
coming months. It is difficult to assess how the oil price will develop. Forward prices
for oil indicate that the oil price is expected to remain around 60 dollars a barrel in the
coming years. Prices of other commodities, such as industrial metals and foods, have
also risen sharply since last spring, and are now at a higher level than prior to the pan-
demic (see Figure 30).
Figure 30. Commodity prices
Index, 2 January 2019 = 100
Note. Oil price refers to Brent crude.
Sources: Intercontinental Exchange (ICE) and S&P Dow Jones.
Aggregate GDP for countries that are important to Sweden's international trade (KIX)
is assessed to have declined somewhat during the first quarter of this year, which is
mainly due to the spread of infection having increased and the restrictions being
tightened. Towards the summer, when more people have been vaccinated and the re-
strictions have begun to be eased, GDP is expected to rise again. The recovery is ex-
pected to be slightly later than was assessed in February. This is because of the in-
creased spread of infection, which has been worsened by new variants of the virus. At
the same time, economic activity is affected to a lesser extent by the restrictions now
than in spring 2020. This is partly because workplaces, particularly in the manufactur-
ing industry, have been held open to a greater extent and partly to higher demand
from China, where the restrictions are much milder than they were last year. This con-
tributed to GDP during the fourth quarter of last year being higher than expected in
many countries, including Norway, Denmark and the United Kingdom. All in all, KIX-
weighted GDP is expected to grow by a good 4 per cent this year and next year and
then in 2023 to grow by just over 2 per cent (see Figure 31). More rapid GDP growth
will also increase resource utilisation and inflation will rise from just over 1 per cent in
25
40
55
70
85
100
115
130
145
160
Jan-19 Jul-19 Jan-20 Jul-20 Jan-21
Oil
Gold
Industrial metals
Grains
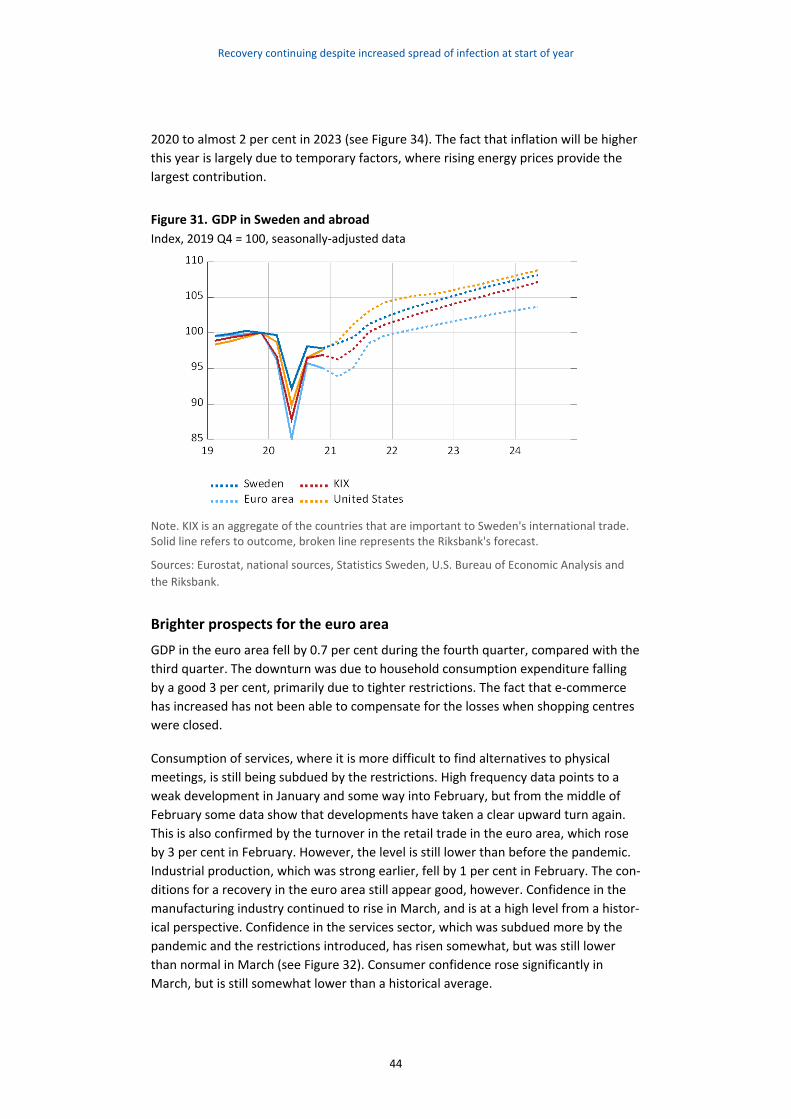
Recovery continuing despite increased spread of infection at start of year
44
2020 to almost 2 per cent in 2023 (see Figure 34). The fact that inflation will be higher
this year is largely due to temporary factors, where rising energy prices provide the
largest contribution.
Figure 31. GDP in Sweden and abroad
Index, 2019 Q4 = 100, seasonally-adjusted data
Note. KIX is an aggregate of the countries that are important to Sweden's international trade. Solid line refers to outcome, broken line represents the Riksbank's forecast.
Sources: Eurostat, national sources, Statistics Sweden, U.S. Bureau of Economic Analysis and
the Riksbank.
Brighter prospects for the euro area
GDP in the euro area fell by 0.7 per cent during the fourth quarter, compared with the
third quarter. The downturn was due to household consumption expenditure falling
by a good 3 per cent, primarily due to tighter restrictions. The fact that e-commerce
has increased has not been able to compensate for the losses when shopping centres
were closed.
Consumption of services, where it is more difficult to find alternatives to physical
meetings, is still being subdued by the restrictions. High frequency data points to a
weak development in January and some way into February, but from the middle of
February some data show that developments have taken a clear upward turn again.
This is also confirmed by the turnover in the retail trade in the euro area, which rose
by 3 per cent in February. However, the level is still lower than before the pandemic.
Industrial production, which was strong earlier, fell by 1 per cent in February. The con-
ditions for a recovery in the euro area still appear good, however. Confidence in the
manufacturing industry continued to rise in March, and is at a high level from a histor-
ical perspective. Confidence in the services sector, which was subdued more by the
pandemic and the restrictions introduced, has risen somewhat, but was still lower
than normal in March (see Figure 32). Consumer confidence rose significantly in
March, but is still somewhat lower than a historical average.

Recovery continuing despite increased spread of infection at start of year
45
The recovery in the euro area is now predicted to be somewhat slower than was as-
sumed in the February Monetary Policy Report, as a result of the increased spread of
infection and the tighter restrictions introduced. Weak activity data at the beginning
of the year indicates that GDP will also fall during the first quarter of this year. Some
of the GDP growth predicted in the February report to come during the second quar-
ter is now expected to come during the third quarter instead, when more of the re-
strictions are withdrawn. The fact that GDP growth was high during the third quarter
of last year, when the restrictions were temporarily eased, indicates a rapid recovery
during the second half of the year.
Figure 32. Euro area purchasing managers’ index
Index
Note. The Purchasing Managers’ Index for the euro area was published on 24/03/2021.
Source: IHS Markit.
The labour market has developed relatively well during the pandemic, in relation to
earlier crises. Employment rose somewhat in February and unemployment was un-
changed at 8.3 per cent. Labour market policy measures, such as short-time work
compensation schemes, are an important explanation for the relatively moderate rise
in unemployment. In the forecast, unemployment will rise somewhat in the current
and next quarter. This is because the demand for labour does not increase sufficiently
fast when the labour market measures are withdrawn in line with the pandemic slow-
ing down. A more lasting improvement on the labour market is expected when eco-
nomic activity has risen further towards the end of the year. Household incomes will
then improve, and together with the money saved over the past year, they will pro-
vide the conditions for a rise in consumption.
Monetary policy is expected to remain very expansionary, which will stimulate con-
sumption and investment. Moreover, fiscal policy measures under the framework of
Next Generation EU (NGEU) are expected to have positive effects in the coming years,
primarily for investment. In addition to the expansionary fiscal policy conducted in the
euro area, we have also taken into account in the forecast the new package of fiscal
10
20
30
40
50
60
70
Jun-18 Dec-18 Jun-19 Dec-19 Jun-20 Dec-20 Jun-21
Services
Manufacturing
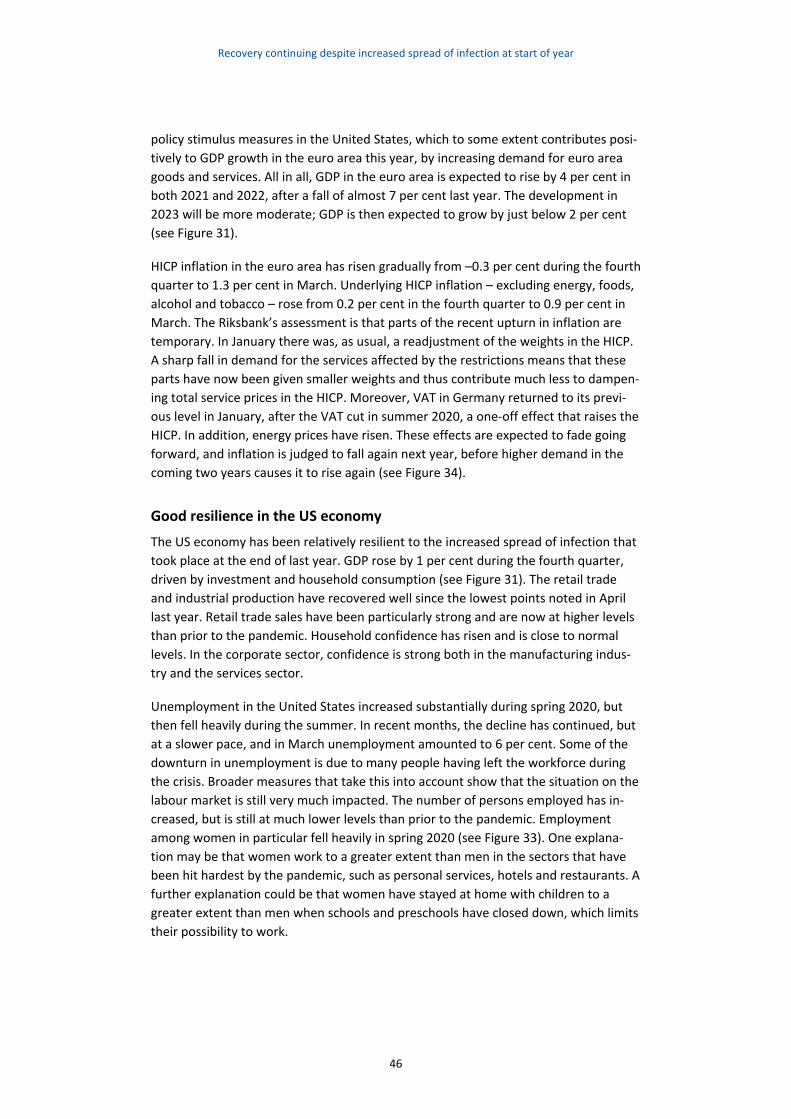
Recovery continuing despite increased spread of infection at start of year
46
policy stimulus measures in the United States, which to some extent contributes posi-
tively to GDP growth in the euro area this year, by increasing demand for euro area
goods and services. All in all, GDP in the euro area is expected to rise by 4 per cent in
both 2021 and 2022, after a fall of almost 7 per cent last year. The development in
2023 will be more moderate; GDP is then expected to grow by just below 2 per cent
(see Figure 31).
HICP inflation in the euro area has risen gradually from –0.3 per cent during the fourth
quarter to 1.3 per cent in March. Underlying HICP inflation – excluding energy, foods,
alcohol and tobacco – rose from 0.2 per cent in the fourth quarter to 0.9 per cent in
March. The Riksbank’s assessment is that parts of the recent upturn in inflation are
temporary. In January there was, as usual, a readjustment of the weights in the HICP.
A sharp fall in demand for the services affected by the restrictions means that these
parts have now been given smaller weights and thus contribute much less to dampen-
ing total service prices in the HICP. Moreover, VAT in Germany returned to its previ-
ous level in January, after the VAT cut in summer 2020, a one-off effect that raises the
HICP. In addition, energy prices have risen. These effects are expected to fade going
forward, and inflation is judged to fall again next year, before higher demand in the
coming two years causes it to rise again (see Figure 34).
Good resilience in the US economy
The US economy has been relatively resilient to the increased spread of infection that
took place at the end of last year. GDP rose by 1 per cent during the fourth quarter,
driven by investment and household consumption (see Figure 31). The retail trade
and industrial production have recovered well since the lowest points noted in April
last year. Retail trade sales have been particularly strong and are now at higher levels
than prior to the pandemic. Household confidence has risen and is close to normal
levels. In the corporate sector, confidence is strong both in the manufacturing indus-
try and the services sector.
Unemployment in the United States increased substantially during spring 2020, but
then fell heavily during the summer. In recent months, the decline has continued, but
at a slower pace, and in March unemployment amounted to 6 per cent. Some of the
downturn in unemployment is due to many people having left the workforce during
the crisis. Broader measures that take this into account show that the situation on the
labour market is still very much impacted. The number of persons employed has in-
creased, but is still at much lower levels than prior to the pandemic. Employment
among women in particular fell heavily in spring 2020 (see Figure 33). One explana-
tion may be that women work to a greater extent than men in the sectors that have
been hit hardest by the pandemic, such as personal services, hotels and restaurants. A
further explanation could be that women have stayed at home with children to a
greater extent than men when schools and preschools have closed down, which limits
their possibility to work.

Recovery continuing despite increased spread of infection at start of year
47
Figure 33. Employment in the USA, gender breakdown
Index, 2019 Q4 = 100
Source: U.S. Bureau of Labor Statistics.
The Riksbank assesses that the restrictions will be eased as more people are vac-
cinated and the spread of infection declines. This will contribute to economic activity
accelerating in coming months. When the recovery is on firmer ground, the labour
market will also gradually improve. In addition, the most recent package of fiscal pol-
icy stimulus measures, which was approved by Congress at the beginning of March,
will contribute to raising growth substantially, especially during the second half of this
year. The package amounts to around USD 1,900 billion, which corresponds to almost
9 per cent of GDP, and it contains for instance direct support payments to house-
holds, extended federal unemployment benefit, expanded tax deductions for families
with children, funding for testing and vaccines, help to states and local authorities and
aid and loans to companies.
The major part of the package will be paid out this year, which combined with higher
demand for services as the economy opens up, will contribute to raising growth sub-
stantially in 2021. The stimulus package will also have positive growth effects in 2022
and 2023. Households, companies and local governments will probably not use the
entire amount paid out in 2021. They will probably use some of the money to pay off
loans, and save some to even out their consumption over time. The high growth dur-
ing in particular the second and third quarters of this year means that resource utilisa-
tion is assessed to be roughly normal during the second half of this year. All in all,
growth in the United States is assessed to be 6.5 per cent this year and then to slow
down to just over 3 per cent in 2022 and almost 2 per cent in 2023.
In March, CPI inflation rose to 2.6 per cent, from 1.7 per cent in February. Energy
prices provided the largest contribution to the upturn. Core inflation, measured in
terms of the CPI excluding energy and food, increased from 1.3 to 1.6 per cent. Last
year, inflation was low, but inflationary pressures are expected to increase as the US
economy continues to recover and resource utilisation normalises. As the economy
80
85
90
95
100
105
Jan-19 Apr-19 Jul-19 Oct-19 Jan-20 Apr-20 Jul-20 Oct-20 Jan-21 Apr-21
Women
Men
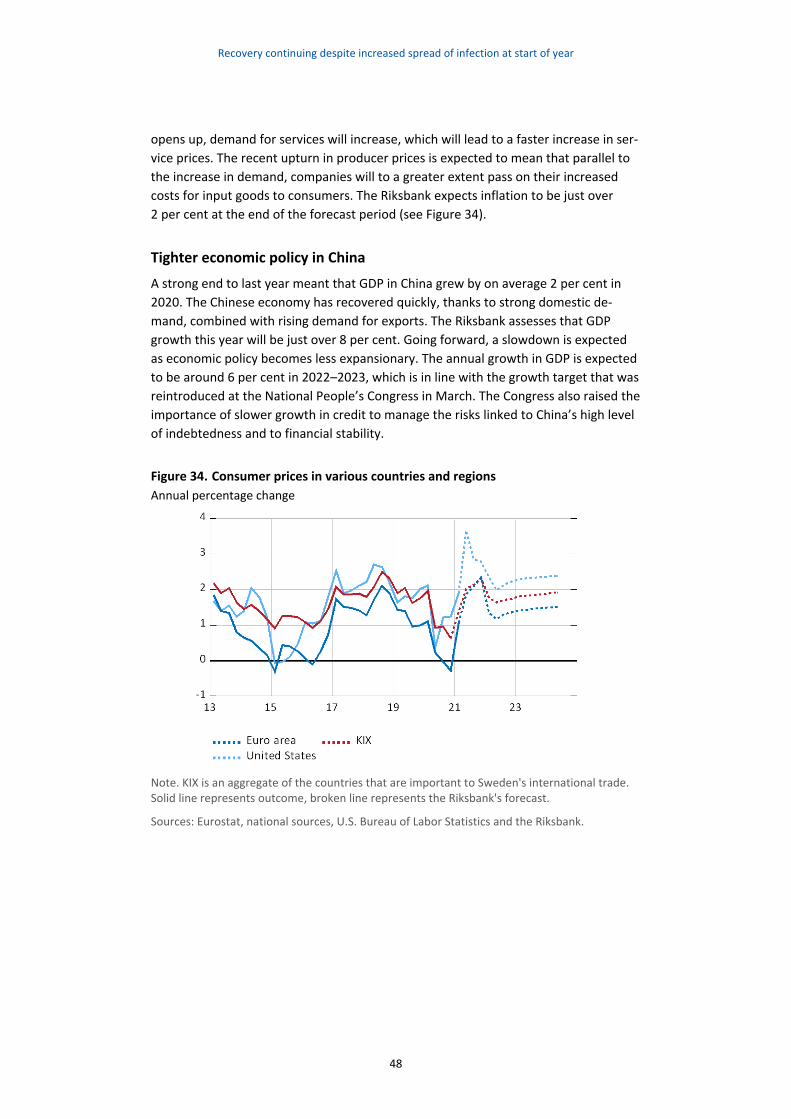
Recovery continuing despite increased spread of infection at start of year
48
opens up, demand for services will increase, which will lead to a faster increase in ser-
vice prices. The recent upturn in producer prices is expected to mean that parallel to
the increase in demand, companies will to a greater extent pass on their increased
costs for input goods to consumers. The Riksbank expects inflation to be just over
2 per cent at the end of the forecast period (see Figure 34).
Tighter economic policy in China
A strong end to last year meant that GDP in China grew by on average 2 per cent in
2020. The Chinese economy has recovered quickly, thanks to strong domestic de-
mand, combined with rising demand for exports. The Riksbank assesses that GDP
growth this year will be just over 8 per cent. Going forward, a slowdown is expected
as economic policy becomes less expansionary. The annual growth in GDP is expected
to be around 6 per cent in 2022–2023, which is in line with the growth target that was
reintroduced at the National People’s Congress in March. The Congress also raised the
importance of slower growth in credit to manage the risks linked to China’s high level
of indebtedness and to financial stability.
Figure 34. Consumer prices in various countries and regions
Annual percentage change
Note. KIX is an aggregate of the countries that are important to Sweden's international trade. Solid line represents outcome, broken line represents the Riksbank's forecast.
Sources: Eurostat, national sources, U.S. Bureau of Labor Statistics and the Riksbank.
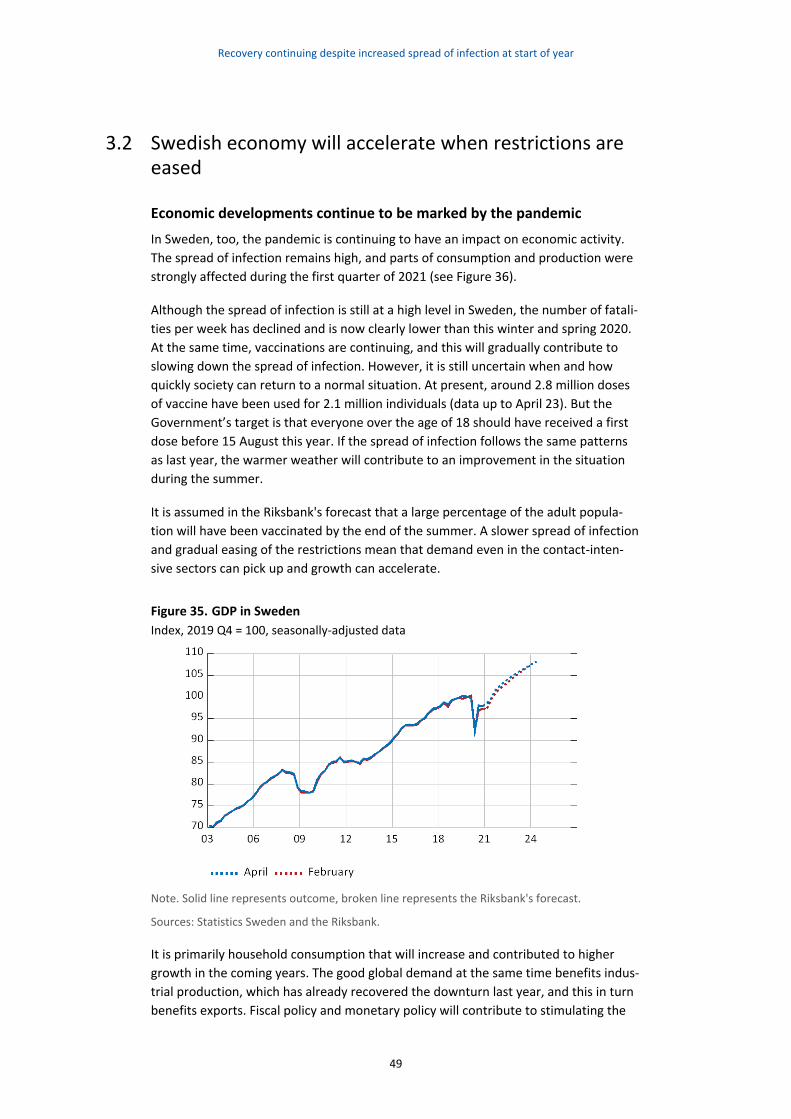
Recovery continuing despite increased spread of infection at start of year
49
3.2 Swedish economy will accelerate when restrictions are eased
Economic developments continue to be marked by the pandemic
In Sweden, too, the pandemic is continuing to have an impact on economic activity.
The spread of infection remains high, and parts of consumption and production were
strongly affected during the first quarter of 2021 (see Figure 36).
Although the spread of infection is still at a high level in Sweden, the number of fatali-
ties per week has declined and is now clearly lower than this winter and spring 2020.
At the same time, vaccinations are continuing, and this will gradually contribute to
slowing down the spread of infection. However, it is still uncertain when and how
quickly society can return to a normal situation. At present, around 2.8 million doses
of vaccine have been used for 2.1 million individuals (data up to April 23). But the
Government’s target is that everyone over the age of 18 should have received a first
dose before 15 August this year. If the spread of infection follows the same patterns
as last year, the warmer weather will contribute to an improvement in the situation
during the summer.
It is assumed in the Riksbank's forecast that a large percentage of the adult popula-
tion will have been vaccinated by the end of the summer. A slower spread of infection
and gradual easing of the restrictions mean that demand even in the contact-inten-
sive sectors can pick up and growth can accelerate.
Figure 35. GDP in Sweden
Index, 2019 Q4 = 100, seasonally-adjusted data
Note. Solid line represents outcome, broken line represents the Riksbank's forecast.
Sources: Statistics Sweden and the Riksbank.
It is primarily household consumption that will increase and contributed to higher
growth in the coming years. The good global demand at the same time benefits indus-
trial production, which has already recovered the downturn last year, and this in turn
benefits exports. Fiscal policy and monetary policy will contribute to stimulating the
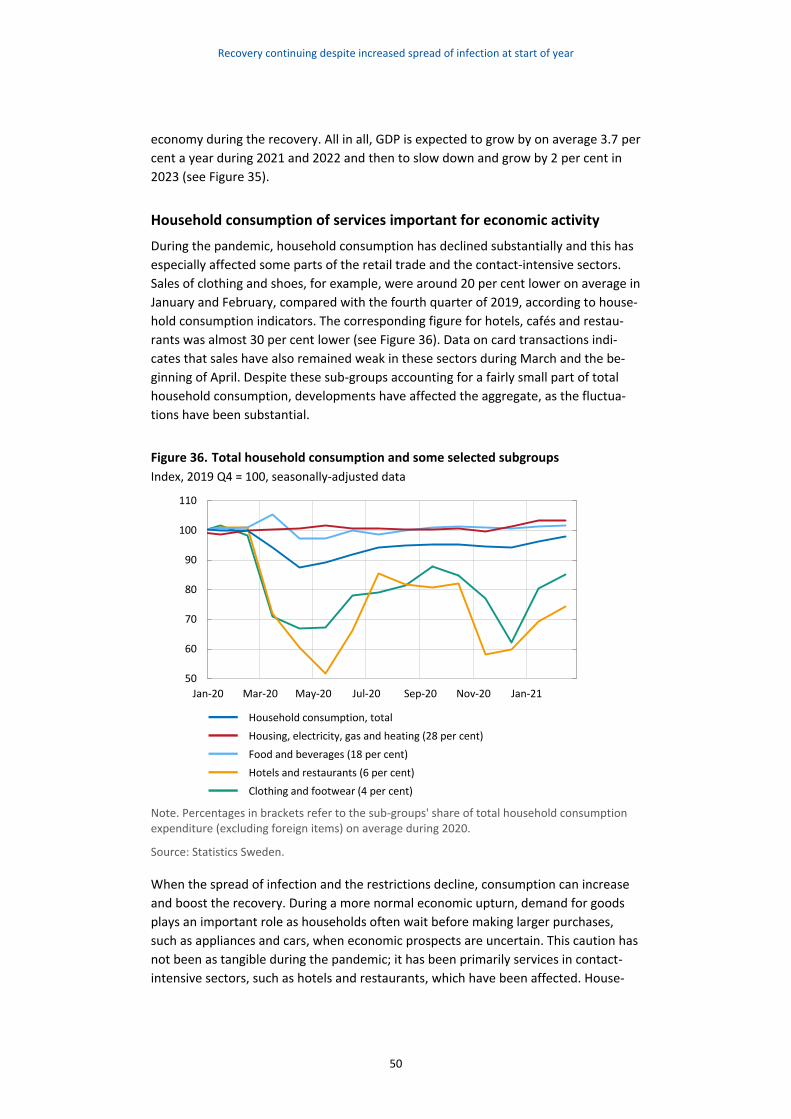
Recovery continuing despite increased spread of infection at start of year
50
economy during the recovery. All in all, GDP is expected to grow by on average 3.7 per
cent a year during 2021 and 2022 and then to slow down and grow by 2 per cent in
2023 (see Figure 35).
Household consumption of services important for economic activity
During the pandemic, household consumption has declined substantially and this has
especially affected some parts of the retail trade and the contact-intensive sectors.
Sales of clothing and shoes, for example, were around 20 per cent lower on average in
January and February, compared with the fourth quarter of 2019, according to house-
hold consumption indicators. The corresponding figure for hotels, cafés and restau-
rants was almost 30 per cent lower (see Figure 36). Data on card transactions indi-
cates that sales have also remained weak in these sectors during March and the be-
ginning of April. Despite these sub-groups accounting for a fairly small part of total
household consumption, developments have affected the aggregate, as the fluctua-
tions have been substantial.
Figure 36. Total household consumption and some selected subgroups
Index, 2019 Q4 = 100, seasonally-adjusted data
Note. Percentages in brackets refer to the sub-groups' share of total household consumption expenditure (excluding foreign items) on average during 2020.
Source: Statistics Sweden.
When the spread of infection and the restrictions decline, consumption can increase
and boost the recovery. During a more normal economic upturn, demand for goods
plays an important role as households often wait before making larger purchases,
such as appliances and cars, when economic prospects are uncertain. This caution has
not been as tangible during the pandemic; it has been primarily services in contact-
intensive sectors, such as hotels and restaurants, which have been affected. House-
50
60
70
80
90
100
110
Jan-20 Mar-20 May-20 Jul-20 Sep-20 Nov-20 Jan-21
Household consumption, total
Housing, electricity, gas and heating (28 per cent)
Food and beverages (18 per cent)
Hotels and restaurants (6 per cent)
Clothing and footwear (4 per cent)
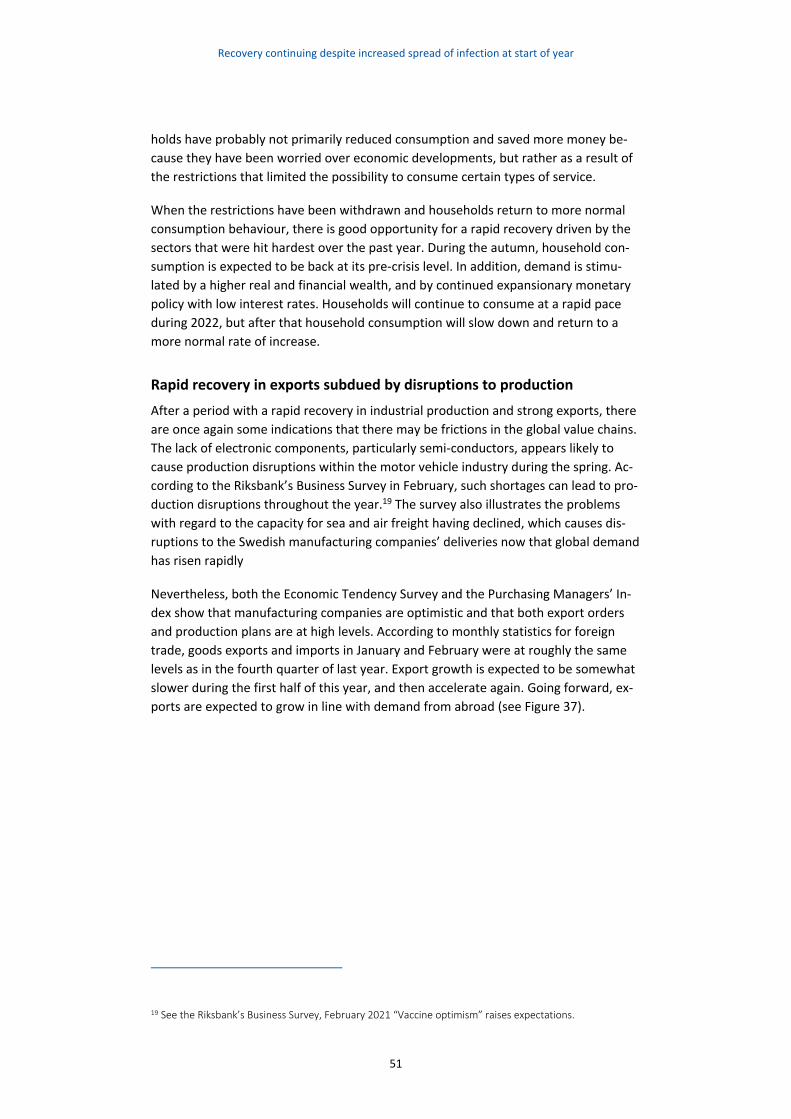
Recovery continuing despite increased spread of infection at start of year
51
holds have probably not primarily reduced consumption and saved more money be-
cause they have been worried over economic developments, but rather as a result of
the restrictions that limited the possibility to consume certain types of service.
When the restrictions have been withdrawn and households return to more normal
consumption behaviour, there is good opportunity for a rapid recovery driven by the
sectors that were hit hardest over the past year. During the autumn, household con-
sumption is expected to be back at its pre-crisis level. In addition, demand is stimu-
lated by a higher real and financial wealth, and by continued expansionary monetary
policy with low interest rates. Households will continue to consume at a rapid pace
during 2022, but after that household consumption will slow down and return to a
more normal rate of increase.
Rapid recovery in exports subdued by disruptions to production
After a period with a rapid recovery in industrial production and strong exports, there
are once again some indications that there may be frictions in the global value chains.
The lack of electronic components, particularly semi-conductors, appears likely to
cause production disruptions within the motor vehicle industry during the spring. Ac-
cording to the Riksbank’s Business Survey in February, such shortages can lead to pro-
duction disruptions throughout the year.19 The survey also illustrates the problems
with regard to the capacity for sea and air freight having declined, which causes dis-
ruptions to the Swedish manufacturing companies’ deliveries now that global demand
has risen rapidly
Nevertheless, both the Economic Tendency Survey and the Purchasing Managers’ In-
dex show that manufacturing companies are optimistic and that both export orders
and production plans are at high levels. According to monthly statistics for foreign
trade, goods exports and imports in January and February were at roughly the same
levels as in the fourth quarter of last year. Export growth is expected to be somewhat
slower during the first half of this year, and then accelerate again. Going forward, ex-
ports are expected to grow in line with demand from abroad (see Figure 37).
19 See the Riksbank’s Business Survey, February 2021 “Vaccine optimism” raises expectations.
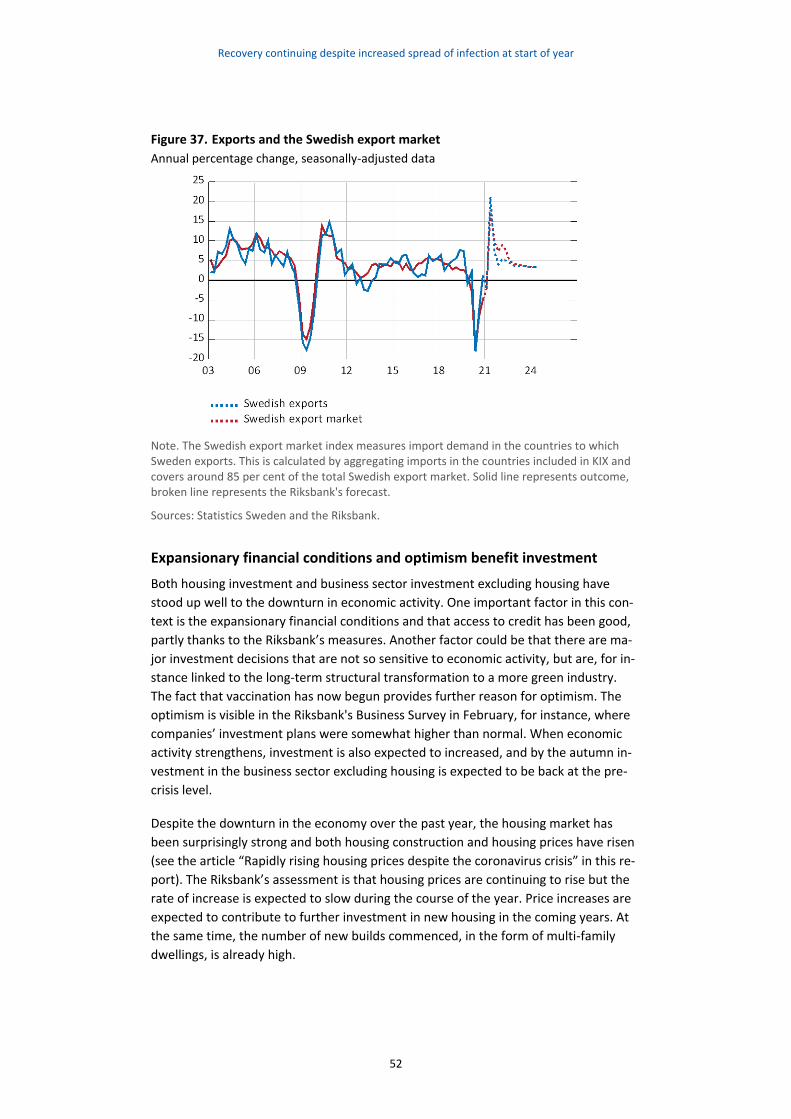
Recovery continuing despite increased spread of infection at start of year
52
Figure 37. Exports and the Swedish export market
Annual percentage change, seasonally-adjusted data
Note. The Swedish export market index measures import demand in the countries to which Sweden exports. This is calculated by aggregating imports in the countries included in KIX and covers around 85 per cent of the total Swedish export market. Solid line represents outcome, broken line represents the Riksbank's forecast.
Sources: Statistics Sweden and the Riksbank.
Expansionary financial conditions and optimism benefit investment
Both housing investment and business sector investment excluding housing have
stood up well to the downturn in economic activity. One important factor in this con-
text is the expansionary financial conditions and that access to credit has been good,
partly thanks to the Riksbank’s measures. Another factor could be that there are ma-
jor investment decisions that are not so sensitive to economic activity, but are, for in-
stance linked to the long-term structural transformation to a more green industry.
The fact that vaccination has now begun provides further reason for optimism. The
optimism is visible in the Riksbank's Business Survey in February, for instance, where
companies’ investment plans were somewhat higher than normal. When economic
activity strengthens, investment is also expected to increased, and by the autumn in-
vestment in the business sector excluding housing is expected to be back at the pre-
crisis level.
Despite the downturn in the economy over the past year, the housing market has
been surprisingly strong and both housing construction and housing prices have risen
(see the article “Rapidly rising housing prices despite the coronavirus crisis” in this re-
port). The Riksbank’s assessment is that housing prices are continuing to rise but the
rate of increase is expected to slow during the course of the year. Price increases are
expected to contribute to further investment in new housing in the coming years. At
the same time, the number of new builds commenced, in the form of multi-family
dwellings, is already high.
Recovery continuing despite increased spread of infection at start of year
53
Fiscal policy measures facilitate the recovery in the economy
Last year, the Government implemented major fiscal policy measures to alleviate the
economic consequences of the pandemic. The costs of these measures is estimated to
have amounted to more than SEK 160 billion and contributed to a deficit in public fi-
nances of 3.1 per cent of GDP. Several of the measures introduced in 2020 have been
extended and support has been provided for potential cessation of business activity.
While earlier measures have primarily been aimed at restricting the spread of infec-
tion and the consequences of low economic activity, the reforms in the Budget Bill for
2021 are to a greater extent aimed at stimulating demand, such as tax reductions and
increased support to municipalities and regions. This year, the cost of the measures is
expected to amount to around SEK 200 billion.
As a result of extensive investments this year, the deficit is largely expected to be un-
changed in relation to 2020 and to amount to 3.0 per cent of GDP, despite a stronger
economic development. In the coming years, the fiscal policy measures are expected
to become much less extensive, and this combined with the economy improving will
mean that central government net lending as a percentage of GDP continues to
strengthen. The public sector’s consolidated gross debt, also known as the Maastricht
debt, rose to just over 40 per cent of GDP in 2020. In the coming years, the debt will
decline, partly because net lending will strengthen and partly because the Riksbank
has decided to finance its own foreign exchange reserves instead of borrowing foreign
currencies via the Swedish National Debt Office. The Riksbank´s transition to own bor-
rowing will take place over a three-year period and reduce the debt by a good 3 per
cent. This year the Maastricht debt will be unchanged at 40 per cent of GDP and in the
year 2023 it will amount to 34 per cent of GDP.
Service production will rise apace with household consumption, and industrial production remains strong
There is a clear connection between household consumption and the development of
service production. The companies that are hit particularly hard by the restrictions are
those in the hotel, restaurant, culture, travel and some retail trade sectors. There,
production has fallen to very low levels and within hotels and restaurants it is still
around 30 per cent lower than prior to the crisis. But the situation is nowhere near as
gloomy for the services sector as a whole (see Figure 38). More corporate-type ser-
vices, such as information and communication and property, are doing much better.
According to the Economic Tendency Survey, optimism among service companies and
expectations of demand are more or less normal. However, the assessment of the
current situation is not as bright, and capacity utilisation is low.
When the restrictions are gradually eased during the summer and autumn, household
consumption is expected to approach its pre-crisis level and the recovery in the hard-
hit service industries is expected to be rapid. At the same time, there is a risk that de-
mand will recover at a faster pace than companies can increase their production. For
instance, it may take time to recruit staff, which would slow down the pace of the re-
covery (see the article “Alternative scenarios for the economic recovery” in this re-
port). In line with household consumption, growth in services production will be
strong in both 2021 and 2022, and then slow down.
Recovery continuing despite increased spread of infection at start of year
54
Demand for Swedish exports of goods was surprisingly high during the second half of
last year, and this is also visible in the development of industrial production. During
January–February, production in the manufacturing industry was a good 2 per cent
higher than in the final quarter of 2019, and indicators for the manufacturing industry,
such as orders and production expectations, pointed to the situation being higher
than normal. Despite disruptions to supply, industrial production will grow rapidly this
year and then slow down somewhat during 2022–2023.
Figure 38. Production in selected sectors
Index, 2019 Q4 = 100, seasonally-adjusted data
Source: Statistics Sweden.
Many hotel and restaurant employees lost their jobs in 2020
Despite all of the support measures, the coronavirus crisis had a clear impact on the
labour market last year. The opportunity for short term short-term work compensa-
tion led to relatively few employed persons with permanent positions losing their
jobs. Employment declined in particular in the services sector, where temporary em-
ployees were hit hard. The downturn was especially large in industries such as
transport and storage, hotels and restaurants, and personal and cultural services. De-
spite all of these industries accounting for almost 16 per cent of all employees in the
business sector prior to the crisis, they contributed to almost 90 per cent of the total
fall in the number of employees in 2020 (see Figure 39). These hard-hit industries em-
ploy many young people and many who were born abroad, and unemployment there-
fore rose in these groups in particular.20 On average, unemployment in the age group
15–74 amounted to 8.3 per cent last year, while unemployment among young people
was 24 per cent. Among those born abroad, unemployment was 19 per cent.
20 Employees within the transport, hotel and restaurant industries are on average younger than those in other industries. A larger share of these are people born abroad and a larger share than in other industries have a lower educational level, see the article “Unemployment in the COVID-19 pandemic” in the Swedish Economic Report December 2020, National Institute of Economic Research.
40
60
80
100
120
Jan-19 Apr-19 Jul-19 Oct-19 Jan-20 Apr-20 Jul-20 Oct-20 Jan-21
Services
Industry
Wholesale and retail trade
Hotels and restaurants
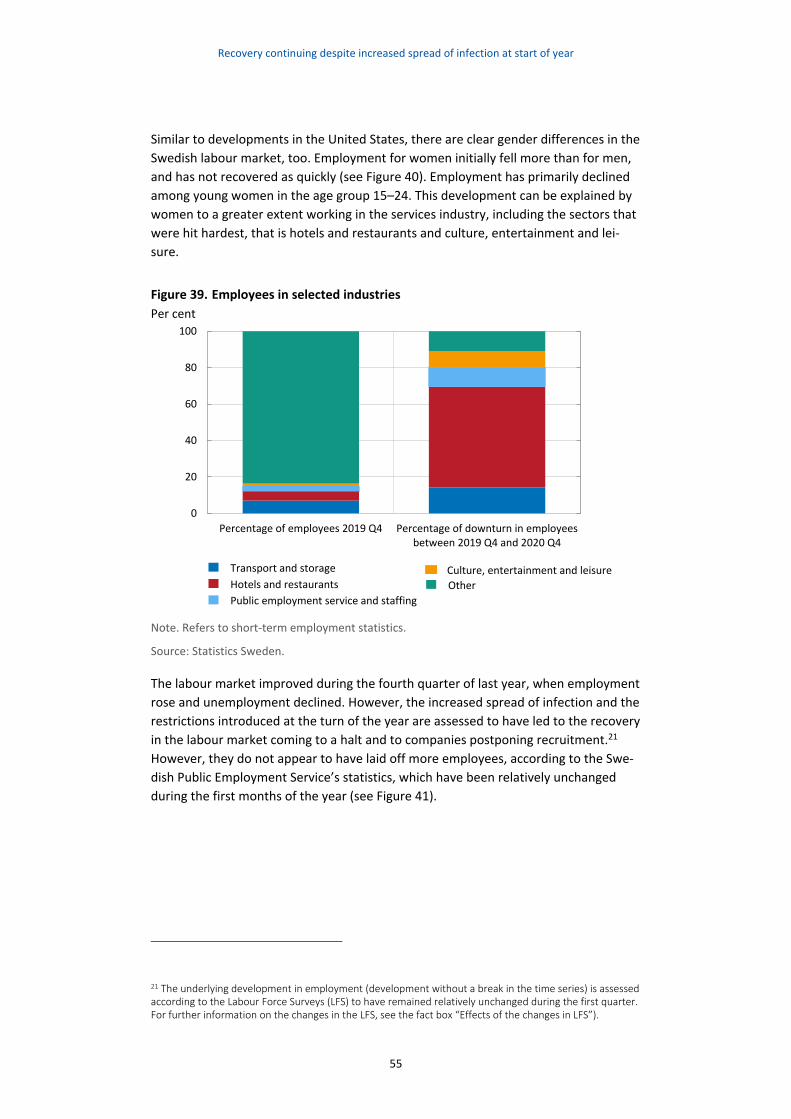
Recovery continuing despite increased spread of infection at start of year
55
Similar to developments in the United States, there are clear gender differences in the
Swedish labour market, too. Employment for women initially fell more than for men,
and has not recovered as quickly (see Figure 40). Employment has primarily declined
among young women in the age group 15–24. This development can be explained by
women to a greater extent working in the services industry, including the sectors that
were hit hardest, that is hotels and restaurants and culture, entertainment and lei-
sure.
Figure 39. Employees in selected industries
Per cent
Note. Refers to short-term employment statistics.
Source: Statistics Sweden.
The labour market improved during the fourth quarter of last year, when employment
rose and unemployment declined. However, the increased spread of infection and the
restrictions introduced at the turn of the year are assessed to have led to the recovery
in the labour market coming to a halt and to companies postponing recruitment.21
However, they do not appear to have laid off more employees, according to the Swe-
dish Public Employment Service’s statistics, which have been relatively unchanged
during the first months of the year (see Figure 41).
21 The underlying development in employment (development without a break in the time series) is assessed according to the Labour Force Surveys (LFS) to have remained relatively unchanged during the first quarter. For further information on the changes in the LFS, see the fact box “Effects of the changes in LFS”).
0
20
40
60
80
100
Percentage of employees 2019 Q4 Percentage of downturn in employeesbetween 2019 Q4 and 2020 Q4
Transport and storage
Hotels and restaurants
Public employment service and staffing
Culture, entertainment and leisure
Other
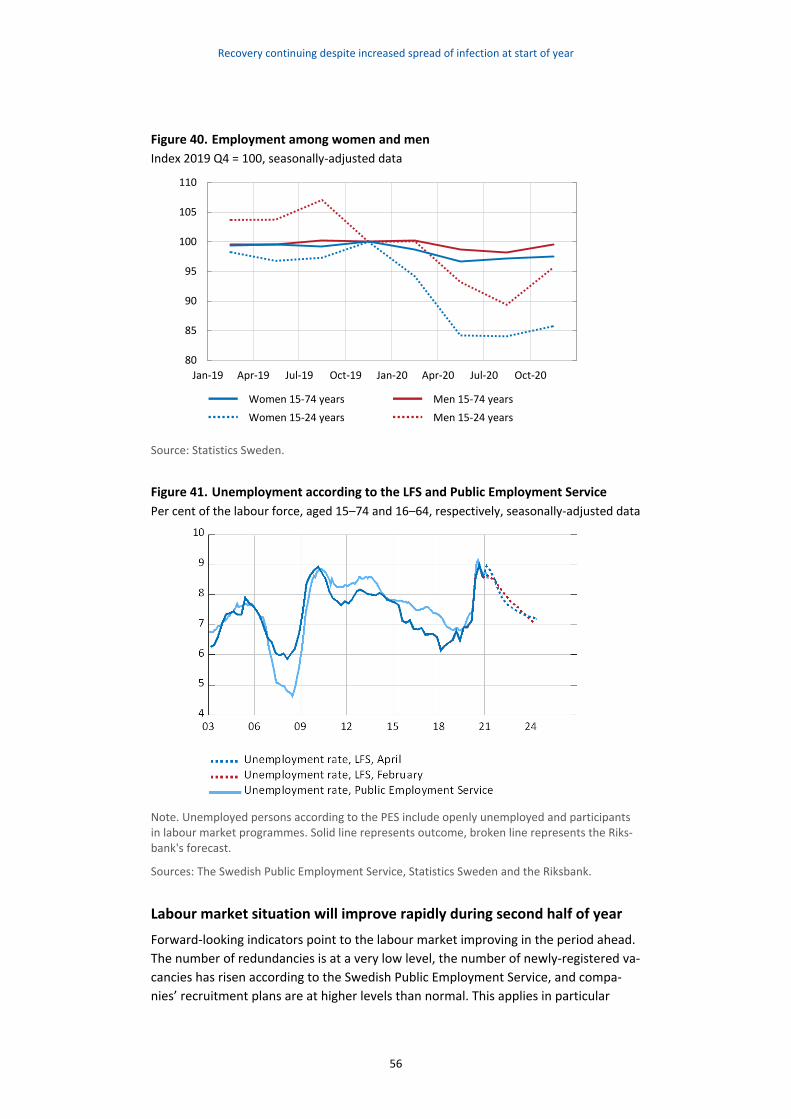
Recovery continuing despite increased spread of infection at start of year
56
Figure 40. Employment among women and men
Index 2019 Q4 = 100, seasonally-adjusted data
Source: Statistics Sweden.
Figure 41. Unemployment according to the LFS and Public Employment Service
Per cent of the labour force, aged 15–74 and 16–64, respectively, seasonally-adjusted data
Note. Unemployed persons according to the PES include openly unemployed and participants in labour market programmes. Solid line represents outcome, broken line represents the Riks-bank's forecast.
Sources: The Swedish Public Employment Service, Statistics Sweden and the Riksbank.
Labour market situation will improve rapidly during second half of year
Forward-looking indicators point to the labour market improving in the period ahead.
The number of redundancies is at a very low level, the number of newly-registered va-
cancies has risen according to the Swedish Public Employment Service, and compa-
nies’ recruitment plans are at higher levels than normal. This applies in particular
80
85
90
95
100
105
110
Jan-19 Apr-19 Jul-19 Oct-19 Jan-20 Apr-20 Jul-20 Oct-20
Women 15-74 years
Women 15-24 years
Men 15-74 years
Men 15-24 years
Recovery continuing despite increased spread of infection at start of year
57
within the manufacturing industry, but there are also many sub-sectors in private ser-
vices that are optimistic (see Figure 42).
Unlike the financial crisis, when the manufacturing industry was hit particularly hard,
most of the industries that are now hit hard are those that require a large number of
staff, where the educational requirements are in many cases lower and where there is
no extensive structural transformation under way. Jobs within these contact-intensive
service industries are therefore expected to return after the crisis, which creates the
conditions for a recovery in employment and a decline in unemployment in the sec-
ond half of the year.
The Swedish Agency for Economic and Regional Growth has granted short-term work
allowance for almost 600,000 employees.22 This support has enabled hard-hit sectors
to retain their employees during the crisis. When sickness leave due to COVID-19 de-
clines and the short-term work allowance ceases to apply, the number of hours
worked is expected to rise rapidly and the number of hours worked to normalise. At
the end of the year, the number of hours worked is expected to be back at the pre-
crisis levels. At the beginning of 2022, employment is expected to increase relatively
rapidly and unemployment to fall. After that, employment growth will gradually slow
down and unemployment will decline at an ever slower rate, whereupon the spare ca-
pacity on the labour market will be utilised.
22 A survey by the trade union Union indicates that use of the short-term work allowance has declined sub-stantially. Last spring, around 120,000 of Unionen’s members were receiving the allowance, in October this figure had fallen to 28,000 and in March this year it was 14,000, see “Fackförbundet: Korttidsarbetet min-skat kraftigt” (Trade union: short-term work allowance has declined substantially), sverigesradio.se (Swe-dish radio).
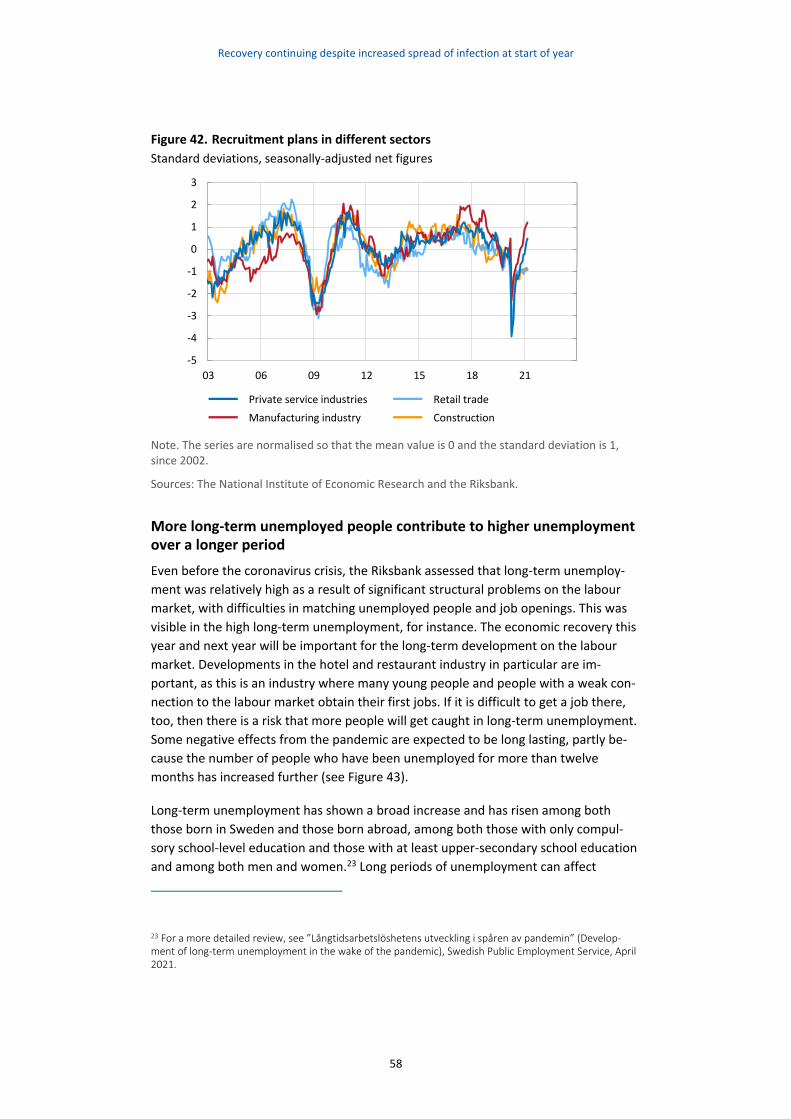
Recovery continuing despite increased spread of infection at start of year
58
Figure 42. Recruitment plans in different sectors
Standard deviations, seasonally-adjusted net figures
Note. The series are normalised so that the mean value is 0 and the standard deviation is 1, since 2002.
Sources: The National Institute of Economic Research and the Riksbank.
More long-term unemployed people contribute to higher unemployment over a longer period
Even before the coronavirus crisis, the Riksbank assessed that long-term unemploy-
ment was relatively high as a result of significant structural problems on the labour
market, with difficulties in matching unemployed people and job openings. This was
visible in the high long-term unemployment, for instance. The economic recovery this
year and next year will be important for the long-term development on the labour
market. Developments in the hotel and restaurant industry in particular are im-
portant, as this is an industry where many young people and people with a weak con-
nection to the labour market obtain their first jobs. If it is difficult to get a job there,
too, then there is a risk that more people will get caught in long-term unemployment.
Some negative effects from the pandemic are expected to be long lasting, partly be-
cause the number of people who have been unemployed for more than twelve
months has increased further (see Figure 43).
Long-term unemployment has shown a broad increase and has risen among both
those born in Sweden and those born abroad, among both those with only compul-
sory school-level education and those with at least upper-secondary school education
and among both men and women.23 Long periods of unemployment can affect
23 For a more detailed review, see ”Långtidsarbetslöshetens utveckling i spåren av pandemin” (Develop-ment of long-term unemployment in the wake of the pandemic), Swedish Public Employment Service, April 2021.
-5
-4
-3
-2
-1
0
1
2
3
03 06 09 12 15 18 21
Private service industries
Manufacturing industry
Retail trade
Construction
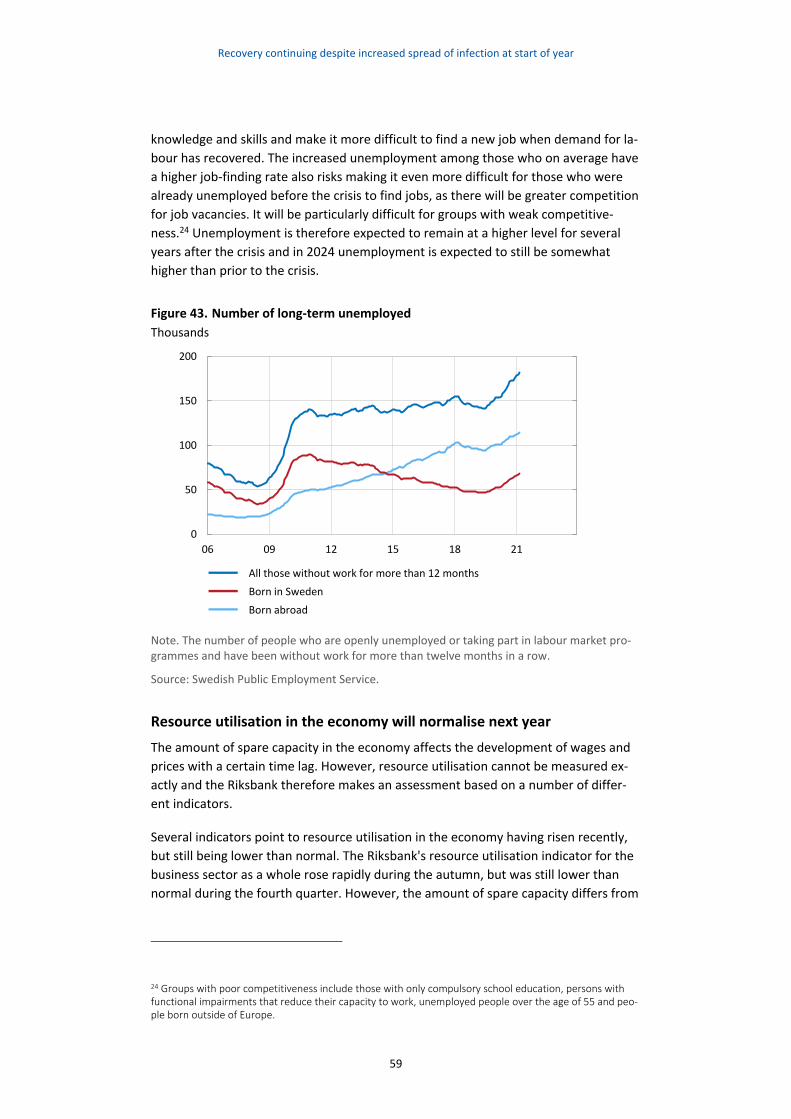
Recovery continuing despite increased spread of infection at start of year
59
knowledge and skills and make it more difficult to find a new job when demand for la-
bour has recovered. The increased unemployment among those who on average have
a higher job-finding rate also risks making it even more difficult for those who were
already unemployed before the crisis to find jobs, as there will be greater competition
for job vacancies. It will be particularly difficult for groups with weak competitive-
ness.24 Unemployment is therefore expected to remain at a higher level for several
years after the crisis and in 2024 unemployment is expected to still be somewhat
higher than prior to the crisis.
Figure 43. Number of long-term unemployed
Thousands
Note. The number of people who are openly unemployed or taking part in labour market pro-grammes and have been without work for more than twelve months in a row.
Source: Swedish Public Employment Service.
Resource utilisation in the economy will normalise next year
The amount of spare capacity in the economy affects the development of wages and
prices with a certain time lag. However, resource utilisation cannot be measured ex-
actly and the Riksbank therefore makes an assessment based on a number of differ-
ent indicators.
Several indicators point to resource utilisation in the economy having risen recently,
but still being lower than normal. The Riksbank's resource utilisation indicator for the
business sector as a whole rose rapidly during the autumn, but was still lower than
normal during the fourth quarter. However, the amount of spare capacity differs from
24 Groups with poor competitiveness include those with only compulsory school education, persons with functional impairments that reduce their capacity to work, unemployed people over the age of 55 and peo-ple born outside of Europe.
0
50
100
150
200
06 09 12 15 18 21
All those without work for more than 12 months
Born in Sweden
Born abroad
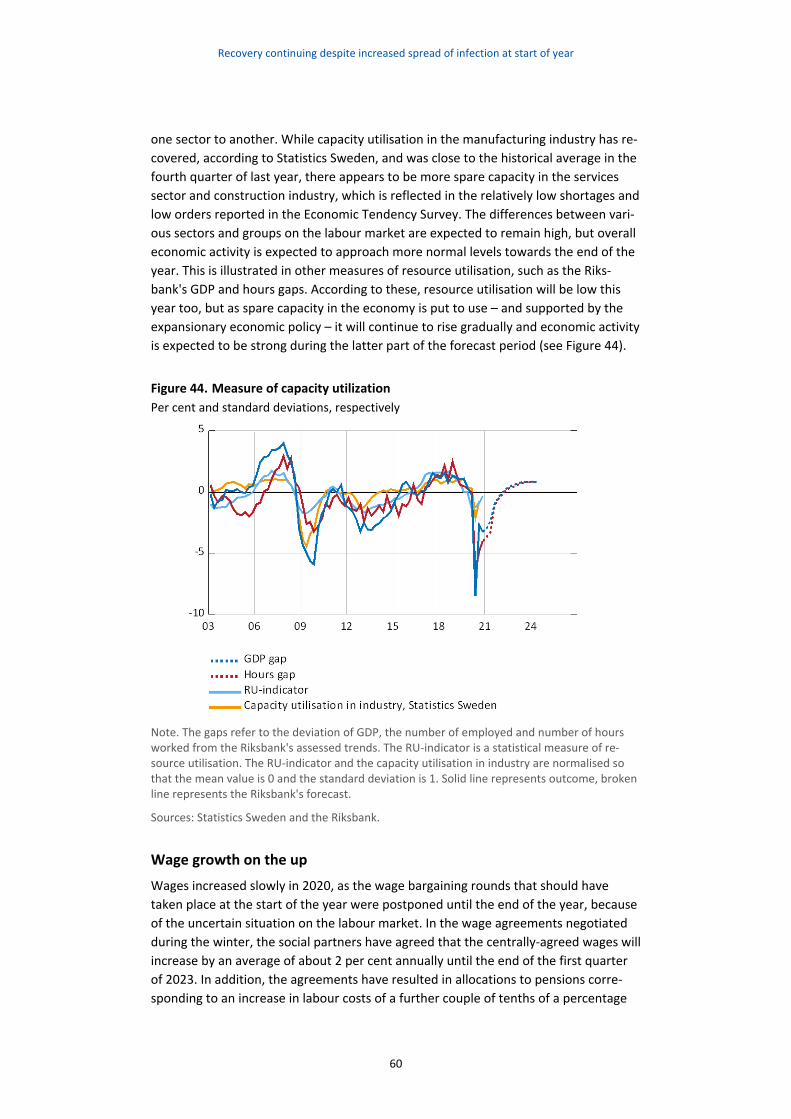
Recovery continuing despite increased spread of infection at start of year
60
one sector to another. While capacity utilisation in the manufacturing industry has re-
covered, according to Statistics Sweden, and was close to the historical average in the
fourth quarter of last year, there appears to be more spare capacity in the services
sector and construction industry, which is reflected in the relatively low shortages and
low orders reported in the Economic Tendency Survey. The differences between vari-
ous sectors and groups on the labour market are expected to remain high, but overall
economic activity is expected to approach more normal levels towards the end of the
year. This is illustrated in other measures of resource utilisation, such as the Riks-
bank's GDP and hours gaps. According to these, resource utilisation will be low this
year too, but as spare capacity in the economy is put to use – and supported by the
expansionary economic policy – it will continue to rise gradually and economic activity
is expected to be strong during the latter part of the forecast period (see Figure 44).
Figure 44. Measure of capacity utilization
Per cent and standard deviations, respectively
Note. The gaps refer to the deviation of GDP, the number of employed and number of hours worked from the Riksbank's assessed trends. The RU-indicator is a statistical measure of re-source utilisation. The RU-indicator and the capacity utilisation in industry are normalised so that the mean value is 0 and the standard deviation is 1. Solid line represents outcome, broken line represents the Riksbank's forecast.
Sources: Statistics Sweden and the Riksbank.
Wage growth on the up
Wages increased slowly in 2020, as the wage bargaining rounds that should have
taken place at the start of the year were postponed until the end of the year, because
of the uncertain situation on the labour market. In the wage agreements negotiated
during the winter, the social partners have agreed that the centrally-agreed wages will
increase by an average of about 2 per cent annually until the end of the first quarter
of 2023. In addition, the agreements have resulted in allocations to pensions corre-
sponding to an increase in labour costs of a further couple of tenths of a percentage
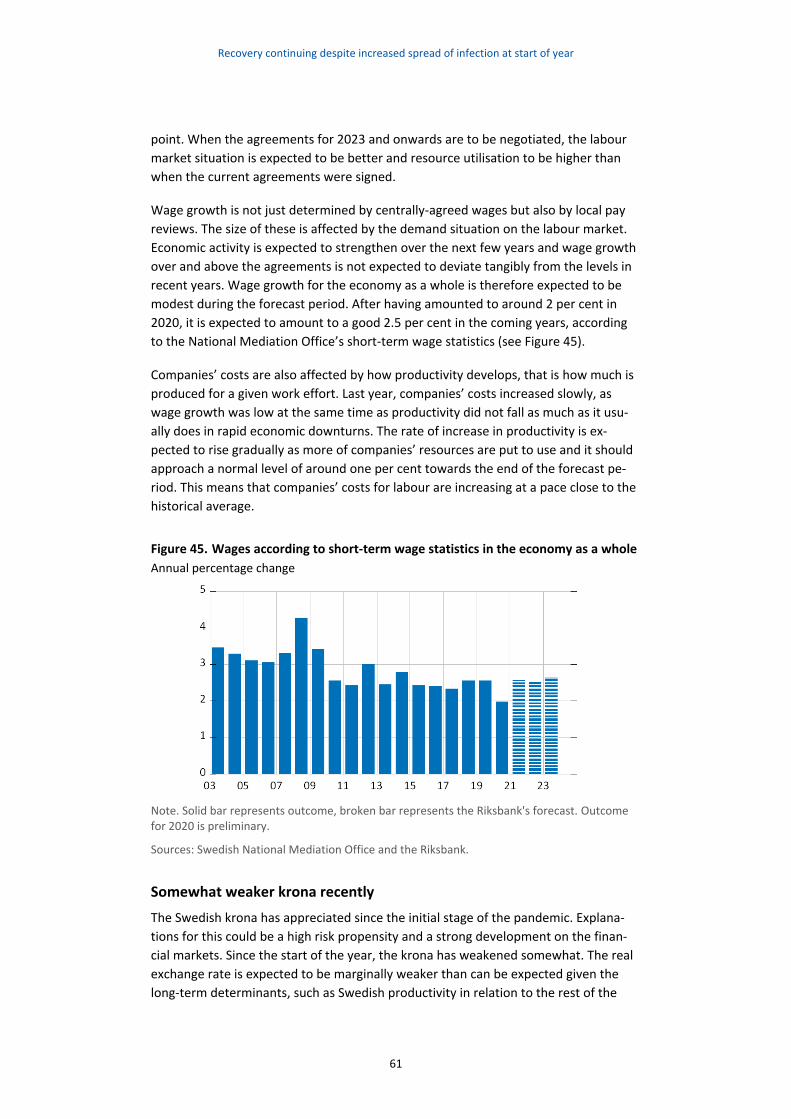
Recovery continuing despite increased spread of infection at start of year
61
point. When the agreements for 2023 and onwards are to be negotiated, the labour
market situation is expected to be better and resource utilisation to be higher than
when the current agreements were signed.
Wage growth is not just determined by centrally-agreed wages but also by local pay
reviews. The size of these is affected by the demand situation on the labour market.
Economic activity is expected to strengthen over the next few years and wage growth
over and above the agreements is not expected to deviate tangibly from the levels in
recent years. Wage growth for the economy as a whole is therefore expected to be
modest during the forecast period. After having amounted to around 2 per cent in
2020, it is expected to amount to a good 2.5 per cent in the coming years, according
to the National Mediation Office’s short-term wage statistics (see Figure 45).
Companies’ costs are also affected by how productivity develops, that is how much is
produced for a given work effort. Last year, companies’ costs increased slowly, as
wage growth was low at the same time as productivity did not fall as much as it usu-
ally does in rapid economic downturns. The rate of increase in productivity is ex-
pected to rise gradually as more of companies’ resources are put to use and it should
approach a normal level of around one per cent towards the end of the forecast pe-
riod. This means that companies’ costs for labour are increasing at a pace close to the
historical average.
Figure 45. Wages according to short-term wage statistics in the economy as a whole
Annual percentage change
Note. Solid bar represents outcome, broken bar represents the Riksbank's forecast. Outcome for 2020 is preliminary.
Sources: Swedish National Mediation Office and the Riksbank.
Somewhat weaker krona recently
The Swedish krona has appreciated since the initial stage of the pandemic. Explana-
tions for this could be a high risk propensity and a strong development on the finan-
cial markets. Since the start of the year, the krona has weakened somewhat. The real
exchange rate is expected to be marginally weaker than can be expected given the
long-term determinants, such as Swedish productivity in relation to the rest of the
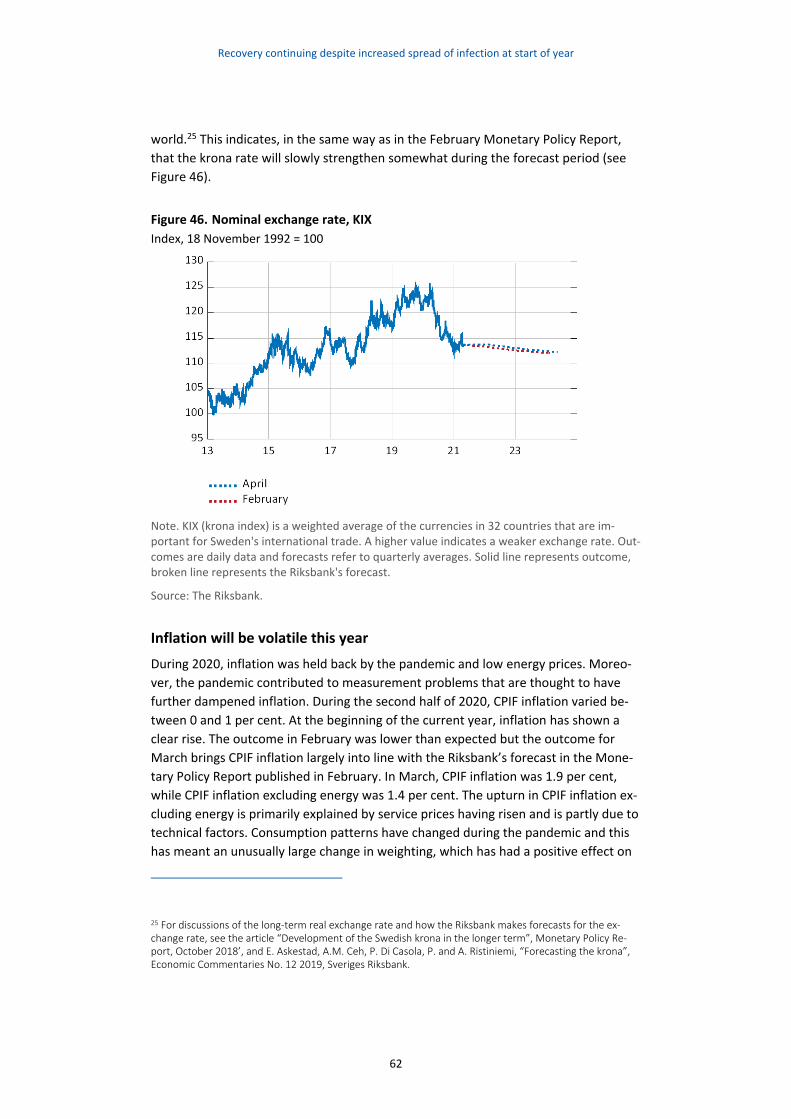
Recovery continuing despite increased spread of infection at start of year
62
world.25 This indicates, in the same way as in the February Monetary Policy Report,
that the krona rate will slowly strengthen somewhat during the forecast period (see
Figure 46).
Figure 46. Nominal exchange rate, KIX
Index, 18 November 1992 = 100
Note. KIX (krona index) is a weighted average of the currencies in 32 countries that are im-portant for Sweden's international trade. A higher value indicates a weaker exchange rate. Out-comes are daily data and forecasts refer to quarterly averages. Solid line represents outcome, broken line represents the Riksbank's forecast.
Source: The Riksbank.
Inflation will be volatile this year
During 2020, inflation was held back by the pandemic and low energy prices. Moreo-
ver, the pandemic contributed to measurement problems that are thought to have
further dampened inflation. During the second half of 2020, CPIF inflation varied be-
tween 0 and 1 per cent. At the beginning of the current year, inflation has shown a
clear rise. The outcome in February was lower than expected but the outcome for
March brings CPIF inflation largely into line with the Riksbank’s forecast in the Mone-
tary Policy Report published in February. In March, CPIF inflation was 1.9 per cent,
while CPIF inflation excluding energy was 1.4 per cent. The upturn in CPIF inflation ex-
cluding energy is primarily explained by service prices having risen and is partly due to
technical factors. Consumption patterns have changed during the pandemic and this
has meant an unusually large change in weighting, which has had a positive effect on
25 For discussions of the long-term real exchange rate and how the Riksbank makes forecasts for the ex-change rate, see the article “Development of the Swedish krona in the longer term”, Monetary Policy Re-port, October 2018’, and E. Askestad, A.M. Ceh, P. Di Casola, P. and A. Ristiniemi, “Forecasting the krona”, Economic Commentaries No. 12 2019, Sveriges Riksbank.
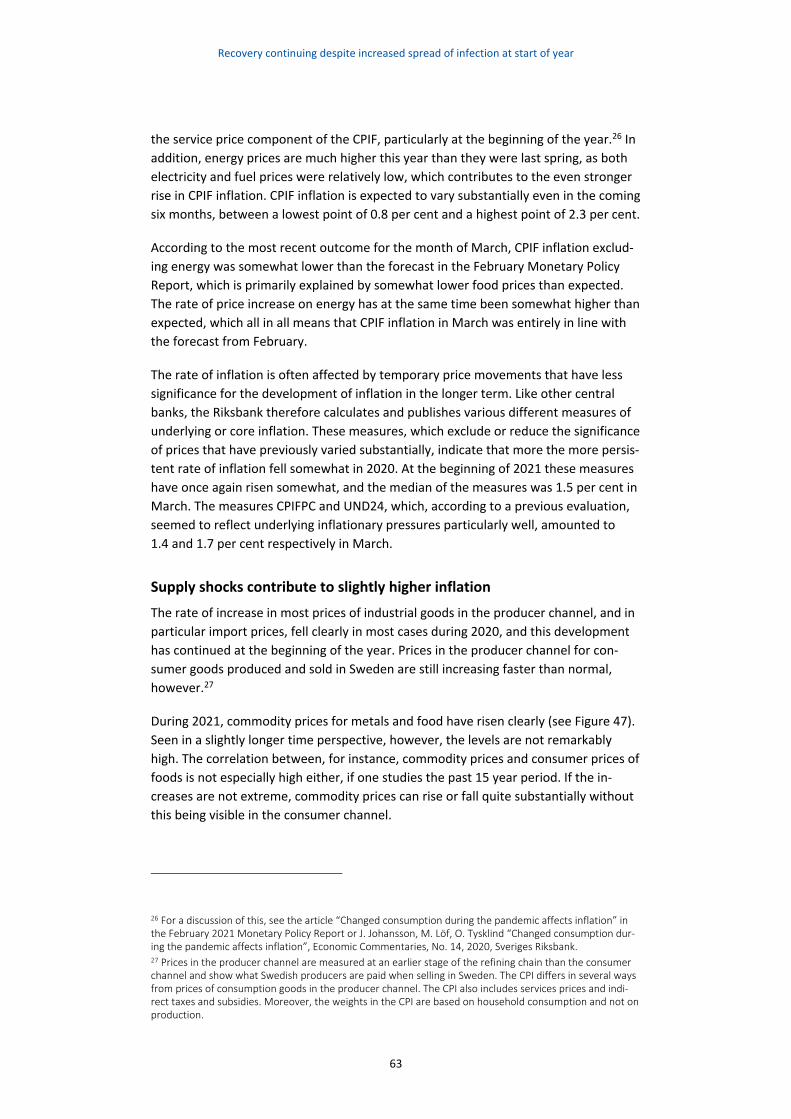
Recovery continuing despite increased spread of infection at start of year
63
the service price component of the CPIF, particularly at the beginning of the year.26 In
addition, energy prices are much higher this year than they were last spring, as both
electricity and fuel prices were relatively low, which contributes to the even stronger
rise in CPIF inflation. CPIF inflation is expected to vary substantially even in the coming
six months, between a lowest point of 0.8 per cent and a highest point of 2.3 per cent.
According to the most recent outcome for the month of March, CPIF inflation exclud-
ing energy was somewhat lower than the forecast in the February Monetary Policy
Report, which is primarily explained by somewhat lower food prices than expected.
The rate of price increase on energy has at the same time been somewhat higher than
expected, which all in all means that CPIF inflation in March was entirely in line with
the forecast from February.
The rate of inflation is often affected by temporary price movements that have less
significance for the development of inflation in the longer term. Like other central
banks, the Riksbank therefore calculates and publishes various different measures of
underlying or core inflation. These measures, which exclude or reduce the significance
of prices that have previously varied substantially, indicate that more the more persis-
tent rate of inflation fell somewhat in 2020. At the beginning of 2021 these measures
have once again risen somewhat, and the median of the measures was 1.5 per cent in
March. The measures CPIFPC and UND24, which, according to a previous evaluation,
seemed to reflect underlying inflationary pressures particularly well, amounted to
1.4 and 1.7 per cent respectively in March.
Supply shocks contribute to slightly higher inflation
The rate of increase in most prices of industrial goods in the producer channel, and in
particular import prices, fell clearly in most cases during 2020, and this development
has continued at the beginning of the year. Prices in the producer channel for con-
sumer goods produced and sold in Sweden are still increasing faster than normal,
however.27
During 2021, commodity prices for metals and food have risen clearly (see Figure 47).
Seen in a slightly longer time perspective, however, the levels are not remarkably
high. The correlation between, for instance, commodity prices and consumer prices of
foods is not especially high either, if one studies the past 15 year period. If the in-
creases are not extreme, commodity prices can rise or fall quite substantially without
this being visible in the consumer channel.
26 For a discussion of this, see the article “Changed consumption during the pandemic affects inflation” in the February 2021 Monetary Policy Report or J. Johansson, M. Löf, O. Tysklind “Changed consumption dur-ing the pandemic affects inflation”, Economic Commentaries, No. 14, 2020, Sveriges Riksbank. 27 Prices in the producer channel are measured at an earlier stage of the refining chain than the consumer channel and show what Swedish producers are paid when selling in Sweden. The CPI differs in several ways from prices of consumption goods in the producer channel. The CPI also includes services prices and indi-rect taxes and subsidies. Moreover, the weights in the CPI are based on household consumption and not on production.
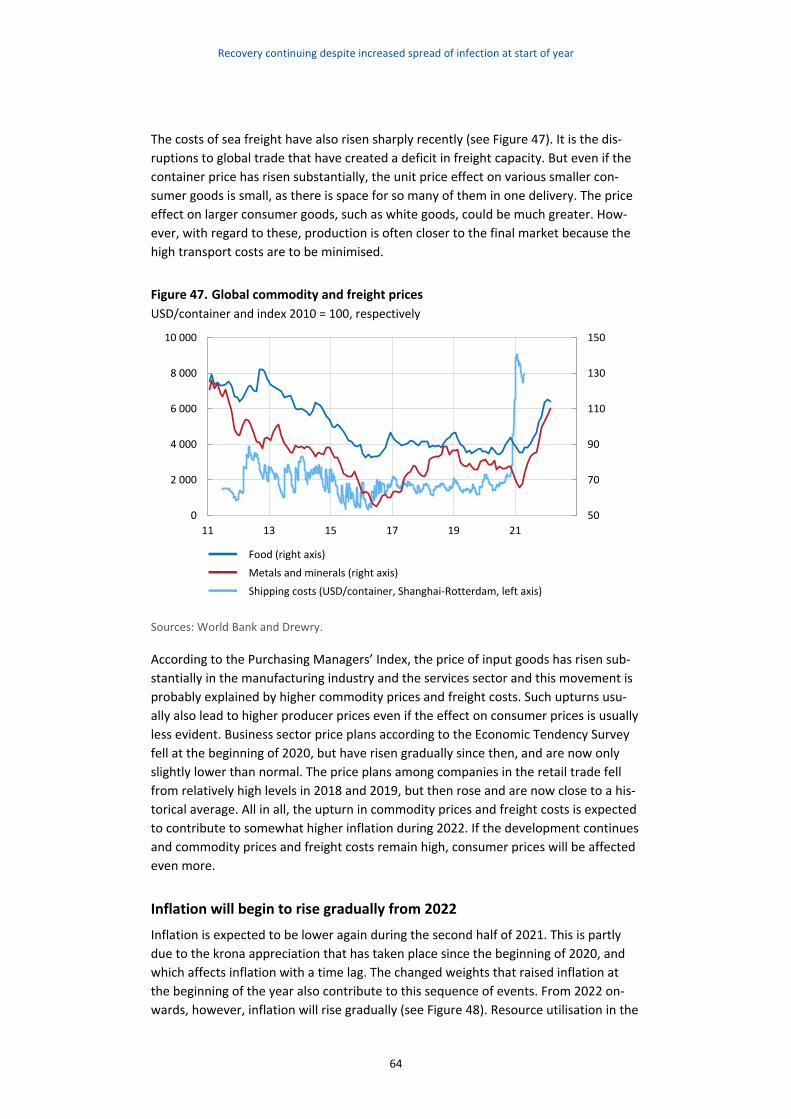
Recovery continuing despite increased spread of infection at start of year
64
The costs of sea freight have also risen sharply recently (see Figure 47). It is the dis-
ruptions to global trade that have created a deficit in freight capacity. But even if the
container price has risen substantially, the unit price effect on various smaller con-
sumer goods is small, as there is space for so many of them in one delivery. The price
effect on larger consumer goods, such as white goods, could be much greater. How-
ever, with regard to these, production is often closer to the final market because the
high transport costs are to be minimised.
Figure 47. Global commodity and freight prices
USD/container and index 2010 = 100, respectively
Sources: World Bank and Drewry.
According to the Purchasing Managers’ Index, the price of input goods has risen sub-
stantially in the manufacturing industry and the services sector and this movement is
probably explained by higher commodity prices and freight costs. Such upturns usu-
ally also lead to higher producer prices even if the effect on consumer prices is usually
less evident. Business sector price plans according to the Economic Tendency Survey
fell at the beginning of 2020, but have risen gradually since then, and are now only
slightly lower than normal. The price plans among companies in the retail trade fell
from relatively high levels in 2018 and 2019, but then rose and are now close to a his-
torical average. All in all, the upturn in commodity prices and freight costs is expected
to contribute to somewhat higher inflation during 2022. If the development continues
and commodity prices and freight costs remain high, consumer prices will be affected
even more.
Inflation will begin to rise gradually from 2022
Inflation is expected to be lower again during the second half of 2021. This is partly
due to the krona appreciation that has taken place since the beginning of 2020, and
which affects inflation with a time lag. The changed weights that raised inflation at
the beginning of the year also contribute to this sequence of events. From 2022 on-
wards, however, inflation will rise gradually (see Figure 48). Resource utilisation in the
50
70
90
110
130
150
0
2 000
4 000
6 000
8 000
10 000
11 13 15 17 19 21
Food (right axis)
Metals and minerals (right axis)
Shipping costs (USD/container, Shanghai-Rotterdam, left axis)
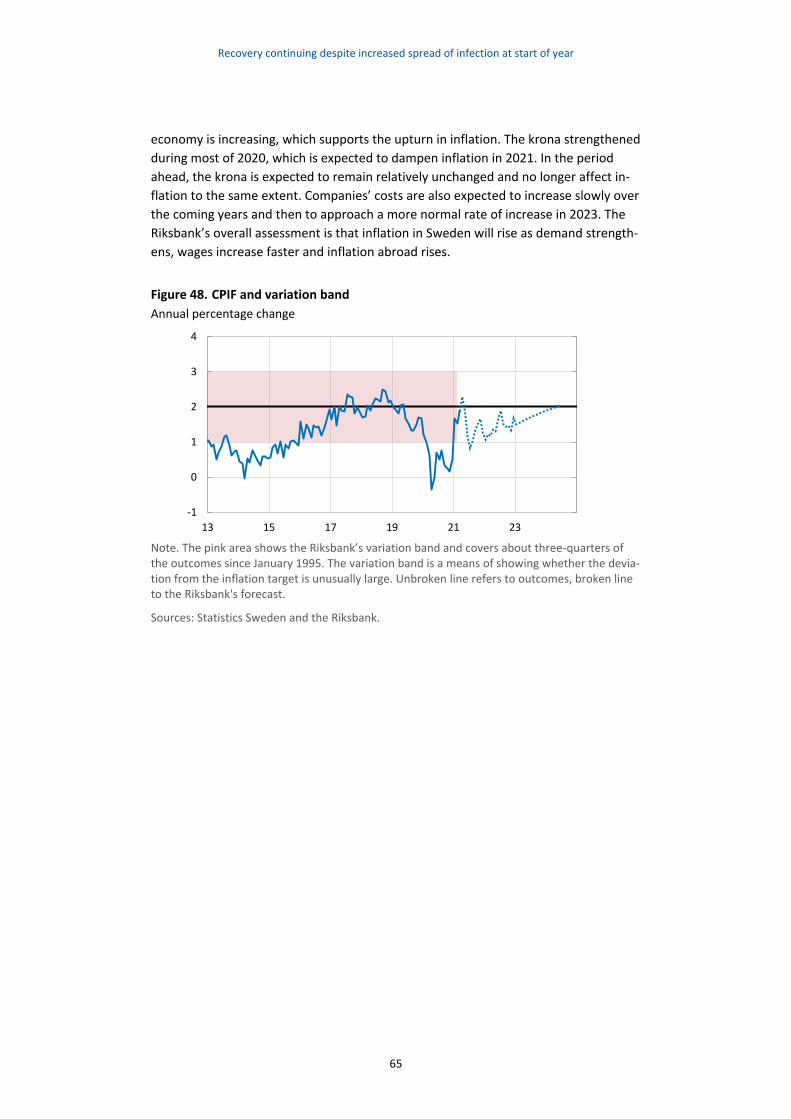
Recovery continuing despite increased spread of infection at start of year
65
economy is increasing, which supports the upturn in inflation. The krona strengthened
during most of 2020, which is expected to dampen inflation in 2021. In the period
ahead, the krona is expected to remain relatively unchanged and no longer affect in-
flation to the same extent. Companies’ costs are also expected to increase slowly over
the coming years and then to approach a more normal rate of increase in 2023. The
Riksbank’s overall assessment is that inflation in Sweden will rise as demand strength-
ens, wages increase faster and inflation abroad rises.
Figure 48. CPIF and variation band
Annual percentage change
Note. The pink area shows the Riksbank’s variation band and covers about three-quarters of the outcomes since January 1995. The variation band is a means of showing whether the devia-tion from the inflation target is unusually large. Unbroken line refers to outcomes, broken line to the Riksbank's forecast.
Sources: Statistics Sweden and the Riksbank.
-1
0
1
2
3
4
13 15 17 19 21 23
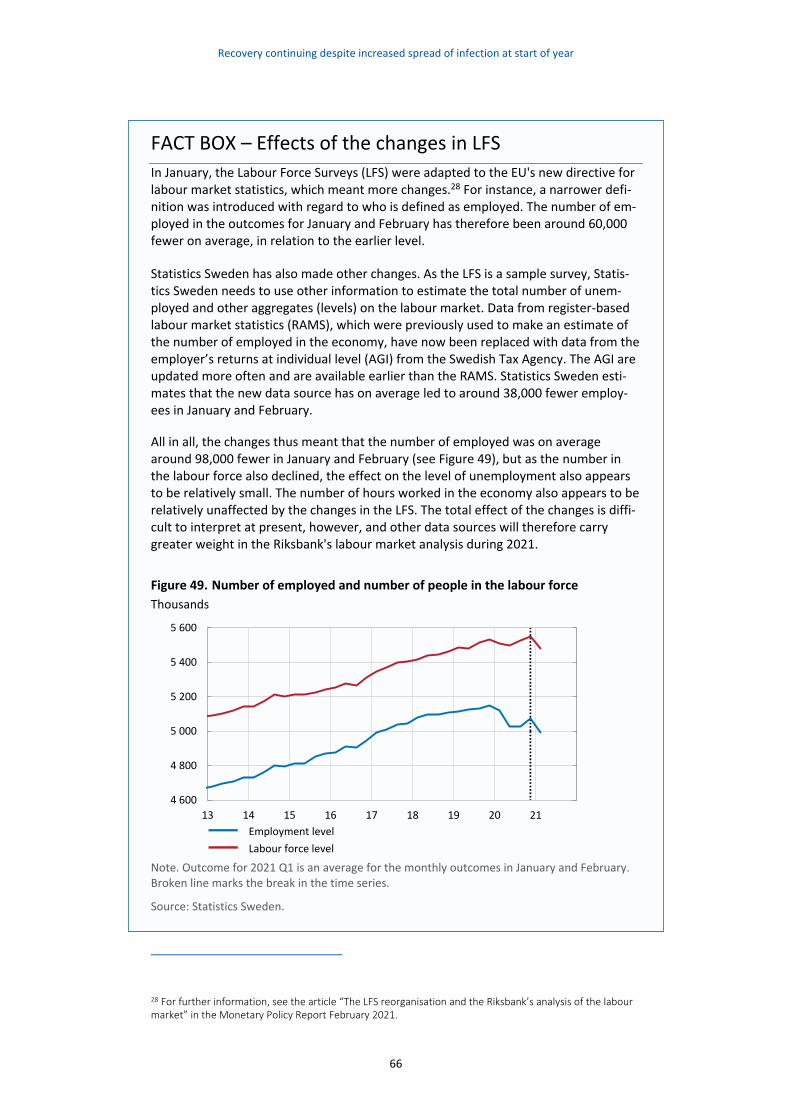
Recovery continuing despite increased spread of infection at start of year
66
FACT BOX – Effects of the changes in LFS
In January, the Labour Force Surveys (LFS) were adapted to the EU's new directive for labour market statistics, which meant more changes.28 For instance, a narrower defi-nition was introduced with regard to who is defined as employed. The number of em-ployed in the outcomes for January and February has therefore been around 60,000 fewer on average, in relation to the earlier level.
Statistics Sweden has also made other changes. As the LFS is a sample survey, Statis-tics Sweden needs to use other information to estimate the total number of unem-ployed and other aggregates (levels) on the labour market. Data from register-based labour market statistics (RAMS), which were previously used to make an estimate of the number of employed in the economy, have now been replaced with data from the employer’s returns at individual level (AGI) from the Swedish Tax Agency. The AGI are updated more often and are available earlier than the RAMS. Statistics Sweden esti-mates that the new data source has on average led to around 38,000 fewer employ-ees in January and February.
All in all, the changes thus meant that the number of employed was on average around 98,000 fewer in January and February (see Figure 49), but as the number in the labour force also declined, the effect on the level of unemployment also appears to be relatively small. The number of hours worked in the economy also appears to be relatively unaffected by the changes in the LFS. The total effect of the changes is diffi-cult to interpret at present, however, and other data sources will therefore carry greater weight in the Riksbank's labour market analysis during 2021.
Figure 49. Number of employed and number of people in the labour force
Thousands
Note. Outcome for 2021 Q1 is an average for the monthly outcomes in January and February. Broken line marks the break in the time series.
Source: Statistics Sweden.
28 For further information, see the article “The LFS reorganisation and the Riksbank’s analysis of the labour market” in the Monetary Policy Report February 2021.
4 600
4 800
5 000
5 200
5 400
5 600
13 14 15 16 17 18 19 20 21
Employment level
Labour force level
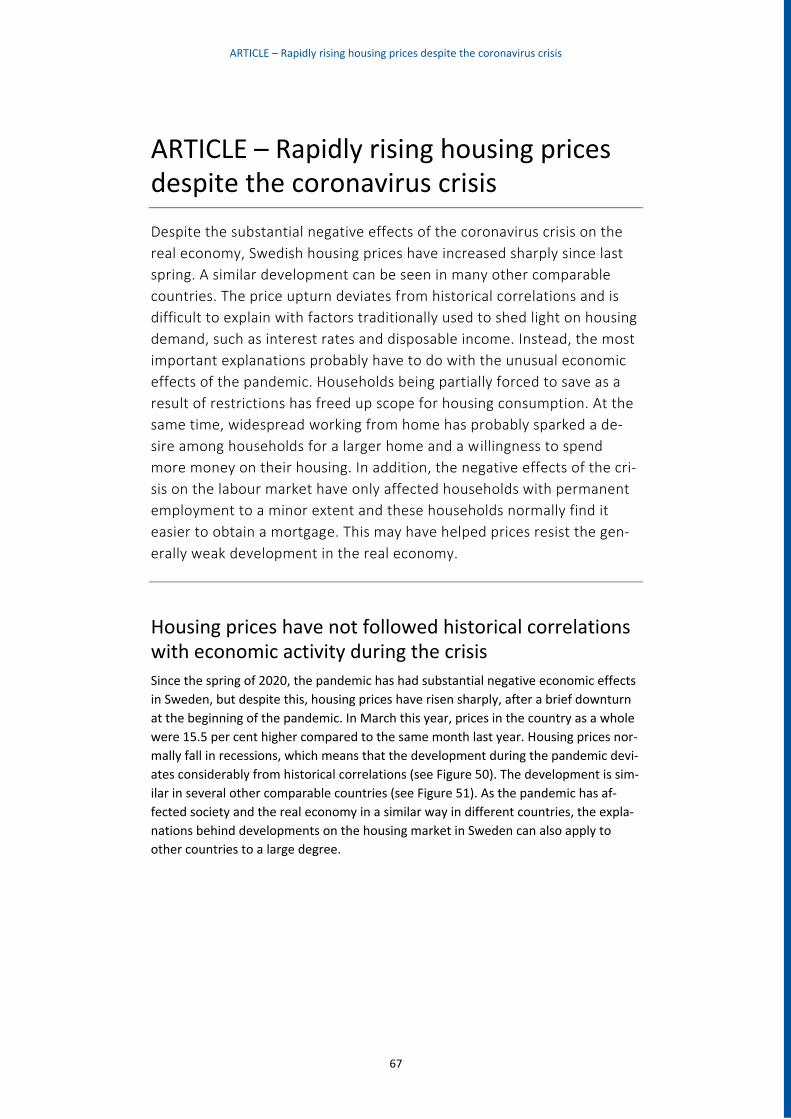
ARTICLE – Rapidly rising housing prices despite the coronavirus crisis
67
ARTICLE – Rapidly rising housing prices despite the coronavirus crisis
Despite the substantial negative effects of the coronavirus crisis on the
real economy, Swedish housing prices have increased sharply since last
spring. A similar development can be seen in many other comparable
countries. The price upturn deviates from historical correlations and is
difficult to explain with factors traditionally used to shed light on housing
demand, such as interest rates and disposable income. Instead, the most
important explanations probably have to do with the unusual economic
effects of the pandemic. Households being partially forced to save as a
result of restrictions has freed up scope for housing consumption. At the
same time, widespread working from home has probably sparked a de-
sire among households for a larger home and a willingness to spend
more money on their housing. In addition, the negative effects of the cri-
sis on the labour market have only affected households with permanent
employment to a minor extent and these households normally find it
easier to obtain a mortgage. This may have helped prices resist the gen-
erally weak development in the real economy.
Housing prices have not followed historical correlations with economic activity during the crisis
Since the spring of 2020, the pandemic has had substantial negative economic effects
in Sweden, but despite this, housing prices have risen sharply, after a brief downturn
at the beginning of the pandemic. In March this year, prices in the country as a whole
were 15.5 per cent higher compared to the same month last year. Housing prices nor-
mally fall in recessions, which means that the development during the pandemic devi-
ates considerably from historical correlations (see Figure 50). The development is sim-
ilar in several other comparable countries (see Figure 51). As the pandemic has af-
fected society and the real economy in a similar way in different countries, the expla-
nations behind developments on the housing market in Sweden can also apply to
other countries to a large degree.
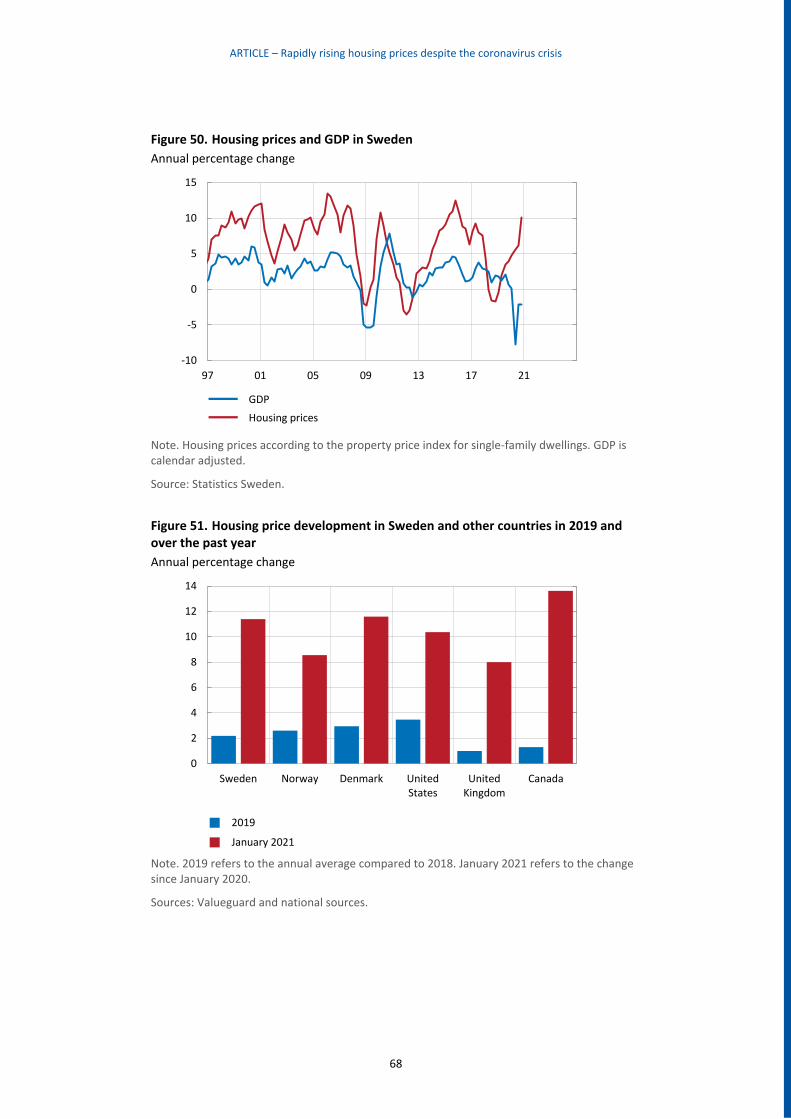
ARTICLE – Rapidly rising housing prices despite the coronavirus crisis
68
Figure 50. Housing prices and GDP in Sweden
Annual percentage change
Note. Housing prices according to the property price index for single-family dwellings. GDP is calendar adjusted.
Source: Statistics Sweden.
Figure 51. Housing price development in Sweden and other countries in 2019 and over the past year
Annual percentage change
Note. 2019 refers to the annual average compared to 2018. January 2021 refers to the change since January 2020.
Sources: Valueguard and national sources.
-10
-5
0
5
10
15
97 01 05 09 13 17 21
GDP
Housing prices
0
2
4
6
8
10
12
14
Sweden Norway Denmark UnitedStates
UnitedKingdom
Canada
2019
January 2021
ARTICLE – Rapidly rising housing prices despite the coronavirus crisis
69
Minor changes in the housing stock – increased demand most important factor for price development over the past year
The rise in housing prices could be due to low supply, high demand or a combination
of the two. Housing construction has increased from a low level after the financial cri-
sis just over 10 years ago and has been high in recent years. For a long time, more
apartments in multi-dwelling blocks have been built than detached houses (see Figure
52).29 During the coronavirus crisis, no dramatic changes have occurred in the con-
struction of new housing. But despite the relatively high level of housing construction
in recent years, the number of new homes over one year is less than 1 per cent of the
existing stock. The total supply of housing is thus changing very slowly. And this is also
true of the composition of the housing available, for example the number of detached
houses in relation to tenant-owned apartments and the number of large apartments
in relation to small ones. In the short term, therefore, price movements on the hous-
ing market are mainly being driven by variations in demand.30
29 For a historical review of housing construction in Sweden, see R. Emanuelsson, “Supply of housing in Swe-den, Sveriges Riksbank Economic Review, No. 2, 2015. 30 There are exceptions, however, when housing construction affected price formation in the short run. An example was 2016-2017, when housing construction increased sharply in Sweden and housing prices fell significantly in the autumn of 2017. See, for example, G. Katinic, “Perspectives on housing construction”, Economic Commentaries, No. 2, 2018, Sveriges Riksbank, “Reduced housing construction is subduing GDP growth”, article in Monetary Policy Report, February, Sveriges Riksbank, 2018 and “New production of housing and financial stability”, article in Financial Stability Report, No. 2, 2018, Sveriges Riksbank.
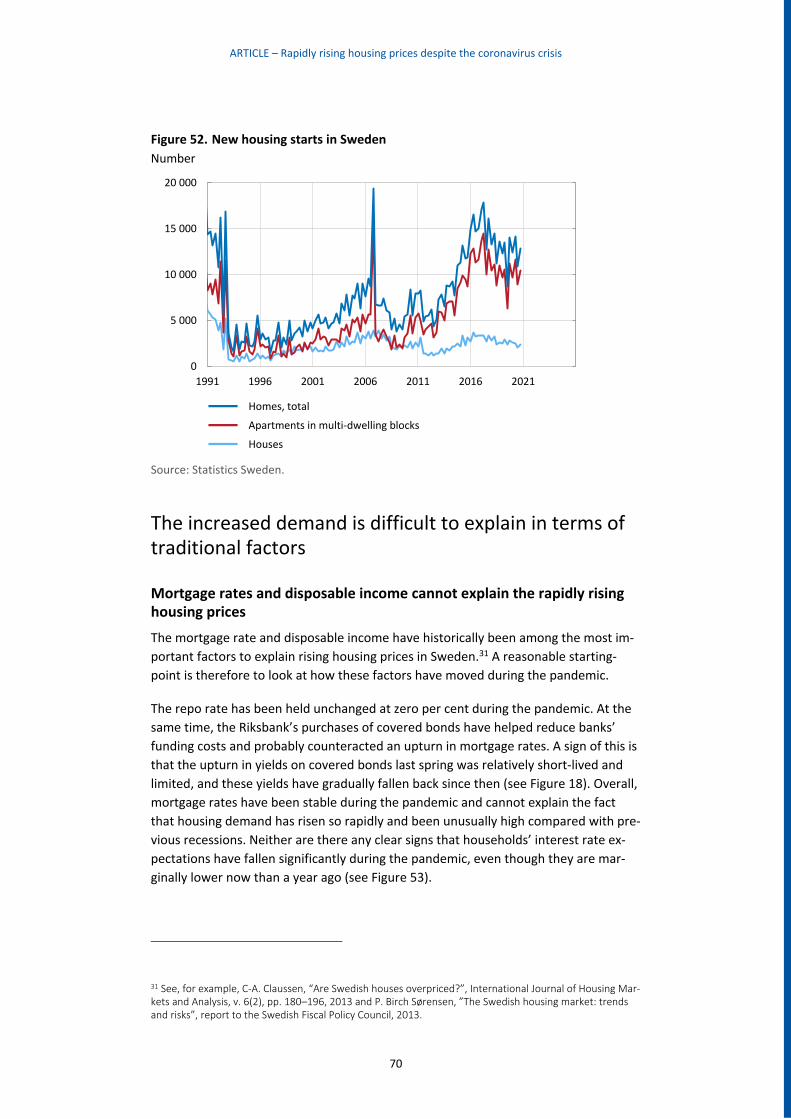
ARTICLE – Rapidly rising housing prices despite the coronavirus crisis
70
Figure 52. New housing starts in Sweden
Number
Source: Statistics Sweden.
The increased demand is difficult to explain in terms of traditional factors
Mortgage rates and disposable income cannot explain the rapidly rising housing prices
The mortgage rate and disposable income have historically been among the most im-
portant factors to explain rising housing prices in Sweden.31 A reasonable starting-
point is therefore to look at how these factors have moved during the pandemic.
The repo rate has been held unchanged at zero per cent during the pandemic. At the
same time, the Riksbank’s purchases of covered bonds have helped reduce banks’
funding costs and probably counteracted an upturn in mortgage rates. A sign of this is
that the upturn in yields on covered bonds last spring was relatively short-lived and
limited, and these yields have gradually fallen back since then (see Figure 18). Overall,
mortgage rates have been stable during the pandemic and cannot explain the fact
that housing demand has risen so rapidly and been unusually high compared with pre-
vious recessions. Neither are there any clear signs that households’ interest rate ex-
pectations have fallen significantly during the pandemic, even though they are mar-
ginally lower now than a year ago (see Figure 53).
31 See, for example, C-A. Claussen, “Are Swedish houses overpriced?”, International Journal of Housing Mar-kets and Analysis, v. 6(2), pp. 180–196, 2013 and P. Birch Sørensen, ”The Swedish housing market: trends and risks”, report to the Swedish Fiscal Policy Council, 2013.
0
5 000
10 000
15 000
20 000
1991 1996 2001 2006 2011 2016 2021
Homes, total
Apartments in multi-dwelling blocks
Houses
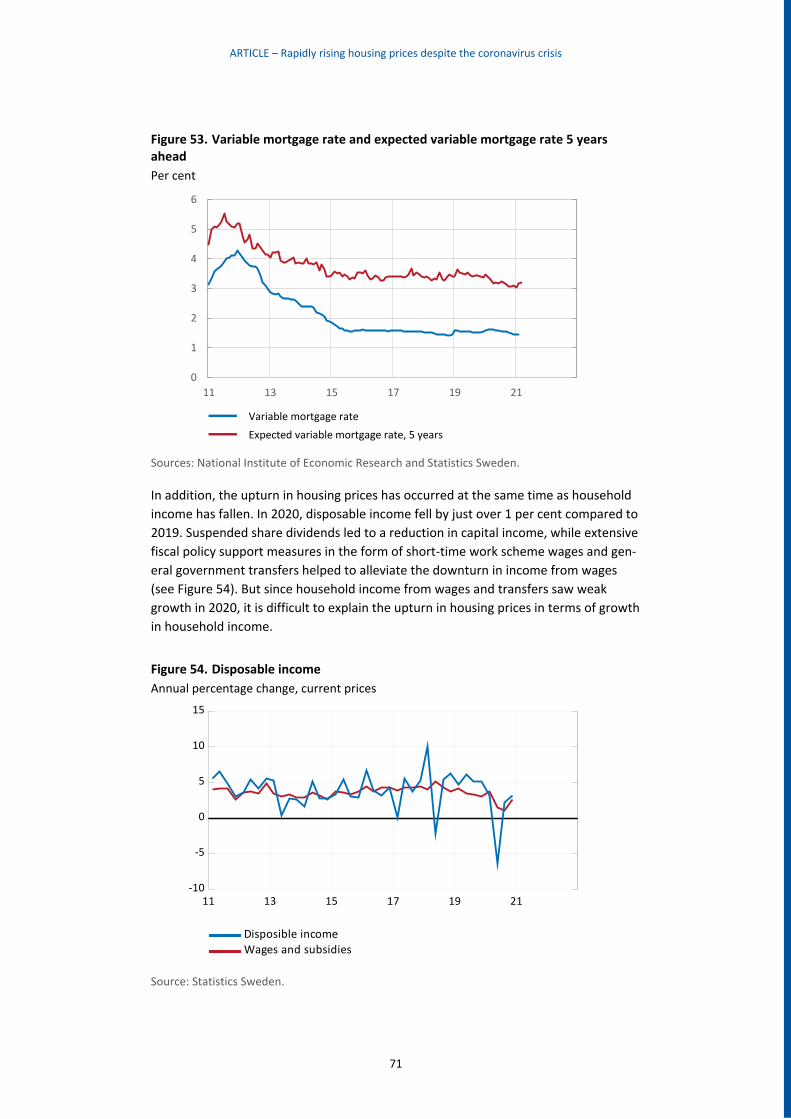
ARTICLE – Rapidly rising housing prices despite the coronavirus crisis
71
Figure 53. Variable mortgage rate and expected variable mortgage rate 5 years ahead
Per cent
Sources: National Institute of Economic Research and Statistics Sweden.
In addition, the upturn in housing prices has occurred at the same time as household
income has fallen. In 2020, disposable income fell by just over 1 per cent compared to
2019. Suspended share dividends led to a reduction in capital income, while extensive
fiscal policy support measures in the form of short-time work scheme wages and gen-
eral government transfers helped to alleviate the downturn in income from wages
(see Figure 54). But since household income from wages and transfers saw weak
growth in 2020, it is difficult to explain the upturn in housing prices in terms of growth
in household income.
Figure 54. Disposable income
Annual percentage change, current prices
11 13 15 17 19 21-10
-5
0
5
10
15
Wages and subsidies
Disposible income
Source: Statistics Sweden.
0
1
2
3
4
5
6
11 13 15 17 19 21
Variable mortgage rate
Expected variable mortgage rate, 5 years
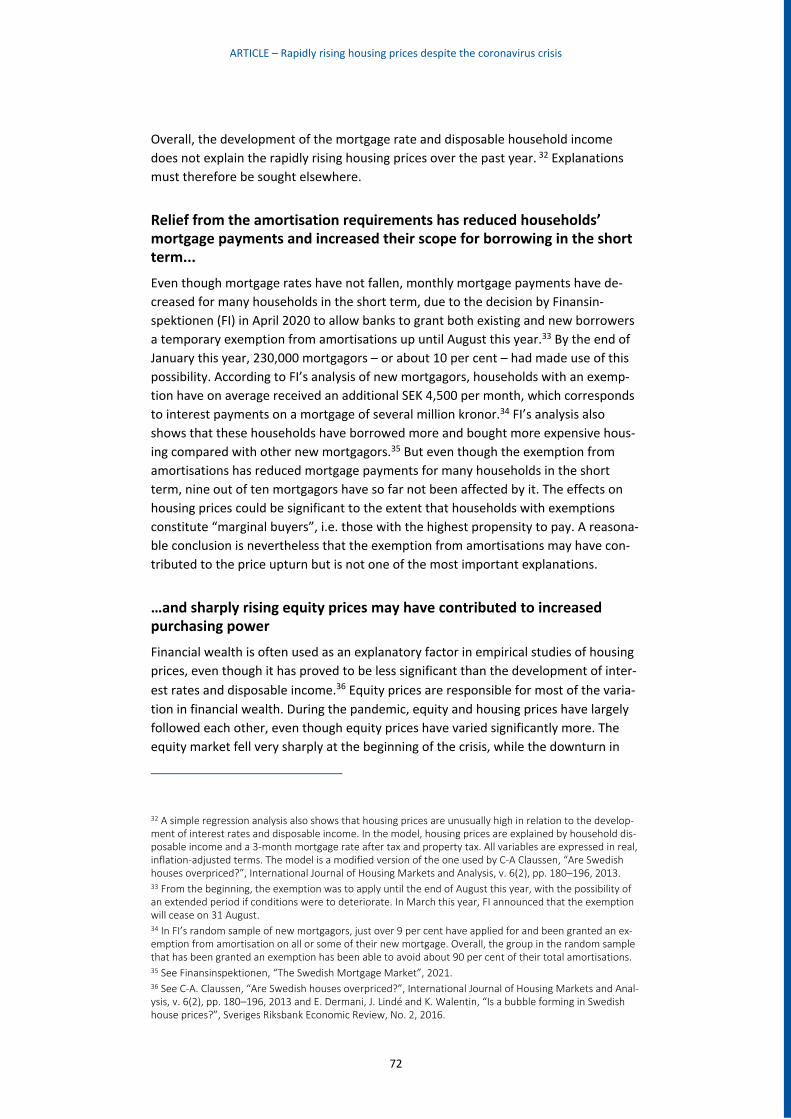
ARTICLE – Rapidly rising housing prices despite the coronavirus crisis
72
Overall, the development of the mortgage rate and disposable household income
does not explain the rapidly rising housing prices over the past year. 32 Explanations
must therefore be sought elsewhere.
Relief from the amortisation requirements has reduced households’ mortgage payments and increased their scope for borrowing in the short term...
Even though mortgage rates have not fallen, monthly mortgage payments have de-
creased for many households in the short term, due to the decision by Finansin-
spektionen (FI) in April 2020 to allow banks to grant both existing and new borrowers
a temporary exemption from amortisations up until August this year.33 By the end of
January this year, 230,000 mortgagors – or about 10 per cent – had made use of this
possibility. According to FI’s analysis of new mortgagors, households with an exemp-
tion have on average received an additional SEK 4,500 per month, which corresponds
to interest payments on a mortgage of several million kronor.34 FI’s analysis also
shows that these households have borrowed more and bought more expensive hous-
ing compared with other new mortgagors.35 But even though the exemption from
amortisations has reduced mortgage payments for many households in the short
term, nine out of ten mortgagors have so far not been affected by it. The effects on
housing prices could be significant to the extent that households with exemptions
constitute “marginal buyers”, i.e. those with the highest propensity to pay. A reasona-
ble conclusion is nevertheless that the exemption from amortisations may have con-
tributed to the price upturn but is not one of the most important explanations.
…and sharply rising equity prices may have contributed to increased purchasing power
Financial wealth is often used as an explanatory factor in empirical studies of housing
prices, even though it has proved to be less significant than the development of inter-
est rates and disposable income.36 Equity prices are responsible for most of the varia-
tion in financial wealth. During the pandemic, equity and housing prices have largely
followed each other, even though equity prices have varied significantly more. The
equity market fell very sharply at the beginning of the crisis, while the downturn in
32 A simple regression analysis also shows that housing prices are unusually high in relation to the develop-ment of interest rates and disposable income. In the model, housing prices are explained by household dis-posable income and a 3-month mortgage rate after tax and property tax. All variables are expressed in real, inflation-adjusted terms. The model is a modified version of the one used by C-A Claussen, “Are Swedish houses overpriced?”, International Journal of Housing Markets and Analysis, v. 6(2), pp. 180–196, 2013. 33 From the beginning, the exemption was to apply until the end of August this year, with the possibility of an extended period if conditions were to deteriorate. In March this year, FI announced that the exemption will cease on 31 August. 34 In FI’s random sample of new mortgagors, just over 9 per cent have applied for and been granted an ex-emption from amortisation on all or some of their new mortgage. Overall, the group in the random sample that has been granted an exemption has been able to avoid about 90 per cent of their total amortisations. 35 See Finansinspektionen, “The Swedish Mortgage Market”, 2021. 36 See C-A. Claussen, “Are Swedish houses overpriced?”, International Journal of Housing Markets and Anal-ysis, v. 6(2), pp. 180–196, 2013 and E. Dermani, J. Lindé and K. Walentin, “Is a bubble forming in Swedish house prices?”, Sveriges Riksbank Economic Review, No. 2, 2016.
ARTICLE – Rapidly rising housing prices despite the coronavirus crisis
73
housing prices was relatively modest. Since then, the equity market has recovered
very strongly (see Figure 19). And during this period, housing prices have also risen
sharply.
The strong stock market growth has contributed to a rise in financial wealth and given
some households greater purchasing power on the housing market. But one reason
equity prices do not normally affect housing demand to any significant extent is that
equity ownership is much more unevenly distributed than housing ownership in the
population. This makes it probable that the rising equity prices may have contributed
to rising housing prices on certain sub-markets but not been of decisive significance
for overall development.
The most important explanations probably have to do with the effects of the pandemic on the economy
More money over for households when other consumption is suspended
A factor that has probably contributed to the development of housing prices in both
Sweden and comparable countries is that households have been more or less forced
to save. This is associated with the fact that it has been difficult to travel and to visit
restaurants and hotels due to both regulated and self-imposed restrictions (see Figure
36). The saving ratio, that is saving in relation to disposable income, has risen signifi-
cantly during the pandemic. This has led to households having greater scope for
spending more of their income on housing services. A household with a disposable in-
come of SEK 50,000 a month that consumes 2 per cent less of its income every month
would, for example, be able to spend SEK 1,000 more a month on housing services.37
A sign that households’ economic resources have been moved from consumption of
goods and services to housing expenses can be found in FI’s mortgage survey. It indi-
cates that new mortgagors in the autumn of 2020 borrowed more compared to one
year previously, both in relation to the value of the home (a higher loan-to-value ra-
tio) and their income (a higher debt-to-income ratio). Both the average loan-to-value
ratio and the average debt-to-income ratio were at their highest since surveys be-
gan.38 An important explanation for why households want to put more money into
their homes is because they are spending more time there.
37 Average disposable income in the random sample of new mortgagors in FI’s mortgage survey was SEK 48,970 a month. See Finansinspektionen, “The Swedish Mortgage Market”, 2,021. 38 The surveys have been published annually since 2012. See Finansinspektionen, “The Swedish Mortgage Market”, 2,021.
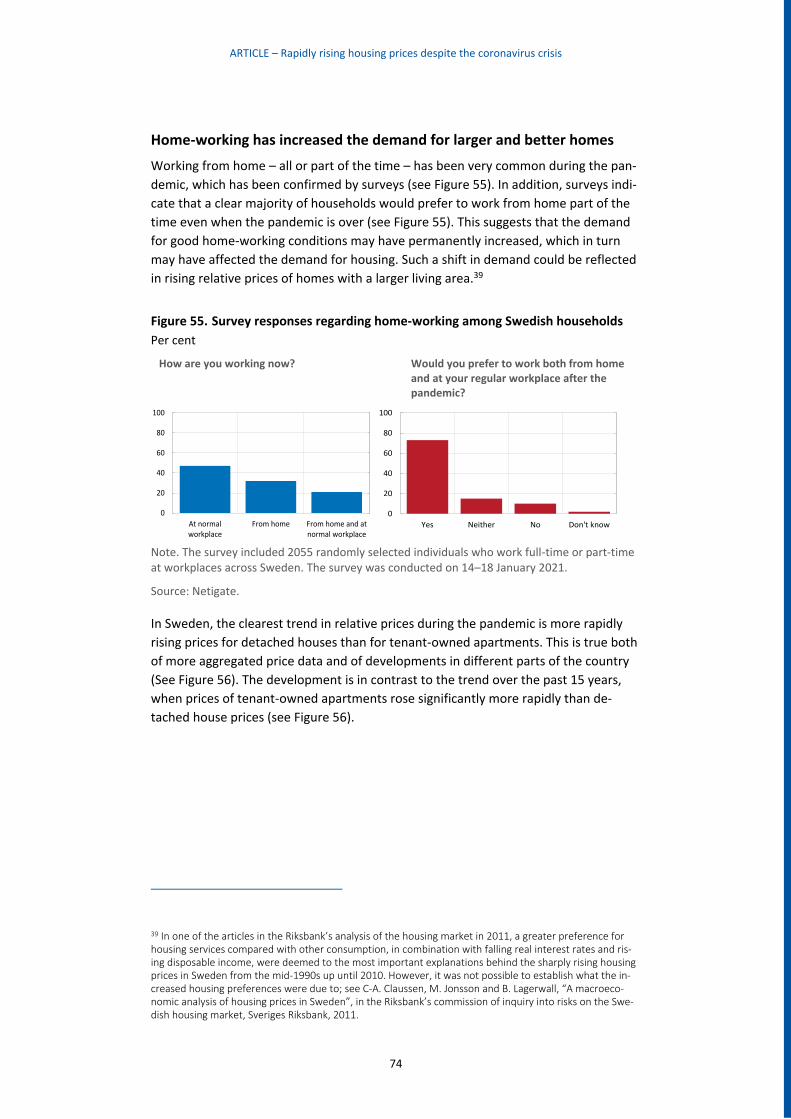
ARTICLE – Rapidly rising housing prices despite the coronavirus crisis
74
Home-working has increased the demand for larger and better homes
Working from home – all or part of the time – has been very common during the pan-
demic, which has been confirmed by surveys (see Figure 55). In addition, surveys indi-
cate that a clear majority of households would prefer to work from home part of the
time even when the pandemic is over (see Figure 55). This suggests that the demand
for good home-working conditions may have permanently increased, which in turn
may have affected the demand for housing. Such a shift in demand could be reflected
in rising relative prices of homes with a larger living area.39
Figure 55. Survey responses regarding home-working among Swedish households
Per cent
How are you working now? Would you prefer to work both from home and at your regular workplace after the pandemic?
Note. The survey included 2055 randomly selected individuals who work full-time or part-time at workplaces across Sweden. The survey was conducted on 14–18 January 2021.
Source: Netigate.
In Sweden, the clearest trend in relative prices during the pandemic is more rapidly
rising prices for detached houses than for tenant-owned apartments. This is true both
of more aggregated price data and of developments in different parts of the country
(See Figure 56). The development is in contrast to the trend over the past 15 years,
when prices of tenant-owned apartments rose significantly more rapidly than de-
tached house prices (see Figure 56).
39 In one of the articles in the Riksbank’s analysis of the housing market in 2011, a greater preference for housing services compared with other consumption, in combination with falling real interest rates and ris-ing disposable income, were deemed to the most important explanations behind the sharply rising housing prices in Sweden from the mid-1990s up until 2010. However, it was not possible to establish what the in-creased housing preferences were due to; see C-A. Claussen, M. Jonsson and B. Lagerwall, “A macroeco-nomic analysis of housing prices in Sweden”, in the Riksbank’s commission of inquiry into risks on the Swe-dish housing market, Sveriges Riksbank, 2011.
0
20
40
60
80
100
At normalworkplace
From home From home and atnormal workplace
0
20
40
60
80
100
Yes Neither No Don't know
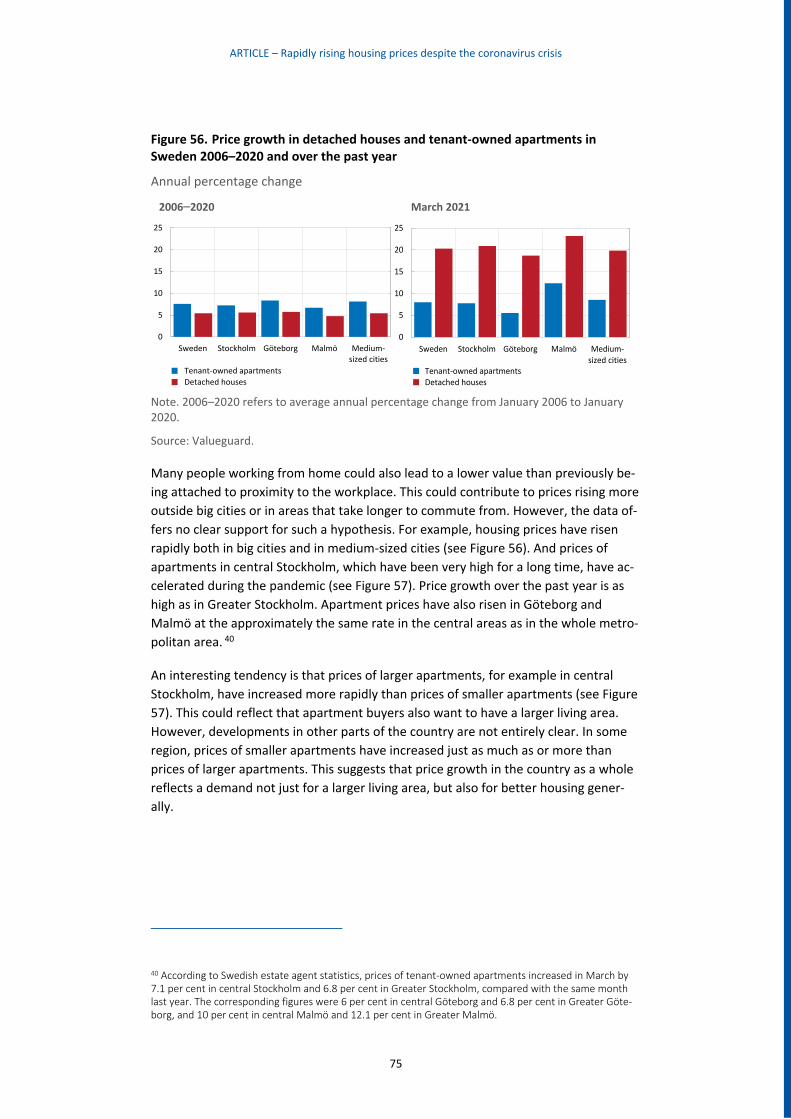
ARTICLE – Rapidly rising housing prices despite the coronavirus crisis
75
Figure 56. Price growth in detached houses and tenant-owned apartments in Sweden 2006–2020 and over the past year
Annual percentage change
2006–2020 March 2021
Note. 2006–2020 refers to average annual percentage change from January 2006 to January 2020.
Source: Valueguard.
Many people working from home could also lead to a lower value than previously be-
ing attached to proximity to the workplace. This could contribute to prices rising more
outside big cities or in areas that take longer to commute from. However, the data of-
fers no clear support for such a hypothesis. For example, housing prices have risen
rapidly both in big cities and in medium-sized cities (see Figure 56). And prices of
apartments in central Stockholm, which have been very high for a long time, have ac-
celerated during the pandemic (see Figure 57). Price growth over the past year is as
high as in Greater Stockholm. Apartment prices have also risen in Göteborg and
Malmö at the approximately the same rate in the central areas as in the whole metro-
politan area. 40
An interesting tendency is that prices of larger apartments, for example in central
Stockholm, have increased more rapidly than prices of smaller apartments (see Figure
57). This could reflect that apartment buyers also want to have a larger living area.
However, developments in other parts of the country are not entirely clear. In some
region, prices of smaller apartments have increased just as much as or more than
prices of larger apartments. This suggests that price growth in the country as a whole
reflects a demand not just for a larger living area, but also for better housing gener-
ally.
40 According to Swedish estate agent statistics, prices of tenant-owned apartments increased in March by 7.1 per cent in central Stockholm and 6.8 per cent in Greater Stockholm, compared with the same month last year. The corresponding figures were 6 per cent in central Göteborg and 6.8 per cent in Greater Göte-borg, and 10 per cent in central Malmö and 12.1 per cent in Greater Malmö.
0
5
10
15
20
25
Sweden Stockholm Göteborg Malmö Medium-sized cities
Tenant-owned apartments
Detached houses
0
5
10
15
20
25
Sweden Stockholm Göteborg Malmö Medium-sized cities
Tenant-owned apartmentsDetached houses
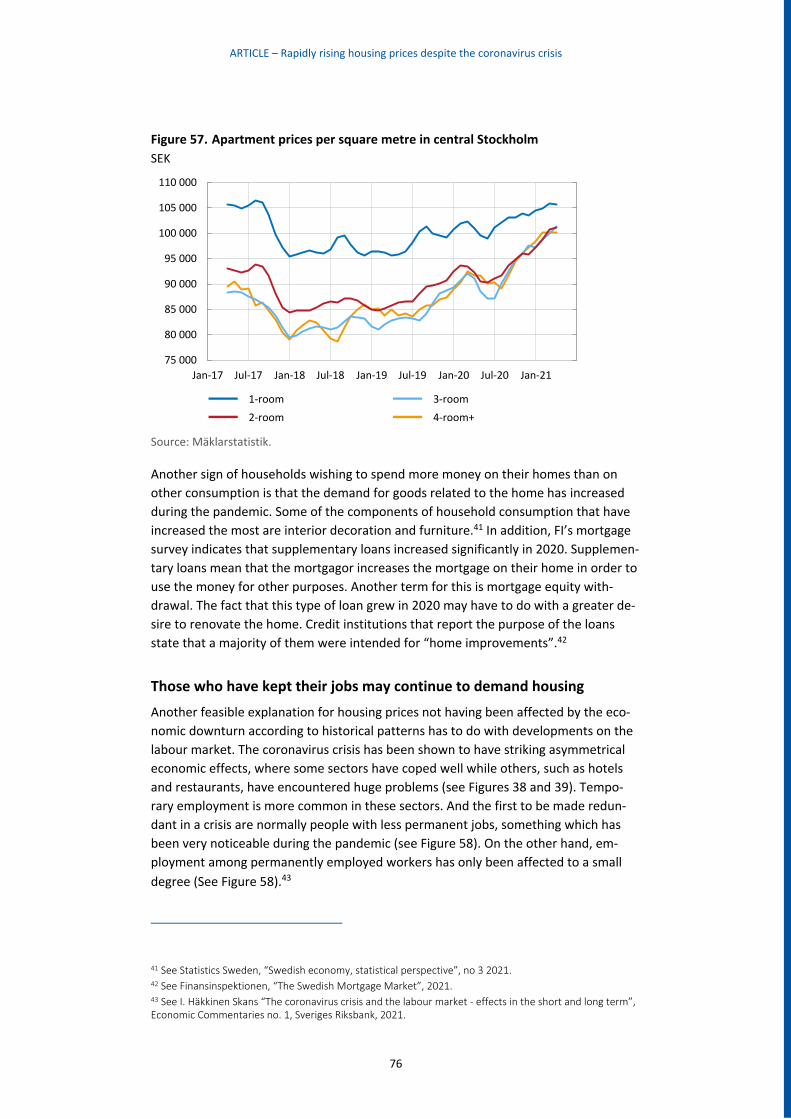
ARTICLE – Rapidly rising housing prices despite the coronavirus crisis
76
Figure 57. Apartment prices per square metre in central Stockholm
SEK
Source: Mäklarstatistik.
Another sign of households wishing to spend more money on their homes than on
other consumption is that the demand for goods related to the home has increased
during the pandemic. Some of the components of household consumption that have
increased the most are interior decoration and furniture.41 In addition, FI’s mortgage
survey indicates that supplementary loans increased significantly in 2020. Supplemen-
tary loans mean that the mortgagor increases the mortgage on their home in order to
use the money for other purposes. Another term for this is mortgage equity with-
drawal. The fact that this type of loan grew in 2020 may have to do with a greater de-
sire to renovate the home. Credit institutions that report the purpose of the loans
state that a majority of them were intended for “home improvements”.42
Those who have kept their jobs may continue to demand housing
Another feasible explanation for housing prices not having been affected by the eco-
nomic downturn according to historical patterns has to do with developments on the
labour market. The coronavirus crisis has been shown to have striking asymmetrical
economic effects, where some sectors have coped well while others, such as hotels
and restaurants, have encountered huge problems (see Figures 38 and 39). Tempo-
rary employment is more common in these sectors. And the first to be made redun-
dant in a crisis are normally people with less permanent jobs, something which has
been very noticeable during the pandemic (see Figure 58). On the other hand, em-
ployment among permanently employed workers has only been affected to a small
degree (See Figure 58).43
41 See Statistics Sweden, “Swedish economy, statistical perspective”, no 3 2021. 42 See Finansinspektionen, “The Swedish Mortgage Market”, 2021. 43 See I. Häkkinen Skans “The coronavirus crisis and the labour market - effects in the short and long term”, Economic Commentaries no. 1, Sveriges Riksbank, 2021.
75 000
80 000
85 000
90 000
95 000
100 000
105 000
110 000
Jan-17 Jul-17 Jan-18 Jul-18 Jan-19 Jul-19 Jan-20 Jul-20 Jan-21
1-room
2-room
3-room
4-room+
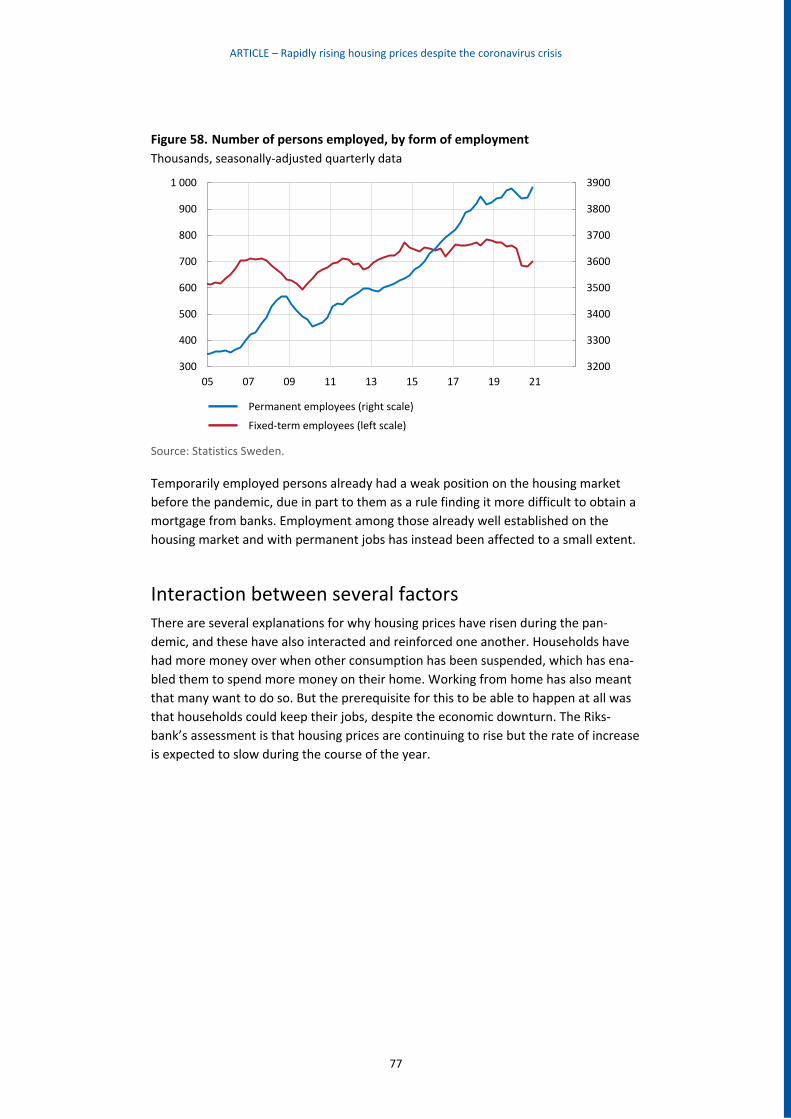
ARTICLE – Rapidly rising housing prices despite the coronavirus crisis
77
Figure 58. Number of persons employed, by form of employment
Thousands, seasonally-adjusted quarterly data
Source: Statistics Sweden.
Temporarily employed persons already had a weak position on the housing market
before the pandemic, due in part to them as a rule finding it more difficult to obtain a
mortgage from banks. Employment among those already well established on the
housing market and with permanent jobs has instead been affected to a small extent.
Interaction between several factors
There are several explanations for why housing prices have risen during the pan-
demic, and these have also interacted and reinforced one another. Households have
had more money over when other consumption has been suspended, which has ena-
bled them to spend more money on their home. Working from home has also meant
that many want to do so. But the prerequisite for this to be able to happen at all was
that households could keep their jobs, despite the economic downturn. The Riks-
bank’s assessment is that housing prices are continuing to rise but the rate of increase
is expected to slow during the course of the year.
3200
3300
3400
3500
3600
3700
3800
3900
300
400
500
600
700
800
900
1 000
05 07 09 11 13 15 17 19 21
Permanent employees (right scale)
Fixed-term employees (left scale)
ARTICLE – Alternative scenarios for the recovery
78
ARTICLE – Alternative scenarios for the recovery
In the Riksbank's main scenario, growth picks up in the second half of
2021, primarily due to rising consumption. However, the economic out-
look is more uncertain than during normal times. This is illustrated in this
article with the help of two alternative scenarios.
In one scenario, it is assumed that the roll-out of vaccines will proceed
more slowly than is expected in the main scenario, or that the vaccines
will turn out to be less effective than expected against virus mutations.
This would mean that effective immunity would be achieved later than in
the main scenario with lower confidence among economic agents and a
slower recovery as a result. In particular, this applies within sectors
where it is common to have a lot of close contact between people.
In the other scenario, it is assumed that the recovery will take place
more rapidly and be more powerful than in the forecast, for example if
willingness to use the savings accumulated during the crisis for consump-
tion and investment has been underestimated in the main scenario. This
may mean that consumer and business confidence increase more rapidly
than in the main scenario, with higher consumption, investment, employ-
ment and inflation as a consequence. At the same time, there may be
limits to how quickly production can be adapted to a rapid rise in de-
mand.
Still considerable uncertainty in the forecasts
The pandemic has impacted different sectors with varying severity
So far, the pandemic has hit companies and employees in the service sector the hard-
est. Sectors such as hotels, restaurants, various personal services, transport and physi-
cal shops have been particularly badly affected.44,45 Despite these sectors being rela-
tively small in relation to total employment, they were responsible for almost 90 per
cent of the total decline in the number of people employed in 2020 (see Figure 39). It
44 The same sectors have also been hardest hit in other countries; see, for example, Economic Bulletin 2021:2, ECB. In both Sweden and the rest of the world, these sectors were particularly badly impacted dur-ing the first wave of the pandemic. 45 This differs from the financial crisis of 2008-2009, for example, when goods manufacturing sectors were hit hardest.
ARTICLE – Alternative scenarios for the recovery
79
is also in these sectors that confidence has fallen the most. On the contrary, produc-
tion and confidence in the manufacturing sector are on a higher level now than before
the pandemic.
The Riksbank’s main scenario assumes that all people over the age of 18 will have
been offered vaccination by the end of summer 2021 and that, helped by the warmer
weather, the spread of infection will thereby slow down and restrictions can be
phased out. In addition, the vaccinations are assumed to prevent the spread of infec-
tion gaining new impetus in the autumn. When restrictions are eased, growth in the
Swedish economy is expected to pick up again, driven above all by increasing house-
hold consumption and rising employment in the sectors impacted most severely by
the pandemic. Household saving has increased during the pandemic. This is not con-
sidered to be due primarily to increased precautionary saving, as in more normal re-
cessions, but to households not having had the possibility to consume certain ser-
vices. Neither have households fully compensated for this by consuming goods, for ex-
ample. This also means that the recovery after the pandemic is expected to differ
from a recovery from normal recessions.46 Even if many people, following the authori-
ties’ advice and restrictions, have refrained from using hotels, restaurants, hairdress-
ers, taxis and cultural services, there is an underlying demand for such services.47 As
these services as a rule imply physical contact, production of them can be automated
or moved abroad to a lower degree than other production. It is therefore likely that
production will recover rapidly when the pandemic subsides and households return to
more normal consumption.
So far, inflation has not been affected as much by the pandemic as production and
employment have.48 In the main scenario, inflation is expected to be volatile this year
due to energy prices and technological factors, but then rise towards 2 per cent as de-
mand strengthens, wages increase more quickly and inflation abroad rises.
Alternative scenario – more rapid recovery
But forecasts are uncertain, especially in these times of constantly updated infor-
mation on, for example, the spread of infection and vaccinations.49 Not much is re-
46 In normal recessions, households tend to postpone larger purchases when the economic outlook is un-certain. Recovery is then largely driven by a pent-up demand for these goods. 47 See R. Chetty, J. Friedman, N. Hendren and M. Stepner, “How did Covid-19 and stabilization policies affect spending and employment? A new real-time economic tracker based on private sector data”, NBER working paper no. 27431, 2020. 48 For more information on the impact and expected impact of changed consumption patterns during the pandemic, see J. Johansson, M. Löf and O. Tysklind, “Changed consumption during the pandemic affects inflation”, Sveriges Riksbank, Economic Commentaries, No. 14, 2020. 49 Approximately the same development in the spread of infection, immunity and restrictions is assumed in this scenario as in the main scenario.
ARTICLE – Alternative scenarios for the recovery
80
quired to increase consumer and business confidence. This could lead to saving de-
creasing more rapidly and more than in the forecast and thereby to higher consump-
tion and investment. In the scenario with more rapid recovery, consumption aimed at
those service sectors hardest hit by the pandemic is expected to increase very sub-
stantially. This may also have spillover effects on other sectors. Similarly, demand
abroad is also expected to increase and thereby drive up demand for Swedish ex-
ports.50 Overall, this means that Swedish GDP will rise significantly more rapidly than
in the main scenario (see Figure 59).51 The calculations presented in this article are
based on the same assumptions of continued expansionary Swedish fiscal and mone-
tary policy as in the main scenario.
It is also within the hardest-hit sectors that many have lost their jobs. For example,
employment in the hotel and restaurant sector has fallen by more than 40,000 people
between the fourth quarter of 2019 and the fourth quarter of 2020. Jobs in these sec-
tors often require relatively short training and a large share of employees have tem-
porary employment in services with a high staff turnover.52 This means that jobs can
quickly be recreated when demand rises again and unemployment will therefore fall
more rapidly than in the main scenario (see Figure 60).53,54 In this scenario, employ-
ment in the hotel and restaurant sector is expected to be back at approximately the
same level as before the pandemic during the fourth quarter of this year. In the main
scenario, the recovery is expected to take longer.
The highest price increases are expected in those sectors hardest hit by the pan-
demic.55 In the main scenario, no extensive supply limitations are assumed due to a
staff shortage or problems with goods deliveries. But in a scenario with faster recov-
ery, competition may arise when many companies need to hire staff at the same time,
something that could drive up wages and prices in these sectors and also spill over to
50 The scenarios in “ECB staff macroeconomic projections for the euro area”, ECB, March 2021 have been used in this article for other countries. 51 The effects in this article are partly based on results from the Riksbank’s general equilibrium model, MAJA; see V. Corbo and I. Strid, “MAJA: A two-region DSGE model for Sweden and its main trading part-ners", Working Paper Series 391, Sveriges Riksbank, 2020. 52 See “Development for temporary employees 2005-2019”, in Statistical news from Statistics Sweden, March 2020 and I. Häkkinen Skans and M. Mossfeldt, “Kort- och långsiktiga effekter av sänkt restaurang-moms” [Short and long-term effects of reduced VAT on restaurants], in Swedish only, Occasional Studies, no. 46, National Institute of Economic Research, 2015. 53 Employees in the hotel, restaurant and transport sectors are on average younger, more often foreign-born and have a lower level of education than employees in other sectors, see the article “Arbetslöshet i covid-19-pandemin” [Unemployment in the COVID-19 pandemic] in the Swedish version of the Swedish Economic Report December 2020, National Institute of Economic Research. 54 For more information on the effects of the pandemic on the labour market, see I. Häkkinen Skans “The corona crisis and the labour market - effects in the short and long term”, Sveriges Riksbank, Economic Com-mentaries no. 1, 2021. 55 This is supported by, for example, the Riksbank’s Business Survey. If demand rises rapidly at pace with the roll-out of vaccines, restaurants will see greater opportunities to raise their prices. In the same survey, how-ever, hotel and travel companies are more hesitant about the opportunity to raise prices. For example, one business leader says that “It isn’t the prices that stop people travelling”. See the Riksbank’s Business Survey ““Vaccine optimism” raises expectations”, Sveriges Riksbank, February 2021.
ARTICLE – Alternative scenarios for the recovery
81
other sectors. The staff shortage might also force companies to hire less experienced
workers with lower productivity, something that companies might need to compen-
sate for by increasing prices. The pent-up need for, for example, eating out means
that many consumers will also accept higher prices. In this scenario, inflation is also
higher abroad, something which, via higher import prices, also spills over to consumer
prices in Sweden. As global trade and industrial output is also expected to be higher in
this scenario, there is a risk of delivery problems, for example caused by a shortage of
semi-conductors or containers as a result of the strong demand.56 Something like this
could subdue output slightly but also drive up inflation in Sweden. In this scenario, it
takes a shorter time for CPIF inflation to reach 2 per cent more permanently than in
the main scenario (see Figure 61).
Alternative scenario – slower recovery
Even if some companies are optimistic now that vaccinations are underway, the pan-
demic is still creating great uncertainty.57 Delays in vaccine distribution, mutated vari-
ants of the virus and increased spread of infection, all of which imply continued strict
restrictions and risks for supply disruptions, are factors causing companies concern.
In the scenario “Slower recovery”, it is assumed that the spread of infection does not
slow as quickly as is expected in the main scenario and that it takes longer to build up
immunity to COVID-19. This can be the result if vaccinations are delayed or virus mu-
tations arise against which the vaccines are not as effective. This will in turn lead to
restrictions remaining in place and will delay the recovery in demand, especially in
sectors where people are in close contact with each other, something that will further
damage consumer and business confidence. In such a scenario, it is also possible to
imagine the currently high level of confidence in the manufacturing industry starting
to fall.
It therefore takes longer for consumption and investment to increase. In the same
way, consumption and investment abroad, and as a result demand for Swedish ex-
ports, also fall.58 This means that Swedish GDP rises more slowly than in the main sce-
nario (see Figure 59).
The lower demand also means that the recovery on the labour market, primarily in
hard-hit service sectors, will be delayed with higher long-term unemployment as well
56 See the article “Brist på halvledare hämmar produktionen första halvåret i år” [Shortage of semi-conduc-tors putting a damper on output in the first half of this year] in the Swedish version of Swedish Economy Report March 2021, National Institute of Economic Research. 57 See the Riksbank’s Business Survey ““Vaccine optimism” raises expectations”, Sveriges Riksbank, February 2021. 58 Less favourable development in the spread of infection and vaccinations is also assumed in the more pes-simistic scenario in “ECB staff macroeconomic projections for the euro area”, ECB, March 2021.
ARTICLE – Alternative scenarios for the recovery
82
as more bankruptcies as a result.59 In addition, the risk of long-term effects on confi-
dence increases as pandemics change our assessment of the probability of new seri-
ous events of this kind occurring. This can lead to households increasing their precau-
tionary saving, to permanently lower corporate investment and employment and to
higher unemployment (see Figure 60).60
In the scenario with slower recovery, more companies in the hardest-hit sectors are
expected to be able to re-hire their staff in order to meet the more slowly rising de-
mand. Competition for staff will thereby be less severe with lower wage pressures
and lower inflation as a result, something which also risks spreading to other sectors.
Imported inflation from abroad is also expected to be lower. In this scenario, CPIF in-
flation is significantly lower than in the main scenario and does not even reach 2 per
cent by the end of the forecast period (see Figure 61).
Economic policy may need adjustment
If economic developments do not turn out as expected in the main scenario, fiscal
policy and monetary policy may need to be adjusted. However, the fact that inflation
approaches 2 per cent more rapidly in the scenario with faster recovery need not be a
reason for making monetary policy less expansionary in different ways. On the other
hand, both fiscal policy and monetary policy would need to be made more expansion-
ary in the scenario with slower recovery. The calculations in this article have not taken
the effects of this into consideration, however.61
59 The number of persons who have been without work for more than 12 months has increased by 30,000 since December 2019 and in March 2021 amounts to 182,000 people. About two-thirds of the increase is made up of persons with only compulsory school education, persons with functional impairments that re-duce their capacity to work, unemployed people over the age of 55 and people born outside Europe. For more information, see ”Långtidsarbetslöshetens utveckling i spåren av pandemin” [Development of long-term unemployment in the wake of the pandemic], in Swedish only, Swedish Public Employment Service, April 2021. 60 This phenomenon is sometimes referred to in academic literature as “belief scarring”, see the discussion in the article “The long-term economic effects of the pandemic are uncertain”, Sveriges Riksbank, Monetary Policy Report, November 2020 and J. Kozlowski, L. Veldkamp and V. Venkateswaran, “Scarring Body and Mind: The Long-Term Belief-Scarring Effects of COVID-19”, National Bureau of Economic Research (NBER), Working Paper 27439, 2020. 61 However, monetary policy is not well suited to providing targeted support to different parts of the econ-omy. Fiscal policy has an important role to play in this.
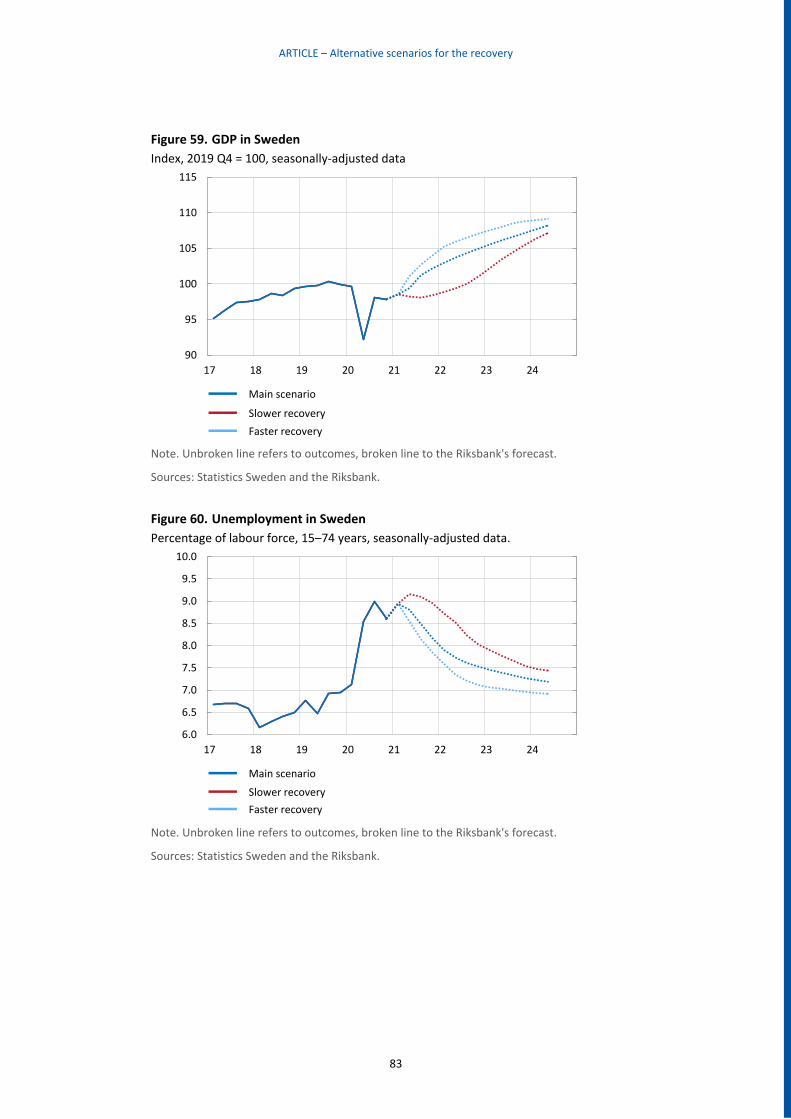
ARTICLE – Alternative scenarios for the recovery
83
Figure 59. GDP in Sweden
Index, 2019 Q4 = 100, seasonally-adjusted data
Note. Unbroken line refers to outcomes, broken line to the Riksbank's forecast.
Sources: Statistics Sweden and the Riksbank.
Figure 60. Unemployment in Sweden
Percentage of labour force, 15–74 years, seasonally-adjusted data.
Note. Unbroken line refers to outcomes, broken line to the Riksbank's forecast.
Sources: Statistics Sweden and the Riksbank.
90
95
100
105
110
115
17 18 19 20 21 22 23 24
Main scenario
Slower recovery
Faster recovery
6.0
6.5
7.0
7.5
8.0
8.5
9.0
9.5
10.0
17 18 19 20 21 22 23 24
Main scenario
Slower recovery
Faster recovery
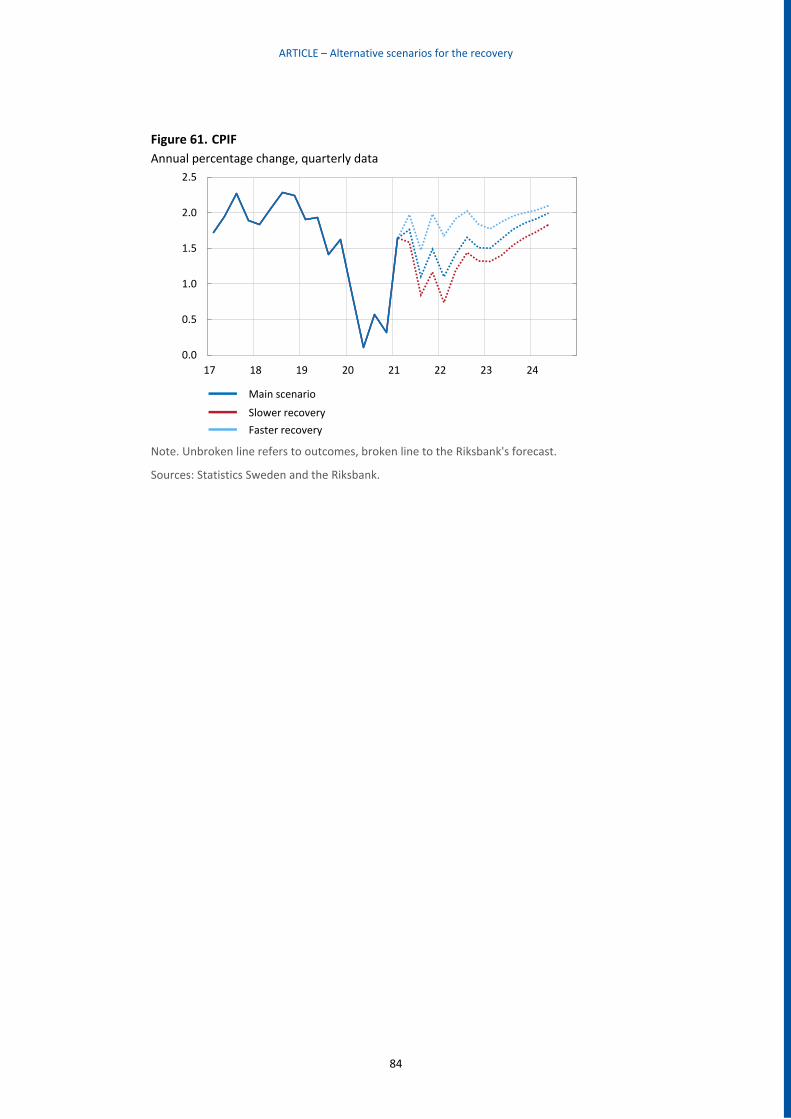
ARTICLE – Alternative scenarios for the recovery
84
Figure 61. CPIF
Annual percentage change, quarterly data
Note. Unbroken line refers to outcomes, broken line to the Riksbank's forecast.
Sources: Statistics Sweden and the Riksbank.
0.0
0.5
1.0
1.5
2.0
2.5
17 18 19 20 21 22 23 24
Main scenario
Slower recovery
Faster recovery
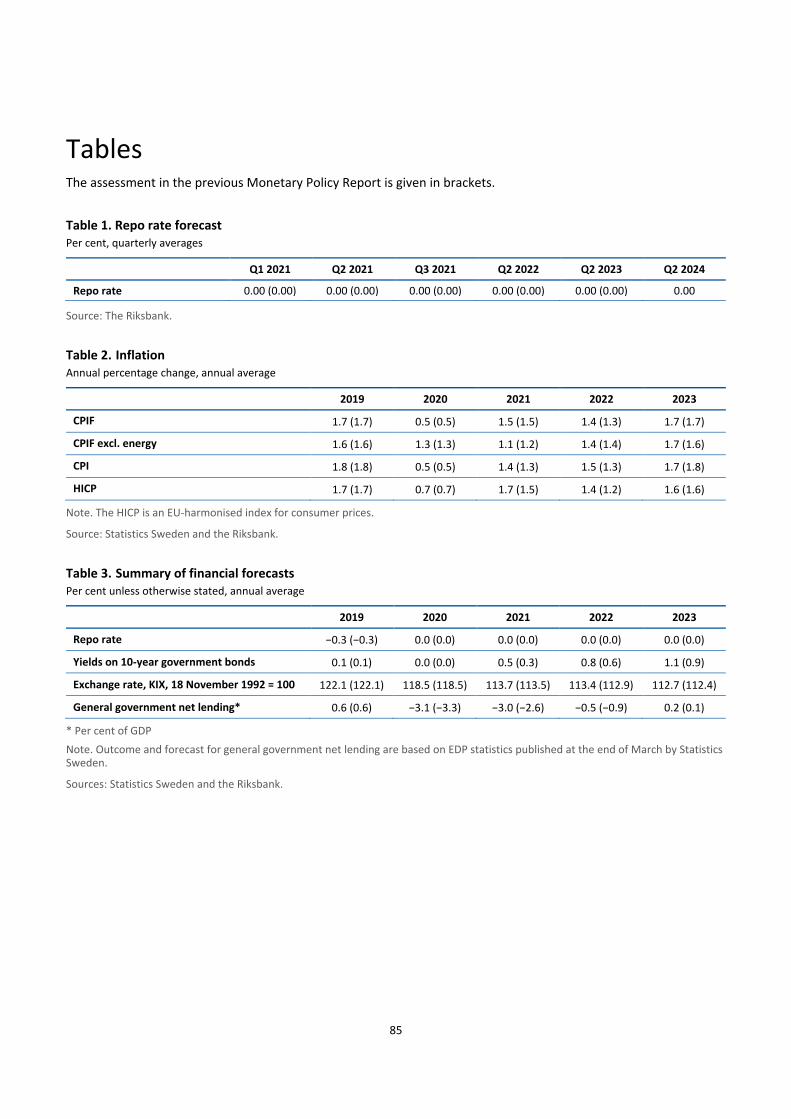
85
Tables The assessment in the previous Monetary Policy Report is given in brackets.
Table 1. Repo rate forecast Per cent, quarterly averages
Q1 2021 Q2 2021 Q3 2021 Q2 2022 Q2 2023 Q2 2024
Repo rate 0.00 (0.00) 0.00 (0.00) 0.00 (0.00) 0.00 (0.00) 0.00 (0.00) 0.00
Source: The Riksbank.
Table 2. Inflation Annual percentage change, annual average
2019 2020 2021 2022 2023
CPIF 1.7 (1.7) 0.5 (0.5) 1.5 (1.5) 1.4 (1.3) 1.7 (1.7)
CPIF excl. energy 1.6 (1.6) 1.3 (1.3) 1.1 (1.2) 1.4 (1.4) 1.7 (1.6)
CPI 1.8 (1.8) 0.5 (0.5) 1.4 (1.3) 1.5 (1.3) 1.7 (1.8)
HICP 1.7 (1.7) 0.7 (0.7) 1.7 (1.5) 1.4 (1.2) 1.6 (1.6)
Note. The HICP is an EU-harmonised index for consumer prices.
Source: Statistics Sweden and the Riksbank.
Table 3. Summary of financial forecasts Per cent unless otherwise stated, annual average
2019 2020 2021 2022 2023
Repo rate −0.3 (−0.3) 0.0 (0.0) 0.0 (0.0) 0.0 (0.0) 0.0 (0.0)
Yields on 10-year government bonds 0.1 (0.1) 0.0 (0.0) 0.5 (0.3) 0.8 (0.6) 1.1 (0.9)
Exchange rate, KIX, 18 November 1992 = 100 122.1 (122.1) 118.5 (118.5) 113.7 (113.5) 113.4 (112.9) 112.7 (112.4)
General government net lending* 0.6 (0.6) −3.1 (−3.3) −3.0 (−2.6) −0.5 (−0.9) 0.2 (0.1)
* Per cent of GDP
Note. Outcome and forecast for general government net lending are based on EDP statistics published at the end of March by Statistics Sweden.
Sources: Statistics Sweden and the Riksbank.
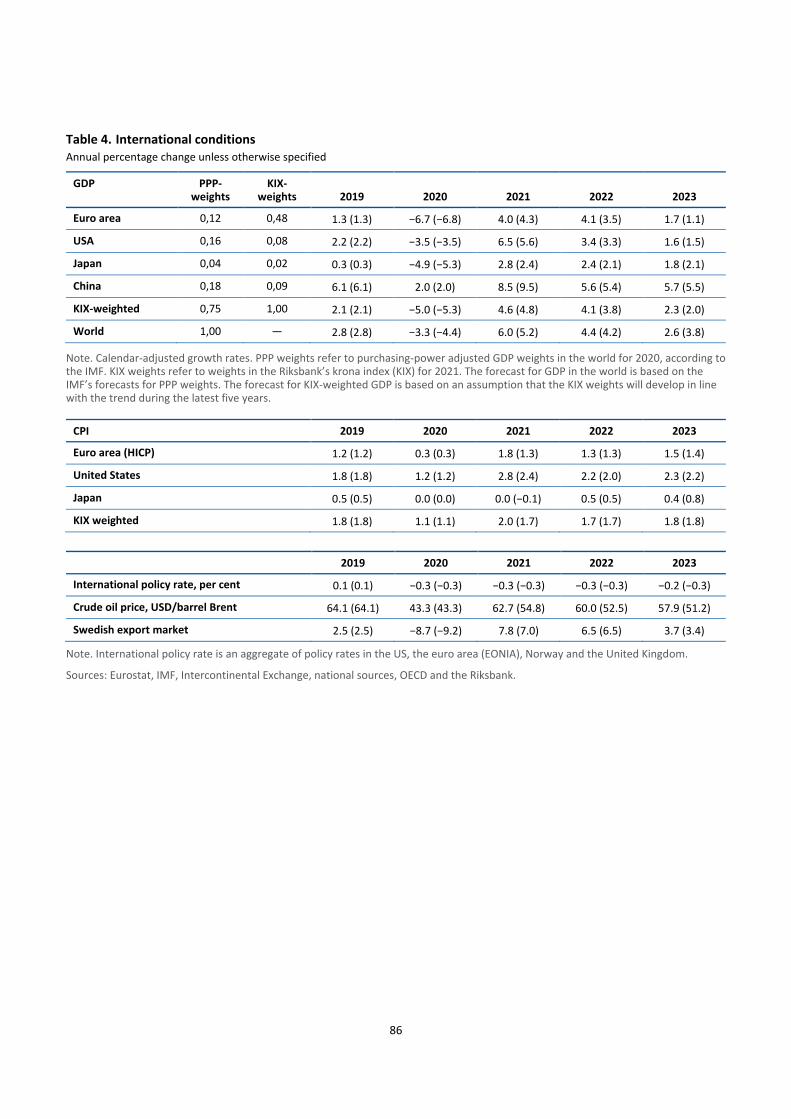
86
Table 4. International conditions Annual percentage change unless otherwise specified
GDP PPP-weights
KIX-weights 2019 2020 2021 2022 2023
Euro area 0,12 0,48 1.3 (1.3) −6.7 (−6.8) 4.0 (4.3) 4.1 (3.5) 1.7 (1.1)
USA 0,16 0,08 2.2 (2.2) −3.5 (−3.5) 6.5 (5.6) 3.4 (3.3) 1.6 (1.5)
Japan 0,04 0,02 0.3 (0.3) −4.9 (−5.3) 2.8 (2.4) 2.4 (2.1) 1.8 (2.1)
China 0,18 0,09 6.1 (6.1) 2.0 (2.0) 8.5 (9.5) 5.6 (5.4) 5.7 (5.5)
KIX-weighted 0,75 1,00 2.1 (2.1) −5.0 (−5.3) 4.6 (4.8) 4.1 (3.8) 2.3 (2.0)
World (PPP−weighted)
1,00 — 2.8 (2.8) −3.3 (−4.4) 6.0 (5.2) 4.4 (4.2) 2.6 (3.8)
Note. Calendar-adjusted growth rates. PPP weights refer to purchasing-power adjusted GDP weights in the world for 2020, according to the IMF. KIX weights refer to weights in the Riksbank’s krona index (KIX) for 2021. The forecast for GDP in the world is based on the IMF’s forecasts for PPP weights. The forecast for KIX-weighted GDP is based on an assumption that the KIX weights will develop in line with the trend during the latest five years.
CPI 2019 2020 2021 2022 2023
Euro area (HICP) 1.2 (1.2) 0.3 (0.3) 1.8 (1.3) 1.3 (1.3) 1.5 (1.4)
United States 1.8 (1.8) 1.2 (1.2) 2.8 (2.4) 2.2 (2.0) 2.3 (2.2)
Japan 0.5 (0.5) 0.0 (0.0) 0.0 (−0.1) 0.5 (0.5) 0.4 (0.8)
KIX weighted 1.8 (1.8) 1.1 (1.1) 2.0 (1.7) 1.7 (1.7) 1.8 (1.8)
2019 2020 2021 2022 2023
International policy rate, per cent 0.1 (0.1) −0.3 (−0.3) −0.3 (−0.3) −0.3 (−0.3) −0.2 (−0.3)
Crude oil price, USD/barrel Brent 64.1 (64.1) 43.3 (43.3) 62.7 (54.8) 60.0 (52.5) 57.9 (51.2)
Swedish export market 2.5 (2.5) −8.7 (−9.2) 7.8 (7.0) 6.5 (6.5) 3.7 (3.4)
Note. International policy rate is an aggregate of policy rates in the US, the euro area (EONIA), Norway and the United Kingdom.
Sources: Eurostat, IMF, Intercontinental Exchange, national sources, OECD and the Riksbank.
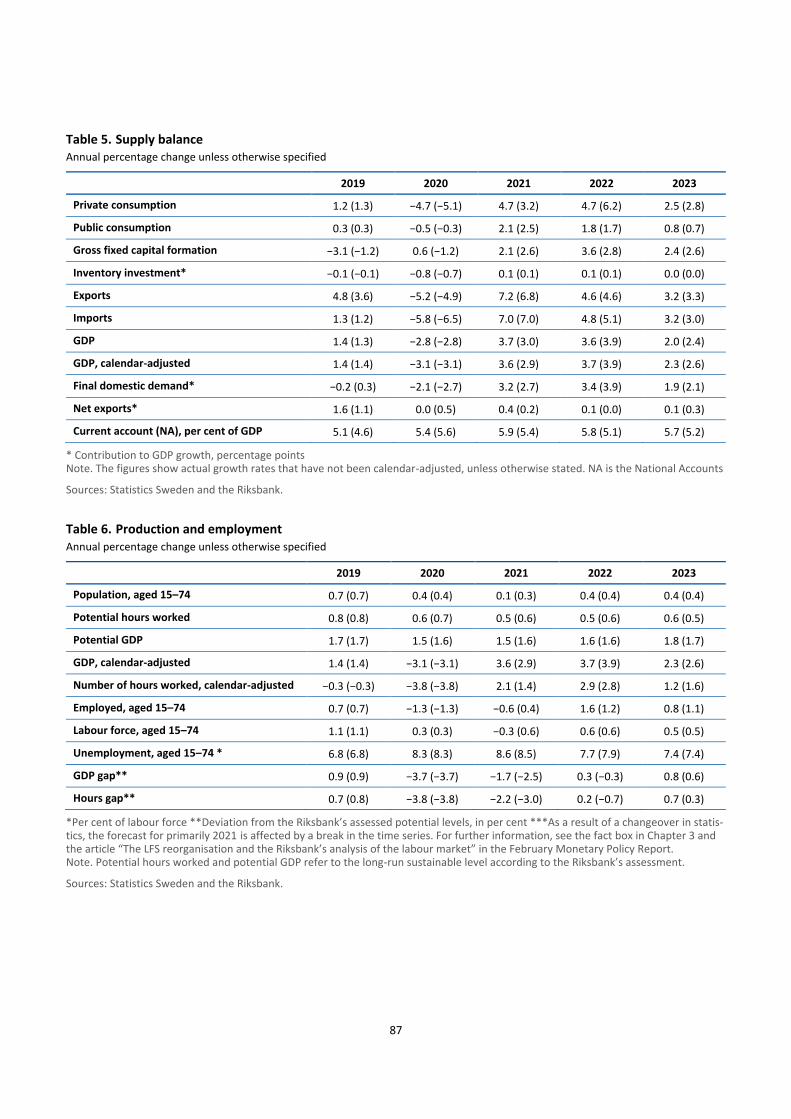
87
Table 5. Supply balance Annual percentage change unless otherwise specified
2019 2020 2021 2022 2023
Private consumption 1.2 (1.3) −4.7 (−5.1) 4.7 (3.2) 4.7 (6.2) 2.5 (2.8)
Public consumption 0.3 (0.3) −0.5 (−0.3) 2.1 (2.5) 1.8 (1.7) 0.8 (0.7)
Gross fixed capital formation −3.1 (−1.2) 0.6 (−1.2) 2.1 (2.6) 3.6 (2.8) 2.4 (2.6)
Inventory investment* −0.1 (−0.1) −0.8 (−0.7) 0.1 (0.1) 0.1 (0.1) 0.0 (0.0)
Exports 4.8 (3.6) −5.2 (−4.9) 7.2 (6.8) 4.6 (4.6) 3.2 (3.3)
Imports 1.3 (1.2) −5.8 (−6.5) 7.0 (7.0) 4.8 (5.1) 3.2 (3.0)
GDP 1.4 (1.3) −2.8 (−2.8) 3.7 (3.0) 3.6 (3.9) 2.0 (2.4)
GDP, calendar-adjusted 1.4 (1.4) −3.1 (−3.1) 3.6 (2.9) 3.7 (3.9) 2.3 (2.6)
Final domestic demand* −0.2 (0.3) −2.1 (−2.7) 3.2 (2.7) 3.4 (3.9) 1.9 (2.1)
Net exports* 1.6 (1.1) 0.0 (0.5) 0.4 (0.2) 0.1 (0.0) 0.1 (0.3)
Current account (NA), per cent of GDP 5.1 (4.6) 5.4 (5.6) 5.9 (5.4) 5.8 (5.1) 5.7 (5.2)
* Contribution to GDP growth, percentage points Note. The figures show actual growth rates that have not been calendar-adjusted, unless otherwise stated. NA is the National Accounts
Sources: Statistics Sweden and the Riksbank.
Table 6. Production and employment Annual percentage change unless otherwise specified
2019 2020 2021 2022 2023
Population, aged 15–74 0.7 (0.7) 0.4 (0.4) 0.1 (0.3) 0.4 (0.4) 0.4 (0.4)
Potential hours worked 0.8 (0.8) 0.6 (0.7) 0.5 (0.6) 0.5 (0.6) 0.6 (0.5)
Potential GDP 1.7 (1.7) 1.5 (1.6) 1.5 (1.6) 1.6 (1.6) 1.8 (1.7)
GDP, calendar-adjusted 1.4 (1.4) −3.1 (−3.1) 3.6 (2.9) 3.7 (3.9) 2.3 (2.6)
Number of hours worked, calendar-adjusted −0.3 (−0.3) −3.8 (−3.8) 2.1 (1.4) 2.9 (2.8) 1.2 (1.6)
Employed, aged 15–74 0.7 (0.7) −1.3 (−1.3) −0.6 (0.4) 1.6 (1.2) 0.8 (1.1)
Labour force, aged 15–74 1.1 (1.1) 0.3 (0.3) −0.3 (0.6) 0.6 (0.6) 0.5 (0.5)
Unemployment, aged 15–74 * 6.8 (6.8) 8.3 (8.3) 8.6 (8.5) 7.7 (7.9) 7.4 (7.4)
GDP gap** 0.9 (0.9) −3.7 (−3.7) −1.7 (−2.5) 0.3 (−0.3) 0.8 (0.6)
Hours gap** 0.7 (0.8) −3.8 (−3.8) −2.2 (−3.0) 0.2 (−0.7) 0.7 (0.3)
*Per cent of labour force **Deviation from the Riksbank’s assessed potential levels, in per cent ***As a result of a changeover in statis-tics, the forecast for primarily 2021 is affected by a break in the time series. For further information, see the fact box in Chapter 3 and the article “The LFS reorganisation and the Riksbank’s analysis of the labour market” in the February Monetary Policy Report. Note. Potential hours worked and potential GDP refer to the long-run sustainable level according to the Riksbank’s assessment.
Sources: Statistics Sweden and the Riksbank.
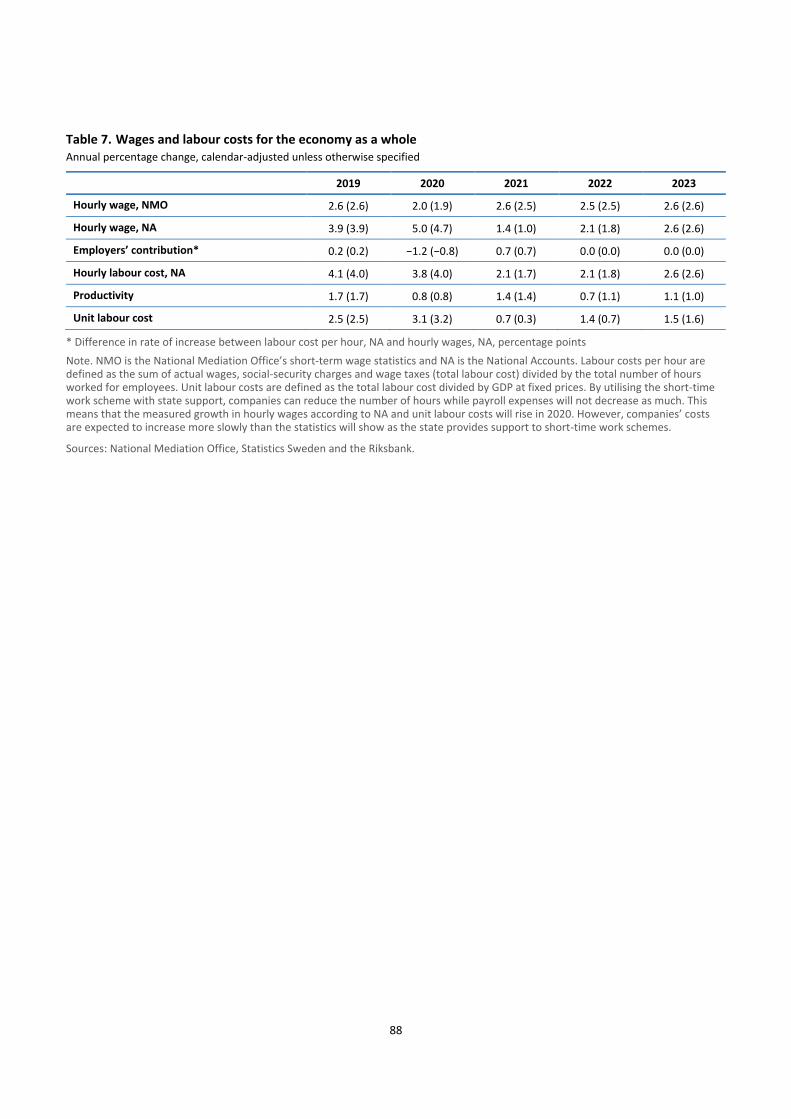
88
Table 7. Wages and labour costs for the economy as a whole Annual percentage change, calendar-adjusted unless otherwise specified
2019 2020 2021 2022 2023
Hourly wage, NMO 2.6 (2.6) 2.0 (1.9) 2.6 (2.5) 2.5 (2.5) 2.6 (2.6)
Hourly wage, NA 3.9 (3.9) 5.0 (4.7) 1.4 (1.0) 2.1 (1.8) 2.6 (2.6)
Employers’ contribution* 0.2 (0.2) −1.2 (−0.8) 0.7 (0.7) 0.0 (0.0) 0.0 (0.0)
Hourly labour cost, NA 4.1 (4.0) 3.8 (4.0) 2.1 (1.7) 2.1 (1.8) 2.6 (2.6)
Productivity 1.7 (1.7) 0.8 (0.8) 1.4 (1.4) 0.7 (1.1) 1.1 (1.0)
Unit labour cost 2.5 (2.5) 3.1 (3.2) 0.7 (0.3) 1.4 (0.7) 1.5 (1.6)
* Difference in rate of increase between labour cost per hour, NA and hourly wages, NA, percentage points
Note. NMO is the National Mediation Office’s short-term wage statistics and NA is the National Accounts. Labour costs per hour are defined as the sum of actual wages, social-security charges and wage taxes (total labour cost) divided by the total number of hours worked for employees. Unit labour costs are defined as the total labour cost divided by GDP at fixed prices. By utilising the short-time work scheme with state support, companies can reduce the number of hours while payroll expenses will not decrease as much. This means that the measured growth in hourly wages according to NA and unit labour costs will rise in 2020. However, companies’ costs are expected to increase more slowly than the statistics will show as the state provides support to short-time work schemes.
Sources: National Mediation Office, Statistics Sweden and the Riksbank.


SVERIGES RIKSBANK 103 37 Stockholm (Brunkebergstorg 11)
Tel 08 ‐ 787 00 00 Fax 08 ‐ 21 05 31 [email protected] www.riksbank.se
PRODUKTION SVERIGES RIKSBANK. ISSN 2000‐2076 (online)