Monetary Policy Report 1 12 - Norges Bank text is set in 10½ pt Times New Roman ... conduct of...
52
Monetary Policy Report Reports from the Central Bank of Norway No. 1/2012 March 1 12
Transcript of Monetary Policy Report 1 12 - Norges Bank text is set in 10½ pt Times New Roman ... conduct of...
Monetary Policy Report
Reports from the Central Bank of Norway No. 1/2012
March1 12

Monetary Policy Report1/2012
Norges Bank
Oslo 2012
Address: Bankplassen 2
Postal address: Postboks 1179 Sentrum, 0107 Oslo
Phone: +47 22 31 60 00
Fax: +47 22 41 31 05
E-mail: [email protected]
Website: http://www.norges-bank.no
Editor: Øystein Olsen
Cover and design: Burson-Marsteller
Printing: 07 Gruppen AS
The text is set in 10½ pt Times New Roman / 9½ pt Univers
ISSN 1504-8470 (print)
ISSN 1504-8497 (online)
Monetary Policy ReportThe Report is published three times a year, in March, June and October/November. The Report assesses the interest rate outlook and includes projections for developments in the Norwegian economy and analyses of selected themes.
At its meeting on 14 December 2011, the Executive Board discussed relevant themes for the Report. At the Executive Board meeting on 29 February 2012 the economic outlook and the monetary policy stance were discussed. On the basis of this discussion and a recommendation from Norges Bank’s management, the Executive Board adopted a monetary policy strategy for the period to the publication of the next Report on 20 June 2012 at the meeting held on 14 March. The Executive Board’s summary of the economic outlook and the monetary policy strategy are presented in “The Executive Board’s assessment”. The next monetary policy meeting of the Executive Board will be held on 10 May.
Table of contents
The Executive Board’s assessment 7
1. Outlook for monetary policy 9
The economic situation 9
The outlook ahead 11
The interest rate forecast 17
Cross-checks of the interest rate forecast 18
Uncertainty surrounding the projections 19
Boxes:
- Response pattern of monetary policy and criteria for an appropriate interest rate path 15
- Changes in the projections since Monetary Policy Report 3/11 20
2. The projections 23
The global economy 23
The Norwegian economy in the year ahead 27
Assumptions concerning fiscal policy and petroleum investment from 2012 to 2015 33
Box
Evaluation of the projections for 2011 36
Annex 39
Boxes 2006 – 2012 41
Publications 2009 – 2012 on Norges Bank's website 42
Regional network: enterprises and organisations interviewed 44
Monetary policy meetings 49
Tables and detailed projections 50
This Monetary Policy Report is based on information in the period to 9 March 2012.
The monetary policy strategy was approved by the Executive Board on 14 March 2012.
6
Monetary policy in Norway
ObjectiveThe operational target of monetary policy is low and stable inflation, with annual consumer price inflation of approximately 2.5% over time.
ImplementationNorges Bank operates a flexible inflation targeting regime, so that weight is given to both variability in inflation and variability in output and employment. In general, the direct effects on consumer prices resulting from changes in interest rates, taxes, excise duties and extraordinary temporary disturbances are not taken into account.
Monetary policy influences the economy with a lag. Norges Bank sets the interest rate with a view to stabilising inflation close to the target in the medium term. The horizon will depend on disturbances to which the economy is exposed and the effects on prospects for the path for inflation and the real economy.
The decision-making processThe monetary policy stance is presented to the Executive Board for discussion at a meeting about two weeks before the Monetary Policy Report is published. Themes of relevance to the Report have been discussed at a previous meeting. On the basis of the analysis and discussion, the Executive Board assesses the consequences for future interest rate developments, including alternative strategies. The final decision to adopt a monetary policy strategy is made on the same day as the Report is published. The strategy applies for the period up to the next Report and is presented at the beginning of the Report.
The key policy rate is set by Norges Bank’s Executive Board. Decisions concerning the interest rate are normally taken at the Executive Board’s monetary policy meeting held six times a year. The analyses and the monetary policy strategy, together with assessments of price and cost developments and conditions in the money and foreign exchange markets, form a basis for interest rate decisions.
Communication of the interest rate decisionThe monetary policy decision is published in a press release and announced at a press conference at 2 pm on the day of the meeting.
“The Executive Board’s assessment” is published in the Monetary Policy Report. The assessment contains the main points of the Report and a summary of the main points to which the Executive Board gives weight in its discussion of monetary policy. The assessment concludes with the Executive Board’s strategy for the period to the publication of the next Report and the key policy rate decision.
The press release, the Monetary Policy Report, the Executive Board’s monetary policy decision – background and general assessment, and the press conference are available on www.norges-bank.no.
ReportingNorges Bank reports on the conduct of monetary policy in the Monetary Policy Report and the Annual Report. The Bank’s reporting obligation is set out in Section 75c of the Constitution, which stipulates that the Storting shall supervise Norway’s monetary system, and in Section 3 of the Norges Bank Act. The Annual Report is submitted to the Ministry of Finance and communicated to the King in Council and to the Storting in the Govern-ment’s Finansmarknadsmeldinga (Financial Market Report). The governor of Norges Bank provides an assess-ment of monetary policy in an open hearing before the Standing Committee on Finance and Economic Affairs in connection with the Storting deliberations on the Financial Market Report.
NORGES BANK MONETARY POLICY REPORT 1/2012 7
At the time of the publication of the October 2011 Monetary Policy Report, the Executive Board decided that the key policy rate should be in the interval 1¾%–2¾% in the period to 14 March 2012, unless the Norwegian economy was exposed to new major shocks. The analysis in the October Report indicated that the key policy rate would remain unchanged for about a year and then gradually rise to around 4% towards the end of 2014. The Report also presented an alternative where the key policy rate declined to 1.5% in the period to summer 2012. The low interest rate alternative assumed continued turbulence in financial markets, sustained high money market premiums and a deeper and more prolonged downturn abroad than in the baseline scenario.
In its discussion at the meeting on 14 December 2011, Norges Bank’s Executive Board pointed to the intensified turbulence abroad and greater risk of a new recession, especially in Europe. As a result of the debt crisis in the euro area, it was more difficult and more costly for European banks to obtain funding in the market. Norwegian banks were also affected. Developments resulted in prospects for lower output and employment growth and lower inflation in the Norwegian economy. The Executive Board noted that money market premiums had risen and that money market rates were higher than assumed in October. The Executive Board decided to lower the key policy rate by 0.5 percentage point to 1.75% to guard against an economic setback and even lower inflation.
At its meetings on 29 February and 14 March, the Executive Board discussed the monetary policy stance and the outlook for the key policy rate. The Executive Board has placed emphasis on the following developments:
The situation in international financial markets has improved since December 2011. Long-term loans from the European Central Bank (ECB) to banks have boosted liquidity and reduced risk premiums in the European banking system and in the sovereign debt market. Funding
has become more accessible, also for Norwegian banks. Norwegian money market rates have recently fallen back slightly. Nevertheless, there are prospects that money market rates will be well above the key policy rate and that this premium will remain higher than projected in October.
There is still considerable uncertainty surrounding economic developments in Europe, even though actions taken by the ECB have eased market turbulence. It seems likely that euro area output will decline this year and that growth among Norway's trading partners as a whole will be fairly moderate. In addition, central bank key rates among Norway’s main trading partners are expected to remain very low even longer than anticipated in autumn 2011.
In Norway, growth in petroleum investment and the oil sector is sustaining economic activity. In January, the enterprises in Norges Bank’s regional network reported higher growth in production, but also that the weak prospects abroad would weigh on growth ahead. The export industry is being affected by developments in Europe and by a strong krone. Owing to high money and credit market premiums, the decline in the key policy rate in December has not resulted in lower bank lending rates. In January, banks announced some tightening of credit standards for households. A high level of uncertainty is causing households and enterprises to be more cautious in their consumption and investment decisions. Nevertheless, current statistics show a pickup in spending on consumer goods. The low key policy rate is stimulating demand for goods and services, but no more than what is necessary to sustain overall capacity utilisation in the economy as a whole.
Inflation is low. It is likely that underlying inflation will remain around 1¼% and 1½% through 2012. The krone has recently appreciated considerably and is now strong. Wage growth appears to be slackening.
The Executive Board’s assessment
8
The point of departure for the Executive Board's deliberations is that the key policy rate is set with a view to stabilising inflation close to 2.5% over time. When setting interest rates, stabilising inflation is balanced against stabilising output and employment. A separate box in this Report describes how financial stability considerations may influence interest rate setting.
The Executive Board notes that the analyses in this Report call for a considerable downward revision of the interest rate forecast compared with the projections in October 2011.
The Executive Board judges that weak growth prospects abroad and the strong krone are contributing to keeping inflation low and dampening economic growth in Norway, even if activity in some industries in Norway remains buoyant. If the interest rate is set too high, the krone may appreciate further, inflation may continue to fall and growth in output and employment may become too low. This suggests that the key policy rate should be reduced further. On the other hand, there is virtually normal capacity utilisation in the Norwegian economy. Moreover, low interest rates over time may induce households and enterprises to take excessive risks and accumulate excessive debt. Such imbalances may have spillover effects further ahead, with substantial effects on output and employment.
The Executive Board decided at its meeting on 14 March that the key policy rate should be in the interval 1%–2% until the publication of the next Report on 20 June 2012, unless the Norwegian economy is exposed to new major shocks. Should uncertainty abate and growth and inflation pick up, the interest rate may be raised. Conversely, a deterioration of the European debt crisis or other major shocks may result in a reduction in the interest rate. A substantially stronger krone may also result in further interest rate cuts.
At the same meeting, the Executive Board decided to reduce the key policy rate by 0.25 percentage point to 1.5%.
Øystein Olsen14 March 2012
NORGES BANK MONETARY POLICY REPORT 1/2012 9
1 Outlook for monetary policy
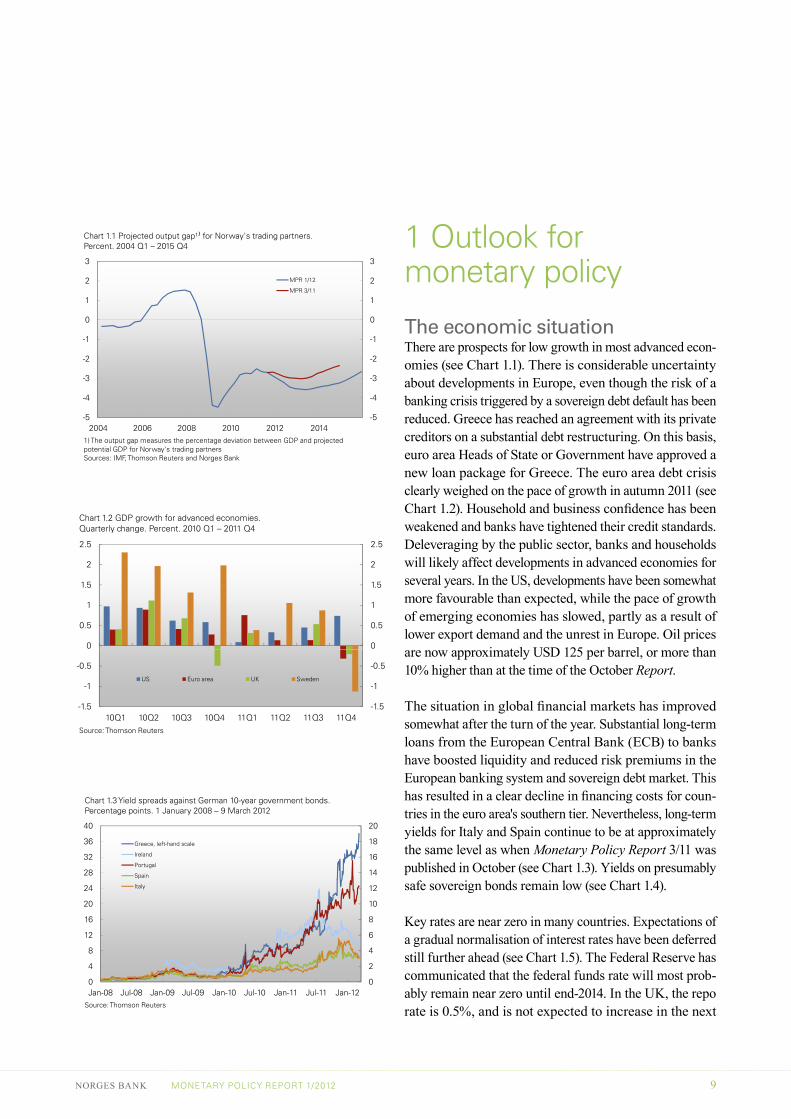
The economic situationThere are prospects for low growth in most advanced econ-omies (see Chart 1.1). There is considerable uncertainty about developments in Europe, even though the risk of a banking crisis triggered by a sovereign debt default has been reduced. Greece has reached an agreement with its private creditors on a substantial debt restructuring. On this basis, euro area Heads of State or Government have approved a new loan package for Greece. The euro area debt crisis clearly weighed on the pace of growth in autumn 2011 (see Chart 1.2). Household and business confidence has been weakened and banks have tightened their credit standards. Deleveraging by the public sector, banks and households will likely affect developments in advanced economies for several years. In the US, developments have been somewhat more favourable than expected, while the pace of growth of emerging economies has slowed, partly as a result of lower export demand and the unrest in Europe. Oil prices are now approximately USD 125 per barrel, or more than 10% higher than at the time of the October Report.
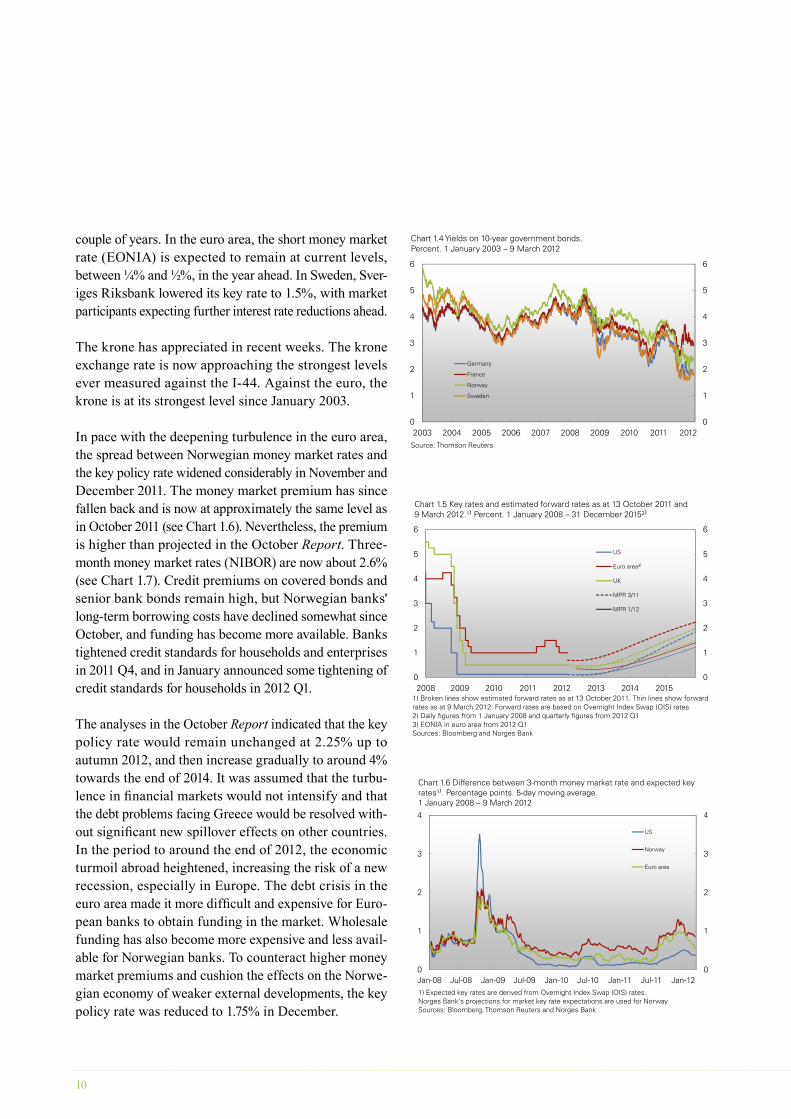
The situation in global financial markets has improved somewhat after the turn of the year. Substantial long-term loans from the European Central Bank (ECB) to banks have boosted liquidity and reduced risk premiums in the European banking system and sovereign debt market. This has resulted in a clear decline in financing costs for coun-tries in the euro area's southern tier. Nevertheless, long-term yields for Italy and Spain continue to be at approximately the same level as when Monetary Policy Report 3/11 was published in October (see Chart 1.3). Yields on presumably safe sovereign bonds remain low (see Chart 1.4).
Key rates are near zero in many countries. Expectations of a gradual normalisation of interest rates have been deferred still further ahead (see Chart 1.5). The Federal Reserve has communicated that the federal funds rate will most prob-ably remain near zero until end-2014. In the UK, the repo rate is 0.5%, and is not expected to increase in the next
-2
-1
0
1
2
3
-2
-1
0
1
2
3
Chart 1.1 Projected output gap¹⁾ for Norway's trading partners.Percent. 2004 Q1 – 2015 Q4
MPR 1/12
MPR 3/11
-5
-4
-3
-5
-4
-3
2004 2006 2008 2010 2012 20141) The output gap measures the percentage deviation between GDP and projected potential GDP for Norway's trading partnersSources: IMF, Thomson Reuters and Norges Bank
0
0.5
1
1.5
2
2.5
0
0.5
1
1.5
2
2.5
Chart 1.2 GDP growth for advanced economies. Quarterly change. Percent. 2010 Q1 – 2011 Q4
-1.5
-1
-0.5
-1.5
-1
-0.5
10Q1 10Q2 10Q3 10Q4 11Q1 11Q2 11Q3 11Q4Source: Thomson Reuters
US Euro area UK Sweden
8
10
12
14
16
18
20
16
20
24
28
32
36
40
Chart 1.3 Yield spreads against German 10-year government bonds. Percentage points. 1 January 2008 – 9 March 2012
Greece, left-hand scale
Ireland
Portugal
Spain
Italy
0
2
4
6
0
4
8
12
Jan-08 Jul-08 Jan-09 Jul-09 Jan-10 Jul-10 Jan-11 Jul-11 Jan-12Source: Thomson Reuters
10
couple of years. In the euro area, the short money market rate (EONIA) is expected to remain at current levels, between ¼% and ½%, in the year ahead. In Sweden, Sver-iges Riksbank lowered its key rate to 1.5%, with market participants expecting further interest rate reductions ahead.
The krone has appreciated in recent weeks. The krone exchange rate is now approaching the strongest levels ever measured against the I-44. Against the euro, the krone is at its strongest level since January 2003.
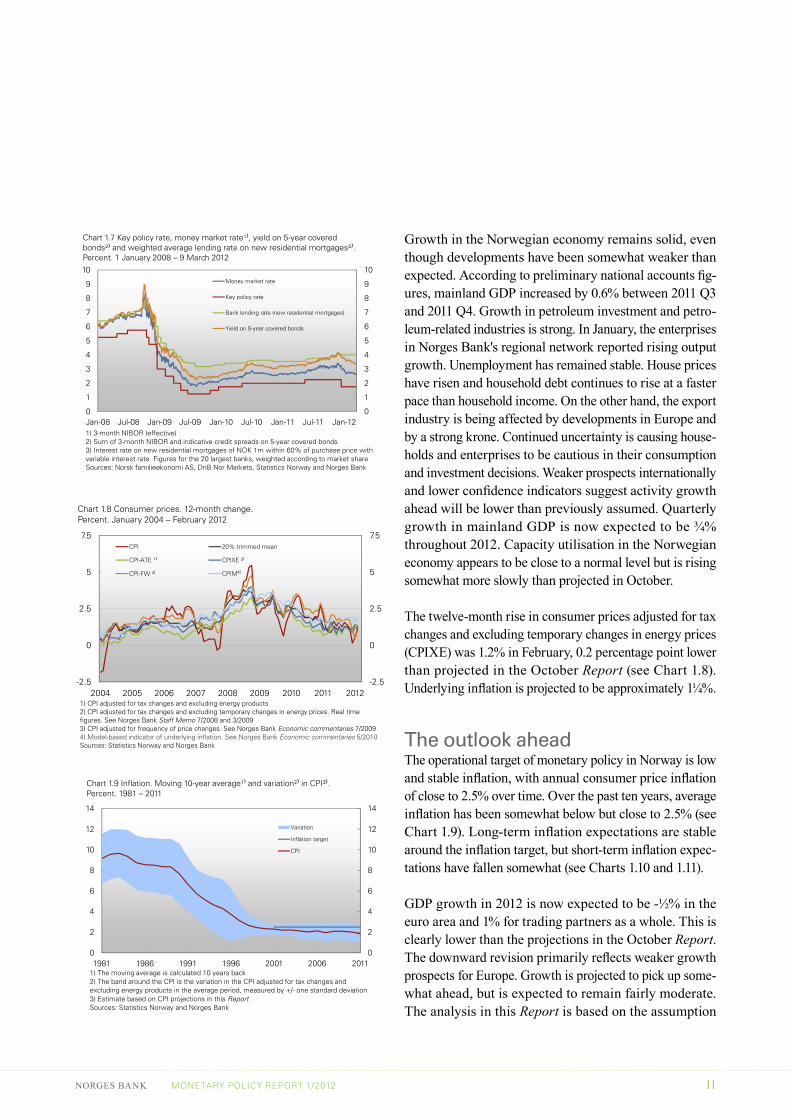
In pace with the deepening turbulence in the euro area, the spread between Norwegian money market rates and the key policy rate widened considerably in November and December 2011. The money market premium has since fallen back and is now at approximately the same level as in October 2011 (see Chart 1.6). Nevertheless, the premium is higher than projected in the October Report. Three-month money market rates (NIBOR) are now about 2.6% (see Chart 1.7). Credit premiums on covered bonds and senior bank bonds remain high, but Norwegian banks' long-term borrowing costs have declined somewhat since October, and funding has become more available. Banks tightened credit standards for households and enterprises in 2011 Q4, and in January announced some tightening of credit standards for households in 2012 Q1.
The analyses in the October Report indicated that the key policy rate would remain unchanged at 2.25% up to autumn 2012, and then increase gradually to around 4% towards the end of 2014. It was assumed that the turbu-lence in financial markets would not intensify and that the debt problems facing Greece would be resolved with-out significant new spillover effects on other countries. In the period to around the end of 2012, the economic turmoil abroad heightened, increasing the risk of a new recession, especially in Europe. The debt crisis in the euro area made it more difficult and expensive for Euro-pean banks to obtain funding in the market. Wholesale funding has also become more expensive and less avail-able for Norwegian banks. To counteract higher money market premiums and cushion the effects on the Norwe-gian economy of weaker external developments, the key policy rate was reduced to 1.75% in December.
2
3
4
5
6
2
3
4
5
6
Chart 1.4 Yields on 10-year government bonds. Percent. 1 January 2003 – 9 March 2012
Germany
0
1
2
0
1
2
2003 2004 2005 2006 2007 2008 2009 2010 2011 2012Source: Thomson Reuters
France
Norway
Sweden
2
3
4
5
6
2
3
4
5
6
Chart 1.5 Key rates and estimated forward rates as at 13 October 2011 and 9 March 2012.¹⁾ Percent. 1 January 2008 – 31 December 2015²⁾
US
Euro area³⁾
UK
MPR 3/11
MPR 1/12
0
1
0
1
2008 2009 2010 2011 2012 2013 2014 20151) Broken lines show estimated forward rates as at 13 October 2011. Thin lines show forward rates as at 9 March 2012. Forward rates are based on Overnight Index Swap (OIS) rates2) Daily figures from 1 January 2008 and quarterly figures from 2012 Q13) EONIA in euro area from 2012 Q1Sources: Bloomberg and Norges Bank
2
3
4
2
3
4
Chart 1.6 Difference between 3-month money market rate and expected key rates¹⁾. Percentage points. 5-day moving average. 1 January 2008 – 9 March 2012
US
Norway
Euro area
0
1
0
1
Jan-08 Jul-08 Jan-09 Jul-09 Jan-10 Jul-10 Jan-11 Jul-11 Jan-121) Expected key rates are derived from Overnight Index Swap (OIS) rates. Norges Bank's projections for market key rate expectations are used for NorwaySources: Bloomberg, Thomson Reuters and Norges Bank
NORGES BANK MONETARY POLICY REPORT 1/2012 11
Growth in the Norwegian economy remains solid, even though developments have been somewhat weaker than expected. According to preliminary national accounts fig-ures, mainland GDP increased by 0.6% between 2011 Q3 and 2011 Q4. Growth in petroleum investment and petro-leum-related industries is strong. In January, the enterprises in Norges Bank's regional network reported rising output growth. Unemployment has remained stable. House prices have risen and household debt continues to rise at a faster pace than household income. On the other hand, the export industry is being affected by developments in Europe and by a strong krone. Continued uncertainty is causing house-holds and enterprises to be cautious in their consumption and investment decisions. Weaker prospects internationally and lower confidence indicators suggest activity growth ahead will be lower than previously assumed. Quarterly growth in mainland GDP is now expected to be ¾% throughout 2012. Capacity utilisation in the Norwegian economy appears to be close to a normal level but is rising somewhat more slowly than projected in October.
The twelve-month rise in consumer prices adjusted for tax changes and excluding temporary changes in energy prices (CPIXE) was 1.2% in February, 0.2 percentage point lower than projected in the October Report (see Chart 1.8). Underlying inflation is projected to be approximately 1¼%.
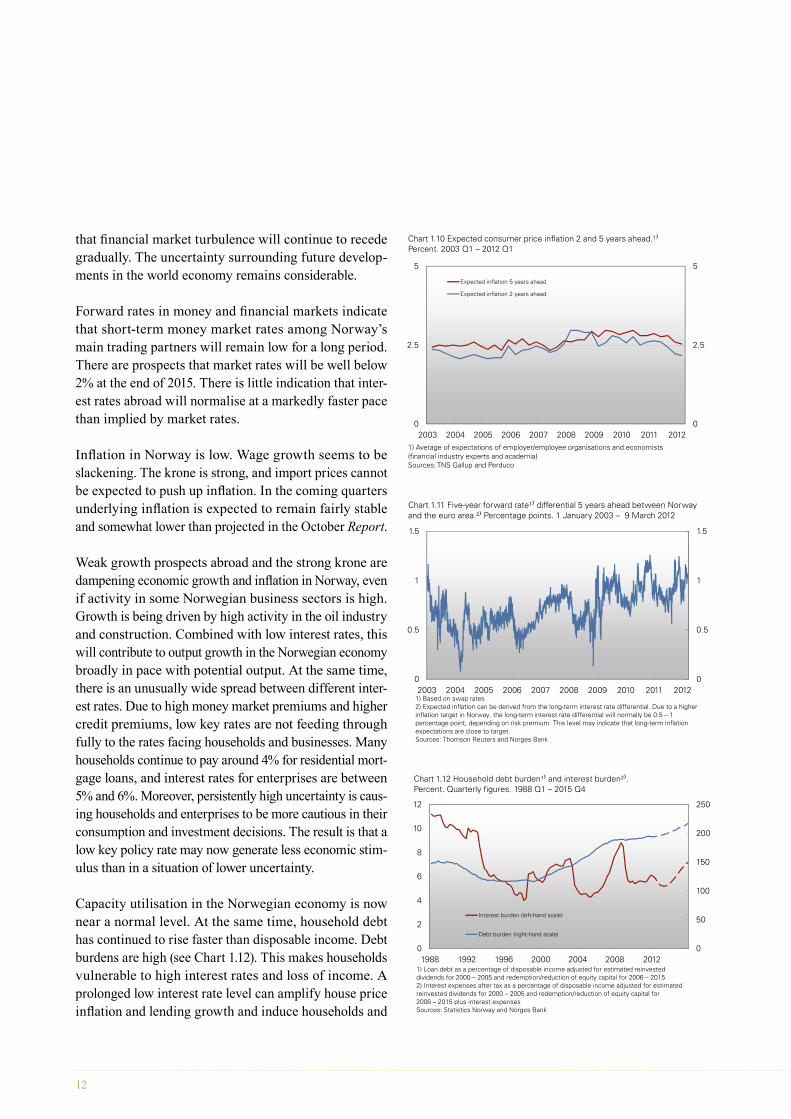
The outlook aheadThe operational target of monetary policy in Norway is low and stable inflation, with annual consumer price inflation of close to 2.5% over time. Over the past ten years, average inflation has been somewhat below but close to 2.5% (see Chart 1.9). Long-term inflation expectations are stable around the inflation target, but short-term inflation expec-tations have fallen somewhat (see Charts 1.10 and 1.11).
GDP growth in 2012 is now expected to be -½% in the euro area and 1% for trading partners as a whole. This is clearly lower than the projections in the October Report. The downward revision primarily reflects weaker growth prospects for Europe. Growth is projected to pick up some-what ahead, but is expected to remain fairly moderate. The analysis in this Report is based on the assumption
0
2.5
5
7.5
0
2.5
5
7.5
Chart 1.8 Consumer prices. 12-month change. Percent. January 2004 – February 2012
CPI 20% trimmed mean
CPI-ATE ¹⁾ CPIXE ²⁾
CPI-FW ³⁾ CPIM⁴⁾
-2.5
0
-2.5
0
2004 2005 2006 2007 2008 2009 2010 2011 20121) CPI adjusted for tax changes and excluding energy products2) CPI adjusted for tax changes and excluding temporary changes in energy prices. Real time figures. See Norges Bank Staff Memo 7/2008 and 3/2009 3) CPI adjusted for frequency of price changes. See Norges Bank Economic commentaries 7/2009 4) Model-based indicator of underlying inflation. See Norges Bank Economic commentaries 5/2010 Sources: Statistics Norway and Norges Bank
3
4
5
6
7
8
9
10
3
4
5
6
7
8
9
10
Chart 1.7 Key policy rate, money market rate¹⁾, yield on 5-year covered bonds²⁾ and weighted average lending rate on new residential mortgages³⁾.Percent. 1 January 2008 – 9 March 2012
Money market rate
Key policy rate
Bank lending rate (new residential mortgages)
Yield on 5-year covered bonds
0
1
2
3
0
1
2
3
Jan-08 Jul-08 Jan-09 Jul-09 Jan-10 Jul-10 Jan-11 Jul-11 Jan-121) 3-month NIBOR (effective)2) Sum of 3-month NIBOR and indicative credit spreads on 5-year covered bonds3) Interest rate on new residential mortgages of NOK 1m within 60% of purchase price with variable interest rate. Figures for the 20 largest banks, weighted according to market shareSources: Norsk familieøkonomi AS, DnB Nor Markets, Statistics Norway and Norges Bank
4
6
8
10
12
14
4
6
8
10
12
14
Chart 1.9 Inflation. Moving 10-year average¹⁾ and variation²⁾ in CPI³⁾. Percent. 1981 – 2011
Variation
Inflation target
CPI
0
2
4
0
2
4
1981 1986 1991 1996 2001 2006 20111) The moving average is calculated 10 years back2) The band around the CPI is the variation in the CPI adjusted for tax changes and excluding energy products in the average period, measured by +/- one standard deviation3) Estimate based on CPI projections in this ReportSources: Statistics Norway and Norges Bank
12
that financial market turbulence will continue to recede gradually. The uncertainty surrounding future develop-ments in the world economy remains considerable.
Forward rates in money and financial markets indicate that short-term money market rates among Norway’s main trading partners will remain low for a long period. There are prospects that market rates will be well below 2% at the end of 2015. There is little indication that inter-est rates abroad will normalise at a markedly faster pace than implied by market rates.
Inflation in Norway is low. Wage growth seems to be slackening. The krone is strong, and import prices cannot be expected to push up inflation. In the coming quarters underlying inflation is expected to remain fairly stable and somewhat lower than projected in the October Report.
Weak growth prospects abroad and the strong krone are dampening economic growth and inflation in Norway, even if activity in some Norwegian business sectors is high. Growth is being driven by high activity in the oil industry and construction. Combined with low interest rates, this will contribute to output growth in the Norwegian economy broadly in pace with potential output. At the same time, there is an unusually wide spread between different inter-est rates. Due to high money market premiums and higher credit premiums, low key rates are not feeding through fully to the rates facing households and businesses. Many households continue to pay around 4% for residential mort-gage loans, and interest rates for enterprises are between 5% and 6%. Moreover, persistently high uncertainty is caus-ing households and enterprises to be more cautious in their consumption and investment decisions. The result is that a low key policy rate may now generate less economic stim-ulus than in a situation of lower uncertainty.
Capacity utilisation in the Norwegian economy is now near a normal level. At the same time, household debt has continued to rise faster than disposable income. Debt burdens are high (see Chart 1.12). This makes households vulnerable to high interest rates and loss of income. A prolonged low interest rate level can amplify house price inflation and lending growth and induce households and
100
150
200
250
4
6
8
10
12
Chart 1.12 Household debt burden¹⁾ and interest burden²⁾. Percent. Quarterly figures. 1988 Q1 – 2015 Q4
0
50
0
2
1988 1992 1996 2000 2004 2008 2012
Interest burden (left-hand scale)
Debt burden (right-hand scale)
1) Loan debt as a percentage of disposable income adjusted for estimated reinvested dividends for 2000 – 2005 and redemption/reduction of equity capital for 2006 – 20152) Interest expenses after tax as a percentage of disposable income adjusted for estimated reinvested dividends for 2000 – 2005 and redemption/reduction of equity capital for 2006 – 2015 plus interest expensesSources: Statistics Norway and Norges Bank
0.5
1
1.5
0.5
1
1.5
Chart 1.11 Five-year forward rate¹⁾ differential 5 years ahead between Norwayand the euro area.²⁾ Percentage points. 1 January 2003 – 9 March 2012
002003 2004 2005 2006 2007 2008 2009 2010 2011 2012
1) Based on swap rates 2) Expected inflation can be derived from the long-term interest rate differential. Due to a higher inflation target in Norway, the long-term interest rate differential will normally be 0.5 – 1 percentage point, depending on risk premium. This level may indicate that long-term inflation expectations are close to target. Sources: Thomson Reuters and Norges Bank
2.5
5
2.5
5
Chart 1.10 Expected consumer price inflation 2 and 5 years ahead.¹⁾Percent. 2003 Q1 – 2012 Q1
Expected inflation 5 years ahead
Expected inflation 2 years ahead
002003 2004 2005 2006 2007 2008 2009 2010 2011 2012
1) Average of expectations of employer/employee organisations and economists(financial industry experts and academia)Sources: TNS Gallup and Perduco
NORGES BANK MONETARY POLICY REPORT 1/2012 13
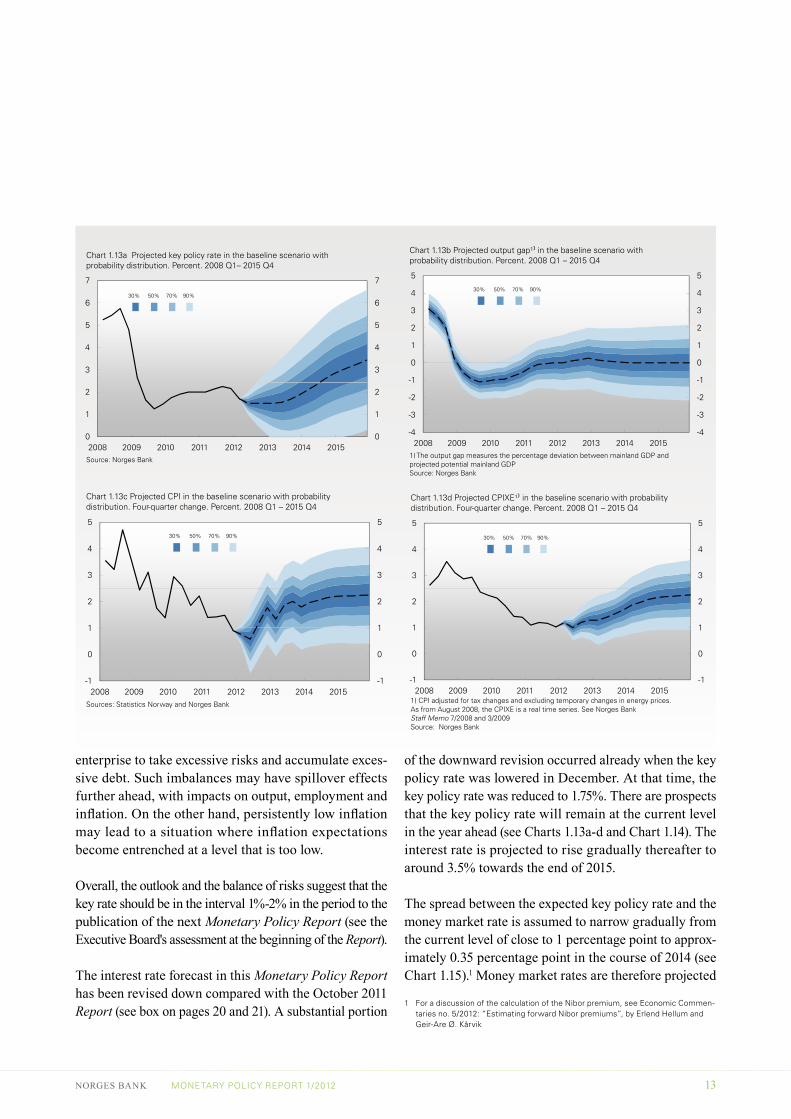
of the downward revision occurred already when the key policy rate was lowered in December. At that time, the key policy rate was reduced to 1.75%. There are prospects that the key policy rate will remain at the current level in the year ahead (see Charts 1.13a-d and Chart 1.14). The interest rate is projected to rise gradually thereafter to around 3.5% towards the end of 2015.
The spread between the expected key policy rate and the money market rate is assumed to narrow gradually from the current level of close to 1 percentage point to approx-imately 0.35 percentage point in the course of 2014 (see Chart 1.15).1 Money market rates are therefore projected
1 For a discussion of the calculation of the Nibor premium, see Economic Commen-taries no. 5/2012: “Estimating forward Nibor premiums”, by Erlend Hellum and Geir-Are Ø. Kårvik
1
0
1
2
3
4
5
1
0
1
2
3
4
5
Chart 1.13b Projected output gap¹⁾ in the baseline scenario withprobability distribution. Percent. 2008 Q1 – 2015 Q4
30% 50% 70% 90%
-4
-3
-2
-1
-4
-3
-2
-1
2008 2009 2010 2011 2012 2013 2014 20151) The output gap measures the percentage deviation between mainland GDP andprojected potential mainland GDPSource: Norges Bank
1
2
3
4
5
1
2
3
4
5
Chart 1.13c Projected CPI in the baseline scenario with probabilitydistribution. Four-quarter change. Percent. 2008 Q1 – 2015 Q4
30% 50% 70% 90%
-1
0
1
-1
0
1
2008 2009 2010 2011 2012 2013 2014 2015Sources: Statistics Norway and Norges Bank
1
2
3
4
5
1
2
3
4
5
Chart 1.13d Projected CPIXE¹⁾ in the baseline scenario with probability distribution. Four-quarter change. Percent. 2008 Q1 – 2015 Q4
30% 50% 70% 90%
-1
0
1
-1
0
1
2008 2009 2010 2011 2012 2013 2014 20151) CPI adjusted for tax changes and excluding temporary changes in energy prices. As from August 2008, the CPIXE is a real time series. See Norges Bank Staff Memo 7/2008 and 3/2009 Source: Norges Bank
3
4
5
6
7
3
4
5
6
7
Chart 1.13a Projected key policy rate in the baseline scenario with probability distribution. Percent. 2008 Q1– 2015 Q4
30% 50% 70% 90%
0
1
2
0
1
2
2008 2009 2010 2011 2012 2013 2014 2015Source: Norges Bank
enterprise to take excessive risks and accumulate exces-sive debt. Such imbalances may have spillover effects further ahead, with impacts on output, employment and inflation. On the other hand, persistently low inflation may lead to a situation where inflation expectations become entrenched at a level that is too low.
Overall, the outlook and the balance of risks suggest that the key rate should be in the interval 1%-2% in the period to the publication of the next Monetary Policy Report (see the Executive Board's assessment at the beginning of the Report).
The interest rate forecast in this Monetary Policy Report has been revised down compared with the October 2011 Report (see box on pages 20 and 21). A substantial portion
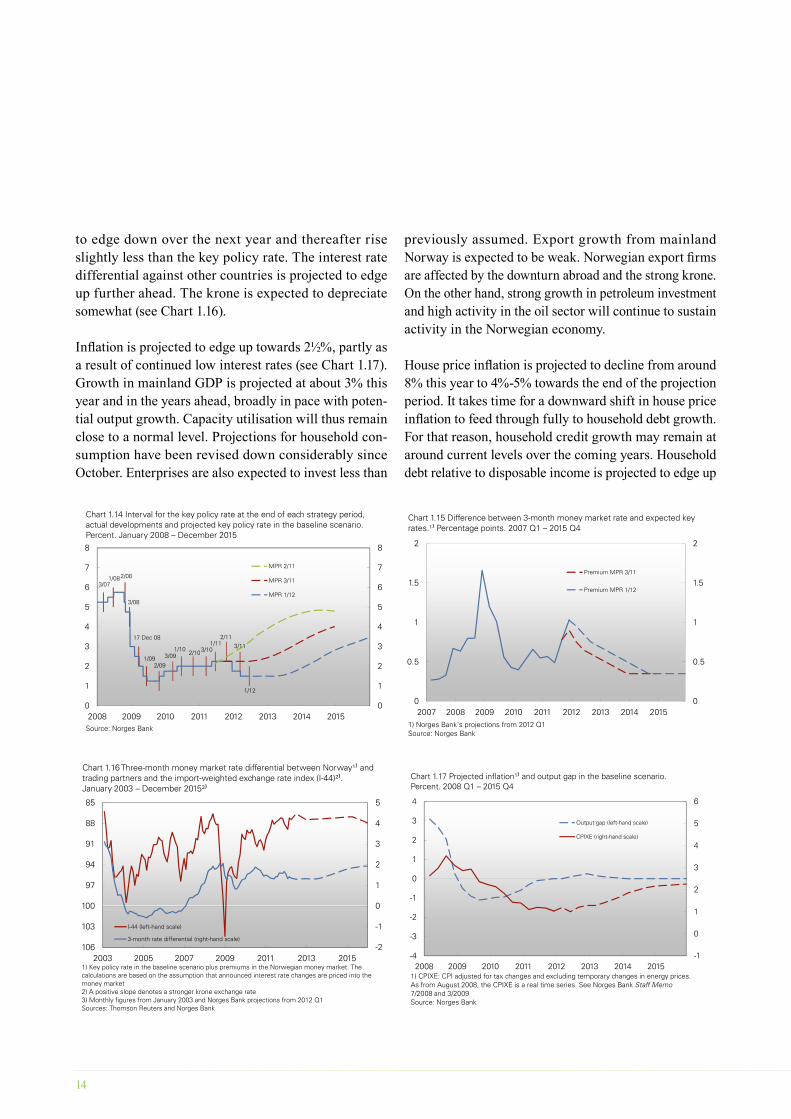
14
to edge down over the next year and thereafter rise slightly less than the key policy rate. The interest rate differential against other countries is projected to edge up further ahead. The krone is expected to depreciate somewhat (see Chart 1.16).
Inflation is projected to edge up towards 2½%, partly as a result of continued low interest rates (see Chart 1.17). Growth in mainland GDP is projected at about 3% this year and in the years ahead, broadly in pace with poten-tial output growth. Capacity utilisation will thus remain close to a normal level. Projections for household con-sumption have been revised down considerably since October. Enterprises are also expected to invest less than
1
1.5
2
1
1.5
2
Chart 1.15 Difference between 3-month money market rate and expected key rates.¹⁾ Percentage points. 2007 Q1 – 2015 Q4
Premium MPR 3/11
Premium MPR 1/12
0
0.5
0
0.5
2007 2008 2009 2010 2011 2012 2013 2014 20151) Norges Bank's projections from 2012 Q1Source: Norges Bank
0
1
2
3
4
585
88
91
94
97
100
Chart 1.16 Three-month money market rate differential between Norway¹⁾ and trading partners and the import-weighted exchange rate index (I-44)²⁾.January 2003 – December 2015³⁾
-2
-1
0100
103
1062003 2005 2007 2009 2011 2013 2015
I-44 (left-hand scale)
3-month rate differential (right-hand scale)
1) Key policy rate in the baseline scenario plus premiums in the Norwegian money market. The calculations are based on the assumption that announced interest rate changes are priced into the money market2) A positive slope denotes a stronger krone exchange rate 3) Monthly figures from January 2003 and Norges Bank projections from 2012 Q1 Sources: Thomson Reuters and Norges Bank
2
3
4
5
6
-1
0
1
2
3
4
Chart 1.17 Projected inflation¹⁾ and output gap in the baseline scenario.Percent. 2008 Q1 – 2015 Q4
Output gap (left-hand scale)
CPIXE (right-hand scale)
-1
0
1
-4
-3
-2
2008 2009 2010 2011 2012 2013 2014 20151) CPIXE: CPI adjusted for tax changes and excluding temporary changes in energy prices. As from August 2008, the CPIXE is a real time series. See Norges Bank Staff Memo7/2008 and 3/2009 Source: Norges Bank
previously assumed. Export growth from mainland Norway is expected to be weak. Norwegian export firms are affected by the downturn abroad and the strong krone. On the other hand, strong growth in petroleum investment and high activity in the oil sector will continue to sustain activity in the Norwegian economy.
House price inflation is projected to decline from around 8% this year to 4%-5% towards the end of the projection period. It takes time for a downward shift in house price inflation to feed through fully to household debt growth. For that reason, household credit growth may remain at around current levels over the coming years. Household debt relative to disposable income is projected to edge up
3
4
5
6
7
8
3
4
5
6
7
8
Chart 1.14 Interval for the key policy rate at the end of each strategy period, actual developments and projected key policy rate in the baseline scenario. Percent. January 2008 – December 2015
MPR 2/11
MPR 3/11
MPR 1/12
3/071/082/08
3/08
17 Dec 08
1/10 2/103/101/11
2/113/11
0
1
2
0
1
2
2008 2009 2010 2011 2012 2013 2014 2015Source: Norges Bank
1/092/09
3/09 2/10 /
1/12
NORGES BANK MONETARY POLICY REPORT 1/2012 15
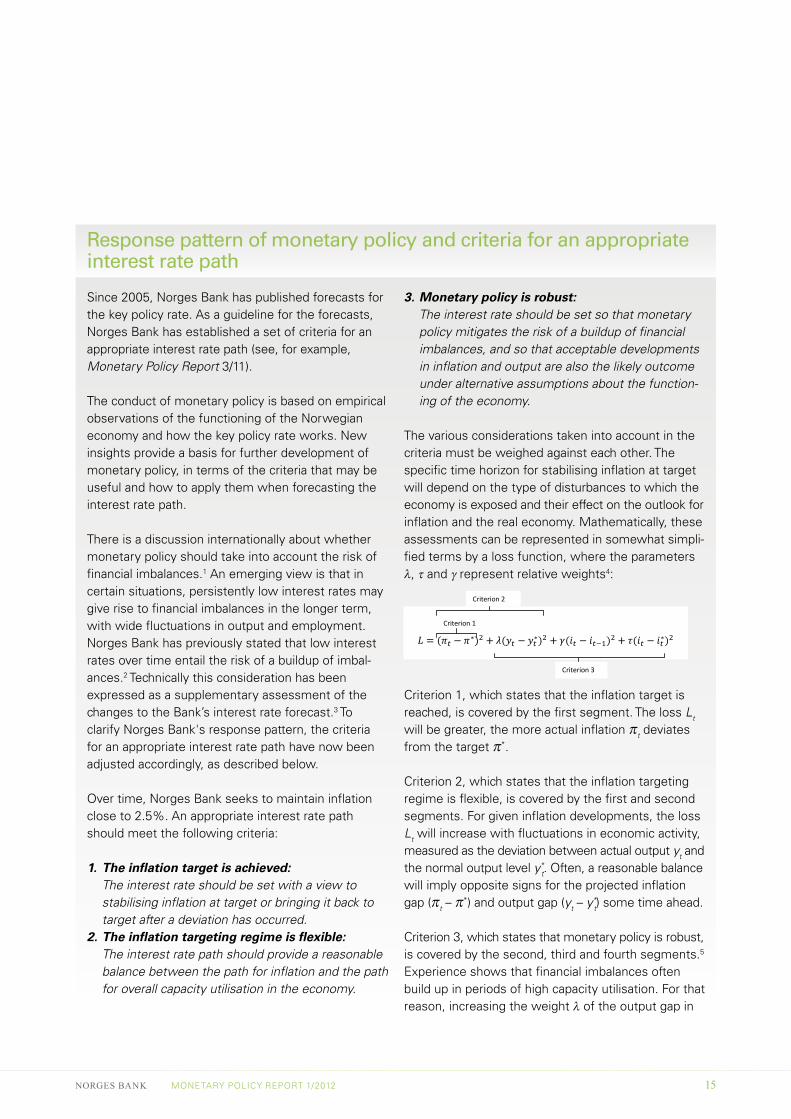
Response pattern of monetary policy and criteria for an appropriate interest rate path
Since 2005, Norges Bank has published forecasts for the key policy rate. As a guideline for the forecasts, Norges Bank has established a set of criteria for an appropriate interest rate path (see, for example, Monetary Policy Report 3/11).
The conduct of monetary policy is based on empirical observations of the functioning of the Norwegian economy and how the key policy rate works. New insights provide a basis for further development of monetary policy, in terms of the criteria that may be useful and how to apply them when forecasting the interest rate path.
There is a discussion internationally about whether monetary policy should take into account the risk of financial imbalances.1 An emerging view is that in certain situations, persistently low interest rates may give rise to financial imbalances in the longer term, with wide fluctuations in output and employment. Norges Bank has previously stated that low interest rates over time entail the risk of a buildup of imbal-ances.2 Technically this consideration has been expressed as a supplementary assessment of the changes to the Bank’s interest rate forecast.3 To clarify Norges Bank's response pattern, the criteria for an appropriate interest rate path have now been adjusted accordingly, as described below.
Over time, Norges Bank seeks to maintain inflation close to 2.5%. An appropriate interest rate path should meet the following criteria:
1. Theinflationtargetisachieved: The interest rate should be set with a view to stabilising inflation at target or bringing it back to target after a deviation has occurred.
2.Theinflationtargetingregimeisflexible: The interest rate path should provide a reasonable balance between the path for inflation and the path for overall capacity utilisation in the economy.
3.Monetarypolicyisrobust: The interest rate should be set so that monetary policy mitigates the risk of a buildup of financial imbalances, and so that acceptable developments in inflation and output are also the likely outcome under alternative assumptions about the function-ing of the economy.
The various considerations taken into account in the criteria must be weighed against each other. The specific time horizon for stabilising inflation at target will depend on the type of disturbances to which the economy is exposed and their effect on the outlook for inflation and the real economy. Mathematically, these assessments can be represented in somewhat simpli-fied terms by a loss function, where the parameters λ, τ and γ represent relative weights4:
Criterion 1
Criterion 2
Criterion 3
Criterion 1, which states that the inflation target is reached, is covered by the first segment. The loss Lt will be greater, the more actual inflation πt deviates from the target π*.
Criterion 2, which states that the inflation targeting regime is flexible, is covered by the first and second segments. For given inflation developments, the loss Lt will increase with fluctuations in economic activity, measured as the deviation between actual output yt and the normal output level y*
t. Often, a reasonable balance will imply opposite signs for the projected inflation gap (πt – π*) and output gap (yt – y*
t) some time ahead.
Criterion 3, which states that monetary policy is robust, is covered by the second, third and fourth segments.5 Experience shows that financial imbalances often build up in periods of high capacity utilisation. For that reason, increasing the weight λ of the output gap in
16
the loss function may reduce the risk of a buildup of such imbalances. The third segment of the loss function expresses that it will normally be robust to change the interest rate gradually, so that the current interest rate, it, does not deviate excessively from the rate in the previous period, it-1. Substantial and sudden changes in the interest rate may lead to economic instability. Gradual changes in the interest rate enhance the robustness of monetary policy because the Bank can then regularly assess the effects of a change in the interest rate and other new information on economic developments.
The last segment states that the loss increases when the interest rate deviates substantially from a normal level it
*.6 This consideration can help to mitigate the risk of a buildup of financial imbalances – even in periods when capacity utilisation is not particularly high.
Over time, income level, saving behaviour, the tax system and the structure of financial markets deter-mine the level of household and corporate indebted-ness. Low interest rates for extended periods can increase the risk that debt and asset prices will move up and remain higher than what is sustainable over the economic cycle.7 In addition, banks may ease credit standards and financial market participants may increase risk taking.8 High debt levels make borrowers more vulnerable and increase the risk of long-term instability in the real economy.9 A sudden, unexpected drop in incomes, higher unemployment or other macroeconomic shocks may result in a fall in property prices, creating imbalances between borrowers' debts and the value of leveraged assets.
By incorporating the interest rate level in the loss function, the Bank is seeking to counter the buildup of such imbalances. This does not imply that the inter est rate becomes an independent objective of mone tary policy. Rather, the purpose is to overcome flaws in our analytical tools related to the effects of low interest rates. Monetary policy will continue to react to shocks that affect the path for inflation, output and employment.10
The loss function must be regarded as a simplified representation of the more extensive assessments underlying interest rate decisions. Situations may arise where weight will be given to considerations other than those expressed in the loss function. In certain situations, for example, a more aggressive interest rate response than usual may be necessary to prevent particularly adverse outcomes. In other situations, the Bank may judge that greater caution
in interest rate setting is warranted. Formalising the considerations that are given weight by means of a loss function will nonetheless contribute to consist-ency over time, and can clarify how Norges Bank normally balances various considerations.
Compared with the loss function in previous reports, the weight given to the output gap (λ) has been adjusted upwards. In addition, the weight given to the deviation of the interest rate from simple monetary policy rules has been replaced by the weight of the deviation of the interest rate from a normal interest rate. The changes have been made to enable the Bank’s model-based analyses to better capture the monetary policy response pattern since the financial crisis in autumn 2008. A separate box on changes in the projections since Monetary Policy Report 3/11 presents the effects of the adjusted loss function on the interest rate path.
As the Bank gains new insights and gathers further evidence, the Bank’s assessments of economic relationships may change and its models may be further developed. New insight into the functioning of the economy and enhanced understanding of how to mitigate the risk of financial imbalances may influence the formulation of the loss function. Norges Bank will provide an account of any adjustments of the loss function such changes would imply.
1 See for example Woodford, Michael (2012): “Inflation Targeting and Financial Stability,” Sveriges Riksbank Economic Review 2012:1, and Svensson, Lars E.O. (2012): “Comment on Michael Woodford, Inflation targeting and Financial Stability”, Sveriges Riksbank Economic Review 2012:1 and Eichengreen, B., M. El-Erian, A. Fraga, T. Ito, J. Pisani-Ferry, E. Prasad, R. Rajan, M. Ramos, C. Reinhart, H. Rey, D. Rodrik, K. Rogoff. H.S. Shin, A. Velasco, B. Weder di Mauro and Y. Yu (2011): Rethinking central banking. Committee on inter-national economic policy and reform, Brookings Institution, Washington DC.
2 See for example Monetary Policy Report 3/10 and 3/113 See Monetary Policy Report 3/11, pp. 20-214 In the calculations for this Report, λ = 0.75, γ = 0.25 and τ = 0.05. In general,
the parameters will depend on the specifications of the model and how the model is solved (see further description in Alstadheim, Ragna, Ida Wolden Bache, Amund Holmsen, Junior Maih and Øistein Røisland (2010): “Monetary Policy Analysis in Practice”, See Norges Bank Staff Memo 11/2010, Norges Bank
5 See forthcoming Norges Bank Staff Memo for a more detailed account of the loss function
6 Given well-anchored inflation expectations, the deviation in the nominal interest rate from a normal level may be expressed as a deviation of the real interest rate. Prospects for very low interest rates in the years ahead have pulled down Norges Bank's projections of a normal interest rate. The normal level of the key policy rate a few years further ahead is assumed to be around 4%
7 See Jordà, Òscar, Moritz Schularick and Alan M. Taylor (2011): “Financial Crises, Credit Booms, and External Imbalances: 140 years of lessons”, IMF Economic Review, Vol. 59, No.2 and Borio, Claudio and Haibin Zhu (2008): “Capital Regulation, Risk-Taking and Monetary Policy: A Missing Link in the Transmission Mechanism?”, Bank for International Settlements Working Paper, No.268. See also Jacobsen, Dag Henning and Bjørn Naug (2004): “What influences the growth of household debt?”, Economic Bulletin, 3/2004, Norges Bank, for an empirical analysis of the relationship between debt and interest rates
8 See Jiménez, Gabriel, Steven Ongena, José Luis Peydrò and Jesùs Saurina (2008): “Hazardous times for monetary policy: What do twenty-three million bank loans say about the effects of monetary policy on credit risk taking?”, Banco de España Working Papers, No. 0833, Banco de España
9 See Reinhart, Carmen M. and Kenneth S. Rogoff (2009): This time is different, Princeton University Press
10 See forthcoming Norges Bank Staff Memo for a description of the effects of the new loss function in NEMO
NORGES BANK MONETARY POLICY REPORT 1/2012 17
1.5
2
2.5
3
3.5
4
1.5
2
2.5
3
3.5
4
Chart 1.18c CPIXE¹⁾. Four-quarter change. Percent. 2008 Q1 – 2015 Q4
Criterion 1
Criteria 1&2
Criteria 1,2&3
0
0.5
1
0
0.5
1
2008 2009 2010 2011 2012 2013 2014 20151) CPI adjusted for tax changes and excluding temporary changes in energy prices. As from August 2008, the CPIXE is a real time series. See Norges Bank Staff Memo 7/2008 and 3/2009 Source: Norges Bank
1
0
1
2
3
4
5
1
0
1
2
3
4
5
Chart 1.18b Output gap. Percent. 2008 Q1 – 2015 Q4
Criterion 1
Criteria 1&2
Criteria 1,2&3
-4
-3
-2
-1
-4
-3
-2
-1
2008 2009 2010 2011 2012 2013 2014 2015Source: Norges Bank
(see Chart 1.12). Prospects of fairly low interest rates for some time ahead will sustain interest rate burdens at a moderate level.
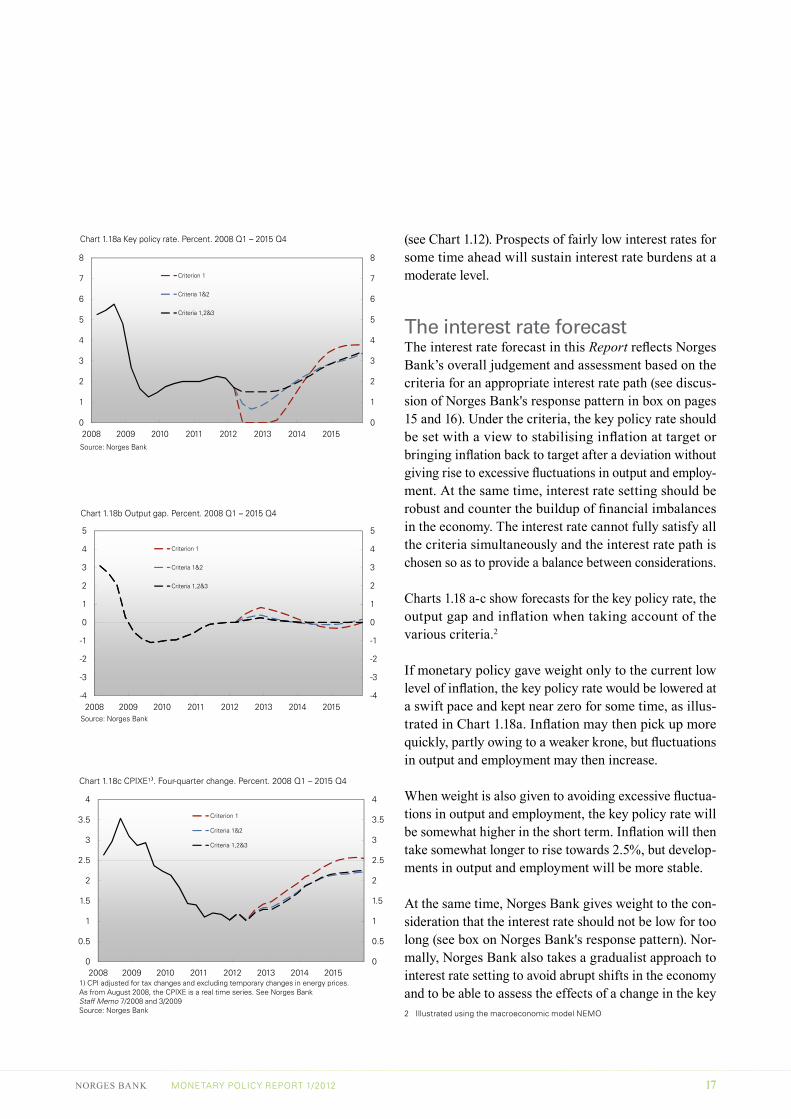
The interest rate forecastThe interest rate forecast in this Report reflects Norges Bank’s overall judgement and assessment based on the criteria for an appropriate interest rate path (see discus-sion of Norges Bank's response pattern in box on pages 15 and 16). Under the criteria, the key policy rate should be set with a view to stabilising inflation at target or bringing inflation back to target after a deviation without giving rise to excessive fluctuations in output and employ-ment. At the same time, interest rate setting should be robust and counter the buildup of financial imbalances in the economy. The interest rate cannot fully satisfy all the criteria simultaneously and the interest rate path is chosen so as to provide a balance between considerations.
Charts 1.18 a-c show forecasts for the key policy rate, the output gap and inflation when taking account of the various criteria.2
If monetary policy gave weight only to the current low level of inflation, the key policy rate would be lowered at a swift pace and kept near zero for some time, as illus-trated in Chart 1.18a. Inflation may then pick up more quickly, partly owing to a weaker krone, but fluctuations in output and employment may then increase.
When weight is also given to avoiding excessive fluctua-tions in output and employment, the key policy rate will be somewhat higher in the short term. Inflation will then take somewhat longer to rise towards 2.5%, but develop-ments in output and employment will be more stable.
At the same time, Norges Bank gives weight to the con-sideration that the interest rate should not be low for too long (see box on Norges Bank's response pattern). Nor-mally, Norges Bank also takes a gradualist approach to interest rate setting to avoid abrupt shifts in the economy and to be able to assess the effects of a change in the key 2 Illustrated using the macroeconomic model NEMO
3
4
5
6
7
8
3
4
5
6
7
8
Chart 1.18a Key policy rate. Percent. 2008 Q1 – 2015 Q4
Criterion 1
Criteria 1&2
Criteria 1,2&3
0
1
2
0
1
2
2008 2009 2010 2011 2012 2013 2014 2015Source: Norges Bank
18
policy rate. Uncertainty about the economic outlook is considerable, and it goes both ways. Taken together, these considerations bring the forecast for the interest rate to the baseline scenario in this Report.
Cross-checks of the interest rate forecast
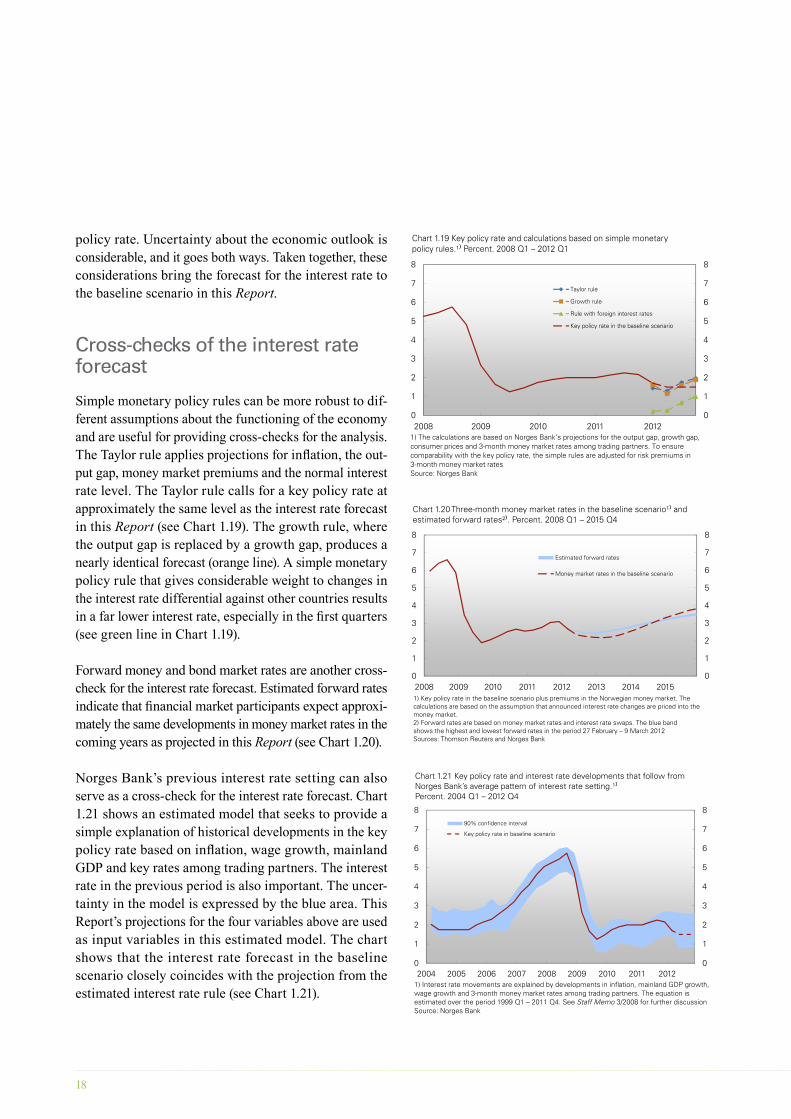
Simple monetary policy rules can be more robust to dif-ferent assumptions about the functioning of the economy and are useful for providing cross-checks for the analysis. The Taylor rule applies projections for inflation, the out-put gap, money market premiums and the normal interest rate level. The Taylor rule calls for a key policy rate at approximately the same level as the interest rate forecast in this Report (see Chart 1.19). The growth rule, where the output gap is replaced by a growth gap, produces a nearly identical forecast (orange line). A simple monetary policy rule that gives considerable weight to changes in the interest rate differential against other countries results in a far lower interest rate, especially in the first quarters (see green line in Chart 1.19).
Forward money and bond market rates are another cross-check for the interest rate forecast. Estimated forward rates indicate that financial market participants expect approxi-mately the same developments in money market rates in the coming years as projected in this Report (see Chart 1.20).
Norges Bank’s previous interest rate setting can also serve as a cross-check for the interest rate forecast. Chart 1.21 shows an estimated model that seeks to provide a simple explanation of historical developments in the key policy rate based on inflation, wage growth, mainland GDP and key rates among trading partners. The interest rate in the previous period is also important. The uncer-tainty in the model is expressed by the blue area. This Report’s projections for the four variables above are used as input variables in this estimated model. The chart shows that the interest rate forecast in the baseline scenario closely coincides with the projection from the estimated interest rate rule (see Chart 1.21).
2
3
4
5
6
7
8
2
3
4
5
6
7
8
Chart 1.20 Three-month money market rates in the baseline scenario¹⁾ and estimated forward rates²⁾. Percent. 2008 Q1 – 2015 Q4
Estimated forward rates
Money market rates in the baseline scenario
0
1
2
0
1
2
2008 2009 2010 2011 2012 2013 2014 20151) Key policy rate in the baseline scenario plus premiums in the Norwegian money market. The calculations are based on the assumption that announced interest rate changes are priced into the money market.2) Forward rates are based on money market rates and interest rate swaps. The blue band shows the highest and lowest forward rates in the period 27 February – 9 March 2012Sources: Thomson Reuters and Norges Bank
3
4
5
6
7
8
3
4
5
6
7
8
Chart 1.21 Key policy rate and interest rate developments that follow from Norges Bank’s average pattern of interest rate setting.¹⁾Percent. 2004 Q1 – 2012 Q4
90% confidence interval
Key policy rate in baseline scenario
0
1
2
0
1
2
2004 2005 2006 2007 2008 2009 2010 2011 20121) Interest rate movements are explained by developments in inflation, mainland GDP growth, wage growth and 3-month money market rates among trading partners. The equation is estimated over the period 1999 Q1 – 2011 Q4. See Staff Memo 3/2008 for further discussionSource: Norges Bank
3
4
5
6
7
8
3
4
5
6
7
8
Chart 1.19 Key policy rate and calculations based on simple monetary policy rules.¹⁾ Percent. 2008 Q1 – 2012 Q1
Taylor rule
Growth rule
Rule with foreign interest rates
Key policy rate in the baseline scenario
0
1
2
0
1
2
2008 2009 2010 2011 20121) The calculations are based on Norges Bank’s projections for the output gap, growth gap, consumer prices and 3-month money market rates among trading partners. To ensure comparability with the key policy rate, the simple rules are adjusted for risk premiums in 3-month money market ratesSource: Norges Bank
NORGES BANK MONETARY POLICY REPORT 1/2012 19
3
4
5
6
7
8
3
4
5
6
7
8
Chart 1.22 Key policy rate in the baseline scenario and in the alternative scenarios. Percent. 2008 Q1 – 2015 Q4
Increased inflation and increased capacity utilisation
Weaker inflation and lower capacity utilisation
Baseline scenario
0
1
2
0
1
2
2008 2009 2010 2011 2012 2013 2014 2015Source: Norges Bank
30% 50% 70% 90%
Uncertainty surrounding the projections
The projections for the key policy rate, inflation, output and other variables are based on Norges Bank’s assess-ment of the economic situation and our perception of the functioning of the economy and monetary policy. If eco-nomic developments are broadly in line with projections, economic agents can expect that the interest rate path will also be approximately as projected. However, the interest rate path may differ if the economic outlook changes or if the effect of interest rate changes on infla-tion, output and employment differs from that projected.
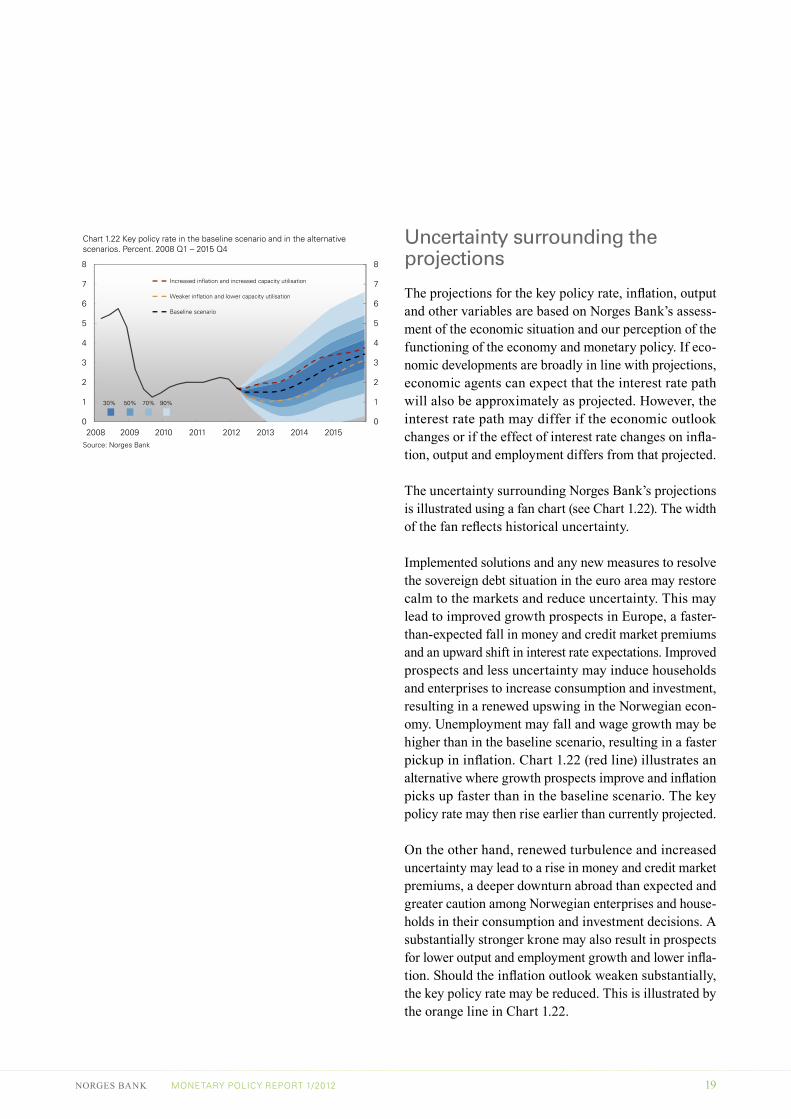
The uncertainty surrounding Norges Bank’s projections is illustrated using a fan chart (see Chart 1.22). The width of the fan reflects historical uncertainty.
Implemented solutions and any new measures to resolve the sovereign debt situation in the euro area may restore calm to the markets and reduce uncertainty. This may lead to improved growth prospects in Europe, a faster-than-expected fall in money and credit market premiums and an upward shift in interest rate expectations. Improved prospects and less uncertainty may induce households and enterprises to increase consumption and investment, resulting in a renewed upswing in the Norwegian econ-omy. Unemployment may fall and wage growth may be higher than in the baseline scenario, resulting in a faster pickup in inflation. Chart 1.22 (red line) illustrates an alternative where growth prospects improve and inflation picks up faster than in the baseline scenario. The key policy rate may then rise earlier than currently projected.
On the other hand, renewed turbulence and increased uncertainty may lead to a rise in money and credit market premiums, a deeper downturn abroad than expected and greater caution among Norwegian enterprises and house-holds in their consumption and investment decisions. A substantially stronger krone may also result in prospects for lower output and employment growth and lower infla-tion. Should the inflation outlook weaken substantially, the key policy rate may be reduced. This is illustrated by the orange line in Chart 1.22.
20
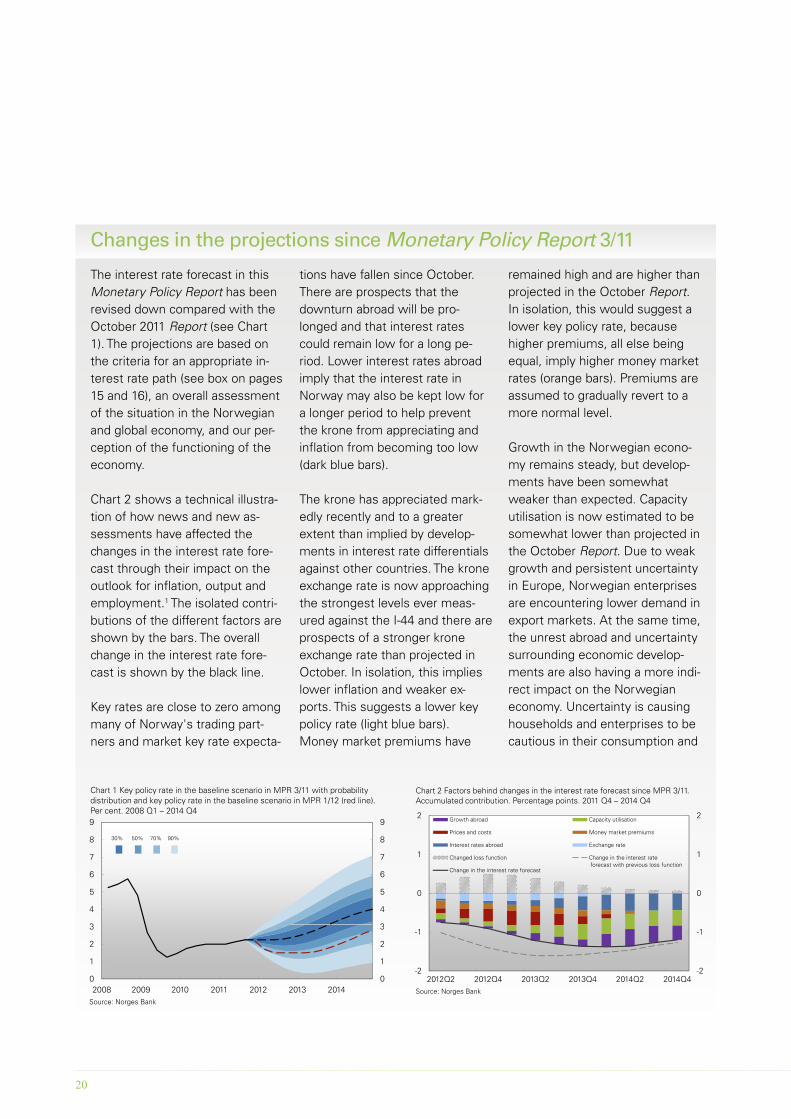
The interest rate forecast in this Monetary Policy Report has been revised down compared with the October 2011 Report (see Chart 1). The projections are based on the criteria for an appropriate in-terest rate path (see box on pages 15 and 16), an overall assessment of the situation in the Norwegian and global economy, and our per-ception of the functioning of the economy.
Chart 2 shows a technical illustra-tion of how news and new as-sessments have affected the changes in the interest rate fore-cast through their impact on the outlook for inflation, output and employment.1 The isolated contri-butions of the different factors are shown by the bars. The overall change in the interest rate fore-cast is shown by the black line.
Key rates are close to zero among many of Norway's trading part-ners and market key rate expecta-
tions have fallen since October. There are prospects that the downturn abroad will be pro-longed and that interest rates could remain low for a long pe-riod. Lower interest rates abroad imply that the interest rate in Norway may also be kept low for a longer period to help prevent the krone from appreciating and inflation from becoming too low (dark blue bars).
The krone has appreciated mark-edly recently and to a greater extent than implied by develop-ments in interest rate differentials against other countries. The krone exchange rate is now approaching the strongest levels ever meas-ured against the I-44 and there are prospects of a stronger krone exchange rate than projected in October. In isolation, this implies lower inflation and weaker ex-ports. This suggests a lower key policy rate (light blue bars).Money market premiums have
remained high and are higher than projected in the October Report. In isolation, this would suggest a lower key policy rate, because higher premiums, all else being equal, imply higher money market rates (orange bars). Premiums are assumed to gradually revert to a more normal level.
Growth in the Norwegian econo-my remains steady, but develop-ments have been somewhat weaker than expected. Capacity utilisation is now estimated to be somewhat lower than projected in the October Report. Due to weak growth and persistent uncertainty in Europe, Norwegian enterprises are encountering lower demand in export markets. At the same time, the unrest abroad and uncertainty surrounding economic develop-ments are also having a more indi-rect impact on the Norwegian economy. Uncertainty is causing households and enterprises to be cautious in their consumption and
Changes in the projections since Monetary Policy Report 3/11
3
4
5
6
7
8
9
3
4
5
6
7
8
9
Chart 1 Key policy rate in the baseline scenario in MPR 3/11 with probability distribution and key policy rate in the baseline scenario in MPR 1/12 (red line). Per cent. 2008 Q1 – 2014 Q4
30% 50% 70% 90%
0
1
2
3
0
1
2
3
2008 2009 2010 2011 2012 2013 2014Source: Norges Bank
0
1
2
0
1
2
Chart 2 Factors behind changes in the interest rate forecast since MPR 3/11. Accumulated contribution. Percentage points. 2011 Q4 – 2014 Q4
Growth abroad Capacity utilisation
Prices and costs Money market premiums
Interest rates abroad Exchange rate
Changed loss function Change in the interest rateforecast with previous loss function
Change in the interest rate forecast
-2
-1
2012Q2 2012Q4 2013Q2 2013Q4 2014Q2 2014Q4-2
-1
Source: Norges Bank
NORGES BANK MONETARY POLICY REPORT 1/2012 21
investment decisions. Activity growth ahead is projected to be lower than previously assumed. Lower demand and weaker growth prospects in Norway and abroad suggest a lower key policy rate (green and purple bars).
Inflation remains low. Underlying inflation is likely to remain at around 1¼% - 1½% through 2012, somewhat lower than pro-jected in the October Report. Pro-jections for wage growth have also been revised down. Lower inflation and cost growth suggest
a lower key policy rate (red bars).
A separate box in this Report de-scribes how financial stability con-siderations may influence interest rate setting. Compared with previ-ous reports, the criteria for an ap-propriate interest rate path have been adjusted. In view of this, the loss function used in the model-based calculations has also been changed. These changes have been made to enable the Bank’s model-based analyses to better capture the monetary policy re-sponse pattern since the financial
crisis in autumn 2008. The broken grey line shows a technical illus-tration of how news would have affected changes in the interest rate forecast using the former loss function. The new loss func-tion describes in isolation a some-what higher interest rate path (grey bars).2
1 Illustrated using the macroeconomic model NEMO. Calculations are based on the opera-tional loss function, which is described in the box on pages 15 and 16.
2 See forthcoming Staff Memo 10/2012 for a description of the effects of the new loss func-tion.
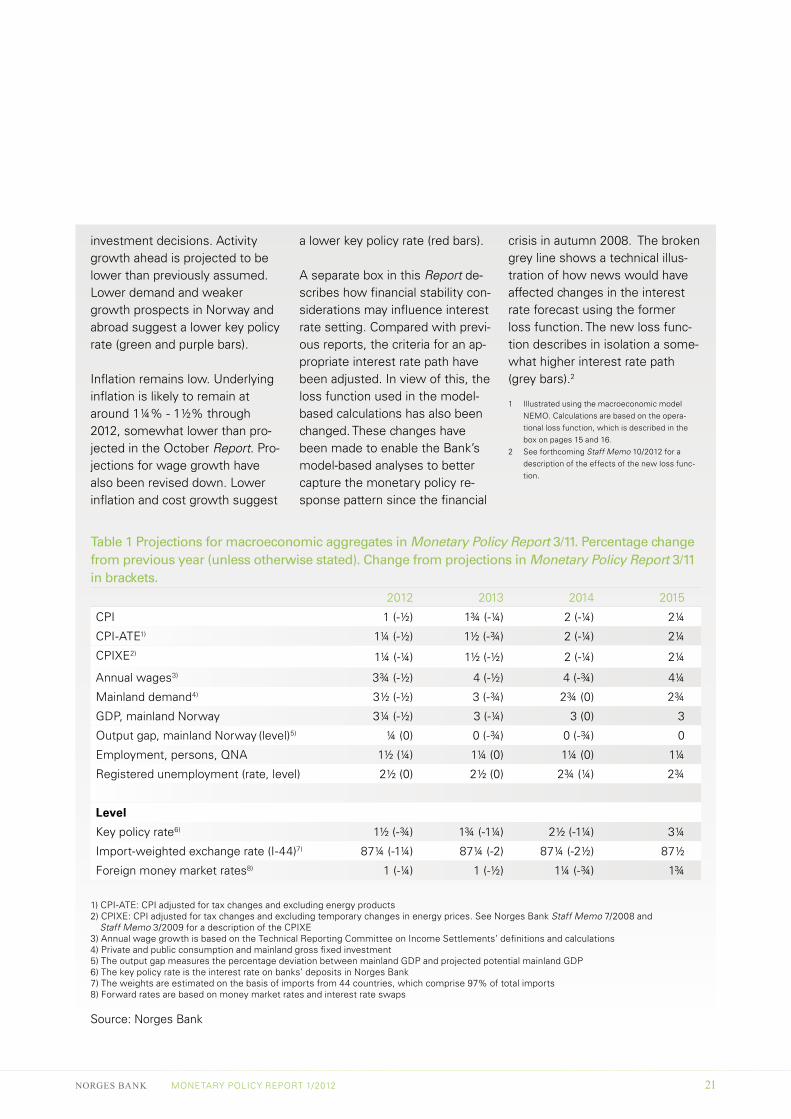
Table 1 Projections for macroeconomic aggregates in Monetary Policy Report 3/11. Percentage change from previous year (unless otherwise stated). Change from projections in Monetary Policy Report 3/11 in brackets.
2012 2013 2014 2015
CPI 1 (-½) 1¾ (-¼) 2 (-¼) 2¼
CPI-ATE1) 1¼ (-½) 1½ (-¾) 2 (-¼) 2¼
CPIXE2) 1¼ (-¼) 1½ (-½) 2 (-¼) 2¼
Annual wages3) 3¾ (-½) 4 (-½) 4 (-¾) 4¼
Mainland demand4) 3½ (-½) 3 (-¾) 2¾ (0) 2¾
GDP, mainland Norway 3¼ (-½) 3 (-¼) 3 (0) 3
Output gap, mainland Norway (level)5) ¼ (0) 0 (-¾) 0 (-¾) 0
Employment, persons, QNA 1½ (¼) 1¼ (0) 1¼ (0) 1¼
Registered unemployment (rate, level) 2½ (0) 2½ (0) 2¾ (¼) 2¾
Level
Key policy rate6) 1½ (-¾) 1¾ (-1¼) 2½ (-1¼) 3¼
Import-weighted exchange rate (I-44)7) 87¼ (-1¼) 87¼ (-2) 87¼ (-2½) 87½
Foreign money market rates8) 1 (-¼) 1 (-½) 1¼ (-¾) 1¾
1) CPI-ATE: CPI adjusted for tax changes and excluding energy products2) CPIXE: CPI adjusted for tax changes and excluding temporary changes in energy prices. See Norges Bank Staff Memo 7/2008 and
Staff Memo 3/2009 for a description of the CPIXE3) Annual wage growth is based on the Technical Reporting Committee on Income Settlements’ definitions and calculations4) Private and public consumption and mainland gross fixed investment5) The output gap measures the percentage deviation between mainland GDP and projected potential mainland GDP6) The key policy rate is the interest rate on banks’ deposits in Norges Bank7) The weights are estimated on the basis of imports from 44 countries, which comprise 97% of total imports8) Forward rates are based on money market rates and interest rate swaps
Source: Norges Bank

NORGES BANK MONETARY POLICY REPORT 1/2012 23
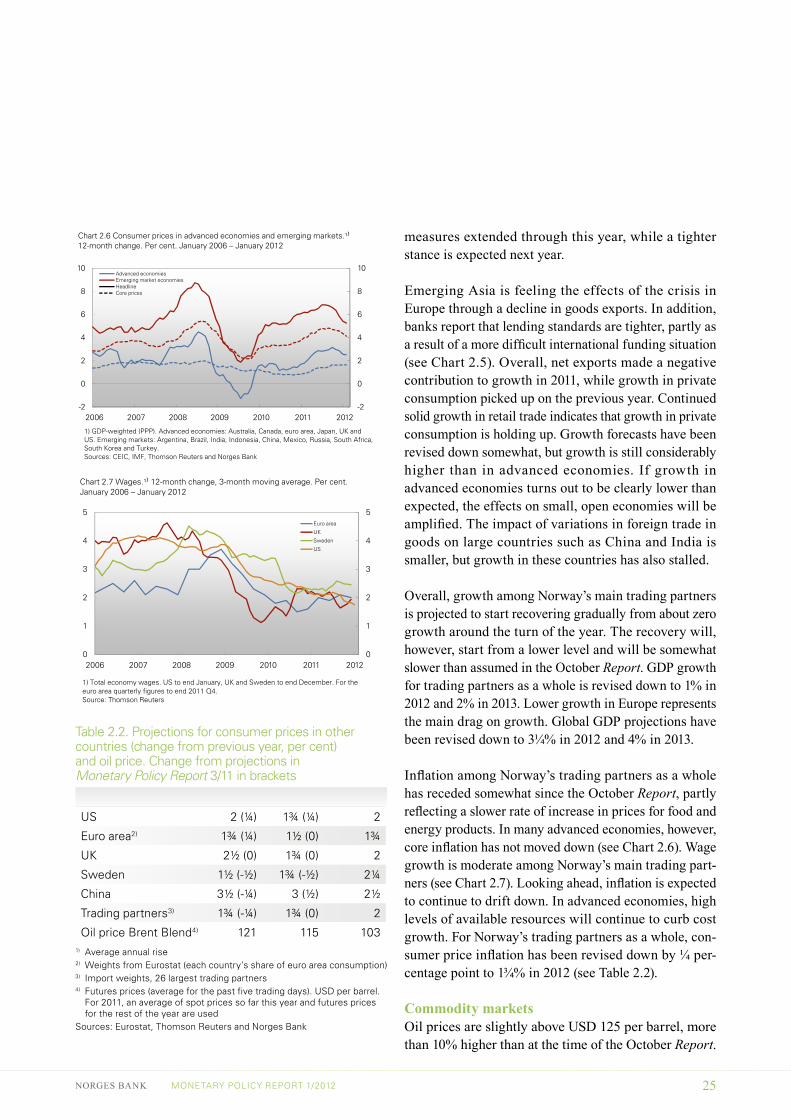
Table 2.1 Projections for GDP growth in other countries. Change from previous year. Per cent. Change from projections in Monetary Policy Report 3/11 in brackets.
Share of world GDP1) (per cent) 2012 2013
2014 – 20152)
US 20 2 (¼) 2½ (-¼) 2¾
Euro area 15 -½ (-1) ¾ (-½) 2
UK 3 ¾ (-½) 1¾ (-½) 2½
Sweden 0.5 ¾ (-¾) 1½ (-¼) 2¾
China 13 8 (-½) 8 (-½) 8½ Trading partners3) 65 1 (-¾) 2 (-¼) 2¾
World (PPP)4) 100 3¼ (-½) 4 (-¼) 4½ World (market exchange rates)4) 100 2½ (-½) 3¼ (-¼) 3 ¾
1) Purchasing power parity (PPP) GDP in 20102) Average annual growth3) Export weights, 26 largest trading partners4) GDP weights. Norges Bank’s estimates for 26 trading partners,
other estimates from IMF and Consensus Economics
Sources: IMF, Consensus Economics, Eurostat and Norges Bank
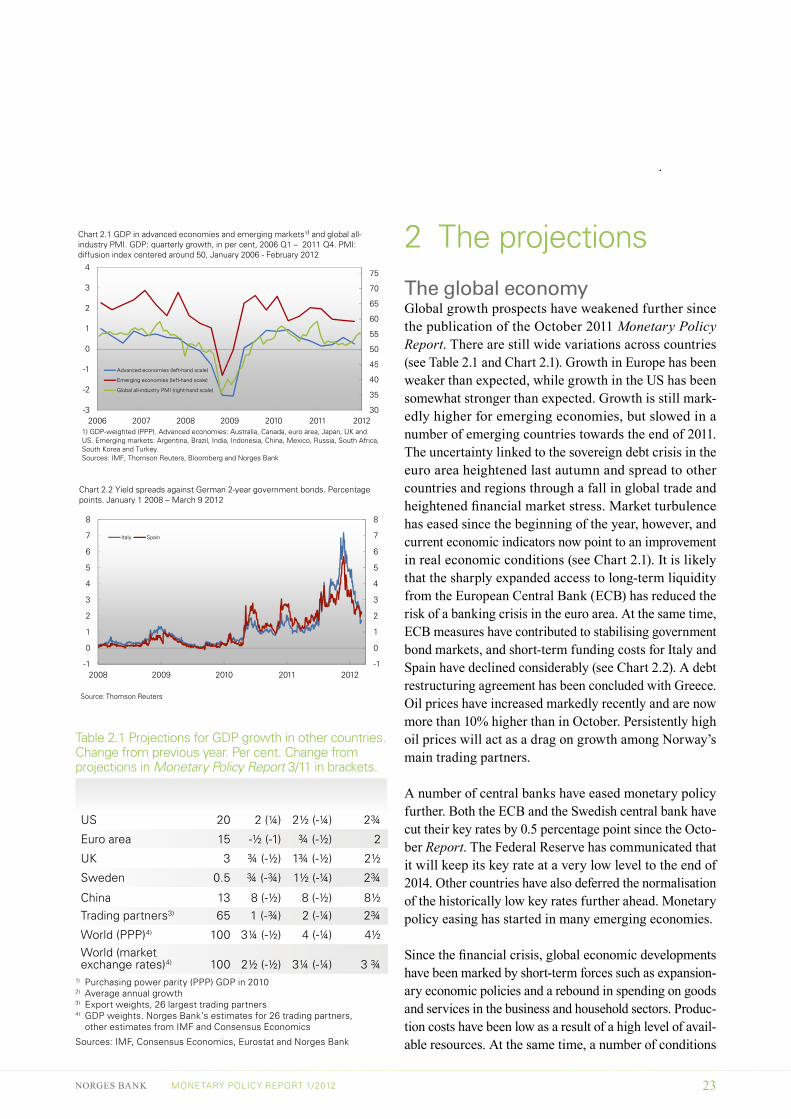
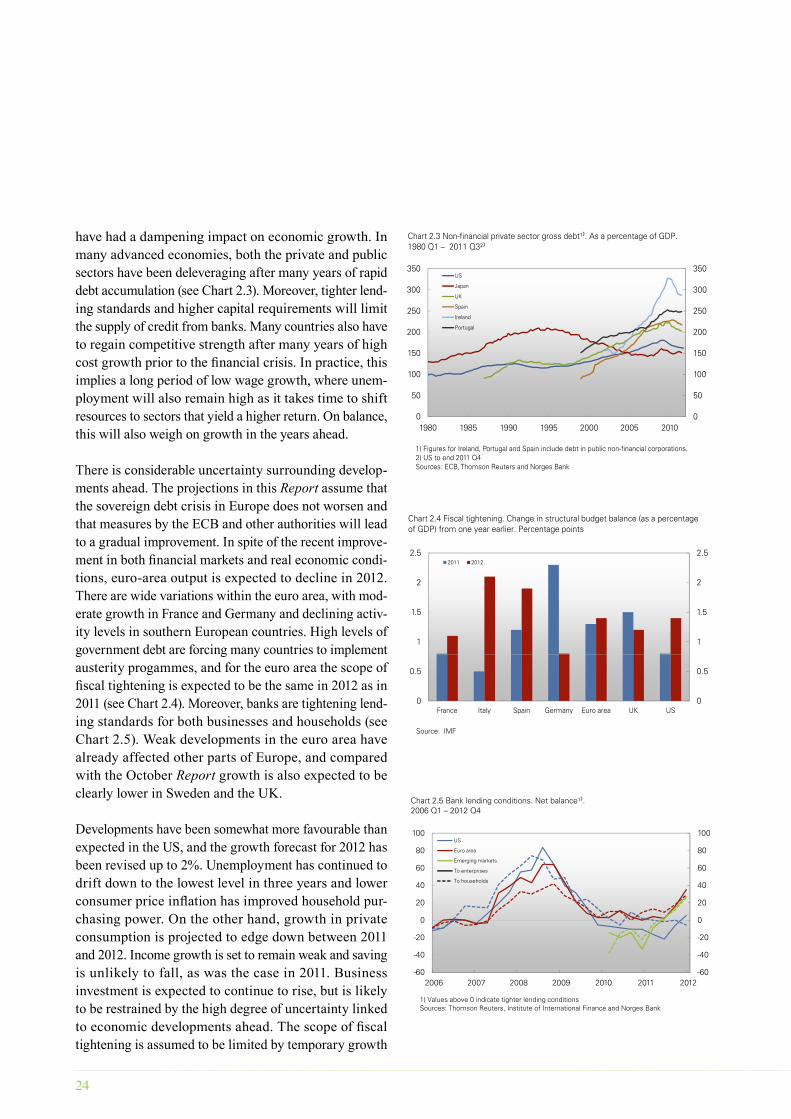
2 The projections The global economy Global growth prospects have weakened further since the publication of the October 2011 Monetary Policy Report. There are still wide variations across countries (see Table 2.1 and Chart 2.1). Growth in Europe has been weaker than expected, while growth in the US has been somewhat stronger than expected. Growth is still mark-edly higher for emerging economies, but slowed in a number of emerging countries towards the end of 2011. The uncertainty linked to the sovereign debt crisis in the euro area heightened last autumn and spread to other countries and regions through a fall in global trade and heightened financial market stress. Market turbulence has eased since the beginning of the year, however, and current economic indicators now point to an improvement in real economic conditions (see Chart 2.1). It is likely that the sharply expanded access to long-term liquidity from the European Central Bank (ECB) has reduced the risk of a banking crisis in the euro area. At the same time, ECB measures have contributed to stabilising government bond markets, and short-term funding costs for Italy and Spain have declined considerably (see Chart 2.2). A debt restructuring agreement has been concluded with Greece. Oil prices have increased markedly recently and are now more than 10% higher than in October. Persistently high oil prices will act as a drag on growth among Norway’s main trading partners.
A number of central banks have eased monetary policy further. Both the ECB and the Swedish central bank have cut their key rates by 0.5 percentage point since the Octo-ber Report. The Federal Reserve has communicated that it will keep its key rate at a very low level to the end of 2014. Other countries have also deferred the normalisation of the historically low key rates further ahead. Monetary policy easing has started in many emerging economies.
Since the financial crisis, global economic developments have been marked by short-term forces such as expansion-ary economic policies and a rebound in spending on goods and services in the business and household sectors. Produc-tion costs have been low as a result of a high level of avail-able resources. At the same time, a number of conditions
2
3
4
5
6
7
8
2
3
4
5
6
7
8
Italy Spain
Chart 2.2 Yield spreads against German 2-year government bonds. Percentage points. January 1 2008 – March 9 2012
2008 2009 2010 2011 2012-1
0
1
-1
0
1
Source: Thomson Reuters
45
50
55
60
65
70
75
0
1
2
3
4
Chart 2.1 GDP in advanced economies and emerging markets¹⁾ and global all-industry PMI. GDP: quarterly growth, in per cent, 2006 Q1 – 2011 Q4. PMI: diffusion index centered around 50, January 2006 - February 2012
30
35
40
45
-3
-2
-1
2006 2007 2008 2009 2010 2011 2012
Advanced economies (left-hand scale)
Emerging economies (left-hand scale)
Global all-industry PMI (right-hand scale)
1) GDP-weighted (PPP). Advanced economies: Australia, Canada, euro area, Japan, UK and US. Emerging markets: Argentina, Brazil, India, Indonesia, China, Mexico, Russia, South Africa, South Korea and Turkey.Sources: IMF, Thomson Reuters, Bloomberg and Norges Bank
24
have had a dampening impact on economic growth. In many advanced economies, both the private and public sectors have been deleveraging after many years of rapid debt accumulation (see Chart 2.3). Moreover, tighter lend-ing standards and higher capital requirements will limit the supply of credit from banks. Many countries also have to regain competitive strength after many years of high cost growth prior to the financial crisis. In practice, this implies a long period of low wage growth, where unem-ployment will also remain high as it takes time to shift resources to sectors that yield a higher return. On balance, this will also weigh on growth in the years ahead.
There is considerable uncertainty surrounding develop-ments ahead. The projections in this Report assume that the sovereign debt crisis in Europe does not worsen and that measures by the ECB and other authorities will lead to a gradual improvement. In spite of the recent improve-ment in both financial markets and real economic condi-tions, euro-area output is expected to decline in 2012. There are wide variations within the euro area, with mod-erate growth in France and Germany and declining activ-ity levels in southern European countries. High levels of government debt are forcing many countries to implement austerity progammes, and for the euro area the scope of fiscal tightening is expected to be the same in 2012 as in 2011 (see Chart 2.4). Moreover, banks are tightening lend-ing standards for both businesses and households (see Chart 2.5). Weak developments in the euro area have already affected other parts of Europe, and compared with the October Report growth is also expected to be clearly lower in Sweden and the UK.
Developments have been somewhat more favourable than expected in the US, and the growth forecast for 2012 has been revised up to 2%. Unemployment has continued to drift down to the lowest level in three years and lower consumer price inflation has improved household pur-chasing power. On the other hand, growth in private consumption is projected to edge down between 2011 and 2012. Income growth is set to remain weak and saving is unlikely to fall, as was the case in 2011. Business investment is expected to continue to rise, but is likely to be restrained by the high degree of uncertainty linked to economic developments ahead. The scope of fiscal tightening is assumed to be limited by temporary growth
150
200
250
300
350
150
200
250
300
350US
Japan
UK
Spain
Ireland
Portugal
Chart 2.3 Non-financial private sector gross debt¹⁾. As a percentage of GDP.1980 Q1 – 2011 Q3²⁾
0
50
100
0
50
100
1980 1985 1990 1995 2000 2005 2010
1) Figures for Ireland, Portugal and Spain include debt in public non-financial corporations.2) US to end 2011 Q4Sources: ECB, Thomson Reuters and Norges Bank
0
20
40
60
80
100
0
20
40
60
80
100US
Euro area
Emerging markets
To enterprises
To households
Chart 2.5 Bank lending conditions. Net balance¹⁾.2006 Q1 – 2012 Q4
2006 2007 2008 2009 2010 2011 2012-60
-40
-20
-60
-40
-20
1) Values above 0 indicate tighter lending conditionsSources: Thomson Reuters, Institute of International Finance and Norges Bank
1
1.5
2
2.5
1
1.5
2
2.52011 2012
Chart 2.4 Fiscal tightening. Change in structural budget balance (as a percentage of GDP) from one year earlier. Percentage points
0
0.5
0
0.5
France Italy Spain Germany Euro area UK US
Source: IMF
NORGES BANK MONETARY POLICY REPORT 1/2012 25
measures extended through this year, while a tighter stance is expected next year.
Emerging Asia is feeling the effects of the crisis in Europe through a decline in goods exports. In addition, banks report that lending standards are tighter, partly as a result of a more difficult international funding situation (see Chart 2.5). Overall, net exports made a negative contribution to growth in 2011, while growth in private consumption picked up on the previous year. Continued solid growth in retail trade indicates that growth in private consumption is holding up. Growth forecasts have been revised down somewhat, but growth is still considerably higher than in advanced economies. If growth in advanced economies turns out to be clearly lower than expected, the effects on small, open economies will be amplified. The impact of variations in foreign trade in goods on large countries such as China and India is smaller, but growth in these countries has also stalled.
Overall, growth among Norway’s main trading partners is projected to start recovering gradually from about zero growth around the turn of the year. The recovery will, however, start from a lower level and will be somewhat slower than assumed in the October Report. GDP growth for trading partners as a whole is revised down to 1% in 2012 and 2% in 2013. Lower growth in Europe represents the main drag on growth. Global GDP projections have been revised down to 3¼% in 2012 and 4% in 2013.
Inflation among Norway’s trading partners as a whole has receded somewhat since the October Report, partly reflecting a slower rate of increase in prices for food and energy products. In many advanced economies, however, core inflation has not moved down (see Chart 2.6). Wage growth is moderate among Norway’s main trading part-ners (see Chart 2.7). Looking ahead, inflation is expected to continue to drift down. In advanced economies, high levels of available resources will continue to curb cost growth. For Norway’s trading partners as a whole, con-sumer price inflation has been revised down by ¼ per-centage point to 1¾% in 2012 (see Table 2.2).
Commodity marketsOil prices are slightly above USD 125 per barrel, more than 10% higher than at the time of the October Report.
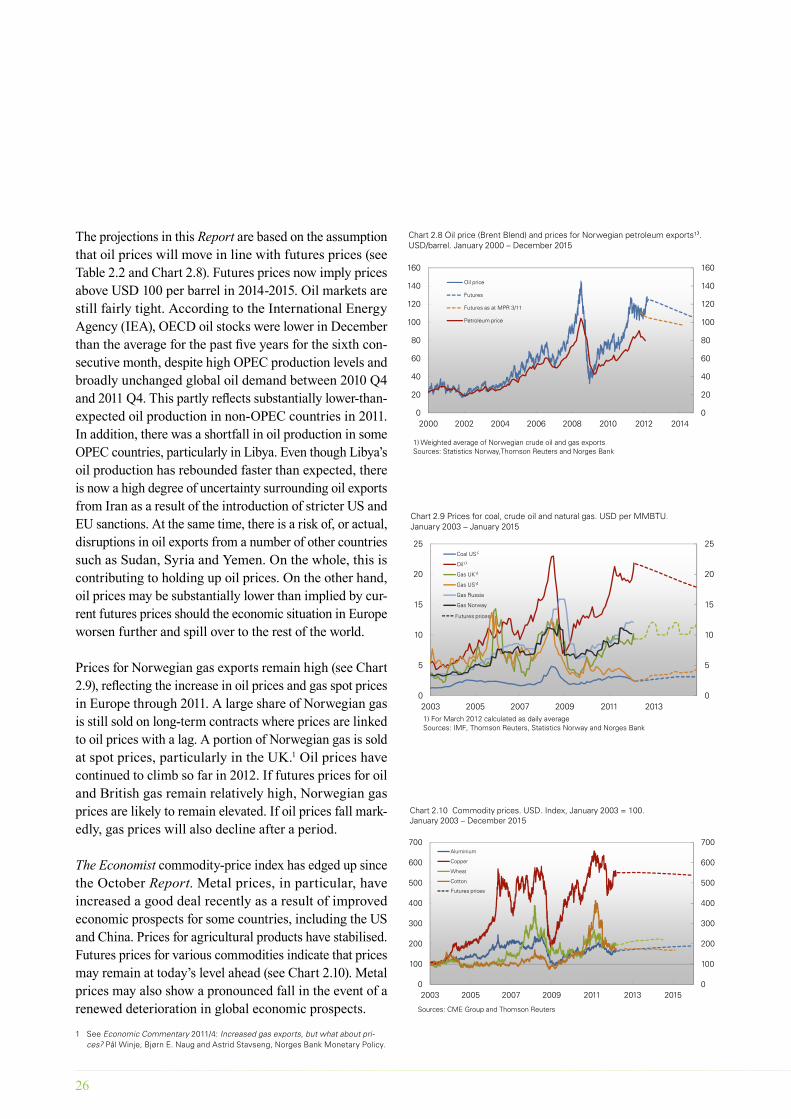
Table 2.2. Projections for consumer prices in other countries (change from previous year, per cent) and oil price. Change from projections in Monetary Policy Report 3/11 in brackets
2012 2013 2014–151)
US 2 (¼) 1¾ (¼) 2
Euro area2) 1¾ (¼) 1½ (0) 1¾
UK 2½ (0) 1¾ (0) 2
Sweden 1½ (-½) 1¾ (-½) 2¼
China 3½ (-¼) 3 (½) 2½
Trading partners3) 1¾ (-¼) 1¾ (0) 2
Oil price Brent Blend4) 121 115 1031) Average annual rise2) Weights from Eurostat (each country’s share of euro area consumption)3) Import weights, 26 largest trading partners4) Futures prices (average for the past five trading days). USD per barrel.
For 2011, an average of spot prices so far this year and futures prices for the rest of the year are used
Sources: Eurostat, Thomson Reuters and Norges Bank
2
4
6
8
10
2
4
6
8
10Advanced economiesEmerging market economiesHeadlineCore prices
Chart 2.6 Consumer prices in advanced economies and emerging markets.¹⁾12-month change. Per cent. January 2006 – January 2012
2006 2007 2008 2009 2010 2011 2012-2
0
2
-2
0
2
1) GDP-weighted (PPP). Advanced economies: Australia, Canada, euro area, Japan, UK and US. Emerging markets: Argentina, Brazil, India, Indonesia, China, Mexico, Russia, South Africa, South Korea and Turkey. Sources: CEIC, IMF, Thomson Reuters and Norges Bank
2
3
4
5
2
3
4
5Euro area
UK
Sweden
US
Chart 2.7 Wages.¹⁾ 12-month change, 3-month moving average. Per cent. January 2006 – January 2012
0
1
0
1
2006 2007 2008 2009 2010 2011 2012
1) Total economy wages. US to end January, UK and Sweden to end December. For the euro area quarterly figures to end 2011 Q4. Source: Thomson Reuters
26
The projections in this Report are based on the assumption that oil prices will move in line with futures prices (see Table 2.2 and Chart 2.8). Futures prices now imply prices above USD 100 per barrel in 2014-2015. Oil markets are still fairly tight. According to the International Energy Agency (IEA), OECD oil stocks were lower in December than the average for the past five years for the sixth con-secutive month, despite high OPEC production levels and broadly unchanged global oil demand between 2010 Q4 and 2011 Q4. This partly reflects substantially lower-than-expected oil production in non-OPEC countries in 2011. In addition, there was a shortfall in oil production in some OPEC countries, particularly in Libya. Even though Libya’s oil production has rebounded faster than expected, there is now a high degree of uncertainty surrounding oil exports from Iran as a result of the introduction of stricter US and EU sanctions. At the same time, there is a risk of, or actual, disruptions in oil exports from a number of other countries such as Sudan, Syria and Yemen. On the whole, this is contributing to holding up oil prices. On the other hand, oil prices may be substantially lower than implied by cur-rent futures prices should the economic situation in Europe worsen further and spill over to the rest of the world.
Prices for Norwegian gas exports remain high (see Chart 2.9), reflecting the increase in oil prices and gas spot prices in Europe through 2011. A large share of Norwegian gas is still sold on long-term contracts where prices are linked to oil prices with a lag. A portion of Norwegian gas is sold at spot prices, particularly in the UK.1 Oil prices have continued to climb so far in 2012. If futures prices for oil and British gas remain relatively high, Norwegian gas prices are likely to remain elevated. If oil prices fall mark-edly, gas prices will also decline after a period.
The Economist commodity-price index has edged up since the October Report. Metal prices, in particular, have increased a good deal recently as a result of improved economic prospects for some countries, including the US and China. Prices for agricultural products have stabilised. Futures prices for various commodities indicate that prices may remain at today’s level ahead (see Chart 2.10). Metal prices may also show a pronounced fall in the event of a renewed deterioration in global economic prospects.
1 See Economic Commentary 2011/4: Increased gas exports, but what about pri-ces? Pål Winje, Bjørn E. Naug and Astrid Stavseng, Norges Bank Monetary Policy.
60
80
100
120
140
160
60
80
100
120
140
160
Chart 2.8 Oil price (Brent Blend) and prices for Norwegian petroleum exports¹⁾.USD/barrel. January 2000 – December 2015
Oil price
Futures
Futures as at MPR 3/11
Petroleum price
0
20
40
0
20
40
2000 2002 2004 2006 2008 2010 2012 2014
1) Weighted average of Norwegian crude oil and gas exportsSources: Statistics Norway,Thomson Reuters and Norges Bank
10
15
20
25
10
15
20
25
Chart 2.9 Prices for coal, crude oil and natural gas. USD per MMBTU.January 2003 – January 2015
Coal US¹⁾
Oil¹⁾
Gas UK¹⁾
Gas US¹⁾
Gas Russia
Gas Norway
Futures prices
0
5
0
5
2003 2005 2007 2009 2011 20131) For March 2012 calculated as daily averageSources: IMF, Thomson Reuters, Statistics Norway and Norges Bank
300
400
500
600
700
300
400
500
600
700Aluminium
Copper
Wheat
Cotton
Chart 2.10 Commodity prices. USD. Index, January 2003 = 100.January 2003 – December 2015
Futures prices
0
100
200
0
100
200
2003 2005 2007 2009 2011 2013 2015
Sources: CME Group and Thomson Reuters
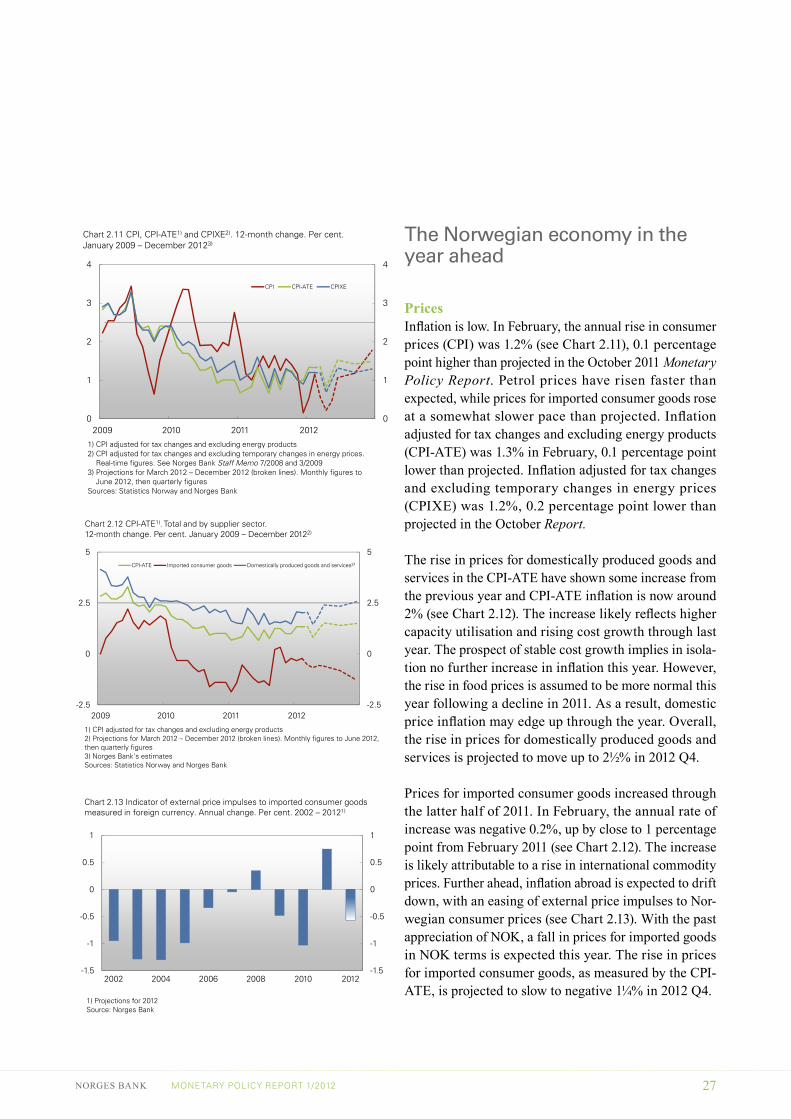
NORGES BANK MONETARY POLICY REPORT 1/2012 27
The Norwegian economy in the year ahead
PricesInflation is low. In February, the annual rise in consumer prices (CPI) was 1.2% (see Chart 2.11), 0.1 percentage point higher than projected in the October 2011 Monetary Policy Report. Petrol prices have risen faster than expected, while prices for imported consumer goods rose at a somewhat slower pace than projected. Inflation adjusted for tax changes and excluding energy products (CPI-ATE) was 1.3% in February, 0.1 percentage point lower than projected. Inflation adjusted for tax changes and excluding temporary changes in energy prices (CPIXE) was 1.2%, 0.2 percentage point lower than projected in the October Report.
The rise in prices for domestically produced goods and services in the CPI-ATE have shown some increase from the previous year and CPI-ATE inflation is now around 2% (see Chart 2.12). The increase likely reflects higher capacity utilisation and rising cost growth through last year. The prospect of stable cost growth implies in isola-tion no further increase in inflation this year. However, the rise in food prices is assumed to be more normal this year following a decline in 2011. As a result, domestic price inflation may edge up through the year. Overall, the rise in prices for domestically produced goods and services is projected to move up to 2½% in 2012 Q4.
Prices for imported consumer goods increased through the latter half of 2011. In February, the annual rate of increase was negative 0.2%, up by close to 1 percentage point from February 2011 (see Chart 2.12). The increase is likely attributable to a rise in international commodity prices. Further ahead, inflation abroad is expected to drift down, with an easing of external price impulses to Nor-wegian consumer prices (see Chart 2.13). With the past appreciation of NOK, a fall in prices for imported goods in NOK terms is expected this year. The rise in prices for imported consumer goods, as measured by the CPI-ATE, is projected to slow to negative 1¼% in 2012 Q4.
1
2
3
4
1
2
3
4
CPI CPI-ATE CPIXE
Chart 2.11 CPI, CPI-ATE1) and CPIXE2). 12-month change. Per cent. January 2009 – December 20123)
002009 2010 2011 2012
1) CPI adjusted for tax changes and excluding energy products2) CPI adjusted for tax changes and excluding temporary changes in energy prices.
Real-time figures. See Norges Bank Staff Memo 7/2008 and 3/20093) Projections for March 2012 – December 2012 (broken lines). Monthly figures to
June 2012, then quarterly figuresSources: Statistics Norway and Norges Bank
0
2.5
5
0
2.5
5
Chart 2.12 CPI-ATE1). Total and by supplier sector. 12-month change. Per cent. January 2009 – December 20122)
CPI-ATE Imported consumer goods Domestically produced goods and services³⁾
-2.5-2.52009 2010 2011 2012
1) CPI adjusted for tax changes and excluding energy products2) Projections for March 2012 – December 2012 (broken lines). Monthly figures to June 2012, then quarterly figures3) Norges Bank's estimatesSources: Statistics Norway and Norges Bank
-0.5
0
0.5
1
-0.5
0
0.5
1
Chart 2.13 Indicator of external price impulses to imported consumer goods measured in foreign currency. Annual change. Per cent. 2002 – 20121)
-1.5
-1
-1.5
-1
2002 2004 2006 2008 2010 2012
1) Projections for 2012Source: Norges Bank
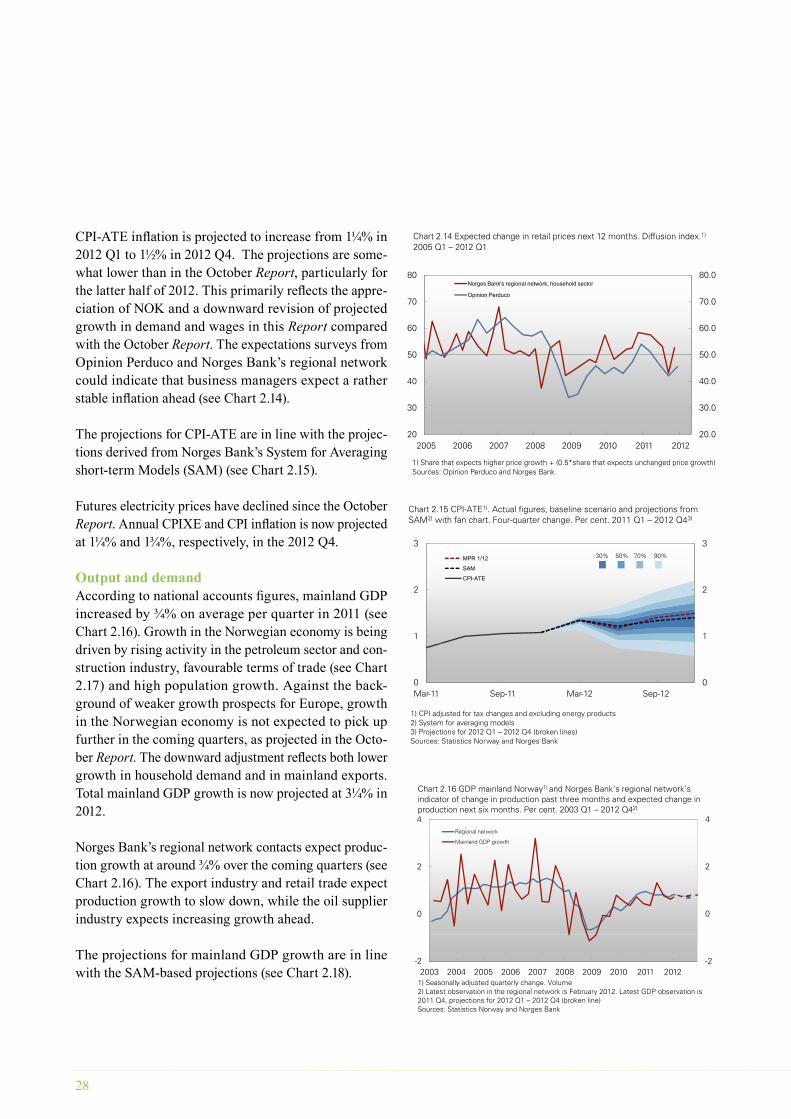
28
CPI-ATE inflation is projected to increase from 1¼% in 2012 Q1 to 1½% in 2012 Q4. The projections are some-what lower than in the October Report, particularly for the latter half of 2012. This primarily reflects the appre-ciation of NOK and a downward revision of projected growth in demand and wages in this Report compared with the October Report. The expectations surveys from Opinion Perduco and Norges Bank’s regional network could indicate that business managers expect a rather stable inflation ahead (see Chart 2.14).
The projections for CPI-ATE are in line with the projec-tions derived from Norges Bank’s System for Averaging short-term Models (SAM) (see Chart 2.15).
Futures electricity prices have declined since the October Report. Annual CPIXE and CPI inflation is now projected at 1¼% and 1¾%, respectively, in the 2012 Q4.
Output and demand According to national accounts figures, mainland GDP increased by ¾% on average per quarter in 2011 (see Chart 2.16). Growth in the Norwegian economy is being driven by rising activity in the petroleum sector and con-struction industry, favourable terms of trade (see Chart 2.17) and high population growth. Against the back-ground of weaker growth prospects for Europe, growth in the Norwegian economy is not expected to pick up further in the coming quarters, as projected in the Octo-ber Report. The downward adjustment reflects both lower growth in household demand and in mainland exports. Total mainland GDP growth is now projected at 3¼% in 2012.
Norges Bank’s regional network contacts expect produc-tion growth at around ¾% over the coming quarters (see Chart 2.16). The export industry and retail trade expect production growth to slow down, while the oil supplier industry expects increasing growth ahead.
The projections for mainland GDP growth are in line with the SAM-based projections (see Chart 2.18).
40.0
50.0
60.0
70.0
80.0
40
50
60
70
80
Chart 2.14 Expected change in retail prices next 12 months. Diffusion index.1)
2005 Q1 – 2012 Q1
Norges Bank's regional network, household sector
Opinion Perduco
20.0
30.0
20
30
2005 2006 2007 2008 2009 2010 2011 2012
1) Share that expects higher price growth + (0.5*share that expects unchanged price growth)Sources: Opinion Perduco and Norges Bank
0
2
4
0
2
4Regional network
Mainland GDP growth
Chart 2.16 GDP mainland Norway1) and Norges Bank's regional network's indicator of change in production past three months and expected change in production next six months. Per cent. 2003 Q1 – 2012 Q42)
-2-22003 2004 2005 2006 2007 2008 2009 2010 2011 2012
1) Seasonally adjusted quarterly change. Volume2) Latest observation in the regional network is February 2012. Latest GDP observation is 2011 Q4, projections for 2012 Q1 – 2012 Q4 (broken line)Sources: Statistics Norway and Norges Bank
1
2
3
1
2
3
MPR 1/12
SAM
CPI-ATE
Chart 2.15 CPI-ATE1). Actual figures, baseline scenario and projections from SAM2) with fan chart. Four-quarter change. Per cent. 2011 Q1 – 2012 Q43)
30% 50% 70% 90%
00Mar-11 Sep-11 Mar-12 Sep-12
1) CPI adjusted for tax changes and excluding energy products2) System for averaging models3) Projections for 2012 Q1 – 2012 Q4 (broken lines)Sources: Statistics Norway and Norges Bank
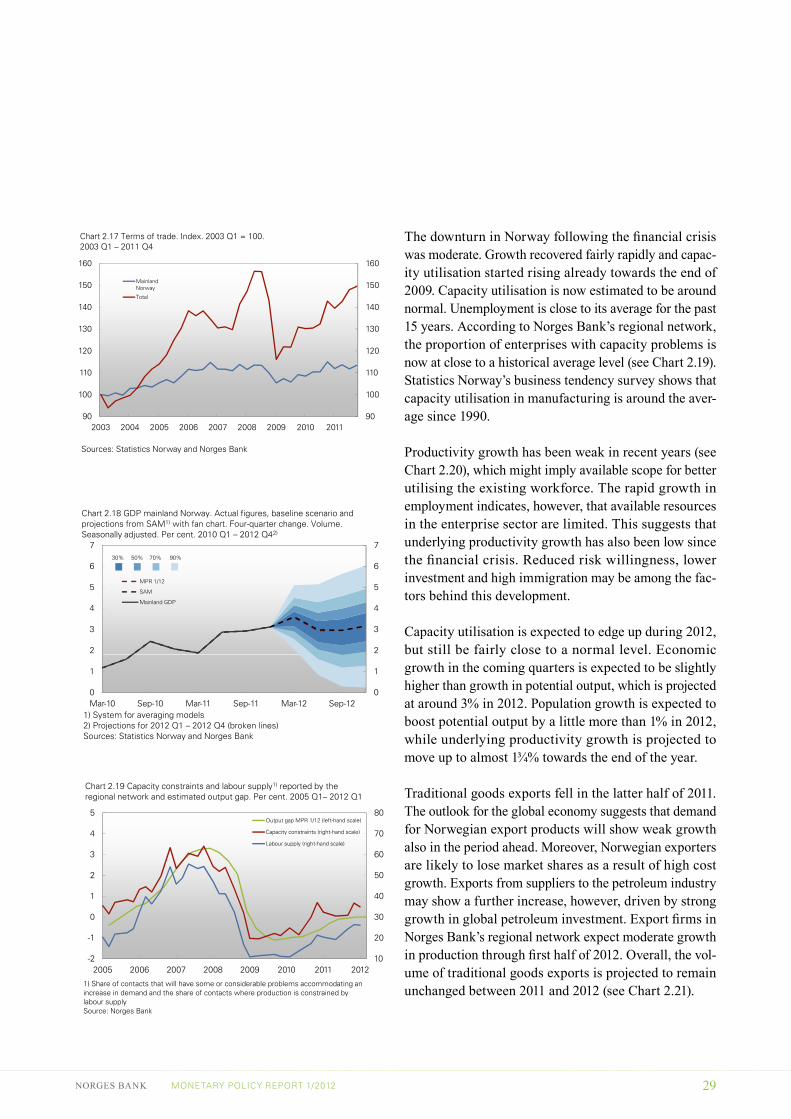
NORGES BANK MONETARY POLICY REPORT 1/2012 29
The downturn in Norway following the financial crisis was moderate. Growth recovered fairly rapidly and capac-ity utilisation started rising already towards the end of 2009. Capacity utilisation is now estimated to be around normal. Unemployment is close to its average for the past 15 years. According to Norges Bank’s regional network, the proportion of enterprises with capacity problems is now at close to a historical average level (see Chart 2.19). Statistics Norway’s business tendency survey shows that capacity utilisation in manufacturing is around the aver-age since 1990.
Productivity growth has been weak in recent years (see Chart 2.20), which might imply available scope for better utilising the existing workforce. The rapid growth in employment indicates, however, that available resources in the enterprise sector are limited. This suggests that underlying productivity growth has also been low since the financial crisis. Reduced risk willingness, lower investment and high immigration may be among the fac-tors behind this development.
Capacity utilisation is expected to edge up during 2012, but still be fairly close to a normal level. Economic growth in the coming quarters is expected to be slightly higher than growth in potential output, which is projected at around 3% in 2012. Population growth is expected to boost potential output by a little more than 1% in 2012, while underlying productivity growth is projected to move up to almost 1¾% towards the end of the year.
Traditional goods exports fell in the latter half of 2011. The outlook for the global economy suggests that demand for Norwegian export products will show weak growth also in the period ahead. Moreover, Norwegian exporters are likely to lose market shares as a result of high cost growth. Exports from suppliers to the petroleum industry may show a further increase, however, driven by strong growth in global petroleum investment. Export firms in Norges Bank’s regional network expect moderate growth in production through first half of 2012. Overall, the vol-ume of traditional goods exports is projected to remain unchanged between 2011 and 2012 (see Chart 2.21).
120
130
140
150
160
120
130
140
150
160
Mainland Norway
Total
Chart 2.17 Terms of trade. Index. 2003 Q1 = 100. 2003 Q1 – 2011 Q4
90
100
110
90
100
110
2003 2004 2005 2006 2007 2008 2009 2010 2011
Sources: Statistics Norway and Norges Bank
2
3
4
5
6
7
2
3
4
5
6
7
MPR 1/12
SAM
Mainland GDP
Chart 2.18 GDP mainland Norway. Actual figures, baseline scenario and projections from SAM1) with fan chart. Four-quarter change. Volume. Seasonally adjusted. Per cent. 2010 Q1 – 2012 Q42)
30% 50% 70% 90%
0
1
0
1
Mar-10 Sep-10 Mar-11 Sep-11 Mar-12 Sep-121) System for averaging models2) Projections for 2012 Q1 – 2012 Q4 (broken lines)Sources: Statistics Norway and Norges Bank
30
40
50
60
70
80
0
1
2
3
4
5Output gap MPR 1/12 (left-hand scale)
Capacity constraints (right-hand scale)
Labour supply (right-hand scale)
Chart 2.19 Capacity constraints and labour supply1) reported by the regional network and estimated output gap. Per cent. 2005 Q1– 2012 Q1
10
20
-2
-1
2005 2006 2007 2008 2009 2010 2011 2012
1) Share of contacts that will have some or considerable problems accommodating an increase in demand and the share of contacts where production is constrained by labour supplySource: Norges Bank
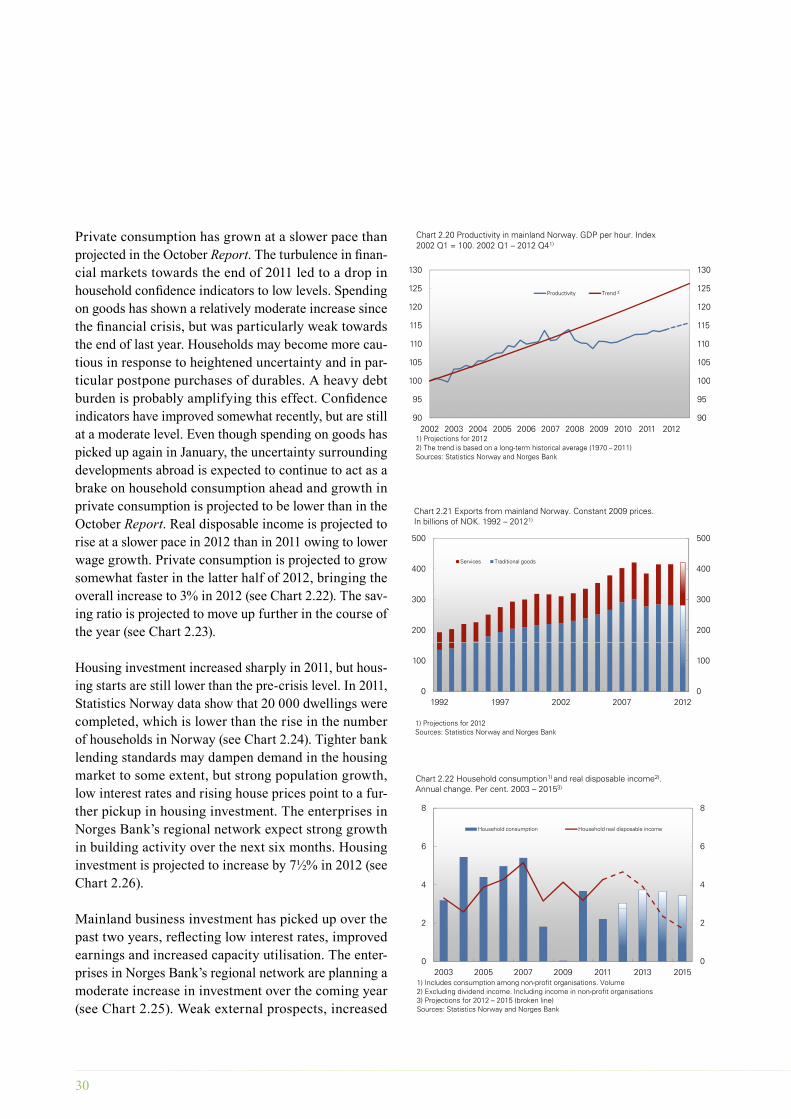
30
Private consumption has grown at a slower pace than projected in the October Report. The turbulence in finan-cial markets towards the end of 2011 led to a drop in household confidence indicators to low levels. Spending on goods has shown a relatively moderate increase since the financial crisis, but was particularly weak towards the end of last year. Households may become more cau-tious in response to heightened uncertainty and in par-ticular postpone purchases of durables. A heavy debt burden is probably amplifying this effect. Confidence indicators have improved somewhat recently, but are still at a moderate level. Even though spending on goods has picked up again in January, the uncertainty surrounding developments abroad is expected to continue to act as a brake on household consumption ahead and growth in private consumption is projected to be lower than in the October Report. Real disposable income is projected to rise at a slower pace in 2012 than in 2011 owing to lower wage growth. Private consumption is projected to grow somewhat faster in the latter half of 2012, bringing the overall increase to 3% in 2012 (see Chart 2.22). The sav-ing ratio is projected to move up further in the course of the year (see Chart 2.23).
Housing investment increased sharply in 2011, but hous-ing starts are still lower than the pre-crisis level. In 2011, Statistics Norway data show that 20 000 dwellings were completed, which is lower than the rise in the number of households in Norway (see Chart 2.24). Tighter bank lending standards may dampen demand in the housing market to some extent, but strong population growth, low interest rates and rising house prices point to a fur-ther pickup in housing investment. The enterprises in Norges Bank’s regional network expect strong growth in building activity over the next six months. Housing investment is projected to increase by 7½% in 2012 (see Chart 2.26).
Mainland business investment has picked up over the past two years, reflecting low interest rates, improved earnings and increased capacity utilisation. The enter-prises in Norges Bank’s regional network are planning a moderate increase in investment over the coming year (see Chart 2.25). Weak external prospects, increased
100
105
110
115
120
125
130
100
105
110
115
120
125
130
Productivity Trend ²⁾
Chart 2.20 Productivity in mainland Norway. GDP per hour. Index 2002 Q1 = 100. 2002 Q1 – 2012 Q41)
90
95
100
90
95
100
2002 2003 2004 2005 2006 2007 2008 2009 2010 2011 20121) Projections for 20122) The trend is based on a long-term historical average (1970 – 2011)Sources: Statistics Norway and Norges Bank
200
300
400
500
200
300
400
500
Services Traditional goods
Chart 2.21 Exports from mainland Norway. Constant 2009 prices. In billions of NOK. 1992 – 20121)
0
100
0
100
1992 1997 2002 2007 2012
1) Projections for 2012Sources: Statistics Norway and Norges Bank
4
6
8
4
6
8
Household consumption Household real disposable income
Chart 2.22 Household consumption1) and real disposable income2). Annual change. Per cent. 2003 – 20153)
0
2
2003 2005 2007 2009 2011 2013 20150
2
1) Includes consumption among non-profit organisations. Volume2) Excluding dividend income. Including income in non-profit organisations3) Projections for 2012 – 2015 (broken line)Sources: Statistics Norway and Norges Bank
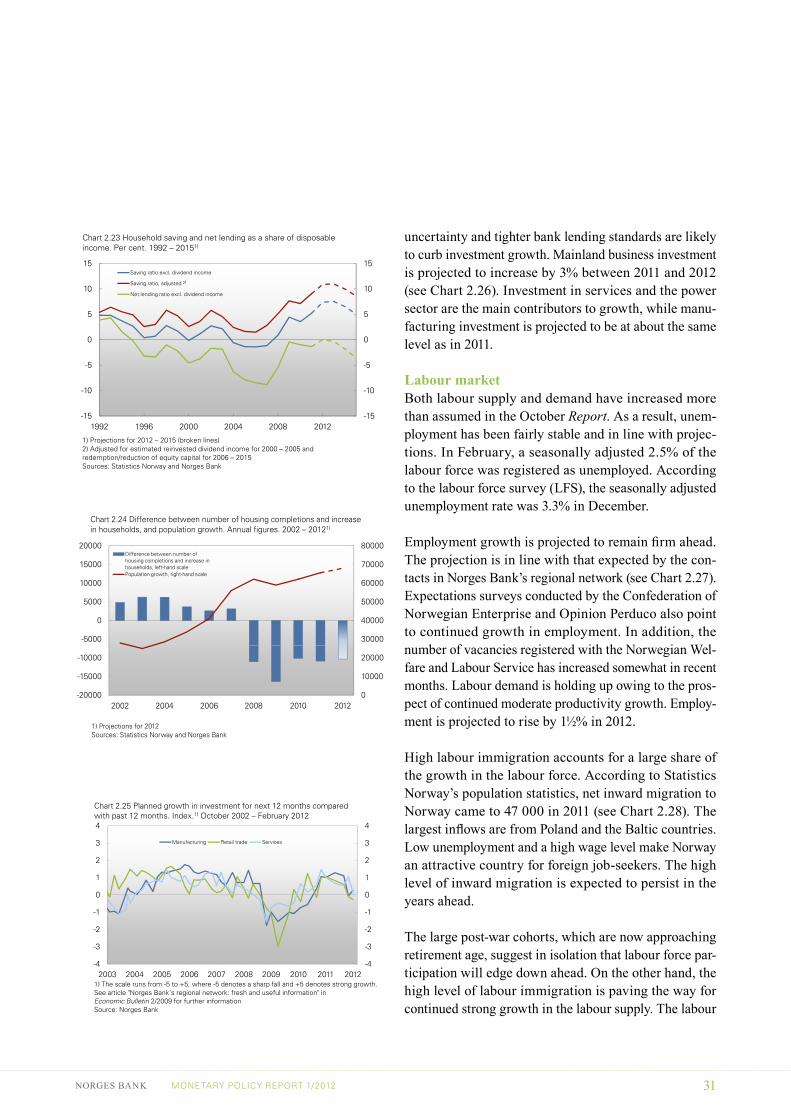
NORGES BANK MONETARY POLICY REPORT 1/2012 31
uncertainty and tighter bank lending standards are likely to curb investment growth. Mainland business investment is projected to increase by 3% between 2011 and 2012 (see Chart 2.26). Investment in services and the power sector are the main contributors to growth, while manu-facturing investment is projected to be at about the same level as in 2011.
Labour market Both labour supply and demand have increased more than assumed in the October Report. As a result, unem-ployment has been fairly stable and in line with projec-tions. In February, a seasonally adjusted 2.5% of the labour force was registered as unemployed. According to the labour force survey (LFS), the seasonally adjusted unemployment rate was 3.3% in December.
Employment growth is projected to remain firm ahead. The projection is in line with that expected by the con-tacts in Norges Bank’s regional network (see Chart 2.27). Expectations surveys conducted by the Confederation of Norwegian Enterprise and Opinion Perduco also point to continued growth in employment. In addition, the number of vacancies registered with the Norwegian Wel-fare and Labour Service has increased somewhat in recent months. Labour demand is holding up owing to the pros-pect of continued moderate productivity growth. Employ-ment is projected to rise by 1½% in 2012.
High labour immigration accounts for a large share of the growth in the labour force. According to Statistics Norway’s population statistics, net inward migration to Norway came to 47 000 in 2011 (see Chart 2.28). The largest inflows are from Poland and the Baltic countries. Low unemployment and a high wage level make Norway an attractive country for foreign job-seekers. The high level of inward migration is expected to persist in the years ahead.
The large post-war cohorts, which are now approaching retirement age, suggest in isolation that labour force par-ticipation will edge down ahead. On the other hand, the high level of labour immigration is paving the way for continued strong growth in the labour supply. The labour
-5
0
5
10
15
-5
0
5
10
15Saving ratio excl. dividend income
Saving ratio, adjusted ²⁾
Net lending ratio excl. dividend income
Chart 2.23 Household saving and net lending as a share of disposable income. Per cent. 1992 – 20151)
-15
-10
1992 1996 2000 2004 2008 2012-15
-10
1) Projections for 2012 – 2015 (broken lines)2) Adjusted for estimated reinvested dividend income for 2000 – 2005 and redemption/reduction of equity capital for 2006 – 2015Sources: Statistics Norway and Norges Bank
30000
40000
50000
60000
70000
80000
-5000
0
5000
10000
15000
20000Difference between number of housing completions and increase in households, left-hand scalePopulation growth, right-hand scale
Chart 2.24 Difference between number of housing completions and increasein households, and population growth. Annual figures. 2002 – 20121)
2002 2004 2006 2008 2010 20120
10000
20000
-20000
-15000
-10000
1) Projections for 2012Sources: Statistics Norway and Norges Bank
3
-2
-1
0
1
2
3
4
3
-2
-1
0
1
2
3
4
Manufacturing Retail trade Services
Chart 2.25 Planned growth in investment for next 12 months compared with past 12 months. Index.1) October 2002 – February 2012
-4
-3
-4
-3
2003 2004 2005 2006 2007 2008 2009 2010 2011 20121) The scale runs from -5 to +5, where -5 denotes a sharp fall and +5 denotes strong growth. See article "Norges Bank's regional network: fresh and useful information" in Economic Bulletin 2/2009 for further informationSource: Norges Bank
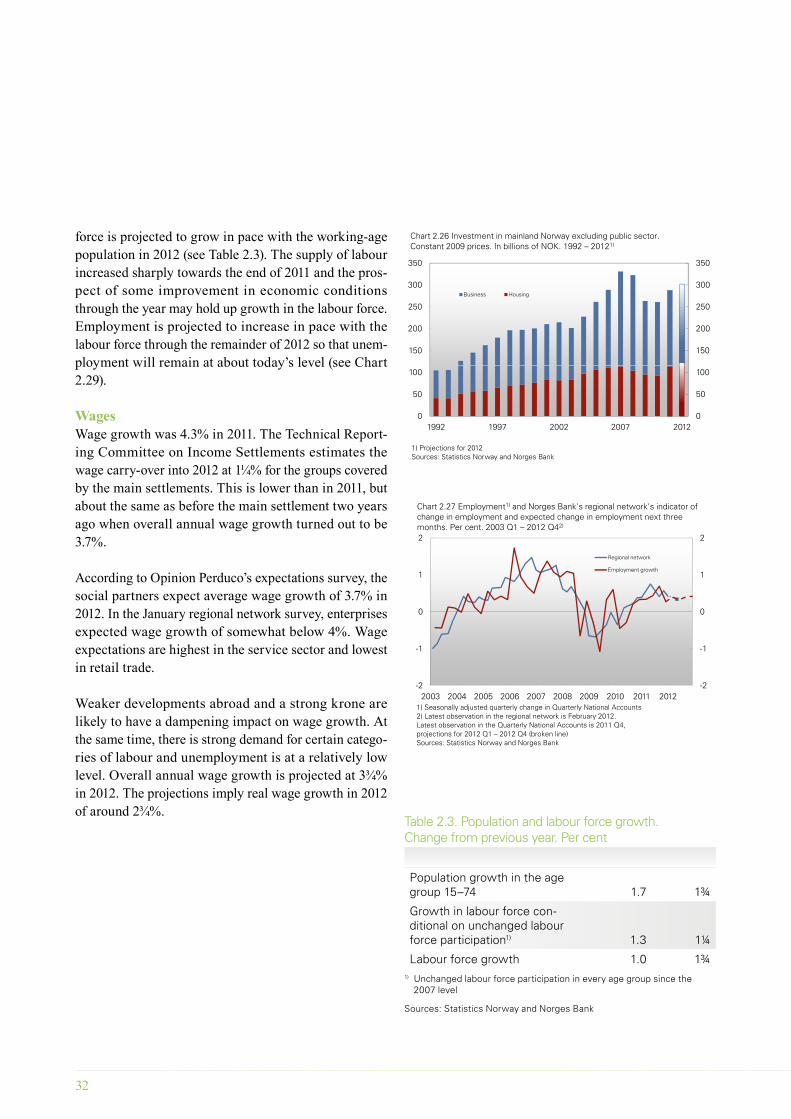
32
force is projected to grow in pace with the working-age population in 2012 (see Table 2.3). The supply of labour increased sharply towards the end of 2011 and the pros-pect of some improvement in economic conditions through the year may hold up growth in the labour force. Employment is projected to increase in pace with the labour force through the remainder of 2012 so that unem-ployment will remain at about today’s level (see Chart 2.29).
WagesWage growth was 4.3% in 2011. The Technical Report-ing Committee on Income Settlements estimates the wage carry-over into 2012 at 1¼% for the groups covered by the main settlements. This is lower than in 2011, but about the same as before the main settlement two years ago when overall annual wage growth turned out to be 3.7%.
According to Opinion Perduco’s expectations survey, the social partners expect average wage growth of 3.7% in 2012. In the January regional network survey, enterprises expected wage growth of somewhat below 4%. Wage expectations are highest in the service sector and lowest in retail trade.
Weaker developments abroad and a strong krone are likely to have a dampening impact on wage growth. At the same time, there is strong demand for certain catego-ries of labour and unemployment is at a relatively low level. Overall annual wage growth is projected at 3¾% in 2012. The projections imply real wage growth in 2012 of around 2¾%.
150
200
250
300
350
150
200
250
300
350
Business Housing
Chart 2.26 Investment in mainland Norway excluding public sector. Constant 2009 prices. In billions of NOK. 1992 – 20121)
0
50
100
0
50
100
1992 1997 2002 2007 2012
1) Projections for 2012Sources: Statistics Norway and Norges Bank
-1
0
1
2
-1
0
1
2
Regional network
Employment growth
Chart 2.27 Employment1) and Norges Bank's regional network's indicator of change in employment and expected change in employment next three months. Per cent. 2003 Q1 – 2012 Q42)
-2
1
-2
1
2003 2004 2005 2006 2007 2008 2009 2010 2011 20121) Seasonally adjusted quarterly change in Quarterly National Accounts2) Latest observation in the regional network is February 2012. Latest observation in the Quarterly National Accounts is 2011 Q4, projections for 2012 Q1 – 2012 Q4 (broken line)Sources: Statistics Norway and Norges Bank
Table 2.3. Population and labour force growth. Change from previous year. Per cent
2011 2012
Population growth in the age group 15–74 1.7 1¾
Growth in labour force con-ditional on unchanged labour force participation1) 1.3 1¼
Labour force growth 1.0 1¾1) Unchanged labour force participation in every age group since the
2007 level
Sources: Statistics Norway and Norges Bank
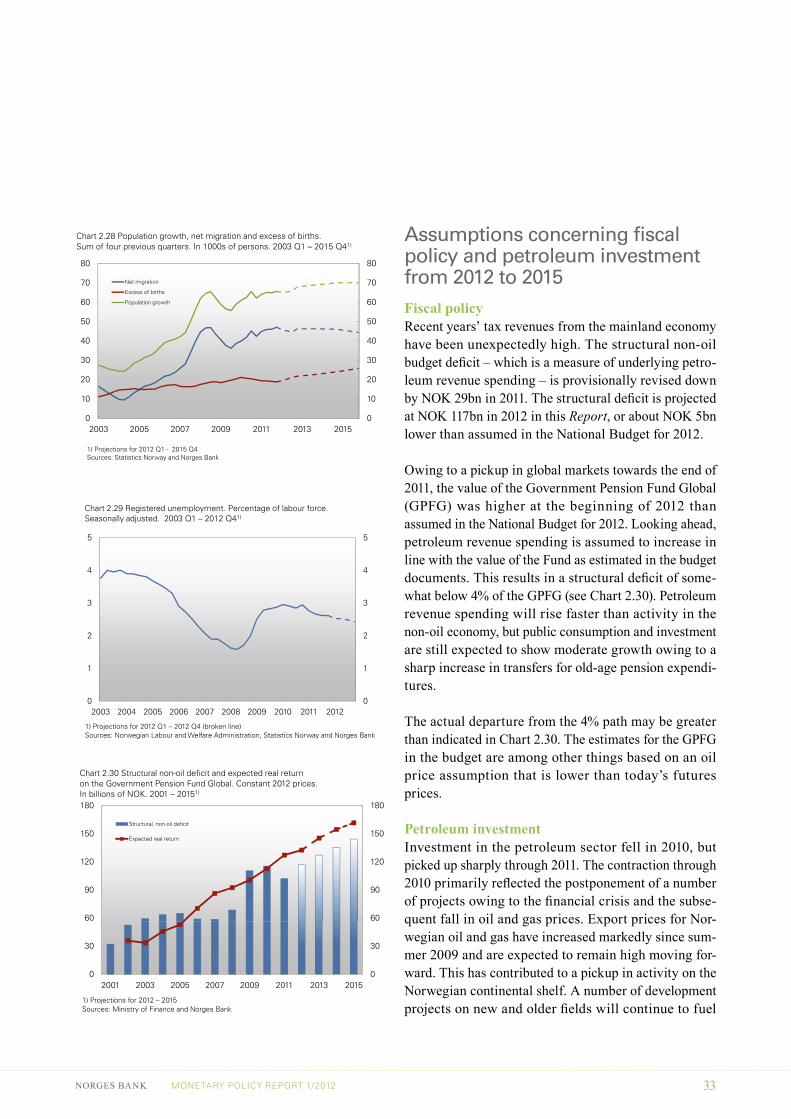
NORGES BANK MONETARY POLICY REPORT 1/2012 33
Assumptions concerning fiscal policy and petroleum investment from 2012 to 2015Fiscal policyRecent years’ tax revenues from the mainland economy have been unexpectedly high. The structural non-oil budget deficit – which is a measure of underlying petro-leum revenue spending – is provisionally revised down by NOK 29bn in 2011. The structural deficit is projected at NOK 117bn in 2012 in this Report, or about NOK 5bn lower than assumed in the National Budget for 2012.
Owing to a pickup in global markets towards the end of 2011, the value of the Government Pension Fund Global (GPFG) was higher at the beginning of 2012 than assumed in the National Budget for 2012. Looking ahead, petroleum revenue spending is assumed to increase in line with the value of the Fund as estimated in the budget documents. This results in a structural deficit of some-what below 4% of the GPFG (see Chart 2.30). Petroleum revenue spending will rise faster than activity in the non-oil economy, but public consumption and investment are still expected to show moderate growth owing to a sharp increase in transfers for old-age pension expendi-tures.
The actual departure from the 4% path may be greater than indicated in Chart 2.30. The estimates for the GPFG in the budget are among other things based on an oil price assumption that is lower than today’s futures prices.
Petroleum investmentInvestment in the petroleum sector fell in 2010, but picked up sharply through 2011. The contraction through 2010 primarily reflected the postponement of a number of projects owing to the financial crisis and the subse-quent fall in oil and gas prices. Export prices for Nor-wegian oil and gas have increased markedly since sum-mer 2009 and are expected to remain high moving for-ward. This has contributed to a pickup in activity on the Norwegian continental shelf. A number of development projects on new and older fields will continue to fuel
30
40
50
60
70
80
30
40
50
60
70
80
Net migration
Excess of births
Population growth
Chart 2.28 Population growth, net migration and excess of births. Sum of four previous quarters. In 1000s of persons. 2003 Q1 – 2015 Q41)
0
10
20
0
10
20
2003 2005 2007 2009 2011 2013 2015
1) Projections for 2012 Q1 - 2015 Q4 Sources: Statistics Norway and Norges Bank
2
3
4
5
2
3
4
5
Chart 2.29 Registered unemployment. Percentage of labour force. Seasonally adjusted. 2003 Q1 – 2012 Q41)
0
1
0
1
2003 2004 2005 2006 2007 2008 2009 2010 2011 2012
1) Projections for 2012 Q1 – 2012 Q4 (broken line)Sources: Norwegian Labour and Welfare Administration, Statistics Norway and Norges Bank
60
90
120
150
180
60
90
120
150
180
Chart 2.30 Structural non-oil deficit and expected real return on the Government Pension Fund Global. Constant 2012 prices. In billions of NOK. 2001 – 20151)
Structural, non-oil deficit
Expected real return
0
30
0
30
2001 2003 2005 2007 2009 2011 2013 2015
1) Projections for 2012 – 2015Sources: Ministry of Finance and Norges Bank
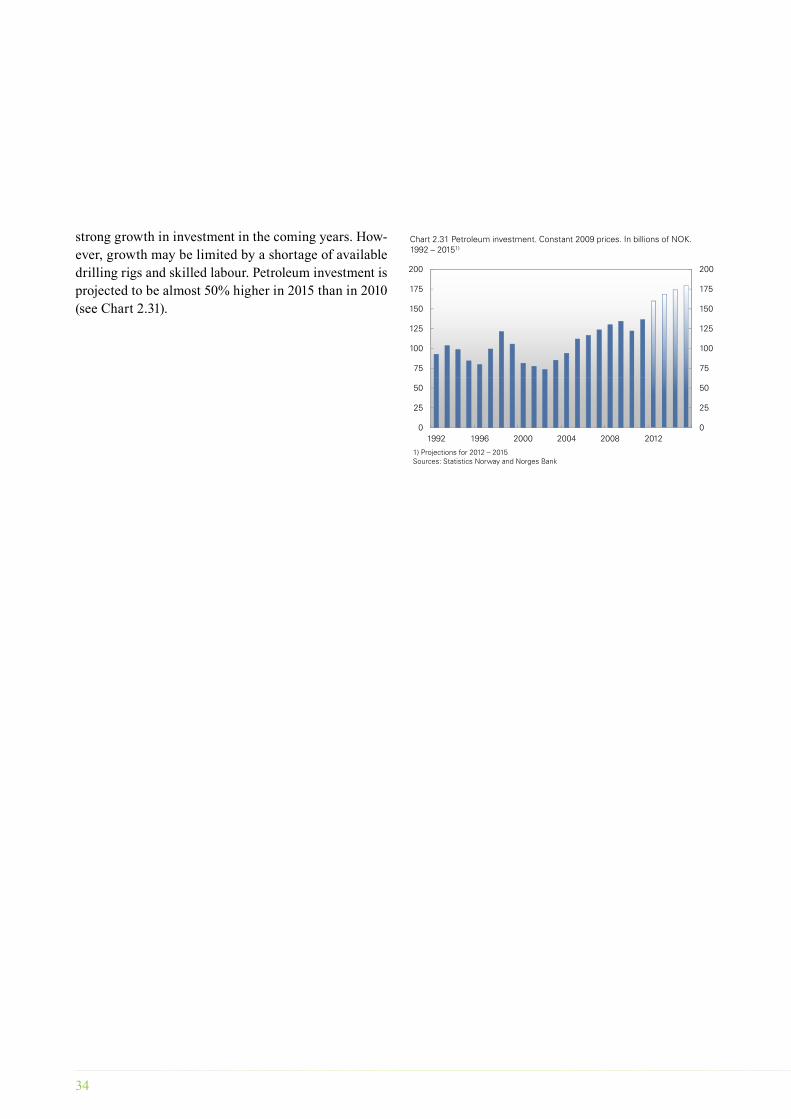
34
strong growth in investment in the coming years. How-ever, growth may be limited by a shortage of available drilling rigs and skilled labour. Petroleum investment is projected to be almost 50% higher in 2015 than in 2010 (see Chart 2.31).
75
100
125
150
175
200
75
100
125
150
175
200
Chart 2.31 Petroleum investment. Constant 2009 prices. In billions of NOK.1992 – 20151)
0
25
50
0
25
50
1992 1996 2000 2004 2008 2012
1) Projections for 2012 – 2015Sources: Statistics Norway and Norges Bank

NORGES BANK MONETARY POLICY REPORT 1/2012 35
Box
Evaluation of the projections for 2011
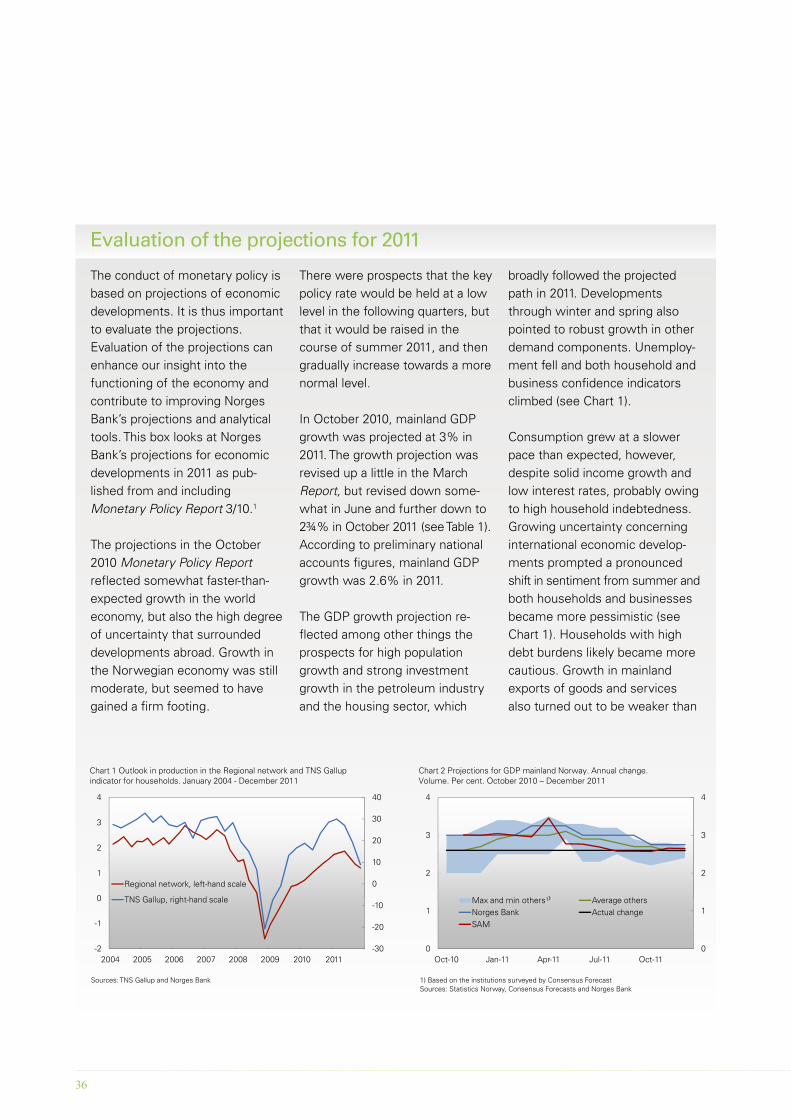
36
The conduct of monetary policy is based on projections of economic developments. It is thus important to evaluate the projections. Evaluation of the projections can enhance our insight into the functioning of the economy and contribute to improving Norges Bank’s projections and analytical tools. This box looks at Norges Bank’s projections for economic developments in 2011 as pub-lished from and including Monetary Policy Report 3/10.1
The projections in the October 2010 Monetary Policy Report reflected somewhat faster-than-expected growth in the world economy, but also the high degree of uncertainty that surrounded developments abroad. Growth in the Norwegian economy was still moderate, but seemed to have gained a firm footing.
There were prospects that the key policy rate would be held at a low level in the following quarters, but that it would be raised in the course of summer 2011, and then gradually increase towards a more normal level.
In October 2010, mainland GDP growth was projected at 3% in 2011. The growth projection was revised up a little in the March Report, but revised down some-what in June and further down to 2¾% in October 2011 (see Table 1). According to preliminary national accounts figures, mainland GDP growth was 2.6% in 2011.
The GDP growth projection re-flected among other things the prospects for high population growth and strong investment growth in the petroleum industry and the housing sector, which
broadly followed the projected path in 2011. Developments through winter and spring also pointed to robust growth in other demand components. Unemploy-ment fell and both household and business confidence indicators climbed (see Chart 1).
Consumption grew at a slower pace than expected, however, despite solid income growth and low interest rates, probably owing to high household indebtedness. Growing uncertainty concerning international economic develop-ments prompted a pronounced shift in sentiment from summer and both households and businesses became more pessimistic (see Chart 1). Households with high debt burdens likely became more cautious. Growth in mainland exports of goods and services also turned out to be weaker than
Evaluation of the projections for 2011
0
10
20
30
40
0
1
2
3
4
Regional network, left-hand scale
TNS G ll i h h d l
Chart 1 Outlook in production in the Regional network and TNS Gallup indicator for households. January 2004 - December 2011
-30
-20
-10
-2
-1
0
2004 2005 2006 2007 2008 2009 2010 2011
Sources: TNS Gallup and Norges Bank
TNS Gallup, right-hand scale
2
3
4
2
3
4
⁾
Chart 2 Projections for GDP mainland Norway. Annual change. Volume. Per cent. October 2010 – December 2011
0
1
0
1
Oct-10 Jan-11 Apr-11 Jul-11 Oct-11
1) Based on the institutions surveyed by Consensus Forecast Sources: Statistics Norway, Consensus Forecasts and Norges Bank
Max and min others¹⁾ Average othersNorges Bank Actual changeSAM
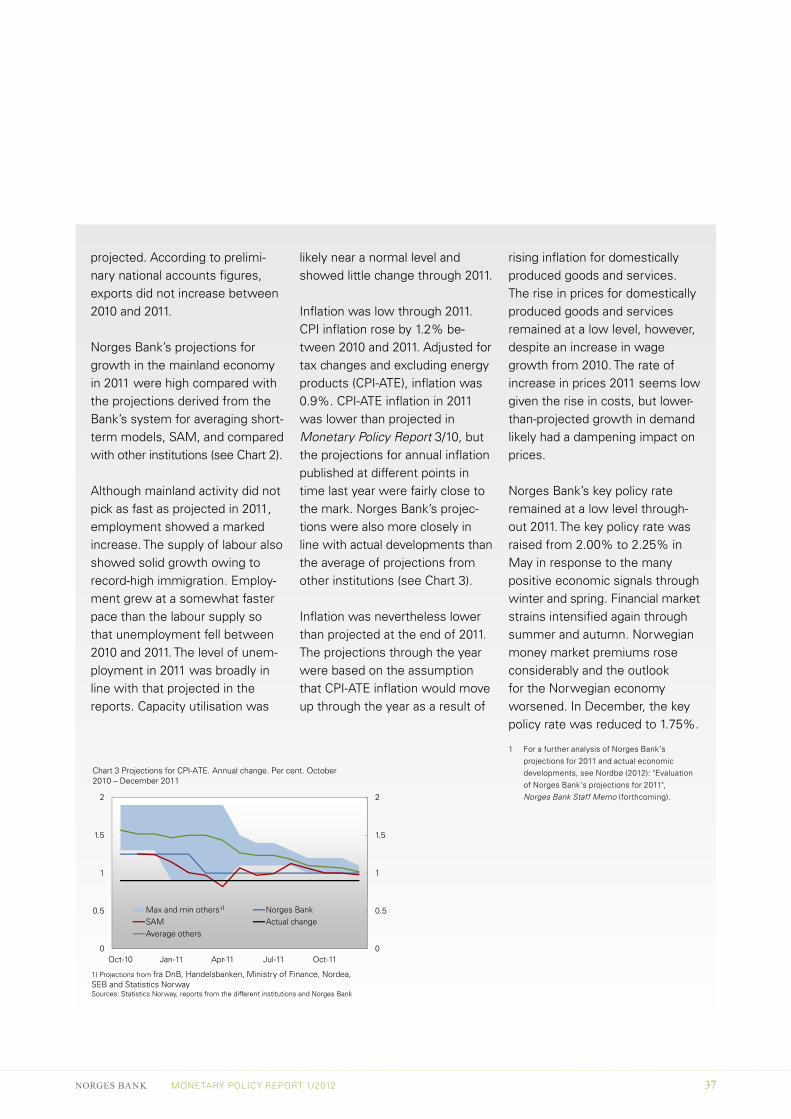
NORGES BANK MONETARY POLICY REPORT 1/2012 37
projected. According to prelimi-nary national accounts figures, exports did not increase between 2010 and 2011.
Norges Bank’s projections for growth in the mainland economy in 2011 were high compared with the projections derived from the Bank’s system for averaging short-term models, SAM, and compared with other institutions (see Chart 2).
Although mainland activity did not pick as fast as projected in 2011, employment showed a marked increase. The supply of labour also showed solid growth owing to record-high immigration. Employ-ment grew at a somewhat faster pace than the labour supply so that unemployment fell between 2010 and 2011. The level of unem-ployment in 2011 was broadly in line with that projected in the reports. Capacity utilisation was
likely near a normal level and showed little change through 2011.
Inflation was low through 2011. CPI inflation rose by 1.2% be-tween 2010 and 2011. Adjusted for tax changes and excluding energy products (CPI-ATE), inflation was 0.9%. CPI-ATE inflation in 2011 was lower than projected in Monetary Policy Report 3/10, but the projections for annual inflation published at different points in time last year were fairly close to the mark. Norges Bank’s projec-tions were also more closely in line with actual developments than the average of projections from other institutions (see Chart 3).
Inflation was nevertheless lower than projected at the end of 2011. The projections through the year were based on the assumption that CPI-ATE inflation would move up through the year as a result of
rising inflation for domestically produced goods and services. The rise in prices for domestically produced goods and services remained at a low level, however, despite an increase in wage growth from 2010. The rate of increase in prices 2011 seems low given the rise in costs, but lower-than-projected growth in demand likely had a dampening impact on prices.
Norges Bank’s key policy rate remained at a low level through-out 2011. The key policy rate was raised from 2.00% to 2.25% in May in response to the many positive economic signals through winter and spring. Financial market strains intensified again through summer and autumn. Norwegian money market premiums rose considerably and the outlook for the Norwegian economy worsened. In December, the key policy rate was reduced to 1.75%.
1 For a further analysis of Norges Bank’s projections for 2011 and actual economic developments, see Nordbø (2012): "Evaluation of Norges Bank’s projections for 2011", Norges Bank Staff Memo (forthcoming).
1
1.5
2
1
1.5
2
Chart 3 Projections for CPI-ATE. Annual change. Per cent. October 2010 – December 2011
0
0.5
0
0.5
Oct-10 Jan-11 Apr-11 Jul-11 Oct-11
1) Projections from fra DnB, Handelsbanken, Ministry of Finance, Nordea, SEB and Statistics NorwaySources: Statistics Norway, reports from the different institutions and Norges Bank
Max and min others¹⁾ Norges BankSAM Actual changeAverage others
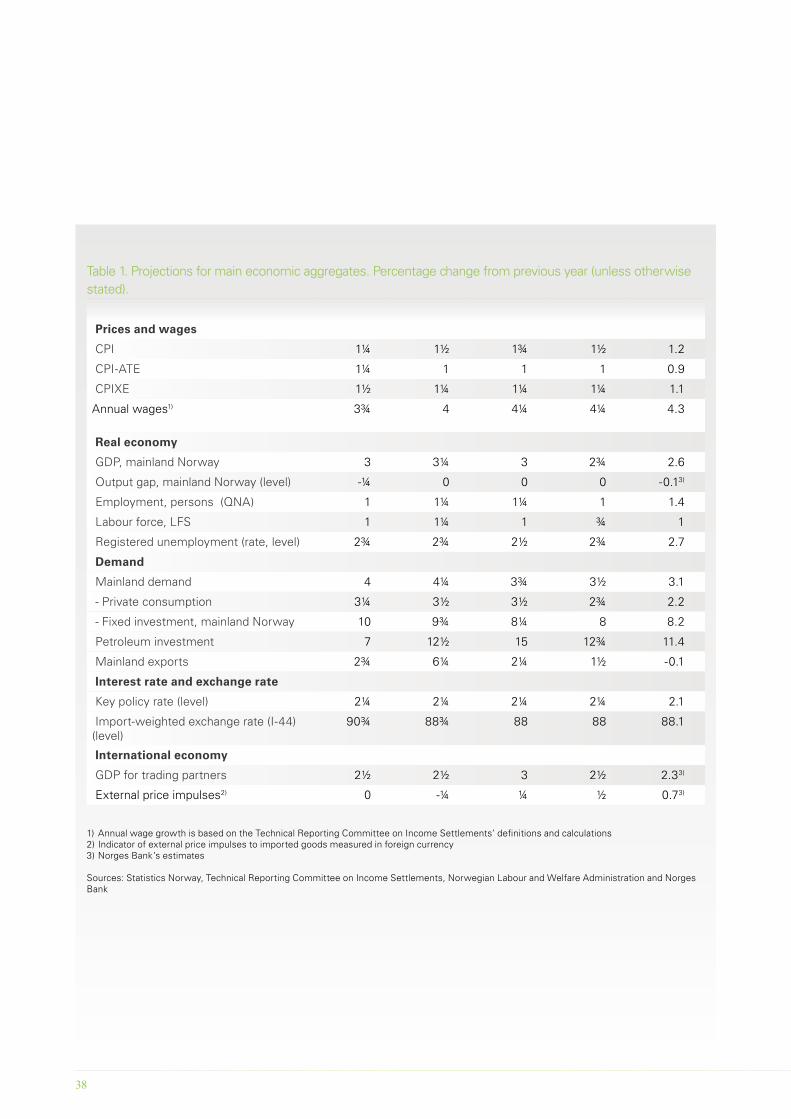
38
Table 1. Projections for main economic aggregates. Percentage change from previous year (unless otherwise stated).
MPR 3/10 MPR 1/11 MPR 2/11 MPR 3/11 Actual
Prices and wages
CPI 1¼ 1½ 1¾ 1½ 1.2
CPI-ATE 1¼ 1 1 1 0.9
CPIXE 1½ 1¼ 1¼ 1¼ 1.1
Annual wages1) 3¾ 4 4¼ 4¼ 4.3
Real economy
GDP, mainland Norway 3 3¼ 3 2¾ 2.6
Output gap, mainland Norway (level) -¼ 0 0 0 -0.13)
Employment, persons (QNA) 1 1¼ 1¼ 1 1.4
Labour force, LFS 1 1¼ 1 ¾ 1
Registered unemployment (rate, level) 2¾ 2¾ 2½ 2¾ 2.7
Demand
Mainland demand 4 4¼ 3¾ 3½ 3.1
- Private consumption 3¼ 3½ 3½ 2¾ 2.2
- Fixed investment, mainland Norway 10 9¾ 8¼ 8 8.2
Petroleum investment 7 12½ 15 12¾ 11.4
Mainland exports 2¾ 6¼ 2¼ 1½ -0.1
Interest rate and exchange rate
Key policy rate (level) 2¼ 2¼ 2¼ 2¼ 2.1
Import-weighted exchange rate (I-44) (level)
90¾ 88¾ 88 88 88.1
International economy
GDP for trading partners 2½ 2½ 3 2½ 2.33)
External price impulses2) 0 -¼ ¼ ½ 0.73)
1) Annual wage growth is based on the Technical Reporting Committee on Income Settlements’ definitions and calculations2) Indicator of external price impulses to imported goods measured in foreign currency3) Norges Bank’s estimates
Sources: Statistics Norway, Technical Reporting Committee on Income Settlements, Norwegian Labour and Welfare Administration and Norges Bank
NORGES BANK MONETARY POLICY REPORT 1/2012 39
Annex
Boxes 2006 – 2012
Publications 2009 – 2012 on Norges Bank's website
Regional network: enterprises and organisations interviewed
Monetary policy meetings
Tables and detailed projections

40
NORGES BANK MONETARY POLICY REPORT 1/2012 41
1/2012Evaluation of the projections for 2011
3/2011The system for managing bank reserves
1/2011Population growth and labour immigrationEvaluation of the projections for 2010
3/2010Why are long-term interest rates so low?CPIM: A model-based indicator of underlying inflation
2/2010Criteria for an appropriate interest rate path
1/2010The level of the normal interest rateEvaluation of the projections for 2009
3/2009Unwinding of extraordinary measuresCPI adjusted for the frequency of price changes
2/2009:The arrangement for the exchange of government securities for bondsStructural liquidityHousehold behaviour
1/2009:Deep downturn in the global economyEvaluation of the projections for 2008
3/2008:The NIBOR marketNorwegian financial crisis measuresHow does the financial crisis affect developments in the real economy?A summary of financial market events since June
2/2008:Underlying inflationSAM - System of models for short-term forecasting
1/2008:Factors driving the rise in domestic and global food pricesCross-checks for the krone exchange rateEvaluation of the projections for 2007
3/2007:Liquidity management in Norges Bank Central bank response to financial turbulenceHousehold saving Fiscal policy and local government financesHigh petroleum investmentNEMO - a new projection and monetary policy analy-sis model
2/2007:Is global inflation on the rise? Developments in productivity growth How often do firms change their prices?
1/2007:Will the global economy be affected by a slowdown in the US?Uncertainty surrounding wage growth ahead Competition and prices Evaluation of projections for 2006
3/2006:Output gap uncertainty
2/2006:Money, credit and prices – a monetary cross-check Foreign labour in Norway Short-term forecasts for mainland GDP in Norway
1/2006:Choice of interest rate path in the work on forecasting Productivity growth in Norway The yield curve and economic outlook in the US Evaluation of Norges Bank’s projections for 2005
Boxes 2006 – 2012
42
Publications 2009 – 2012 on Norges Bank's website
Economic CommentariesThis series consists of short, signed articles on current economic issues.
4/2012 The G20 and international economic cooperation. Ingimundur Fridriksson3/2012 The petroleum fund mechanism and Norges Bank’s foreign exchange purchases for the GPFG.
Ellen Aamodt 2/2012 Sammenhengen mellom styringsrenten og pengemarkedsrentene: 2007–2012. Tom Bernhardsen 1/2012 Misunderstood central bank reserves. Tom Bernhardsen og Arne Kloster 6/2011 Calculating the need for housing in Norway . Birgitte Hovdan Molden 5/2011 The composition of Norwegian banks’ funding and the effect of risk premiums on bank lending rates
Erna Hoff 4/2011 Increased gas exports, but what about prices? Pål Winje, Bjørn E. Naug og Astrid Stavseng 3/2011 Liquidity in the foreign exchange market for EUR/NOK. Kathrine Lund2/2011 Distribution of household debt burden across age groups. Haakon Solheim and Bjørn Helge Vatne 1/2011 Om nye virkemidler i pengepolitikken. Avgrensning mellom pengepolitikken og finanspolitikken.
Ragna Alstadheim. Norwegian only.7/2010 The Norwegian market for government securities and covered bonds in view of new liquidity buffer
requirements for banks. Haseeb Syed6/2010 CPIM: a model-based indicator of underlying inflation. Marius Hov5/2010 Stress testing in Norges Bank before and during the crisis – an overview. Gøril B. Havro4/2010 Asset prices, investment, credit and financial vulnerability. Magdalena D. Riiser3/2010 What determines developments in US long-term interest rates over time? Erlend Hellum2/2010 Public finances – the difficult path back to sustainable levels. Unni Larsen and Bente Støholen1/2010 What is the level of the normal interest rate? Tom Bernhardsen and Arne Kloster9/2009 Housing and debt. Bjørn Helge Vatne 8/2009 Emerging market economies – an ever more important driver for the global economy. Sofie Jebsen,
Unni Larsen and Bente Støholen 7/2009 CPI-FW: a frequency weighted indicator of underlying inflation. Agnes Marie Simensen and
Fredrik Wulfsberg6/2009 Temporary halt in labour migration to Norway? Kaj W. Halvorsen, Marie Norum Lerbak and
Haakon Solheim
Staff MemoStaff Memos present reports and documentation written by staff members and affiliates of Norges Bank.
9/2012 Da Norge forlot gullet: Norges Bank og kurspolitikken 1931–1933. Tine Petersen 8/2012 Norges Bank’s output gap estimates. Marianne Sturød and Kåre Hagelund 7/2012 Nærmere om Norges Banks anslag på produksjonsgapet. Marianne Sturød og Kåre Hagelund 6/2012 Background information, annual address 2012. Norges Bank Monetary Policy 5/2012 Dokumentasjon av enkelte beregninger til årstalen 2012. Norges Bank Pengepolitikk 4/2012 Kan finansiell stabilitet måles? En stressindeks for den norske banksektoren. Hanna Winje
NORGES BANK MONETARY POLICY REPORT 1/2012 43
3/2012 ”til Christiania for at søge Forlindring i de store Tyngsler”: Bondetogene på Østlandet og bøndenes motstand mot skattepolitikken i 1818. Sonja Serina Finstad Johansson
2/2012 The financial accelerator and the real economy: A small macroeconometric model for Norway with financial frictions. Roger Hammersland and Cathrine Bolstad Træe,
1/2012 Rettslige sider ved utlåns- og diskonteringsvirksomheten til Norges Bank 1816–1824. Eugenia Blücher
22/2011 Norges Banks uavhengighet i etterkrigstida En analyse av sentralbankens uavhengighet fra 1945 til 1970 i et komparativt perspektiv. Ragnar Trøite
21/2011 Inflasjon og akkomodasjon: Norsk valutakurspolitikk fra 1971 til 1986. Christoffer Kleivset20/2011 Fra reell til nominell: En analyse av pengepolitikken i Norge fra devalueringen i 1986, til innføringen
av inflasjonsmålet i 2001. Bastian Engelsen Klunde 19/2011 Mellom politikk og marked? En studie av Pengepolitisk avdeling i Norges Bank, IMF og spørsmålet
om den norske penge- og kredittpolitikken ca. 1965–1980. Thomas Nordbø Berg 18/2011 Når staten tar kontroll: Bankkrisen fra 1991–1993. Trond Gram 17/2011 Kredittpolitikken som redskap i den samfunnsøkonomiske styringen fra 1965 til 1980. Gunnhild J.
Ecklund16/2011 Likviditetskrisen høsten 2008. Nora Kirsten Sundvall15/2011 A cobweb model of financial stability in Norway. Geir Arne Dahl, Thea Birkeland Kloster, Unni
Larsen, Ketil Johan Rakkestad, Rebekka Reisvaag, Bjørne Dyre Syversten and Cathrine Bolstad Træe. Edited by Magdalena D. Riiser
14/2011 Makroøkonomiske virkninger av høyere kapitalkrav for bankene. Dag Henning Jacobsen, Thea Birkeland Kloster, Aslak Bakke Kvinlog og Unni Larsen
13/2011 Credit, house prices, and risk taking by banks in Norway. Artashes Karapetyan12/2011 Effekter av arbeidsinnvandring. Kåre Hagelund, Einar W. Nordbø og Fredrik Wulfsberg11/2011 Om interaksjon mellom pengepolitikk og tidsvarierende makroregulering av finanssektoren. Gisle
James Natvik10/2011 Effects of a higher equity ratio on a bank's total funding costs and lending. Bent Vale9/2011 Short-term forecasting of GDP and inflation in real-time: Norges Bank’s system for averaging
models. Knut Are Aastveit, Karsten R. Gerdrup and Anne Sofie Jore8/2011 Sikkerhet for lån i Norges Bank – Virkningen av endringer i Norges Banks regelverk på bankenes
verdipapirporteføljer og utstedelser. Sigrid Igland and Johannes A. Skjeltorp7/2011 A financial conditions index for Norway. Nikka Husom Vonen6/2011 On the purpose of models – The Norges Bank experience. Karsten G. Gjerdrup and Jon Nicolaisen5/2011 Systemer for likviditetsstyring: Oppbygging og egenskaper. Olav Syrstad4/2011 Renteanalysen. Tom Bernhardsen. Norwegian only3/2011 Countercyclical capital buffer proposal: an analysis for Norway. VO Thi Quynh Anh2/2011 Two essays on the magic number 4. Sigbjørn Atle Berg, Jan F. Qvigstad and Nikka Husom Vonen1/2011 Norwegian overnight interbank interest rates. Q. Farooq Akram and Casper Christophersen13/2010 Credit, asset prices and monetary policy. Leif Brubakk and Gisle Natvik12/2010 Systemic surcharges and measures of systemic importance. Sigbjørn Atle Berg11/2010 Monetary policy analysis in practice. Ragna Alstadheim, Ida Wolden Bache, Amund Holmsen,
Junior Maih and Øistein Røisland10/2010 Likviditetsstyringen i Norge og utviklingen i bankenes likviditet (Liquidity management in Norway and
developments in bank liquidity). Erna Hoff. Norwegian only

44
Regional network: enterprises and organisations interviewed
07 Gruppen AS3B-fiberglass Norway AS7. himmel ASABB ASABCenter eiendom ASAccenture ASAccount-IT ASAdecco Norge AS, TrondheimAditro HRMAdresseavisen ASAdvokat Ole Morten Husmo ASAdvokatfirmaet Schjødt ASAhead frisørAhlsell Norge AS, TrondheimAibel ASAir Products ASAker Midsund ASAker Offshore Partner AS,
KristiansundAker Pusnes ASAkershus universitetssykehus HFAktietrykkeriet ASAktiv365AKVA Group ASAAlcoa Norway ANS, ListaAlfr. Nesset ASAlfsen og Gunderson ASAlleen auto ASAlliero ASAlta kommuneAmerican Express Business
Travel ASA-møbler ASAnleggsgartnerfirma Strandman ASApollo reiserApply TB ASApropos internett ASAPS Norway ASArendal auto ASArendal kommuneArendal kulturhus ASArki arkitektar AS
Arntzen de Besche advokat- firma AS
Asker kommuneAsko Hedmark ASAsko Norge ASAskøy kommuneAsplan Viak AS, StavangerAT Group ASAtelier Ekren ASAurora Group Norge ASAustevoll Seafood ASAAvantor ASAvinor ASAvinor AS, Bergen lufthavnAvinor AS, Kristiansund lufthavnAvinor AS, Trondheim lufthavnBates United ASBearingPoint Norway ASBeitostølen Resort ASBennet Nord-Norge AS avd. BodøBerg Jacobsen gruppenBergans fritid ASBerge & Co ASBergen Group ASABergen kino ASBergen kommuneBergene Holm ASBergens tidende ASBerg-Hansen reisebureau
Vestfold ASBernhard Olsen ASBertel O. Steen Rogaland ASBetong Øst ASBiltema SørlandsparkenBiobag International ASBioMar ASBiotec Pharmacon ASABirkenes byggsenter ASBirkenes kommuneBjerkreim kommuneBjørn bygg ASBlock Berge bygg AS
BN entreprenør ASBohus Bomøbler ASBohus Møbelhuset ASBr. Reme ASBravida ASBravida AS, SørvestBrude Safety ASBrunvoll ASBrødrene Dahl ASBrødrene Pedersen ASBrødrene Ulveseth ASBunnpriskjeden ASByggma ASAByggmakker Norge ASBø kommuneBølgen og Moi ASBørstad transport ASBåtsfjordbruket ASCapgemini Norge AS, TrondheimCarshine ASCC Mart'n Gjøvik drift ASCegal ASCelsa Steel Service ASCermaq ASAChiron ASClarkes ASClas Ohlson ASClas Ohlson AS, region NordClas Ohlson AS, region SørClas Ohlson AS, region SørCoop Hordaland BACoop NKL SACoop Nord SACoop Nordland SACoop Steinkjer SACoop Vest SACowi AS, TrondheimCramo ASCrediCare AS, FørdeCSC Norge ASDark ASDeloitte AS, Sogn og Fjordane

NORGES BANK MONETARY POLICY REPORT 1/2012 45
Devold of Norway ASDin Tur ASDnB eiendom ASDnB næringsmegling AS,
TrondheimDNH Den norske høyttaler-
fabrikk ASDokka Fasteners ASDokken og Moen
murmesterforretning ASDrammen kommuneEDB ErgoGroup ASAEDB Ergogroup ASA, region
InnlandEDB ErgoGroup ASA, TrondheimEFD Induction ASEidskog kommuneEidsvoll kommuneEiendomsmegler 1 Nord Norge ASEiendomsmegler 1 SR-eiendom ASEiendomsør og bygg ASEigedomsmekling Sogn og
Fjordane ASEkornes ASAElektro ASElkem ASA, Salten VerkElkem Thamshavn ASElkjøp Finnsnes ASElkjøp giganten ForusElkjøp giganten ÅsaneElkjøp Norge ASElkjøp stormarked BodøElmo ASEramet Norway AS, SaudaEramet Norway Kvinesdal ASErnst & Young AS, StavangerEsko-Graphics Kongsberg ASEuronics Norge ASEvensen & Evensen ASEwos ASExbo Sørlandet ASExpert MoldeFabelaktiv ASFarstad Shipping ASFarsund bygg AS
Finn.no ASFinneid sveiseverksted ASFinsbråten ASFirda media ASFjord Line ASFjord1 Nordvestlandske ASFK Butikken Felleskjøpet RogalandFlekkefjord kommuneFM Gruppen ASFokus bankFokus bank, BodøFokus Krogsveen ASFokus Krogsveen AS, TrondheimFolk i husan eiendomsmegling ASFollestad Oslo ASForus næringspark ASFossberg hotell ASFotoKnudsen ASFrank Mohn ASFranzefoss pukk ASFresenius Kabi Norge ASFretex butikkutsalg, KristiansandFriskhuset Holding ASFugro Oceanor ASFædrelandsvennen ASFørde kommuneGausdal Bruvoll BAGE Healthcare ASGeomatikk IKT ASGERA Technology ASGilstad trelast ASGipling ASGjøvik kommuneGlamox ASAGlava ASGlåmdalen ASGoman bakeriet AS, TrondheimGran kommuneGran Taralrud ASGrande entreprenør ASGranit kleber ASGravdahl ASGrenland Group ASAGresvig ASA, SportGrilstad AS, Brumunddal
Grunnarbeid ASG-Sport Nord ASGudbrandsdalens uldvarefarbrik ASGunnar Hippe ASGunnar Klo ASH. & O. Bernhardsen ASH. Mydland ASHafjell alpinsenter ASHalliburton Norge Holding ASHamar kommuneHammerfest kommuneHammerø & Storvik Molde ASHamworthy ASHandelsbanken, TrondheimHaproHaram kommuneHauans ASHedalm Anebyhus ASHedalm Anebyhus AS, Nord-VestHedmark eiendom ASHedmark fylkeskommuneHelgelandssykehuset HFHelse Bergen HFHelse FørdeHelse Midt-Norge RHFHelse Stavanger HFHerregalleriet ASHi-Fi klubben AS, GrimstadHogg Robinson Nordic ASHolm grafisk ASHolmen fjordhotellHordaland fylkeskommuneHouse of Beauty ASHunton fiber ASHydraulikk Finnmark ASHydro Aluminium AS, ÅrdalHydro Aluminium Profiler ASIBM NorgeICA Norge Rimi VestIde møbler Bodø ASIKEA ASIKEA AS, ForusIKM gruppen ASIndre Sogn sparebankInnoventi AS
46
Innvik Sellgren industrier ASInterfil ASIntra ASItab industrier ASITet ASIvar Mjåland ASJak Restaurantdrift A/SJC Decaux Norge ASJemar Norpower ASJensen møbler ASJernbaneverketJernia ASJiffy Products International ASJM Norge ASJMS Mediasystems ASJobzone ASJohansen Th & Sønner ASJohn Galten ASJotun ASJotunheimen og Valdresruten
bilselskap ASJulius Jakhelln ASKappahl ASKarmøy kommuneKirkestuen transport ASKjøpmannshuset Norge ASKleive betongbygg ASKlæbu kommuneKnutsen Jørgensen & Skjelbred
Servering ASKongsberg Automotive ASKongsberg Automotive AS,
RaufossKongsberg kommuneKontali analyse ASKosbergs arkitektkontor ASKPMG ASKPMG AS, TrondheimKraft Foods Norge ASKristiansand CementstøperiKristiansand kommuneKristiansund kommuneKristiseter M Entreprenør ASKruse Smith ASKvalitet & Ledelse AS
Kverneland Group ASAKværner Verdal ASLandteknikk fabrikk ASLantmannen Cerealia ASLarvik kommuneLeiv Eiriksson nyskapning ASLena maskin ASLenvik kommuneLerum ASLerøy Midnor ASLilleborg AS, profesjonellLindex ASLink signatur ASLom kommuneLom og Skjåk sparebankLundegården Bar & Brasserie ASLunner kommuneLøype Anleggsdrift ASMadsen bil ASMadshus ASMagneten kjøpesenterMainstream Norway ASMalvik kommuneManpower ASManpower AS, BodøManpower AS, Hedmark og
OpplandManpower AS, Nordmøre og
RomsdalManpower AS, TrondheimMapei ASMarine Cybernetics ASMarine installasjoner ASMascot Electronics ASMaxMat ASMelhus kommuneMeny KrøgenesMeyergården Turisthotell ASMeyership ASMezina ASMiljøbygg ASMiras multimaskin ASModern Design ASModerne Byggfornyelse ASMoelven Nordia AS
Moi rør ASMolab ASMolde kommuneMoldjord Bygg og Anlegg ASMoss kommuneMulticonsult ASMulticonsult AS, StavangerMX SportMøbelringen ASMøllerGruppen ASMøre båtservice ASMøre eiendomsmegling ASMøre Trafo ASMørenot ASMøretre ASNammo ASNAV Aust-AgderNAV OpplandNAV RogalandNAV Sogn og FjordaneNAV Sør-TrøndelagNAV Vest-AgderNexans Norway ASNexans Norway AS, RognanNikkers ASNils Williksen ASNobia ASNofi Tromsø ASNor tekstil ASNorconsult AS, BodøNorconsult AS, TrondheimNord Norsk dekkimport ASNorDan ASNorDan AS, Hedmark/OpplandNord-Aurdal kommuneNordea bank Norge ASANordea bank Norge ASA,
KristiansandNordek ASNordic Paper ASNordlaks ASNordland betong ASNordox ASNord-Tre entreprenør ASNorengros Kjosavik AS
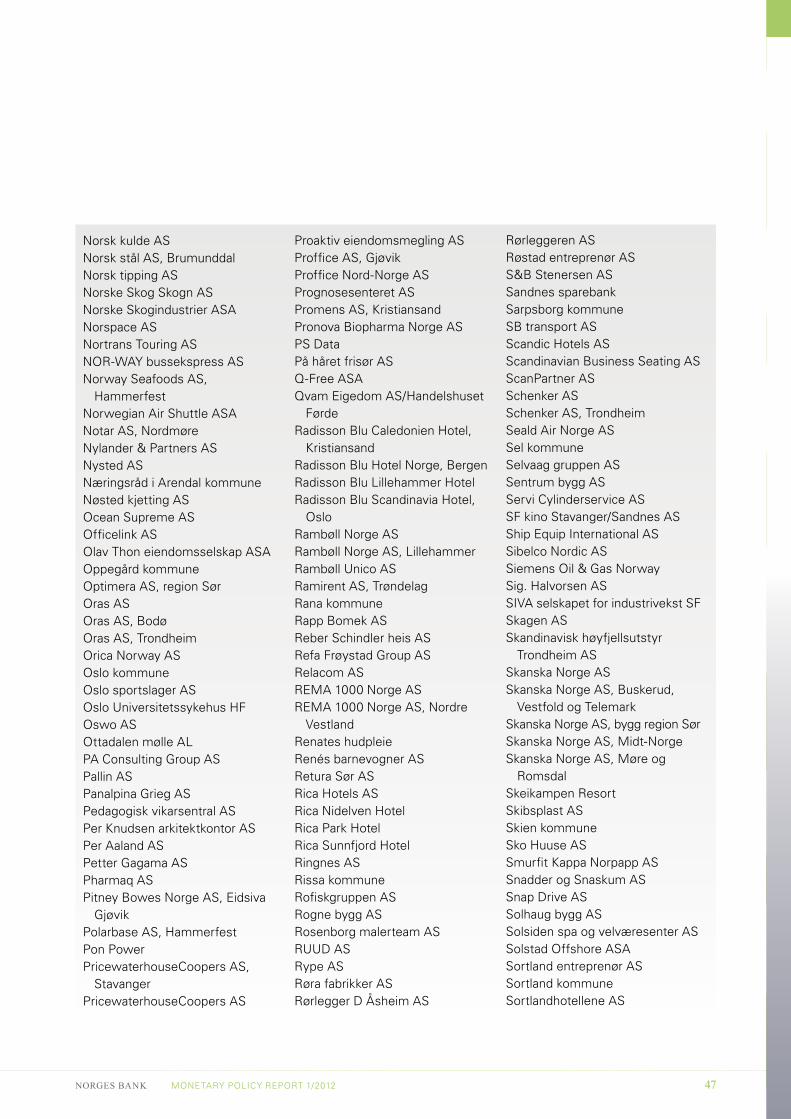
NORGES BANK MONETARY POLICY REPORT 1/2012 47
Norsk kulde ASNorsk stål AS, BrumunddalNorsk tipping ASNorske Skog Skogn ASNorske Skogindustrier ASANorspace ASNortrans Touring ASNOR-WAY bussekspress ASNorway Seafoods AS,
HammerfestNorwegian Air Shuttle ASANotar AS, NordmøreNylander & Partners ASNysted ASNæringsråd i Arendal kommuneNøsted kjetting ASOcean Supreme ASOfficelink ASOlav Thon eiendomsselskap ASAOppegård kommuneOptimera AS, region SørOras ASOras AS, BodøOras AS, TrondheimOrica Norway ASOslo kommuneOslo sportslager ASOslo Universitetssykehus HFOswo ASOttadalen mølle ALPA Consulting Group ASPallin ASPanalpina Grieg ASPedagogisk vikarsentral ASPer Knudsen arkitektkontor ASPer Aaland ASPetter Gagama ASPharmaq ASPitney Bowes Norge AS, Eidsiva
GjøvikPolarbase AS, HammerfestPon PowerPricewaterhouseCoopers AS,
StavangerPricewaterhouseCoopers AS
Proaktiv eiendomsmegling ASProffice AS, GjøvikProffice Nord-Norge ASPrognosesenteret ASPromens AS, KristiansandPronova Biopharma Norge ASPS DataPå håret frisør ASQ-Free ASAQvam Eigedom AS/Handelshuset
FørdeRadisson Blu Caledonien Hotel,
KristiansandRadisson Blu Hotel Norge, BergenRadisson Blu Lillehammer HotelRadisson Blu Scandinavia Hotel,
OsloRambøll Norge ASRambøll Norge AS, LillehammerRambøll Unico ASRamirent AS, TrøndelagRana kommuneRapp Bomek ASReber Schindler heis ASRefa Frøystad Group ASRelacom ASREMA 1000 Norge ASREMA 1000 Norge AS, Nordre
VestlandRenates hudpleieRenés barnevogner ASRetura Sør ASRica Hotels ASRica Nidelven HotelRica Park HotelRica Sunnfjord HotelRingnes ASRissa kommuneRofiskgruppen ASRogne bygg ASRosenborg malerteam ASRUUD ASRype ASRøra fabrikker ASRørlegger D Åsheim AS
Rørleggeren ASRøstad entreprenør ASS&B Stenersen ASSandnes sparebankSarpsborg kommuneSB transport ASScandic Hotels ASScandinavian Business Seating ASScanPartner ASSchenker ASSchenker AS, TrondheimSeald Air Norge ASSel kommuneSelvaag gruppen ASSentrum bygg ASServi Cylinderservice ASSF kino Stavanger/Sandnes ASShip Equip International ASSibelco Nordic ASSiemens Oil & Gas NorwaySig. Halvorsen ASSIVA selskapet for industrivekst SFSkagen ASSkandinavisk høyfjellsutstyr
Trondheim ASSkanska Norge ASSkanska Norge AS, Buskerud,
Vestfold og TelemarkSkanska Norge AS, bygg region SørSkanska Norge AS, Midt-NorgeSkanska Norge AS, Møre og
RomsdalSkeikampen ResortSkibsplast ASSkien kommuneSko Huuse ASSmurfit Kappa Norpapp ASSnadder og Snaskum ASSnap Drive ASSolhaug bygg ASSolsiden spa og velværesenter ASSolstad Offshore ASASortland entreprenør ASSortland kommuneSortlandhotellene AS
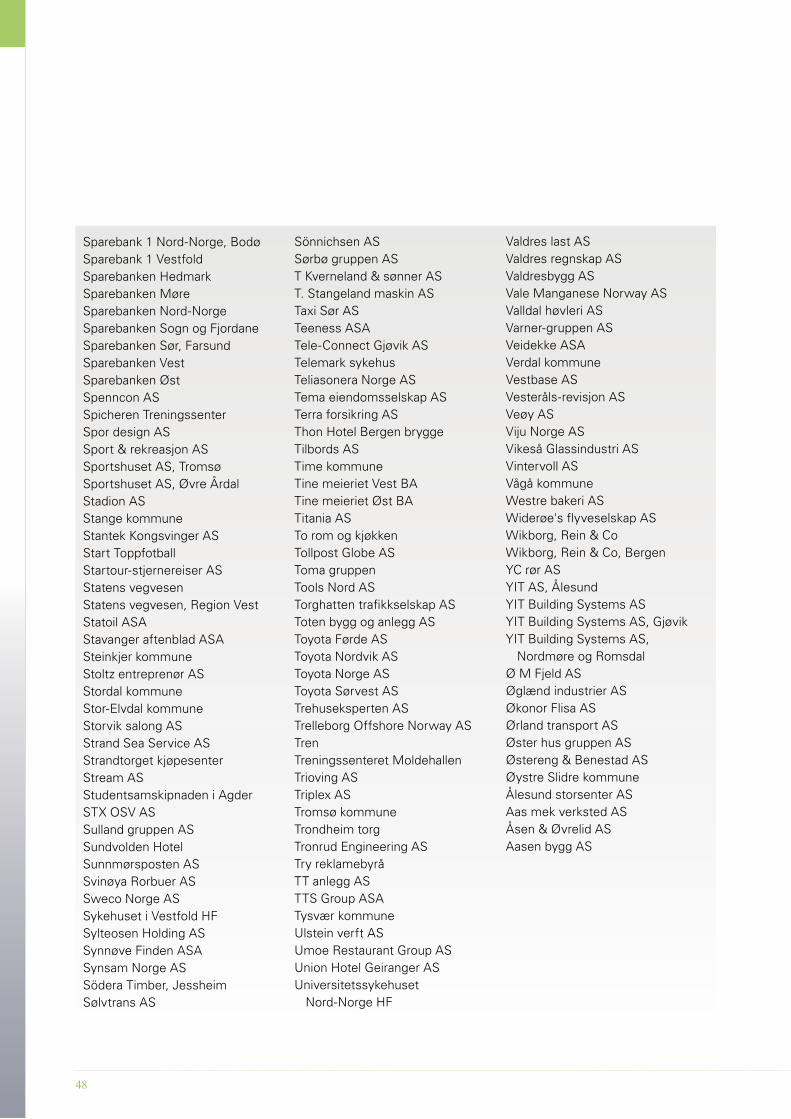
48
Sparebank 1 Nord-Norge, BodøSparebank 1 VestfoldSparebanken HedmarkSparebanken MøreSparebanken Nord-NorgeSparebanken Sogn og FjordaneSparebanken Sør, FarsundSparebanken VestSparebanken ØstSpenncon ASSpicheren TreningssenterSpor design ASSport & rekreasjon ASSportshuset AS, TromsøSportshuset AS, Øvre ÅrdalStadion ASStange kommuneStantek Kongsvinger ASStart ToppfotballStartour-stjernereiser ASStatens vegvesenStatens vegvesen, Region VestStatoil ASAStavanger aftenblad ASASteinkjer kommuneStoltz entreprenør ASStordal kommuneStor-Elvdal kommuneStorvik salong ASStrand Sea Service ASStrandtorget kjøpesenterStream ASStudentsamskipnaden i AgderSTX OSV ASSulland gruppen ASSundvolden HotelSunnmørsposten ASSvinøya Rorbuer ASSweco Norge ASSykehuset i Vestfold HFSylteosen Holding ASSynnøve Finden ASASynsam Norge ASSödera Timber, JessheimSølvtrans AS
Sönnichsen ASSørbø gruppen AST Kverneland & sønner AST. Stangeland maskin ASTaxi Sør ASTeeness ASATele-Connect Gjøvik ASTelemark sykehusTeliasonera Norge ASTema eiendomsselskap ASTerra forsikring ASThon Hotel Bergen bryggeTilbords ASTime kommuneTine meieriet Vest BATine meieriet Øst BATitania ASTo rom og kjøkkenTollpost Globe ASToma gruppenTools Nord ASTorghatten trafikkselskap ASToten bygg og anlegg ASToyota Førde ASToyota Nordvik ASToyota Norge ASToyota Sørvest ASTrehuseksperten ASTrelleborg Offshore Norway ASTrenTreningssenteret MoldehallenTrioving ASTriplex ASTromsø kommuneTrondheim torgTronrud Engineering ASTry reklamebyråTT anlegg ASTTS Group ASATysvær kommuneUlstein verft ASUmoe Restaurant Group ASUnion Hotel Geiranger ASUniversitetssykehuset
Nord-Norge HF
Valdres last ASValdres regnskap ASValdresbygg ASVale Manganese Norway ASValldal høvleri ASVarner-gruppen ASVeidekke ASAVerdal kommuneVestbase ASVesteråls-revisjon ASVeøy ASViju Norge ASVikeså Glassindustri ASVintervoll ASVågå kommuneWestre bakeri ASWiderøe's flyveselskap ASWikborg, Rein & CoWikborg, Rein & Co, BergenYC rør ASYIT AS, ÅlesundYIT Building Systems ASYIT Building Systems AS, GjøvikYIT Building Systems AS,
Nordmøre og RomsdalØ M Fjeld ASØglænd industrier ASØkonor Flisa ASØrland transport ASØster hus gruppen ASØstereng & Benestad ASØystre Slidre kommuneÅlesund storsenter ASAas mek verksted ASÅsen & Øvrelid ASAasen bygg AS
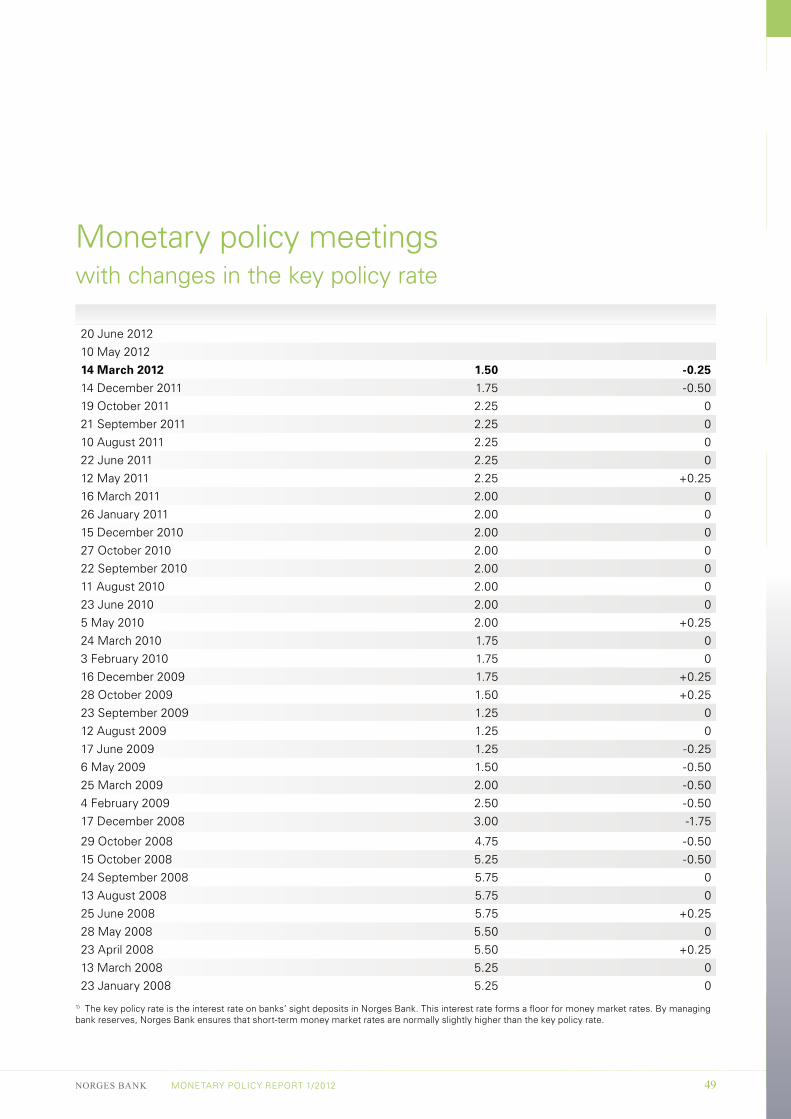
NORGES BANK MONETARY POLICY REPORT 1/2012 49
Monetary policy meetingswith changes in the key policy rateDate Key policy rate1) Change
20 June 201210 May 2012
14 March 2012 1.50 -0.25
14 December 2011 1.75 -0.5019 October 2011 2.25 021 September 2011 2.25 010 August 2011 2.25 022 June 2011 2.25 012 May 2011 2.25 +0.2516 March 2011 2.00 026 January 2011 2.00 015 December 2010 2.00 027 October 2010 2.00 022 September 2010 2.00 011 August 2010 2.00 023 June 2010 2.00 05 May 2010 2.00 +0.2524 March 2010 1.75 03 February 2010 1.75 016 December 2009 1.75 +0.2528 October 2009 1.50 +0.2523 September 2009 1.25 012 August 2009 1.25 017 June 2009 1.25 -0.256 May 2009 1.50 -0.5025 March 2009 2.00 -0.504 February 2009 2.50 -0.5017 December 2008 3.00 -1.75
29 October 2008 4.75 -0.5015 October 2008 5.25 -0.5024 September 2008 5.75 013 August 2008 5.75 025 June 2008 5.75 +0.2528 May 2008 5.50 023 April 2008 5.50 +0.2513 March 2008 5.25 023 January 2008 5.25 0
1) The key policy rate is the interest rate on banks’ sight deposits in Norges Bank. This interest rate forms a floor for money market rates. By managingbank reserves, Norges Bank ensures that short-term money market rates are normally slightly higher than the key policy rate.
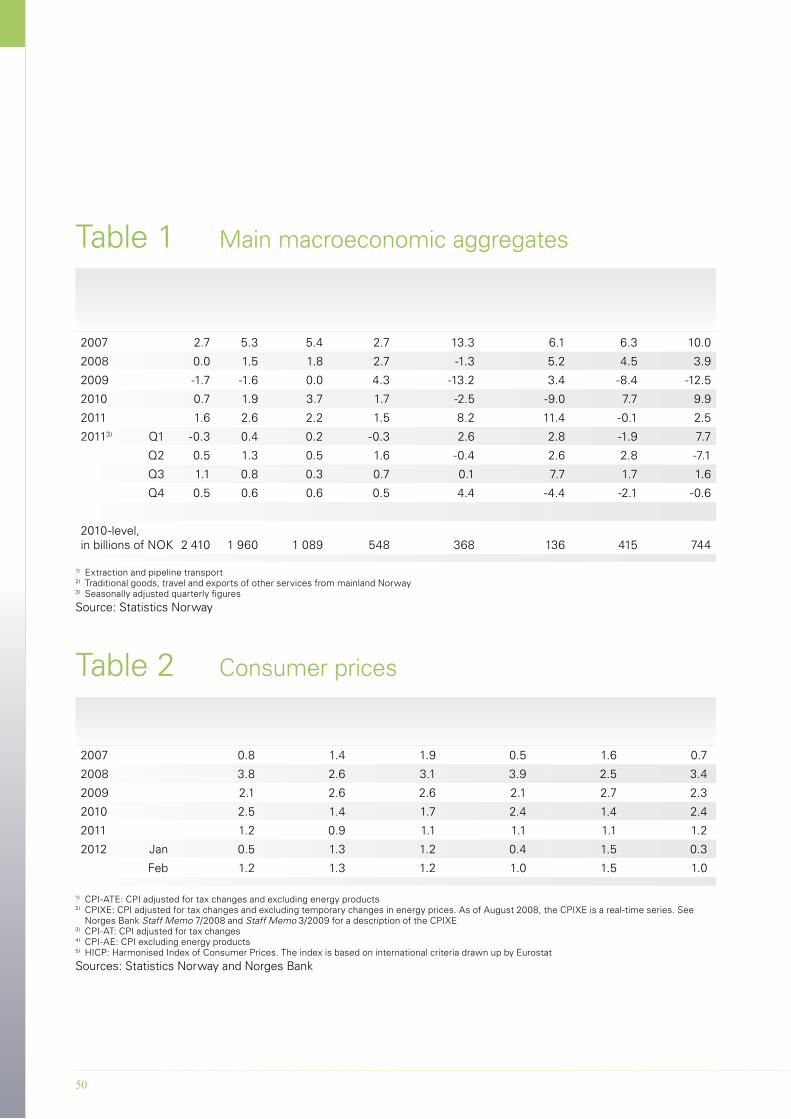
50
Table 1 Main macroeconomic aggregatesPercentage change from previous year/quarter GDP
Main-land GDP
Private con-
sumption
Public con-
sumption
Mainland fixed
investmentPetroleum
investment1)
Mainland exports2) Imports
2007 2.7 5.3 5.4 2.7 13.3 6.1 6.3 10.0
2008 0.0 1.5 1.8 2.7 -1.3 5.2 4.5 3.9
2009 -1.7 -1.6 0.0 4.3 -13.2 3.4 -8.4 -12.5
2010 0.7 1.9 3.7 1.7 -2.5 -9.0 7.7 9.9
2011 1.6 2.6 2.2 1.5 8.2 11.4 -0.1 2.5
20113) Q1 -0.3 0.4 0.2 -0.3 2.6 2.8 -1.9 7.7
Q2 0.5 1.3 0.5 1.6 -0.4 2.6 2.8 -7.1
Q3 1.1 0.8 0.3 0.7 0.1 7.7 1.7 1.6
Q4 0.5 0.6 0.6 0.5 4.4 -4.4 -2.1 -0.6
2010-level, in billions of NOK 2 410 1 960 1 089 548 368 136 415 744
1) Extraction and pipeline transport 2) Traditional goods, travel and exports of other services from mainland Norway3) Seasonally adjusted quarterly figures
Source: Statistics Norway
Table 2 Consumer pricesAnnual rise/twelve-monthrise. Per cent CPI CPI-ATE1) CPIXE2) CPI-AT3) CPI-AE4) HICP5)
2007 0.8 1.4 1.9 0.5 1.6 0.7
2008 3.8 2.6 3.1 3.9 2.5 3.4
2009 2.1 2.6 2.6 2.1 2.7 2.3
2010 2.5 1.4 1.7 2.4 1.4 2.4
2011 1.2 0.9 1.1 1.1 1.1 1.2
2012 Jan 0.5 1.3 1.2 0.4 1.5 0.3
Feb 1.2 1.3 1.2 1.0 1.5 1.0
1) CPI-ATE: CPI adjusted for tax changes and excluding energy products2) CPIXE: CPI adjusted for tax changes and excluding temporary changes in energy prices. As of August 2008, the CPIXE is a real-time series. See
Norges Bank Staff Memo 7/2008 and Staff Memo 3/2009 for a description of the CPIXE3) CPI-AT: CPI adjusted for tax changes4) CPI-AE: CPI excluding energy products5) HICP: Harmonised Index of Consumer Prices. The index is based on international criteria drawn up by Eurostat
Sources: Statistics Norway and Norges Bank
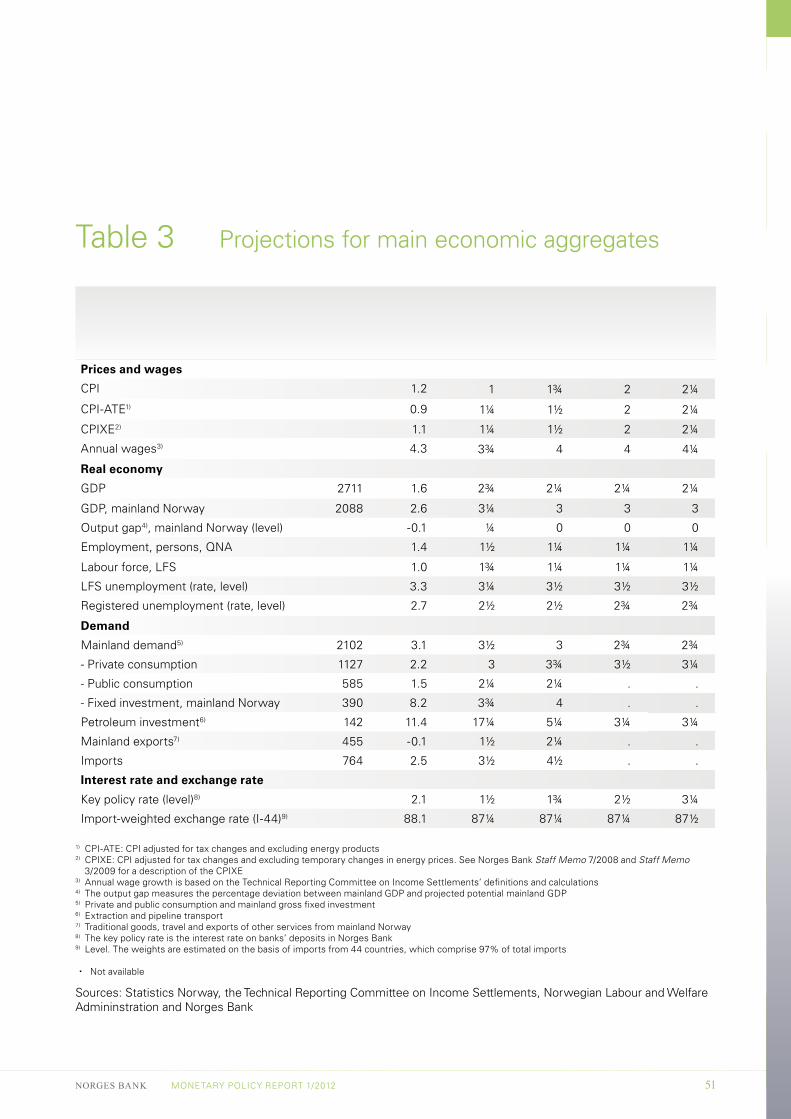
NORGES BANK MONETARY POLICY REPORT 1/2012 51
Table 3 Projections for main economic aggregates
In billionsof NOK
Percentage change from previous year(unless otherwise stated)
Projections
2011 2011 2012 2013 2014 2015
Prices and wages
CPI 1.2 1 1¾ 2 2¼
CPI-ATE1) 0.9 1¼ 1½ 2 2¼
CPIXE2) 1.1 1¼ 1½ 2 2¼
Annual wages3) 4.3 3¾ 4 4 4¼
Real economy
GDP 2711 1.6 2¾ 2¼ 2¼ 2¼
GDP, mainland Norway 2088 2.6 3¼ 3 3 3
Output gap4), mainland Norway (level) -0.1 ¼ 0 0 0
Employment, persons, QNA 1.4 1½ 1¼ 1¼ 1¼
Labour force, LFS 1.0 1¾ 1¼ 1¼ 1¼
LFS unemployment (rate, level) 3.3 3¼ 3½ 3½ 3½
Registered unemployment (rate, level) 2.7 2½ 2½ 2¾ 2¾
Demand
Mainland demand5) 2102 3.1 3½ 3 2¾ 2¾
- Private consumption 1127 2.2 3 3¾ 3½ 3¼
- Public consumption 585 1.5 2¼ 2¼ . .
- Fixed investment, mainland Norway 390 8.2 3¾ 4 . .
Petroleum investment6) 142 11.4 17¼ 5¼ 3¼ 3¼
Mainland exports7) 455 -0.1 1½ 2¼ . .
Imports 764 2.5 3½ 4½ . .
Interest rate and exchange rate
Key policy rate (level)8) 2.1 1½ 1¾ 2½ 3¼
Import-weighted exchange rate (I-44)9) 88.1 87¼ 87¼ 87¼ 87½
1) CPI-ATE: CPI adjusted for tax changes and excluding energy products2) CPIXE: CPI adjusted for tax changes and excluding temporary changes in energy prices. See Norges Bank Staff Memo 7/2008 and Staff Memo
3/2009 for a description of the CPIXE3) Annual wage growth is based on the Technical Reporting Committee on Income Settlements’ definitions and calculations4) The output gap measures the percentage deviation between mainland GDP and projected potential mainland GDP5) Private and public consumption and mainland gross fixed investment6) Extraction and pipeline transport7) Traditional goods, travel and exports of other services from mainland Norway8) The key policy rate is the interest rate on banks’ deposits in Norges Bank9) Level. The weights are estimated on the basis of imports from 44 countries, which comprise 97% of total imports
. Not available
Sources: Statistics Norway, the Technical Reporting Committee on Income Settlements, Norwegian Labour and Welfare Admininstration and Norges Bank

52
Monetary Policy R
eport No. 1 - M
arch
2012