Molten Salt Reactor (MSR) for Worcester Polytechnic ...€¦ · Molten Salt Reactor (MSR) for...
193
Molten Salt Reactor (MSR) for Worcester Polytechnic Institute (WPI) Steam Generation A Major Qualifying Project Report Submitted to the Faculty of Worcester Polytechnic Institute In partial fulfillment of the requirements for the Degree of Bachelor of Science Submitted By: Alexandra Hardin Submitted To: WPI Chemical Engineering Department, Worcester, MA Submitted On: March 6 th , 2015 Project Advisors: Ángel Rivera Peter Miraglia Robert W. Thompson
Transcript of Molten Salt Reactor (MSR) for Worcester Polytechnic ...€¦ · Molten Salt Reactor (MSR) for...
Molten Salt Reactor (MSR) for Worcester
Polytechnic Institute (WPI) Steam Generation
A Major Qualifying Project Report
Submitted to the Faculty of Worcester Polytechnic Institute
In partial fulfillment of the requirements for the
Degree of Bachelor of Science
Submitted By:
Alexandra Hardin
Submitted To:
WPI Chemical Engineering Department, Worcester, MA
Submitted On:
March 6th, 2015
Project Advisors:
Ángel Rivera
Peter Miraglia
Robert W. Thompson
ABSTRACT
This project revisited a nuclear technology, investigated in Oak Ridge National Laboratory
(ORNL) in the 1960s and 70s, called Molten Salt Reactors (MSRs). For this project, the ORNL
reactor design was used to create a system including a primary heat exchanger and steam generator,
considering WPI’s steam needs, and the special properties of materials used in an MSR. This
project will serve as a starting point for bringing an MSR to WPI. The final project was also
translated into Spanish, and investigates the difficulties of translation and its importance in
technical fields.
ACKNOWLEDGEMENTS
Our team would like to thank the following departments and people for their support and
contribution to our project:
Robert W. Thompson
Peter Miraglia
Transatomic Power Inc.
Bill Grudzinski
Germano Iannacchione
Stephen Kmiotek
Thomas Starr
EXECUTIVE SUMMARY
Background
The 21st century has presented scientists and researchers with several new problems. One of the
most pressing issues facing today’s innovators is the energy problem: the issue of increasing
energy demand, intensified by a decreasing resource supply and increasing environmental
concerns. The challenge of the 21st century is to find clean, cheap, and long-lasting energy. Current
technologies include hydrogen fuel cells and biofuels, but a promising option seems to be nuclear
power.
The first proof of energy production from nuclear fission was shown by Enrico Fermi in 1942
(Wood, 2007). From this discovery, the world gained and interest in using nuclear power as an
advantage in World War II. Nuclear power gained popularity in the military not only for weapon
use, but also for powering submarines and aircrafts.
From the research of nuclear power in the military came the development of pressurized water
reactors (PWRs). The technology powered submarines for extended periods without refueling.
After seeing the success with PWRs in the submarines, Shippingport Atomic Power Station opened
a nuclear power plant in 1957 for the creation of commercial power (Kok, 2009). As research
continued, boiling water reactors (BWRs) were developed. In the 1950s, nuclear research began
to turn from a military focus to civilian energy focus, and research began on a new type of reactor
using molten salt (Wood, 2007). The Molten Salt Reactor Experiment (MSRE) began at Oak Ridge
National Laboratory in Tennessee in 1961.
This new technology had all the environmental benefits of nuclear power, but in addition,
presented improvements in fuel efficiency, stability, and safety (Robertson, 1965). MSRs differ
from PWRs and BWRs in that the fuel leaves the reactor and flows throughout the reactor system,
transferring heat directly. In PWRs and BWRs, water flows through the reactor and transfers heat
from the reactor to another loop. MSRs can reduce costs because of they don’t require a complex
fuel rod design in the reactor core, and they don’t require extensive shutdown procedures like
PWRs and BWRs (Shultis & Faw, 2002).
The MSR also presents incredible safety benefits. Even though nuclear material travels outside of
the reactor, nuclear material can be separated from the heat generation loop by the insertion of an
intermediate loop of coolant salt. On top of this, the system does not operate at nearly the same
pressures as PWRs and BWRs. The MSRE was stopped in 1969 due to economic reasons, but the
results of the experiment proved the MSRs were a promising technology. Though current MSR
technology does not exist, it is one of the main considerations in Generation IV reactor technology
because of its added benefits and because ORNL has already proved that it can work (Generation
IV International Forum, 2013).
Because of MSRs promise, this project used applied ORNL’s reactor design to create a steam
generation system to provide steam to the Worcester Polytechnic Institute campus. To prove and
MSR was better than both the current WPI steam generation system and other nuclear
technologies, this project focused on the thermal properties and heat transfer related to the steam
generation systems.
Goals, objectives, and methods
The goal of this project was to design a steam generation system for the steam needs of Worcester
Polytechnic Institute using the Oak Ridge National Laboratory Molten Salt Reactor Experimental
reactor design as a heat source. The methodology and results of this project will be a starting point
for designing an MSR steam generation system at WPI, ultimately being more thermally efficient,
more environmentally friendly, and potentially more beneficial to educational programs at WPI.
In designing the steam generation system, the following steps were taken:
1. Determine campus heating needs from given steam production information
2. Evaluate steam generation loop using the design from the Oak Ridge National Laboratory
Molten Salt Reactor Experiment.
3. Evaluate steam generation loop and determine steam production from the thermal output
of the MSRE using Aspen Plus Simulation software.
4. Use heat transfer calculations to compare steam generation from a Molten Salt Reactor to
that of a Pressurized Water Reactor (PWR).
5. Design the heat exchanger network used with a molten salt reactor for campus heating,
taking into consideration special requirements for the molten salt system.
Step 1:
Using the description of current campus steam production, the energy content of the steam was
used to determine the overall heating needs of campus.
Step 2:
Using the design from ORNL’s MSRE, a steam generation loop was developed and evaluated. The
original MSRE design only consisted of a radiator to dissipate heat. For this project, the first step
was to make this system capable of producing steam by utilizing the heat from the reactor.
Step 3
After the steam generation potential was evaluated, detailed data from the MSRE was used to
validate the steam output from the MSRE’s specific design Aspen Plus Simulation Software.
Step 4:
Heat balance calculations were used to evaluate steam generation from a pressurized water reactor-
based system and a similar molten salt reactor-based system to show the advantage of MSRs.
Step 5:
Once the thermal properties of the steam generation loop were determined, the heat exchanger
network was designed, taking into consideration the thermal duties of each unit, as well as the
necessary materials for the special chemical, physical, and thermal properties of the molten salt.
Results
The steps above showed that the MSRE design does not exactly meet campus heating needs. Then
it was found that the PWR and MSR systems can both meet campus needs with a reactor output
of 12.55 MW for the PWR and 12.16 for the MSR. The MSR fuel was determined to have a higher
specific power of 44 kW/kg uranium, compared to 33 kW/kg uranium in the PWR fuel. Lastly, the
heat exchanger network required was found to be a four exchanger set-up with one economizer,
one evaporator, and two superheaters. The overall design was compared to data found about
industrial boilers which showed that the heat exchanger network took a total floor space of 44
square feet, while the current boiler system at WPI would take about 256 square feet, showing the
heat exchanger network would be four times more space efficient.
Conclusion and Recommendations
In conclusion, the research of this project showed that a molten salt reactor steam generation
system would be an advantageous campus update for WPI to consider implementing for continued
leadership in environmental impact, sustainability, and technological innovation. However, as a
Generation IV technology, actual reactor usage is likely still a few decades in the future. This
extended timetable allows for future research into optimization of materials, design of the
containment and equipment that was not considered here, and more accurate heat transfer analysis.
Once these projects are completed, final studies could include a cost analysis for system
installation and operation, licensing considerations, and determination of the optimum campus
location for this system.
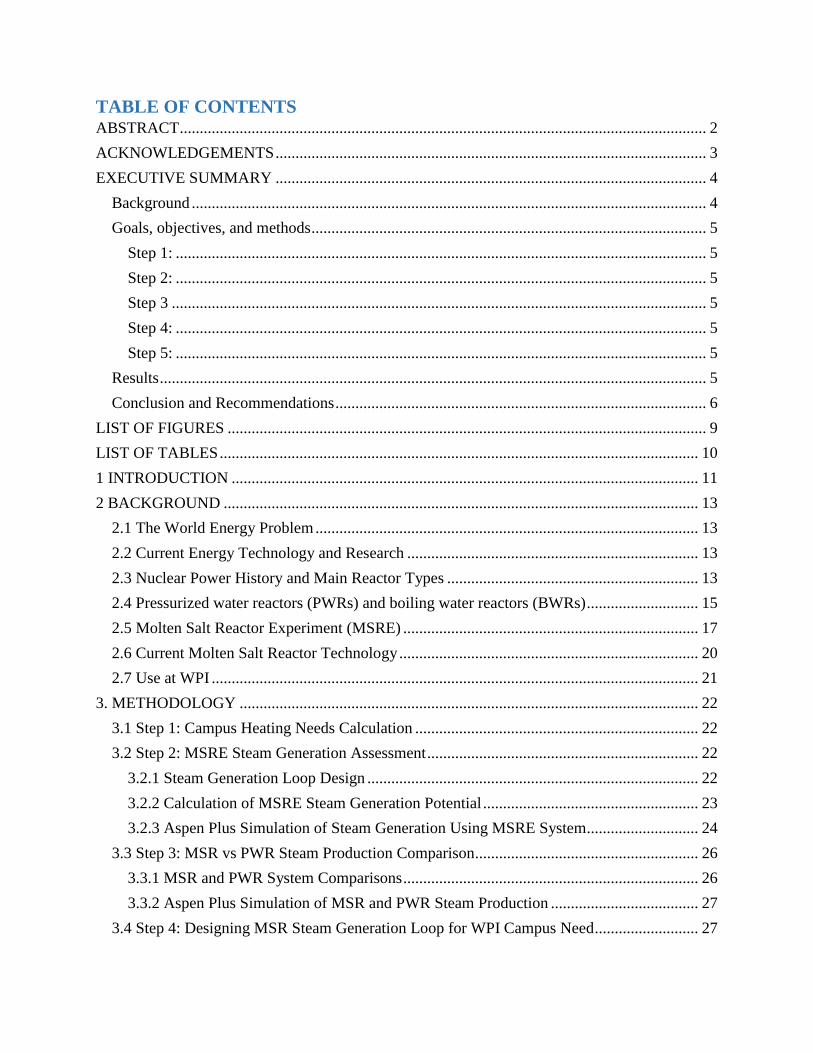
TABLE OF CONTENTS ABSTRACT .................................................................................................................................... 2
ACKNOWLEDGEMENTS ............................................................................................................ 3
EXECUTIVE SUMMARY ............................................................................................................ 4
Background ................................................................................................................................. 4
Goals, objectives, and methods ................................................................................................... 5
Step 1: ..................................................................................................................................... 5
Step 2: ..................................................................................................................................... 5
Step 3 ...................................................................................................................................... 5
Step 4: ..................................................................................................................................... 5
Step 5: ..................................................................................................................................... 5
Results ......................................................................................................................................... 5
Conclusion and Recommendations ............................................................................................. 6
LIST OF FIGURES ........................................................................................................................ 9
LIST OF TABLES ........................................................................................................................ 10
1 INTRODUCTION ..................................................................................................................... 11
2 BACKGROUND ....................................................................................................................... 13
2.1 The World Energy Problem ................................................................................................ 13
2.2 Current Energy Technology and Research ......................................................................... 13
2.3 Nuclear Power History and Main Reactor Types ............................................................... 13
2.4 Pressurized water reactors (PWRs) and boiling water reactors (BWRs) ............................ 15
2.5 Molten Salt Reactor Experiment (MSRE) .......................................................................... 17
2.6 Current Molten Salt Reactor Technology ........................................................................... 20
2.7 Use at WPI .......................................................................................................................... 21
3. METHODOLOGY ................................................................................................................... 22
3.1 Step 1: Campus Heating Needs Calculation ....................................................................... 22
3.2 Step 2: MSRE Steam Generation Assessment .................................................................... 22
3.2.1 Steam Generation Loop Design ................................................................................... 22
3.2.2 Calculation of MSRE Steam Generation Potential ...................................................... 23
3.2.3 Aspen Plus Simulation of Steam Generation Using MSRE System............................ 24
3.3 Step 3: MSR vs PWR Steam Production Comparison ........................................................ 26
3.3.1 MSR and PWR System Comparisons .......................................................................... 26
3.3.2 Aspen Plus Simulation of MSR and PWR Steam Production ..................................... 27
3.4 Step 4: Designing MSR Steam Generation Loop for WPI Campus Need .......................... 27
3.4.1 Design Calculations ..................................................................................................... 27
3.4.2 Material Considerations ............................................................................................... 31
3.4.3 Comparison to WPI’s Current Boiler System .............................................................. 31
4. RESULTS AND DISCUSSION ............................................................................................... 32
4.1 Campus Heating Need ........................................................................................................ 32
4.2 MSRE Energy Potential Calculations and Simulation........................................................ 32
4.3 PWR vs. MSR Comparison ................................................................................................ 33
4.3.1 Steam Generation by a PWR ....................................................................................... 34
4.3.2 Steam Generation by an MSR...................................................................................... 34
4.3.3 Benefits of the MSR..................................................................................................... 35
4.3.4 Exchanger Network Design and Sizing ........................................................................... 36
4.4.1 Primary Exchanger Sizing Calculations ...................................................................... 36
4.4.2 Superheater A/B Calculations ..................................................................................... 38
4.4.3 Evaporator Sizing Calculations.................................................................................... 38
4.4.4 Economizer Sizing Calculations .................................................................................. 39
4.4.5 Floor Space Comparison to Current Boiler System ..................................................... 39
CONCLUSION AND RECOMMENDATIONS ......................................................................... 40
REFERENCES ............................................................................................................................. 42
APPENDIX A: Heat transfer and energy calculations ................................................................. 45
A.1 Campus energy requirement .............................................................................................. 45
A.2 MSRE steam production .................................................................................................... 46
A.3 PWR steam production ...................................................................................................... 51
A.4 MSR Steam Production and Specific Power Calculations ................................................. 55
MSR Steam Generation ........................................................................................................ 55
MSRE Specific Power Calculation ....................................................................................... 58
APPENDIX B: Aspen Input Files................................................................................................. 59
B.1 Campus Energy Need ......................................................................................................... 59
B.2 MSRE Steam Production ................................................................................................... 60
B.3 PWR Steam Production ...................................................................................................... 64
B.4 MSR Steam Production ...................................................................................................... 67
APPENDIX C: Equipment design calculations ............................................................................ 72
C.1 Primary Heat Exchanger .................................................................................................... 72
C.2 Steam Generation Exchangers ........................................................................................... 75
APPENDIX D: Heat exchanger shell diameter charts .................................................................. 91
LIST OF FIGURES
Figure 1: Shippingport Atomic Power during installation;
http://en.wikipedia.org/wiki/Shippingport_Atomic_Power_Station .................................................. 14
Figure 2: MSRE Reactor Vessel during Installation (1961) ....................................................................... 17
Figure 3: MSRE Flow Diagram .................................................................................................................. 18
Figure 4: MSRE Fuel and Coolant Loop Designs ...................................................................................... 19
Figure 5: TAP MSR Reactor Vessel and Power Generation System Design ............................................. 20
Figure 6 WPI 2-D campus map obtained from wpi.edu. Red outline added to demonstrate buildings
heated with steam from the Power House boilers (Worcester Polytechnic Institute, 2014). ............. 21
Figure 7: Steam Generation Heat Exchanger Series Block Diagram.......................................................... 23
Figure 8: Aspen Plus Flow Sheet for MSRE Steam Generation ................................................................. 25
Figure 9: Diagram of Heat Transfer Coefficiens through a Shell and Tube Exchanger ............................. 28
Figure 10:"Estimating Overall Heat Transfer Coefficients" ....................................................................... 30
Figure 11: U-tube Set Up for Exchanger Design ........................................................................................ 37
Figure 12: MSR Exchanger System Design ............................................................................................... 37
Figure 13: Split Superheater Steam Generation Design ............................................................................. 38

LIST OF TABLES
Table 1: ORNL Stream Data used for Aspen Input .................................................................................... 26
Table 2: Salt Stream Compositions in mol% .............................................................................................. 26
Table 3: MSR vs. PWR; *Indicates value calculated from WPI campus energy need ............................... 36
1 INTRODUCTION
Since the industrial revolution, the world has seen an increasing need for energy. The U.S. Energy
Information Administration (EIA) estimates a 56 percent increase in energy consumption between
2010 and 2040. The growth is mainly due to population and economic growth in underdeveloped
countries (U.S. Energy Informatio Administration (EIA), 2014). Coupled with an increased energy
demand is a decreased and unreliable supply of many of the world’s energy resources like coal,
natural gas, and oil. These resources have also gained a reputation for their harmful effects on the
environment. The world is now on a search for renewable and low-emission energy sources.
Nuclear power may be what the world is looking for. Many countries, including the United States,
already utilize nuclear power. “On a global scale, nuclear power currently reduces carbon dioxide
emissions by some 2.5 billion tonnes per year”, had the same amount of power been produced by
coal, and nuclear power only accounts for about 12% of the world’s electricity (World Nuclear
Association, 2014). Utilizing nuclear power could drastically decrease the environmental impact
of energy use.
The majority of light water reactors, which are the most prevalent type of reactor currently in use,
generate their power through Uranium fission reactions, meaning Uranium is the principle fuel
used in nuclear reactors. Uranium is typically obtained from mining, and is “approximately as
common as tin or zinc” (World Nuclear Association, 2014). The World Nuclear Association
reported the total known recoverable Uranium as almost 6 million tons in 2013. It is possible that
with continually improved mining methods, this amount could increase. Energy production by
uranium also requires much less fuel. A ton of uranium produces 7.4 x 10¹⁶ Joules. The same
amount of coal only produces 3.2 x 10¹⁰ Joules (Holdren, 1991).
Despite Uranium’s energy and availability promise, like any energy source, there are potential
flaws. To produce energy, the Uranium fuel absorbs a neutron, and begins to fission. The heavy
and unstable nucleus, given a neutron absorption event, begins to break into smaller, radioactive
fission products. Fission events also produce a large energy release. The radiation from fission
products, gamma rays, and alpha and beta particles, make nuclear reactions dangerous.
Overexposure to these high-energy particles can cause health issues such as cancer. Nuclear waste
from uranium reactors is also a concern as the spent fuel still contains radioactive nuclides. There
are many ways to condition or reprocess the fuel, but current U.S. policy is to store spent fuel for
ultimate disposal rather than for reprocess, leaving potential energy unused (Nuclear Regulatory
Commission, 2014).
Yet again, there is a potential solution to the energy problem. Molten salt reactors, which appeared
in the 1950s, present a much safer and economical approach to nuclear power. Molten salt reactors
use the same material as both its fuel and coolant. This permits the use of spent LWR fuel, fresh
low-enrichment uranium-based fuel, or thorium-based fuel. Molten salt reactors were studied for
a short period of time in the 1950s to the 1960s, but major research in Oak Ridge National
Laboratory in Tennessee was shut down and the United States focused more on implementation of
the pressurized water and boiling water reactors (Wood, 2007).
This project re-opened molten salt reactor research. With help from the Oak Ridge experiment,
current research, and chemical engineering plant design concepts, this project aimed to create a

modern, feasible design for a pilot reactor to produce steam to meet campus heating needs.
Successful installation of such a unit may reduce energy and labor costs for the University, and
will also act as a research and learning tool for future students. While this project focused on
determining a feasible design for a steam generation system, future research may include cost and
logistics of building and installing the reactor, as well as materials and thermal considerations not
taken into account for these initial calculations. The purpose of this project was to outline a process
for analyzing and designing the steam generation loop from given thermal energy needs.
2 BACKGROUND
2.1 The World Energy Problem
Global warming and energy use have become increasingly popular topics in the 21st century. The
energy problem is nearly unavoidable. The worlds of research, media, and literature have all taken
notice to the issue. The energy problem consists of two main issues: the supply and demand of
energy resources and the environmental impact of energy production.
Holdren’s study on “Population and the Energy Problem” from the University of California
Berkley claimed that “[t]he problem is not that we are running out of energy. It’s that we have
nearly run out of the low-cost energy that has fueled the industrial development of today’s rich
countries.” (Holdren, 1991). Increased demand and depletion of these sources has increased energy
costs as new sources may be harder to find, harder to transport, and require more investment.
Coupled with supply issues is an increasing population and demand, the effect of depleting
resources is intensified. Between 1950 and 1990, the world population doubled. Energy use,
however, quadrupled (Holdren, 1991). “If the cumulative consumption of [gas fuels] continued to
double every 20 years, the initial endowment would be 80% depleted in another 40 years’
(Holdren, 1991).
As mentioned, the energy problem is a two-part conundrum. Energy generation also poses a threat
to the environment. Emissions from burning coal and fossil fuels have a direct impact on the
environment, and are a principle cause of global warming because they affect how much energy
the atmosphere absorbs (Environmental Protection Agency, 2013). The increased heat created by
global warming has a direct impact on habitats, water supply, crop production, and infrastructure
(Environmental Protection Agency, 2013).
2.2 Current Energy Technology and Research
The energy problem has sparked several developments in the energy industry. From recovery
technologies to renewable sources and scrubbing technologies, there have been several efforts to
solve the energy problem.
The National Academy of Sciences identifies several “emerging technologies”. It notes that
“[s]ome will require substantial improvements-or even research breakthroughs- to have a major
impact on our energy market.” However, research in these areas create hope for improvements to
the energy industry. Nuclear power, hydrogen fuel cells and biofuels are just a few of the
technologies being researched today (The National Academy of Sciences, 2014).
2.3 Nuclear Power History and Main Reactor Types
Just as atoms can interact with other atoms by forming or breaking bonds, the nuclei of said atoms
can also interact with other nuclei as well as subatomic particles. In these interactions, neutrons
collide with a nucleus with just the right level of kinetic energy to either be absorbed by the
nucleus, or to cause the nucleus to break apart. These interactions, where the nucleus splits into
separate nuclei, are called fission reactions. In these reactions, the amount of energy released is
significantly higher than that produced in chemical reactions. According to Shultis and Faw, the
amount of energy released in a fission reaction is approximately 50 million times the energy
produced in the formation of carbon dioxide via combustion (Shultis & Faw, 2002).
The potential for energy production from nuclear fission was first shown by Enrico Fermi in 1942
when Chicago Pile 1, the first nuclear reactor, reached the point of producing enough neutrons to
sustain continuous fission reactions (Wood, 2007). This construction of graphite and uranium
exemplified the ability of a nuclear reaction to become self-sustaining by producing excess
neutrons with each fission. It was soon after this discovery that the Manhattan Project began with
the goal of constructing a weapon using nuclear energy for the United States to use in World War
II.
Research into harnessing nuclear energy for military use continued when the United States
government began research into powering military submarines and aircraft with nuclear reactors.
This led to the start of the Aircraft Reactor Experiment (ARE), undertaken by Oak Ridge National
Laboratory (ORNL) in Oak Ridge, Tennessee in 1954. The aim of this experiment was to design
a small reactor capable of powering a military aircraft, but it was determined that a nuclear reactor
with the proper amount of shielding to contain radioactivity would need to be far too heavy to
make flight possible.
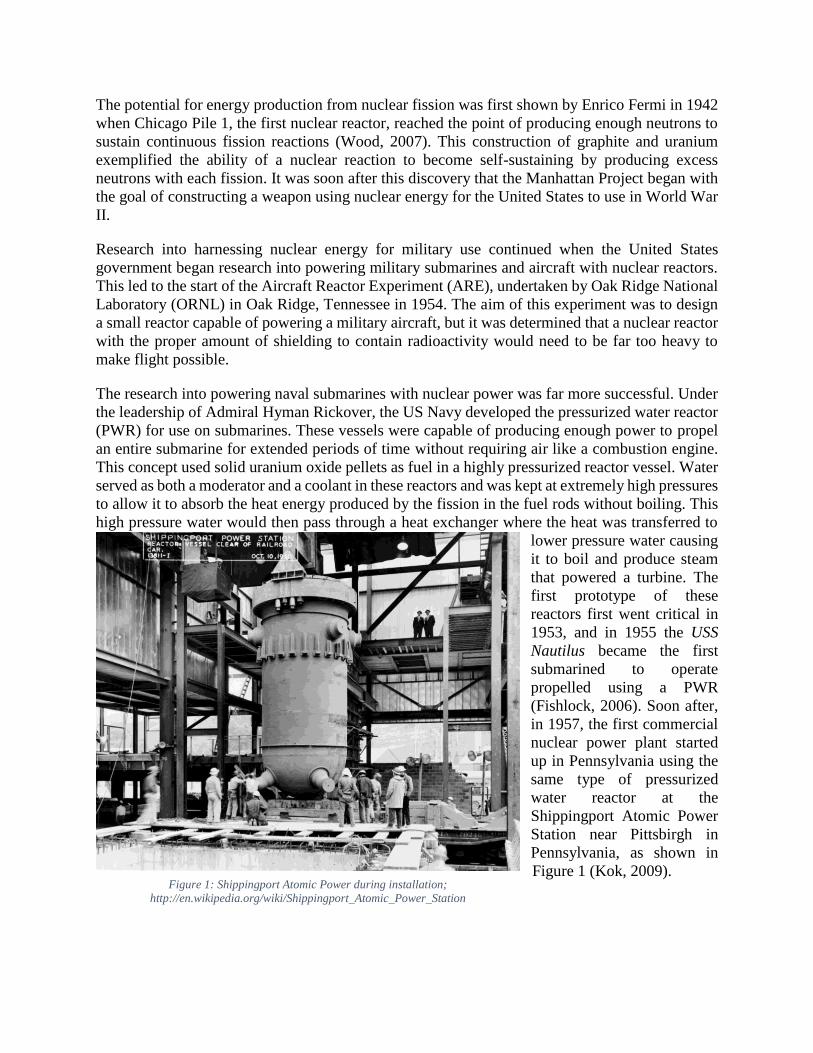
The research into powering naval submarines with nuclear power was far more successful. Under
the leadership of Admiral Hyman Rickover, the US Navy developed the pressurized water reactor
(PWR) for use on submarines. These vessels were capable of producing enough power to propel
an entire submarine for extended periods of time without requiring air like a combustion engine.
This concept used solid uranium oxide pellets as fuel in a highly pressurized reactor vessel. Water
served as both a moderator and a coolant in these reactors and was kept at extremely high pressures
to allow it to absorb the heat energy produced by the fission in the fuel rods without boiling. This
high pressure water would then pass through a heat exchanger where the heat was transferred to
lower pressure water causing
it to boil and produce steam
that powered a turbine. The
first prototype of these
reactors first went critical in
1953, and in 1955 the USS
Nautilus became the first
submarined to operate
propelled using a PWR
(Fishlock, 2006). Soon after,
in 1957, the first commercial
nuclear power plant started
up in Pennsylvania using the
same type of pressurized
water reactor at the
Shippingport Atomic Power
Station near Pittsbirgh in
Pennsylvania, as shown in
Figure 1 (Kok, 2009).
Figure 1: Shippingport Atomic Power during installation;
http://en.wikipedia.org/wiki/Shippingport_Atomic_Power_Station
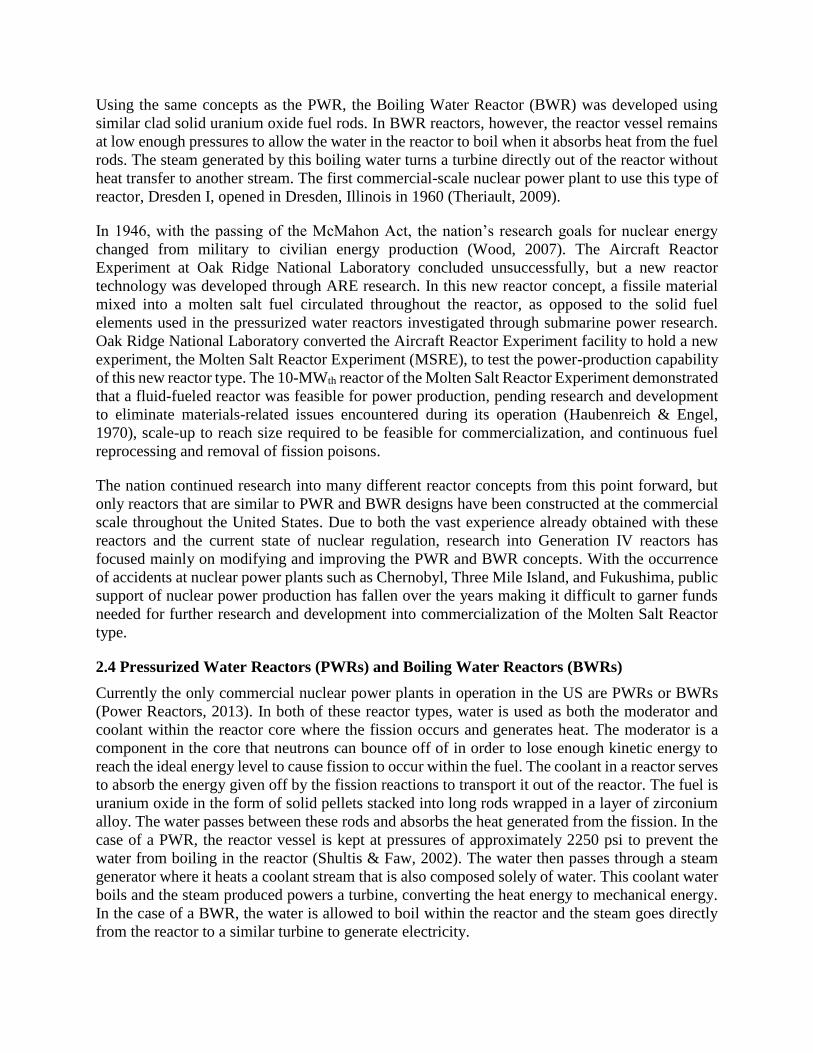
Using the same concepts as the PWR, the Boiling Water Reactor (BWR) was developed using
similar clad solid uranium oxide fuel rods. In BWR reactors, however, the reactor vessel remains
at low enough pressures to allow the water in the reactor to boil when it absorbs heat from the fuel
rods. The steam generated by this boiling water turns a turbine directly out of the reactor without
heat transfer to another stream. The first commercial-scale nuclear power plant to use this type of
reactor, Dresden I, opened in Dresden, Illinois in 1960 (Theriault, 2009).
In 1946, with the passing of the McMahon Act, the nation’s research goals for nuclear energy
changed from military to civilian energy production (Wood, 2007). The Aircraft Reactor
Experiment at Oak Ridge National Laboratory concluded unsuccessfully, but a new reactor
technology was developed through ARE research. In this new reactor concept, a fissile material
mixed into a molten salt fuel circulated throughout the reactor, as opposed to the solid fuel
elements used in the pressurized water reactors investigated through submarine power research.
Oak Ridge National Laboratory converted the Aircraft Reactor Experiment facility to hold a new
experiment, the Molten Salt Reactor Experiment (MSRE), to test the power-production capability
of this new reactor type. The 10-MWth reactor of the Molten Salt Reactor Experiment demonstrated
that a fluid-fueled reactor was feasible for power production, pending research and development
to eliminate materials-related issues encountered during its operation (Haubenreich & Engel,
1970), scale-up to reach size required to be feasible for commercialization, and continuous fuel
reprocessing and removal of fission poisons.
The nation continued research into many different reactor concepts from this point forward, but
only reactors that are similar to PWR and BWR designs have been constructed at the commercial
scale throughout the United States. Due to both the vast experience already obtained with these
reactors and the current state of nuclear regulation, research into Generation IV reactors has
focused mainly on modifying and improving the PWR and BWR concepts. With the occurrence
of accidents at nuclear power plants such as Chernobyl, Three Mile Island, and Fukushima, public
support of nuclear power production has fallen over the years making it difficult to garner funds
needed for further research and development into commercialization of the Molten Salt Reactor
type.
2.4 Pressurized Water Reactors (PWRs) and Boiling Water Reactors (BWRs)
Currently the only commercial nuclear power plants in operation in the US are PWRs or BWRs
(Power Reactors, 2013). In both of these reactor types, water is used as both the moderator and
coolant within the reactor core where the fission occurs and generates heat. The moderator is a
component in the core that neutrons can bounce off of in order to lose enough kinetic energy to
reach the ideal energy level to cause fission to occur within the fuel. The coolant in a reactor serves
to absorb the energy given off by the fission reactions to transport it out of the reactor. The fuel is
uranium oxide in the form of solid pellets stacked into long rods wrapped in a layer of zirconium
alloy. The water passes between these rods and absorbs the heat generated from the fission. In the
case of a PWR, the reactor vessel is kept at pressures of approximately 2250 psi to prevent the
water from boiling in the reactor (Shultis & Faw, 2002). The water then passes through a steam
generator where it heats a coolant stream that is also composed solely of water. This coolant water
boils and the steam produced powers a turbine, converting the heat energy to mechanical energy.
In the case of a BWR, the water is allowed to boil within the reactor and the steam goes directly
from the reactor to a similar turbine to generate electricity.
The safety system of a PWR or BWR relies mainly on the insertion of control rods or blades into
the reactor core in situations where the reactor has reached limits of safe operation. These control
rods are made of materials, such as boron or a silver-indium-cadmium mixture, that absorb
neutrons to prevent them from colliding with fissile atoms to continue the chain reaction. In
addition, containment is a main consideration in initial reactor design to prevent any escape of
radiation or materials in such situations. Pressurized and boiling water reactors are housed within
containment buildings with thick concrete walls to keep any leaked reactor contents or radiation
emissions from escaping into the surrounding environment. If any part of the reactor or coolant
circulation system failed for any reason, the containment building would hold the leak and keep
surrounding personnel, buildings, and plant and animal life safe from exposure to the radioactive
fuel, fission products and byproducts, and any other components that may produce harmful
radiation particles.
Throughout the operation of the reactor, isotopes of different elements are produced to form the
reactor waste. When a uranium atom undergoes fission, neutrons collide with the atom’s nucleus
and cause it to break unevenly, forming fission products with mass depending on how the protons
and neutrons split between the new nuclei, as well as well as more neutrons. Fisison products are
radioactive or unstable and decay to more stable elements by giving off energy or charged particles.
In some cases, the neutron doesn’t have enough energy in the collision so it is just absorbed by the
nucleus and a different isotope of uranium is formed. In any reactor, all of these things will be
occurring with many isotopes of different elements. This leads to the production of a variety of
waste byproducts that are classified as either high level, transuranic, intermediate level, or low
level waste based on their radioactivity and components (Shultis & Faw, 2002).
High level waste is highly radioactive and contains the fission products that build up within the
reactor fuel. Transuranics are actinide elements with atomic numbers greater than 92 that are
formed in reactor fuels by neutron absorption and radioactive decay and remain highly radioactive
for thousands of years (Kok, 2009). Low level wastes include contaminated materials that are not
part of the reactor, and are much less radioactive than the high level and transuranic waste (Shultis
& Faw, 2002). Low level waste can generally be sent away and stored for disposal, but high level
waste and transuranics cause more problems. The United States does not currently have a long-
term solution for the ever-growing quantities of high-level and transuranic waste produced by these
reactors, though options are being considered.
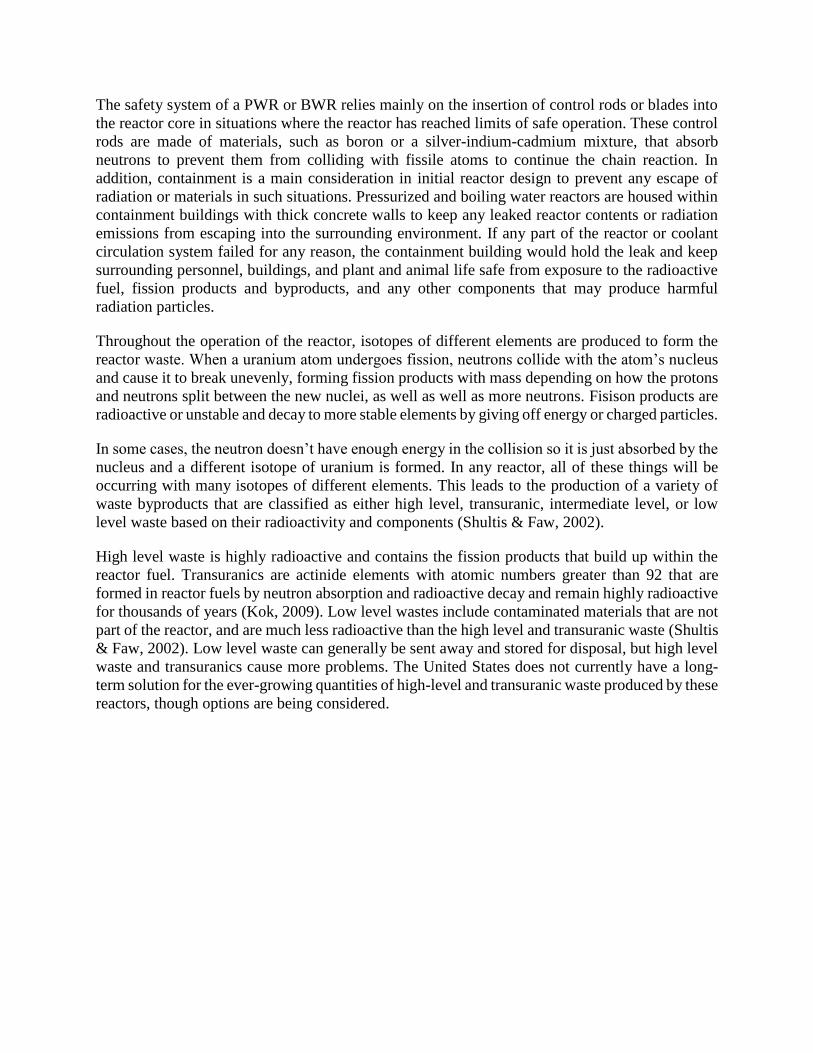
2.5 Molten Salt Reactor Experiment (MSRE)
The Molten Salt Reactor
Experiment (MSRE) was approved
by the Atomic Energy Commission
in 1961 with the goal of studying
the molten salt-fuelled reactor
concept developed through
research for the Aircraft Nuclear
Propulsion Experiment. The
MSRE was not used for power
generation, but to demonstrate
general feasibility of someday
using the molten-salt reactor
technology for commercial power
production. A small-scale reactor
capable of producing a maximum
of 10MW was constructed on the
Oak Ridge National Laboratory
site in the building previously
dedicated to aircraft propulsion
studies. Actual operation of the
molten salt reactor began in 1964
and continued for approximately
five years. Throughout operation,
the reactor was operated at
different power levels, allowing for
analysis of different operating
conditions, development of equipment improvements, and studies of the fuel and reactor
component behavior (Haubenreich & Engel, 1970). A picture of the reactor during installation is
show in Figure 2.
Figure 2: MSRE Reactor Vessel during Installation (Robertson, 1965)
The most promising aspects of molten salt reactors were related to fuel efficiency, stability, and
costs, as well as safety features, and neutron economy (Robertson, 1965). In a molten salt reactor,
unlike PWRs and BWRs, the fuel flows throughout the reactor system in liquid form. This
eliminates many costs incurred with solid fuel rod design, development, and implementation. This
also eliminates the cladding needed for solid fuel rods, which are disposed in high level waste,
further saving costs in the fuel cycle. Fuel can also be added or processed as part of reactor
operation (Robertson, 1965), unlike PWRs and BWRs which require shut-down periods
throughout every one or two years throughout the life of the reactor for fuel reloading and removal
for eliminating fission products that impede reactor operation (Shultis & Faw, 2002). Molten salt
fuel also allows for savings in pumping costs because the reactor operates at high temperatures
and does not require pressurization.
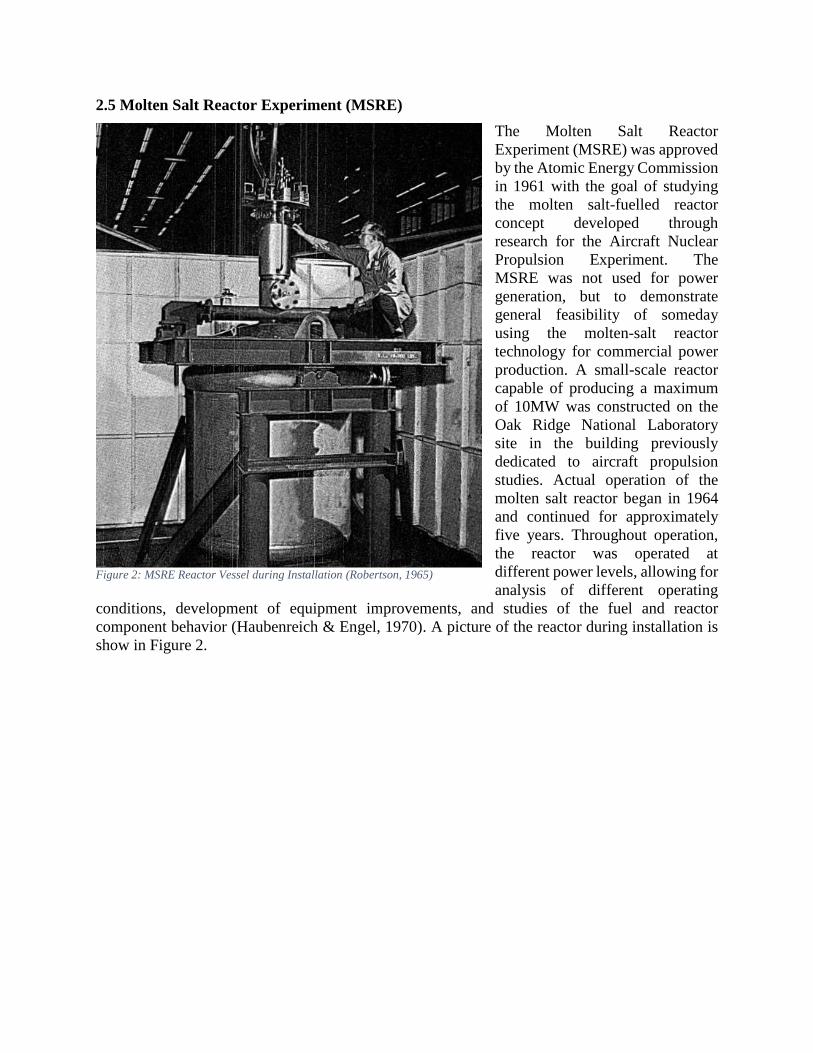
Figure 3: MSRE Flow Diagram
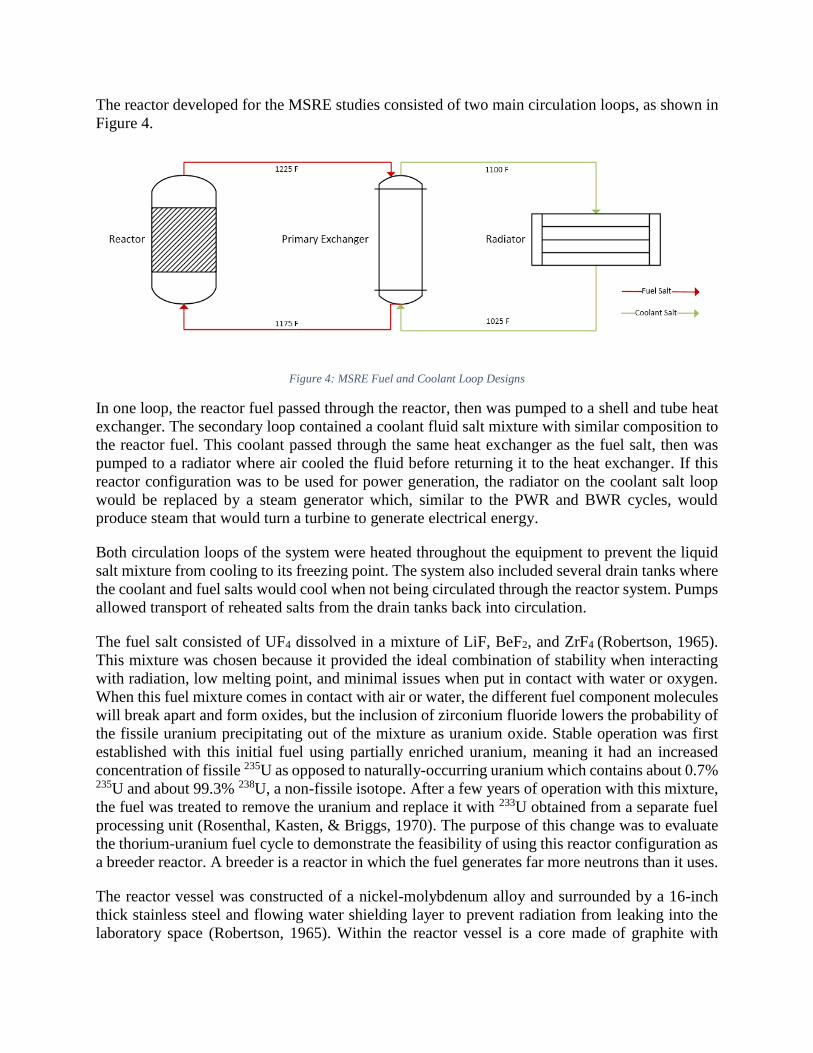
The reactor developed for the MSRE studies consisted of two main circulation loops, as shown in
Figure 4.
Figure 4: MSRE Fuel and Coolant Loop Designs
In one loop, the reactor fuel passed through the reactor, then was pumped to a shell and tube heat
exchanger. The secondary loop contained a coolant fluid salt mixture with similar composition to
the reactor fuel. This coolant passed through the same heat exchanger as the fuel salt, then was
pumped to a radiator where air cooled the fluid before returning it to the heat exchanger. If this
reactor configuration was to be used for power generation, the radiator on the coolant salt loop
would be replaced by a steam generator which, similar to the PWR and BWR cycles, would
produce steam that would turn a turbine to generate electrical energy.
Both circulation loops of the system were heated throughout the equipment to prevent the liquid
salt mixture from cooling to its freezing point. The system also included several drain tanks where
the coolant and fuel salts would cool when not being circulated through the reactor system. Pumps
allowed transport of reheated salts from the drain tanks back into circulation.
The fuel salt consisted of UF4 dissolved in a mixture of LiF, BeF2, and ZrF4 (Robertson, 1965).
This mixture was chosen because it provided the ideal combination of stability when interacting
with radiation, low melting point, and minimal issues when put in contact with water or oxygen.
When this fuel mixture comes in contact with air or water, the different fuel component molecules
will break apart and form oxides, but the inclusion of zirconium fluoride lowers the probability of
the fissile uranium precipitating out of the mixture as uranium oxide. Stable operation was first
established with this initial fuel using partially enriched uranium, meaning it had an increased
concentration of fissile 235U as opposed to naturally-occurring uranium which contains about 0.7% 235U and about 99.3% 238U, a non-fissile isotope. After a few years of operation with this mixture,
the fuel was treated to remove the uranium and replace it with 233U obtained from a separate fuel
processing unit (Rosenthal, Kasten, & Briggs, 1970). The purpose of this change was to evaluate
the thorium-uranium fuel cycle to demonstrate the feasibility of using this reactor configuration as
a breeder reactor. A breeder is a reactor in which the fuel generates far more neutrons than it uses.
The reactor vessel was constructed of a nickel-molybdenum alloy and surrounded by a 16-inch
thick stainless steel and flowing water shielding layer to prevent radiation from leaking into the
laboratory space (Robertson, 1965). Within the reactor vessel is a core made of graphite with
grooves cut out where fuel flows and reaches a critical configuration. Within these grooves, the
uranium within the fuel salt mixture underwent fission to produce heat energy, which built up until
the fuel stream reached the heat exchanger. There the fuel salt passed on the shell side of the heat
exchanger, where the heat created within the reactor was transferred to the coolant salt. Because
the reactor was not used for power production, the heat was allowed to radiate from the coolant
salt into the air.
Upon completion of the MSRE in 1969, several conclusions could be drawn relating to the
feasibility of commercial power production by molten salt-fueled reactors. It was found that the
fuel remained chemically stable, corrosion of the reactor materials was low, and that complete
containment of radioactivity was attainable (Haubenreich & Engel, 1970). These conclusions
showed that design and operation of a molten salt-fueled reactor was indeed feasible, increasing
the promising outlook of this technology.
2.6 Current Molten Salt Reactor Technology
Today, the Molten Salt Reactor is one of six main designs being considered in the Generation IV
class of reactors and is currently being researched mainly by Russia, France, and the European
Union (Generation IV International Forum, 2013). The MOSART reactor concept currently being
researched in Russia is a molten-salt reactor able to process transuranics (long-lived, highly
radioactive by-products created during fission of uranium) and thus reduce the amount of
dangerous waste produced by currently operating PWR and BWR type reactors (Ignatiev, et al.,
2014).
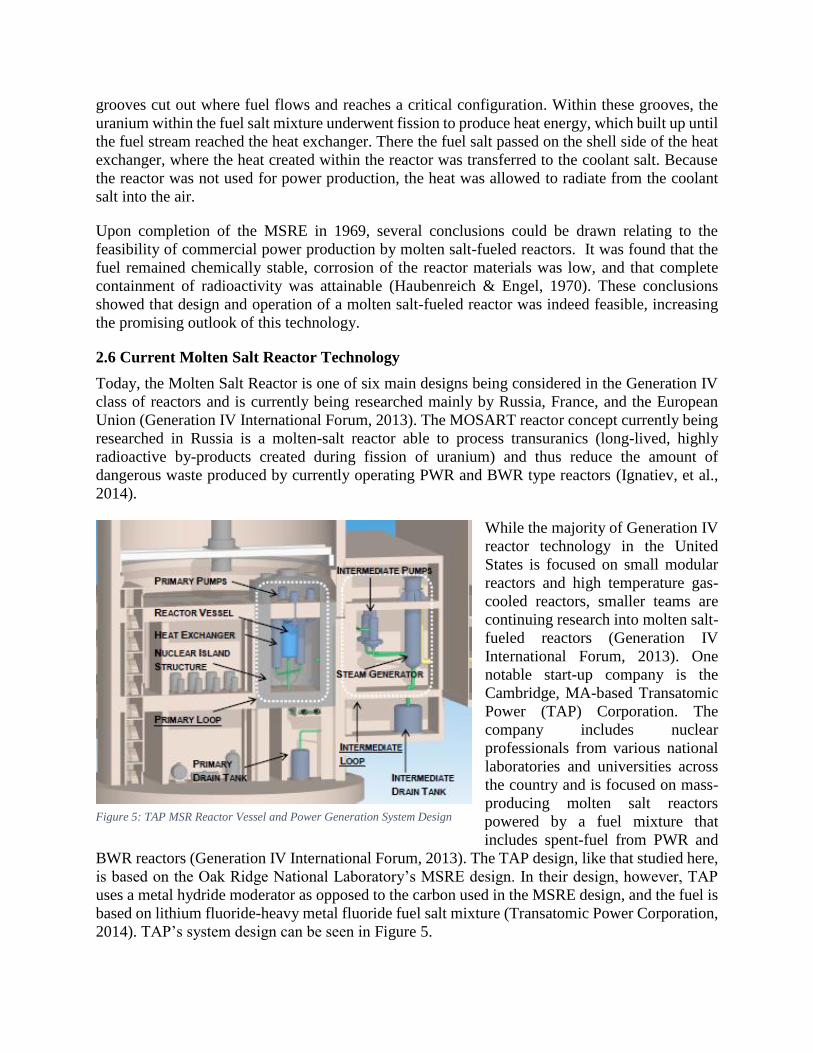
While the majority of Generation IV
reactor technology in the United
States is focused on small modular
reactors and high temperature gas-
cooled reactors, smaller teams are
continuing research into molten salt-
fueled reactors (Generation IV
International Forum, 2013). One
notable start-up company is the
Cambridge, MA-based Transatomic
Power (TAP) Corporation. The
company includes nuclear
professionals from various national
laboratories and universities across
the country and is focused on mass-
producing molten salt reactors
powered by a fuel mixture that
includes spent-fuel from PWR and
BWR reactors (Generation IV International Forum, 2013). The TAP design, like that studied here,
is based on the Oak Ridge National Laboratory’s MSRE design. In their design, however, TAP
uses a metal hydride moderator as opposed to the carbon used in the MSRE design, and the fuel is
based on lithium fluoride-heavy metal fluoride fuel salt mixture (Transatomic Power Corporation,
2014). TAP’s system design can be seen in Figure 5.
Figure 5: TAP MSR Reactor Vessel and Power Generation System Design
2.7 Use at WPI
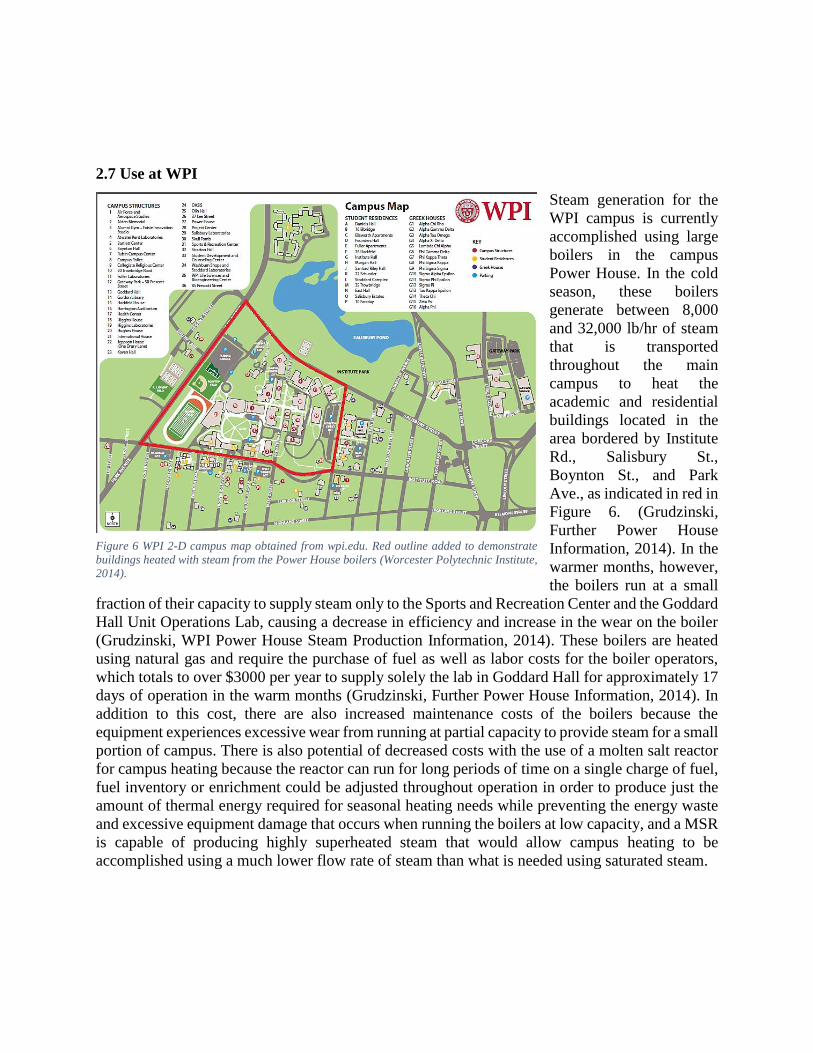
Steam generation for the
WPI campus is currently
accomplished using large
boilers in the campus
Power House. In the cold
season, these boilers
generate between 8,000
and 32,000 lb/hr of steam
that is transported
throughout the main
campus to heat the
academic and residential
buildings located in the
area bordered by Institute
Rd., Salisbury St.,
Boynton St., and Park
Ave., as indicated in red in
Figure 6. (Grudzinski,
Further Power House
Information, 2014). In the
warmer months, however,
the boilers run at a small
fraction of their capacity to supply steam only to the Sports and Recreation Center and the Goddard
Hall Unit Operations Lab, causing a decrease in efficiency and increase in the wear on the boiler
(Grudzinski, WPI Power House Steam Production Information, 2014). These boilers are heated
using natural gas and require the purchase of fuel as well as labor costs for the boiler operators,
which totals to over $3000 per year to supply solely the lab in Goddard Hall for approximately 17
days of operation in the warm months (Grudzinski, Further Power House Information, 2014). In
addition to this cost, there are also increased maintenance costs of the boilers because the
equipment experiences excessive wear from running at partial capacity to provide steam for a small
portion of campus. There is also potential of decreased costs with the use of a molten salt reactor
for campus heating because the reactor can run for long periods of time on a single charge of fuel,
fuel inventory or enrichment could be adjusted throughout operation in order to produce just the
amount of thermal energy required for seasonal heating needs while preventing the energy waste
and excessive equipment damage that occurs when running the boilers at low capacity, and a MSR
is capable of producing highly superheated steam that would allow campus heating to be
accomplished using a much lower flow rate of steam than what is needed using saturated steam.
Figure 6 WPI 2-D campus map obtained from wpi.edu. Red outline added to demonstrate
buildings heated with steam from the Power House boilers (Worcester Polytechnic Institute,
2014).
3. METHODOLOGY
The goal of this project was to evaluate the feasibility of using a molten salt reactor similar to that
used in Oak Ridge National Laboratory’s Molten Salt Reactor Experiment of the 1960s for steam
generation on the WPI campus to be used for heating in the winter. In order to evaluate this, a
series of objectives were met, as follows:
1. Determine thermal energy required for WPI campus heating based on steam conditions and
flow rate obtained from interviews with the campus Power House Chief Engineer
2. Evaluate steam generation that can be accomplished using the same conditions used in the
Molten Salt Reactor Experiment and model MSRE steam generation system using Aspen
Plus to validate calculated results
3. Calculate the reactor thermal power output required from a PWR and a MSR to produce
superheated steam with the energy content required to meet campus needs, and model PWR
and MSR steam generation
4. Design heat exchanger network for steam generation using a molten salt reactor to produce
steam to meet campus heating needs and simulate design in Aspen Plus to verify design
calculation results
3.1 Step 1: Campus Heating Needs Calculation
Heat for the majority of WPI campus is currently provided by saturated steam generated in natural
gas-fuelled boilers in the Power House. Because the steam generated is saturated, the enthalpy, H,
was determined from steam tables. This enthalpy value was used in Equation 1 to calculate the
total thermal energy required for heating campus at the maximum steam production rate.
𝑄𝑛𝑒𝑒𝑑𝑒𝑑 = �̇�𝐻 (1)
This energy needed value was used in further calculations to evaluate the ability of the MSRE
design for campus heating, as well as to calculate the reactor thermal output required from a PWR
and from an MSR to heat campus. These calculations are shown in Appendix A.1.
To validate the calculations done, an Aspen Simulation was run using a furnace or fired heater
block.
3.2 Step 2: MSRE Steam Generation Assessment
3.2.1 Steam Generation Loop Design
The MSRE set-up consisted of a reactor attached to a fuel circulation loop, a primary heat
exchanger where heat is transferred from the fuel to a coolant salt loop where heat was removed
through a radiator and expelled to the atmosphere through a heat stack (Robertson, 1965). The
purpose of this project was to design a process that would utilize the heat production from a molten
salt reactor. This was a simple process design that involved the addition of a steam generator in
the place of the radiator.
For steam generation calculations, a three-exchanger system was adopted for the steam generator
design. Per Teir’s suggested calculations in “Basics of Steam Generation”, the generator
calculations approximated a heat recovery steam generator as a series of heat exchangers (Teir,
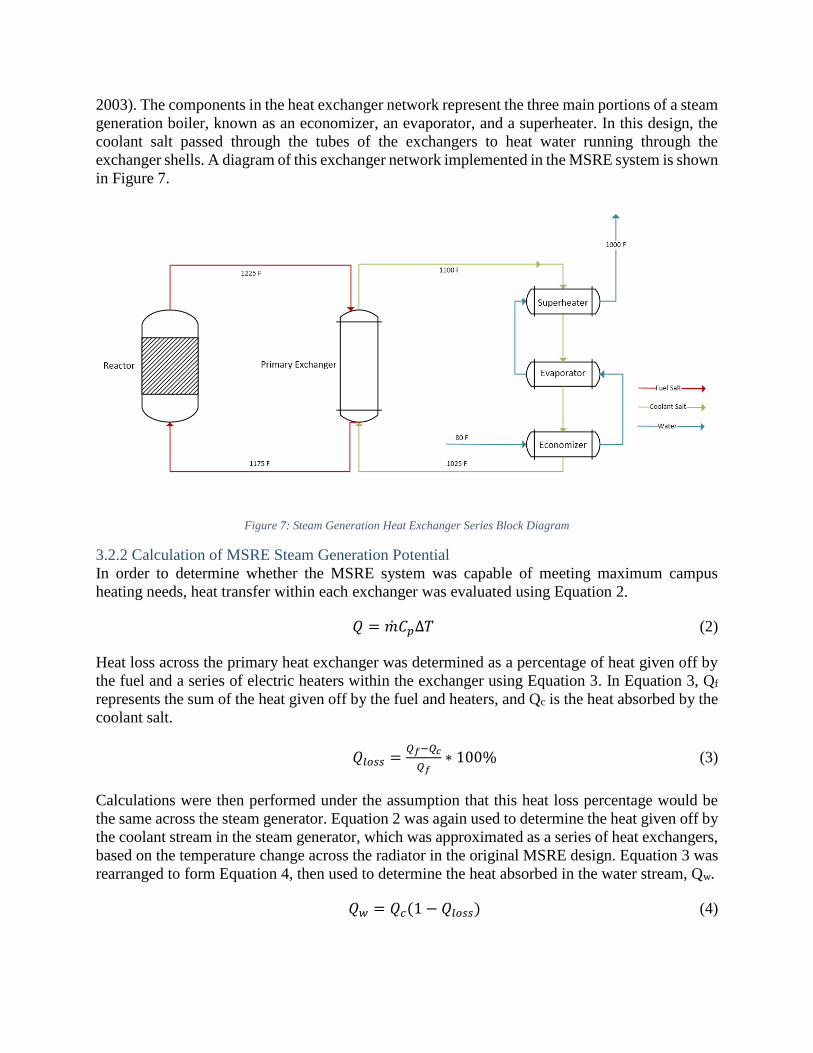
2003). The components in the heat exchanger network represent the three main portions of a steam
generation boiler, known as an economizer, an evaporator, and a superheater. In this design, the
coolant salt passed through the tubes of the exchangers to heat water running through the
exchanger shells. A diagram of this exchanger network implemented in the MSRE system is shown
in Figure 7.
Figure 7: Steam Generation Heat Exchanger Series Block Diagram
3.2.2 Calculation of MSRE Steam Generation Potential
In order to determine whether the MSRE system was capable of meeting maximum campus
heating needs, heat transfer within each exchanger was evaluated using Equation 2.
𝑄 = �̇�𝐶𝑝Δ𝑇 (2)
Heat loss across the primary heat exchanger was determined as a percentage of heat given off by
the fuel and a series of electric heaters within the exchanger using Equation 3. In Equation 3, Qf
represents the sum of the heat given off by the fuel and heaters, and Qc is the heat absorbed by the
coolant salt.
𝑄𝑙𝑜𝑠𝑠 =𝑄𝑓−𝑄𝑐
𝑄𝑓∗ 100% (3)
Calculations were then performed under the assumption that this heat loss percentage would be
the same across the steam generator. Equation 2 was again used to determine the heat given off by
the coolant stream in the steam generator, which was approximated as a series of heat exchangers,
based on the temperature change across the radiator in the original MSRE design. Equation 3 was
rearranged to form Equation 4, then used to determine the heat absorbed in the water stream, Qw.
𝑄𝑤 = 𝑄𝑐(1 − 𝑄𝑙𝑜𝑠𝑠) (4)
Qw represents the sum of the heat absorbed by the water in each of the heat exchangers used to
approximate the steam generator. The overall heat transferred to the water/steam stream within the
steam generator was modeled by Equation 5. The three heat exchangers used to approximate the
steam generator were the economizer, where the water was heated to saturation temperature, the
evaporator where the latent heat of vaporization, λ, was added to convert the saturated water to
saturated steam, and the superheater that heats the saturated steam above the saturation temperature
to 1000°F.
𝑄𝑤 = �̇�𝑤(𝐶𝑝𝑤Δ𝑇𝑒𝑐𝑜𝑛𝑜𝑚𝑖𝑧𝑒𝑟 + 𝜆 + 𝐶𝑝𝑠Δ𝑇𝑠𝑢𝑝𝑒𝑟ℎ𝑒𝑎𝑡𝑒𝑟) (5)
Equation 5 was used to calculate the flow rate of steam that could be produced from this system
as follows in Equation 6:
�̇�𝑤 =𝑄𝑤
(𝐶𝑝𝑤Δ𝑇𝑒𝑐𝑜𝑛𝑜𝑚𝑖𝑧𝑒𝑟+𝜆+𝐶𝑝𝑠Δ𝑇𝑠𝑢𝑝𝑒𝑟ℎ𝑒𝑎𝑡𝑒𝑟) (6)
One of the main benefits of the molten salt reactor is that it is capable of producing highly
superheated steam because of the high temperatures of the fuel and coolant salts. The enthalpy of
superheated steam is greater than that of saturated steam, so equivalent heating can be
accomplished with a lower flow rate. The enthalpy of 1000°F and 100 psig steam and the
calculated flow rate that could be produced were used in Equation 1 to determine the thermal
energy content of the steam produced to compare to the calculated campus heating need.
3.2.3 Aspen Plus Simulation of Steam Generation Using MSRE System
Aspen simulations were performed using the specifications from the Oak Ridge MSRE. This was
done to validate parameters given in the Oak Ridge reports and give more information on the
design loop. Information from the simulations was also used in proceeding simulations.
The simulation was run to obtain heat duties of the exchangers and steam production, as well as to
verify the use of Aspen and heat transfer calculations to optimize the steam generation loop design
in future steps.
3.2.3.1 Simulation Using Furnace/Fired Heater Block
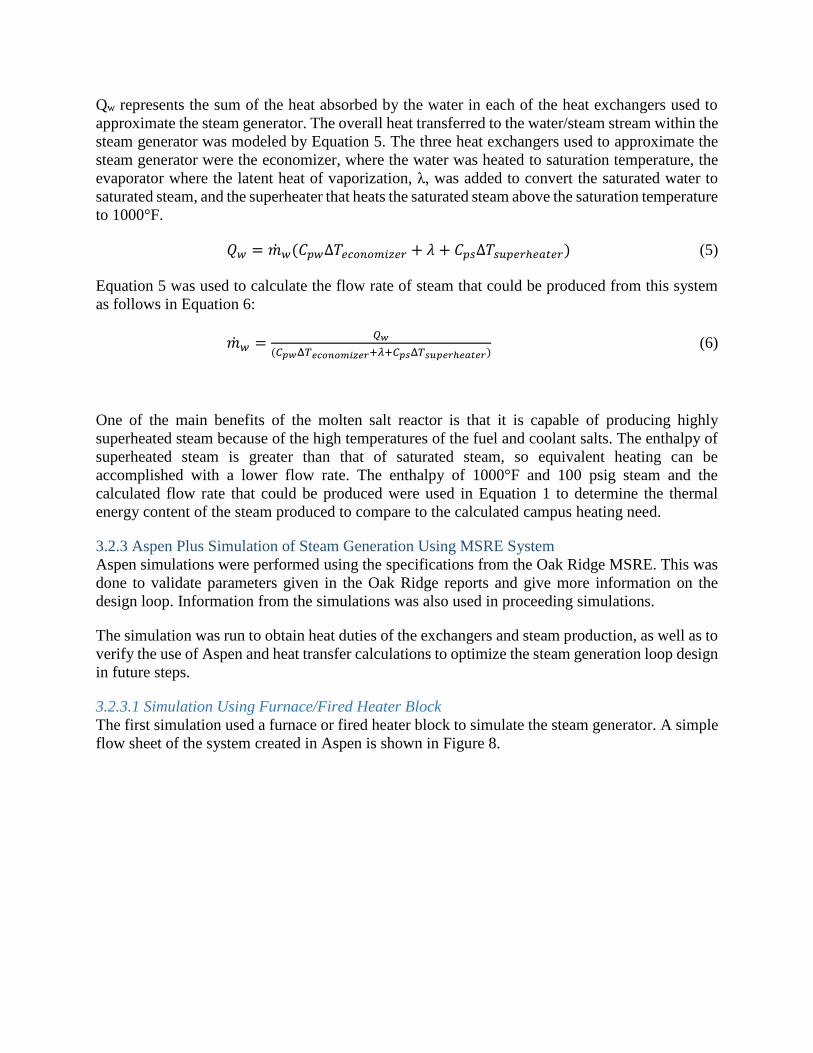
The first simulation used a furnace or fired heater block to simulate the steam generator. A simple
flow sheet of the system created in Aspen is shown in Figure 8.
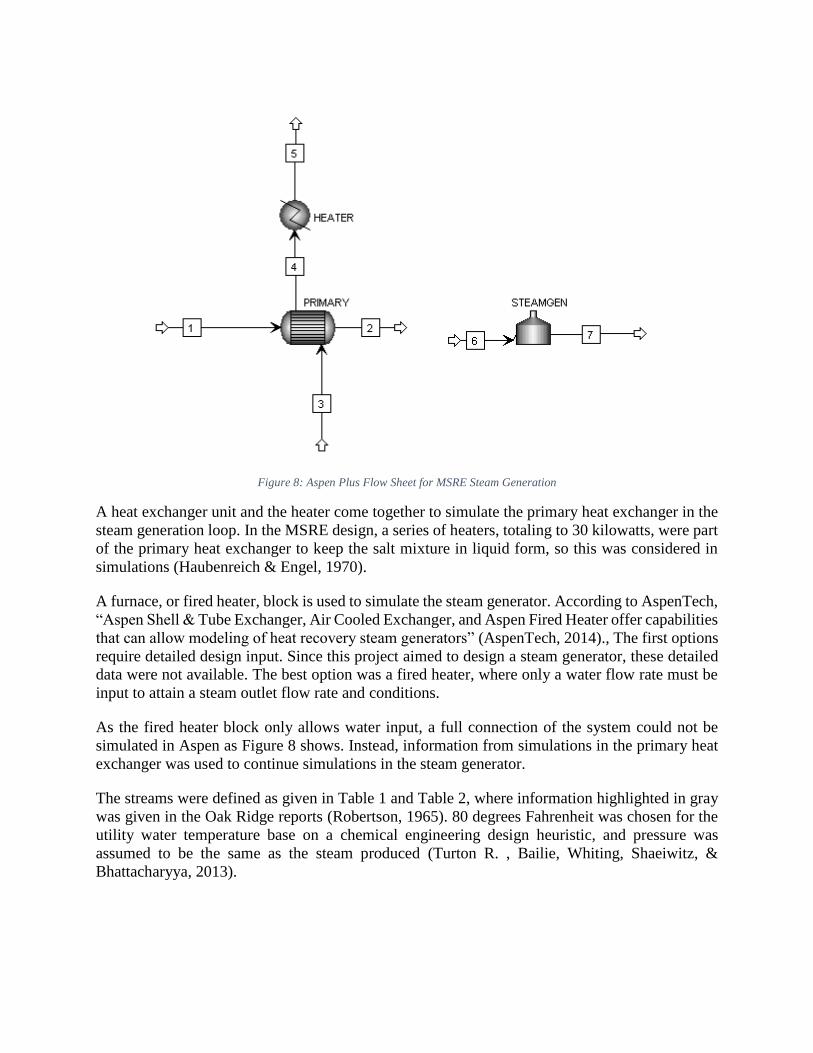
Figure 8: Aspen Plus Flow Sheet for MSRE Steam Generation
A heat exchanger unit and the heater come together to simulate the primary heat exchanger in the
steam generation loop. In the MSRE design, a series of heaters, totaling to 30 kilowatts, were part
of the primary heat exchanger to keep the salt mixture in liquid form, so this was considered in
simulations (Haubenreich & Engel, 1970).
A furnace, or fired heater, block is used to simulate the steam generator. According to AspenTech,
“Aspen Shell & Tube Exchanger, Air Cooled Exchanger, and Aspen Fired Heater offer capabilities
that can allow modeling of heat recovery steam generators” (AspenTech, 2014)., The first options
require detailed design input. Since this project aimed to design a steam generator, these detailed
data were not available. The best option was a fired heater, where only a water flow rate must be
input to attain a steam outlet flow rate and conditions.
As the fired heater block only allows water input, a full connection of the system could not be
simulated in Aspen as Figure 8 shows. Instead, information from simulations in the primary heat
exchanger was used to continue simulations in the steam generator.
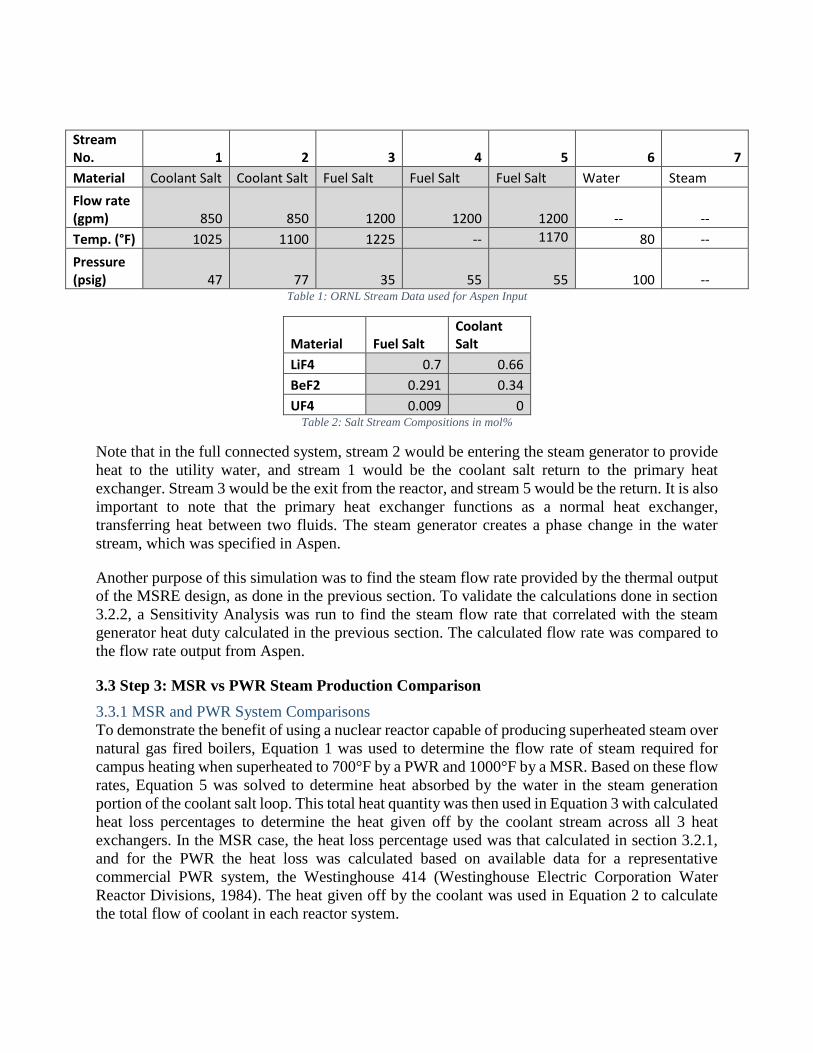
The streams were defined as given in Table 1 and Table 2, where information highlighted in gray
was given in the Oak Ridge reports (Robertson, 1965). 80 degrees Fahrenheit was chosen for the
utility water temperature base on a chemical engineering design heuristic, and pressure was
assumed to be the same as the steam produced (Turton R. , Bailie, Whiting, Shaeiwitz, &
Bhattacharyya, 2013).
Stream No. 1 2 3 4
5 6 7
Material Coolant Salt Coolant Salt Fuel Salt Fuel Salt Fuel Salt Water Steam
Flow rate (gpm) 850 850 1200 1200
1200 -- --
Temp. (°F) 1025 1100 1225 -- 1170 80 --
Pressure (psig) 47 77 35 55
55 100 --
Table 1: ORNL Stream Data used for Aspen Input
Material Fuel Salt Coolant Salt
LiF4 0.7 0.66
BeF2 0.291 0.34
UF4 0.009 0 Table 2: Salt Stream Compositions in mol%
Note that in the full connected system, stream 2 would be entering the steam generator to provide
heat to the utility water, and stream 1 would be the coolant salt return to the primary heat
exchanger. Stream 3 would be the exit from the reactor, and stream 5 would be the return. It is also
important to note that the primary heat exchanger functions as a normal heat exchanger,
transferring heat between two fluids. The steam generator creates a phase change in the water
stream, which was specified in Aspen.
Another purpose of this simulation was to find the steam flow rate provided by the thermal output
of the MSRE design, as done in the previous section. To validate the calculations done in section
3.2.2, a Sensitivity Analysis was run to find the steam flow rate that correlated with the steam
generator heat duty calculated in the previous section. The calculated flow rate was compared to
the flow rate output from Aspen.
3.3 Step 3: MSR vs PWR Steam Production Comparison
3.3.1 MSR and PWR System Comparisons
To demonstrate the benefit of using a nuclear reactor capable of producing superheated steam over
natural gas fired boilers, Equation 1 was used to determine the flow rate of steam required for
campus heating when superheated to 700°F by a PWR and 1000°F by a MSR. Based on these flow
rates, Equation 5 was solved to determine heat absorbed by the water in the steam generation
portion of the coolant salt loop. This total heat quantity was then used in Equation 3 with calculated
heat loss percentages to determine the heat given off by the coolant stream across all 3 heat
exchangers. In the MSR case, the heat loss percentage used was that calculated in section 3.2.1,
and for the PWR the heat loss was calculated based on available data for a representative
commercial PWR system, the Westinghouse 414 (Westinghouse Electric Corporation Water
Reactor Divisions, 1984). The heat given off by the coolant was used in Equation 2 to calculate
the total flow of coolant in each reactor system.

In the MSR-based system, the heat given off by the coolant salt was used in Equation 3 to
determine the heat transferred from the fuel salt. In this case, the thermal power of the reactor is
the same as the heat given off by the fuel because the power is generated within the fuel salt itself
as it passes through the reactor. In the PWR system, water serves as the coolant, and heat is
transferred to it from the stationary fuel rods within the reactor core. This means that heat loss
occurs not only in the steam generator, but also within the reactor. Therefore, Equation 3 must be
used to evaluate the thermal output of the reactor using a heat loss percentage calculated based on
Westinghouse 414 PWR data. The reactor output calculations for the PWR system are given in
Appendix A.3 and MSR thermal output calculations are given in Appendix A.4.
Another comparison of the two systems was made using thermal efficiency, which is a ratio of
energy produced by the steam to the energy output of the reactor. In other words, the measure of
thermal energy lost to the environment in each system was compared. Thermal efficiency was
found using Equation 7:
𝑇ℎ𝑒𝑟𝑚𝑎𝑙 𝐸𝑓𝑓𝑖𝑐𝑖𝑒𝑛𝑐𝑦 =𝐸𝑛𝑒𝑟𝑔𝑦 𝑐𝑜𝑛𝑡𝑒𝑛𝑡 𝑜𝑓 𝑆𝑡𝑒𝑎𝑚
𝑇ℎ𝑒𝑟𝑚𝑎𝑙 𝑜𝑢𝑡𝑝𝑢𝑡 𝑜𝑓 𝑟𝑒𝑎𝑐𝑡𝑜𝑟 (7)
Lastly, the reactors were compared using specific power, which is calculated by dividing the
thermal output of the reactor by the mass of Uranium in the fuel:
𝑆𝑝𝑒𝑐𝑖𝑓𝑖𝑐 𝑃𝑜𝑤𝑒𝑟 =𝑇ℎ𝑒𝑟𝑚𝑎𝑙 𝑜𝑢𝑡𝑝𝑢𝑡 𝑜𝑓 𝑟𝑒𝑎𝑐𝑡𝑜𝑟
𝑀𝑎𝑠𝑠 𝑈𝑟𝑎𝑛𝑖𝑢𝑚 𝑖𝑛 𝑓𝑢𝑒𝑙 (8)
3.3.2 Aspen Plus Simulation of MSR and PWR Steam Production
To simulate the steam production differences in a PWR and the MSR in Aspen, only the fired
heater block was used, as pictured in Figure 8. To compare each system, a sensitivity analysis was
done in Aspen to determine the mass flow rate of steam needed for each reactor to meet the energy
needs of WPI, the energy of steam required by WPI, 38,090,000 Btu/hr (Grudzinski, WPI Power
House Steam Production Information, 2014). For the different processes, the fired heater block
required different input. A PWR can only produce saturated high pressure steam (Westinghouse
Electric Corporation Water Reactor Divisions, 1984). In the PWR simulation, only a vapor fraction
of 1 and outlet pressure of 100 psig were specified, which would output saturated steam at 100
psig and 338°F. The use of an MSR allows for steam at much higher temperatures and creation of
superheated steam. In simulating MSR steam generation, degrees of superheat were specified
instead of vapor fraction, keeping in mind that the exiting coolant salt temperature is 1025°F, and
the steam could therefore not exceed around 1000°F. The mass flow rates of steam from the MSR
and PWR loops obtained from Aspen were compared.
3.4 Step 4: Designing MSR Steam Generation Loop for WPI Campus Need
3.4.1 Design Calculations
Based on the calculated campus heating needs, a MSR system was developed using a network of
heat exchangers, as shown in Figure 7, to transfer heat from the reactor fuel salt, to coolant salt,
and finally to steam to generate the necessary quantity of 1000°F superheated steam. The reactor
output was determined in section 3.3.1, but specific reactor sizing would involve nuclear physics
and engineering concepts that were beyond the scope of this project. Therefore the design aspect
of this project focused on sizing of the primary exchanger for heat transfer between fuel and
coolant salts, and sizing of the heat exchangers that made up the steam generation section of the
coolant salt loop.
3.4.1.1 Inner Heat Transfer Coefficient Calculation
In order to effectively design each heat exchanger, Equation 9 needed to be evaluated to determine
A, the total surface area required to transfer the calculated amount of heat. This total surface area
represents the outer area of all of the tubes within the heat exchangers.
𝑄 = 𝑈𝐴Δ𝑇𝐿𝑀 (9)
Q in Equation 7 is the same as the Q value calculated using Equation 2 for the hot stream in each
exchanger. ΔTLM in Equation 6 is the log mean temperature difference across the exchanger, and
U represents the overall heat transfer coefficient. Equation 10 gives the definition of ΔTLM, where
the subscripts h and c indicate the hot and cold streams, respectively, subscripts i and o indicate
inlet and outlet, respectively, and F is a correction factor that accounts for the fact that flow in heat
exchangers of 2 or more passes are not truly countercurrent, which the ΔTLM assumes. A correction
factor of 0.97 was given in the MSRE report and was assumed to be a suitable approximation to
use throughout exchanger sizing calculations (Robertson, 1965).
Δ𝑇𝐿𝑀 =(𝑇ℎ𝑖−𝑇𝑐𝑜)−(𝑇ℎ𝑜−𝑇𝑐𝑖)
ln(𝑇ℎ𝑖−𝑇𝑐𝑜𝑇ℎ𝑜−𝑇𝑐𝑖
)∗ 𝐹 (10)
The overall heat transfer coefficient, U, represents the resistance to heat transfer across the film
of fluid immediately adjacent to the inner boundary of the tube walls, through the pipe itself, and
across the film of fluid immediately adjacent to the outer wall of pipe. The equation form of this
overall heat transfer coefficient is given in Equation 10. Again, subscripts i and o indicate inner
and outer, respectively, while Aave is the average between the total inner area and total outer area
of the tubes, tp is the thickness of the pipe and kp is the thermal conductivity of the pipe material.
1
𝑈𝐴𝑜=
1
ℎ𝑖𝐴𝑖+
𝑡𝑝
𝑘𝑝𝐴𝑎𝑣𝑒+
1
ℎ𝑜𝐴𝑜 (11)
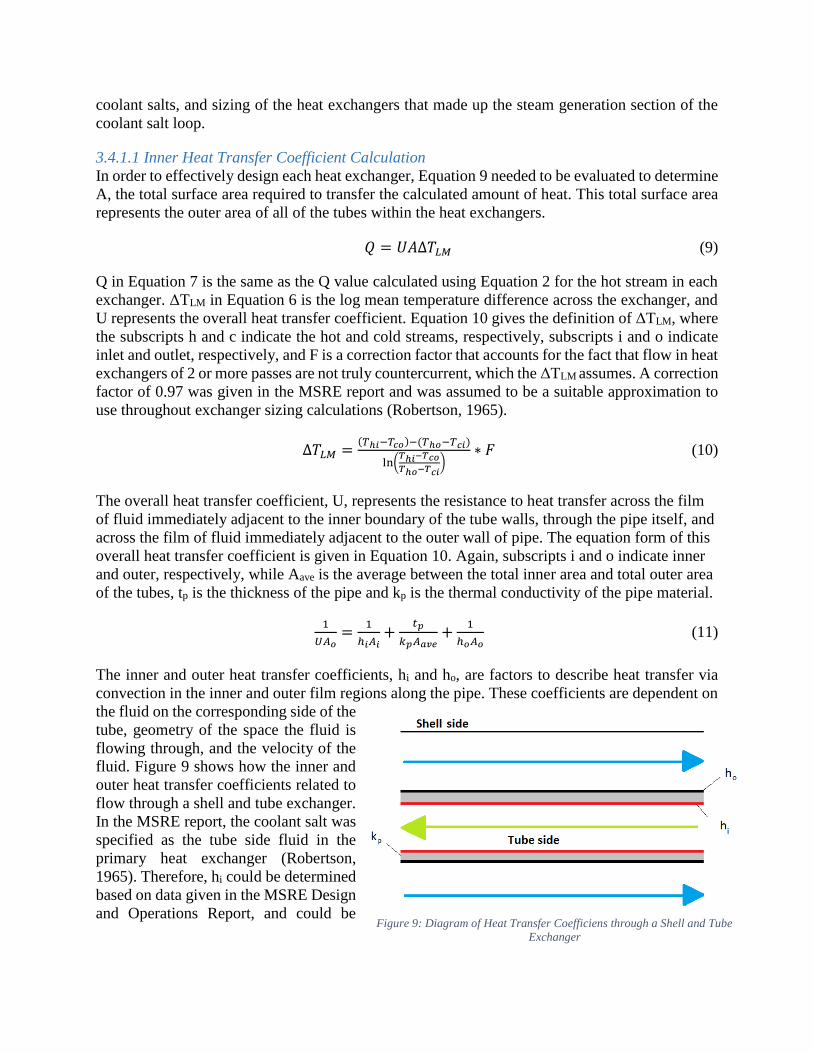
The inner and outer heat transfer coefficients, hi and ho, are factors to describe heat transfer via
convection in the inner and outer film regions along the pipe. These coefficients are dependent on
the fluid on the corresponding side of the
tube, geometry of the space the fluid is
flowing through, and the velocity of the
fluid. Figure 9 shows how the inner and
outer heat transfer coefficients related to
flow through a shell and tube exchanger.
In the MSRE report, the coolant salt was
specified as the tube side fluid in the
primary heat exchanger (Robertson,
1965). Therefore, hi could be determined
based on data given in the MSRE Design
and Operations Report, and could be Figure 9: Diagram of Heat Transfer Coefficiens through a Shell and Tube
Exchanger
used in sizing calculations for this design as long as coolant salt was specified to be the tube side
fluid throughout the system.
The value of hi was calculated using properties of the coolant salt given in the MSRE Design and
Operations Report and Equations 12-15. Equation 12 is the dimensionless parameter known as the
Nusselt number, Re is the Reynold’s number, defined by Equation 13, and Pr is the Prandtl number,
defined by Equation 14. Equation 15 defines the relationship between the three parameters for
turbulent flow, and is known as the Dittus-Boelter Equation (Clark, 2014). The calculated value
of hi from MSRE data, as well as the pipe thickness and thermal conductivity, were taken to be
constant throughout heat exchanger sizing calculations.
𝑁𝑢 =ℎ𝑖𝑑𝑖
𝑘𝑐 (12)
𝑅𝑒 =𝜌𝑐𝑑𝑖𝑣𝑐
𝜇𝑐 (13)
𝑃𝑟 =𝐶𝑝𝑐𝜇𝑐
𝑘𝑐 (14)
𝑁𝑢 = 0.023𝑅𝑒0.8𝑃𝑟0.4 (15)
3.4.1.2 Outer Heat Transfer Coefficient Calculation
The outer heat transfer coefficient depends on the flow characteristics, properties, and flow
geometry of the shell side fluid. In the case of the primary heat exchanger, the shell side fluid was
the same as in the primary exchanger in the MSRE, so the overall heat transfer coefficient was
assumed to be the same for simplicity of design calculations. In the steam generation exchangers,
however, the outer heat transfer coefficient would be different due to the shell side containing
water instead of fuel salt, and the difference in phases between the exchangers containing water.
In these cases, the outer heat transfer had to be calculated separately. Equations 16 and 17 were
obtained from Fundamentals of Heat and Mass Transfer by Bergman et al and was used to estimate
the outer film heat transfer coefficient for the economizer and superheater, where no phase change
occurs (9.6 Empirical Correlations: External Free Convection Flows; 9.6.3 The Long Horizontal
Cylinder, 2011).
𝑅𝑎𝐷 =𝑔𝛽(𝑇𝑠−𝑇𝑏𝑢𝑙𝑘)𝑑𝑜
3
𝜈𝛼 (16)
𝑁𝑢 =ℎ𝑜𝑑𝑜
𝑘
{
0.60 +0.387𝑅𝑎𝐷
16
[1+(0.559
𝑃𝑟)
916]
827
}
2
(17)
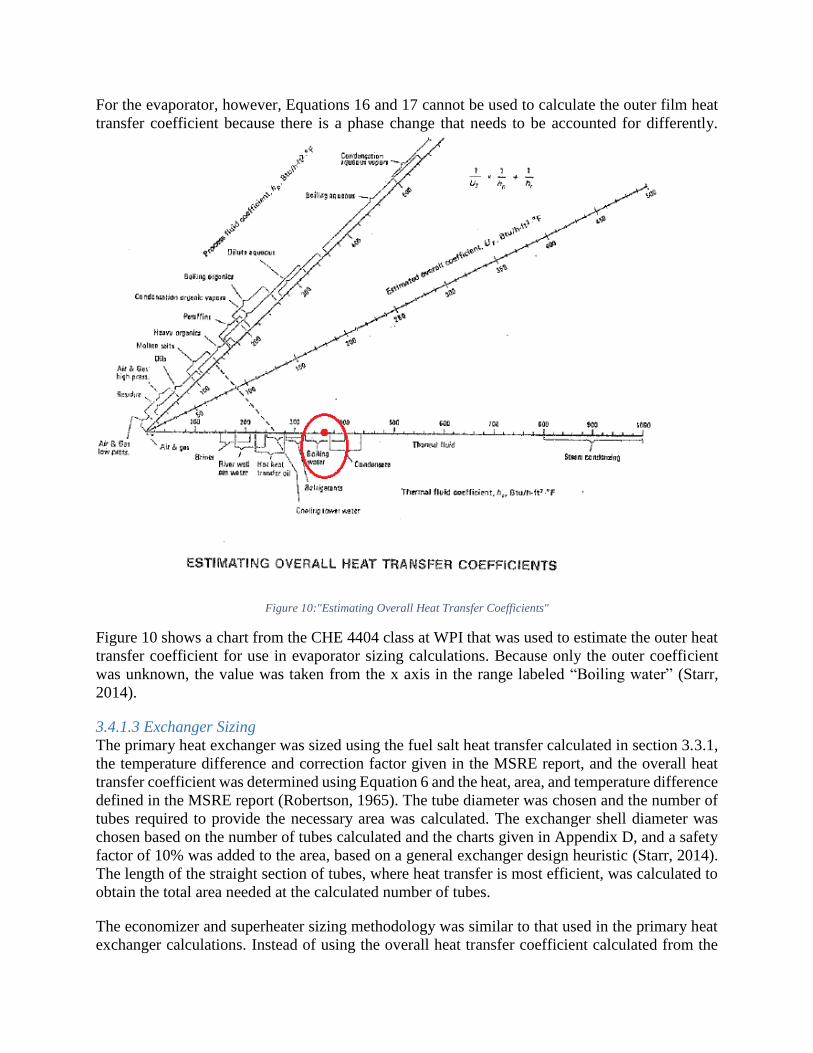
For the evaporator, however, Equations 16 and 17 cannot be used to calculate the outer film heat
transfer coefficient because there is a phase change that needs to be accounted for differently.
Figure 10:"Estimating Overall Heat Transfer Coefficients"
Figure 10 shows a chart from the CHE 4404 class at WPI that was used to estimate the outer heat
transfer coefficient for use in evaporator sizing calculations. Because only the outer coefficient
was unknown, the value was taken from the x axis in the range labeled “Boiling water” (Starr,
2014).
3.4.1.3 Exchanger Sizing
The primary heat exchanger was sized using the fuel salt heat transfer calculated in section 3.3.1,
the temperature difference and correction factor given in the MSRE report, and the overall heat
transfer coefficient was determined using Equation 6 and the heat, area, and temperature difference
defined in the MSRE report (Robertson, 1965). The tube diameter was chosen and the number of
tubes required to provide the necessary area was calculated. The exchanger shell diameter was
chosen based on the number of tubes calculated and the charts given in Appendix D, and a safety
factor of 10% was added to the area, based on a general exchanger design heuristic (Starr, 2014).
The length of the straight section of tubes, where heat transfer is most efficient, was calculated to
obtain the total area needed at the calculated number of tubes.
The economizer and superheater sizing methodology was similar to that used in the primary heat
exchanger calculations. Instead of using the overall heat transfer coefficient calculated from the
MSRE data, though, Equations 16 and 17 were solved for a chosen diameter and given flow and
temperature conditions in each exchanger that did not cause phase change. These heat transfer
coefficients were then used to solve a system of equations including inner and outer area formulae
and Equations 11-15 for the areas, tube straight length, and number of tubes. Similar to the primary
exchanger sizing, the shell diameter was determined using the charts in Appendix D and the actual
tube length was found based on an additional 10% heat transfer area. The evaporator was sized the
same way using the estimated outer film heat transfer coefficient from Figure 10 in place of
Equations 16 and 17.
3.4.2 Material Considerations
After designing the size of the heat exchangers in the steam generation loop, materials were chosen
for each one. Since the exchangers use molten salts, “[t]he high operating temperatures limit the
range of possible candidate materials for the construction of the heat exchanger[s]” (Adames,
2010). Corrosion, creep and thermal loads are three characteristics to take into consideration when
choosing a material of construction (MOC). Molten salts can be very corrosive. And because they
operate at high temperatures, the tendency for creep and oxidation greatly increase (Adames,
2010). Therefore, special steels or “superalloys” were considered for use wherever molten salt
exposure would occur. ORNL’s MSRE used hastelloy, a nickel-based alloy, with the ability to
resist corrosion and oxidation, and avoid creep at high temperatures. Hastelloy and other nickel
alloys will be important considerations for the heat exchangers’ material (Haynes International,
2008).
3.4.3 Comparison to WPI’s Current Boiler System
After the heat exchanger network was designed for an MSR meeting campus heating needs, the
designs were compared to WPI’s current set up in the Power House. To compare the two systems,
floor space of each was evaluated. The design calculations for each exchanger in the MSR system
included shell diameters and lengths. Assuming each exchanger’s width was equivalent to its
diameter, a floor space area was calculated:
𝐴 = 𝐿𝑒𝑛𝑔𝑡ℎ 𝑥 𝑑𝑖𝑎𝑚𝑒𝑡𝑒𝑟 (18)
The exact floor space of the boilers in WPI’s Power House were not known, so their size was
estimated using data from an industrial boiler manufacturer, which provide base length and width,
thus floor space can be determined by:
𝐴 = 𝐿𝑒𝑛𝑔𝑡ℎ 𝑥 𝑤𝑖𝑑𝑡ℎ (19)
4. RESULTS AND DISCUSSION
4.1 Campus Heating Need
Currently, heating needs on the majority of WPI’s campus are met by 100 psig saturated steam
produced by the boilers in the campus Power House. This steam is transported along a fuel loop
that heats approximately 1.2 million square feet of academic and residential spaces (Grudzinski,
Further Power House Information, 2014). During the cold season, the production need of this
steam is between 8,000 lb/hr and 32,000 lb/hr, but on average the required flow rate is
approximately 25,000 lb/hr. At a certain pressure and temperature, steam contains a specific
amount of energy per pound, known as the enthalpy of the steam. At the conditions used on
campus, the enthalpy was assumed to be constant at 1190 BTU/lb of steam, meaning saturation
temperature and pressure was assumed to be maintained at maximum, minimum, and average
production rates (Spirax-Sarco, 2014). At minimum steam production of 8,000 lb/hr, the heating
energy usage was found to be approximately 9.52 million BTU/hr. At maximum heating need, the
total energy need was found to be approximately 38.1 million BTU/hr, and the average heating
energy need for campus was found to be 29.8 million BTU/hr. These calculations are provided in
Appendix A.1.
An Aspen simulation was performed to validate these calculations. The simulations yielded an
energy output of 9.2 million BTU/hr, 29 million BTU/hr, and 37 million BTU/hr for minimum,
average and maximum steam needs, respectively. The Aspen results compare well to the energy
balance calculations, confirming that Aspen and the furnace/fired heater block can simulate steam
generation from a boiler system. Although future calculations did not focus on the boiler system,
they did investigate the steam generation system of other heat sources.
These energy calculate levels of energy need were considered the standards from which to
determine whether campus heating needs could be met using nuclear reactors as heat sources. The
WPI Power House boilers produce saturated steam, but if the heat source of the steam production
could heat the steam beyond the saturation temperature then campus heating could be
accomplished more efficiently. As the steam temperature increases further and further above
saturation temperature, in this case 338°F, the enthalpy of the steam increases and therefore the
same quantity of heating can be accomplished using less water. This is the first way in which
switching to a nuclear reactor as the heat source for campus steam generation would be beneficial.
The outlet temperature of steam, and therefore the quality of that steam, from a natural gas-fired
boiler is limited by the combustion energy obtainable from natural gas, furnace efficiency and
boiler efficiency. The systems examined in this report, however, are based solely on heat exchange
between two fluids, which can be accomplished using typical shell-and-tube heat exchangers,
allowing efficiency to be estimated based on the calculated heat loss across the primary exchanger
in the MSRE Design and Operations Report (Robertson, 1965).
4.2 MSRE Energy Potential Calculations and Simulation
The first candidate system to be evaluated for its ability to meet campus steam needs was the
Molten Salt Reactor Experiment design used in Oak Ridge National Laboratory. For these
calculations, the system was considered to contain a 10 MWth reactor for nuclear power generation,
a fuel salt flow rate of 1,200 gallons per minute, and a coolant salt flow rate of 850 gallons per
minute, identical to the conditions used in the MSRE. The primary heat exchanger and all
temperatures were assumed to be identical to the MSRE design as well, but the air-cooled radiator
was replaced with a theoretical heat recovery steam generator. The steam generator was
approximated by three heat exchangers where heat was transferred between the coolant salt loop
and the feed water/steam generation stream. Based on the temperature change in the coolant salt
across the radiator, it was assumed that superheated steam could be produced at 1,000°F because
this is reasonably close to the minimum coolant temperature of 1,025°F. Heat transfer calculations
determined a heat loss in the primary exchanger of approximately 5% of the heat given off by the
fuel salt. This was used as an estimate for heat loss across the steam generator to determine the
overall heat absorbed by the water to generate the steam.
The inlet and outlet temperatures of the water stream in each exchanger were known because the
steam was assumed to be 1000°F, as mentioned previously, and the economizer inlet temperature
was chosen as 80°F based on a chemical engineering design heuristic and the assumption that
Worcester city water supply would be at a similar temperature (Turton R. , Bailie, Whiting,
Shaeiwitz, & Bhattacharyya, 2012). The remaining unknown temperatures, the evaporator inlet
and outlet, are by definition the saturation temperature of 100 psig water because the economizer
heats the feed water to saturation, phase change occurs within the evaporator, and the superheater
heats the steam from saturation to the outlet temperature. From the known information in the
MSRE report, both heat balances and an Aspen simulation were performed.
For the heat balance, known total heat transferred and temperature change values for each
exchanger, as well as heat capacity and latent heat values obtained from steam tables (Spirax-
Sarco, 2014), the set of three heat balances and the sum of the 3 heat values were solved
simultaneously to find the heat transfer in each exchanger and the flow rate of superheated steam
produced. The overall flow rate of superheated steam produced was found to be 20,521 lb/hr. The
enthalpy of steam at 100 psig and 1000°F is 1532 BTU/lb, meaning the total heating energy in the
calculated steam production is 31.4 million BTU/hr. The Aspen simulation yielded similar results,
finding that an energy need of 3.1 BTU/hr of would require 20,660 lb/hr of steam.
These results indicate that the MSRE design would be able to meet the minimum and average
heating needs of the buildings on the campus steam heating loop, but only 82.5% of maximum
campus heating needs. Based on this finding, a molten salt reactor-based steam generation loop
would require a slightly greater reactor thermal power output than that of Oak Ridge National
Laboratory’s MSRE. Calculations for the MSRE evaluation are provided in Appendix A.2
4.3 PWR vs. MSR Comparison
The next set of calculations aimed to determine the reactor thermal output that would be required
to satisfy even maximum campus heating needs. For this evaluation, the goal was twofold – to
show the water savings that can be seen from using a nuclear reactor instead of the natural gas-
fuelled boilers currently used on campus, and to show the advantages of using a molten salt reactor
as opposed to a pressurized water reactor similar to those used in many commercial nuclear power
plants in the United States. To meet these goals, a steam generation system was first evaluated that
resembled a scaled-down version of a Westinghouse 414 PWR power generation plant to
determine the degree of superheating that can be attained at 100 psig and the reactor thermal output
that would be required to produce enough steam at this temperature to meet the maximum campus
heating needs of approximately 38 million BTU/hr. This was then compared to a design similar to
the MSRE, with the radiator again replaced by a series of heat exchangers for steam generation.
4.3.1 Steam Generation by a PWR
The Westinghouse 414 is an example of a typical commercial PWR reactor capable of producing
approximately 3800 MWth (Westinghouse Electric Corporation Water Reactor Divisions, 1984).
The first step in evaluating a system like this to be adapted for use in steam generation was to
determine heat losses within the reactor and within the steam generators. Based on data available
for the Westinghouse 414, the reactor was found to have approximately 11% of the thermal energy
generated in the core not transferred to the coolant water, and 6.7% of the heat from the coolant
water is lost across the steam generator to the environment. These percentages were then used in
the design of a steam generation system for WPI.
Based on the temperatures given in the Westinghouse 414, heat exchange between the coolant
stream and steam generation stream could potentially produce steam at a temperature of 500°F
because this is reasonably close to the minimum coolant temperature of 558°F. Superheated steam
at 100 psig and 500°F has an enthalpy of 1277 BTU/lb, which means that 29,800 lb/hr of steam
would need to be produced in order to meet maximum campus heating needs (Spirax-Sarco, 2014).
The Aspen Simulation estimated a need of 31,370 lb/hr. The Aspen and heat balance results are
comparable, helping to verify each result. The Aspen simulation yielded a higher steam need by
mass, which can be explained by one of two things. First, Aspen may use a higher heat loss across
the generator. If all of the heat from the reactor isn’t transferred to the steam generator, more steam
will be required to service the same energy need. Second, heat transfer calculations become
complex with boiling and phase change. Aspen may assume slightly different heat capacities or
other values than those found for the heat transfer calculations.
Continuing a heat balance around the steam generator it was found that there would need to be a
flow rate of approximately 455,000 lb/hr of coolant water at the same operating temperatures
described in the Westinghouse 414. Another heat balance performed around the reactor determined
that a PWR with similar heat loss to the Westinghouse 414 design would need to produce 12.55
MWth in order to produce enough steam at 500°F to meet maximum heating needs on campus. A
reactor this size producing steam at 500°F would allow for an overall water saving in the steam
generation loop of 6.8% over the saturated steam produced by the boilers on campus at maximum
heat production. Aspen Plus was not capable of simulating these calculations because of the
extreme pressures required by a PWR, and because the fired heater/furnace block was not capable
of connecting to another system or heat source.
By dividing the energy content of the outlet steam by the reactor thermal efficiency, the system
was found to have an overall thermal efficiency of 89%, using Equation 7. Shultis and Faw provide
a PWR summary table showing that the fuel used in a PWR has a specific power of approximately
33 kW/kg uranium (Shultis & Faw, 2002). Based on this specific power estimate, it was calculated
that a 12.55 MWth PWR would require approximately 380 kg of uranium to operate, rearranging
Equation 8.
4.3.2 Steam Generation by an MSR
The 5% heat loss calculated in evaluation of the MSRE for steam generation was used as the
approximate heat loss across the primary exchanger and steam generation exchangers in the MSR
system evaluation. As mentioned in section 4.2, a molten salt reactor system at the temperatures
given in the MSRE Design and Operations report is capable of producing steam superheated to
1000°F at 100 psig. This results in a steam flow rate of approximately 24,900 lb/hr required to
meet maximum campus heating needs. An Aspen simulation estimated the 38 million BTU/hr
would require 25,674 lb/hr in an MSR. This corresponds to an average water savings of 20.1%
over saturated steam need.
In order to produce this quantity of 1000°F steam from coolant salt at temperatures equal to those
in the MSRE, the coolant flow rate required was found to be 991,600 lb/hr, and the fuel flow rate
required was found to be 1.77 million lb/hr, an increase of 21.2% in coolant flow rate and 36.9%
in fuel flow rate over the MSRE design. At these flow rates and the temperature changes from the
MSRE, the total reactor thermal output required was found to be 12.16 MW and the thermal
efficiency of the system was found to be 91.8%. Again, an Aspen simulation was not done on this
part of the calculations because of the limitations of the furnace/fired heater block.
At 10 MWth operation of the MSRE system, the primary (fuel circulation) loop contained 73 ft3 of
fuel. According to the fuel composition given in the Design and Operations Report, 0.009 mol %
of the fuel was uranium tetrafluoride (Robertson, 1965). Using Equation 8, the specific power of
the fuel was approximately 43.9 kW/kg uranium. Assuming this same specific power, the 12.16
MW reactor required to produce steam to meet campus needs would require approximately 276 kg
of uranium of uranium to operate. Detailed calculations can be found in Appendix A.4.
4.3.3 Benefits of the MSR
The calculations above prove that using a nuclear reactor as the heat source in a steam generation
loop for heating the majority of campus would indeed allow for water savings in the steam
generation. These calculations also show that not only can greater water savings be achieved with
a molten salt reactor, but at a lower power production rate and with a lower uranium inventory. In
addition to these benefits, a pressurized water reactor requires high pressure operation at
approximately 2250 psia in order to prevent the water in the coolant loop from boiling (Shultis &
Faw, 2002), however the molten salt fuel and coolant salts allow operation at pressures between 5
psig and 55 psig. This eliminates the need for equipment capable of withstanding such extreme
pressures. Also, in a commercial PWR it is necessary to shut the reactor down completely
approximately once a year to replace a portion of the fuel rods due to the buildup of fission poisons.
The fluid nature of the fuel in a molten salt reactor enables some of these fission poisons to be
removed throughout typical reactor operation by a helium off-gas system within the pump bowl
(Robertson, 1965). For poisons that can’t be removed by the helium gas, additional chemical
processing unit operations can be added to the fuel loop to allow for continuous reprocessing
without shutdown, or small quantities of fuel can be removed or added through a sample port in
the reactor housing (Robertson, 1965). This would allow for continuous operation over long
periods of time, which is especially important during the winter months when campus would rely
on a consistent heating source to prevent pipe freezing or discomfort of students, staff, and faculty
members. Table 3 shows a summary of the benefits related to an MSR over a PWR.
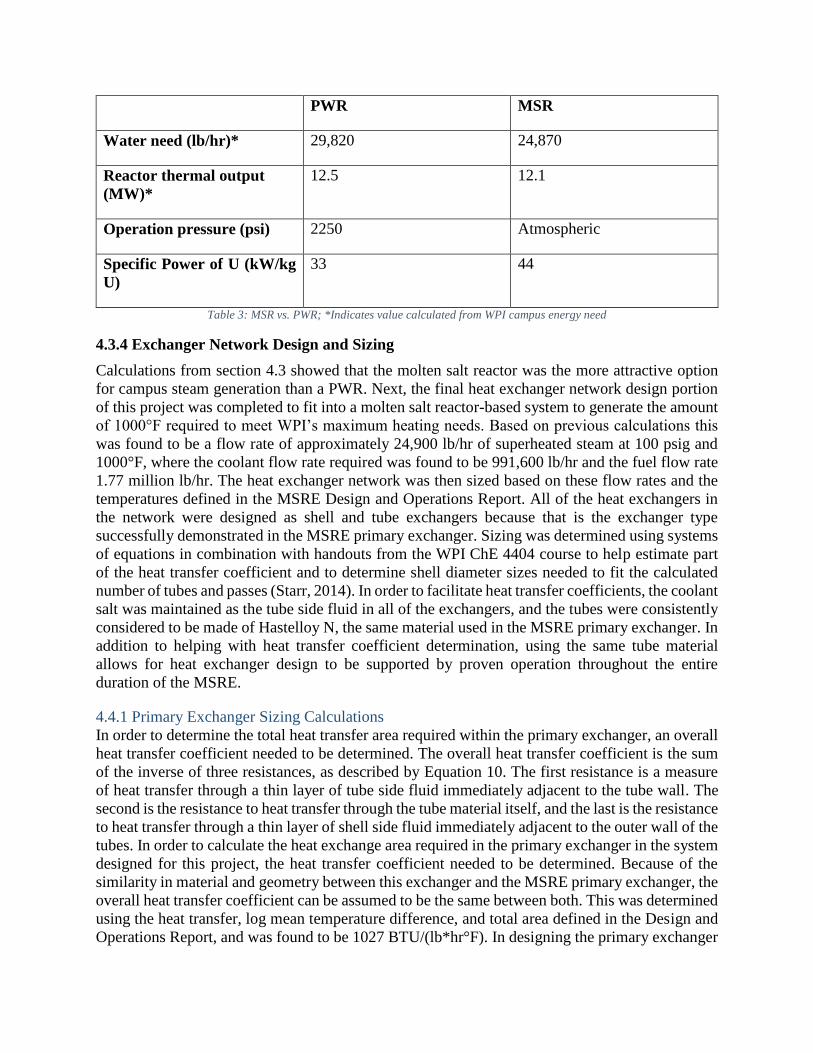
PWR MSR
Water need (lb/hr)* 29,820 24,870
Reactor thermal output
(MW)*
12.5 12.1
Operation pressure (psi) 2250 Atmospheric
Specific Power of U (kW/kg
U)
33 44
Table 3: MSR vs. PWR; *Indicates value calculated from WPI campus energy need
4.3.4 Exchanger Network Design and Sizing
Calculations from section 4.3 showed that the molten salt reactor was the more attractive option
for campus steam generation than a PWR. Next, the final heat exchanger network design portion
of this project was completed to fit into a molten salt reactor-based system to generate the amount
of 1000°F required to meet WPI’s maximum heating needs. Based on previous calculations this
was found to be a flow rate of approximately 24,900 lb/hr of superheated steam at 100 psig and
1000°F, where the coolant flow rate required was found to be 991,600 lb/hr and the fuel flow rate
1.77 million lb/hr. The heat exchanger network was then sized based on these flow rates and the
temperatures defined in the MSRE Design and Operations Report. All of the heat exchangers in
the network were designed as shell and tube exchangers because that is the exchanger type
successfully demonstrated in the MSRE primary exchanger. Sizing was determined using systems
of equations in combination with handouts from the WPI ChE 4404 course to help estimate part
of the heat transfer coefficient and to determine shell diameter sizes needed to fit the calculated
number of tubes and passes (Starr, 2014). In order to facilitate heat transfer coefficients, the coolant
salt was maintained as the tube side fluid in all of the exchangers, and the tubes were consistently
considered to be made of Hastelloy N, the same material used in the MSRE primary exchanger. In
addition to helping with heat transfer coefficient determination, using the same tube material
allows for heat exchanger design to be supported by proven operation throughout the entire
duration of the MSRE.
4.4.1 Primary Exchanger Sizing Calculations
In order to determine the total heat transfer area required within the primary exchanger, an overall
heat transfer coefficient needed to be determined. The overall heat transfer coefficient is the sum
of the inverse of three resistances, as described by Equation 10. The first resistance is a measure
of heat transfer through a thin layer of tube side fluid immediately adjacent to the tube wall. The
second is the resistance to heat transfer through the tube material itself, and the last is the resistance
to heat transfer through a thin layer of shell side fluid immediately adjacent to the outer wall of the
tubes. In order to calculate the heat exchange area required in the primary exchanger in the system
designed for this project, the heat transfer coefficient needed to be determined. Because of the
similarity in material and geometry between this exchanger and the MSRE primary exchanger, the
overall heat transfer coefficient can be assumed to be the same between both. This was determined
using the heat transfer, log mean temperature difference, and total area defined in the Design and
Operations Report, and was found to be 1027 BTU/(lb*hr°F). In designing the primary exchanger
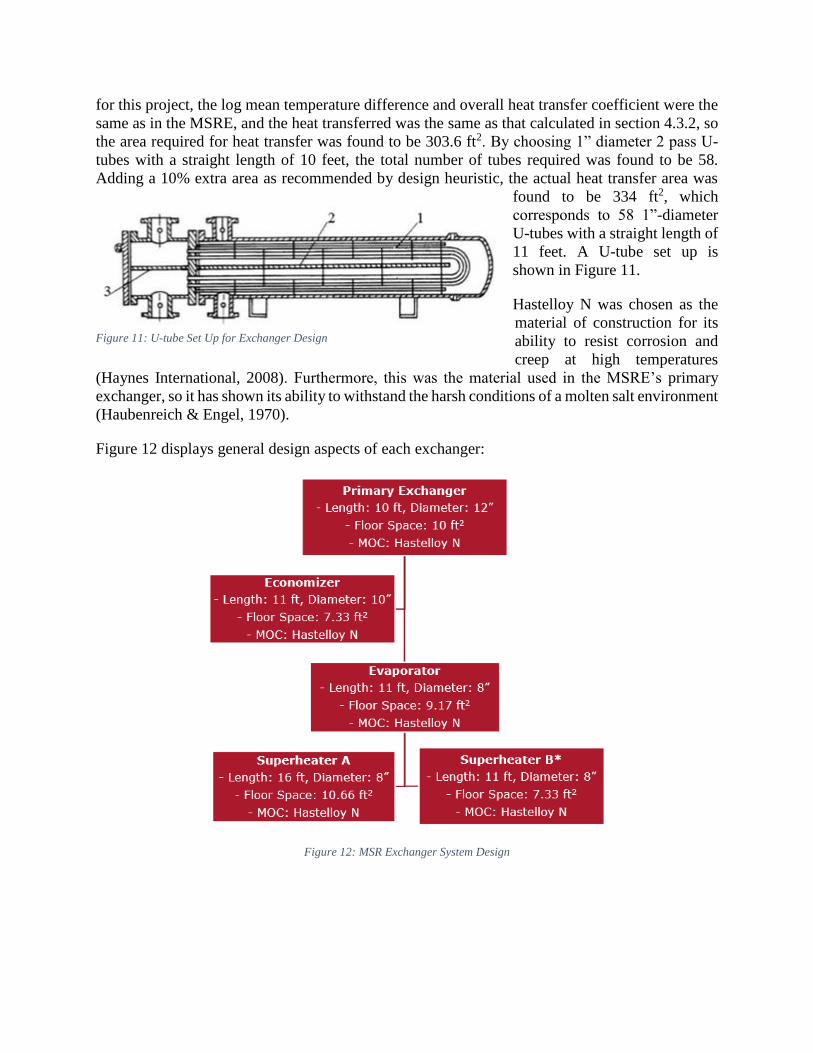
for this project, the log mean temperature difference and overall heat transfer coefficient were the
same as in the MSRE, and the heat transferred was the same as that calculated in section 4.3.2, so
the area required for heat transfer was found to be 303.6 ft2. By choosing 1” diameter 2 pass U-
tubes with a straight length of 10 feet, the total number of tubes required was found to be 58.
Adding a 10% extra area as recommended by design heuristic, the actual heat transfer area was
found to be 334 ft2, which
corresponds to 58 1”-diameter
U-tubes with a straight length of
11 feet. A U-tube set up is
shown in Figure 11.
Hastelloy N was chosen as the
material of construction for its
ability to resist corrosion and
creep at high temperatures
(Haynes International, 2008). Furthermore, this was the material used in the MSRE’s primary
exchanger, so it has shown its ability to withstand the harsh conditions of a molten salt environment
(Haubenreich & Engel, 1970).
Figure 12 displays general design aspects of each exchanger:
Figure 12: MSR Exchanger System Design
Figure 11: U-tube Set Up for Exchanger Design
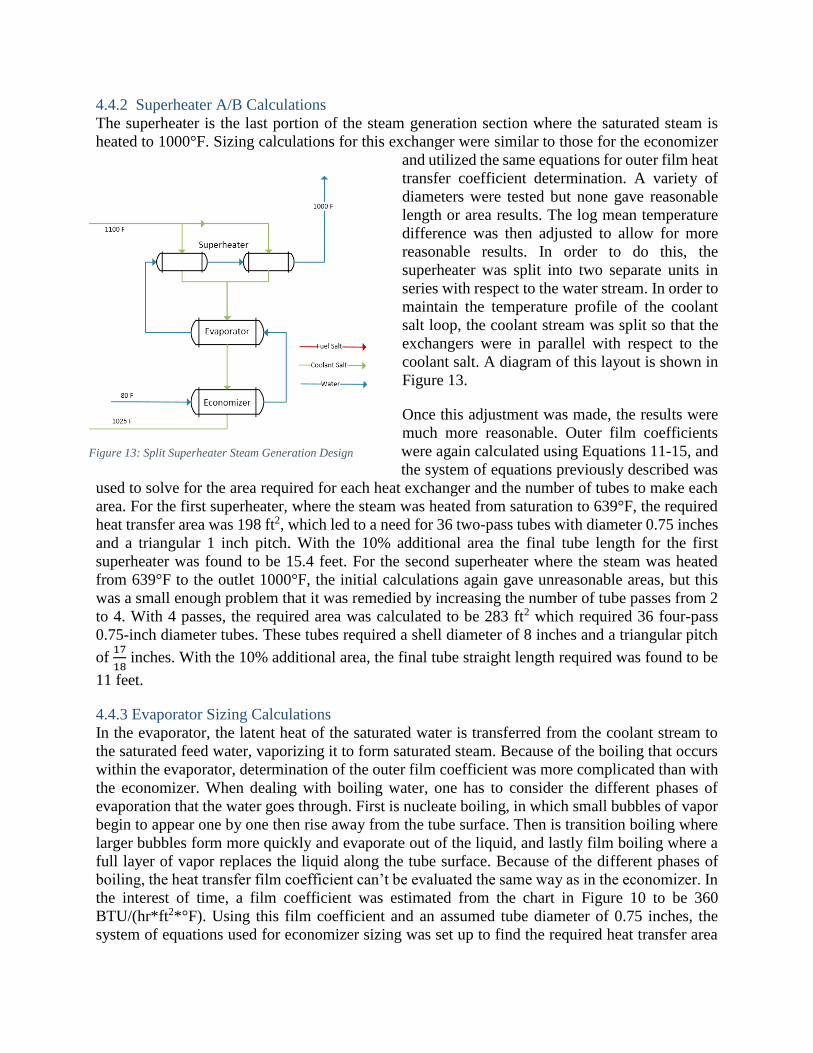
4.4.2 Superheater A/B Calculations
The superheater is the last portion of the steam generation section where the saturated steam is
heated to 1000°F. Sizing calculations for this exchanger were similar to those for the economizer
and utilized the same equations for outer film heat
transfer coefficient determination. A variety of
diameters were tested but none gave reasonable
length or area results. The log mean temperature
difference was then adjusted to allow for more
reasonable results. In order to do this, the
superheater was split into two separate units in
series with respect to the water stream. In order to
maintain the temperature profile of the coolant
salt loop, the coolant stream was split so that the
exchangers were in parallel with respect to the
coolant salt. A diagram of this layout is shown in
Figure 13.
Once this adjustment was made, the results were
much more reasonable. Outer film coefficients
were again calculated using Equations 11-15, and
the system of equations previously described was
used to solve for the area required for each heat exchanger and the number of tubes to make each
area. For the first superheater, where the steam was heated from saturation to 639°F, the required
heat transfer area was 198 ft2, which led to a need for 36 two-pass tubes with diameter 0.75 inches
and a triangular 1 inch pitch. With the 10% additional area the final tube length for the first
superheater was found to be 15.4 feet. For the second superheater where the steam was heated
from 639°F to the outlet 1000°F, the initial calculations again gave unreasonable areas, but this
was a small enough problem that it was remedied by increasing the number of tube passes from 2
to 4. With 4 passes, the required area was calculated to be 283 ft2 which required 36 four-pass
0.75-inch diameter tubes. These tubes required a shell diameter of 8 inches and a triangular pitch
of 17
18 inches. With the 10% additional area, the final tube straight length required was found to be
11 feet.
4.4.3 Evaporator Sizing Calculations
In the evaporator, the latent heat of the saturated water is transferred from the coolant stream to
the saturated feed water, vaporizing it to form saturated steam. Because of the boiling that occurs
within the evaporator, determination of the outer film coefficient was more complicated than with
the economizer. When dealing with boiling water, one has to consider the different phases of
evaporation that the water goes through. First is nucleate boiling, in which small bubbles of vapor
begin to appear one by one then rise away from the tube surface. Then is transition boiling where
larger bubbles form more quickly and evaporate out of the liquid, and lastly film boiling where a
full layer of vapor replaces the liquid along the tube surface. Because of the different phases of
boiling, the heat transfer film coefficient can’t be evaluated the same way as in the economizer. In
the interest of time, a film coefficient was estimated from the chart in Figure 10 to be 360
BTU/(hr*ft2*°F). Using this film coefficient and an assumed tube diameter of 0.75 inches, the
system of equations used for economizer sizing was set up to find the required heat transfer area
Figure 13: Split Superheater Steam Generation Design
of 141 ft2 and the number of tubes required, which was found to be 36. In order to fit 36 tubes of
0.75 inch diameter on a triangular pitch of 1 inch, the shell diameter required was found to be 8
inches. With the 10% safety factor area increase, the total straight tube length was determined to
be 11 feet.
4.4.4 Economizer Sizing Calculations
The economizer is the first section of the steam generation heat exchanger series. In this exchanger,
the feed water is heated from 80°F to its saturation temperature of 338°F. This exchanger utilizes
the coolest part of the coolant salt stream because it requires the least heat. The heat exchanged is
approximately 4.73 million BTU/hr, and the corrected log mean temperature difference is 224°F.
In order to calculate the area required for heat exchange, the overall heat transfer coefficient was
determined. Unlike the primary exchanger, the value calculated from MSRE data could not be
applied to this exchanger because the shell side fluid is not fuel salt and therefore the film
coefficient will be different. Fundamentals of Heat and Mass Transfer provided Equations 13 and
14 to determine the outer film coefficient for a fluid flowing in a cross-flow configuration across
cylindrical horizontal tubes (9.6 Empirical Correlations: External Free Convection Flows; 9.6.3
The Long Horizontal Cylinder, 2011). From these equations and a chosen outer tube diameter of
1.75 inches, the outer film coefficient was found to be 522.13 BTU/(hr*ft2*°F). A system of
equations was set up using Equations 6, 8-12, and the equations for inner and outer tube areas to
solve for the number of tubes and the straight length of those tubes that would allow the inner film
coefficient to be the same as that in the primary exchanger while simultaneously making Equation
6 true. The heat exchange area required was found from this system of equations to be 142 ft2,
which corresponded to 22 two-pass tubes on a 1 5/8 inch triangular pitch. This many tubes at this
size require a 10 inch shell based on the charts provided from ChE 4404 (Starr, 2014). After adding
a 10% safety factor to the area, the final straight length of these tubes was found to be 10.8 ft.
4.4.5 Floor Space Comparison to Current Boiler System
To compare the designed MSR steam generation system to the current system used at WPI and
prove the impact of using an MSR, the floor space of each layout was compared. Using the shell
diameters determined from the design calculations as a width, and tube lengths as length, the floor
space needed for each MSR exchanger was calculated. It was found that the primary exchanger,
evaporator, economizer, superheater A and superheater B would require 10, 7.33, 9.17, 10.66, 7.33
ft2, respectively. This totals to 44.5 ft2 of floor space required for the entire MSR exchanger system,
not taking into account the space needed for accessing the equipment for maintenance.
The floor space taken up by the current boiler system at WPI was unknown, so an estimation was
calculated using information from an industrial boiler manufacturer, Hoval. In Hoval’s manual of
industrial boiler options, the base length and width are listed for each type, along with other data.
Hoval’s smallest boiler, which has a capacity of 7.8 BTU/hr, has base dimensions of 3480 mm by
1700mm (11.42 ft by 5.6 ft) (Hoval, 2013). Thus, the floor space required for the boiler is 63.9 ft2.
A minimum of four of these boilers would be required to meet WPI’s campus heating needs,
meaning it would require about 256 ft2 of floor space, over 5 times more floor space than the entire
MSR system. . There are currently only three boilers in the WPI Power House, but this serves as
a general understanding of the space requirement for each kind of steam generation system. The
difference in the floor space requirements for each system is impactful for future analysis and
implementation. Since the MSR system doesn’t require as much space, the possibilities for
installation location on campus are much greater than those of a boiler system.
40
CONCLUSION AND RECOMMENDATIONS
After determining WPI heating need and evaluating and designing a steam generation system, a
molten salt reactor would be an attractive solution to WPI’s steam generation issues. Using an
MSR would be an economic, technological, and environmental advantage. This project was the
first step in evaluating an MSR for steam generation and the possibility of a nuclear reactor of such
a large scale on a university campus. There are several research and implementation steps ahead.
Recommendations for future work can be broken into two categories: continued loop design and
campus implementation. Research on continued loop design would focus on refining the MSR
system designed in this project by looking at all aspects of the reactor and steam generation loop.
Campus implementation would include research on economic and political aspects of building a
new reactor, as well as the eventual installation and operation plans.
As mentioned before, this project was the first step in designing a steam generation loop for WPI,
using an MSR as a heat source. Future research should focus on building upon the proposed design
and designing all other aspects of the reactor and steam generation loop. Since the MSRE design
would not meet WPI’s heating needs, a new reactor would need to be designed for use at WPI.
The required thermal output of the reactor and the fuel and coolant salt flow rates were determined
in this project, but extensive research should be done on the core design itself and scaling up to
over 12 MW from the 10 MW MSRE design. Furthermore, the MSRE concluded in the 1960s,
less than 20 years after nuclear power research began. Over 50 years later, there are certainly
technological improvements to be made on the core design. Future research should also focus on
the design of the entire system: containment tanks, freeze valves, pumps, pipes, etc. A potentially
unique aspect of an MSR design would be pump design. A study presented at the 12th annual
International Conference on Optimization of Electrical and Electronic Equipment in 2010
investigated the possibility of pumps self-operating from the convective and electromagnetic
nature of molten salts (Etay, Fireteanu, Fautrelle, & Roman, 2010). This would add another benefit
to the MSR system by improving safety and reducing electricity costs.
In addition to the equipment design, there are possibilities for improvements in fuel technology
and material of construction for equipment in the MSR system. An important aspect of bringing
an MSR to campus would be determining most efficient and cost effective fuel compositions and
materials of construction. The MSRE investigated multiple fuel types before it was shut down,
each with varying compositions of beryllium fluoride, lithium fluoride, zirconium fluoride,
thorium fluoride, and uranium fluoride (Haubenreich & Engel, 1970). This research should
continue to determine the best fuel from his application. Research could also continue on materials
for both the core and other equipment. Although Hastelloy N was used in the MSRE successfully,
it is a very expensive alloy. There may be cheaper or more effective materials that could be used
for the design on WPI campus.
Lastly, to aid research of continued loop design, it would be important to use a simulation software
capable of simulating nuclear chemistry, high temperatures, and the unique properties of molten
salts. Aspen Plus Simulation software was able to give a basic understanding on some of the heat
transfer properties of steam in the steam generator. However, there were difficulties in simulating
the molten salt heat transfer, and Aspen was unable to simulate the full connected MSR system.
To best design the future system for WPI’s campus, it would be important to use a more advanced
simulation software to test designs.
41
Once the full system has been designed, WPI can begin the process of bringing the reactor to
campus. This would also require extensive research. Before the reactor could actually be built on
campus, research should focus on several aspects of implementation. First, once system materials
and equipment have been designed, it will be important to complete a cost analysis of the project,
including construction, installation and eventual labor costs. A cost analysis would also serve as a
comparison to WPI’s current steam generation system to determine how beneficial the MSR would
be economically. Furthermore, there are extensive safety and licensing requirements for chemical
plants, especially for nuclear reactors. Once the reactor is sized, research should look into where
the system can be placed on campus, how it can be connected to the current system, and what
licensing and regulations standards WPI will need to meet. Since actual implementation of the
project is several years in the future, there is plenty of time for current Power House operators and
staff to receive the proper training.
Overall, the MSR is a promising technology for steam generation a WPI. Though there are several
future steps and research necessary before an actual reactor can be brought to campus, this project
has proven that MSR technology is an important option to consider for improving WPI’s steam
generation. Most importantly, implementing a nuclear reactor for steam generation on a college
campus would make a significant impact in the technology world. WPI has a long tradition of
innovation, and striving to be at the forefront of technological advancements. Bringing an MSR to
campus would continue this tradition.
42
REFERENCES
9.6 Empirical Correlations: External Free Convection Flows; 9.6.3 The Long Horizontal Cylinder.
(2011). In T. L. Bergman, A. S. Lavine, F. P. Incropera, & D. P. Dewitt, Fundamentals of
Heat and Mass Transfer (7th ed., pp. 604-613). United States: John Wiley & Sons, Inc.
Adames, A. A. (2010). Design COnsiderations of a 15kW Heat Exchanger for the CSPonD
Project. Boston: Adrian A. Adams.
AspenTech. (2014). Reduce Captial Costs and Improve Efficiency by Sizing and Modeling Heat
Exchangers in Aspen Plus and Aspen HYSYS. Retrieved from AspenTech Support.
Clark, W. M. (2014). Review of Heat Transfer. Retrieved from blackboard.wpi.edu:
https://my.wpi.edu/webapps/portal/frameset.jsp?tab_tab_group_id=_2_1&url=%2Fweba
pps%2Fblackboard%2Fexecute%2Flauncher%3Ftype%3DCourse%26id%3D_66853_1%
26url%3D
Environmental Protection Agency. (2013). Climate Change and Indicators in the United States.
Etay, J., Fireteanu, V., Fautrelle, Y., & Roman, C. (2010). Electromagnetic Pumping of Molten
Salts. International Conference on Optimization of Electrical and Electronic Equipment.
Fishlock, D. (2006). Voyage of the PWR. Nuclear Engineering International, 38-40.
Generation IV International Forum. (2013). Annual Report 2013.
Grudzinski, B. (2014, November 18). Further Power House Information. (K. Devaney,
Interviewer)
Grudzinski, B. (2014, November 7). WPI Power House Steam Production Information. (K.
Devaney, Interviewer)
Hargraves, R., & Moir, R. (2010). Liquid Fluoride Thorium Reactors - An old idea in nuclear
power gets reexamined. American Scientist, 304-313.
Haubenreich, P. N., & Engel, J. R. (1970). Experience With the Molten Salt Reactor Experiment.
Nuclear Applications and Technology, 118-136.
Haynes International. (2008). Hastelloy X Alloy. Kokomo, IN: Haynes International Global
Headquarters.
Holdren, J. P. (1991). Population and the Energy Problem.
Hoval. (2013). Industrial Boilers. Lichtenstein.
Ignatiev, V., Feynberg, O., Gnidoi, I., Merzlyakov, A., Surenkov, A., Uglov, V., . . . Osipenko, A.
(2014). Molten salt actinide recycler and transforming system without and with Th-U
43
support: Fuel cycle flexibility and key material properties. Annals of Nuclear Energy, 64,
408-420.
Kok, K. D. (2009). Nuclear Engineering Handbook. New York: CRC Press.
Nuclear Regulatory Commission. (2014, October 6). Storage of Spent Nuclear Fuel. Retrieved
from U.S. NRC: http://www.nrc.gov/waste/spent-fuel-storage.html
Power Reactors. (2013, December). Retrieved from United States Nuclear Regulatory
Commission: http://www.nrc.gov/reactors/power.html
Robertson, R. C. (1965). MSRE Design and Operations Report Part I Description of Reactor
Design. Oak Ridge National Laboratory. Oak Ridge, TN: Oak Ridge National Laboratory.
Rosenthal, M. W., Kasten, P. R., & Briggs, R. B. (1970). Molten-salt Reactors - History, Status,
and Potential. Nuclear Applications & Technology, 107-117.
Shultis, J. K., & Faw, R. E. (2002). Fundamentals of Nuclear Science and Engineering. New York:
Marcel Dekker, Inc.
Spirax-Sarco. (2014). Steam Tables. Retrieved from Spirax Sarco USA:
http://www2.spiraxsarco.com/us/resources/steam-tables.asp
Starr, T. (2014, November 24). CHE 4404 Lecture on Heat Exchanger Sizing. Worcester, MA.
Teir, S. (2003). Basics of Steam Generation. In S. Teir, Steam Boiler Technology eBook (2 ed.).
Energy Engineering and Environmental Protection Publications.
The National Academy of Sciences. (2014). What you Need to Know about Energy- Emerging
Technologies. Retrieved from http://needtoknow.nas.edu/energy/energy-
sources/emerging-technologies/
Theriault, K. (2009). Boiling Water Reactors (BWRs). In K. D. Kok (Ed.), Nuclear Engineering
Handbook (eBook ed., pp. 83-139). CRC Press.
Transatomic Power Corporation. (2014, October). Retrieved from Transatomic Power:
http://transatomicpower.com/
Turton, R., Bailie, R. C., Whiting, W. B., Shaeiwitz, J. A., & Bhattacharyya, D. (2012). Analysis,
Synthesis and Design of Chemical Processes (Kindle Fire ed.). Boston: Prentice Hall.
Turton, R., Bailie, R., Whiting, W., Shaeiwitz, J., & Bhattacharyya, D. (2013). Analysis, Synthesis,
and Design of Chemical Processes. Boston: Prenticce Hall.
U.S. Energy Informatio Administration (EIA). (2014). International Energy Outlook 2014.
Washington, DC: EIA.
Westinghouse Electric Corporation Water Reactor Divisions. (1984). The Westinghouse
Pressurized Water Reactor Nuclear Power Plant.
44
Wood, J. (2007). Nuclear Power. Institution of Engineering and Technology.
Worcester Polytechnic Institute. (2014, Dec 12). Campus Maps. Retrieved from wpi.edu:
http://www.wpi.edu/Images/CMS/University-About/WPI_2-D_Map_2014__web.pdf
World Nuclear Association. (1996). Physics of Uranium and Nuclear Energy. Retrieved from
http://www.world-nuclear.org/info/Nuclear-Fuel-Cycle/Introduction/Physics-of-Nuclear-
Energy/
World Nuclear Association. (2014, October 8). Supply of Uranium. Retrieved from World Nuclear
Association: http://www.world-nuclear.org/info/Nuclear-Fuel-Cycle/Uranium-
Resources/Supply-of-Uranium/
World Nuclear Association. (2014, November). World Energy Needs and Nuclear Power.
Retrieved from World Nuclear Association: http://www.world-nuclear.org/info/Current-
and-Future-Generation/World-Energy-Needs-and-Nuclear-Power/
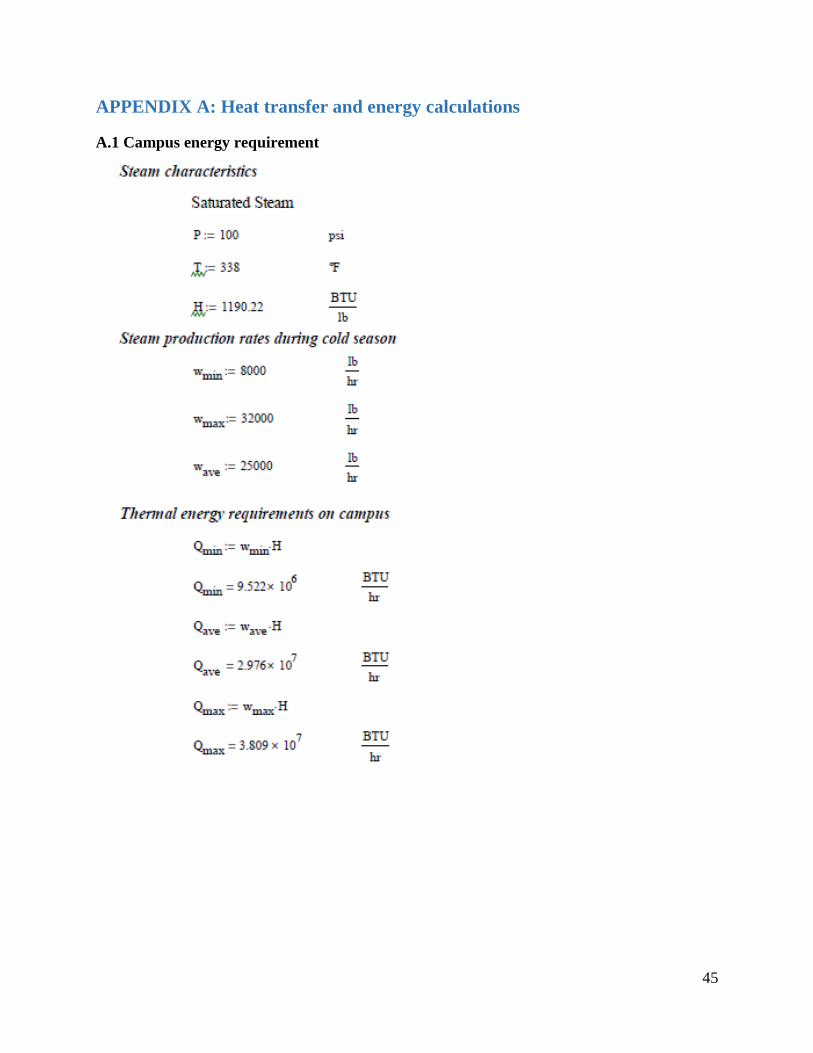
45
APPENDIX A: Heat transfer and energy calculations
A.1 Campus energy requirement
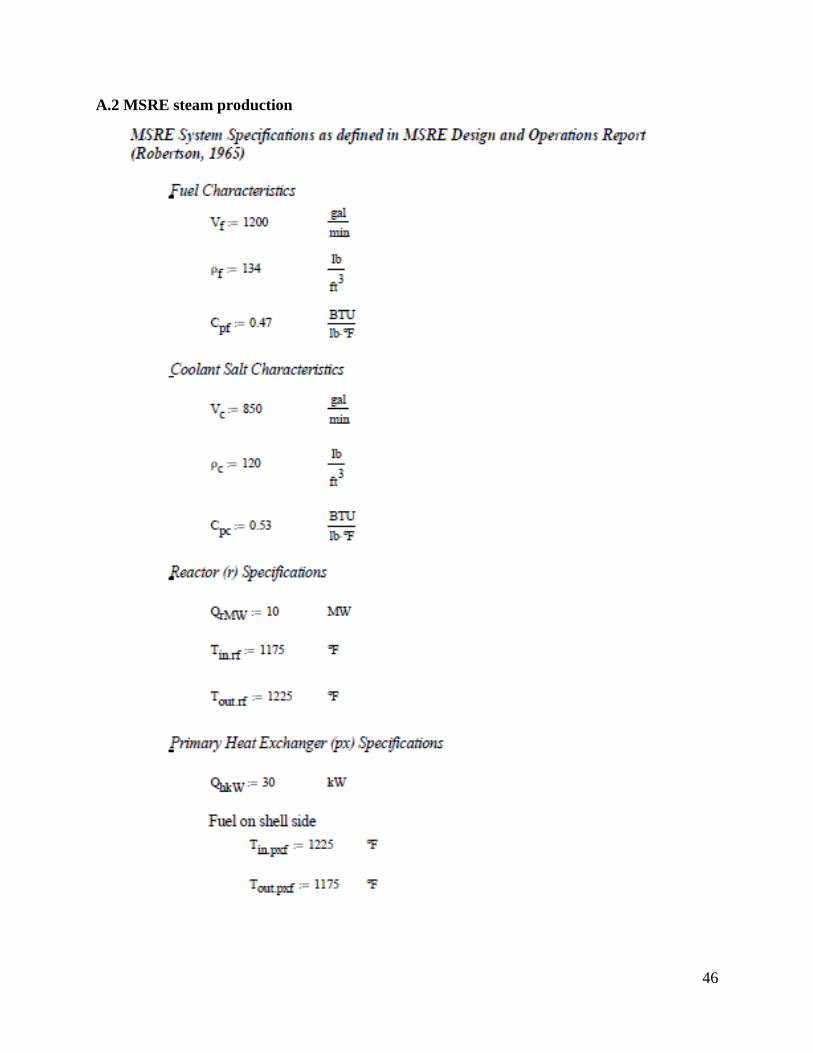
46
A.2 MSRE steam production

47
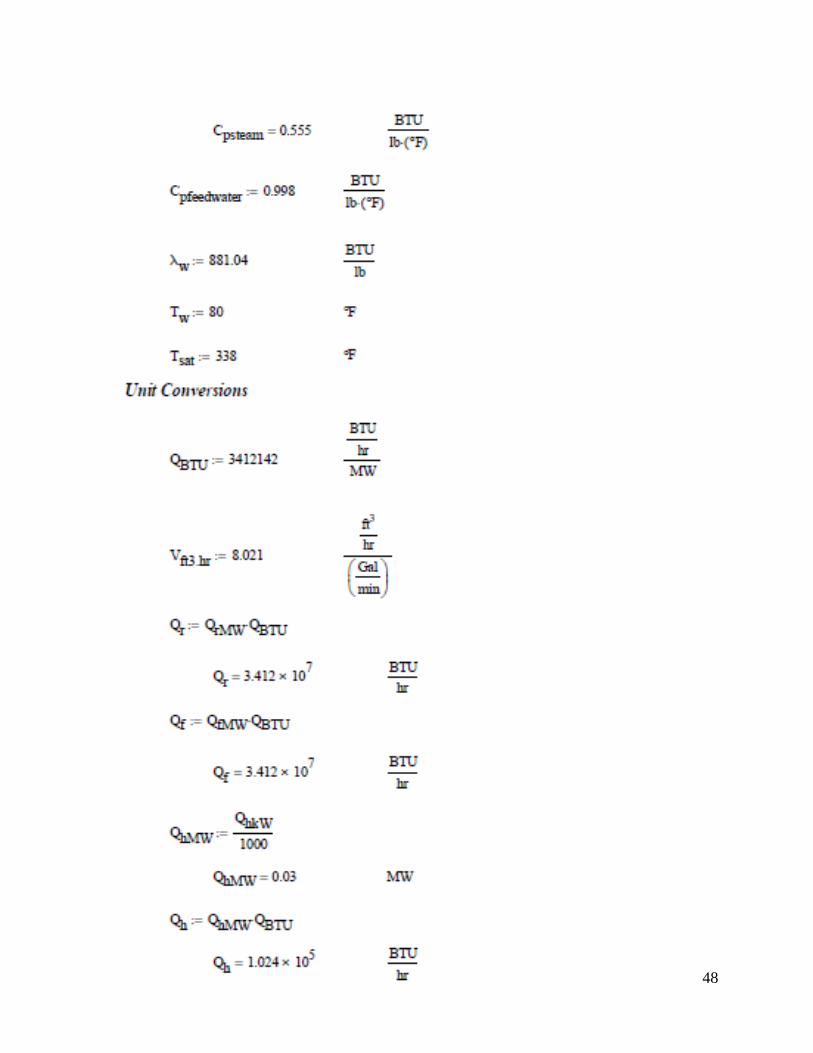
48
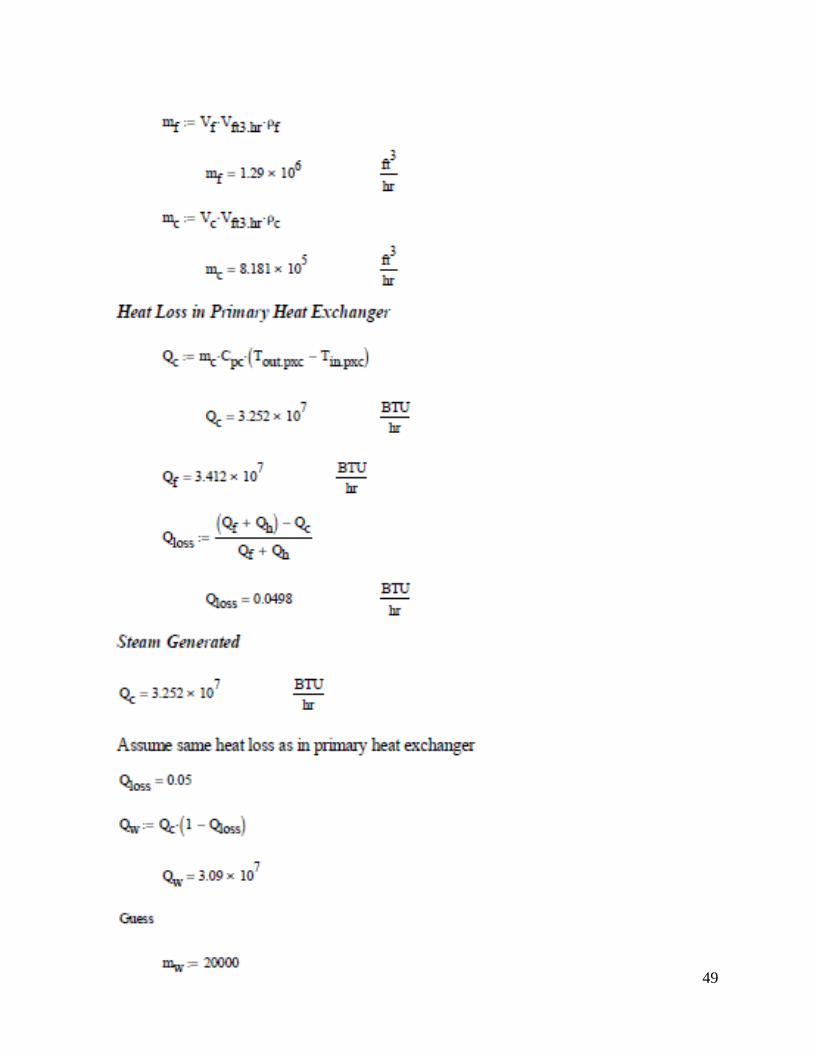
49
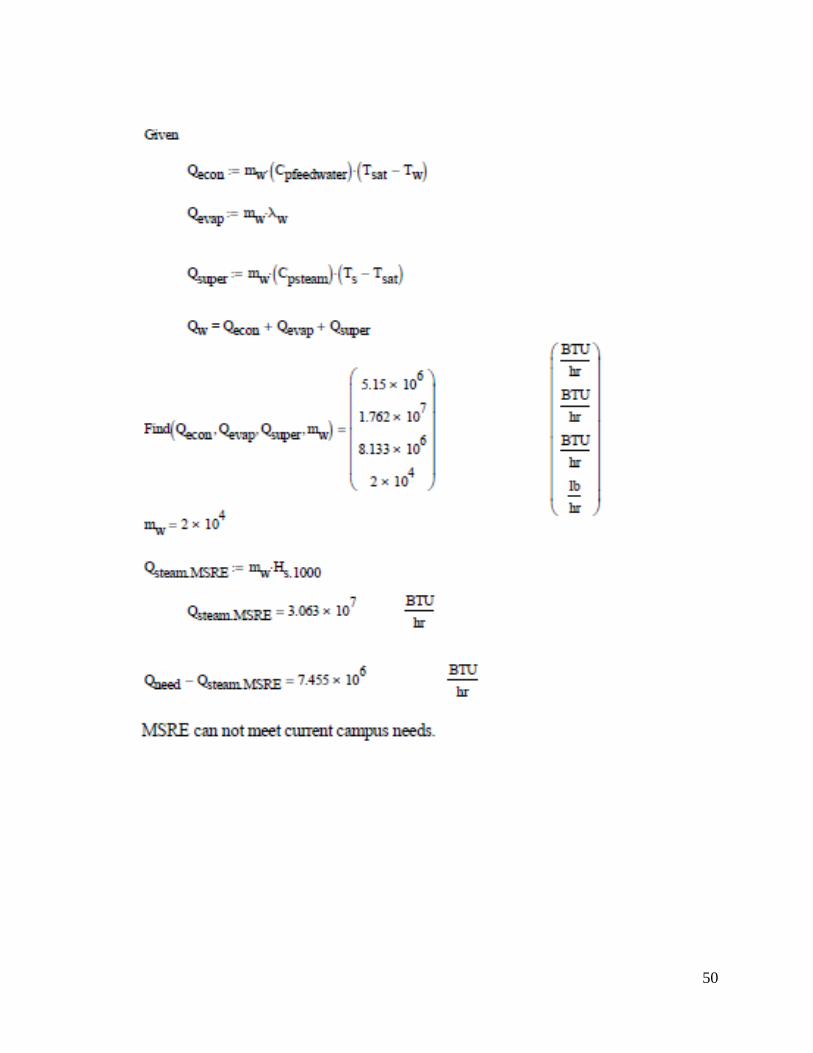
50
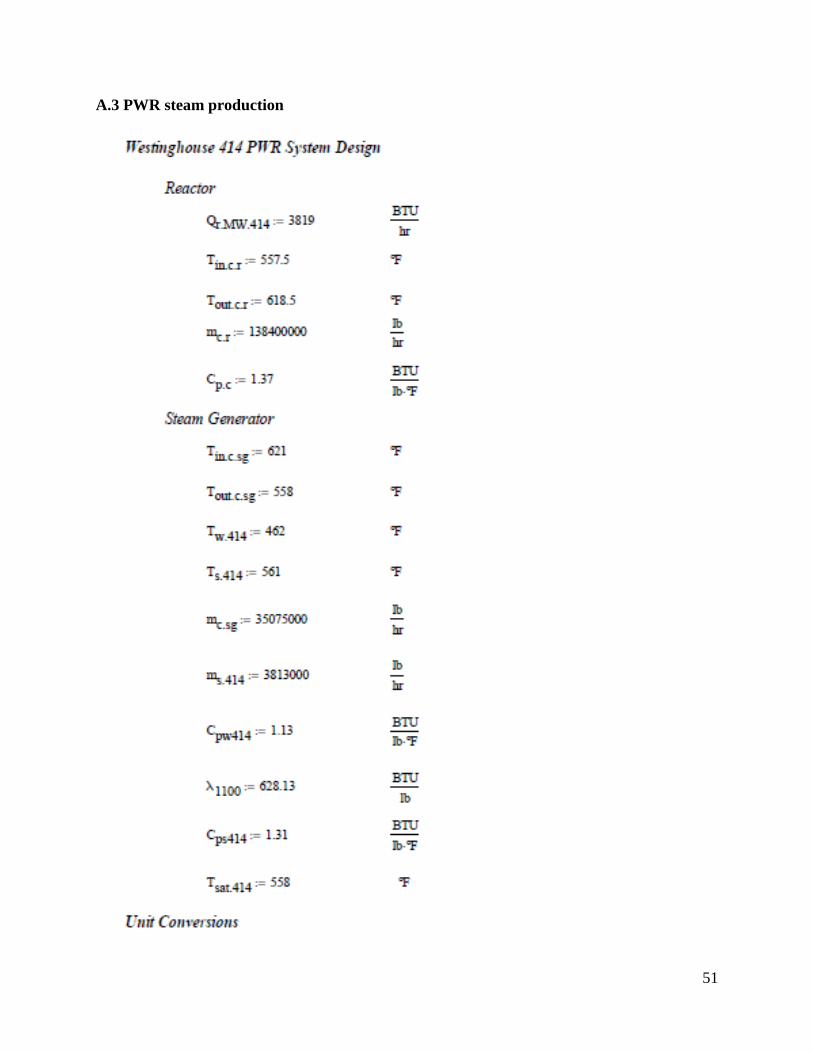
51
A.3 PWR steam production
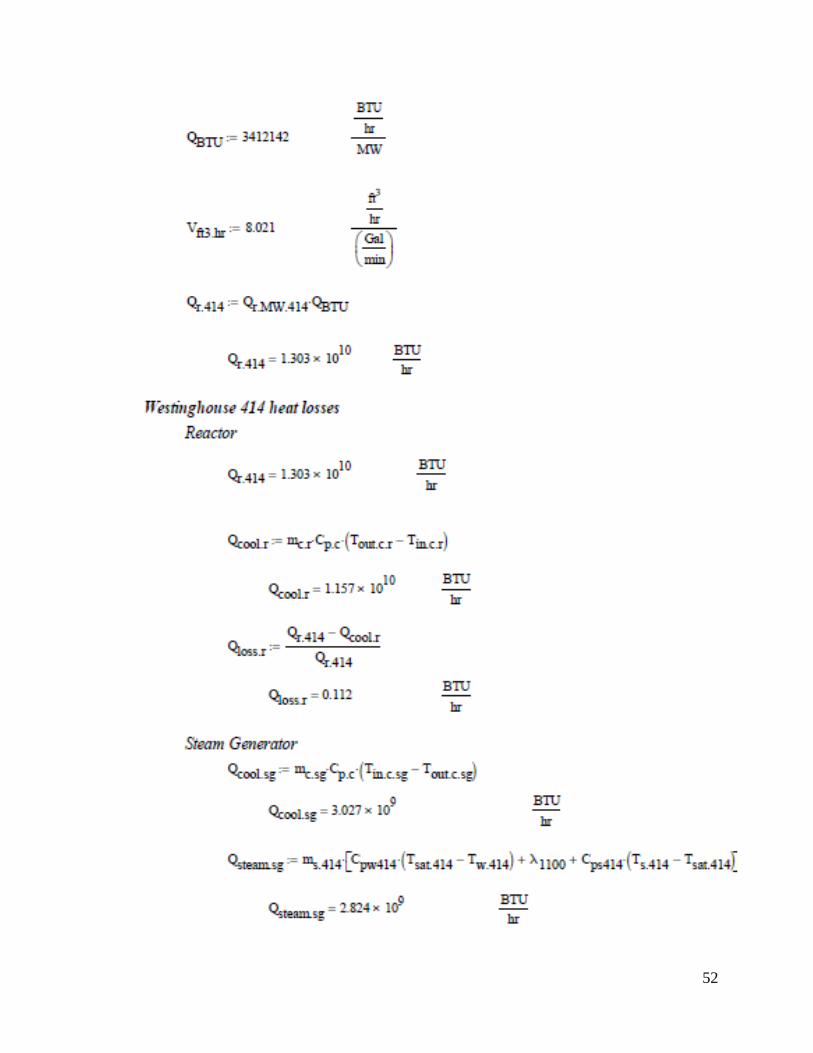
52
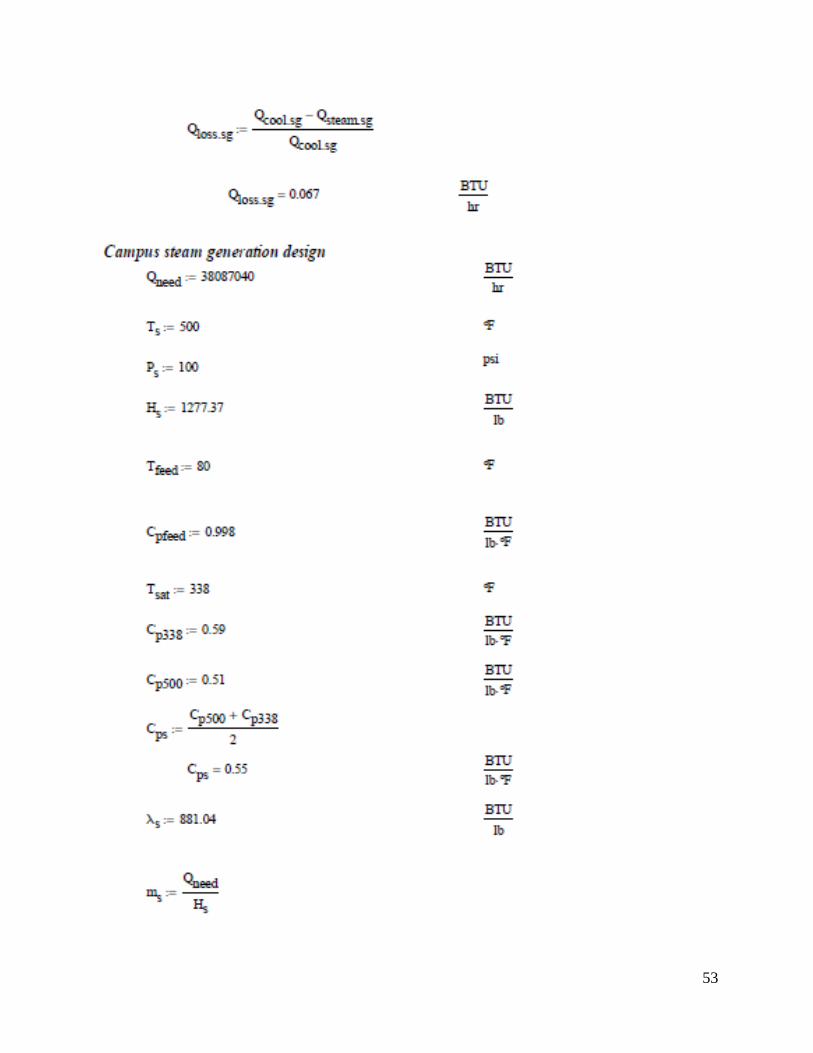
53
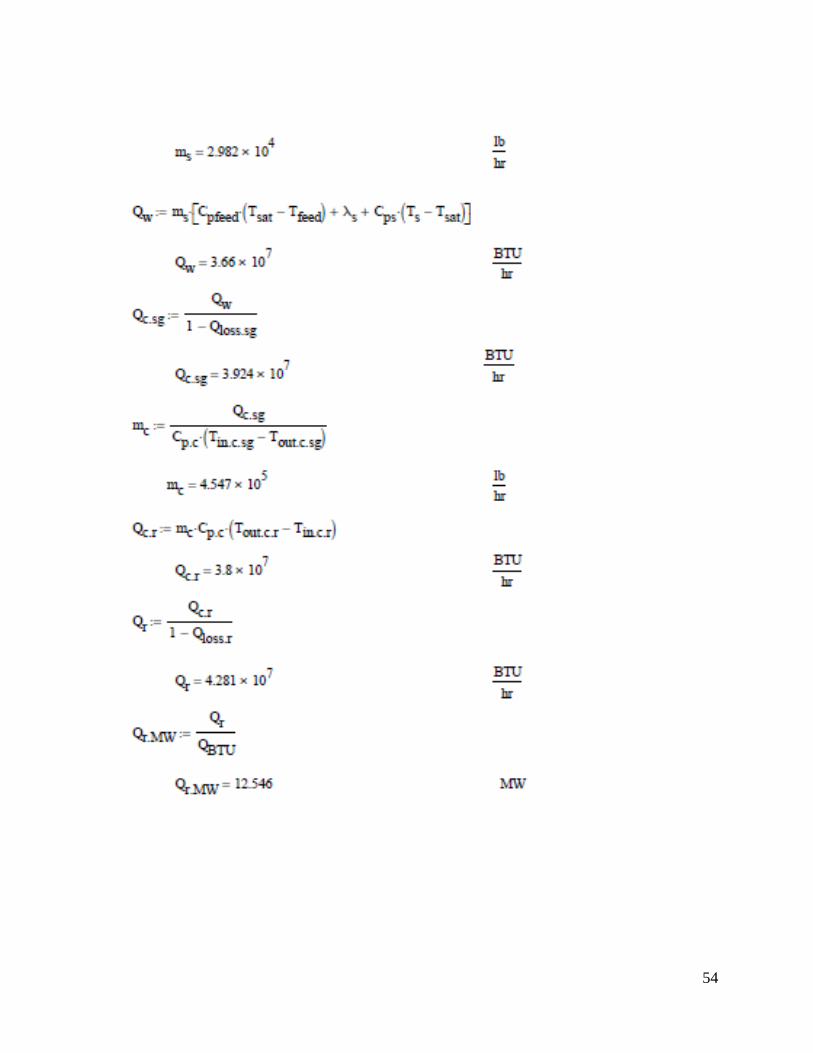
54
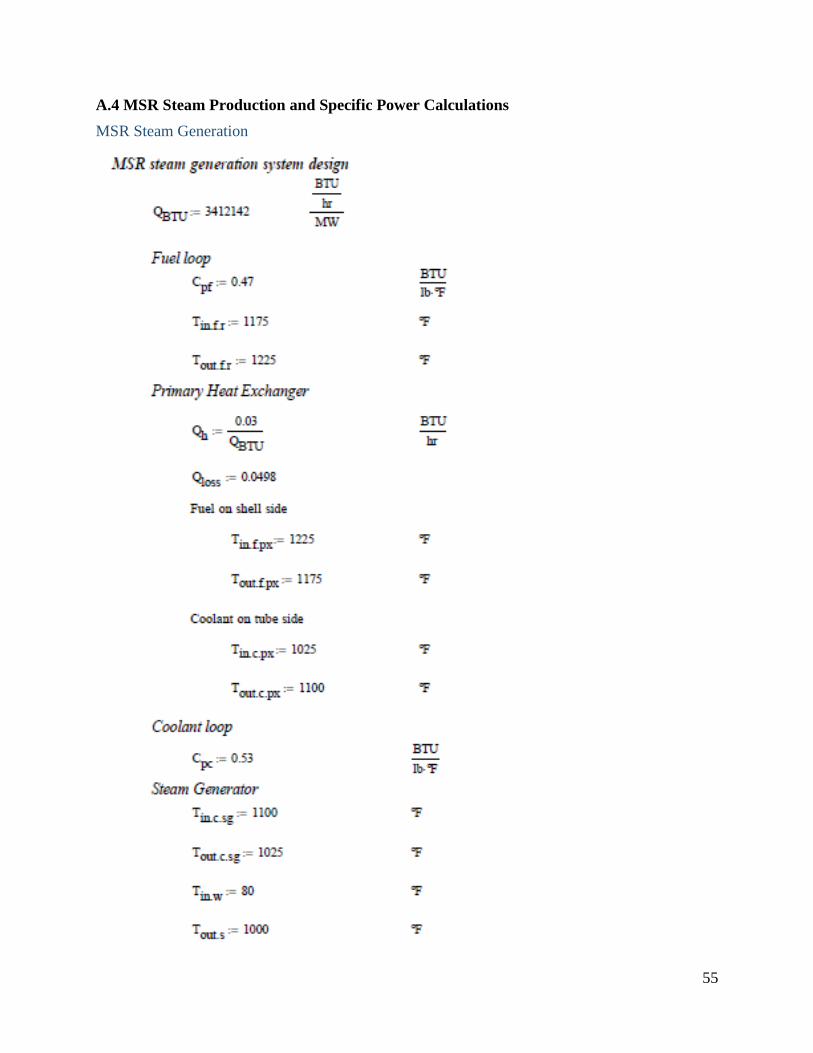
55
A.4 MSR Steam Production and Specific Power Calculations
MSR Steam Generation

56
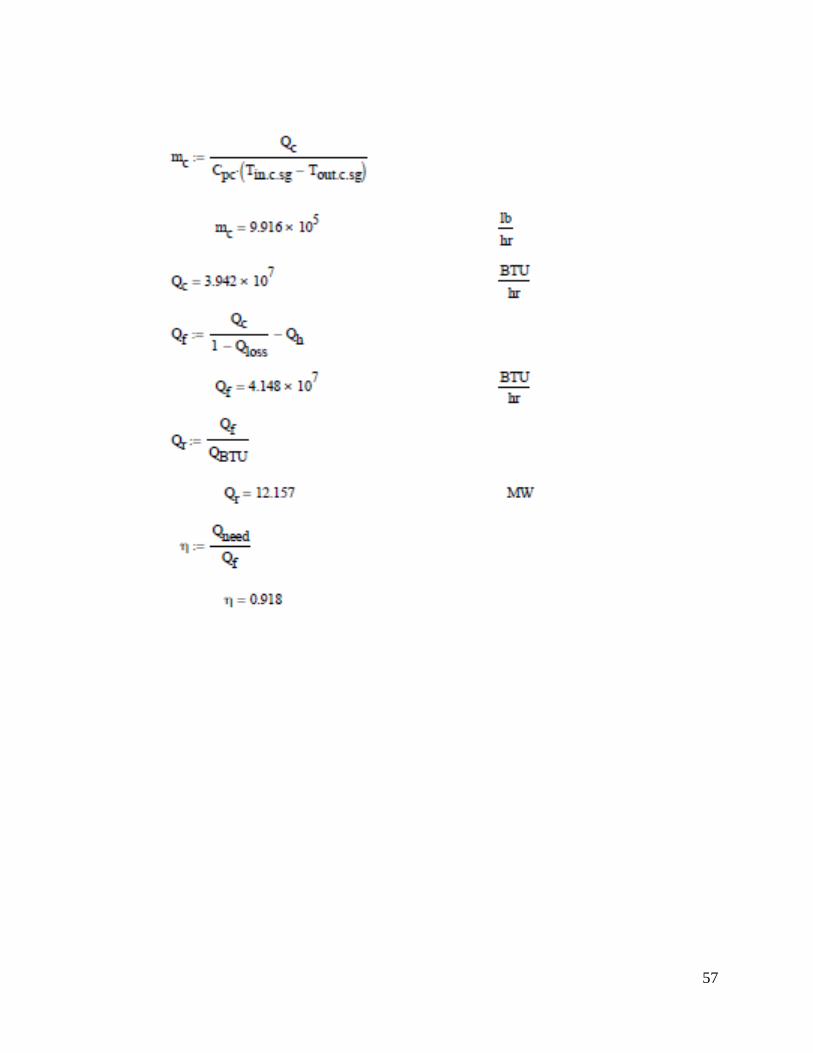
57
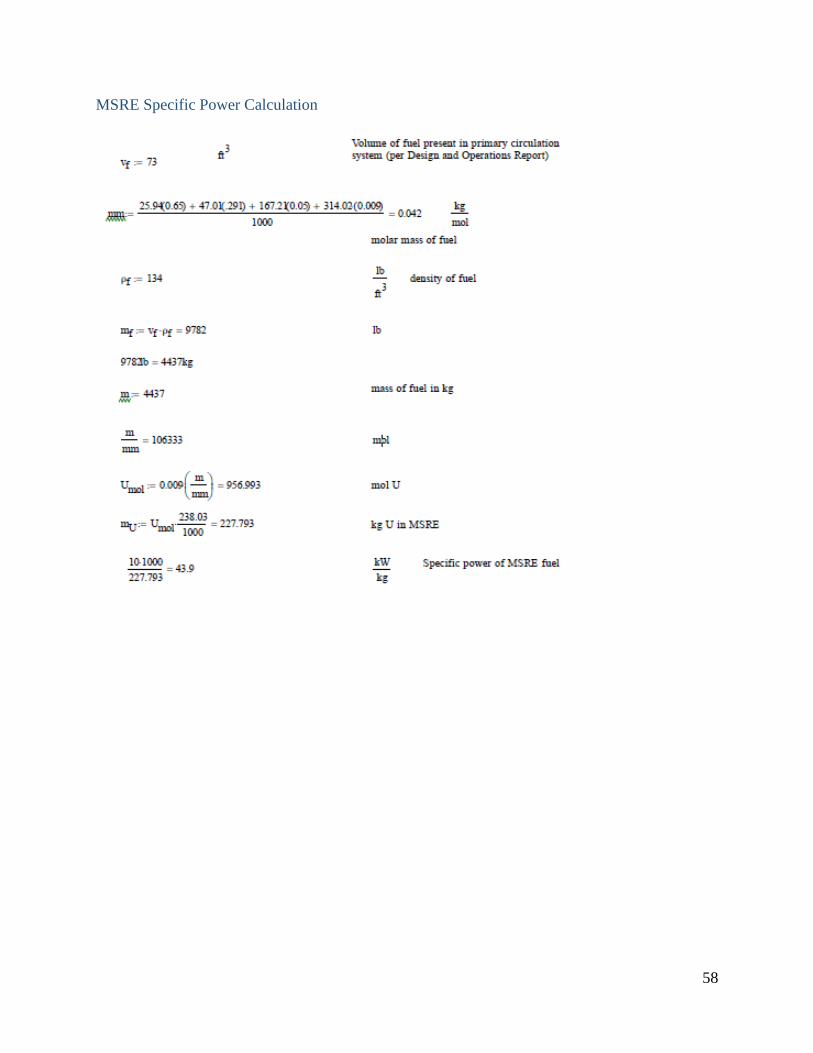
58
MSRE Specific Power Calculation
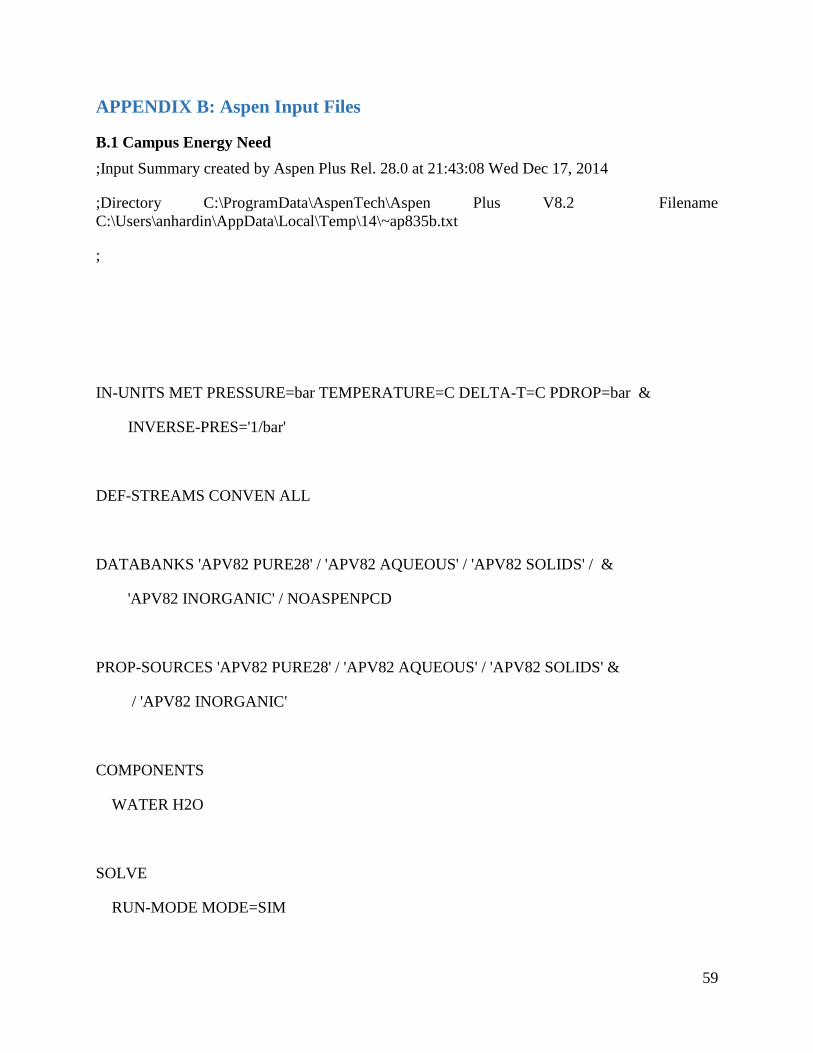
59
APPENDIX B: Aspen Input Files
B.1 Campus Energy Need
;Input Summary created by Aspen Plus Rel. 28.0 at 21:43:08 Wed Dec 17, 2014
;Directory C:\ProgramData\AspenTech\Aspen Plus V8.2 Filename
C:\Users\anhardin\AppData\Local\Temp\14\~ap835b.txt
;
IN-UNITS MET PRESSURE=bar TEMPERATURE=C DELTA-T=C PDROP=bar &
INVERSE-PRES='1/bar'
DEF-STREAMS CONVEN ALL
DATABANKS 'APV82 PURE28' / 'APV82 AQUEOUS' / 'APV82 SOLIDS' / &
'APV82 INORGANIC' / NOASPENPCD
PROP-SOURCES 'APV82 PURE28' / 'APV82 AQUEOUS' / 'APV82 SOLIDS' &
/ 'APV82 INORGANIC'
COMPONENTS
WATER H2O
SOLVE
RUN-MODE MODE=SIM
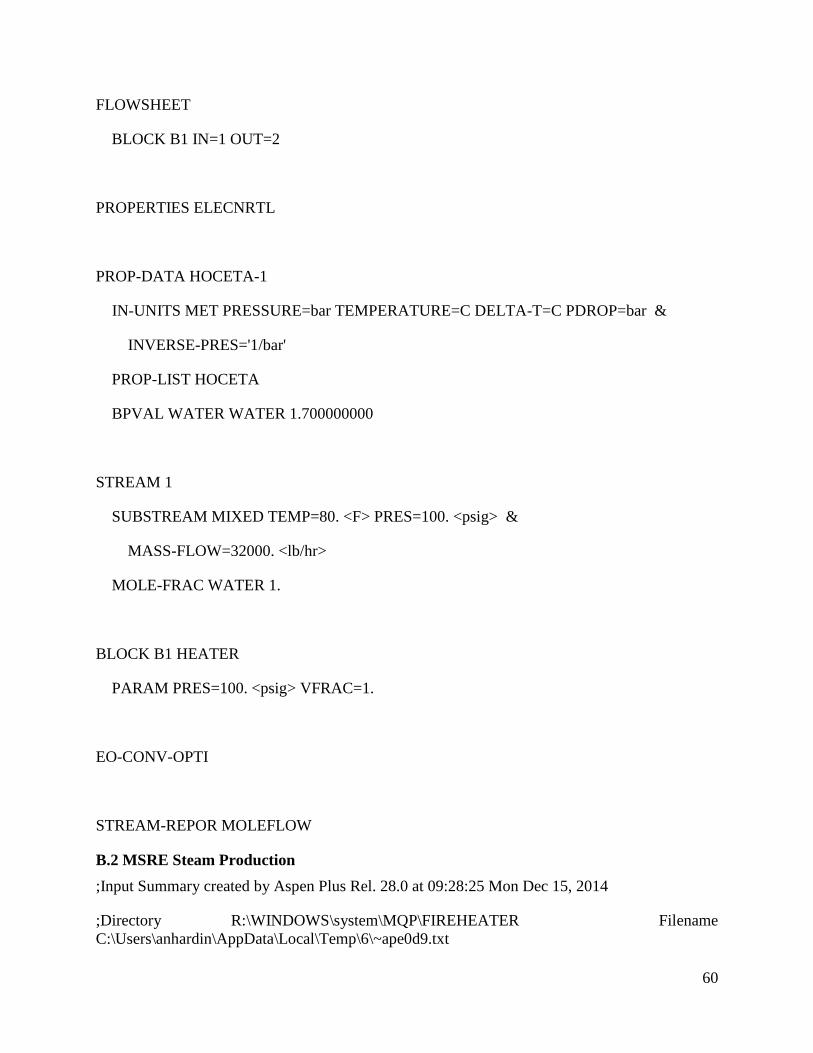
60
FLOWSHEET
BLOCK B1 IN=1 OUT=2
PROPERTIES ELECNRTL
PROP-DATA HOCETA-1
IN-UNITS MET PRESSURE=bar TEMPERATURE=C DELTA-T=C PDROP=bar &
INVERSE-PRES='1/bar'
PROP-LIST HOCETA
BPVAL WATER WATER 1.700000000
STREAM 1
SUBSTREAM MIXED TEMP=80. <F> PRES=100. <psig> &
MASS-FLOW=32000. <lb/hr>
MOLE-FRAC WATER 1.
BLOCK B1 HEATER
PARAM PRES=100. <psig> VFRAC=1.
EO-CONV-OPTI
STREAM-REPOR MOLEFLOW
B.2 MSRE Steam Production
;Input Summary created by Aspen Plus Rel. 28.0 at 09:28:25 Mon Dec 15, 2014
;Directory R:\WINDOWS\system\MQP\FIREHEATER Filename
C:\Users\anhardin\AppData\Local\Temp\6\~ape0d9.txt
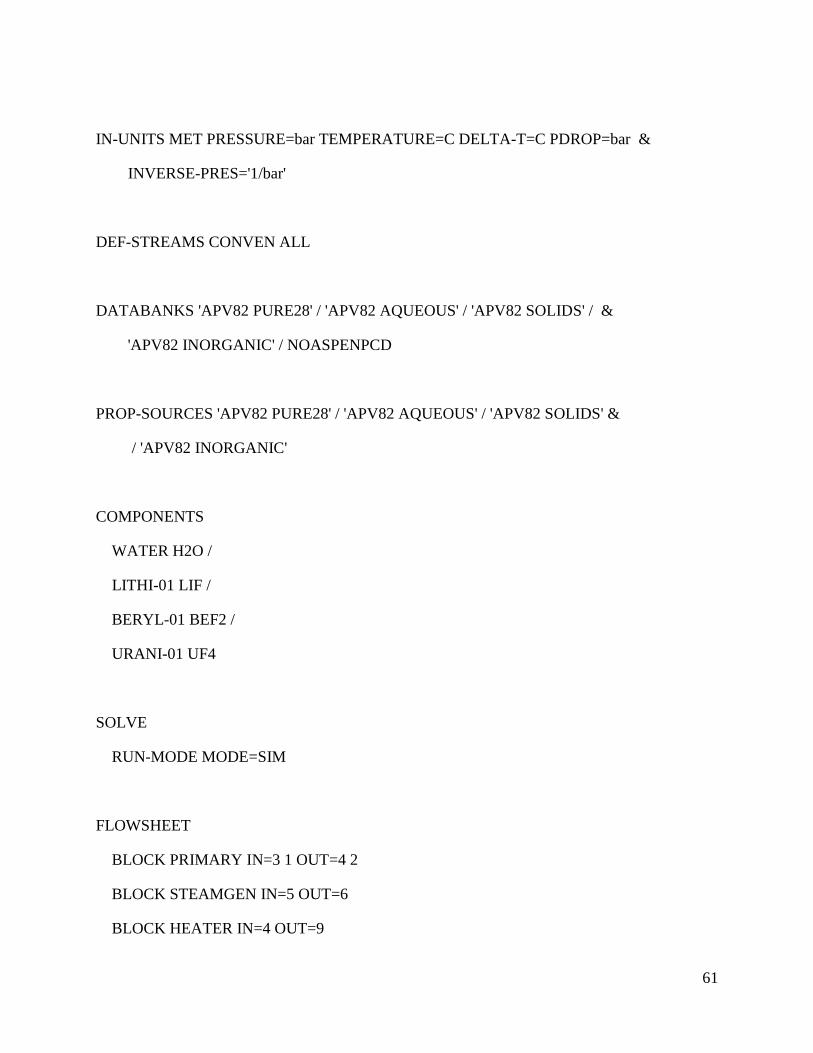
61
IN-UNITS MET PRESSURE=bar TEMPERATURE=C DELTA-T=C PDROP=bar &
INVERSE-PRES='1/bar'
DEF-STREAMS CONVEN ALL
DATABANKS 'APV82 PURE28' / 'APV82 AQUEOUS' / 'APV82 SOLIDS' / &
'APV82 INORGANIC' / NOASPENPCD
PROP-SOURCES 'APV82 PURE28' / 'APV82 AQUEOUS' / 'APV82 SOLIDS' &
/ 'APV82 INORGANIC'
COMPONENTS
WATER H2O /
LITHI-01 LIF /
BERYL-01 BEF2 /
URANI-01 UF4
SOLVE
RUN-MODE MODE=SIM
FLOWSHEET
BLOCK PRIMARY IN=3 1 OUT=4 2
BLOCK STEAMGEN IN=5 OUT=6
BLOCK HEATER IN=4 OUT=9
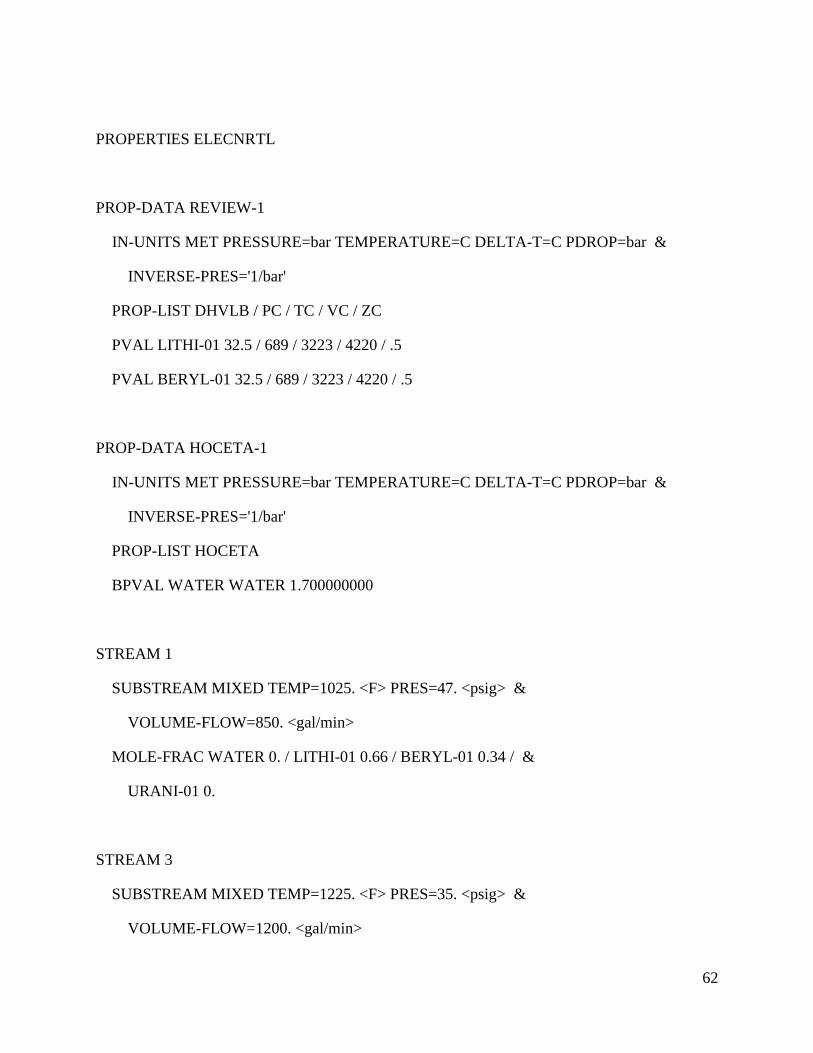
62
PROPERTIES ELECNRTL
PROP-DATA REVIEW-1
IN-UNITS MET PRESSURE=bar TEMPERATURE=C DELTA-T=C PDROP=bar &
INVERSE-PRES='1/bar'
PROP-LIST DHVLB / PC / TC / VC / ZC
PVAL LITHI-01 32.5 / 689 / 3223 / 4220 / .5
PVAL BERYL-01 32.5 / 689 / 3223 / 4220 / .5
PROP-DATA HOCETA-1
IN-UNITS MET PRESSURE=bar TEMPERATURE=C DELTA-T=C PDROP=bar &
INVERSE-PRES='1/bar'
PROP-LIST HOCETA
BPVAL WATER WATER 1.700000000
STREAM 1
SUBSTREAM MIXED TEMP=1025. <F> PRES=47. <psig> &
VOLUME-FLOW=850. <gal/min>
MOLE-FRAC WATER 0. / LITHI-01 0.66 / BERYL-01 0.34 / &
URANI-01 0.
STREAM 3
SUBSTREAM MIXED TEMP=1225. <F> PRES=35. <psig> &
VOLUME-FLOW=1200. <gal/min>
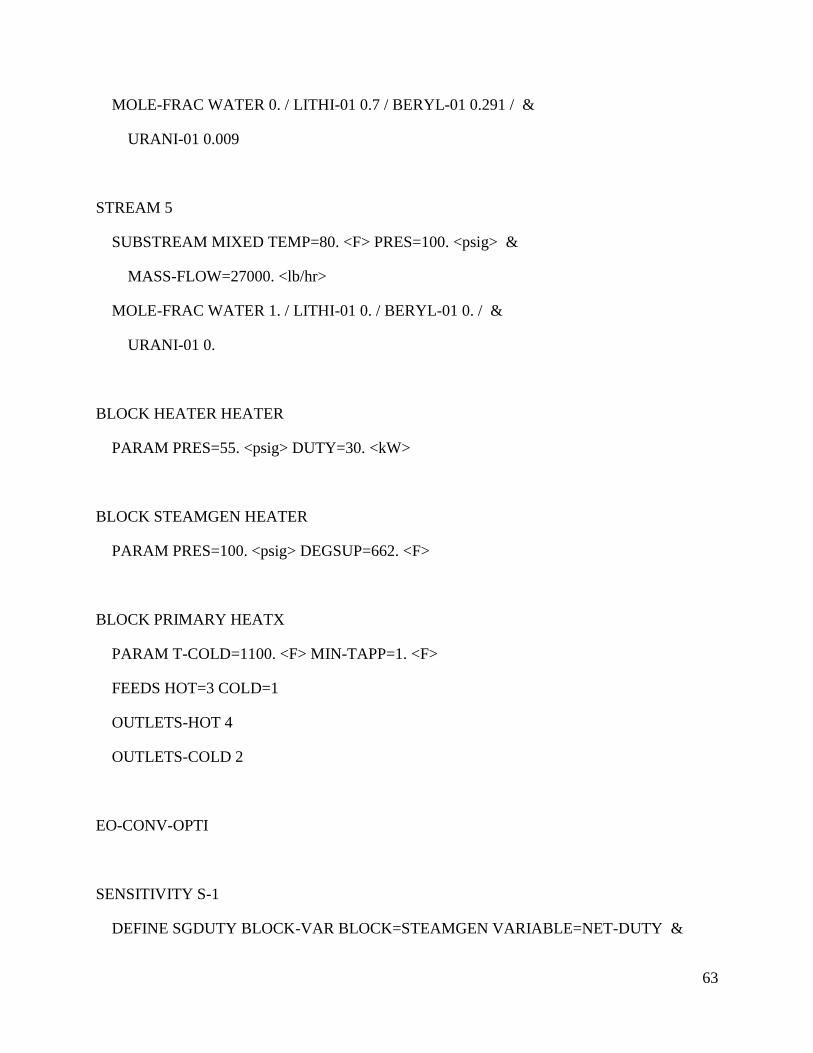
63
MOLE-FRAC WATER 0. / LITHI-01 0.7 / BERYL-01 0.291 / &
URANI-01 0.009
STREAM 5
SUBSTREAM MIXED TEMP=80. <F> PRES=100. <psig> &
MASS-FLOW=27000. <lb/hr>
MOLE-FRAC WATER 1. / LITHI-01 0. / BERYL-01 0. / &
URANI-01 0.
BLOCK HEATER HEATER
PARAM PRES=55. <psig> DUTY=30. <kW>
BLOCK STEAMGEN HEATER
PARAM PRES=100. <psig> DEGSUP=662. <F>
BLOCK PRIMARY HEATX
PARAM T-COLD=1100. <F> MIN-TAPP=1. <F>
FEEDS HOT=3 COLD=1
OUTLETS-HOT 4
OUTLETS-COLD 2
EO-CONV-OPTI
SENSITIVITY S-1
DEFINE SGDUTY BLOCK-VAR BLOCK=STEAMGEN VARIABLE=NET-DUTY &
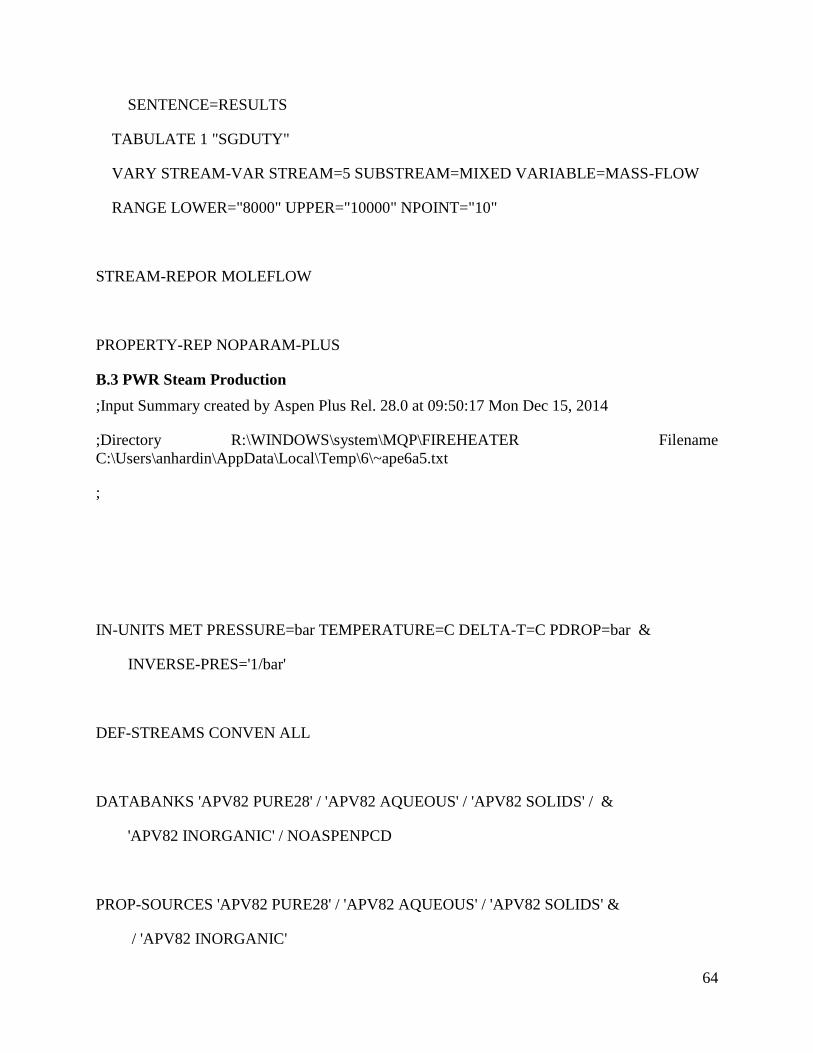
64
SENTENCE=RESULTS
TABULATE 1 "SGDUTY"
VARY STREAM-VAR STREAM=5 SUBSTREAM=MIXED VARIABLE=MASS-FLOW
RANGE LOWER="8000" UPPER="10000" NPOINT="10"
STREAM-REPOR MOLEFLOW
PROPERTY-REP NOPARAM-PLUS
B.3 PWR Steam Production
;Input Summary created by Aspen Plus Rel. 28.0 at 09:50:17 Mon Dec 15, 2014
;Directory R:\WINDOWS\system\MQP\FIREHEATER Filename
C:\Users\anhardin\AppData\Local\Temp\6\~ape6a5.txt
;
IN-UNITS MET PRESSURE=bar TEMPERATURE=C DELTA-T=C PDROP=bar &
INVERSE-PRES='1/bar'
DEF-STREAMS CONVEN ALL
DATABANKS 'APV82 PURE28' / 'APV82 AQUEOUS' / 'APV82 SOLIDS' / &
'APV82 INORGANIC' / NOASPENPCD
PROP-SOURCES 'APV82 PURE28' / 'APV82 AQUEOUS' / 'APV82 SOLIDS' &
/ 'APV82 INORGANIC'
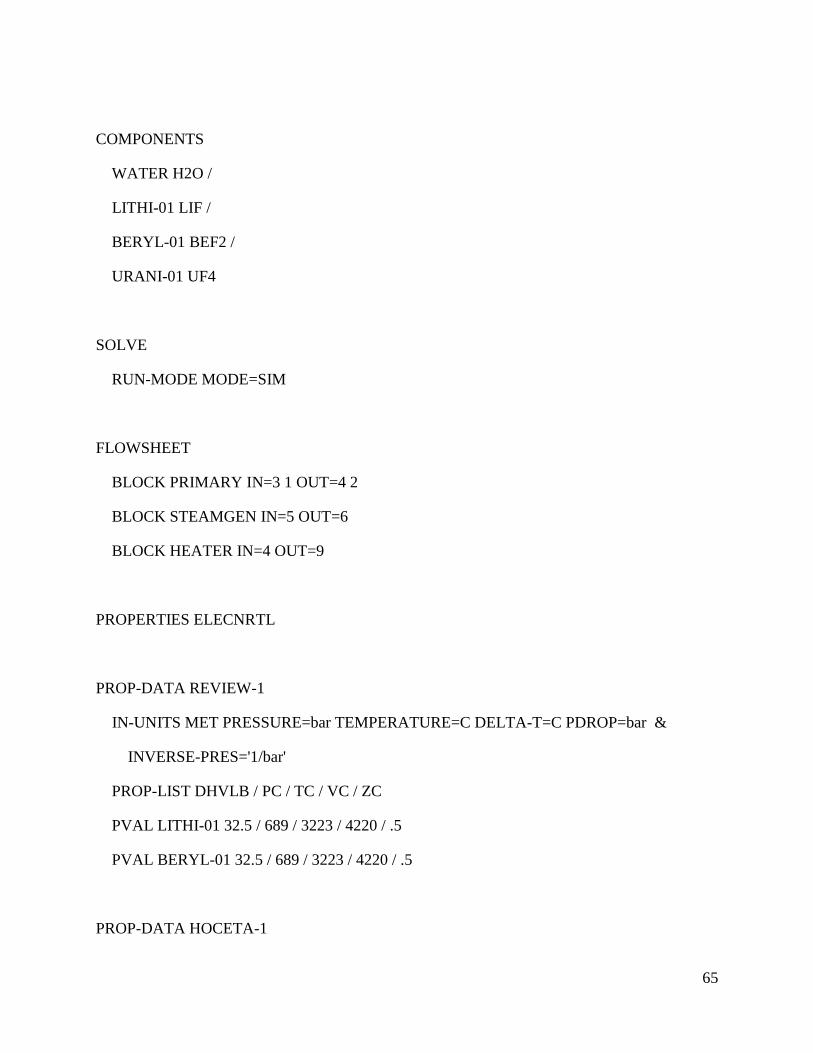
65
COMPONENTS
WATER H2O /
LITHI-01 LIF /
BERYL-01 BEF2 /
URANI-01 UF4
SOLVE
RUN-MODE MODE=SIM
FLOWSHEET
BLOCK PRIMARY IN=3 1 OUT=4 2
BLOCK STEAMGEN IN=5 OUT=6
BLOCK HEATER IN=4 OUT=9
PROPERTIES ELECNRTL
PROP-DATA REVIEW-1
IN-UNITS MET PRESSURE=bar TEMPERATURE=C DELTA-T=C PDROP=bar &
INVERSE-PRES='1/bar'
PROP-LIST DHVLB / PC / TC / VC / ZC
PVAL LITHI-01 32.5 / 689 / 3223 / 4220 / .5
PVAL BERYL-01 32.5 / 689 / 3223 / 4220 / .5
PROP-DATA HOCETA-1

66
IN-UNITS MET PRESSURE=bar TEMPERATURE=C DELTA-T=C PDROP=bar &
INVERSE-PRES='1/bar'
PROP-LIST HOCETA
BPVAL WATER WATER 1.700000000
STREAM 1
SUBSTREAM MIXED TEMP=1025. <F> PRES=47. <psig> &
VOLUME-FLOW=850. <gal/min>
MOLE-FRAC WATER 0. / LITHI-01 0.66 / BERYL-01 0.34 / &
URANI-01 0.
STREAM 3
SUBSTREAM MIXED TEMP=1225. <F> PRES=35. <psig> &
VOLUME-FLOW=1200. <gal/min>
MOLE-FRAC WATER 0. / LITHI-01 0.7 / BERYL-01 0.291 / &
URANI-01 0.009
STREAM 5
SUBSTREAM MIXED TEMP=80. <F> PRES=100. <psig> &
MASS-FLOW=27000. <lb/hr>
MOLE-FRAC WATER 1. / LITHI-01 0. / BERYL-01 0. / &
URANI-01 0.
BLOCK HEATER HEATER
PARAM PRES=55. <psig> DUTY=30. <kW>
67
BLOCK STEAMGEN HEATER
PARAM PRES=100. <psig> VFRAC=1.
BLOCK PRIMARY HEATX
PARAM T-COLD=1100. <F> MIN-TAPP=1. <F>
FEEDS HOT=3 COLD=1
OUTLETS-HOT 4
OUTLETS-COLD 2
EO-CONV-OPTI
SENSITIVITY S-1
DEFINE SGDUTY BLOCK-VAR BLOCK=STEAMGEN VARIABLE=NET-DUTY &
SENTENCE=RESULTS
TABULATE 1 "SGDUTY"
VARY STREAM-VAR STREAM=5 SUBSTREAM=MIXED VARIABLE=MASS-FLOW
RANGE LOWER="12000" UPPER="18000" NPOINT="10"
STREAM-REPOR MOLEFLOW
PROPERTY-REP NOPARAM-PLUS
B.4 MSR Steam Production
;Input Summary created by Aspen Plus Rel. 28.0 at 10:07:22 Mon Dec 15, 2014
;Directory R:\WINDOWS\system\MQP\FIREHEATER Filename
C:\Users\anhardin\AppData\Local\Temp\6\~ap884b.txt

68
;
IN-UNITS MET PRESSURE=bar TEMPERATURE=C DELTA-T=C PDROP=bar &
INVERSE-PRES='1/bar'
DEF-STREAMS CONVEN ALL
DATABANKS 'APV82 PURE28' / 'APV82 AQUEOUS' / 'APV82 SOLIDS' / &
'APV82 INORGANIC' / NOASPENPCD
PROP-SOURCES 'APV82 PURE28' / 'APV82 AQUEOUS' / 'APV82 SOLIDS' &
/ 'APV82 INORGANIC'
COMPONENTS
WATER H2O /
LITHI-01 LIF /
BERYL-01 BEF2 /
URANI-01 UF4
SOLVE
RUN-MODE MODE=SIM
FLOWSHEET
69
BLOCK PRIMARY IN=3 1 OUT=4 2
BLOCK STEAMGEN IN=5 OUT=6
BLOCK HEATER IN=4 OUT=9
PROPERTIES ELECNRTL
PROP-DATA REVIEW-1
IN-UNITS MET PRESSURE=bar TEMPERATURE=C DELTA-T=C PDROP=bar &
INVERSE-PRES='1/bar'
PROP-LIST DHVLB / PC / TC / VC / ZC
PVAL LITHI-01 32.5 / 689 / 3223 / 4220 / .5
PVAL BERYL-01 32.5 / 689 / 3223 / 4220 / .5
PROP-DATA HOCETA-1
IN-UNITS MET PRESSURE=bar TEMPERATURE=C DELTA-T=C PDROP=bar &
INVERSE-PRES='1/bar'
PROP-LIST HOCETA
BPVAL WATER WATER 1.700000000
STREAM 1
SUBSTREAM MIXED TEMP=1025. <F> PRES=47. <psig> &
VOLUME-FLOW=850. <gal/min>
MOLE-FRAC WATER 0. / LITHI-01 0.66 / BERYL-01 0.34 / &
URANI-01 0.

70
STREAM 3
SUBSTREAM MIXED TEMP=1225. <F> PRES=35. <psig> &
VOLUME-FLOW=1200. <gal/min>
MOLE-FRAC WATER 0. / LITHI-01 0.7 / BERYL-01 0.291 / &
URANI-01 0.009
STREAM 5
SUBSTREAM MIXED TEMP=80. <F> PRES=100. <psig> &
MASS-FLOW=27000. <lb/hr>
MOLE-FRAC WATER 1. / LITHI-01 0. / BERYL-01 0. / &
URANI-01 0.
BLOCK HEATER HEATER
PARAM PRES=55. <psig> DUTY=30. <kW>
BLOCK STEAMGEN HEATER
PARAM PRES=100. <psig> DEGSUP=662. <F>
BLOCK PRIMARY HEATX
PARAM T-COLD=1100. <F> MIN-TAPP=1. <F>
FEEDS HOT=3 COLD=1
OUTLETS-HOT 4
OUTLETS-COLD 2
EO-CONV-OPTI
71
SENSITIVITY S-1
DEFINE SGDUTY BLOCK-VAR BLOCK=STEAMGEN VARIABLE=DUTY &
SENTENCE=PARAM
TABULATE 1 "SGDUTY"
VARY STREAM-VAR STREAM=5 SUBSTREAM=MIXED VARIABLE=MASS-FLOW
RANGE LOWER="10000" UPPER="14000" NPOINT="10"
STREAM-REPOR MOLEFLOW
PROPERTY-REP NOPARAM-PLUS
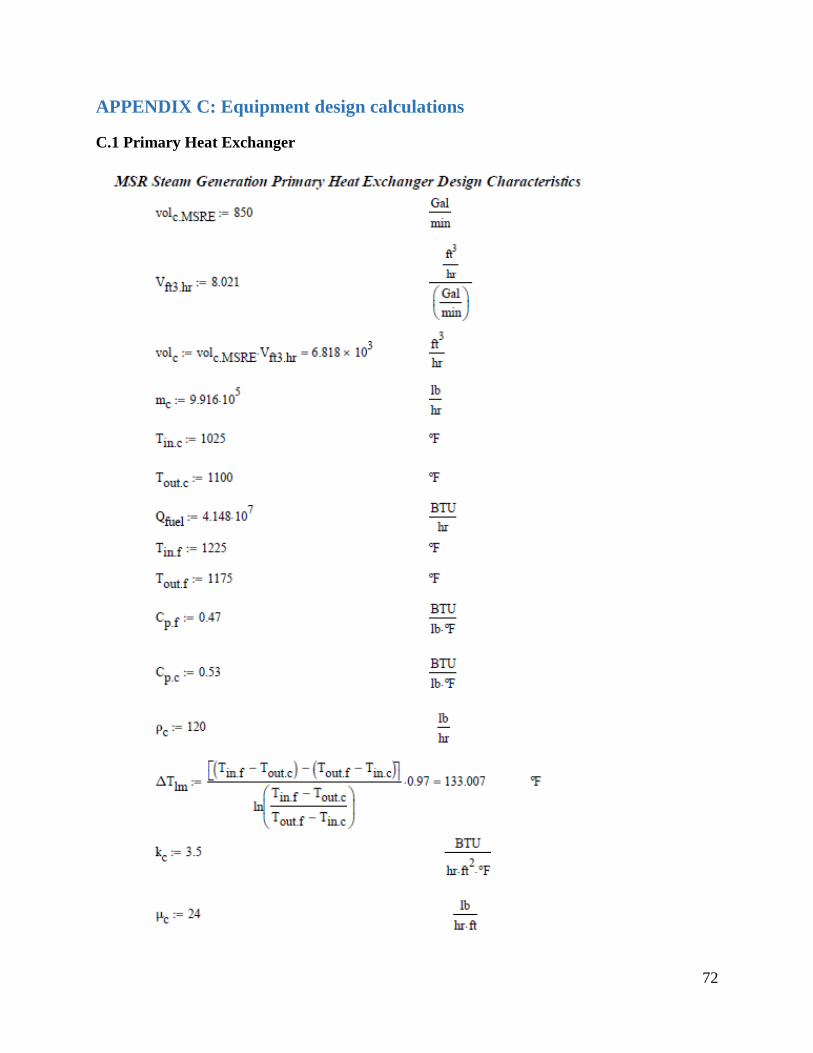
72
APPENDIX C: Equipment design calculations
C.1 Primary Heat Exchanger
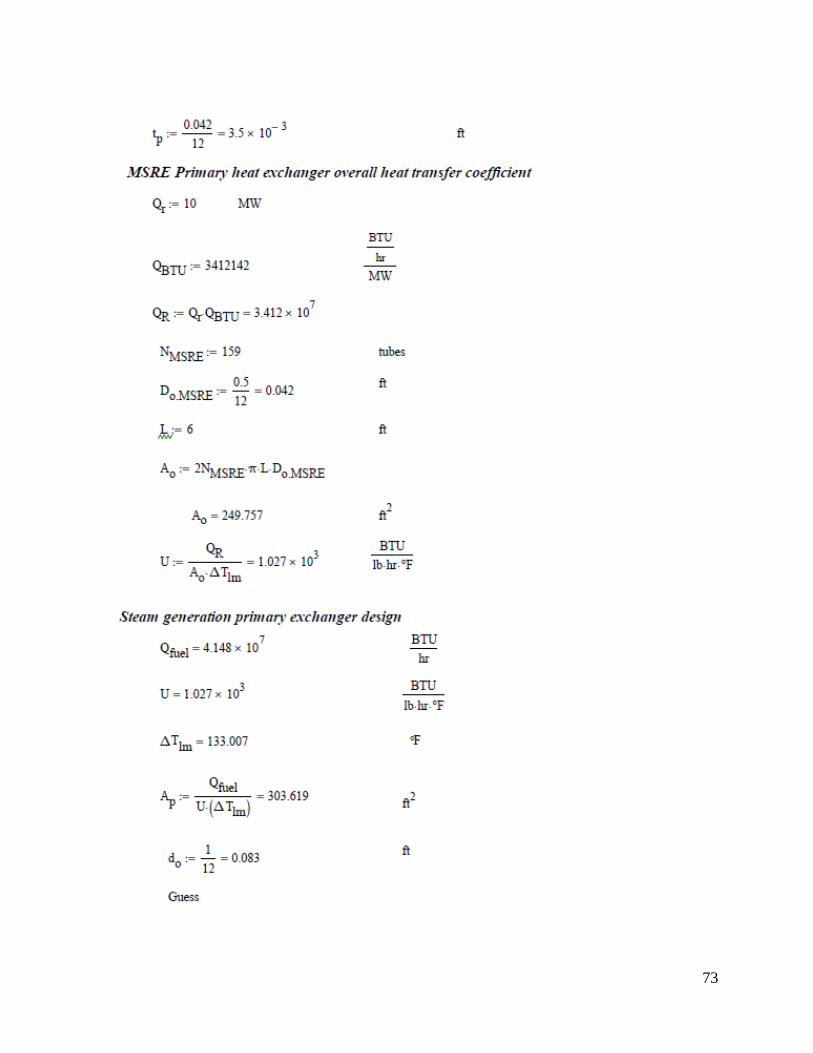
73

74
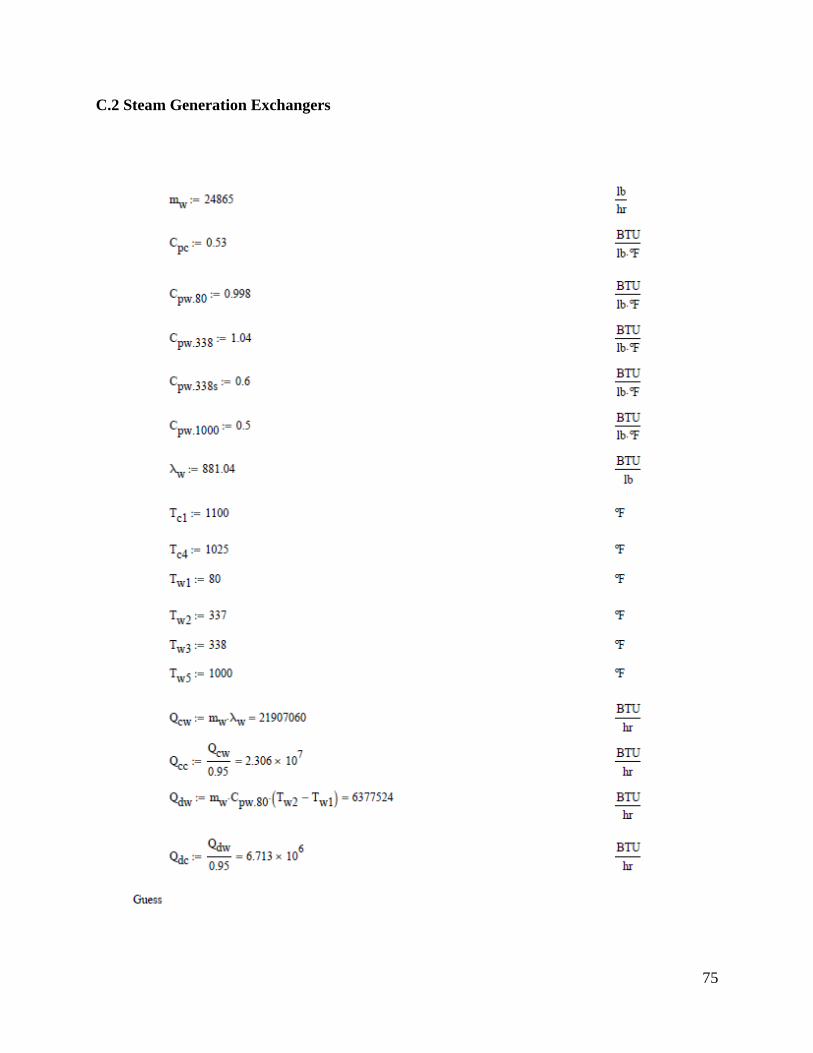
75
C.2 Steam Generation Exchangers
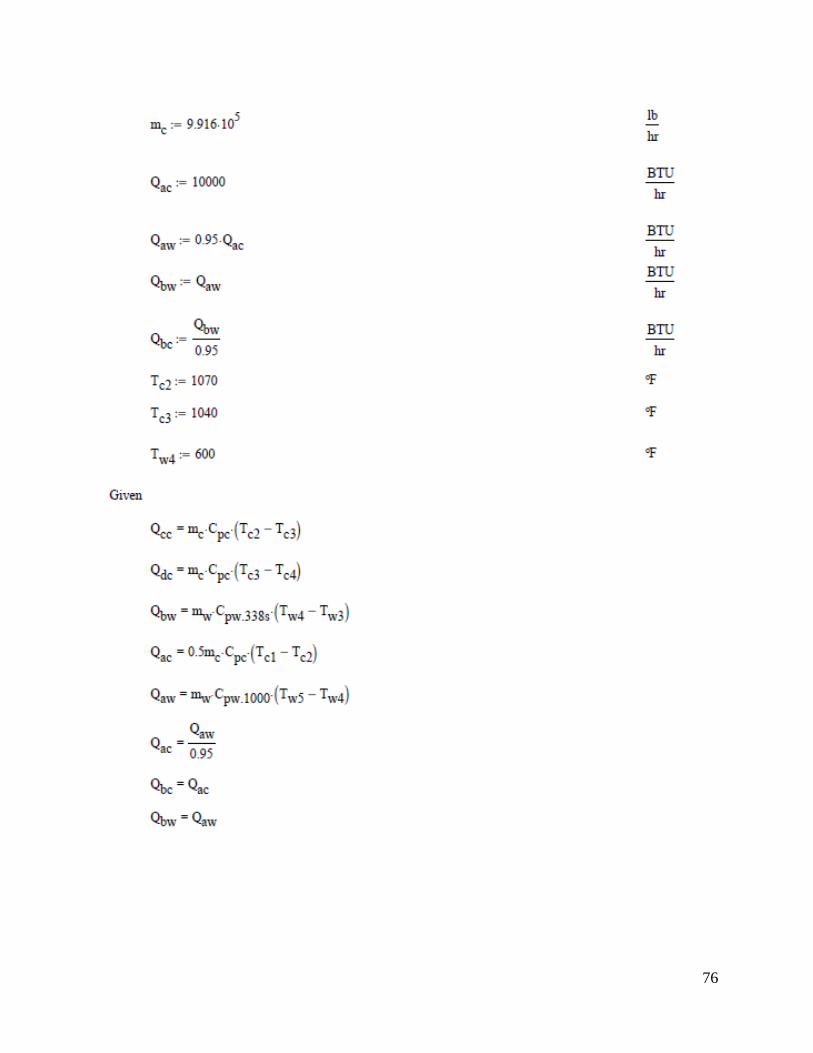
76

77
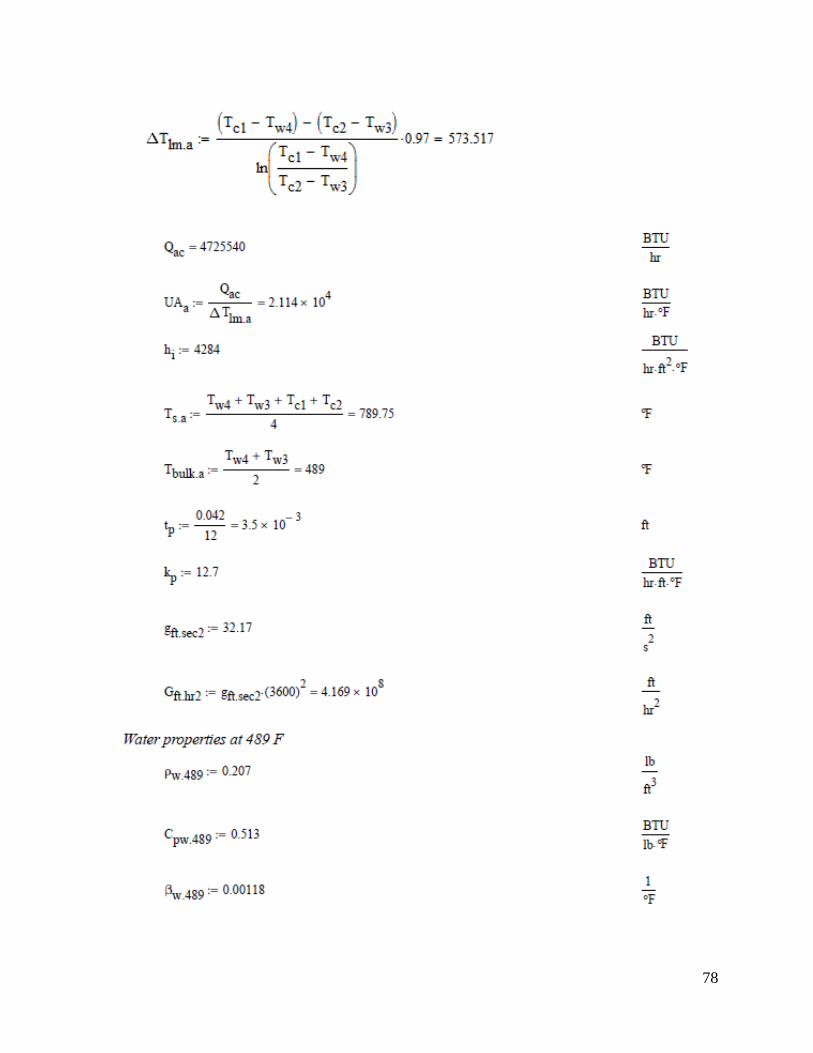
78
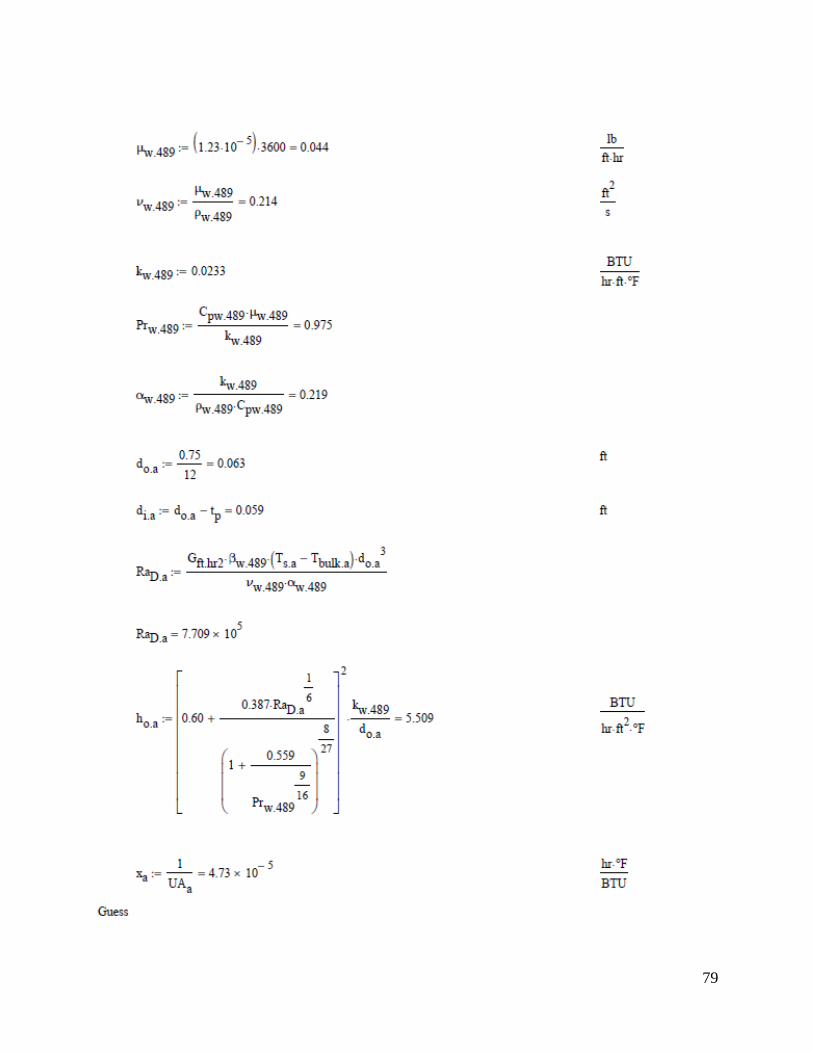
79

80

81

82

83
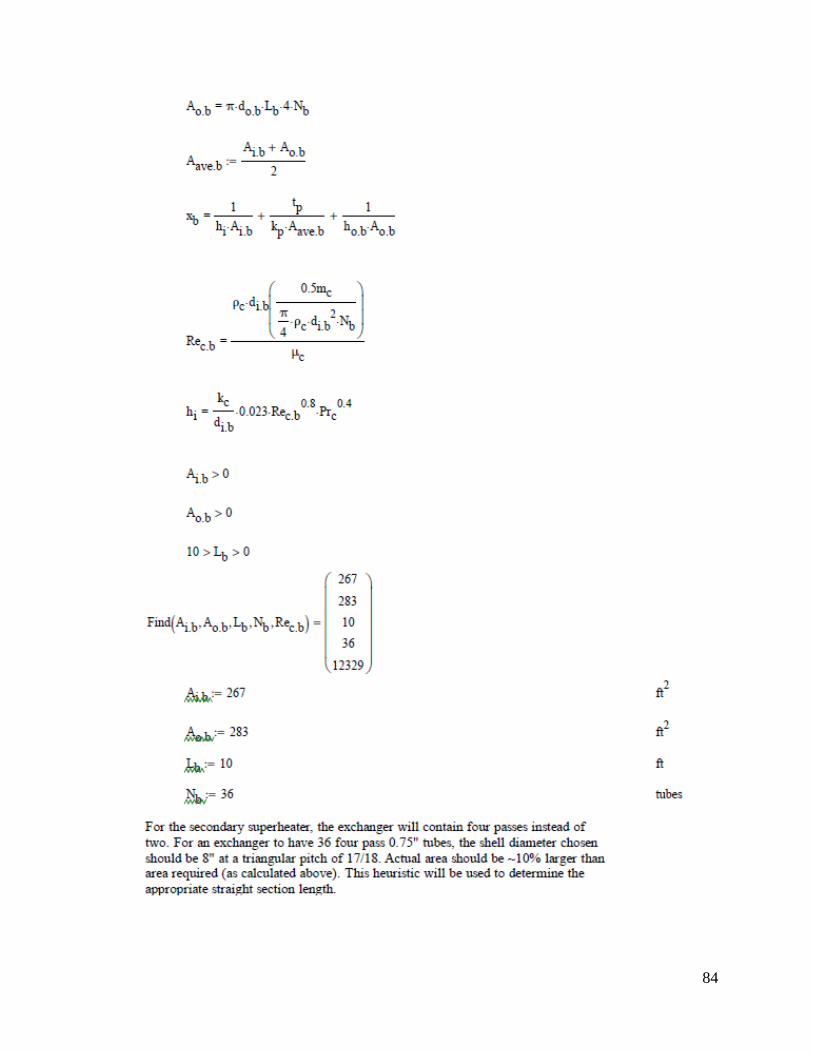
84
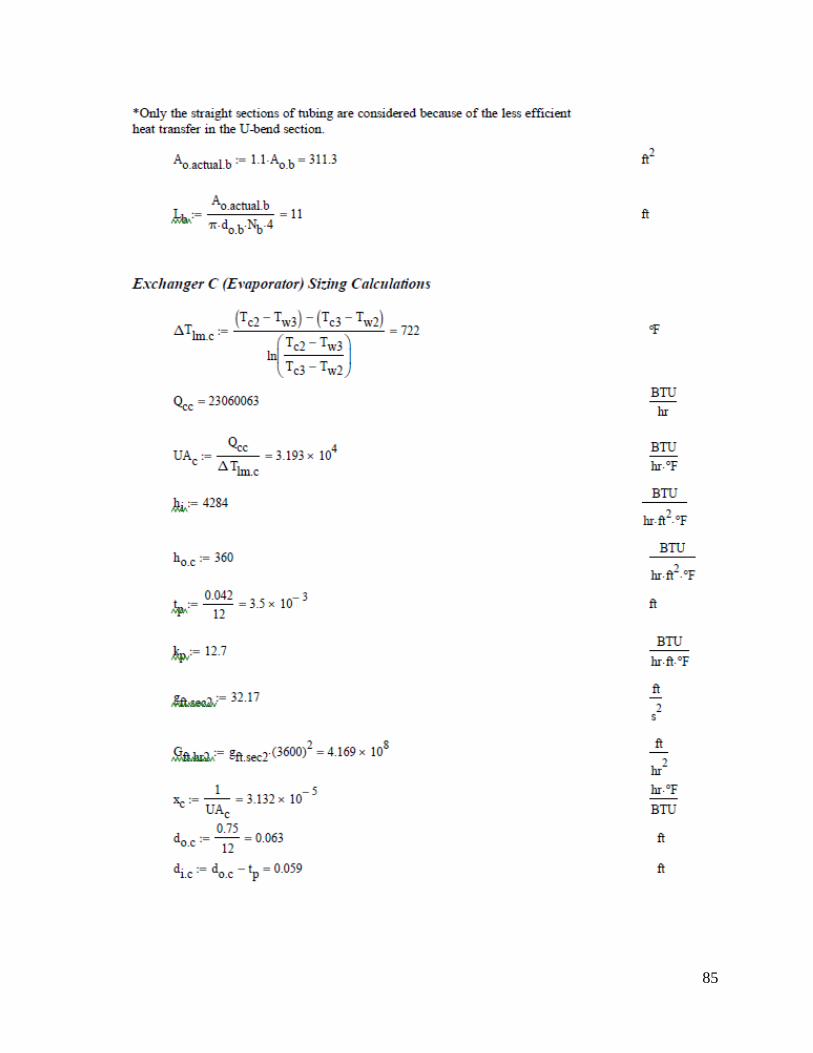
85

86

87

88

89
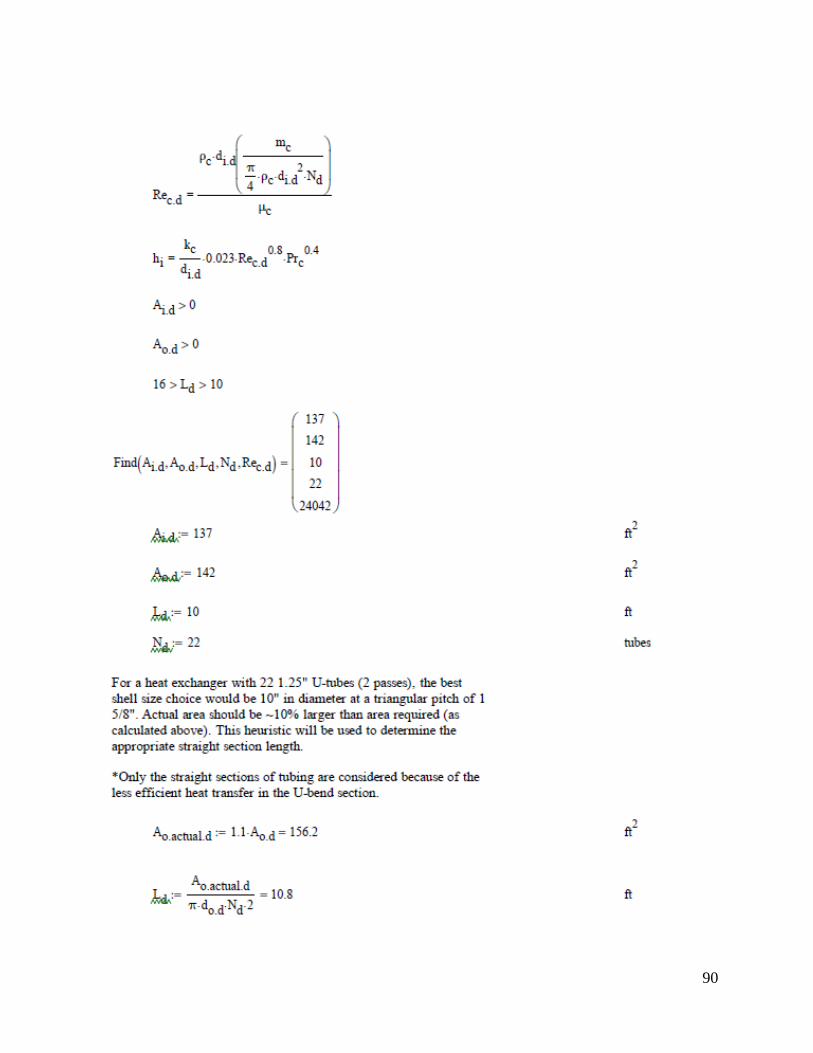
90
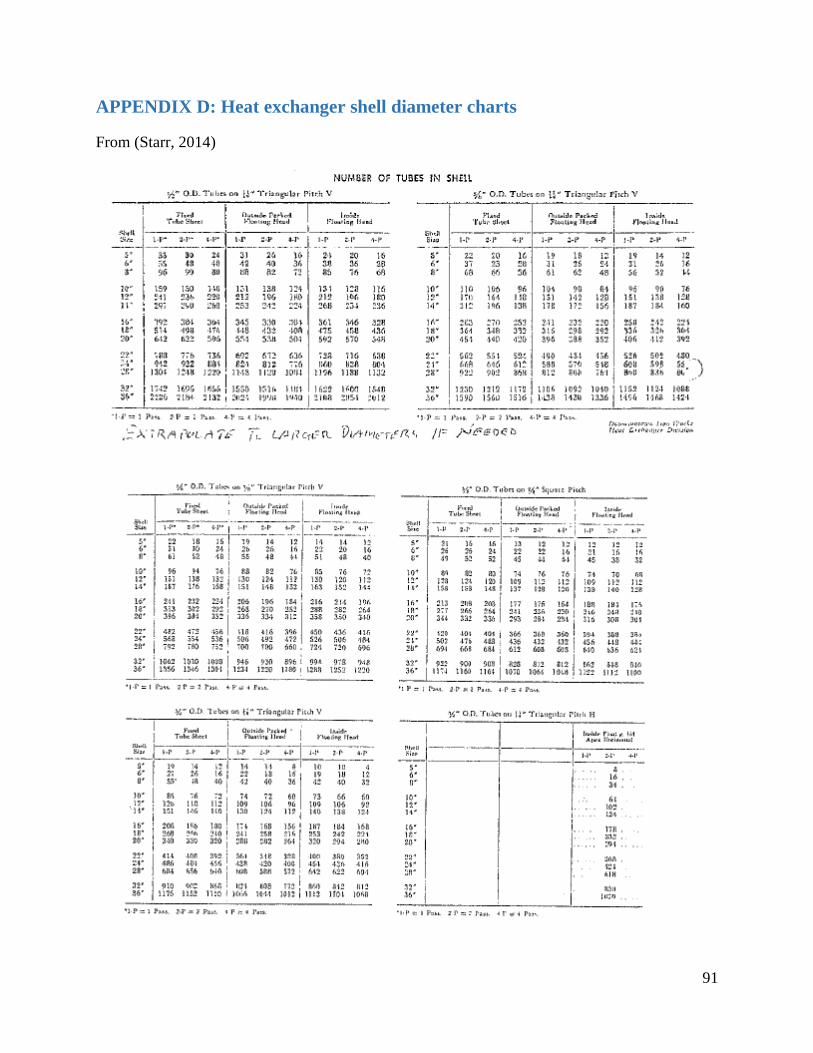
91
APPENDIX D: Heat exchanger shell diameter charts
From (Starr, 2014)
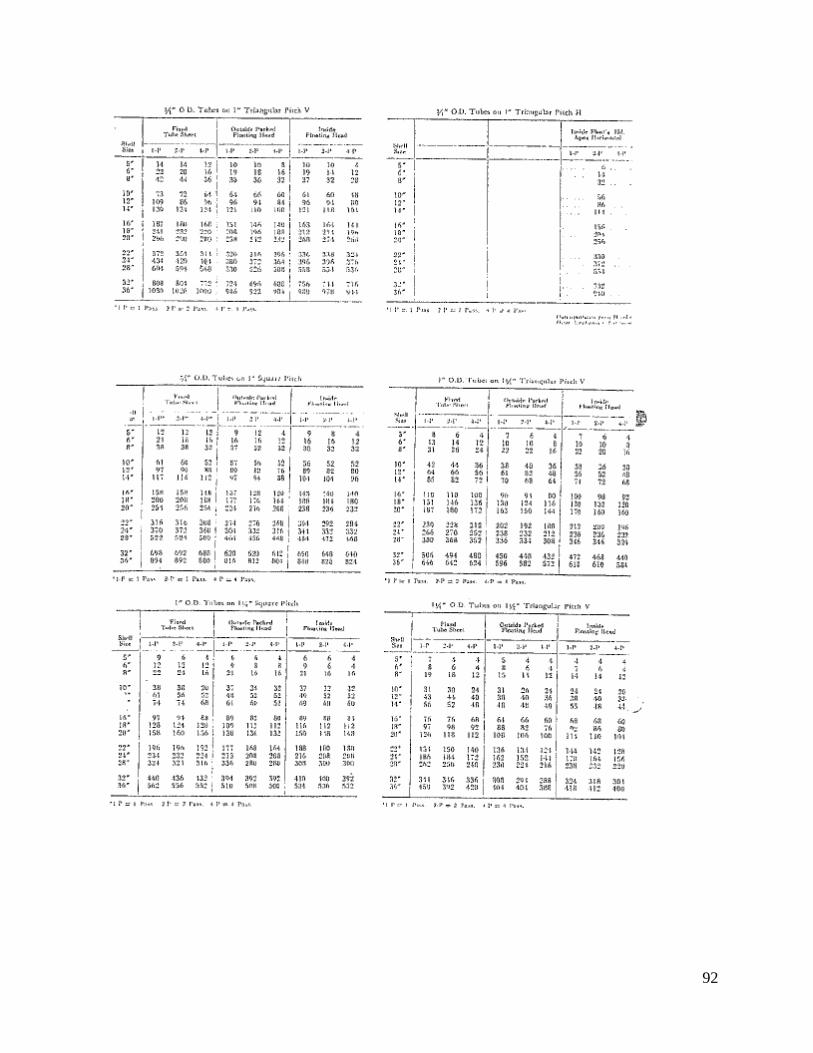
92
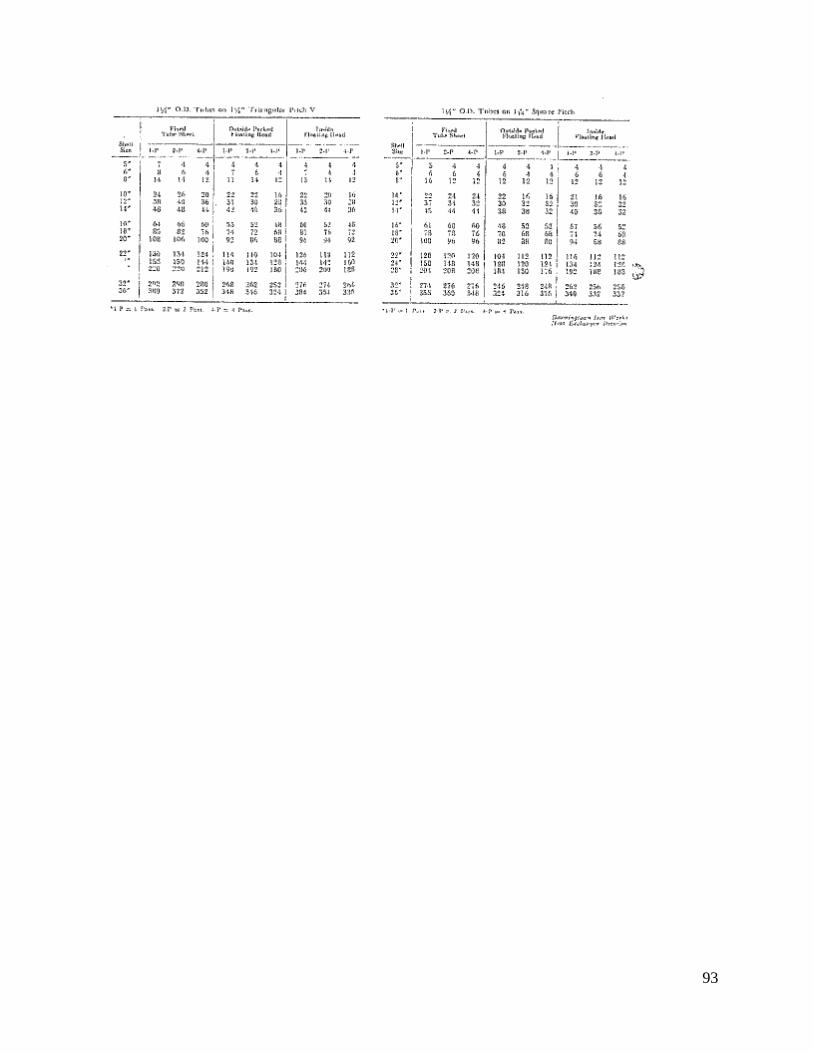
93
94
Reactor de sales fundidas (MSR) para la
producción de vapor en Worcester Polytechnic
Institute (WPI)
Un reporte para el Major Qualifying Project
Entregada a la facultad de Worcester Polytechnic Institute
En realización parcial de los requisitos para
El título de bachillerato en Ciencia
Presentado por:
Alexandra Hardin
Presentado a:
Departamento de Ingeniería Química y
Departamento de Humanidades y Artes, WPI, Worcester, MA
Presentado el
11 de marzo del 2015
Asesores del proyecto:
Peter Miraglia
Robert W. Thompson
Ángel Rivera

95
Desde este punto, los trabajos son una traducción del trabajo original de “Molten Salt Reactor for
WPI Steam Generation” [Reactor de sales fundidas (MSR) para la producción de vapor en
Worcester Polytechnic Institute (WPI)], el proyecto de MQP, que se puede encontrar en el link:
https://www.wpi.edu/Pubs/E-project/Available/E-project-122214-085446/
Cada traducción ha sido realizada por Alexandra Hardin.
96
REFLEXIÓN
En parte de la realización de un requisito para el título de Bachillerato en Ciencia, hice un Major
Qualifying Project (MQP) en dos áreas: Ingeniería Química y las Humanidades y Artes. Para
realizar el requisito de Ingeniería Química, completé el proyecto, “Reactor de sales fundidas
(MSR) para la producción de vapor en Worcester Polytechnic Institute (WPI)” [Molten Salt
Reactor (MSR) for WPI Steam Generation]. Para realizar el requisito de las Humanidades y Artes,
con un enfoque en español y estudios hispánicos, traduje el proyecto. Lo que sigue es una reflexión
del proceso de traducir: las dificultades, retos y cosas que aprendí. Después, se puede encontrar el
trabajo de traducción.
Para empezar, es importante considerar dos cosas que hace más fácil el proceso de traducción para
mí, como se indican en Scientific and Technical Translation. Primero, Herman menciona que “un
excelente traductor técnico también es un excelente escritor técnico” [“an excellent technical
translator is an excellent technical writer”] (Wright, 13). Gracias a mi experiencia y conocimiento
en el ámbito técnico, fue más fácil traducir el trabajo técnico. La escritura técnica tiene muchas
reglas, y es importante entenderlas en el proceso de traducción. Además, Herman menciona que
es necesario tener “una cantidad considerable de conocimiento detallado sobre el tema del texto
original” [considerable detailed knowledge, about the subject of the document to be translated]
para producir una traducción efectiva (Wright, 18). En este caso, traduje mi propio trabajo. Por
supuesto, he leído el proyecto muchas veces, y estoy muy familiarizado con el tema y los detalles
técnicos. Por eso, eliminé el primer paso en el proceso de traducción: leer y familiarizarse con el
trabajo original.
Aunque los primeros pasos en el proceso de traducción estuvieron a favor de mí, fueron muchos
retos en el resto del proceso. Primero, un problema típico en traducción es la falta de una traducción
exacta. Muchas veces, existe una palabra en un idioma que no existe en el otro idioma, pero existen
palabras más específicas o más generalizadas. Por ejemplo, mi proyecto trata de la producción de
energía. El concepto de energía en inglés es diferente que el en español. En ingles, existe la palabra
“power”, que describe la conversión de energía a corriente eléctrica. La traducción directa de
“power” es “poder”, pero en el sentido de fuerza física o control. Energía es una palabra general,
y para explicar el mismo concepto de “power”, es necesario añadir más descripción: energía
eléctrica. En traducir, es necesario entender el significado de las palabras en los dos idiomas para
mantener el mismo significado en la traducción. También es posible que una palabra no existe
porque no tiene aplicación en el otro idioma. El reactor de sales fundidas es una tecnología nueva
en los países más avanzados. Por eso, fue difícil encontrar términos correctos para describir algo
técnico en español. Por ejemplo, tuve dificultades en determinar una traducción para “inner/outer
film heat transfer coefficient”. Usé Linguee.com, un sitio de web que muestra traducciones
completadas para encontrar una traducción adecuada para una palabra, frase o términos. Pero el
sitio no tiene una traducción para “inner/outer film heat transfer coefficient”. Por eso, usé el
conocimiento del idioma y el contexto del término para traducirlo: el coeficiente térmico de la
capa interna/externa.
En Scientific and Technical Translation, Herman también menciona que “ninguna traducción que
tiene la intención de funcionar en si misma puede ser completamente literal, tampoco una
traducción de un texto técnico” [no translation meant to stand on its own, even one of a technical
document, can be literal in the word-for-word sense] (Wright, 13). Es imposible mantener el
97
mismo significado sin cambiar partes del texto original. En el caso de la cita mencionada en el
principio de este párrafo, por ejemplo, la frase en ingles incluye muchos clichés, que no se puede
traducir directamente porque sonaría mal en español. Muchas veces en traducir este trabajo,
cambié el orden de frases, formas del verbos, o vocabulario para crear un significado más cerca
del texto original. Por ejemplo, es raro usar gerundios en español, pero es mucho más común en
inglés. Por eso, donde se puede cambiar el gerundio al infinitivo u otra forma, lo hice. También,
en cambiar el gerundio, fue necesario cambiar el orden de la frase entera. Casos como esto, son
difíciles porque requieren conocimiento muy bueno del otro idioma. Es necesario “sentir” cuando
una frase es incorrecta. Es necesario saber aspectos culturales o conversacionales y tener mucha
practica con el idioma.
Finalmente, un parte importante de traducir un trabajo técnico es su aplicación en el mundo del
otro idioma. Obviamente, cada traducción tiene un propósito. En otras palabras, siempre existe
una razón por la producción de la traducción. A causa de mis experiencias y estudios en ingeniería
y español, creo que la habilidad de traducir o comunicar en otro idioma es importante,
especialmente en el ámbito de ingeniería. En Teaching Translation from Spanish to English
Lonsdale menciona que “sin traductores, los ambientales de comercio, relaciones internacionales,
política, derecho, y arte serian limitados severamente” [without translators, commerce, trade,
international relations, politics, law, science, and art would be severely limited” (Lonsdale, 3).
Pienso que los problemas ingenieros afectan todos estos aspectos de la sociedad. Ingenieros tienen
la habilidad de afectar comercio, política, relaciones internacionales, derecho y arte. Por eso,
traducción en sujetos técnicos pueden tener un impacto mucho más alto.
En conclusión, esta traducción me ha enseñado mucho sobre el proceso de traducción. He ganado
más experiencia en traducir, especialmente en textos técnicos. Espero que aplique esta experiencia
en mi carrera de ingeniería, y a causa de esta experiencia, el proceso de traducción se hace más
fácil en el futuro para mí.
Referencias
Herman, Mark (1993). Teachnical Translation Style: Clarity, Concision, Correctness. Scientific
and Technical Translation. In E. Wright, Sue E.; Wright, Leland D. Retrieved from: ProQuest
Lonsdale, Allison B (1996). The Importance of Translation. Teaching Translation from Spanish
to English: Worlds beyond Words. Retrieved from: https://books.google.com/books
98
RESUMEN
El aumento en la demanda de energía y reducción de recursos como el carbón, gas natural y
petróleo han estimulado innovaciones en la industria de energía. Científicos e investigadores han
reexaminado tecnologías viejas para resolver este problema. En los 1960s y 70s, Oak Ridge
National Laboratory (ORNL), en Tennessee, estudió los reactores de sales fundidas (MSR), pero
terminó las investigaciones de esta tecnología nuclear a causa de dificultades financieras y
tecnológicas. Nuestro proyecto (Major Qualifying Project) usó el diseño de Oak Ridge para diseñar
un sistema de producción de vapor para Worcester Polytechnic Institute. Este proyecto diseñó un
sistema que incluye un intercambiador primario de calor y un generador de vapor, usando el diseño
del reactor de ORNL. El diseño también consideró las necesidades para la producción de vapor de
WPI, y las propiedades fisicas, químicas y térmicas de los materiales especiales que usa un MSR.
Este proyecto servirá como un punto de partida para la producción de vapor más limpia y más
eficiente en WPI; también es una guía paso a paso para el proceso de diseño.
99
RECONOCIMIENTOS
Nuestro equipo quiere dar las gracias a los siguientes departamentos y personas por su apoyo y
contribución a nuestro proyecto:
Robert W. Thompson
Peter Miraglia
Ángel Rivera
Bill Grudzinski
Germano Iannacchione
Stephen Kmiotek
Thomas Starr
100
RESUMEN EJECUTIVO
Metas, objectivos, y métodos
La meta principal de este proyecto fue diseñar un sistema de producción de vapor para las
necesidades de Worcester Polytechnic Institute, usando el diseño del MSRE de Oak Ridge
National Laboratory como una fuente de calor. La metodología y los resultados de este proyecto
servirán como un punto de partida para el proceso de diseñar un sistema de producción de vapores
con un MSR en WPI. Este sistema sería más eficiente desde el punto de vista térmico, más
ecológico, y también es posible que beneficiaría los programas educacionales en WPI. Para diseñar
el sistema, se tomaron las medidas prácticas que siguen:
6. Determinar las necesidades de calefacción con la información sobre la producción actual
de vapor.
7. Desarrollar y evaluar el circuito de producción de vapor que usa el diseño de Oak Ridge
National Laboratory Experimento del Reactor de Sal Fundida.
8. Evaluar el circuito de producción de vapor y determinar el potencial de producir vapor con
Aspen Plus software de simulación.
9. Hacer calculaciones de transferencia de calor para comparar la producción de vapor de un
reactor de sales fundidas con un reactor de agua a presión.
10. Diseñar la red de intercambiadores de calor para la calefacción de campus. El diseño debe
considerar los requisitos especiales para un sistema que usa sales fundidas.
Paso 1:
Se usó la descripción de la producción actual de vapor en WPI para calcular el contenido energético
del vapor para determinar las necesidades de calefacción en el campus.
Paso 2:
Se usó el diseño del MSRE del ORNL para desarrollar y evaluar un circuito de producción de
vapor. El diseño original de MSRE usó un radiador para disipar la calefacción, pero la primera
etapa para este proyecto fue diseñar un sistema entero que usa el calor del reactor para producir
vapor.
Paso 3:
Después de la evaluación del sistema de producción de vapor, se usaron datos específicos del
MSRE y Aspen Plus software de simulación para verificar la producción de vapor del MSRE.
Paso 4:
Se usó cálculo del balance térmico para evaluar la producción de vapor de un sistema que usa un
reactor de agua a presión y un sistema que usa un reactor de sales fundidas para mostrar algunas
ventajas de un MSR.
Paso 5:
Después de determinar las propiedades térmicas del circuito de producción de vapor, se diseñó la
red de intercambiadores de calor. El diseño consideró la carga térmica de cada parte y los
materiales adecuados para las propiedades químicas, fisicas, y térmicas que son especiales para sal
fundida.
101
Antecedentes
El siglo veintiuno ha presentado una serie de nuevos problemas a científicos e investigadores. El
problema del aumento en la demanda de energía a nivel mundial junto con la reducción de de las
fuentes de recursos representa un asunto apremiantes para los innvadores. Además, los recursos
más usados como el carbón, gas natural y petróleo presentan problemas medioambientales. El reto
del siglo veintiuno es el de encontrar energía limpia, barata y duradera. Hay muchas tecnologías
nuevas como pilas de combusibles con hidrógeno y biocombustibles, pero una tecnología más
vieja, energía nuclear, puede ser una opción más prometedora.
Enrico Fermi creó energía usando fision nuclear por primera vez en 1942 (Wood, 2007). Este
descubrimiento inició un interés mundial en la tecnología nuclear, y muchos países empezaron a
usarla con ventaja en la Segunda Guerra Mundial. La energía nuclear se hizo popular en las fuerzas
armadas no solo por su uso como arma, sino también para la alimentación de submarinos y aviones.
Los reactores de agua a presión (PWR) fueron creados a causa de las investigaciones en la energía
nuclear en las fuerzas armadas. Esta tecnología alimentó submarinos por un largo periodo de
tiempo sin la necesidad de reabastecerse. Después del éxito de los PWRs en submarinos, La
Shippingport Atomic Power Station abrió una planta de energía nuclear en 1957 para la producción
comercial de energia (Kok, 2009). Las investiagaciones en la energía nuclear continuaron y los
reactores de agua en ebullición (BWRs) fueron desarrollados. En los 1950s, las investigaciones de
energía nuclear cambiaron de un enfoque militar al de un enfoque en la energía civily se produjó
una nueva investigación sobre un tipo de reactor nuevo que uso sal fundida (Wood, 2007). El
Experimento del Reactor de Sal Fundida (MSRE) empezó en Oak Ridge National Laboratory, en
Tennessee, en 1961.
Esta tecnología nueva tenía todas las ventajas de la energía nuclear, pero además, presentó mejoras
en la eficiencia del uso de combustibles, estabilidad, y seguridad (Robertson, 1965). MSRs son
diferentes de PWRs y BWRs porque el combustible nuclear sale del reactor y fluye por el sistema.
Esto permite transferencia directa de calor. En PWRs y BWRs, el agua fluye por el reactor y
transfiere calor desde el reactor a otro circuito. Los MSRs pueden reducir los costos porque no
requiren un diseño complicado de barras de combustible en el núcleo del reactor. Además, no
requiren un procedimiento de apagado tan complicado como los de PWRs y BWRs (Shultis &
Faw, 2002).
Las ventajas más impresionantes de MSRs son las ventajas de seguridad. Aunque el material
nuclear fluye afuera del reactor, se puede separar del circuito de la producción de calor con la
incorporación de un circuito intermedio con refrigerante de sal. Ademas de esto, el sistema no
opera en las presiones tan altas como PWRs y BWRs. El MSRE se terminó en 1969 por razones
económicas, pero los resultados del experimiento probaron que MSRs fueron una tecnología
prometedora. Aunque hoy en día no existe ninguna MSRs funcionando, se está considerando para
los reactores de la cuarta generación (Generation IV International Forum, 2013).
A causa de los beneficios que presenta un MSR, nuestro proyecto se aplicó el diseño de ORNL
para crear un sistema de producción de vapor para proporcionar vapor al campus de WPI. Este
proyecto se en las propiedades térmicas y la transferencia de calor en el sistema para mostrar que
102
un MSR es mejor que el sistema actual de producción de vapor en WPI y también mejor que otras
tecnologías nucleares.
Resultados
Se constató que el diseño del MSRE no puede proveer las necesidades de calefacción para el
campus completamente. Se requeriría un MSR con una emisión térmica del reactor de 12.16
megavatios (MW). Un sistema con un reactor de agua a presión requeriría una emisión térmica de
12.55 MW para producir la misma calefacción. También se constató que el combustible del MSR
tiene un requerimiento específico de potencia de 44 kW/kg uranio, más alta que el combustible del
PWR, 33 kilovatios por kilogramo (kW/kg) uranio. Finalmente, se determinó que la red de
intercambiadores de calor require cuatro intercambiadores de calor con un economizador, un
evaporador y dos sobrecalentadores. Se comparó el diseño entero con información conocido sobre
calderas industriales, y se concluyó que la red requeriría 13.41 metros cuadrados (m2), pero se
valoró que el sistema actual en WPI requiere 78.03 metros cuadrados.
Conclusión y recomendaciones
Para concluir, las investigaciones de este proyecto mostraron que se debe considerar como una
ventaja la posibilidad de traer un reactor de sales fundidas en al campus de WPI. Esta
modernización presenta muchas ventajas y podría tener una parte importante en la tradición de
WPI por su liderato en los estudios ambientales, el impacto del medioambiente, la sostenibilidad,
y la innovación técnica. Pero es importante considerar que este tipo de reactor es de Generación
IV, y es probable que uso actual del reactor sera posible quizás en el futuro. Este calendario
extendido permite más investigaciones en los materiales, el diseño de la contención, y en el análisis
de transferencia de calor con mayor precisión. Cuando el diseño completo sea finalizado, otras
investigaciones deben evaluar los costos de instalación y operación, las consideraciones de
concesión y determinación de la mejor ubicación par el reactor.
103
TABLA DE CONTENIDO REFLEXIÓN ................................................................................................................................ 96
RESUMEN ................................................................................................................................... 98
RECONOCIMIENTOS ................................................................................................................ 99
RESUMEN EJECUTIVO ........................................................................................................... 100
Metas, objectivos, y métodos .................................................................................................. 100
Paso 1: ................................................................................................................................. 100
Paso 2: ................................................................................................................................. 100
Paso 3: ................................................................................................................................. 100
Paso 4: ................................................................................................................................. 100
Paso 5: ................................................................................................................................. 100
Antecedentes ........................................................................................................................... 101
Resultados ............................................................................................................................... 102
Conclusión y recomendaciones ............................................................................................... 102
LISTA DE FIGURAS ................................................................................................................. 106
LISTA OF TABLAS................................................................................................................... 107
1 INTRODUCCIÓN ................................................................................................................... 108
2 ANTECEDENTES .................................................................................................................. 110
2.1 El problema de energía mundial ....................................................................................... 110
2.2 Investigaciones actuales en la tecnología energética ........................................................ 110
2.3 La historia de energía nuclear y tipos principales de reactores ........................................ 110
2.4 Reactores de agua a presión (PWRs) y reactors de agua en ebullición (BWRs) .............. 113
2.5 El Experimento del Reactor de Sal Fundida (MSRE) ...................................................... 115
2.6 La tecnología actual de reactores de sales fundidas .......................................................... 118
2.7 El uso de vapor en WPI .................................................................................................... 119
3. METODOLOGÍA ................................................................................................................... 119
3.1 Paso 1: La calculación de las necesidades de calefacción de campus .............................. 120
3.2 Paso 2: El cálculo de la producción de vapor del MSRE ................................................. 120
3.2.1 El diseño del circuito de la producción de vapor ....................................................... 120
3.2.2 La calculación de la potencial de producción de vapor del MSRE ........................... 121
3.2.3 La simulación de la producción de vapor usando el sistema de MSRE e Aspen Plus
............................................................................................................................................. 122
3.3 Paso 3: Una comparación de la producción de vapor de un MSR y un PWR .................. 124
3.3.1 Unas comparaciones entre los sistemas de MSR y PWR .......................................... 124
3.3.2 La simulación de producción de vapor en un MSR e un PWR en Aspen Plus .......... 125
104
3.4 Paso 4: El diseño del circuito de producción de vapor con un MSR para satisfacer las
necesidades del campus de WPI ............................................................................................. 125
3.4.1 Las calculaciones del diseño ...................................................................................... 126
3.4.2 Consideraciones para los materiales .......................................................................... 129
3.4.3 Una comparación con el sistema actual de las calderas en WPI ................................ 129
4 RESULTADOS Y DISCUSIÓN ............................................................................................. 131
4.1 Las necesidades para la calefacción del campus ............................................................... 131
4.2 Las calculaciones y simulación para la producción de energía potencial del MSRE ....... 131
4.3 La comparación del PWR y MSR ..................................................................................... 132
4.3.1 Producción de vapor de un PWR ............................................................................... 133
4.3.2 Producción de vapor de un MSR ............................................................................... 133
4.3.3 Ventajas del MSR ...................................................................................................... 134
4.4 El diseño y dimensiones de la red de intercambiadores de calor ...................................... 135
4.4.1 Las dimensiones del intercambiador de calor primario ............................................. 135
4.4.2 Las calculaciones para los sobrecalentadores A/B .................................................... 136
4.4.3 Las calculaciones para las dimensiones del evaporador ............................................ 137
4.4.4 Las calculaciones para el tallaje del economizador ................................................... 137
4.4.5 La comparación con la superficie del sistema actual de calderas .............................. 137
CONCLUSIÓN Y RECOMENDACIONES .............................................................................. 139
REFERENCIAS .......................................................................................................................... 141
APÉNDICE A: Las calculaciones del balance térmico y energético ......................................... 144
A.1 Las necesidades para la calefacción del campus .............................................................. 144
A.2 La producción de vapor del MSRE .................................................................................. 145
A.3 La producción de vapor del PWR .................................................................................... 150
A.4 Las calculaciones para la producción de vapor y el poder específico de un MSR .......... 154
La producción de vapor de un MSR ................................................................................... 154
Poder específico del MSRE ................................................................................................ 157
APÉNDICE B: Los archivos de la entrada de Aspen ................................................................. 158
B.1 Las necesidades de calefacción del campus ..................................................................... 158
B.2 La producción de vapor del MSRE .................................................................................. 159
B.3 La producción de vapor del PWR .................................................................................... 163
B.4 La producción de vapor de un MSR................................................................................. 166
APÉNDICE C: Las calculaciones para el diseño del equipamiento ........................................... 171
C.1 El intercambiador de calor primario ................................................................................. 171
C.2 Los intercambiadores de producción de vapor ................................................................. 174

105
APÉNDICE D: Las tablas para el diámetro de los cascos para los intercambiadores ................ 190
106
LISTA DE FIGURAS
Figura 1: Shippingport Atomic Power durante la instalación;
http://en.wikipedia.org/wiki/Shippingport_Atomic_Power_Station ................................................ 112
Figura 2: La vasija de reacciones del MSRE durante la instalación (Robertson, 1965) ........................... 115
Figura 3: El diagrama de flujo del MSRE ................................................................................................. 116
Figura 4: El diseño para el circuito de combustible y refrigerante en el MSRE ....................................... 117
Figura 5: El diseño de TAP para la vasija de reacciones para un sistema de producción de vapor con un
MSR ................................................................................................................................................. 118
Figura 6: Un mapa 2-D del campus de WPI obtenido por wpi.edu. Se añadió un contorno de rojo para
demonstrar los edificios calentados con el vapor de las calderas en el Power House (Worcester
Polytechnic Institute, 2014) .............................................................................................................. 119
Figura 7: El diagrama de flujo de la serie de intercambiadores de calor para producción de vapor ......... 121
Figura 8: El diagrama de flujo de Aspen para la producción de vapor del MSRE ................................... 123
Figura 9: El diagrama de los coeficientes térmicos a tráves de un intercambiador de casco y tubo ......... 127
Figura 10: El diagrama para estimar los coeficientes térmicos ................................................................. 128
Figura 11: Un diseño para un intercambiador con tubos en la forma de U............................................... 136
Figura 12: El diseño para la producción de vapor con dos sobrecalentadores .......................................... 136
Figura 13: El diseño para la red de intercambiadores para el sistema del MSR ....................................... 138

107
LISTA OF TABLAS
Tabla 1: Datos de ORNL para las corrientes usados en la entrada de Aspen ........................................... 124
Tabla 2: Las composiciones para las corrientes de sal fundida en mol% ................................................. 124
Tabla 3: MSR v. PWR, *Indica un valor calculado en las necesidades de calefacción de WPI ............... 135
108
1 INTRODUCCIÓN
El mundo ha sufrido una incremental demanda de energía a partir de la revolución industrial. El
U.S. Energy Information Administration (EIA) estima que el consumo de energía aumentará en
un 56 porciento entre 2010 y 2040. El crecimiento se relaciona directamente con el crecimiento de
población y el crecimiento económico en los países subdesarrollados (U.S. Energy Informatio
Administration (EIA), 2014). Con este problema viene otro: las fuentes de los recursos más
importantes, como carbón, gas natural y petróleo están desapareciendo. Además estos recursos han
ganado una reputación por sus efectos negativos en el medio ambiente. En estos momentos existe
una búsqueda para encontrar fuentes renovables y de baja emisión.
Es posible que la energía nuclear es lo que busca el mundo. Muchos países, incluyendo los Estados
Unidos, ya utilizan energía nuclear. “On a global scale, nuclear power currently reduces carbon
dioxide emissions by some 2.5 billion tonnes per year” [En una escala global, energía nuclear
actualmente reduce las emisiones de dióxido de carbono por unos 2.5 miliones de toneladas- 2.27
x 109kg] si la misma cantidad de energía hubiera sido producido por carbón, e energía nuclear
representa solo 12% de la electricidad mundial. Es posible que la utilización de energía nuclear
reduzca drásticamente el impacto negativo del uso de energía convencional en el medioambiente.
La mayoría de los reactores de agua ligera (RAL), que son los reactores más comunes, generan su
energía por reacciones de fisión de uranio, el combustible principal en reactores nucleares. El
uranio se obtiene por medio de la minería, y es “approximately as common as tin or zinc”
[aproximadamente tan común como estaño o zinc] (World Nuclear Association, 2014) The World
Nuclear Association reportó que el total conocido de uranio recuperable de casi 5.44 x 10⁹
kilogramos en 2013. Es posible que continuas mejoras en la tecnología aumentará esta cantidad.
La producción de energía por uranio require una cantidad menor de combustible que otros
métodos. Una tonelada de uranio produce 7.4 x 10¹⁶ julios. La misma cantidad de carbón solo
produce 3.2 x 10¹⁰ julios.
A pesar de la promesa del uranio como fuente de energía, existen algunas imperfecciones, en
cualquier fuente de energía. Para producir energía, el uranio absorbe un neutrón y empieza el
proceso de fisión. Con el evento de una absorción, el nucleo se vuelve pesado e inestable y empieza
a romperse en productos radiactivos de fisión. Los eventos de fisión también producen una
liberación de energía muy grande. La radiación de los productos de fisión, rayos gammas, y
partículas alfa y beta, son peligrosos. Sobreexposición a estas partículas de alta energía puede
causar problemas de salud como cáncer. Los desechos nucleares de los reactores que usan uranio
también son una preocupación porque el combustible gastado todavía contiene nucleidos
radiactivos. Hay muchos procesos para reprocesar el combustible, pero la política actual en los
Estados Unidos requiere que el combustible sea embodegado para desecho en vez de reproceso.
Con esta política, la energía potencial no es aprovechada.
Pero otra vez, hay una solución potencial al problema de energía. Los reactores de sales fundidas,
que aparecieron en los 1950s, presentan una estrategia para energía nuclear mucho más segura y
económica. Reactores de sales fundidas usan el mismo material para su combustible y su
refrigerante. Esto permite el uso de combustible usado de RALs, combustible fresco de uranio
poco enriquecido, o combustible de torio. Reactores de sales fundidas fueron estudiados por un
corto periódo durante los 1950s hasta los 1960s. Sin embargo, las investigaciones en Oak Ridge
109
National Laboratory fueron desconinuadas en los Estados Unidos se enfocaron más en la
implementación de los reactores de agua a presión y de agua en ebullición (Wood, 2007).
Este proyecto reabrió las investigaciones en los reactores de sales fundidas. Con ayuda del
experimento de Oak Ridge, investigaciones actuales y conceptos del diseño de las instalaciones de
ingeniería química, este proyecto apunta a crear un diseño moderno para un reactor piloto para
satisfacer las necesidades de calefacción del campus de WPI. Una instalación existosa de este tipo
de reactor puede reducir los costos energéticos y laborales para la universidad. Además, serviría
como una herramienta de investigación y educación para los estudiantes del futuro. Aunque este
proyecto se enfoca en el diseño factible para un sistema de producción de vapor con un reactor
piloto, las investigaciones del futuro pueden enfocarse en costos y la logística de construir e instalar
el reactor, además en los materiales y propiedades térmicos que no son partes de este proyecto. El
propósito de este proyecto has sido resumir el proceso de analizar y diseñar un circuito de
producción de vapor con cantidades conocidas de las necesidades de calefacción.
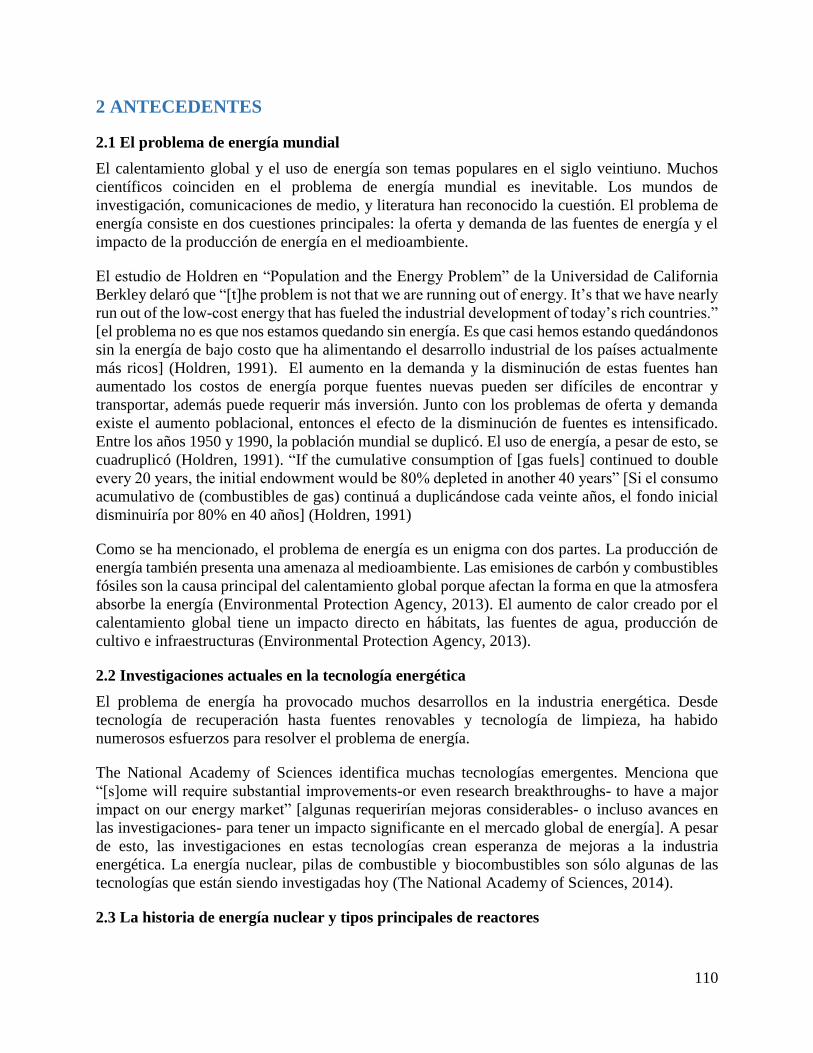
110
2 ANTECEDENTES
2.1 El problema de energía mundial
El calentamiento global y el uso de energía son temas populares en el siglo veintiuno. Muchos
científicos coinciden en el problema de energía mundial es inevitable. Los mundos de
investigación, comunicaciones de medio, y literatura han reconocido la cuestión. El problema de
energía consiste en dos cuestiones principales: la oferta y demanda de las fuentes de energía y el
impacto de la producción de energía en el medioambiente.
El estudio de Holdren en “Population and the Energy Problem” de la Universidad de California
Berkley delaró que “[t]he problem is not that we are running out of energy. It’s that we have nearly
run out of the low-cost energy that has fueled the industrial development of today’s rich countries.”
[el problema no es que nos estamos quedando sin energía. Es que casi hemos estando quedándonos
sin la energía de bajo costo que ha alimentando el desarrollo industrial de los países actualmente
más ricos] (Holdren, 1991). El aumento en la demanda y la disminución de estas fuentes han
aumentado los costos de energía porque fuentes nuevas pueden ser difíciles de encontrar y
transportar, además puede requerir más inversión. Junto con los problemas de oferta y demanda
existe el aumento poblacional, entonces el efecto de la disminución de fuentes es intensificado.
Entre los años 1950 y 1990, la población mundial se duplicó. El uso de energía, a pesar de esto, se
cuadruplicó (Holdren, 1991). “If the cumulative consumption of [gas fuels] continued to double
every 20 years, the initial endowment would be 80% depleted in another 40 years” [Si el consumo
acumulativo de (combustibles de gas) continuá a duplicándose cada veinte años, el fondo inicial
disminuiría por 80% en 40 años] (Holdren, 1991)
Como se ha mencionado, el problema de energía es un enigma con dos partes. La producción de
energía también presenta una amenaza al medioambiente. Las emisiones de carbón y combustibles
fósiles son la causa principal del calentamiento global porque afectan la forma en que la atmosfera
absorbe la energía (Environmental Protection Agency, 2013). El aumento de calor creado por el
calentamiento global tiene un impacto directo en hábitats, las fuentes de agua, producción de
cultivo e infraestructuras (Environmental Protection Agency, 2013).
2.2 Investigaciones actuales en la tecnología energética
El problema de energía ha provocado muchos desarrollos en la industria energética. Desde
tecnología de recuperación hasta fuentes renovables y tecnología de limpieza, ha habido
numerosos esfuerzos para resolver el problema de energía.
The National Academy of Sciences identifica muchas tecnologías emergentes. Menciona que
“[s]ome will require substantial improvements-or even research breakthroughs- to have a major
impact on our energy market” [algunas requerirían mejoras considerables- o incluso avances en
las investigaciones- para tener un impacto significante en el mercado global de energía]. A pesar
de esto, las investigaciones en estas tecnologías crean esperanza de mejoras a la industria
energética. La energía nuclear, pilas de combustible y biocombustibles son sólo algunas de las
tecnologías que están siendo investigadas hoy (The National Academy of Sciences, 2014).
2.3 La historia de energía nuclear y tipos principales de reactores
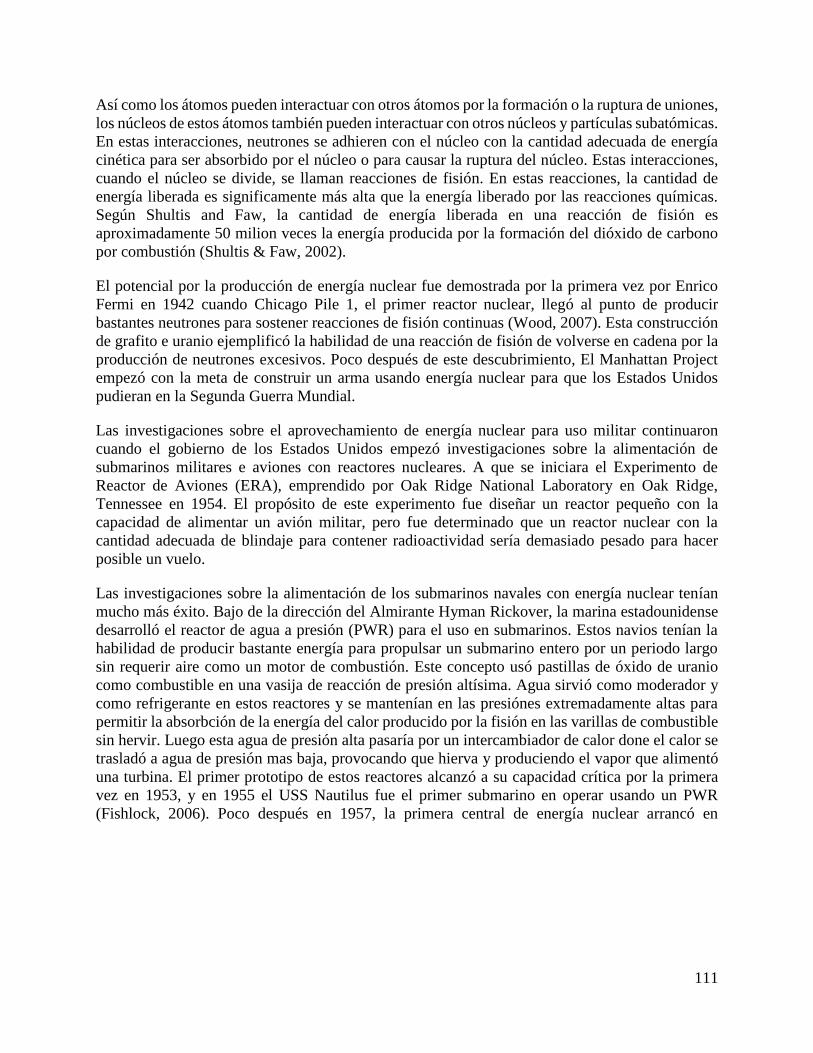
111
Así como los átomos pueden interactuar con otros átomos por la formación o la ruptura de uniones,
los núcleos de estos átomos también pueden interactuar con otros núcleos y partículas subatómicas.
En estas interacciones, neutrones se adhieren con el núcleo con la cantidad adecuada de energía
cinética para ser absorbido por el núcleo o para causar la ruptura del núcleo. Estas interacciones,
cuando el núcleo se divide, se llaman reacciones de fisión. En estas reacciones, la cantidad de
energía liberada es significamente más alta que la energía liberado por las reacciones químicas.
Según Shultis and Faw, la cantidad de energía liberada en una reacción de fisión es
aproximadamente 50 milion veces la energía producida por la formación del dióxido de carbono
por combustión (Shultis & Faw, 2002).
El potencial por la producción de energía nuclear fue demostrada por la primera vez por Enrico
Fermi en 1942 cuando Chicago Pile 1, el primer reactor nuclear, llegó al punto de producir
bastantes neutrones para sostener reacciones de fisión continuas (Wood, 2007). Esta construcción
de grafito e uranio ejemplificó la habilidad de una reacción de fisión de volverse en cadena por la
producción de neutrones excesivos. Poco después de este descubrimiento, El Manhattan Project
empezó con la meta de construir un arma usando energía nuclear para que los Estados Unidos
pudieran en la Segunda Guerra Mundial.
Las investigaciones sobre el aprovechamiento de energía nuclear para uso militar continuaron
cuando el gobierno de los Estados Unidos empezó investigaciones sobre la alimentación de
submarinos militares e aviones con reactores nucleares. A que se iniciara el Experimento de
Reactor de Aviones (ERA), emprendido por Oak Ridge National Laboratory en Oak Ridge,
Tennessee en 1954. El propósito de este experimento fue diseñar un reactor pequeño con la
capacidad de alimentar un avión militar, pero fue determinado que un reactor nuclear con la
cantidad adecuada de blindaje para contener radioactividad sería demasiado pesado para hacer
posible un vuelo.
Las investigaciones sobre la alimentación de los submarinos navales con energía nuclear tenían
mucho más éxito. Bajo de la dirección del Almirante Hyman Rickover, la marina estadounidense
desarrolló el reactor de agua a presión (PWR) para el uso en submarinos. Estos navios tenían la
habilidad de producir bastante energía para propulsar un submarino entero por un periodo largo
sin requerir aire como un motor de combustión. Este concepto usó pastillas de óxido de uranio
como combustible en una vasija de reacción de presión altísima. Agua sirvió como moderador y
como refrigerante en estos reactores y se mantenían en las presiónes extremadamente altas para
permitir la absorbción de la energía del calor producido por la fisión en las varillas de combustible
sin hervir. Luego esta agua de presión alta pasaría por un intercambiador de calor done el calor se
trasladó a agua de presión mas baja, provocando que hierva y produciendo el vapor que alimentó
una turbina. El primer prototipo de estos reactores alcanzó a su capacidad crítica por la primera
vez en 1953, y en 1955 el USS Nautilus fue el primer submarino en operar usando un PWR
(Fishlock, 2006). Poco después en 1957, la primera central de energía nuclear arrancó en
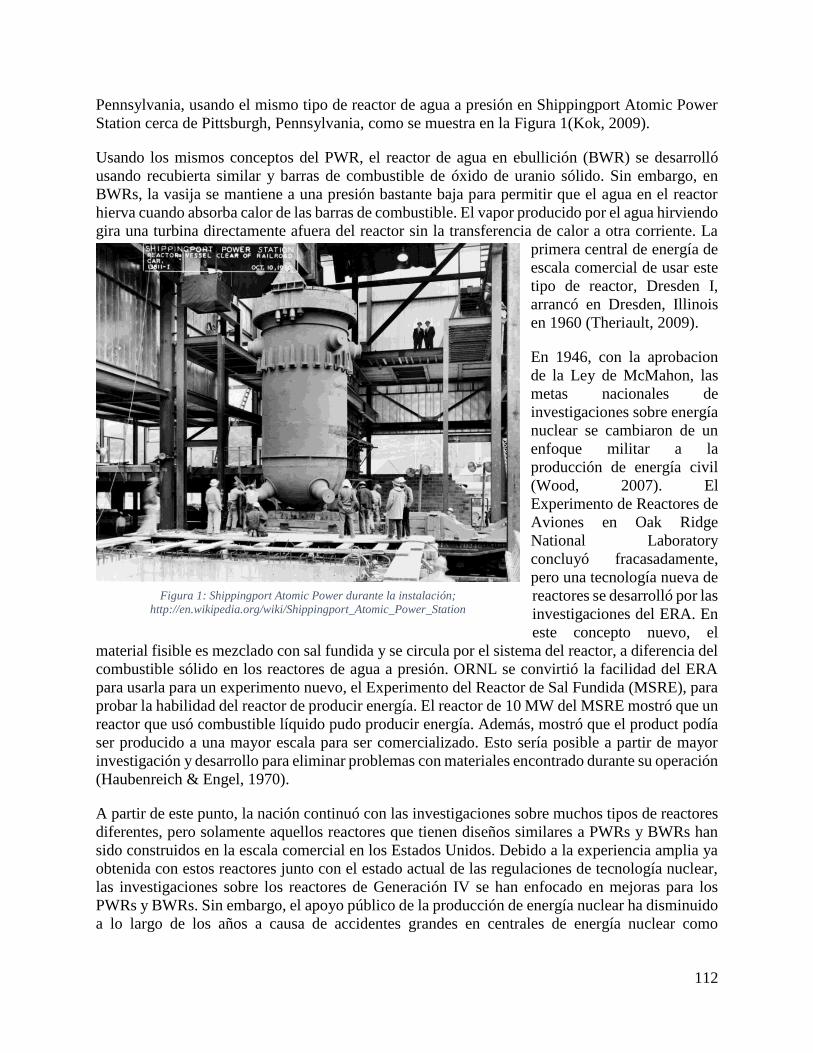
112
Pennsylvania, usando el mismo tipo de reactor de agua a presión en Shippingport Atomic Power
Station cerca de Pittsburgh, Pennsylvania, como se muestra en la Figura 1(Kok, 2009).
Usando los mismos conceptos del PWR, el reactor de agua en ebullición (BWR) se desarrolló
usando recubierta similar y barras de combustible de óxido de uranio sólido. Sin embargo, en
BWRs, la vasija se mantiene a una presión bastante baja para permitir que el agua en el reactor
hierva cuando absorba calor de las barras de combustible. El vapor producido por el agua hirviendo
gira una turbina directamente afuera del reactor sin la transferencia de calor a otra corriente. La
primera central de energía de
escala comercial de usar este
tipo de reactor, Dresden I,
arrancó en Dresden, Illinois
en 1960 (Theriault, 2009).
En 1946, con la aprobacion
de la Ley de McMahon, las
metas nacionales de
investigaciones sobre energía
nuclear se cambiaron de un
enfoque militar a la
producción de energía civil
(Wood, 2007). El
Experimento de Reactores de
Aviones en Oak Ridge
National Laboratory
concluyó fracasadamente,
pero una tecnología nueva de
reactores se desarrolló por las
investigaciones del ERA. En
este concepto nuevo, el
material fisible es mezclado con sal fundida y se circula por el sistema del reactor, a diferencia del
combustible sólido en los reactores de agua a presión. ORNL se convirtió la facilidad del ERA
para usarla para un experimento nuevo, el Experimento del Reactor de Sal Fundida (MSRE), para
probar la habilidad del reactor de producir energía. El reactor de 10 MW del MSRE mostró que un
reactor que usó combustible líquido pudo producir energía. Además, mostró que el product podía
ser producido a una mayor escala para ser comercializado. Esto sería posible a partir de mayor
investigación y desarrollo para eliminar problemas con materiales encontrado durante su operación
(Haubenreich & Engel, 1970).
A partir de este punto, la nación continuó con las investigaciones sobre muchos tipos de reactores
diferentes, pero solamente aquellos reactores que tienen diseños similares a PWRs y BWRs han
sido construidos en la escala comercial en los Estados Unidos. Debido a la experiencia amplia ya
obtenida con estos reactores junto con el estado actual de las regulaciones de tecnología nuclear,
las investigaciones sobre los reactores de Generación IV se han enfocado en mejoras para los
PWRs y BWRs. Sin embargo, el apoyo público de la producción de energía nuclear ha disminuido
a lo largo de los años a causa de accidentes grandes en centrales de energía nuclear como
Figure 14: Shippingport Atomic Power during installation;
http://en.wikipedia.org/wiki/Shippingport_Atomic_Power_Station
Figura 1: Shippingport Atomic Power durante la instalación;
http://en.wikipedia.org/wiki/Shippingport_Atomic_Power_Station
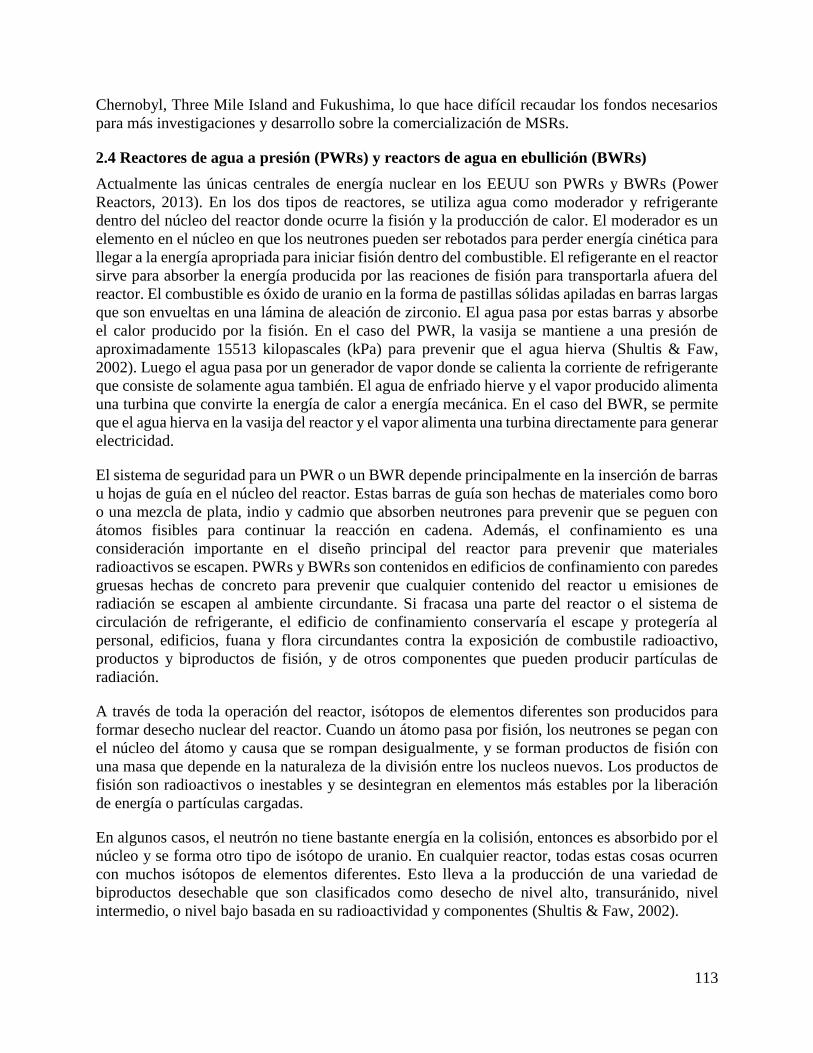
113
Chernobyl, Three Mile Island and Fukushima, lo que hace difícil recaudar los fondos necesarios
para más investigaciones y desarrollo sobre la comercialización de MSRs.
2.4 Reactores de agua a presión (PWRs) y reactors de agua en ebullición (BWRs)
Actualmente las únicas centrales de energía nuclear en los EEUU son PWRs y BWRs (Power
Reactors, 2013). En los dos tipos de reactores, se utiliza agua como moderador y refrigerante
dentro del núcleo del reactor donde ocurre la fisión y la producción de calor. El moderador es un
elemento en el núcleo en que los neutrones pueden ser rebotados para perder energía cinética para
llegar a la energía apropriada para iniciar fisión dentro del combustible. El refigerante en el reactor
sirve para absorber la energía producida por las reaciones de fisión para transportarla afuera del
reactor. El combustible es óxido de uranio en la forma de pastillas sólidas apiladas en barras largas
que son envueltas en una lámina de aleación de zirconio. El agua pasa por estas barras y absorbe
el calor producido por la fisión. En el caso del PWR, la vasija se mantiene a una presión de
aproximadamente 15513 kilopascales (kPa) para prevenir que el agua hierva (Shultis & Faw,
2002). Luego el agua pasa por un generador de vapor donde se calienta la corriente de refrigerante
que consiste de solamente agua también. El agua de enfriado hierve y el vapor producido alimenta
una turbina que convirte la energía de calor a energía mecánica. En el caso del BWR, se permite
que el agua hierva en la vasija del reactor y el vapor alimenta una turbina directamente para generar
electricidad.
El sistema de seguridad para un PWR o un BWR depende principalmente en la inserción de barras
u hojas de guía en el núcleo del reactor. Estas barras de guía son hechas de materiales como boro
o una mezcla de plata, indio y cadmio que absorben neutrones para prevenir que se peguen con
átomos fisibles para continuar la reacción en cadena. Además, el confinamiento es una
consideración importante en el diseño principal del reactor para prevenir que materiales
radioactivos se escapen. PWRs y BWRs son contenidos en edificios de confinamiento con paredes
gruesas hechas de concreto para prevenir que cualquier contenido del reactor u emisiones de
radiación se escapen al ambiente circundante. Si fracasa una parte del reactor o el sistema de
circulación de refrigerante, el edificio de confinamiento conservaría el escape y protegería al
personal, edificios, fuana y flora circundantes contra la exposición de combustile radioactivo,
productos y biproductos de fisión, y de otros componentes que pueden producir partículas de
radiación.
A través de toda la operación del reactor, isótopos de elementos diferentes son producidos para
formar desecho nuclear del reactor. Cuando un átomo pasa por fisión, los neutrones se pegan con
el núcleo del átomo y causa que se rompan desigualmente, y se forman productos de fisión con
una masa que depende en la naturaleza de la división entre los nucleos nuevos. Los productos de
fisión son radioactivos o inestables y se desintegran en elementos más estables por la liberación
de energía o partículas cargadas.
En algunos casos, el neutrón no tiene bastante energía en la colisión, entonces es absorbido por el
núcleo y se forma otro tipo de isótopo de uranio. En cualquier reactor, todas estas cosas ocurren
con muchos isótopos de elementos diferentes. Esto lleva a la producción de una variedad de
biproductos desechable que son clasificados como desecho de nivel alto, transuránido, nivel
intermedio, o nivel bajo basada en su radioactividad y componentes (Shultis & Faw, 2002).
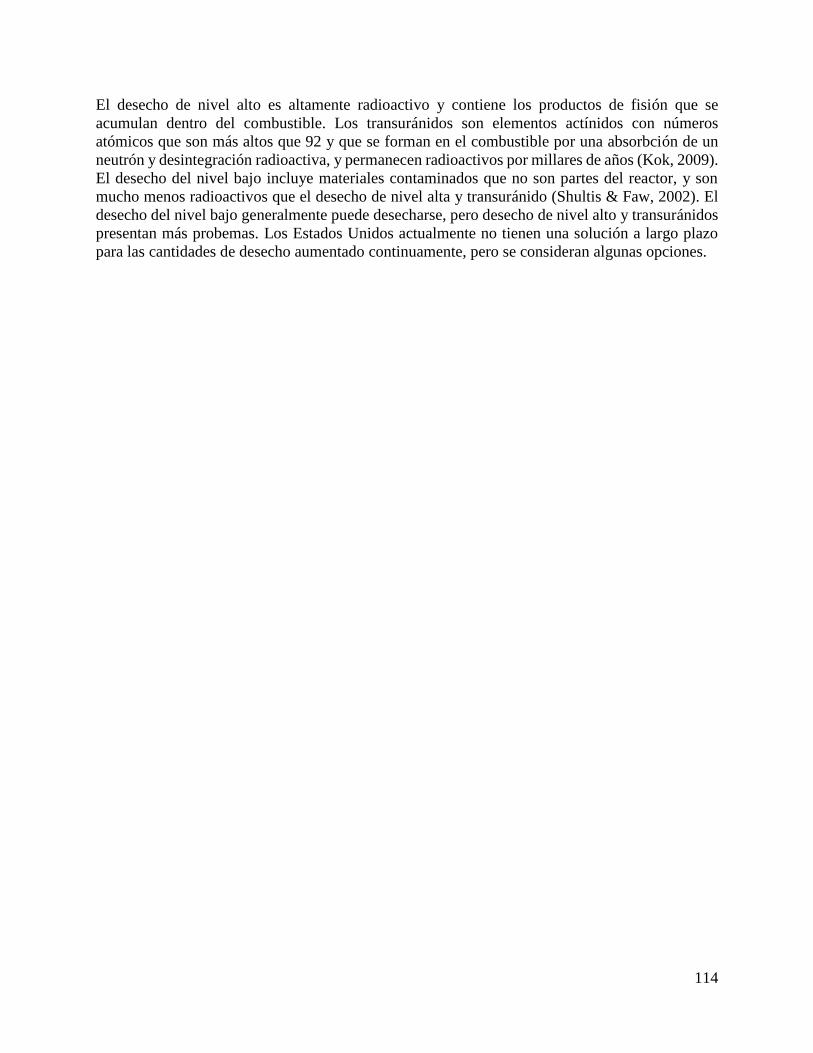
114
El desecho de nivel alto es altamente radioactivo y contiene los productos de fisión que se
acumulan dentro del combustible. Los transuránidos son elementos actínidos con números
atómicos que son más altos que 92 y que se forman en el combustible por una absorbción de un
neutrón y desintegración radioactiva, y permanecen radioactivos por millares de años (Kok, 2009).
El desecho del nivel bajo incluye materiales contaminados que no son partes del reactor, y son
mucho menos radioactivos que el desecho de nivel alta y transuránido (Shultis & Faw, 2002). El
desecho del nivel bajo generalmente puede desecharse, pero desecho de nivel alto y transuránidos
presentan más probemas. Los Estados Unidos actualmente no tienen una solución a largo plazo
para las cantidades de desecho aumentado continuamente, pero se consideran algunas opciones.
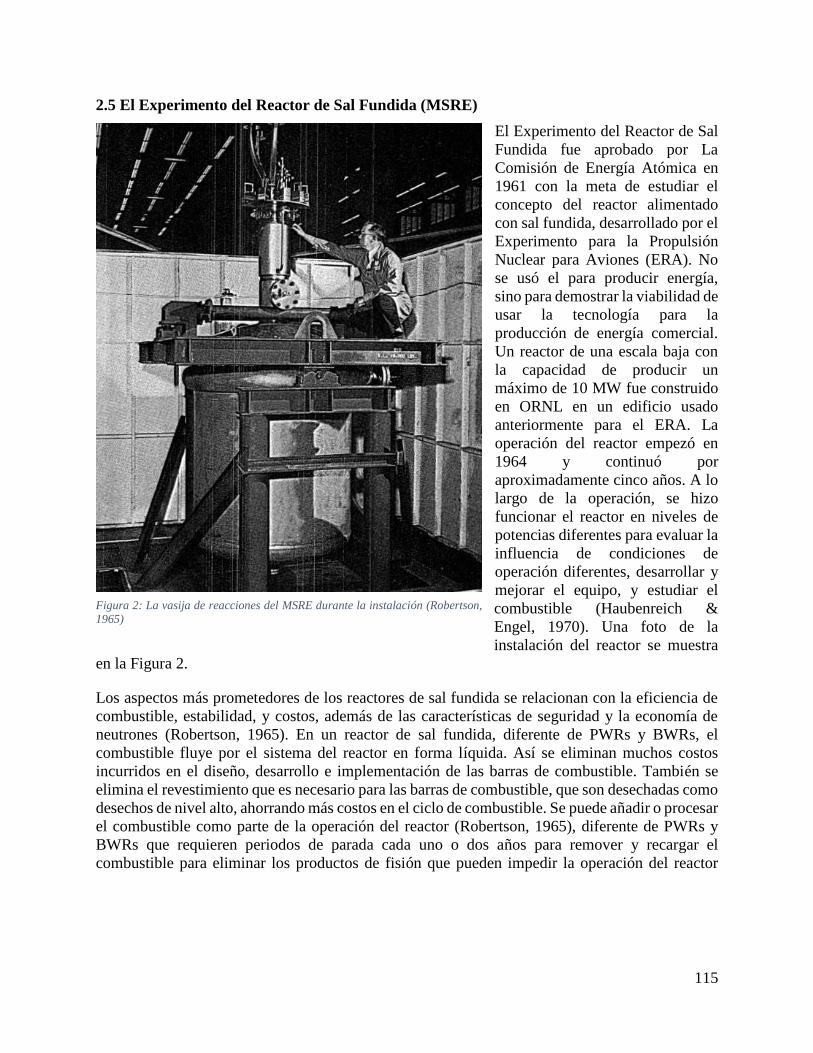
115
2.5 El Experimento del Reactor de Sal Fundida (MSRE)
El Experimento del Reactor de Sal
Fundida fue aprobado por La
Comisión de Energía Atómica en
1961 con la meta de estudiar el
concepto del reactor alimentado
con sal fundida, desarrollado por el
Experimento para la Propulsión
Nuclear para Aviones (ERA). No
se usó el para producir energía,
sino para demostrar la viabilidad de
usar la tecnología para la
producción de energía comercial.
Un reactor de una escala baja con
la capacidad de producir un
máximo de 10 MW fue construido
en ORNL en un edificio usado
anteriormente para el ERA. La
operación del reactor empezó en
1964 y continuó por
aproximadamente cinco años. A lo
largo de la operación, se hizo
funcionar el reactor en niveles de
potencias diferentes para evaluar la
influencia de condiciones de
operación diferentes, desarrollar y
mejorar el equipo, y estudiar el
combustible (Haubenreich &
Engel, 1970). Una foto de la
instalación del reactor se muestra
en la Figura 2.
Los aspectos más prometedores de los reactores de sal fundida se relacionan con la eficiencia de
combustible, estabilidad, y costos, además de las características de seguridad y la economía de
neutrones (Robertson, 1965). En un reactor de sal fundida, diferente de PWRs y BWRs, el
combustible fluye por el sistema del reactor en forma líquida. Así se eliminan muchos costos
incurridos en el diseño, desarrollo e implementación de las barras de combustible. También se
elimina el revestimiento que es necesario para las barras de combustible, que son desechadas como
desechos de nivel alto, ahorrando más costos en el ciclo de combustible. Se puede añadir o procesar
el combustible como parte de la operación del reactor (Robertson, 1965), diferente de PWRs y
BWRs que requieren periodos de parada cada uno o dos años para remover y recargar el
combustible para eliminar los productos de fisión que pueden impedir la operación del reactor
Figura 2: La vasija de reacciones del MSRE durante la instalación (Robertson,
1965)
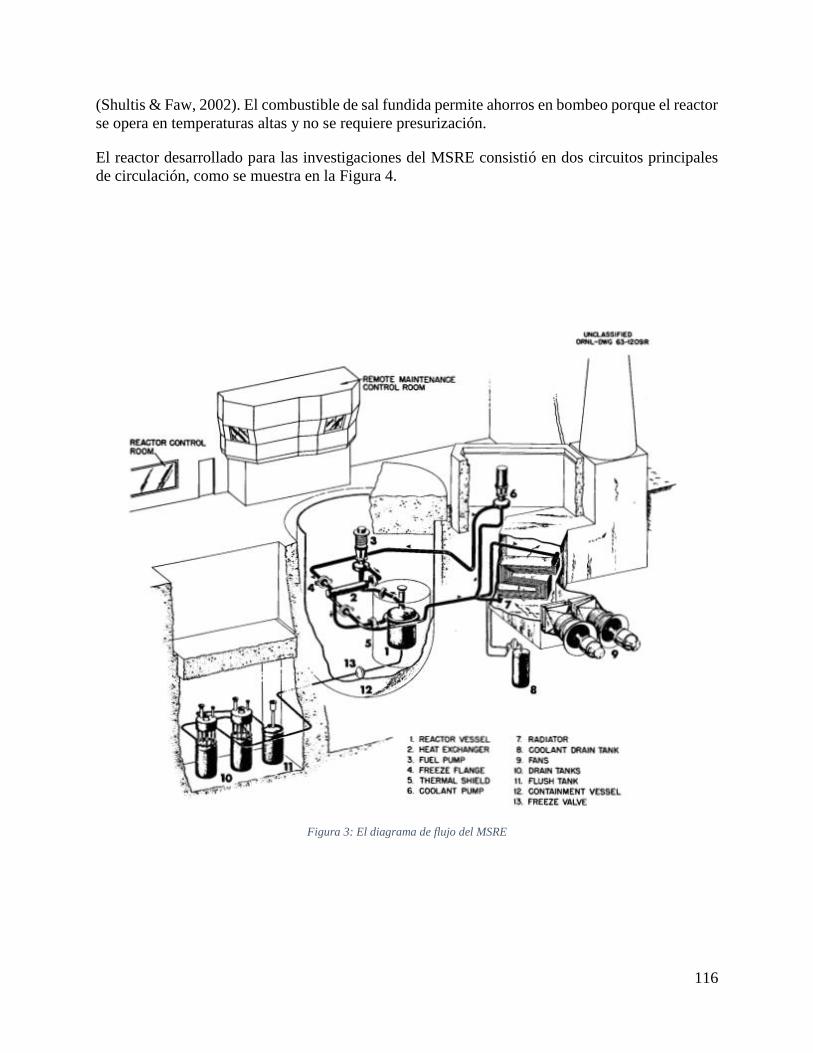
116
(Shultis & Faw, 2002). El combustible de sal fundida permite ahorros en bombeo porque el reactor
se opera en temperaturas altas y no se requiere presurización.
El reactor desarrollado para las investigaciones del MSRE consistió en dos circuitos principales
de circulación, como se muestra en la Figura 4.
Figura 3: El diagrama de flujo del MSRE
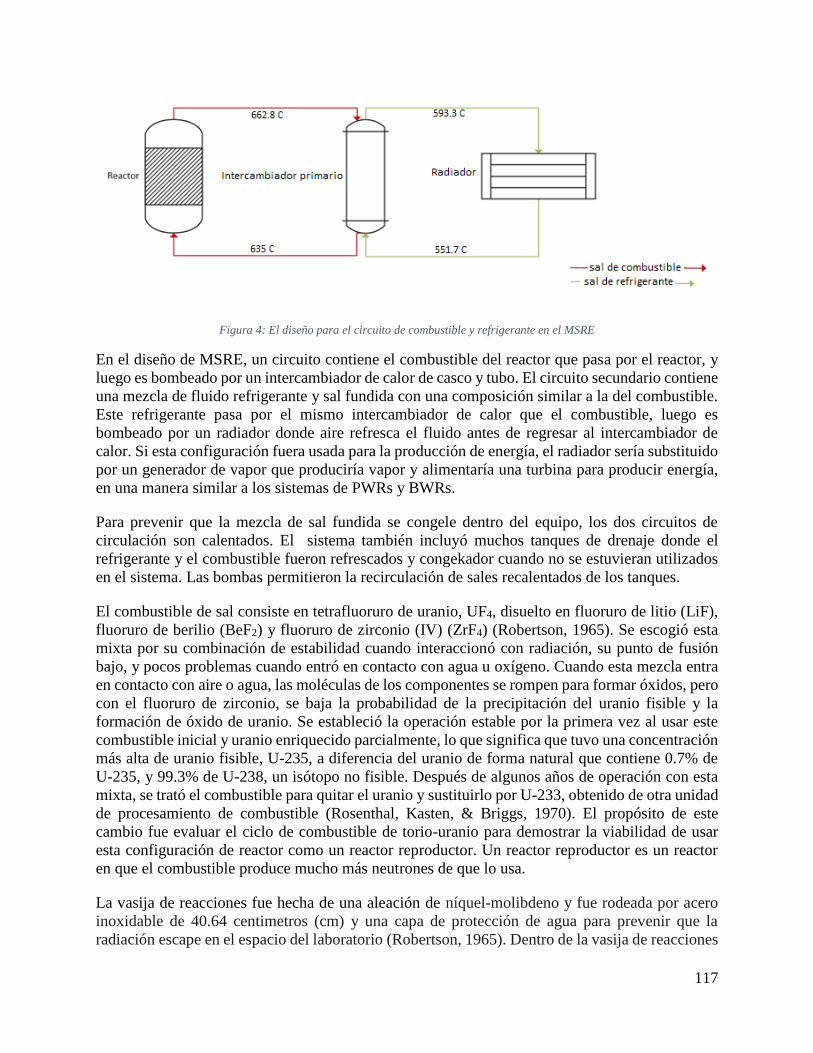
117
Figura 4: El diseño para el circuito de combustible y refrigerante en el MSRE
En el diseño de MSRE, un circuito contiene el combustible del reactor que pasa por el reactor, y
luego es bombeado por un intercambiador de calor de casco y tubo. El circuito secundario contiene
una mezcla de fluido refrigerante y sal fundida con una composición similar a la del combustible.
Este refrigerante pasa por el mismo intercambiador de calor que el combustible, luego es
bombeado por un radiador donde aire refresca el fluido antes de regresar al intercambiador de
calor. Si esta configuración fuera usada para la producción de energía, el radiador sería substituido
por un generador de vapor que produciría vapor y alimentaría una turbina para producir energía,
en una manera similar a los sistemas de PWRs y BWRs.
Para prevenir que la mezcla de sal fundida se congele dentro del equipo, los dos circuitos de
circulación son calentados. El sistema también incluyó muchos tanques de drenaje donde el
refrigerante y el combustible fueron refrescados y congekador cuando no se estuvieran utilizados
en el sistema. Las bombas permitieron la recirculación de sales recalentados de los tanques.
El combustible de sal consiste en tetrafluoruro de uranio, UF4, disuelto en fluoruro de litio (LiF),
fluoruro de berilio (BeF2) y fluoruro de zirconio (IV) (ZrF4) (Robertson, 1965). Se escogió esta
mixta por su combinación de estabilidad cuando interaccionó con radiación, su punto de fusión
bajo, y pocos problemas cuando entró en contacto con agua u oxígeno. Cuando esta mezcla entra
en contacto con aire o agua, las moléculas de los componentes se rompen para formar óxidos, pero
con el fluoruro de zirconio, se baja la probabilidad de la precipitación del uranio fisible y la
formación de óxido de uranio. Se estableció la operación estable por la primera vez al usar este
combustible inicial y uranio enriquecido parcialmente, lo que significa que tuvo una concentración
más alta de uranio fisible, U-235, a diferencia del uranio de forma natural que contiene 0.7% de
U-235, y 99.3% de U-238, un isótopo no fisible. Después de algunos años de operación con esta
mixta, se trató el combustible para quitar el uranio y sustituirlo por U-233, obtenido de otra unidad
de procesamiento de combustible (Rosenthal, Kasten, & Briggs, 1970). El propósito de este
cambio fue evaluar el ciclo de combustible de torio-uranio para demostrar la viabilidad de usar
esta configuración de reactor como un reactor reproductor. Un reactor reproductor es un reactor
en que el combustible produce mucho más neutrones de que lo usa.
La vasija de reacciones fue hecha de una aleación de níquel-molibdeno y fue rodeada por acero
inoxidable de 40.64 centimetros (cm) y una capa de protección de agua para prevenir que la
radiación escape en el espacio del laboratorio (Robertson, 1965). Dentro de la vasija de reacciones
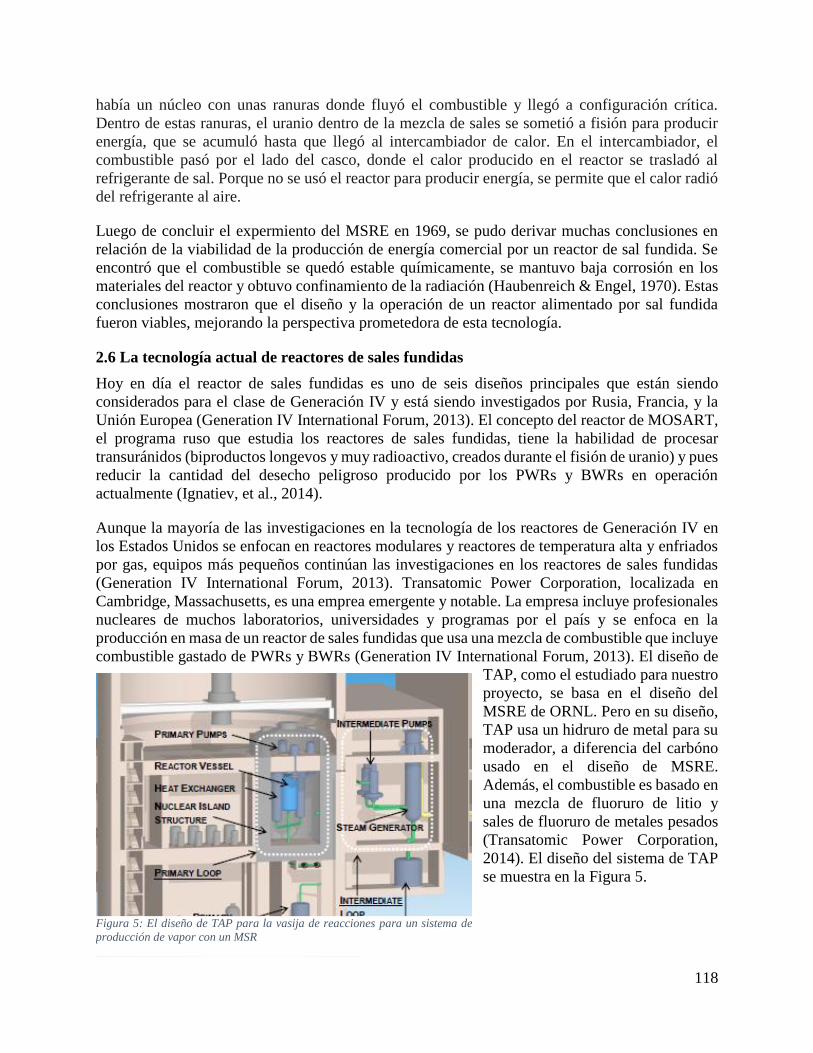
118
había un núcleo con unas ranuras donde fluyó el combustible y llegó a configuración crítica.
Dentro de estas ranuras, el uranio dentro de la mezcla de sales se sometió a fisión para producir
energía, que se acumuló hasta que llegó al intercambiador de calor. En el intercambiador, el
combustible pasó por el lado del casco, donde el calor producido en el reactor se trasladó al
refrigerante de sal. Porque no se usó el reactor para producir energía, se permite que el calor radió
del refrigerante al aire.
Luego de concluir el expermiento del MSRE en 1969, se pudo derivar muchas conclusiones en
relación de la viabilidad de la producción de energía comercial por un reactor de sal fundida. Se
encontró que el combustible se quedó estable químicamente, se mantuvo baja corrosión en los
materiales del reactor y obtuvo confinamiento de la radiación (Haubenreich & Engel, 1970). Estas
conclusiones mostraron que el diseño y la operación de un reactor alimentado por sal fundida
fueron viables, mejorando la perspectiva prometedora de esta tecnología.
2.6 La tecnología actual de reactores de sales fundidas
Hoy en día el reactor de sales fundidas es uno de seis diseños principales que están siendo
considerados para el clase de Generación IV y está siendo investigados por Rusia, Francia, y la
Unión Europea (Generation IV International Forum, 2013). El concepto del reactor de MOSART,
el programa ruso que estudia los reactores de sales fundidas, tiene la habilidad de procesar
transuránidos (biproductos longevos y muy radioactivo, creados durante el fisión de uranio) y pues
reducir la cantidad del desecho peligroso producido por los PWRs y BWRs en operación
actualmente (Ignatiev, et al., 2014).
Aunque la mayoría de las investigaciones en la tecnología de los reactores de Generación IV en
los Estados Unidos se enfocan en reactores modulares y reactores de temperatura alta y enfriados
por gas, equipos más pequeños continúan las investigaciones en los reactores de sales fundidas
(Generation IV International Forum, 2013). Transatomic Power Corporation, localizada en
Cambridge, Massachusetts, es una emprea emergente y notable. La empresa incluye profesionales
nucleares de muchos laboratorios, universidades y programas por el país y se enfoca en la
producción en masa de un reactor de sales fundidas que usa una mezcla de combustible que incluye
combustible gastado de PWRs y BWRs (Generation IV International Forum, 2013). El diseño de
TAP, como el estudiado para nuestro
proyecto, se basa en el diseño del
MSRE de ORNL. Pero en su diseño,
TAP usa un hidruro de metal para su
moderador, a diferencia del carbóno
usado en el diseño de MSRE.
Además, el combustible es basado en
una mezcla de fluoruro de litio y
sales de fluoruro de metales pesados
(Transatomic Power Corporation,
2014). El diseño del sistema de TAP
se muestra en la Figura 5.
Figura 5: El diseño de TAP para la vasija de reacciones para un sistema de
producción de vapor con un MSR
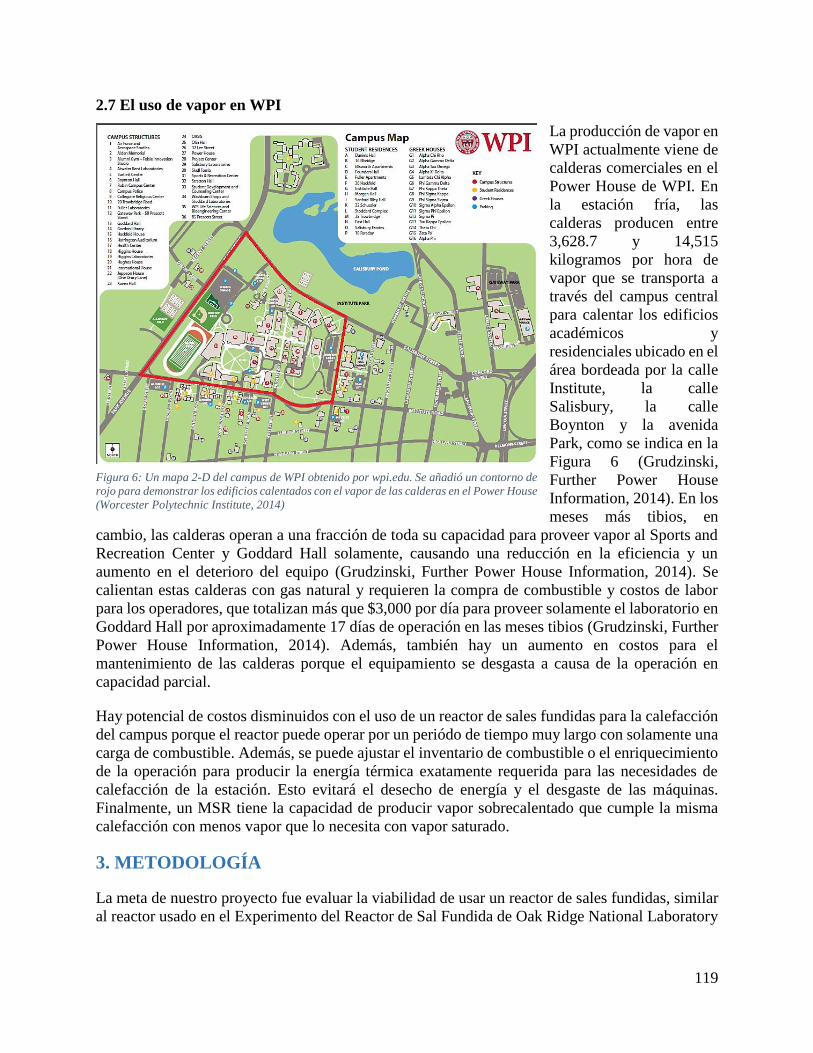
119
2.7 El uso de vapor en WPI
La producción de vapor en
WPI actualmente viene de
calderas comerciales en el
Power House de WPI. En
la estación fría, las
calderas producen entre
3,628.7 y 14,515
kilogramos por hora de
vapor que se transporta a
través del campus central
para calentar los edificios
académicos y
residenciales ubicado en el
área bordeada por la calle
Institute, la calle
Salisbury, la calle
Boynton y la avenida
Park, como se indica en la
Figura 6 (Grudzinski,
Further Power House
Information, 2014). En los
meses más tibios, en
cambio, las calderas operan a una fracción de toda su capacidad para proveer vapor al Sports and
Recreation Center y Goddard Hall solamente, causando una reducción en la eficiencia y un
aumento en el deterioro del equipo (Grudzinski, Further Power House Information, 2014). Se
calientan estas calderas con gas natural y requieren la compra de combustible y costos de labor
para los operadores, que totalizan más que $3,000 por día para proveer solamente el laboratorio en
Goddard Hall por aproximadamente 17 días de operación en las meses tibios (Grudzinski, Further
Power House Information, 2014). Además, también hay un aumento en costos para el
mantenimiento de las calderas porque el equipamiento se desgasta a causa de la operación en
capacidad parcial.
Hay potencial de costos disminuidos con el uso de un reactor de sales fundidas para la calefacción
del campus porque el reactor puede operar por un periódo de tiempo muy largo con solamente una
carga de combustible. Además, se puede ajustar el inventario de combustible o el enriquecimiento
de la operación para producir la energía térmica exatamente requerida para las necesidades de
calefacción de la estación. Esto evitará el desecho de energía y el desgaste de las máquinas.
Finalmente, un MSR tiene la capacidad de producir vapor sobrecalentado que cumple la misma
calefacción con menos vapor que lo necesita con vapor saturado.
3. METODOLOGÍA
La meta de nuestro proyecto fue evaluar la viabilidad de usar un reactor de sales fundidas, similar
al reactor usado en el Experimento del Reactor de Sal Fundida de Oak Ridge National Laboratory
Figure 15 WPI 2-D campus map obtained from wpi.edu. Red outline added to demonstrate
buildings heated with steam from the Power House boilers (Worcester Polytechnic Institute,
2014).
Figura 6: Un mapa 2-D del campus de WPI obtenido por wpi.edu. Se añadió un contorno de
rojo para demonstrar los edificios calentados con el vapor de las calderas en el Power House
(Worcester Polytechnic Institute, 2014)
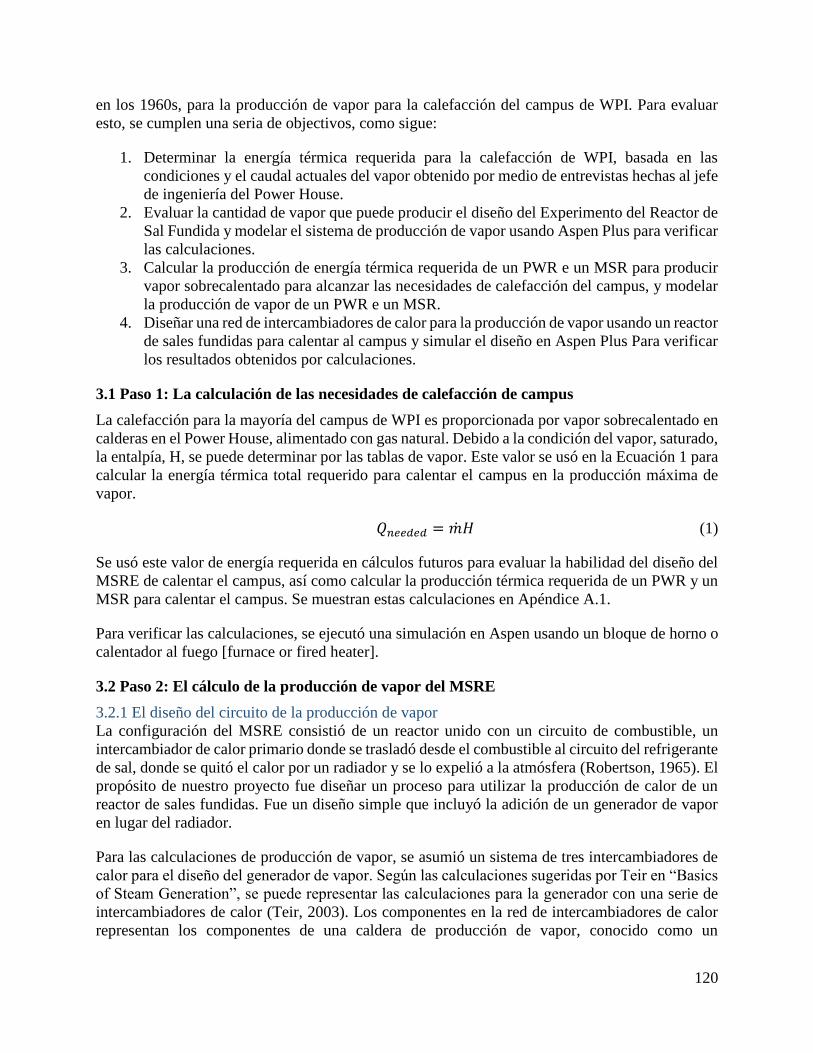
120
en los 1960s, para la producción de vapor para la calefacción del campus de WPI. Para evaluar
esto, se cumplen una seria de objectivos, como sigue:
1. Determinar la energía térmica requerida para la calefacción de WPI, basada en las
condiciones y el caudal actuales del vapor obtenido por medio de entrevistas hechas al jefe
de ingeniería del Power House.
2. Evaluar la cantidad de vapor que puede producir el diseño del Experimento del Reactor de
Sal Fundida y modelar el sistema de producción de vapor usando Aspen Plus para verificar
las calculaciones.
3. Calcular la producción de energía térmica requerida de un PWR e un MSR para producir
vapor sobrecalentado para alcanzar las necesidades de calefacción del campus, y modelar
la producción de vapor de un PWR e un MSR.
4. Diseñar una red de intercambiadores de calor para la producción de vapor usando un reactor
de sales fundidas para calentar al campus y simular el diseño en Aspen Plus Para verificar
los resultados obtenidos por calculaciones.
3.1 Paso 1: La calculación de las necesidades de calefacción de campus
La calefacción para la mayoría del campus de WPI es proporcionada por vapor sobrecalentado en
calderas en el Power House, alimentado con gas natural. Debido a la condición del vapor, saturado,
la entalpía, H, se puede determinar por las tablas de vapor. Este valor se usó en la Ecuación 1 para
calcular la energía térmica total requerido para calentar el campus en la producción máxima de
vapor.
𝑄𝑛𝑒𝑒𝑑𝑒𝑑 = �̇�𝐻 (1)
Se usó este valor de energía requerida en cálculos futuros para evaluar la habilidad del diseño del
MSRE de calentar el campus, así como calcular la producción térmica requerida de un PWR y un
MSR para calentar el campus. Se muestran estas calculaciones en Apéndice A.1.
Para verificar las calculaciones, se ejecutó una simulación en Aspen usando un bloque de horno o
calentador al fuego [furnace or fired heater].
3.2 Paso 2: El cálculo de la producción de vapor del MSRE
3.2.1 El diseño del circuito de la producción de vapor
La configuración del MSRE consistió de un reactor unido con un circuito de combustible, un
intercambiador de calor primario donde se trasladó desde el combustible al circuito del refrigerante
de sal, donde se quitó el calor por un radiador y se lo expelió a la atmósfera (Robertson, 1965). El
propósito de nuestro proyecto fue diseñar un proceso para utilizar la producción de calor de un
reactor de sales fundidas. Fue un diseño simple que incluyó la adición de un generador de vapor
en lugar del radiador.
Para las calculaciones de producción de vapor, se asumió un sistema de tres intercambiadores de
calor para el diseño del generador de vapor. Según las calculaciones sugeridas por Teir en “Basics
of Steam Generation”, se puede representar las calculaciones para la generador con una serie de
intercambiadores de calor (Teir, 2003). Los componentes en la red de intercambiadores de calor
representan los componentes de una caldera de producción de vapor, conocido como un
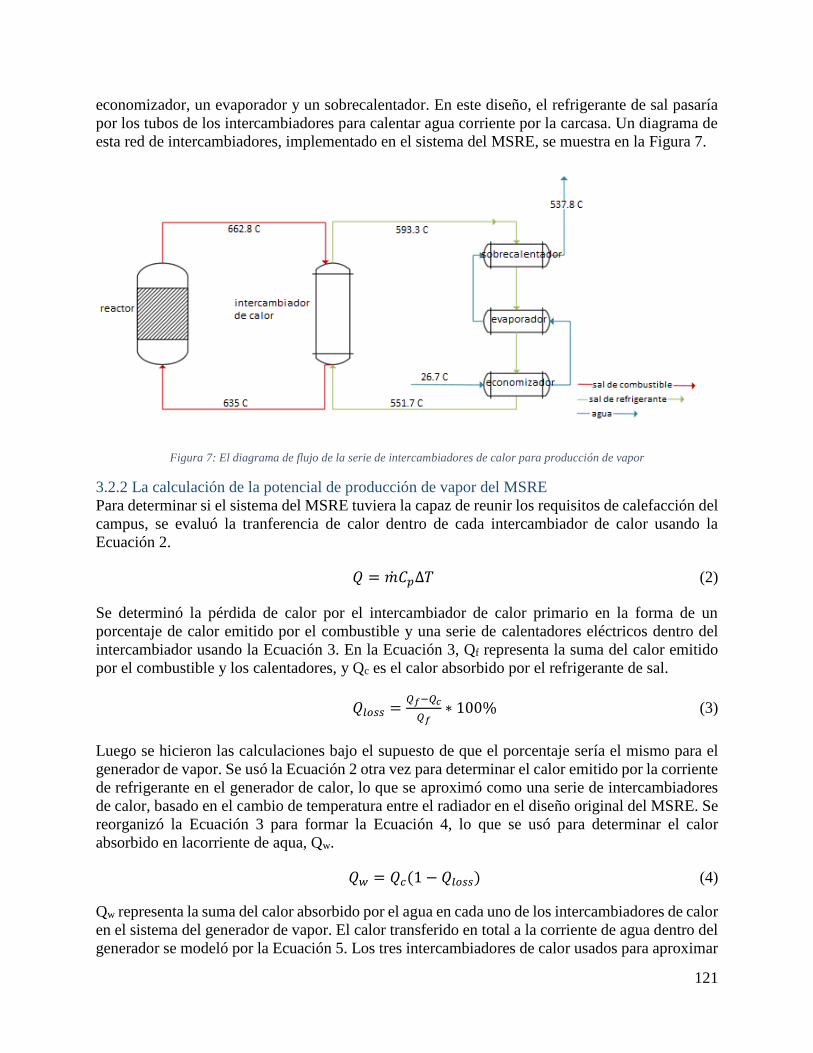
121
economizador, un evaporador y un sobrecalentador. En este diseño, el refrigerante de sal pasaría
por los tubos de los intercambiadores para calentar agua corriente por la carcasa. Un diagrama de
esta red de intercambiadores, implementado en el sistema del MSRE, se muestra en la Figura 7.
Figura 7: El diagrama de flujo de la serie de intercambiadores de calor para producción de vapor
3.2.2 La calculación de la potencial de producción de vapor del MSRE
Para determinar si el sistema del MSRE tuviera la capaz de reunir los requisitos de calefacción del
campus, se evaluó la tranferencia de calor dentro de cada intercambiador de calor usando la
Ecuación 2.
𝑄 = �̇�𝐶𝑝Δ𝑇 (2)
Se determinó la pérdida de calor por el intercambiador de calor primario en la forma de un
porcentaje de calor emitido por el combustible y una serie de calentadores eléctricos dentro del
intercambiador usando la Ecuación 3. En la Ecuación 3, Qf representa la suma del calor emitido
por el combustible y los calentadores, y Qc es el calor absorbido por el refrigerante de sal.
𝑄𝑙𝑜𝑠𝑠 =𝑄𝑓−𝑄𝑐
𝑄𝑓∗ 100% (3)
Luego se hicieron las calculaciones bajo el supuesto de que el porcentaje sería el mismo para el
generador de vapor. Se usó la Ecuación 2 otra vez para determinar el calor emitido por la corriente
de refrigerante en el generador de calor, lo que se aproximó como una serie de intercambiadores
de calor, basado en el cambio de temperatura entre el radiador en el diseño original del MSRE. Se
reorganizó la Ecuación 3 para formar la Ecuación 4, lo que se usó para determinar el calor
absorbido en lacorriente de aqua, Qw.
𝑄𝑤 = 𝑄𝑐(1 − 𝑄𝑙𝑜𝑠𝑠) (4)
Qw representa la suma del calor absorbido por el agua en cada uno de los intercambiadores de calor
en el sistema del generador de vapor. El calor transferido en total a la corriente de agua dentro del
generador se modeló por la Ecuación 5. Los tres intercambiadores de calor usados para aproximar
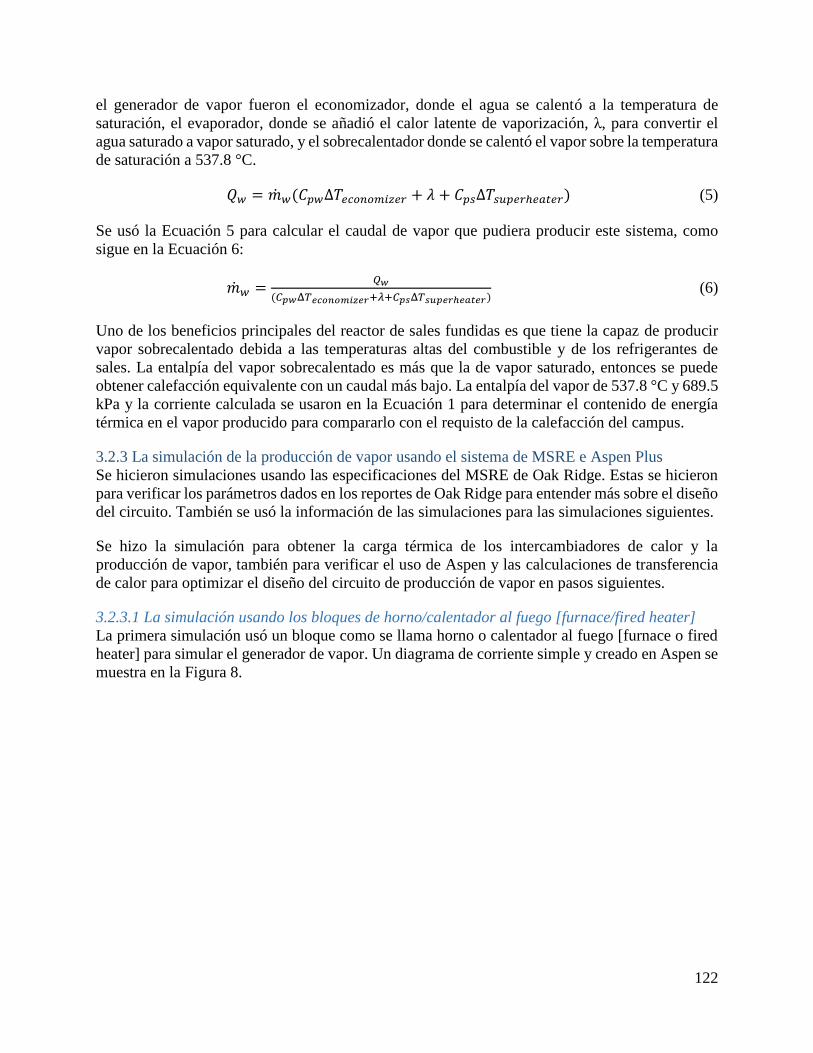
122
el generador de vapor fueron el economizador, donde el agua se calentó a la temperatura de
saturación, el evaporador, donde se añadió el calor latente de vaporización, λ, para convertir el
agua saturado a vapor saturado, y el sobrecalentador donde se calentó el vapor sobre la temperatura
de saturación a 537.8 °C.
𝑄𝑤 = �̇�𝑤(𝐶𝑝𝑤Δ𝑇𝑒𝑐𝑜𝑛𝑜𝑚𝑖𝑧𝑒𝑟 + 𝜆 + 𝐶𝑝𝑠Δ𝑇𝑠𝑢𝑝𝑒𝑟ℎ𝑒𝑎𝑡𝑒𝑟) (5)
Se usó la Ecuación 5 para calcular el caudal de vapor que pudiera producir este sistema, como
sigue en la Ecuación 6:
�̇�𝑤 =𝑄𝑤
(𝐶𝑝𝑤Δ𝑇𝑒𝑐𝑜𝑛𝑜𝑚𝑖𝑧𝑒𝑟+𝜆+𝐶𝑝𝑠Δ𝑇𝑠𝑢𝑝𝑒𝑟ℎ𝑒𝑎𝑡𝑒𝑟) (6)
Uno de los beneficios principales del reactor de sales fundidas es que tiene la capaz de producir
vapor sobrecalentado debida a las temperaturas altas del combustible y de los refrigerantes de
sales. La entalpía del vapor sobrecalentado es más que la de vapor saturado, entonces se puede
obtener calefacción equivalente con un caudal más bajo. La entalpía del vapor de 537.8 °C y 689.5
kPa y la corriente calculada se usaron en la Ecuación 1 para determinar el contenido de energía
térmica en el vapor producido para compararlo con el requisto de la calefacción del campus.
3.2.3 La simulación de la producción de vapor usando el sistema de MSRE e Aspen Plus
Se hicieron simulaciones usando las especificaciones del MSRE de Oak Ridge. Estas se hicieron
para verificar los parámetros dados en los reportes de Oak Ridge para entender más sobre el diseño
del circuito. También se usó la información de las simulaciones para las simulaciones siguientes.
Se hizo la simulación para obtener la carga térmica de los intercambiadores de calor y la
producción de vapor, también para verificar el uso de Aspen y las calculaciones de transferencia
de calor para optimizar el diseño del circuito de producción de vapor en pasos siguientes.
3.2.3.1 La simulación usando los bloques de horno/calentador al fuego [furnace/fired heater]
La primera simulación usó un bloque como se llama horno o calentador al fuego [furnace o fired
heater] para simular el generador de vapor. Un diagrama de corriente simple y creado en Aspen se
muestra en la Figura 8.
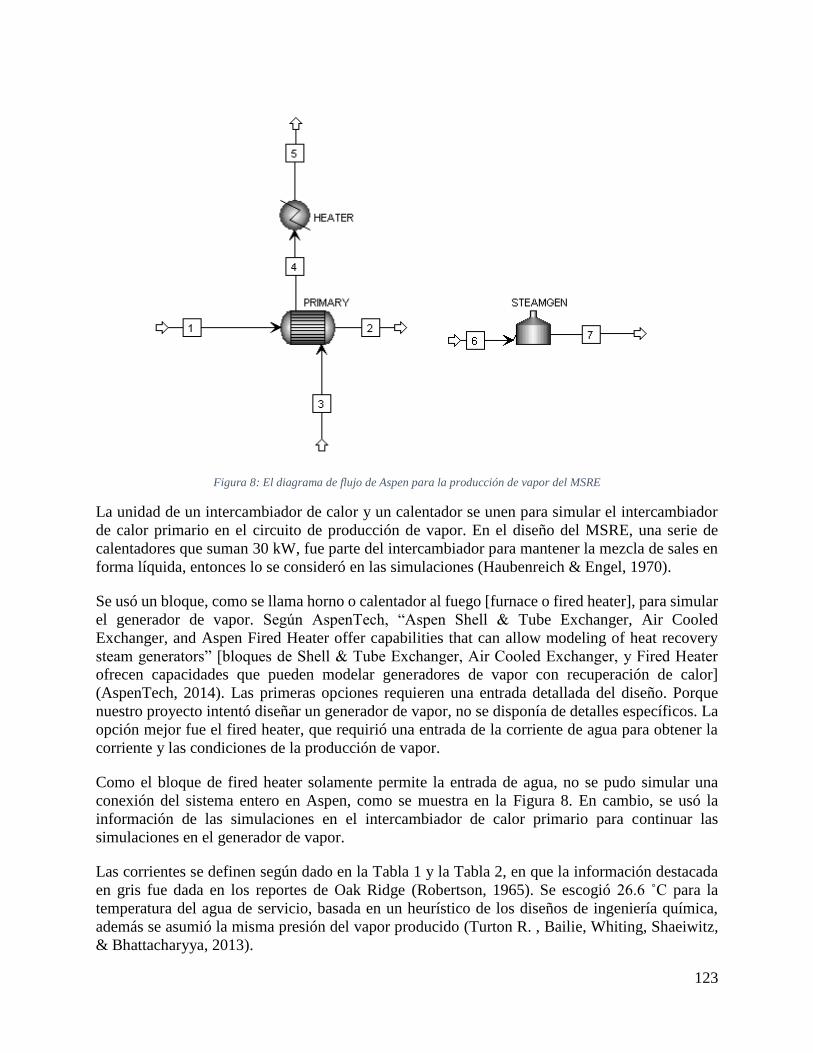
123
Figura 8: El diagrama de flujo de Aspen para la producción de vapor del MSRE
La unidad de un intercambiador de calor y un calentador se unen para simular el intercambiador
de calor primario en el circuito de producción de vapor. En el diseño del MSRE, una serie de
calentadores que suman 30 kW, fue parte del intercambiador para mantener la mezcla de sales en
forma líquida, entonces lo se consideró en las simulaciones (Haubenreich & Engel, 1970).
Se usó un bloque, como se llama horno o calentador al fuego [furnace o fired heater], para simular
el generador de vapor. Según AspenTech, “Aspen Shell & Tube Exchanger, Air Cooled
Exchanger, and Aspen Fired Heater offer capabilities that can allow modeling of heat recovery
steam generators” [bloques de Shell & Tube Exchanger, Air Cooled Exchanger, y Fired Heater
ofrecen capacidades que pueden modelar generadores de vapor con recuperación de calor]
(AspenTech, 2014). Las primeras opciones requieren una entrada detallada del diseño. Porque
nuestro proyecto intentó diseñar un generador de vapor, no se disponía de detalles específicos. La
opción mejor fue el fired heater, que requirió una entrada de la corriente de agua para obtener la
corriente y las condiciones de la producción de vapor.
Como el bloque de fired heater solamente permite la entrada de agua, no se pudo simular una
conexión del sistema entero en Aspen, como se muestra en la Figura 8. En cambio, se usó la
información de las simulaciones en el intercambiador de calor primario para continuar las
simulaciones en el generador de vapor.
Las corrientes se definen según dado en la Tabla 1 y la Tabla 2, en que la información destacada
en gris fue dada en los reportes de Oak Ridge (Robertson, 1965). Se escogió 26.6 ˚C para la
temperatura del agua de servicio, basada en un heurístico de los diseños de ingeniería química,
además se asumió la misma presión del vapor producido (Turton R. , Bailie, Whiting, Shaeiwitz,
& Bhattacharyya, 2013).
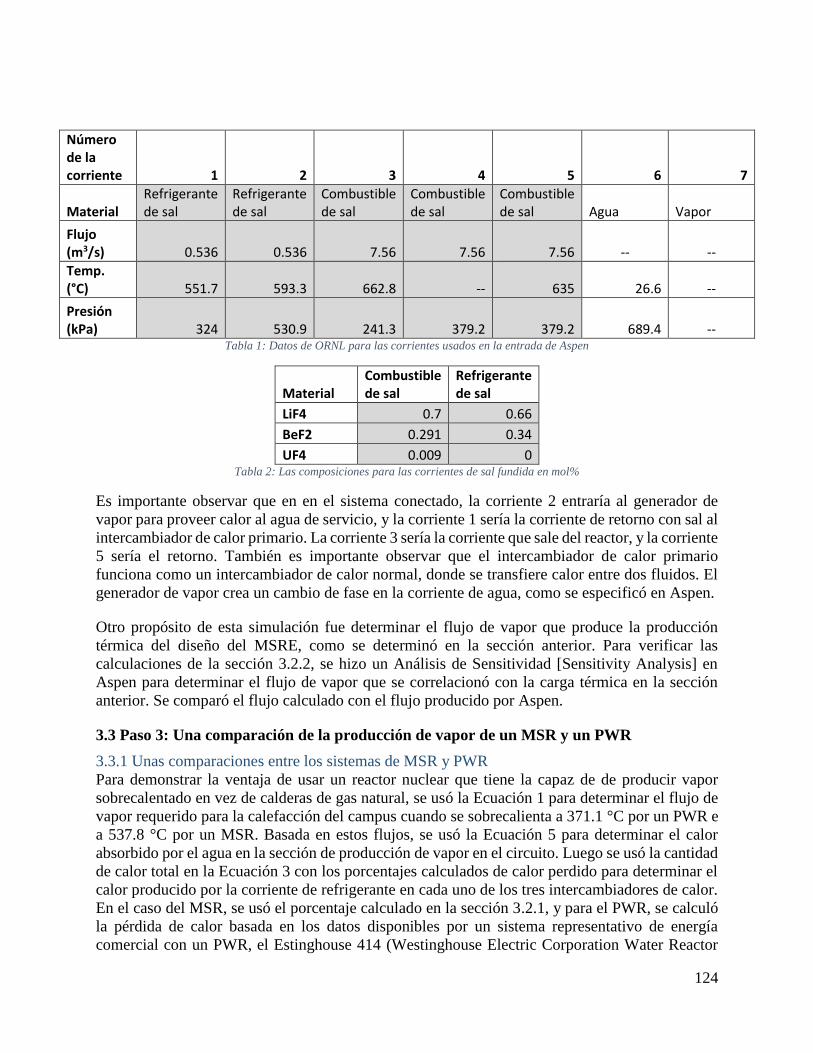
124
Número de la corriente 1 2 3 4
5 6 7
Material Refrigerante de sal
Refrigerante de sal
Combustible de sal
Combustible de sal
Combustible de sal Agua Vapor
Flujo (m3/s) 0.536 0.536 7.56 7.56
7.56 -- --
Temp. (°C) 551.7 593.3 662.8 --
635 26.6 --
Presión (kPa) 324 530.9 241.3 379.2
379.2 689.4 --
Tabla 1: Datos de ORNL para las corrientes usados en la entrada de Aspen
Material Combustible de sal
Refrigerante de sal
LiF4 0.7 0.66
BeF2 0.291 0.34
UF4 0.009 0 Tabla 2: Las composiciones para las corrientes de sal fundida en mol%
Es importante observar que en en el sistema conectado, la corriente 2 entraría al generador de
vapor para proveer calor al agua de servicio, y la corriente 1 sería la corriente de retorno con sal al
intercambiador de calor primario. La corriente 3 sería la corriente que sale del reactor, y la corriente
5 sería el retorno. También es importante observar que el intercambiador de calor primario
funciona como un intercambiador de calor normal, donde se transfiere calor entre dos fluidos. El
generador de vapor crea un cambio de fase en la corriente de agua, como se especificó en Aspen.
Otro propósito de esta simulación fue determinar el flujo de vapor que produce la producción
térmica del diseño del MSRE, como se determinó en la sección anterior. Para verificar las
calculaciones de la sección 3.2.2, se hizo un Análisis de Sensitividad [Sensitivity Analysis] en
Aspen para determinar el flujo de vapor que se correlacionó con la carga térmica en la sección
anterior. Se comparó el flujo calculado con el flujo producido por Aspen.
3.3 Paso 3: Una comparación de la producción de vapor de un MSR y un PWR
3.3.1 Unas comparaciones entre los sistemas de MSR y PWR
Para demonstrar la ventaja de usar un reactor nuclear que tiene la capaz de de producir vapor
sobrecalentado en vez de calderas de gas natural, se usó la Ecuación 1 para determinar el flujo de
vapor requerido para la calefacción del campus cuando se sobrecalienta a 371.1 °C por un PWR e
a 537.8 °C por un MSR. Basada en estos flujos, se usó la Ecuación 5 para determinar el calor
absorbido por el agua en la sección de producción de vapor en el circuito. Luego se usó la cantidad
de calor total en la Ecuación 3 con los porcentajes calculados de calor perdido para determinar el
calor producido por la corriente de refrigerante en cada uno de los tres intercambiadores de calor.
En el caso del MSR, se usó el porcentaje calculado en la sección 3.2.1, y para el PWR, se calculó
la pérdida de calor basada en los datos disponibles por un sistema representativo de energía
comercial con un PWR, el Estinghouse 414 (Westinghouse Electric Corporation Water Reactor
125
Divisions, 1984). Se usó el calor producido por el refrigerante en la Ecuación 2 para calcular el
flujo total del refrigerante en cada sistema del reactor.
En el sistema del MSR, se usó el calor producido por el refrigerante de sal en la Ecuación 3 para
determinar el calor transferido del combustible de sal. En este caso, la energía térmica producida
en el reactor es la misma que la del combustible porque se produce la energía dentro del
combustible cuando se pasa por el reactor. En el sistema con el PWR, el agua sirve como el
refrigerante, y se transfiere el calor de las barras de combustible estacionarias en el núcleo del
reactor al refrigerante. Esto significa que la pérdida de calor no ocurre solamente en el generador
de vapor, sino también dentro del reactor. Entonces, es necesario usar la Ecuación 3 para evaluar
la producción térmica del reactor, usando el porcentaje de calor perdido calculado de los datos de
Westinghouse 414 PWR. Se encuentran las calculaciones para la producción del reactor de PWR
en Apéndice A.3, y las del MSR en Apéndice A.4.
Otra comparación entre los sistemas se hizo usando la eficacia térmica, la cual es la proporción de
la energía producida por el vapor a la energía producida por el reactor. Por tanto, se comparan las
medidas de energía térmica perdida al ambiente en cada sistema. Se calculó la eficiencia térmica
usando la Ecuación 7:
𝑇ℎ𝑒𝑟𝑚𝑎𝑙 𝐸𝑓𝑓𝑖𝑐𝑖𝑒𝑛𝑐𝑦 =𝐸𝑛𝑒𝑟𝑔𝑦 𝑐𝑜𝑛𝑡𝑒𝑛𝑡 𝑜𝑓 𝑆𝑡𝑒𝑎𝑚
𝑇ℎ𝑒𝑟𝑚𝑎𝑙 𝑜𝑢𝑡𝑝𝑢𝑡 𝑜𝑓 𝑟𝑒𝑎𝑐𝑡𝑜𝑟 (7)
Por fin, se comparan los reactores usando energía específica, lo que se calcula dividiendo la
producción térmica del reactor por la masa de uranio en el combustible:
𝑆𝑝𝑒𝑐𝑖𝑓𝑖𝑐 𝑃𝑜𝑤𝑒𝑟 =𝑇ℎ𝑒𝑟𝑚𝑎𝑙 𝑜𝑢𝑡𝑝𝑢𝑡 𝑜𝑓 𝑟𝑒𝑎𝑐𝑡𝑜𝑟
𝑀𝑎𝑠𝑠 𝑈𝑟𝑎𝑛𝑖𝑢𝑚 𝑖𝑛 𝑓𝑢𝑒𝑙 (8)
3.3.2 La simulación de producción de vapor en un MSR e un PWR en Aspen Plus
Para simular las diferencias entre la producción de vapor en un PWR e en un MSR en Aspen, se
usó solamente el bloque de fired heater, como se muestra en la Figura 8. Para comparar cada
sistema, se hizo un Sensitivity Analysis en Aspen para determinar el flujo de masa de vapor
requerido para que cada reactor satisfaga las necesidades de energía de WPI y la energía del vapor
requerido, 11,163,074 joules por segundo (J/s) (Grudzinski, Further Power House Information,
2014). Para cada proceso diferente, se requiere entrada diferente en el bloque de fired heater. Un
PWR solo puede producir vapor saturado a presión alta (Westinghouse Electric Corporation Water
Reactor Divisions, 1984). En la simulación con el PWR, se especifcó la fracción de vapor de 1 y
la presión de salida de 689.4 kPa, lo que produce vapor saturado de 689.4 kPa y 170 ˚C. El uso de
un MSR permite la producción de vapor de temperaturas y presiones muchas más altas para crear
vapor sobrecalentado. En simular la producción de vapor de un MSR, se especificaron los grados
de sobrecalefacción en vez de la fracción de vapor, también teniendo en cuenta que la temperatura
de salida del refrigerante es 551.7 ˚C y por lo tanto, no se puede exceder 537.8 ˚C. Se comparan
los flujos de masa del vapor obtenidos en Aspen para los circuitos del MSR y del PWR.
3.4 Paso 4: El diseño del circuito de producción de vapor con un MSR para satisfacer las
necesidades del campus de WPI
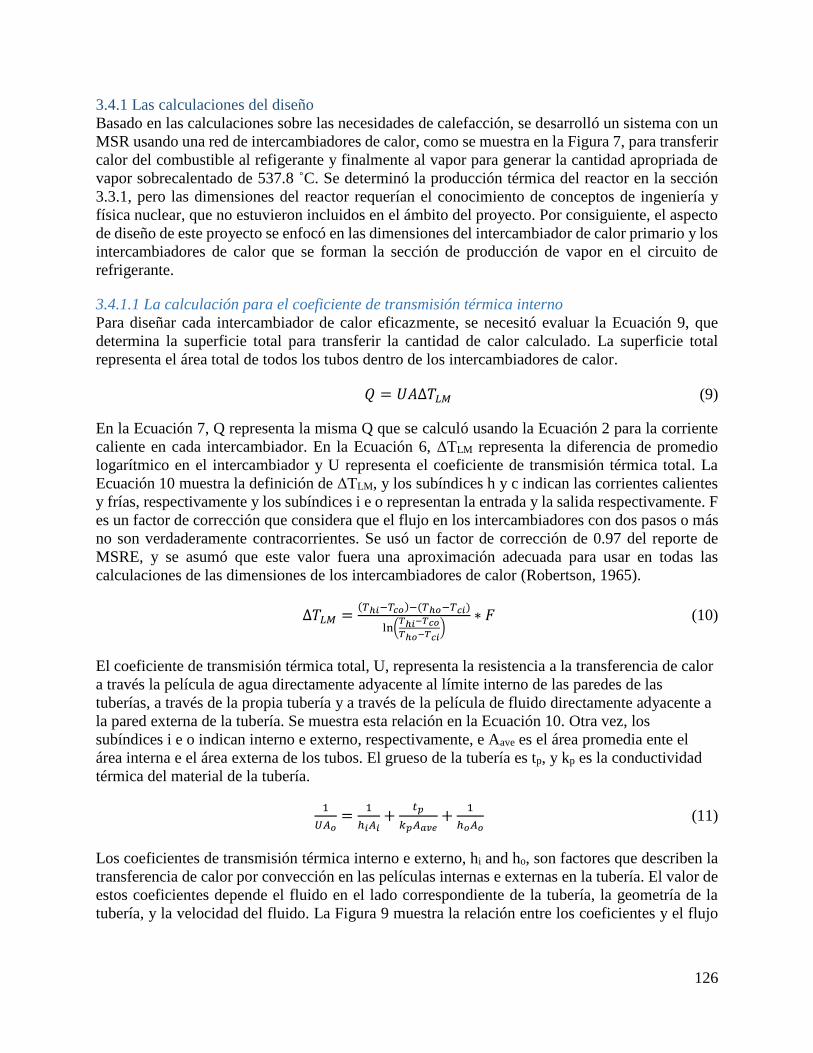
126
3.4.1 Las calculaciones del diseño
Basado en las calculaciones sobre las necesidades de calefacción, se desarrolló un sistema con un
MSR usando una red de intercambiadores de calor, como se muestra en la Figura 7, para transferir
calor del combustible al refigerante y finalmente al vapor para generar la cantidad apropriada de
vapor sobrecalentado de 537.8 ˚C. Se determinó la producción térmica del reactor en la sección
3.3.1, pero las dimensiones del reactor requerían el conocimiento de conceptos de ingeniería y
física nuclear, que no estuvieron incluidos en el ámbito del proyecto. Por consiguiente, el aspecto
de diseño de este proyecto se enfocó en las dimensiones del intercambiador de calor primario y los
intercambiadores de calor que se forman la sección de producción de vapor en el circuito de
refrigerante.
3.4.1.1 La calculación para el coeficiente de transmisión térmica interno
Para diseñar cada intercambiador de calor eficazmente, se necesitó evaluar la Ecuación 9, que
determina la superficie total para transferir la cantidad de calor calculado. La superficie total
representa el área total de todos los tubos dentro de los intercambiadores de calor.
𝑄 = 𝑈𝐴Δ𝑇𝐿𝑀 (9)
En la Ecuación 7, Q representa la misma Q que se calculó usando la Ecuación 2 para la corriente
caliente en cada intercambiador. En la Ecuación 6, ΔTLM representa la diferencia de promedio
logarítmico en el intercambiador y U representa el coeficiente de transmisión térmica total. La
Ecuación 10 muestra la definición de ΔTLM, y los subíndices h y c indican las corrientes calientes
y frías, respectivamente y los subíndices i e o representan la entrada y la salida respectivamente. F
es un factor de corrección que considera que el flujo en los intercambiadores con dos pasos o más
no son verdaderamente contracorrientes. Se usó un factor de corrección de 0.97 del reporte de
MSRE, y se asumó que este valor fuera una aproximación adecuada para usar en todas las
calculaciones de las dimensiones de los intercambiadores de calor (Robertson, 1965).
Δ𝑇𝐿𝑀 =(𝑇ℎ𝑖−𝑇𝑐𝑜)−(𝑇ℎ𝑜−𝑇𝑐𝑖)
ln(𝑇ℎ𝑖−𝑇𝑐𝑜𝑇ℎ𝑜−𝑇𝑐𝑖
)∗ 𝐹 (10)
El coeficiente de transmisión térmica total, U, representa la resistencia a la transferencia de calor
a través la película de agua directamente adyacente al límite interno de las paredes de las
tuberías, a través de la propia tubería y a través de la película de fluido directamente adyacente a
la pared externa de la tubería. Se muestra esta relación en la Ecuación 10. Otra vez, los
subíndices i e o indican interno e externo, respectivamente, e Aave es el área promedia ente el
área interna e el área externa de los tubos. El grueso de la tubería es tp, y kp es la conductividad
térmica del material de la tubería.
1
𝑈𝐴𝑜=
1
ℎ𝑖𝐴𝑖+
𝑡𝑝
𝑘𝑝𝐴𝑎𝑣𝑒+
1
ℎ𝑜𝐴𝑜 (11)
Los coeficientes de transmisión térmica interno e externo, hi and ho, son factores que describen la
transferencia de calor por convección en las películas internas e externas en la tubería. El valor de
estos coeficientes depende el fluido en el lado correspondiente de la tubería, la geometría de la
tubería, y la velocidad del fluido. La Figura 9 muestra la relación entre los coeficientes y el flujo
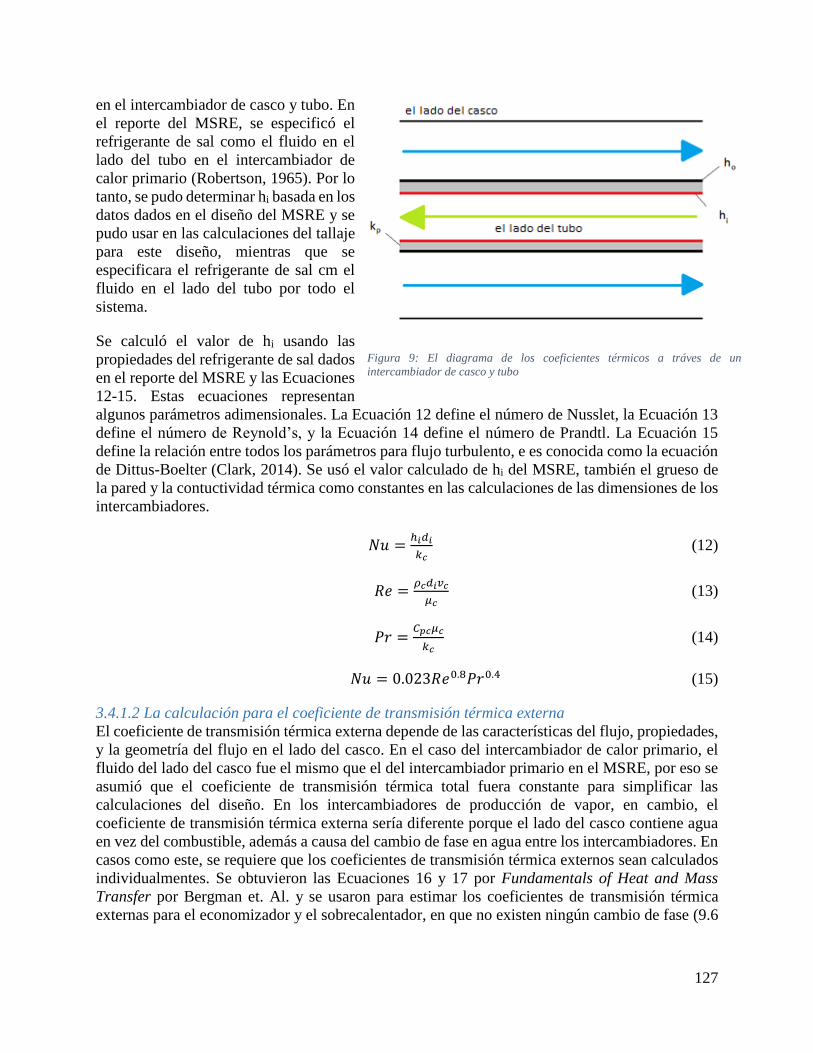
127
en el intercambiador de casco y tubo. En
el reporte del MSRE, se especificó el
refrigerante de sal como el fluido en el
lado del tubo en el intercambiador de
calor primario (Robertson, 1965). Por lo
tanto, se pudo determinar hi basada en los
datos dados en el diseño del MSRE y se
pudo usar en las calculaciones del tallaje
para este diseño, mientras que se
especificara el refrigerante de sal cm el
fluido en el lado del tubo por todo el
sistema.
Se calculó el valor de hi usando las
propiedades del refrigerante de sal dados
en el reporte del MSRE y las Ecuaciones
12-15. Estas ecuaciones representan
algunos parámetros adimensionales. La Ecuación 12 define el número de Nusslet, la Ecuación 13
define el número de Reynold’s, y la Ecuación 14 define el número de Prandtl. La Ecuación 15
define la relación entre todos los parámetros para flujo turbulento, e es conocida como la ecuación
de Dittus-Boelter (Clark, 2014). Se usó el valor calculado de hi del MSRE, también el grueso de
la pared y la contuctividad térmica como constantes en las calculaciones de las dimensiones de los
intercambiadores.
𝑁𝑢 =ℎ𝑖𝑑𝑖
𝑘𝑐 (12)
𝑅𝑒 =𝜌𝑐𝑑𝑖𝑣𝑐
𝜇𝑐 (13)
𝑃𝑟 =𝐶𝑝𝑐𝜇𝑐
𝑘𝑐 (14)
𝑁𝑢 = 0.023𝑅𝑒0.8𝑃𝑟0.4 (15)
3.4.1.2 La calculación para el coeficiente de transmisión térmica externa
El coeficiente de transmisión térmica externa depende de las características del flujo, propiedades,
y la geometría del flujo en el lado del casco. En el caso del intercambiador de calor primario, el
fluido del lado del casco fue el mismo que el del intercambiador primario en el MSRE, por eso se
asumió que el coeficiente de transmisión térmica total fuera constante para simplificar las
calculaciones del diseño. En los intercambiadores de producción de vapor, en cambio, el
coeficiente de transmisión térmica externa sería diferente porque el lado del casco contiene agua
en vez del combustible, además a causa del cambio de fase en agua entre los intercambiadores. En
casos como este, se requiere que los coeficientes de transmisión térmica externos sean calculados
individualmentes. Se obtuvieron las Ecuaciones 16 y 17 por Fundamentals of Heat and Mass
Transfer por Bergman et. Al. y se usaron para estimar los coeficientes de transmisión térmica
externas para el economizador y el sobrecalentador, en que no existen ningún cambio de fase (9.6
Figura 9: El diagrama de los coeficientes térmicos a tráves de un
intercambiador de casco y tubo
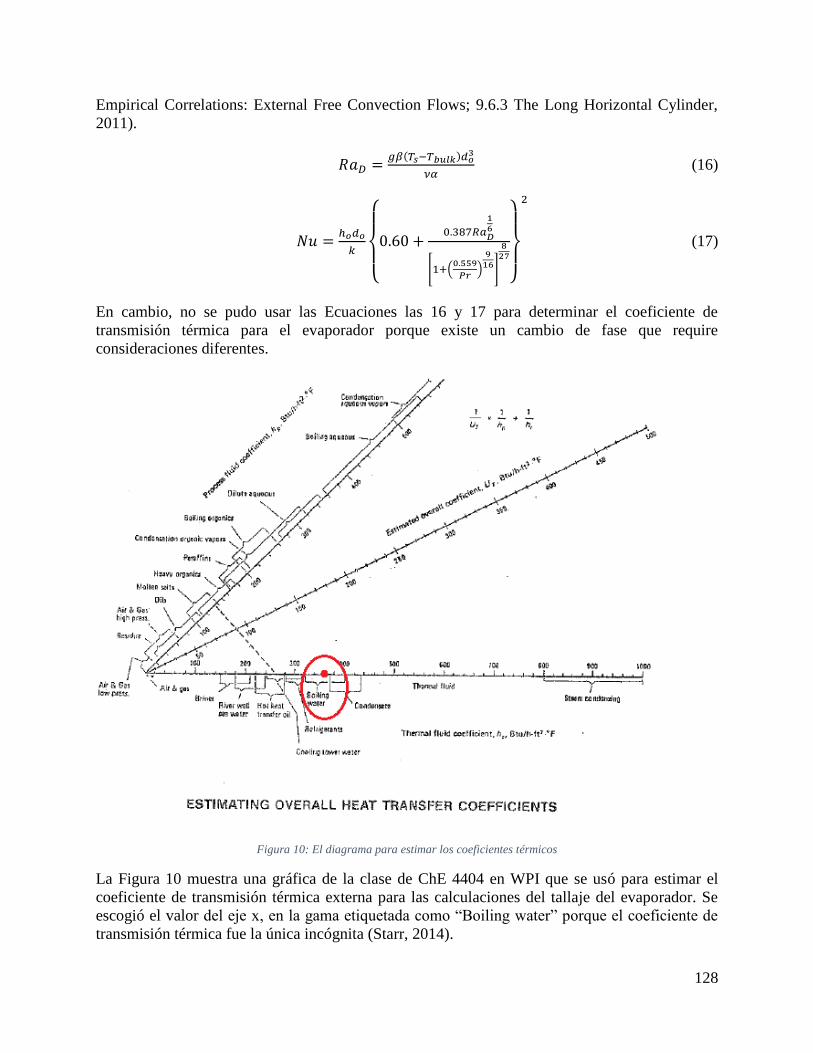
128
Empirical Correlations: External Free Convection Flows; 9.6.3 The Long Horizontal Cylinder,
2011).
𝑅𝑎𝐷 =𝑔𝛽(𝑇𝑠−𝑇𝑏𝑢𝑙𝑘)𝑑𝑜
3
𝜈𝛼 (16)
𝑁𝑢 =ℎ𝑜𝑑𝑜
𝑘
{
0.60 +0.387𝑅𝑎𝐷
16
[1+(0.559
𝑃𝑟)
916]
827
}
2
(17)
En cambio, no se pudo usar las Ecuaciones las 16 y 17 para determinar el coeficiente de
transmisión térmica para el evaporador porque existe un cambio de fase que require
consideraciones diferentes.
Figura 10: El diagrama para estimar los coeficientes térmicos
La Figura 10 muestra una gráfica de la clase de ChE 4404 en WPI que se usó para estimar el
coeficiente de transmisión térmica externa para las calculaciones del tallaje del evaporador. Se
escogió el valor del eje x, en la gama etiquetada como “Boiling water” porque el coeficiente de
transmisión térmica fue la única incógnita (Starr, 2014).
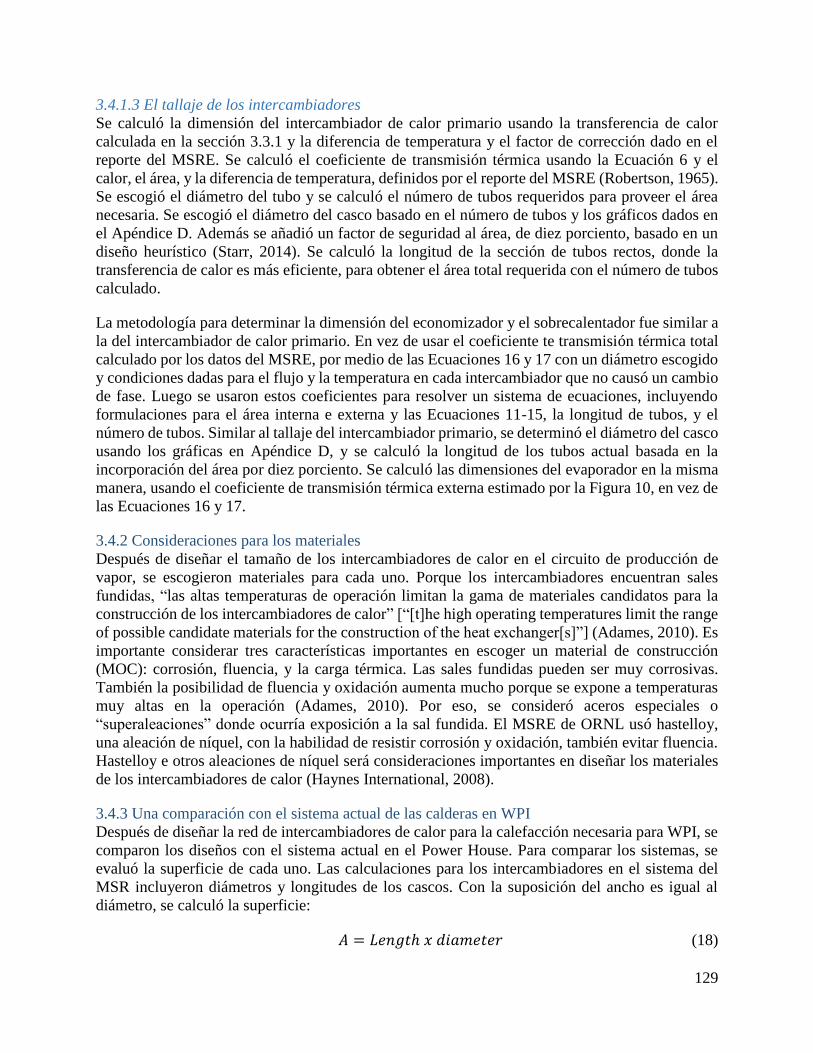
129
3.4.1.3 El tallaje de los intercambiadores
Se calculó la dimensión del intercambiador de calor primario usando la transferencia de calor
calculada en la sección 3.3.1 y la diferencia de temperatura y el factor de corrección dado en el
reporte del MSRE. Se calculó el coeficiente de transmisión térmica usando la Ecuación 6 y el
calor, el área, y la diferencia de temperatura, definidos por el reporte del MSRE (Robertson, 1965).
Se escogió el diámetro del tubo y se calculó el número de tubos requeridos para proveer el área
necesaria. Se escogió el diámetro del casco basado en el número de tubos y los gráficos dados en
el Apéndice D. Además se añadió un factor de seguridad al área, de diez porciento, basado en un
diseño heurístico (Starr, 2014). Se calculó la longitud de la sección de tubos rectos, donde la
transferencia de calor es más eficiente, para obtener el área total requerida con el número de tubos
calculado.
La metodología para determinar la dimensión del economizador y el sobrecalentador fue similar a
la del intercambiador de calor primario. En vez de usar el coeficiente te transmisión térmica total
calculado por los datos del MSRE, por medio de las Ecuaciones 16 y 17 con un diámetro escogido
y condiciones dadas para el flujo y la temperatura en cada intercambiador que no causó un cambio
de fase. Luego se usaron estos coeficientes para resolver un sistema de ecuaciones, incluyendo
formulaciones para el área interna e externa y las Ecuaciones 11-15, la longitud de tubos, y el
número de tubos. Similar al tallaje del intercambiador primario, se determinó el diámetro del casco
usando los gráficas en Apéndice D, y se calculó la longitud de los tubos actual basada en la
incorporación del área por diez porciento. Se calculó las dimensiones del evaporador en la misma
manera, usando el coeficiente de transmisión térmica externa estimado por la Figura 10, en vez de
las Ecuaciones 16 y 17.
3.4.2 Consideraciones para los materiales
Después de diseñar el tamaño de los intercambiadores de calor en el circuito de producción de
vapor, se escogieron materiales para cada uno. Porque los intercambiadores encuentran sales
fundidas, “las altas temperaturas de operación limitan la gama de materiales candidatos para la
construcción de los intercambiadores de calor” [“[t]he high operating temperatures limit the range
of possible candidate materials for the construction of the heat exchanger[s]”] (Adames, 2010). Es
importante considerar tres características importantes en escoger un material de construcción
(MOC): corrosión, fluencia, y la carga térmica. Las sales fundidas pueden ser muy corrosivas.
También la posibilidad de fluencia y oxidación aumenta mucho porque se expone a temperaturas
muy altas en la operación (Adames, 2010). Por eso, se consideró aceros especiales o
“superaleaciones” donde ocurría exposición a la sal fundida. El MSRE de ORNL usó hastelloy,
una aleación de níquel, con la habilidad de resistir corrosión y oxidación, también evitar fluencia.
Hastelloy e otros aleaciones de níquel será consideraciones importantes en diseñar los materiales
de los intercambiadores de calor (Haynes International, 2008).
3.4.3 Una comparación con el sistema actual de las calderas en WPI
Después de diseñar la red de intercambiadores de calor para la calefacción necesaria para WPI, se
comparon los diseños con el sistema actual en el Power House. Para comparar los sistemas, se
evaluó la superficie de cada uno. Las calculaciones para los intercambiadores en el sistema del
MSR incluyeron diámetros y longitudes de los cascos. Con la suposición del ancho es igual al
diámetro, se calculó la superficie:
𝐴 = 𝐿𝑒𝑛𝑔𝑡ℎ 𝑥 𝑑𝑖𝑎𝑚𝑒𝑡𝑒𝑟 (18)

130
No pudimos determinar la superficie exacta de las calderas en el Power House en WPI, por eso se
estimó su tamaño usando datos de un fabricante de calderas industriales, lo que provee medidas
de ancho y longitud, y se puede determinar la superficie:
𝐴 = 𝐿𝑒𝑛𝑔𝑡ℎ 𝑥 𝑤𝑖𝑑𝑡ℎ (19)
131
4 RESULTADOS Y DISCUSIÓN
4.1 Las necesidades para la calefacción del campus
Actualmente, las necesidades de calefacción para la mayoría del campus de WPI son satisfechas
con vapor saturado de 6.89 kPa, producido por las calderas en el Power House. Se transporta este
vapor en un circuito que calenta aproximadamente 111,480 de metros cuadrados para espacios
académicos y residenciales (Grudzinski, Further Power House Information, 2014). Durante la
estación fría, se produce entre 3,628.7 y 14,515 kg/h de vapor, pero de media, se requiere un flujo
de aproximadamente 11,339 kg/h. En cada combinación de temperatura y presión, vapor contiene
una cantidad de energía específica por gramo, lo que llama entalpía. Para las condiciones usadas
en campus, se asume una entalpía constante de 2,767 kilojoules por kilogramo (kJ/kg), lo que
significa que la temperatura y presión de saturación se asume las mismas entalpias para
producciones máxima, mínima, y promedia (Spirax-Sarco, 2014). Cuando se produce el mínimo
de 3,628 kg/h, se determinó que el uso de energía para calefacción es 2.79 miliones J/s. En la
producción máxima, se determinó que las necesidades de calefacción son 11.2 miliones J/s, y
finalmente que la producción promedia requiere 8.7 miliones J/s. Se proveen estas calculaciones
en Apéndice A.1.
Se hizo una simulación en Aspen para verificar estas calculaciones. Las simulaciones determinaron
que la producción de energía para las necesidades mínimia, promedia y máxima, son 2.7, 8.5, y
10.8 miliones J/s, respectivamente. Los resultados comparan bien con las calculaciones del balance
térmico, y confirman que los bloques de horno/calentador [furnace/fired heater] pueden simular la
producción de vapor en un sistema de calderas. Las calculaciones que siguieron no se enfocaron
en un sistema de calderas, pero en la producción de vapor usando otras fuentes de calor.
Se consideraron estas calculaciones en determinar la posibilidad de usar un reactor nuclear como
una fuente de calor para satisfacer las necesidades de calefacción de campus. Las calderas en el
Power House producen vapor saturado, pero el uso de una fuente de calor que puede calentar el
vapor a una temperatura más alta que la temperatura de saturación presenta la posibilidad de
calentar el vapor en una manera más eficiente. Cuando aumenta la temperatura del vapor a
temperaturas superiores de la temperatura de saturación, en este caso 170 ˚C, la entalpía también
aumenta, y por eso se puede cumplir la misma cantidad de calefacción usando menos agua. Esta
es la primera ventaja en usar un reactor nuclear como una fuente de calor. La temperatura de salida
en una caldera de gas natural, por eso la calidad del vapor, es limitada por la energía de combustión
que se puede obtener de gas natural, además por la eficiencia del horno y la caldera. Pero los
sistemas examinados en nuestro reporte, son basados en el intercambio de calor entre solamente
dos fluidos. Se puede realizar esto usando un intercambiador de calor de casco y tubo, que permite
que se basa la calculación de eficiencia en la perdida de calor en el intercambiador primario en el
diseño del MSRE (Robertson, 1965).
4.2 Las calculaciones y simulación para la producción de energía potencial del MSRE
La primera evaluación de la habilidad de cumplir a las necesidades de calefacción del campus fue
del diseño del MSRE, usado en ORNL. Para estas calculaciones, se usó condiciones idénticas a
las del MSRE: un reactor de 10MWth para la producción de energía nuclear, un flujo de
combustible de 0.756 m3/s, y un flujo de refrigerante de 0.05 m3/s. También se asumieron las
mismas temperaturas y condiciones para el intercambiador primario que el MSRE, pero se

132
reemplazó el radiador con un generador de vapor teorético con recuperación de calor. Se aproximó
el generador de como tres intercambiadores de calor, donde se transfiere calor entre el circuito del
refrigerante de sal a una corriente de agua. Basado en el cambio de temperatura a través el radiador
en la corriente del refrigerante, se asume que el calor del refrigerante se puede producir vapor
saturado de 537.8 ˚C porque es bastante cerca a la temperatura mínima del refrigerante, 551.7 ˚C.
Las calculaciones de transferencia térmica determinaron una pérdida de calor de 5% a través del
intercambiador primario. Se usó este valor en estimar la pérdida de calor a través del generador de
vapor para determinar el calor total absorbido por el agua para generar vapor.
Las temperaturas de entrada y salida en cada intercambiador ya eran conocidas. Como se ha
mencionado, se asume que el vapor fue 1000F, y se escogió 80F para la temperatura de entrada
del economizador, usando un diseño químico heurístico que describe la temperatura típica del
suministro de agua en una ciudad como Worcester (Turton R. , Bailie, Whiting, Shaeiwitz, &
Bhattacharyya, 2013). Las temperaturas restantes, la entrada y la salida del evaporador, también
son conocidas por la definición del sistema del generador de vapor. El economizador calienta el
agua a saturación, un cambio de fase ocurre en el evaporador, y el sobrecalentador caliente el vapor
de saturación a la temperatura de salida. Por eso, las temperaturas de la entrada y salida del
evaporador son la temperatura de saturación de agua de 6.89 kPa. Con la información mencionada
se hicieron las calculaciones de balance térmico y la simulación en Aspen.
Se usó cuatro tipos de valores para resolver la colección de tres ecuaciones para el balance térmico:
la transferencia total de calor, el cambio de temperatura a través de cada intercambiador, y las
capacidades térmicas y calor latente obtenidos por las tablas de vapor (Spirax-Sarco, 2014). Se
resolvió el sistema de ecuaciones para determinar la transferencia de calor en cada intercambiador
de calor y el flujo de vapor sobrecalentado producido. Se determinó que el flujo total de vapor
sobrecalentado de 1.29 m3/s. La entalpía de vapor de 6.98 kPa y 537.8 ˚C es 3563.4 kJ/kg, por eso
la energía total de calefacción para esta cantidad es 9.2 miliones J/s. La simulación en Aspen
produjo resultados similares y determinó que las necesidades de calefacción de 0.9 miliones J/s
requerían 1.3 m3/s de vapor.
Los resultados indican que el MSRE tiene la habilidad de proveer calefacción al campus durante
producción mínima y promedio pero solamente 82.5% de la producción máxima. Por eso, un
sistema basado en un reactor de sales fundidas para WPI requiere una producción térmica más que
la producción térmica del MSRE. Se proveen las calculaciones para la evaluación de MSRE en
Apéndice A.2.
4.3 La comparación del PWR y MSR
El propósito de la próxima colección de calculaciones fue determinar la producción térmica del
reactor que cumpliría las necesidades máximas de calefacción para campus. La meta de esta
evaluación fue doble –mostrar el ahorro de agua que se puede obtener usando un reactor nuclear
en vez de las calderas de gas natural usado actualmente en el campus, y además de esto, mostrar
las ventajas en usar un reactor de sales fundidas en vez de un reactor de agua a presión. Para
alcanzar las metas, el primer paso fue evaluar un sistema de producción de vapor que se parece a
una versión mas baja del PWR de la central energética de Westinghouse 414. La evaluación
determinó el grado de sobrecalefacción que puede obtener el reactor con vapor 6.89 kPa y la
producción térmica del reactor adecuada para calentar el campus con 11.1 miliones J/s. Luego se
133
comparan el diseño del Westinghouse con un diseño similar al del MSRE, con una serie de
intercambiadores de calor en lugar del radiador.
4.3.1 Producción de vapor de un PWR
El Westinghouse 414 es un ejemplo de un PWR típico que puede producir aproximadamente 3800
MWth en el reactor (Westinghouse Electric Corporation Water Reactor Divisions, 1984). El
primer paso en evaluar este sistema fue determinar la pérdida de calor a través el generador de
vapor. Basado en los datos disponibles de Westinghouse 414, se encontró que aproximadamente
11% de la energía producida en el núcleo no se transfiere al refrigerante de agua, y 6.7% del calor
del agua no se transfiere a través el generador de vapor –se pierde esta energía al medio ambiente.
Luego se usaron los porcentajes en el diseño del sistema de producción de vapor para WPI.
Basada en las temperaturas dadas en Westinghouse 414, determinó que el circuito puede producir
vapor de 260 ˚C porque es bastante cerca de la temperatura del refrigerante (292.2 ˚C). El vapor
sobrecalentado de 6.89 kPa y 260 ˚C tiene una entalpía de 2,970 kJ/kg, lo que significa que el
sistema de producción de vapor con un PWR usa 14,752 kg/h de agua para calentar el campus
(Spirax-Sarco, 2014). La simulación en Aspen calculó que el sistema requiere 15,529 kg/h. Los
resultados de Aspen y las calculaciones del balance térmico son comparables, lo que puede
verificar cada resultado. Se puede explicar la diferencia entre los resultados en dos maneras.
Primero, es posible que Aspen asume una perdida de calor mas alta que nuestras calculaciones.
Cuando aumenta la perdida de calor desde el reactor al generador de vapor, también aumenta la
cantidad de agua requerida para producir vapor con la misma cantidad de energía. La segunda
explicación es que las calculaciones de transferencia térmica se vuelven más complicadas con
hervir y cambio de fase. Es posible que Aspen use valores un poco diferentes que las calculaciones
para las capacidades de calor u otros valores. Se determinaron los valores de forma experimental
en el MSRE, pero es posible que Aspen no se calcule las cantidades en la misma forma.
En continuar el balance térmico, se encontró que un sistema con el reactor de Westinghouse
requiere 225,247 m3/s de refrigerante de agua cuando se usa las mismas temperaturas de operación
que Westinghouse 414. Además, se determinó que un PWR similar al Westinghouse 414 necesita
producir 12.55 MWth para producir bastante vapor de 260 ˚C para calentar el campus durante
producción máxima. El uso de este tipo de reactor para producir vapor de 260 ˚C en vez de las
calderas actualmente en campus puede ahorrar 6.8% de agua en el circuito durante producción
máxima. Aspen Plus no tiene la habilidad de simular estas calculaciones a causa de las presiones
altísimas en el sistema del PWR. También no se puede conectar el bloque de horno/calentador a
fuego [furnace/fired heater] a otro sistema o fuente de calor.
Por medio de dividir el contenido energético de la corriente saliendo por la eficiencia térmica del
reactor, se encontró que el sistema tiene una eficiencia de 89%, usando La Ecuación 7. Shultis y
Faw proveen una tabla de resumen que define el poder específico del combustible en el PWR como
33 kW/kg uranio (Shultis & Faw, 2002). Basado en esta estimación, se reorganizó La Ecuación 8
y se calculó que un PWR de 12.55 MWth requiere aproximadamente 380 kg de uranio.
4.3.2 Producción de vapor de un MSR
Se usó 5% de calor perdido como calculado en la evaluación del MSRE para producción de vapor,
para estimar la pérdida de calor a través del intercambiador primario y los intercambiadores en el
sistema del generador de vapor en la evaluación del MSR. Como se mencionara en la sección 4.2,
134
un sistema con un reactor de sales fundidas que opera con las temperaturas especificadas en el
diseño del MSRE tiene la habilidad de producir vapor de 537.8 ˚C y 6.98 kPa. Vapor con estas
condiciones en este sistema requiere aproximadamente 12,326 kg/h de agua para calentar el
campus durante producción máxima. Se hizo una simulación en Aspen que estimó que el requisito
de 11.1 miliones J/s necesita 12,710 kg/h en este sistema. Los descubrimientos equiparan a un
promedio ahorro de agua de 20.1%.
Para producir esta cantidad de vapor de 537 ˚C con las temperaturas especificadas en el diseño del
MSRE, se encontró que el flujo de refrigerante de sal requerido es 490,891 kg/h, y el flujo de
combustible es 876,237 kg/h –esto corresponde a aumentos en los flujos del diseño del MSRE,
como un aumento de 21.2% en el flujo de refrigerante y un aumento de 36.9% en el flujo de
combustible. Con estos flujos y las temperaturas del MSRE, se encontró que la producción térmica
del reactor es 12.16 MWth, y la eficiencia térmica es 91.8%. Otra vez, Aspen no tiene la habilidad
de simular esta calculación a causa de las restricciones de los bloques.
En el diseño original del MSRE con un reactor de 10MWth, el circuito del combustible contuvo
2.07 m3 de combustible. Según los datos dados en el reporte del MSRE, el combustible fue 0.009
mol% tetrafluoruro de uranio (Robertson, 1965). Usando La Ecuación 8, se calculó un poder
específico de aproximadamente 43.9 kW/kg uranio. Usando este poder específico, el reactor de
12.16 MWth, la producción térmica requerida para calentar el campus, requiere aproximadamente
276 kg de uranio. Se pueden encontrar calculaciones detalladas en Apéndice A.4.
4.3.3 Ventajas del MSR
Las calculaciones de las secciones anteriores muestran que el uso de un reactor nuclear como una
fuente de calor en el circuito de producción de vapor ahorraría agua en el proceso. También
muestra que se puede ahorrar todavía más agua con el uso de un reactor de sales fundidas, sino
también con una producción térmica y un inventario de uranio más bajos. Además de estas
ventajas, la operación de un reactor de agua a presión requiere la operación a presiones muy altas:
aproximadamente 15,502 kPa para prevenir que el agua en reactor hierva (Shultis & Faw, 2002).
Diferente del PWR, un MSR y el uso de combustibles y refrigerantes de sales permiten operación
entre 34.47 y 379 kPa. Al operar a presiones más bajas, se elimina la necesidad de usar una
máquina especial que pueda resistir la presión extrema. Además, con un PWR, es necesario cerrar
el reactor completamente por lo menos una vez cada año para reemplazar las barras de combustible
a causa de la acumulación de los productos de fisión. La naturaleza fluida del combustible en un
reactor de sales fundidas permite que los productos de fisión sean eliminados por un sistema de
gases de descarga basado en helio dentro de la bomba (Robertson, 1965). Se puede añadir otras
operaciones de unidad al circuito para procesar el resto de los productos de fisión que no se pueden
quitar por el sistema de gases de descarga. También se puede sacar o añadir cantidades pequeñas
del combustible por un puerto en el cubrimiento del reactor para reprocesar el combustible
constantemente sin cerrar el reactor (Robertson, 1965). Sin cerrar el reactor, el sistema puede
operar por un largo período de tiempo, lo que es importante en los meses durante el invierno
cuando el campus requiere calefacción constantemente para prevenir que la tubería no se congele,
y para mantenar condiciones cómodas en los edificios para los estudiantes y la facultad. La Tabla
3 muestra un resumen de las ventajas de usar un MSR en vez de un PWR.
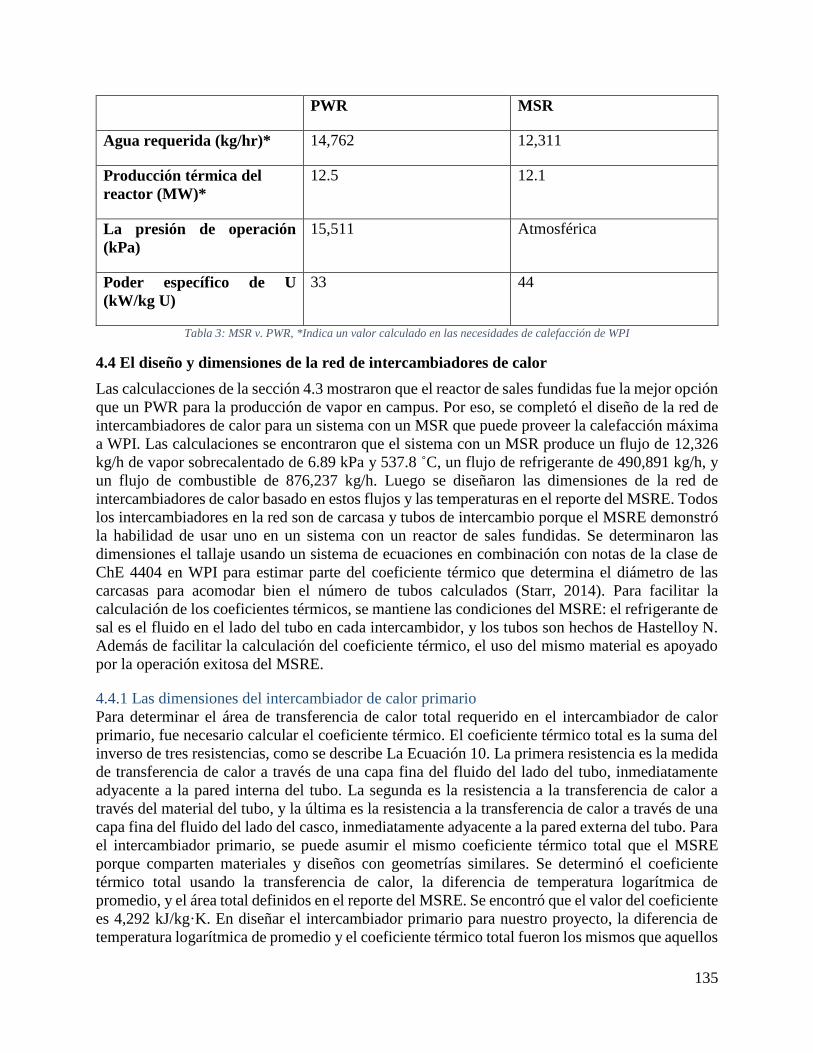
135
PWR MSR
Agua requerida (kg/hr)* 14,762 12,311
Producción térmica del
reactor (MW)*
12.5 12.1
La presión de operación
(kPa)
15,511 Atmosférica
Poder específico de U
(kW/kg U)
33 44
Tabla 3: MSR v. PWR, *Indica un valor calculado en las necesidades de calefacción de WPI
4.4 El diseño y dimensiones de la red de intercambiadores de calor
Las calculacciones de la sección 4.3 mostraron que el reactor de sales fundidas fue la mejor opción
que un PWR para la producción de vapor en campus. Por eso, se completó el diseño de la red de
intercambiadores de calor para un sistema con un MSR que puede proveer la calefacción máxima
a WPI. Las calculaciones se encontraron que el sistema con un MSR produce un flujo de 12,326
kg/h de vapor sobrecalentado de 6.89 kPa y 537.8 ˚C, un flujo de refrigerante de 490,891 kg/h, y
un flujo de combustible de 876,237 kg/h. Luego se diseñaron las dimensiones de la red de
intercambiadores de calor basado en estos flujos y las temperaturas en el reporte del MSRE. Todos
los intercambiadores en la red son de carcasa y tubos de intercambio porque el MSRE demonstró
la habilidad de usar uno en un sistema con un reactor de sales fundidas. Se determinaron las
dimensiones el tallaje usando un sistema de ecuaciones en combinación con notas de la clase de
ChE 4404 en WPI para estimar parte del coeficiente térmico que determina el diámetro de las
carcasas para acomodar bien el número de tubos calculados (Starr, 2014). Para facilitar la
calculación de los coeficientes térmicos, se mantiene las condiciones del MSRE: el refrigerante de
sal es el fluido en el lado del tubo en cada intercambidor, y los tubos son hechos de Hastelloy N.
Además de facilitar la calculación del coeficiente térmico, el uso del mismo material es apoyado
por la operación exitosa del MSRE.
4.4.1 Las dimensiones del intercambiador de calor primario
Para determinar el área de transferencia de calor total requerido en el intercambiador de calor
primario, fue necesario calcular el coeficiente térmico. El coeficiente térmico total es la suma del
inverso de tres resistencias, como se describe La Ecuación 10. La primera resistencia es la medida
de transferencia de calor a través de una capa fina del fluido del lado del tubo, inmediatamente
adyacente a la pared interna del tubo. La segunda es la resistencia a la transferencia de calor a
través del material del tubo, y la última es la resistencia a la transferencia de calor a través de una
capa fina del fluido del lado del casco, inmediatamente adyacente a la pared externa del tubo. Para
el intercambiador primario, se puede asumir el mismo coeficiente térmico total que el MSRE
porque comparten materiales y diseños con geometrías similares. Se determinó el coeficiente
térmico total usando la transferencia de calor, la diferencia de temperatura logarítmica de
promedio, y el área total definidos en el reporte del MSRE. Se encontró que el valor del coeficiente
es 4,292 kJ/kg·K. En diseñar el intercambiador primario para nuestro proyecto, la diferencia de
temperatura logarítmica de promedio y el coeficiente térmico total fueron los mismos que aquellos
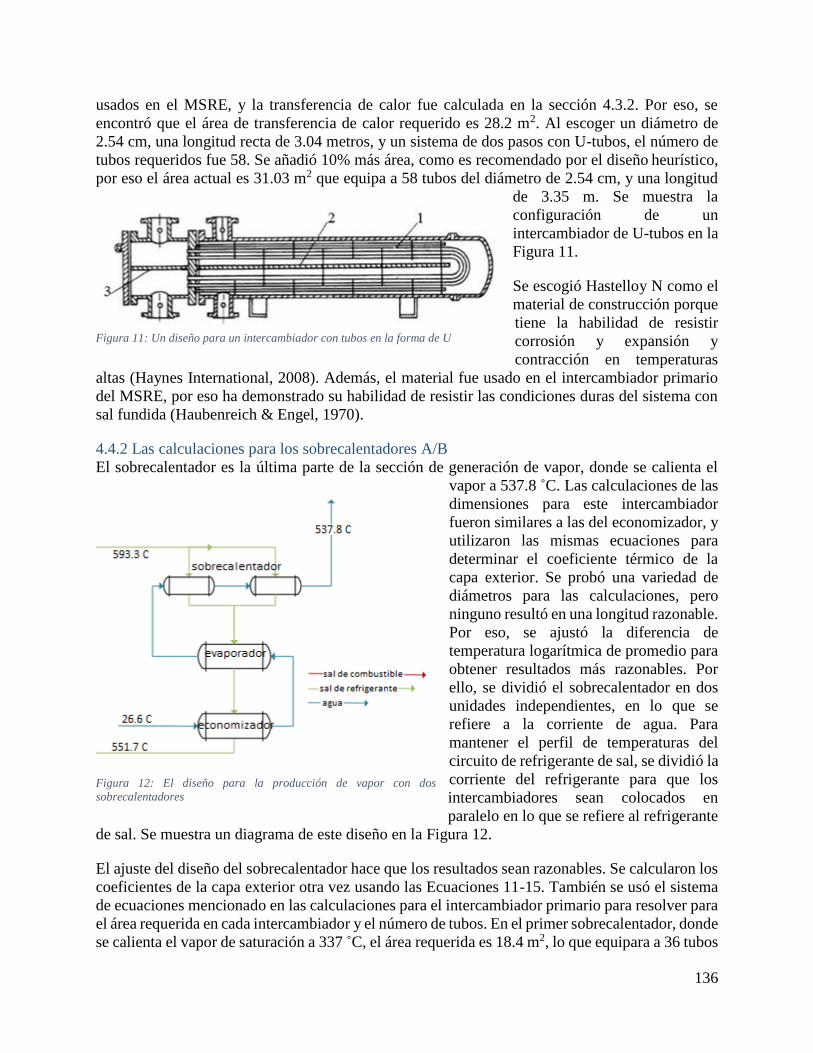
136
usados en el MSRE, y la transferencia de calor fue calculada en la sección 4.3.2. Por eso, se
encontró que el área de transferencia de calor requerido es 28.2 m2. Al escoger un diámetro de
2.54 cm, una longitud recta de 3.04 metros, y un sistema de dos pasos con U-tubos, el número de
tubos requeridos fue 58. Se añadió 10% más área, como es recomendado por el diseño heurístico,
por eso el área actual es 31.03 m2 que equipa a 58 tubos del diámetro de 2.54 cm, y una longitud
de 3.35 m. Se muestra la
configuración de un
intercambiador de U-tubos en la
Figura 11.
Se escogió Hastelloy N como el
material de construcción porque
tiene la habilidad de resistir
corrosión y expansión y
contracción en temperaturas
altas (Haynes International, 2008). Además, el material fue usado en el intercambiador primario
del MSRE, por eso ha demonstrado su habilidad de resistir las condiciones duras del sistema con
sal fundida (Haubenreich & Engel, 1970).
4.4.2 Las calculaciones para los sobrecalentadores A/B
El sobrecalentador es la última parte de la sección de generación de vapor, donde se calienta el
vapor a 537.8 ˚C. Las calculaciones de las
dimensiones para este intercambiador
fueron similares a las del economizador, y
utilizaron las mismas ecuaciones para
determinar el coeficiente térmico de la
capa exterior. Se probó una variedad de
diámetros para las calculaciones, pero
ninguno resultó en una longitud razonable.
Por eso, se ajustó la diferencia de
temperatura logarítmica de promedio para
obtener resultados más razonables. Por
ello, se dividió el sobrecalentador en dos
unidades independientes, en lo que se
refiere a la corriente de agua. Para
mantener el perfil de temperaturas del
circuito de refrigerante de sal, se dividió la
corriente del refrigerante para que los
intercambiadores sean colocados en
paralelo en lo que se refiere al refrigerante
de sal. Se muestra un diagrama de este diseño en la Figura 12.
El ajuste del diseño del sobrecalentador hace que los resultados sean razonables. Se calcularon los
coeficientes de la capa exterior otra vez usando las Ecuaciones 11-15. También se usó el sistema
de ecuaciones mencionado en las calculaciones para el intercambiador primario para resolver para
el área requerida en cada intercambiador y el número de tubos. En el primer sobrecalentador, donde
se calienta el vapor de saturación a 337 ˚C, el área requerida es 18.4 m2, lo que equipara a 36 tubos
Figure 16: U-tube Set Up for Exchanger Design Figura 11: Un diseño para un intercambiador con tubos en la forma de U
Figura 12: El diseño para la producción de vapor con dos
sobrecalentadores
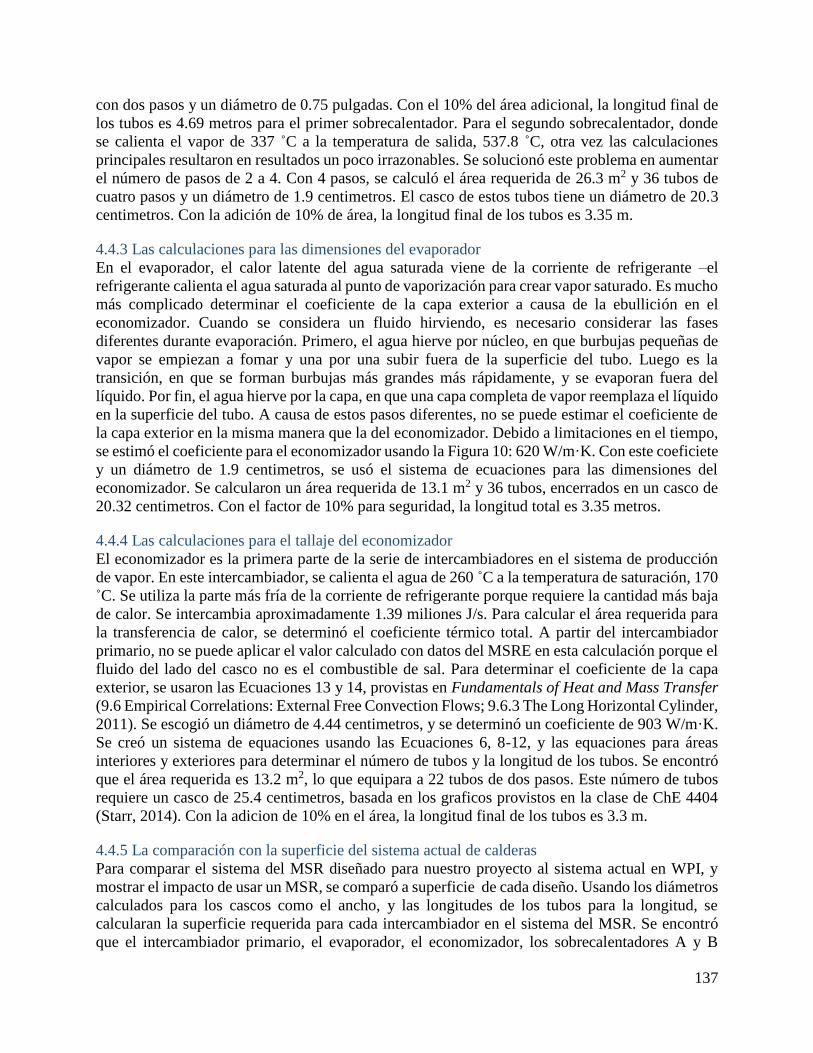
137
con dos pasos y un diámetro de 0.75 pulgadas. Con el 10% del área adicional, la longitud final de
los tubos es 4.69 metros para el primer sobrecalentador. Para el segundo sobrecalentador, donde
se calienta el vapor de 337 ˚C a la temperatura de salida, 537.8 ˚C, otra vez las calculaciones
principales resultaron en resultados un poco irrazonables. Se solucionó este problema en aumentar
el número de pasos de 2 a 4. Con 4 pasos, se calculó el área requerida de 26.3 m2 y 36 tubos de
cuatro pasos y un diámetro de 1.9 centimetros. El casco de estos tubos tiene un diámetro de 20.3
centimetros. Con la adición de 10% de área, la longitud final de los tubos es 3.35 m.
4.4.3 Las calculaciones para las dimensiones del evaporador
En el evaporador, el calor latente del agua saturada viene de la corriente de refrigerante –el
refrigerante calienta el agua saturada al punto de vaporización para crear vapor saturado. Es mucho
más complicado determinar el coeficiente de la capa exterior a causa de la ebullición en el
economizador. Cuando se considera un fluido hirviendo, es necesario considerar las fases
diferentes durante evaporación. Primero, el agua hierve por núcleo, en que burbujas pequeñas de
vapor se empiezan a fomar y una por una subir fuera de la superficie del tubo. Luego es la
transición, en que se forman burbujas más grandes más rápidamente, y se evaporan fuera del
líquido. Por fin, el agua hierve por la capa, en que una capa completa de vapor reemplaza el líquido
en la superficie del tubo. A causa de estos pasos diferentes, no se puede estimar el coeficiente de
la capa exterior en la misma manera que la del economizador. Debido a limitaciones en el tiempo,
se estimó el coeficiente para el economizador usando la Figura 10: 620 W/m·K. Con este coeficiete
y un diámetro de 1.9 centimetros, se usó el sistema de ecuaciones para las dimensiones del
economizador. Se calcularon un área requerida de 13.1 m2 y 36 tubos, encerrados en un casco de
20.32 centimetros. Con el factor de 10% para seguridad, la longitud total es 3.35 metros.
4.4.4 Las calculaciones para el tallaje del economizador
El economizador es la primera parte de la serie de intercambiadores en el sistema de producción
de vapor. En este intercambiador, se calienta el agua de 260 ˚C a la temperatura de saturación, 170
˚C. Se utiliza la parte más fría de la corriente de refrigerante porque requiere la cantidad más baja
de calor. Se intercambia aproximadamente 1.39 miliones J/s. Para calcular el área requerida para
la transferencia de calor, se determinó el coeficiente térmico total. A partir del intercambiador
primario, no se puede aplicar el valor calculado con datos del MSRE en esta calculación porque el
fluido del lado del casco no es el combustible de sal. Para determinar el coeficiente de la capa
exterior, se usaron las Ecuaciones 13 y 14, provistas en Fundamentals of Heat and Mass Transfer
(9.6 Empirical Correlations: External Free Convection Flows; 9.6.3 The Long Horizontal Cylinder,
2011). Se escogió un diámetro de 4.44 centimetros, y se determinó un coeficiente de 903 W/m·K.
Se creó un sistema de equaciones usando las Ecuaciones 6, 8-12, y las equaciones para áreas
interiores y exteriores para determinar el número de tubos y la longitud de los tubos. Se encontró
que el área requerida es 13.2 m2, lo que equipara a 22 tubos de dos pasos. Este número de tubos
requiere un casco de 25.4 centimetros, basada en los graficos provistos en la clase de ChE 4404
(Starr, 2014). Con la adicion de 10% en el área, la longitud final de los tubos es 3.3 m.
4.4.5 La comparación con la superficie del sistema actual de calderas
Para comparar el sistema del MSR diseñado para nuestro proyecto al sistema actual en WPI, y
mostrar el impacto de usar un MSR, se comparó a superficie de cada diseño. Usando los diámetros
calculados para los cascos como el ancho, y las longitudes de los tubos para la longitud, se
calcularan la superficie requerida para cada intercambiador en el sistema del MSR. Se encontró
que el intercambiador primario, el evaporador, el economizador, los sobrecalentadores A y B
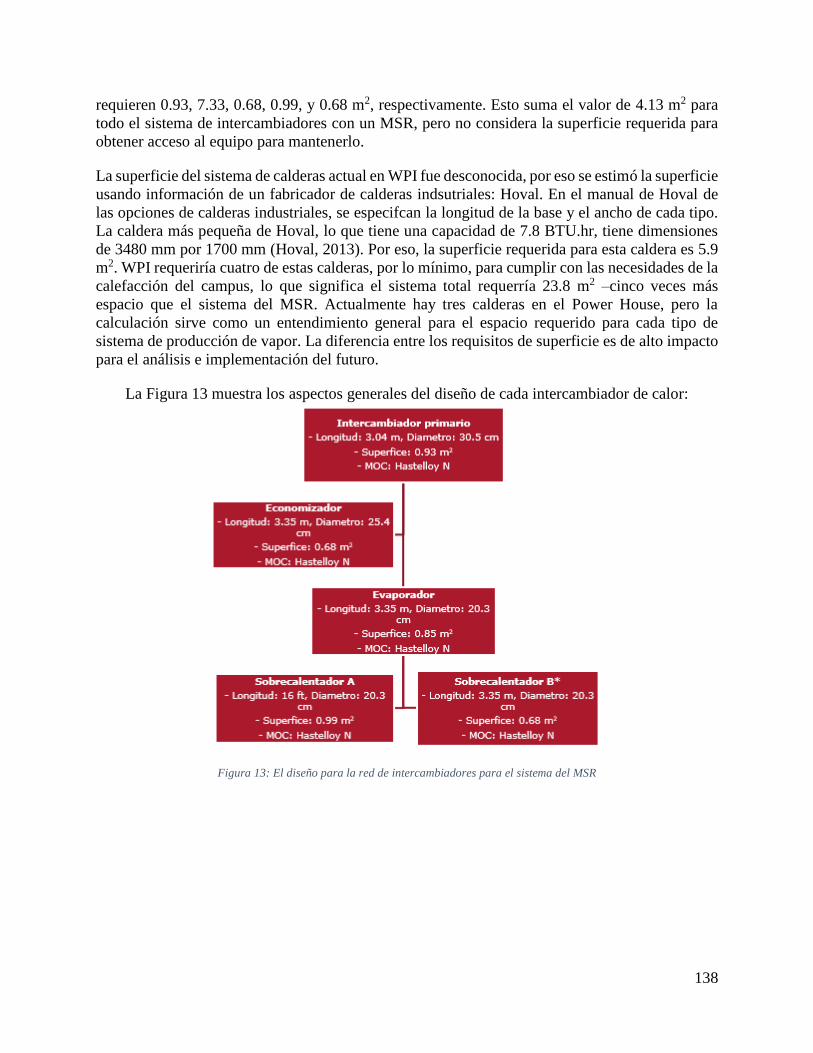
138
requieren 0.93, 7.33, 0.68, 0.99, y 0.68 m2, respectivamente. Esto suma el valor de 4.13 m2 para
todo el sistema de intercambiadores con un MSR, pero no considera la superficie requerida para
obtener acceso al equipo para mantenerlo.
La superficie del sistema de calderas actual en WPI fue desconocida, por eso se estimó la superficie
usando información de un fabricador de calderas indsutriales: Hoval. En el manual de Hoval de
las opciones de calderas industriales, se especifcan la longitud de la base y el ancho de cada tipo.
La caldera más pequeña de Hoval, lo que tiene una capacidad de 7.8 BTU.hr, tiene dimensiones
de 3480 mm por 1700 mm (Hoval, 2013). Por eso, la superficie requerida para esta caldera es 5.9
m2. WPI requeriría cuatro de estas calderas, por lo mínimo, para cumplir con las necesidades de la
calefacción del campus, lo que significa el sistema total requerría 23.8 m2 –cinco veces más
espacio que el sistema del MSR. Actualmente hay tres calderas en el Power House, pero la
calculación sirve como un entendimiento general para el espacio requerido para cada tipo de
sistema de producción de vapor. La diferencia entre los requisitos de superficie es de alto impacto
para el análisis e implementación del futuro.
La Figura 13 muestra los aspectos generales del diseño de cada intercambiador de calor:
Figura 13: El diseño para la red de intercambiadores para el sistema del MSR
139
CONCLUSIÓN Y RECOMENDACIONES
Después de determinar la calefacción requerida en WPI y evaluar y diseñar un sistema de
producción de vapor, se puede concluir que un reactor de sales fundidas es una solución seductora
para resolver los problemas del sistema actual. MSRs presentan ventajas económicas, tecnológicas
y medioambientales. Nuestro proyecto fue el primer paso en evaluar el uso de un MSR para la
producción de vapor y la posibilidad de implementar un MSR en un campus de una universidad.
Hay muchos pasos siguientes para continuar las investigaciones y eventualmente implementar la
construcción. Se categorizó las recomendaciones para trabajos del futuro en dos partes: el diseño
del circuito y la implementación en campus. Las investigaciones sobre el diseño del circuito se
deben enfocar en mejorar y refinar cada aspecto del diseño del sistema de producción de vapor.
La implementación en campus se debe enfocar en los aspectos económicos y políticos asociados
con un reactor nuevo, así como los planes de instalación y operación.
Como fue mencionado, nuestro proyecto fue el primer paso en diseñar un circuito de producción
de vapor para WPI, usando un MSR como una fuente de calor. Las investigaciones del futuro se
deben enfocar en aprovechar cada aspecto del diseño presentado en nuestro proyecto. Porque el
diseño del MSRE no puede satisfacer las necesidades de calefacción en WPI, es necesario diseñar
un reactor nuevo para el campus. Se determinó la producción térmica adecuada para el reactor,
además los flujos de combustible y refrigerante. Pero se debe continuar investigaciones en el
diseño del núcleo y el amplio del reactor de 10MW a 12MW. Más que eso, el MSRE concluyó en
los 1960s, menos de veinte años después del comienzo de investigaciones sobre energía nuclear.
Hoy en día, 50 años más tarde, no hay duda que hay mejoras potenciales en el diseño del núcleo.
Las investigaciones futuras también se deben enfocar en el diseño del sistema entero: tanques de
contención, válvulas de congelación, bombas, tubería, etc. El uso de un MSR presenta una opción
interesante para el diseño de las bombas. Un estudio, presentado en el International Conference
on Optimization of Electrical and Electronic Equipment en 2010, investigó la posibilidad de
bombas auto operativas con el uso de la naturaleza convectiva y electromagnética de las sales
fundidas (Etay, Fireteanu, Fautrelle, & Roman, 2010). Esto presenta otra ventaja del diseño del
sistema con un MSR porque mejora la seguridad y reduce los costos de electricidad.
Además del diseño del equipo, hay posibilidades para mejorar mucho la tecnología del
combustible y el material de construcción en el sistema del MSR. Un aspecto importante en usar
un reactor nuclear en el campus no solo radica en determinar el mejor combustible en términos de
composición, sino también los materiales de construcción para que sean eficiencias de costes. El
MSRE investigó muchos tipos de combustibles antes de terminar sus funciones, cada uno tuvo
composiciones diferentes de fluoruro de berilio, fluoruro de litio, fluoruro de zirconio, fluoruro de
torio, y tetrafluoruro de uranio (Haubenreich & Engel, 1970). Se debe continuar estas
investigaciones para determinar la mejor opción para WPI. También se puede continuar las
investigaciones sobre los materiales en el núcleo y otro equipo. Aunque el MSRE usó Hastelloy N
exitosamente, es muy caro. Es posible que hoy en día hay materiales más barratos y efectivos que
se puede usar en el diseño para WPI.
Por fin, en las investigaciones sobre el diseño del circuito, es importante usar un software de
simulación que tiene la habilidad de simular química nuclear, temperaturas altas, y las propiedades
únicas de sales fundidas. El software de simulación de Aspen Plus nos dio un entendimiento básico
de algunas propiedades térmicas en el vapor y el generador de vapor. Pero, tuvimos dificultades
140
en simular la transferencia de calor con sales fundidas, por eso no pudimos simular el sistema
entero del MSR. Para diseñar el mejor sistema para WPI, es importante usar otro software más
avanzado para probar diseños.
Después de diseñar el sistema entero, WPI puede empezar el proceso de implementar el reactor en
el campus. La implementación también requiere investigaciones extensivas. Antes de construir el
reactor en el campus, se deben enfocar en muchos aspectos de implementación. Primero, con el
diseño con los materiales y equipo necesario, es importante hacer un análisis de costes para el
proyecto, incluyendo construcción, instalación, y costes loborales. Un análisis de costes también
ayuda en la comparación entre el sistema actual en WPI y el sistema del MSR para determinar los
beneficios del MSR económicamente. Más que eso, hay muchos requisitos para autorización para
centrales químicos, especialmente para reactores nucleares. Después de establecer las dimensiones
del reactor, se debe empezar investigaciones sobre la ubicación del reactor en el campus, la
conexión al sistema actual, las regulaciones de usar el reactor en el campus. Implementacion es
muchos años en el futuro, por eso hay bastante tiempo para que los empleados del Power House
reciban el entrenamiento necesario.
En general, el MSR es una tecnología prometadora para la producción de vapor en WPI. Aunque
hay muchos pasos e investigaciones futuros antes de implementar un reactor actual en el campus,
nuestro proyecto ha mostrado que es importante considerar la tecnología de MSR como opción
para mejorar la producción de vapor en WPI. Mas importante, la implementación de un reactor
nuclear para la producción de vapor en un campus universitario tendría un impacto significantivo
en el mundo de tecnología. WPI tiene una tradición de innovación y siempre se esfuerza por estar
en la vanguardia de avances tecnológicos. En traer un MSR al campus, WPI continuaría esta
tradición.

141
REFERENCIAS
9.6 Empirical Correlations: External Free Convection Flows; 9.6.3 The Long Horizontal Cylinder.
(2011). In T. L. Bergman, A. S. Lavine, F. P. Incropera, & D. P. Dewitt, Fundamentals of
Heat and Mass Transfer (7th ed., pp. 604-613). United States: John Wiley & Sons, Inc.
Adames, A. A. (2010). Design COnsiderations of a 15kW Heat Exchanger for the CSPonD
Project. Boston: Adrian A. Adams.
AspenTech. (2014). Reduce Captial Costs and Improve Efficiency by Sizing and Modeling Heat
Exchangers in Aspen Plus and Aspen HYSYS. Retrieved from AspenTech Support.
Clark, W. M. (2014). Review of Heat Transfer. Retrieved from blackboard.wpi.edu:
https://my.wpi.edu/webapps/portal/frameset.jsp?tab_tab_group_id=_2_1&url=%2Fweba
pps%2Fblackboard%2Fexecute%2Flauncher%3Ftype%3DCourse%26id%3D_66853_1%
26url%3D
Environmental Protection Agency. (2013). Climate Change and Indicators in the United States.
Etay, J., Fireteanu, V., Fautrelle, Y., & Roman, C. (2010). Electromagnetic Pumping of Molten
Salts. International Conference on Optimization of Electrical and Electronic Equipment.
Fishlock, D. (2006). Voyage of the PWR. Nuclear Engineering International, 38-40.
Generation IV International Forum. (2013). Annual Report 2013.
Grudzinski, B. (2014, November 18). Further Power House Information. (K. Devaney,
Interviewer)
Grudzinski, B. (2014, November 7). WPI Power House Steam Production Information. (K.
Devaney, Interviewer)
Hargraves, R., & Moir, R. (2010). Liquid Fluoride Thorium Reactors - An old idea in nuclear
power gets reexamined. American Scientist, 304-313.
Haubenreich, P. N., & Engel, J. R. (1970). Experience With the Molten Salt Reactor Experiment.
Nuclear Applications and Technology, 118-136.
Haynes International. (2008). Hastelloy X Alloy. Kokomo, IN: Haynes International Global
Headquarters.
Holdren, J. P. (1991). Population and the Energy Problem.
Hoval. (2013). Industrial Boilers. Lichtenstein.
Ignatiev, V., Feynberg, O., Gnidoi, I., Merzlyakov, A., Surenkov, A., Uglov, V., . . . Osipenko, A.
(2014). Molten salt actinide recycler and transforming system without and with Th-U
142
support: Fuel cycle flexibility and key material properties. Annals of Nuclear Energy, 64,
408-420.
Kok, K. D. (2009). Nuclear Engineering Handbook. New York: CRC Press.
Nuclear Regulatory Commission. (2014, October 6). Storage of Spent Nuclear Fuel. Retrieved
from U.S. NRC: http://www.nrc.gov/waste/spent-fuel-storage.html
Power Reactors. (2013, December). Retrieved from United States Nuclear Regulatory
Commission: http://www.nrc.gov/reactors/power.html
Robertson, R. C. (1965). MSRE Design and Operations Report Part I Description of Reactor
Design. Oak Ridge National Laboratory. Oak Ridge, TN: Oak Ridge National Laboratory.
Rosenthal, M. W., Kasten, P. R., & Briggs, R. B. (1970). Molten-salt Reactors - History, Status,
and Potential. Nuclear Applications & Technology, 107-117.
Shultis, J. K., & Faw, R. E. (2002). Fundamentals of Nuclear Science and Engineering. New York:
Marcel Dekker, Inc.
Spirax-Sarco. (2014). Steam Tables. Retrieved from Spirax Sarco USA:
http://www2.spiraxsarco.com/us/resources/steam-tables.asp
Starr, T. (2014, November 24). CHE 4404 Lecture on Heat Exchanger Sizing. Worcester, MA.
Teir, S. (2003). Basics of Steam Generation. In S. Teir, Steam Boiler Technology eBook (2 ed.).
Energy Engineering and Environmental Protection Publications.
The National Academy of Sciences. (2014). What you Need to Know about Energy- Emerging
Technologies. Retrieved from http://needtoknow.nas.edu/energy/energy-
sources/emerging-technologies/
Theriault, K. (2009). Boiling Water Reactors (BWRs). In K. D. Kok (Ed.), Nuclear Engineering
Handbook (eBook ed., pp. 83-139). CRC Press.
Transatomic Power Corporation. (2014, October). Retrieved from Transatomic Power:
http://transatomicpower.com/
Turton, R., Bailie, R. C., Whiting, W. B., Shaeiwitz, J. A., & Bhattacharyya, D. (2012). Analysis,
Synthesis and Design of Chemical Processes (Kindle Fire ed.). Boston: Prentice Hall.
Turton, R., Bailie, R., Whiting, W., Shaeiwitz, J., & Bhattacharyya, D. (2013). Analysis, Synthesis,
and Design of Chemical Processes. Boston: Prenticce Hall.
U.S. Energy Informatio Administration (EIA). (2014). International Energy Outlook 2014.
Washington, DC: EIA.
Westinghouse Electric Corporation Water Reactor Divisions. (1984). The Westinghouse
Pressurized Water Reactor Nuclear Power Plant.

143
Wood, J. (2007). Nuclear Power. Institution of Engineering and Technology.
Worcester Polytechnic Institute. (2014, Dec 12). Campus Maps. Retrieved from wpi.edu:
http://www.wpi.edu/Images/CMS/University-About/WPI_2-D_Map_2014__web.pdf
World Nuclear Association. (1996). Physics of Uranium and Nuclear Energy. Retrieved from
http://www.world-nuclear.org/info/Nuclear-Fuel-Cycle/Introduction/Physics-of-Nuclear-
Energy/
World Nuclear Association. (2014, October 8). Supply of Uranium. Retrieved from World Nuclear
Association: http://www.world-nuclear.org/info/Nuclear-Fuel-Cycle/Uranium-
Resources/Supply-of-Uranium/
World Nuclear Association. (2014, November). World Energy Needs and Nuclear Power.
Retrieved from World Nuclear Association: http://www.world-nuclear.org/info/Current-
and-Future-Generation/World-Energy-Needs-and-Nuclear-Power/
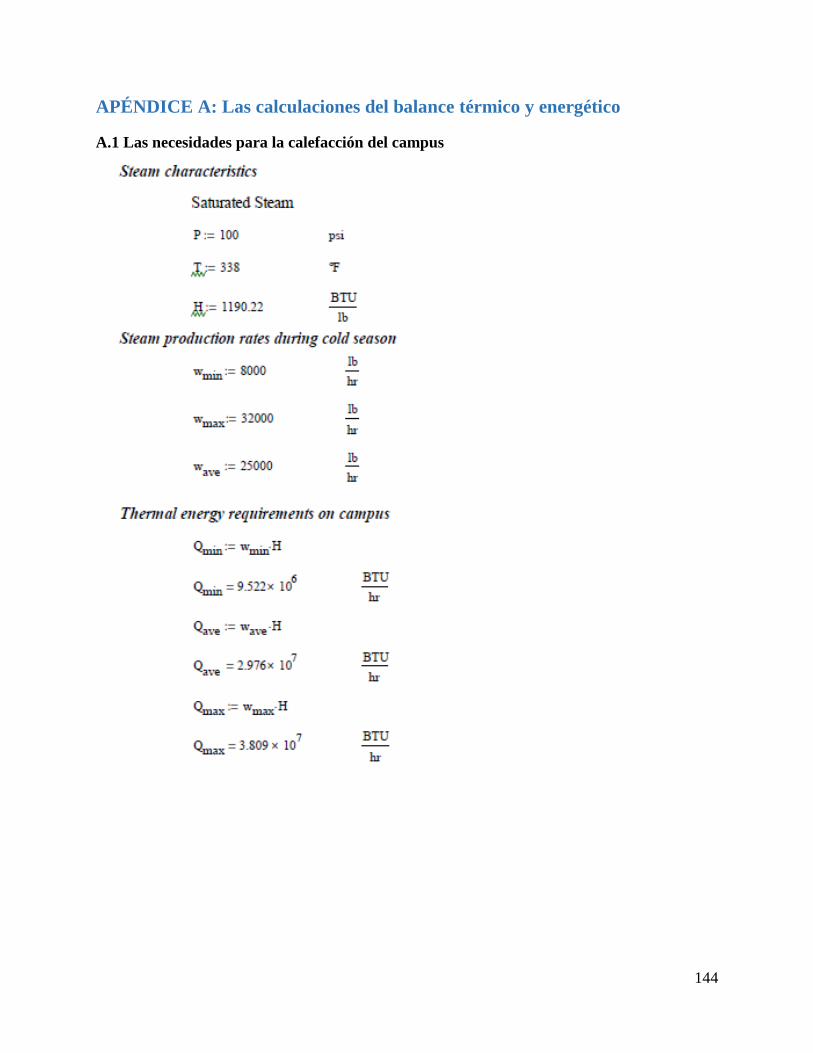
144
APÉNDICE A: Las calculaciones del balance térmico y energético
A.1 Las necesidades para la calefacción del campus
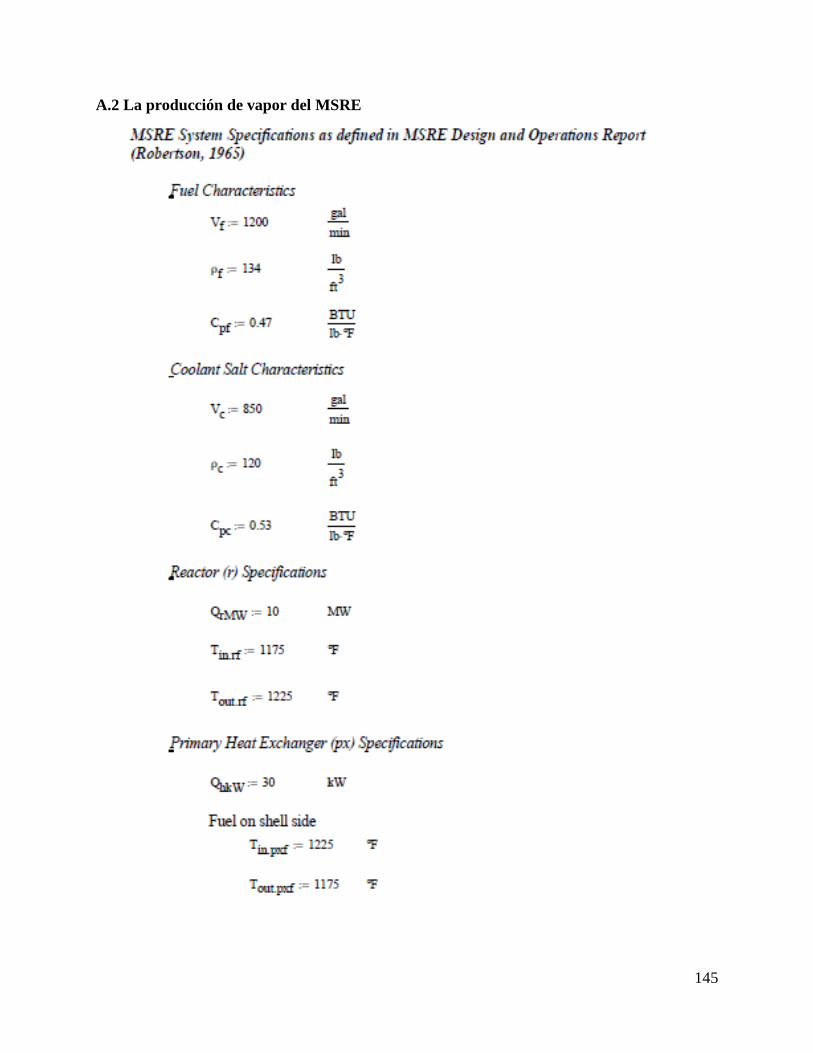
145
A.2 La producción de vapor del MSRE
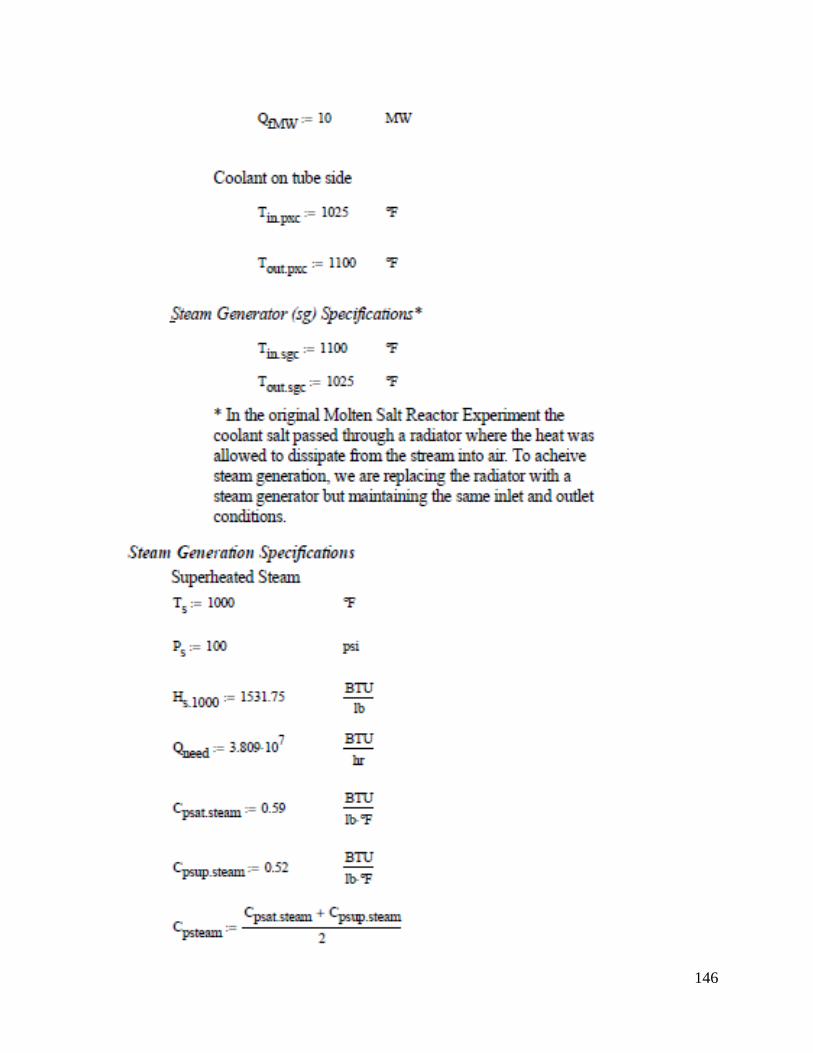
146

147

148

149
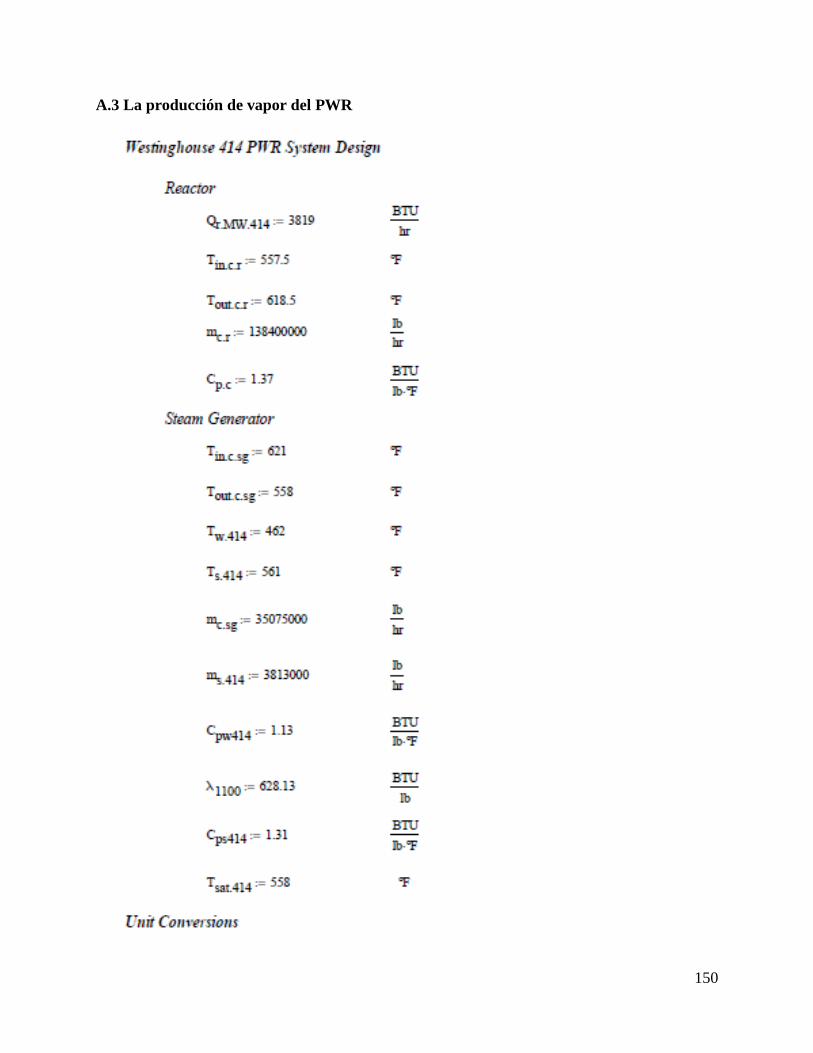
150
A.3 La producción de vapor del PWR
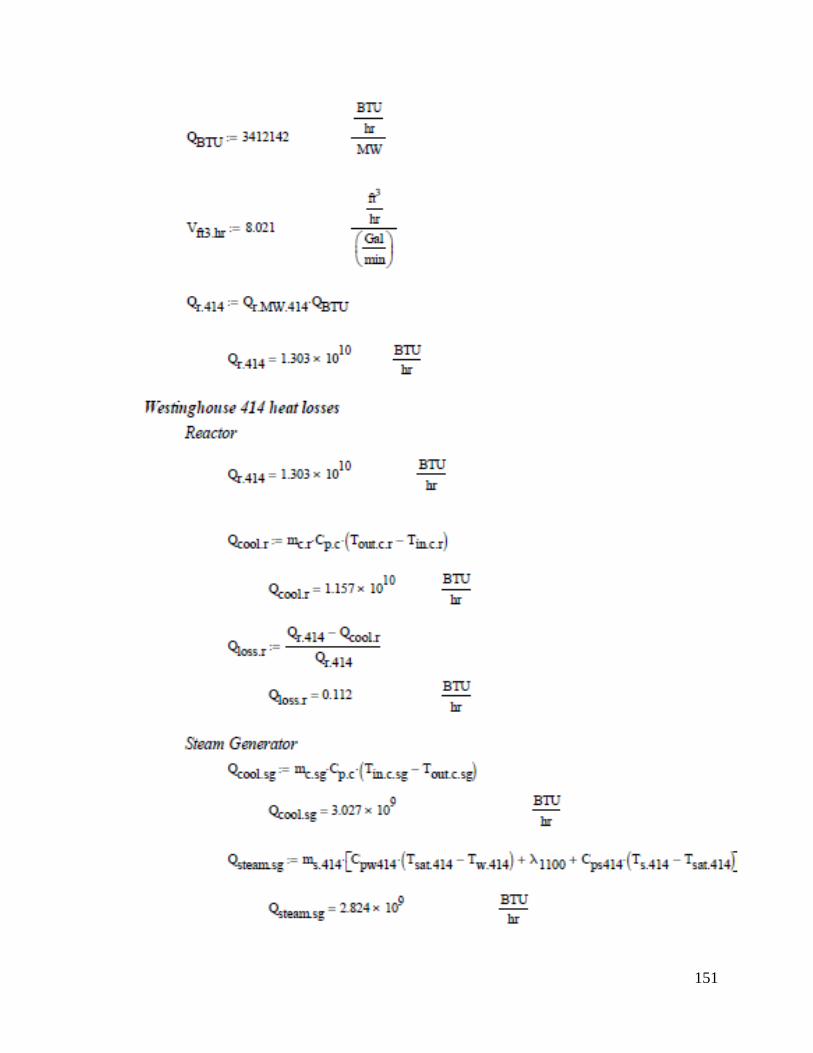
151

152

153
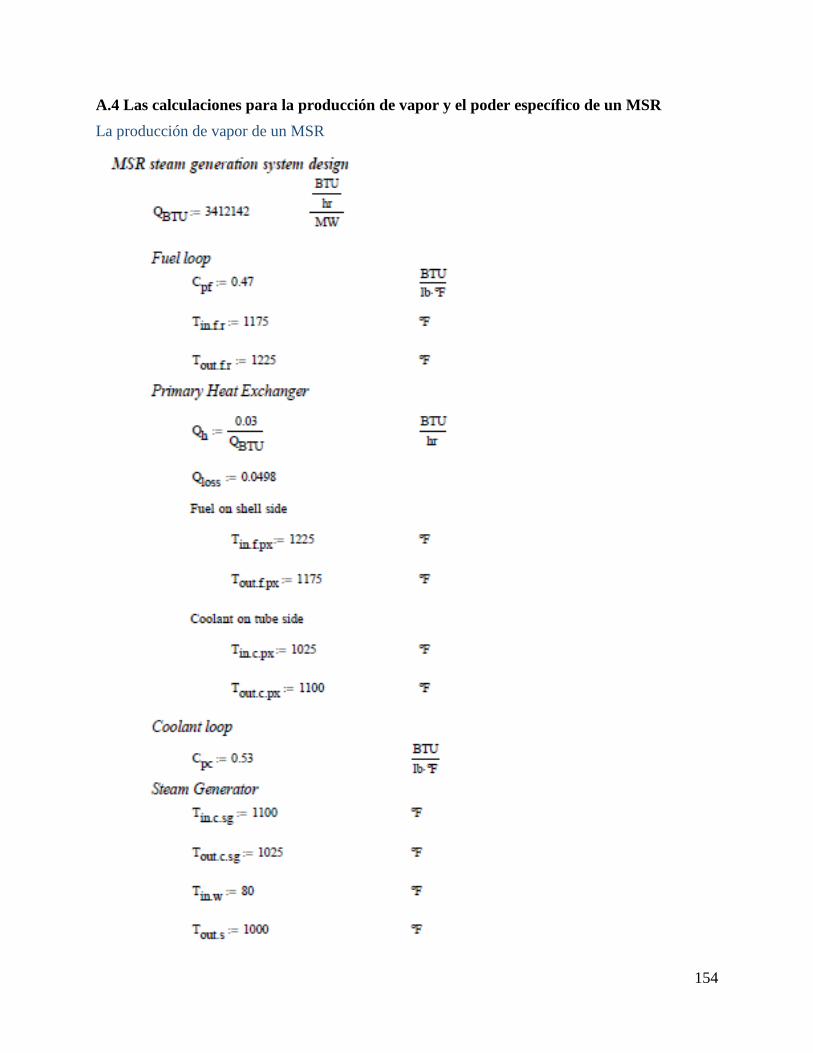
154
A.4 Las calculaciones para la producción de vapor y el poder específico de un MSR
La producción de vapor de un MSR
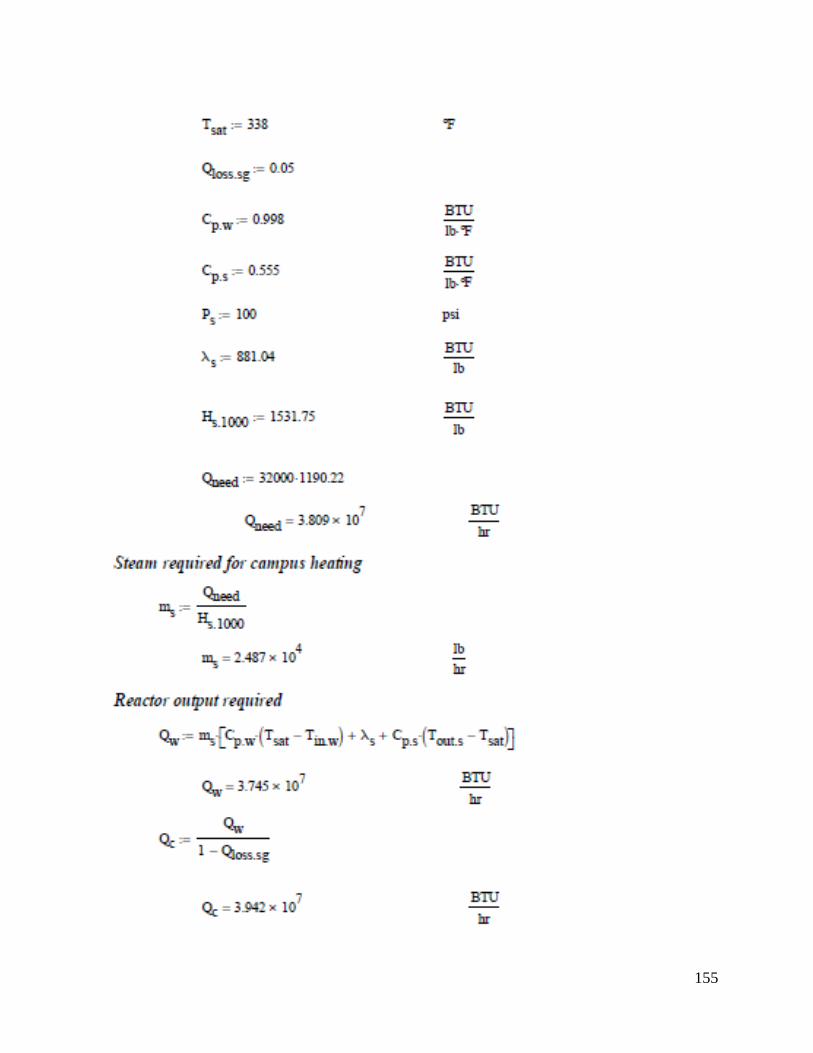
155
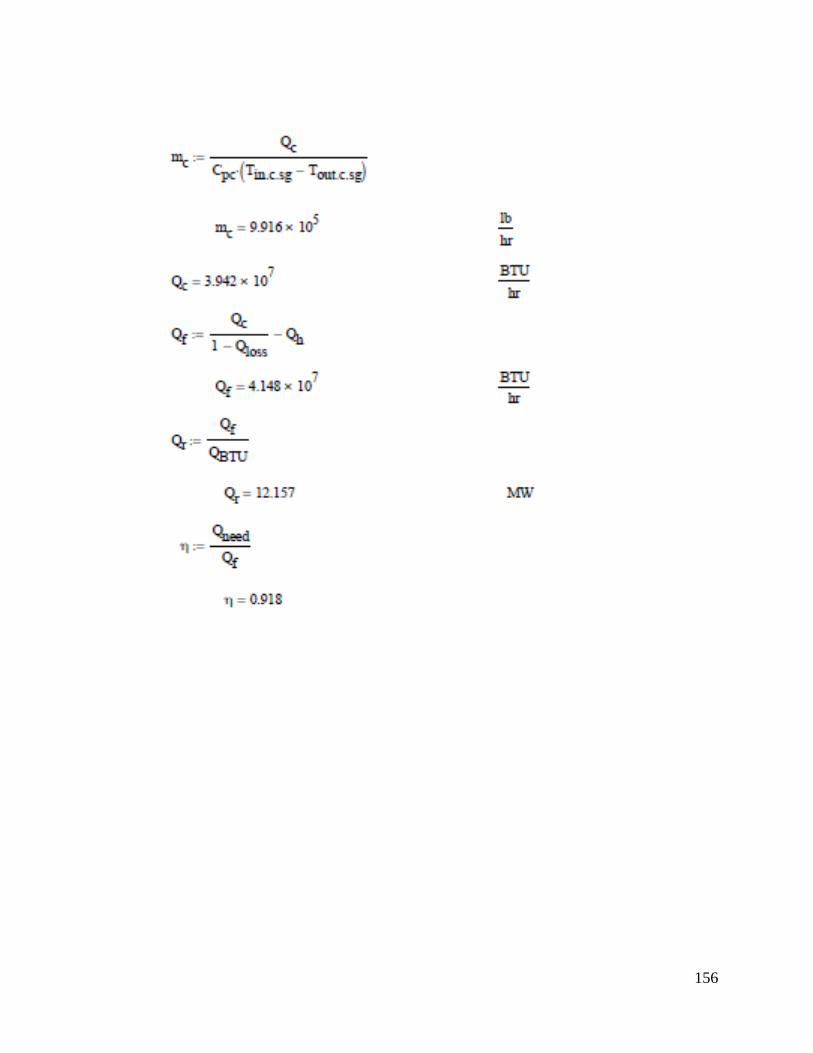
156

157
Poder específico del MSRE
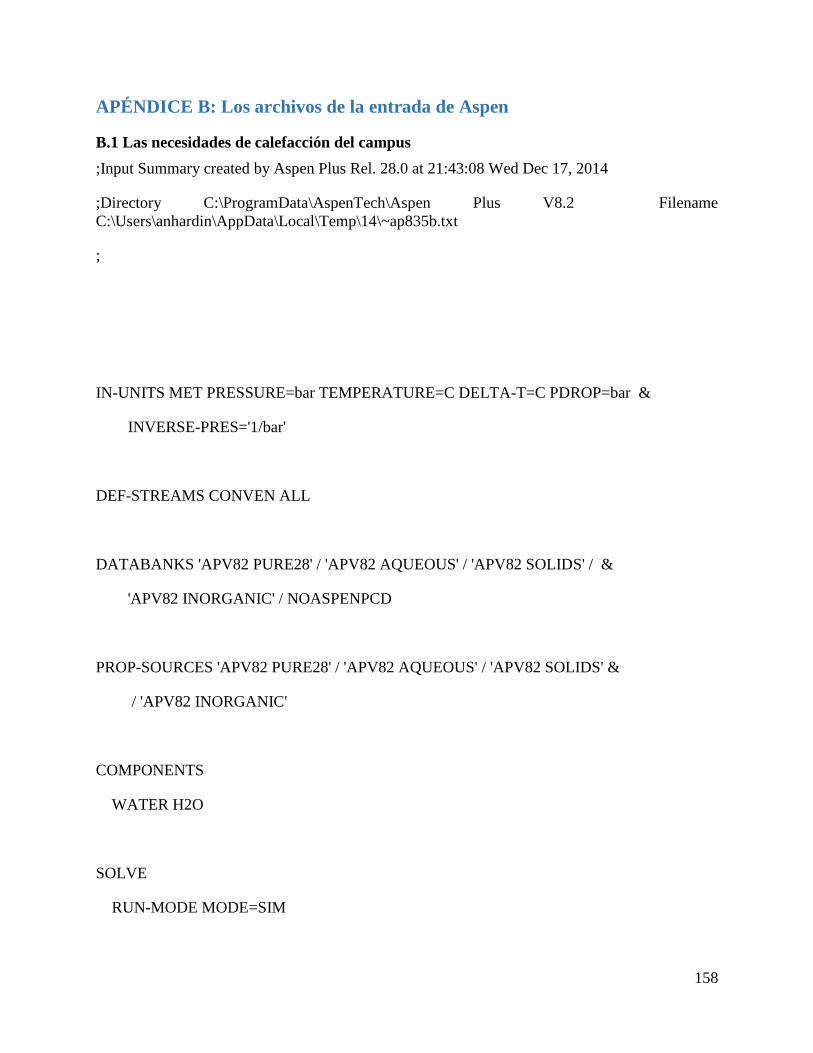
158
APÉNDICE B: Los archivos de la entrada de Aspen
B.1 Las necesidades de calefacción del campus
;Input Summary created by Aspen Plus Rel. 28.0 at 21:43:08 Wed Dec 17, 2014
;Directory C:\ProgramData\AspenTech\Aspen Plus V8.2 Filename
C:\Users\anhardin\AppData\Local\Temp\14\~ap835b.txt
;
IN-UNITS MET PRESSURE=bar TEMPERATURE=C DELTA-T=C PDROP=bar &
INVERSE-PRES='1/bar'
DEF-STREAMS CONVEN ALL
DATABANKS 'APV82 PURE28' / 'APV82 AQUEOUS' / 'APV82 SOLIDS' / &
'APV82 INORGANIC' / NOASPENPCD
PROP-SOURCES 'APV82 PURE28' / 'APV82 AQUEOUS' / 'APV82 SOLIDS' &
/ 'APV82 INORGANIC'
COMPONENTS
WATER H2O
SOLVE
RUN-MODE MODE=SIM
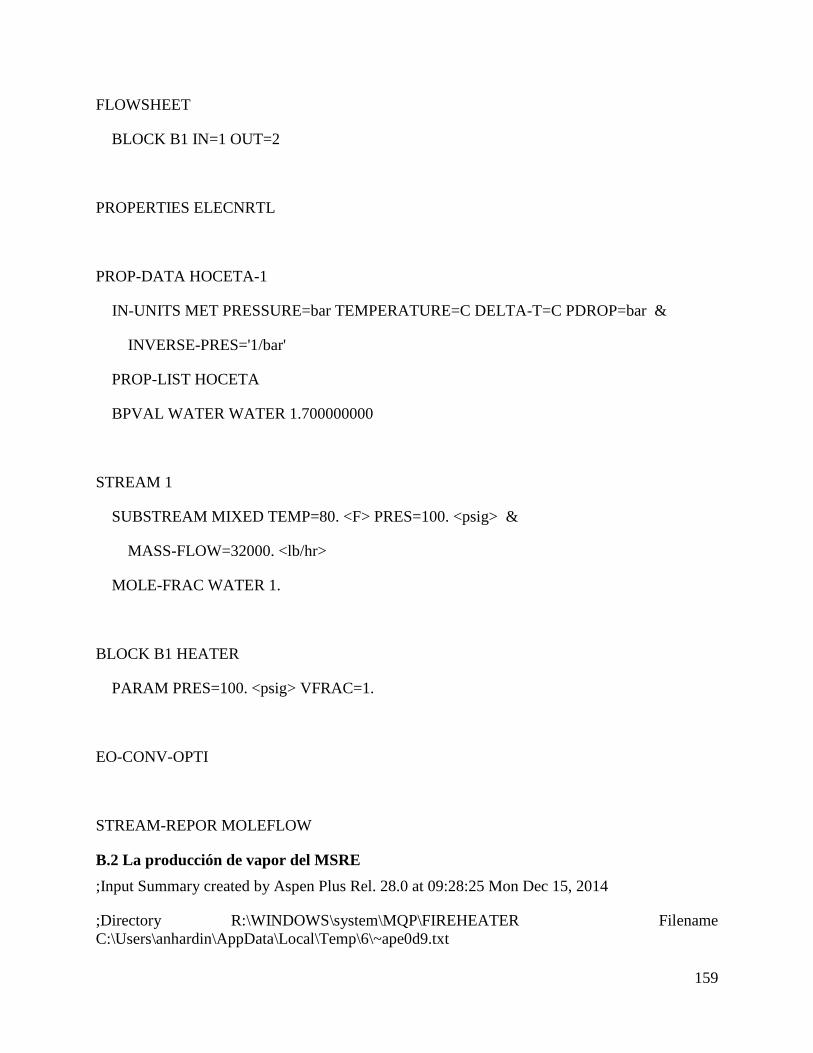
159
FLOWSHEET
BLOCK B1 IN=1 OUT=2
PROPERTIES ELECNRTL
PROP-DATA HOCETA-1
IN-UNITS MET PRESSURE=bar TEMPERATURE=C DELTA-T=C PDROP=bar &
INVERSE-PRES='1/bar'
PROP-LIST HOCETA
BPVAL WATER WATER 1.700000000
STREAM 1
SUBSTREAM MIXED TEMP=80. <F> PRES=100. <psig> &
MASS-FLOW=32000. <lb/hr>
MOLE-FRAC WATER 1.
BLOCK B1 HEATER
PARAM PRES=100. <psig> VFRAC=1.
EO-CONV-OPTI
STREAM-REPOR MOLEFLOW
B.2 La producción de vapor del MSRE
;Input Summary created by Aspen Plus Rel. 28.0 at 09:28:25 Mon Dec 15, 2014
;Directory R:\WINDOWS\system\MQP\FIREHEATER Filename
C:\Users\anhardin\AppData\Local\Temp\6\~ape0d9.txt

160
IN-UNITS MET PRESSURE=bar TEMPERATURE=C DELTA-T=C PDROP=bar &
INVERSE-PRES='1/bar'
DEF-STREAMS CONVEN ALL
DATABANKS 'APV82 PURE28' / 'APV82 AQUEOUS' / 'APV82 SOLIDS' / &
'APV82 INORGANIC' / NOASPENPCD
PROP-SOURCES 'APV82 PURE28' / 'APV82 AQUEOUS' / 'APV82 SOLIDS' &
/ 'APV82 INORGANIC'
COMPONENTS
WATER H2O /
LITHI-01 LIF /
BERYL-01 BEF2 /
URANI-01 UF4
SOLVE
RUN-MODE MODE=SIM
FLOWSHEET
BLOCK PRIMARY IN=3 1 OUT=4 2
BLOCK STEAMGEN IN=5 OUT=6
BLOCK HEATER IN=4 OUT=9
161
PROPERTIES ELECNRTL
PROP-DATA REVIEW-1
IN-UNITS MET PRESSURE=bar TEMPERATURE=C DELTA-T=C PDROP=bar &
INVERSE-PRES='1/bar'
PROP-LIST DHVLB / PC / TC / VC / ZC
PVAL LITHI-01 32.5 / 689 / 3223 / 4220 / .5
PVAL BERYL-01 32.5 / 689 / 3223 / 4220 / .5
PROP-DATA HOCETA-1
IN-UNITS MET PRESSURE=bar TEMPERATURE=C DELTA-T=C PDROP=bar &
INVERSE-PRES='1/bar'
PROP-LIST HOCETA
BPVAL WATER WATER 1.700000000
STREAM 1
SUBSTREAM MIXED TEMP=1025. <F> PRES=47. <psig> &
VOLUME-FLOW=850. <gal/min>
MOLE-FRAC WATER 0. / LITHI-01 0.66 / BERYL-01 0.34 / &
URANI-01 0.
STREAM 3
SUBSTREAM MIXED TEMP=1225. <F> PRES=35. <psig> &
VOLUME-FLOW=1200. <gal/min>

162
MOLE-FRAC WATER 0. / LITHI-01 0.7 / BERYL-01 0.291 / &
URANI-01 0.009
STREAM 5
SUBSTREAM MIXED TEMP=80. <F> PRES=100. <psig> &
MASS-FLOW=27000. <lb/hr>
MOLE-FRAC WATER 1. / LITHI-01 0. / BERYL-01 0. / &
URANI-01 0.
BLOCK HEATER HEATER
PARAM PRES=55. <psig> DUTY=30. <kW>
BLOCK STEAMGEN HEATER
PARAM PRES=100. <psig> DEGSUP=662. <F>
BLOCK PRIMARY HEATX
PARAM T-COLD=1100. <F> MIN-TAPP=1. <F>
FEEDS HOT=3 COLD=1
OUTLETS-HOT 4
OUTLETS-COLD 2
EO-CONV-OPTI
SENSITIVITY S-1
DEFINE SGDUTY BLOCK-VAR BLOCK=STEAMGEN VARIABLE=NET-DUTY &
163
SENTENCE=RESULTS
TABULATE 1 "SGDUTY"
VARY STREAM-VAR STREAM=5 SUBSTREAM=MIXED VARIABLE=MASS-FLOW
RANGE LOWER="8000" UPPER="10000" NPOINT="10"
STREAM-REPOR MOLEFLOW
PROPERTY-REP NOPARAM-PLUS
B.3 La producción de vapor del PWR
;Input Summary created by Aspen Plus Rel. 28.0 at 09:50:17 Mon Dec 15, 2014
;Directory R:\WINDOWS\system\MQP\FIREHEATER Filename
C:\Users\anhardin\AppData\Local\Temp\6\~ape6a5.txt
;
IN-UNITS MET PRESSURE=bar TEMPERATURE=C DELTA-T=C PDROP=bar &
INVERSE-PRES='1/bar'
DEF-STREAMS CONVEN ALL
DATABANKS 'APV82 PURE28' / 'APV82 AQUEOUS' / 'APV82 SOLIDS' / &
'APV82 INORGANIC' / NOASPENPCD
PROP-SOURCES 'APV82 PURE28' / 'APV82 AQUEOUS' / 'APV82 SOLIDS' &
/ 'APV82 INORGANIC'

164
COMPONENTS
WATER H2O /
LITHI-01 LIF /
BERYL-01 BEF2 /
URANI-01 UF4
SOLVE
RUN-MODE MODE=SIM
FLOWSHEET
BLOCK PRIMARY IN=3 1 OUT=4 2
BLOCK STEAMGEN IN=5 OUT=6
BLOCK HEATER IN=4 OUT=9
PROPERTIES ELECNRTL
PROP-DATA REVIEW-1
IN-UNITS MET PRESSURE=bar TEMPERATURE=C DELTA-T=C PDROP=bar &
INVERSE-PRES='1/bar'
PROP-LIST DHVLB / PC / TC / VC / ZC
PVAL LITHI-01 32.5 / 689 / 3223 / 4220 / .5
PVAL BERYL-01 32.5 / 689 / 3223 / 4220 / .5
PROP-DATA HOCETA-1
165
IN-UNITS MET PRESSURE=bar TEMPERATURE=C DELTA-T=C PDROP=bar &
INVERSE-PRES='1/bar'
PROP-LIST HOCETA
BPVAL WATER WATER 1.700000000
STREAM 1
SUBSTREAM MIXED TEMP=1025. <F> PRES=47. <psig> &
VOLUME-FLOW=850. <gal/min>
MOLE-FRAC WATER 0. / LITHI-01 0.66 / BERYL-01 0.34 / &
URANI-01 0.
STREAM 3
SUBSTREAM MIXED TEMP=1225. <F> PRES=35. <psig> &
VOLUME-FLOW=1200. <gal/min>
MOLE-FRAC WATER 0. / LITHI-01 0.7 / BERYL-01 0.291 / &
URANI-01 0.009
STREAM 5
SUBSTREAM MIXED TEMP=80. <F> PRES=100. <psig> &
MASS-FLOW=27000. <lb/hr>
MOLE-FRAC WATER 1. / LITHI-01 0. / BERYL-01 0. / &
URANI-01 0.
BLOCK HEATER HEATER
PARAM PRES=55. <psig> DUTY=30. <kW>
166
BLOCK STEAMGEN HEATER
PARAM PRES=100. <psig> VFRAC=1.
BLOCK PRIMARY HEATX
PARAM T-COLD=1100. <F> MIN-TAPP=1. <F>
FEEDS HOT=3 COLD=1
OUTLETS-HOT 4
OUTLETS-COLD 2
EO-CONV-OPTI
SENSITIVITY S-1
DEFINE SGDUTY BLOCK-VAR BLOCK=STEAMGEN VARIABLE=NET-DUTY &
SENTENCE=RESULTS
TABULATE 1 "SGDUTY"
VARY STREAM-VAR STREAM=5 SUBSTREAM=MIXED VARIABLE=MASS-FLOW
RANGE LOWER="12000" UPPER="18000" NPOINT="10"
STREAM-REPOR MOLEFLOW
PROPERTY-REP NOPARAM-PLUS
B.4 La producción de vapor de un MSR
;Input Summary created by Aspen Plus Rel. 28.0 at 10:07:22 Mon Dec 15, 2014
;Directory R:\WINDOWS\system\MQP\FIREHEATER Filename
C:\Users\anhardin\AppData\Local\Temp\6\~ap884b.txt
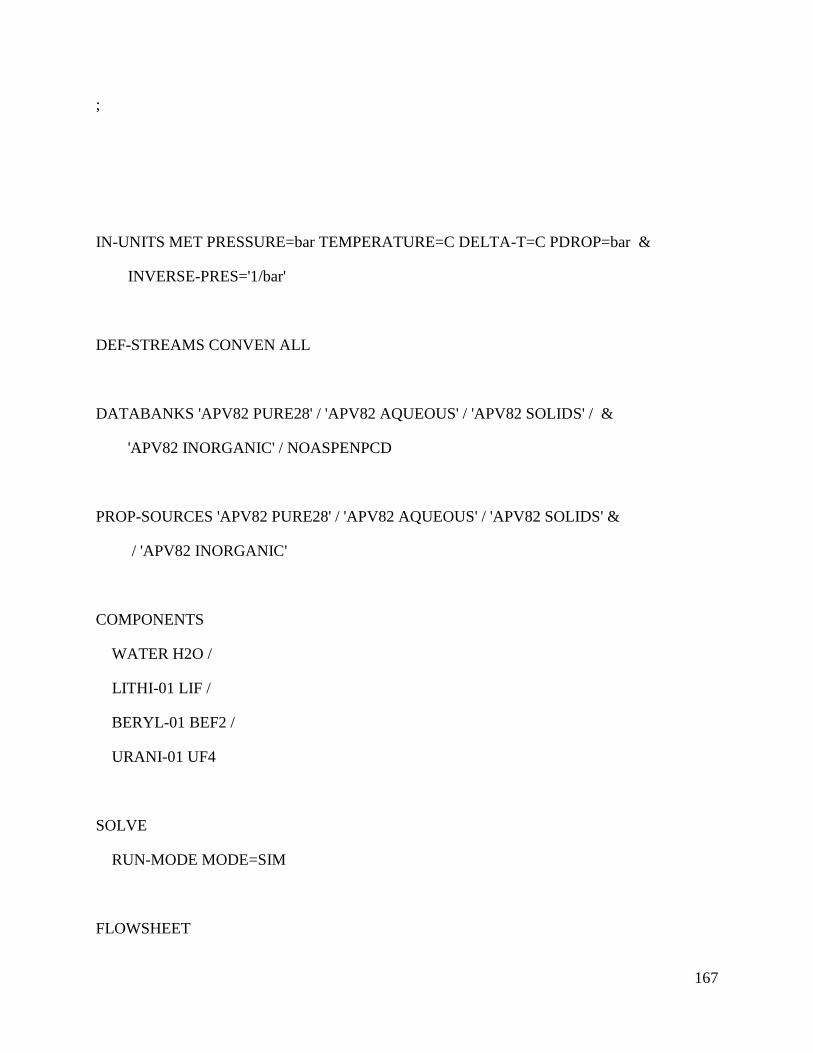
167
;
IN-UNITS MET PRESSURE=bar TEMPERATURE=C DELTA-T=C PDROP=bar &
INVERSE-PRES='1/bar'
DEF-STREAMS CONVEN ALL
DATABANKS 'APV82 PURE28' / 'APV82 AQUEOUS' / 'APV82 SOLIDS' / &
'APV82 INORGANIC' / NOASPENPCD
PROP-SOURCES 'APV82 PURE28' / 'APV82 AQUEOUS' / 'APV82 SOLIDS' &
/ 'APV82 INORGANIC'
COMPONENTS
WATER H2O /
LITHI-01 LIF /
BERYL-01 BEF2 /
URANI-01 UF4
SOLVE
RUN-MODE MODE=SIM
FLOWSHEET
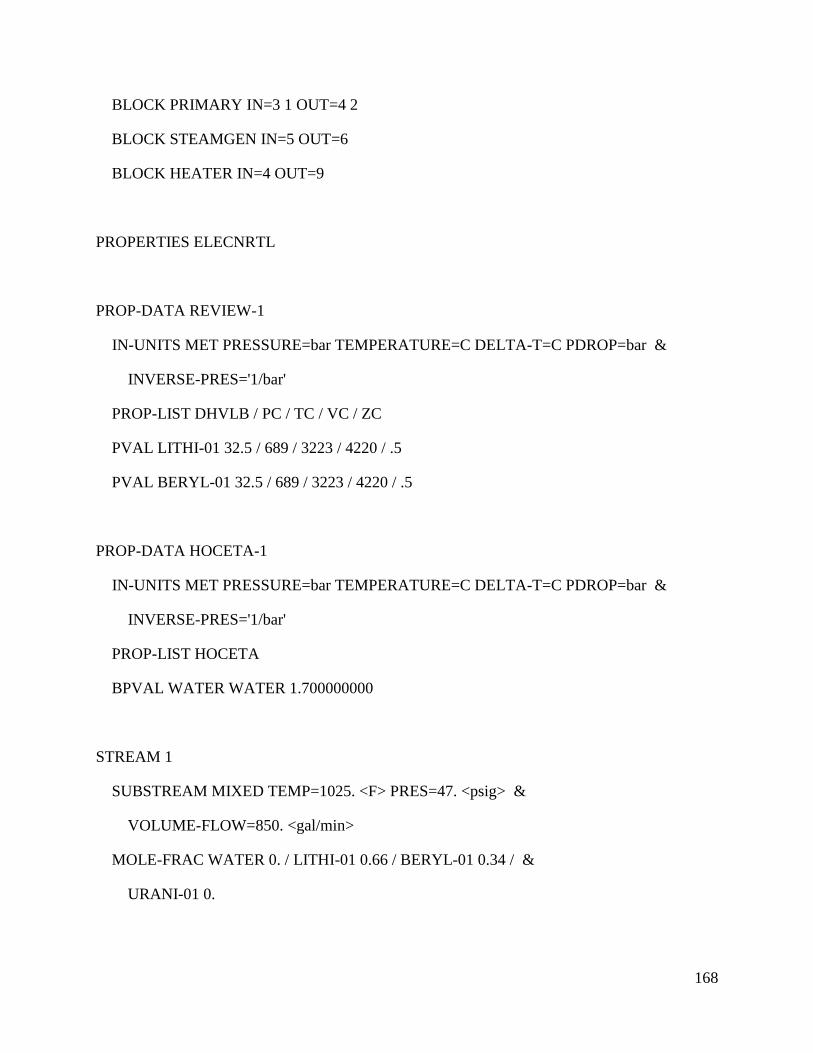
168
BLOCK PRIMARY IN=3 1 OUT=4 2
BLOCK STEAMGEN IN=5 OUT=6
BLOCK HEATER IN=4 OUT=9
PROPERTIES ELECNRTL
PROP-DATA REVIEW-1
IN-UNITS MET PRESSURE=bar TEMPERATURE=C DELTA-T=C PDROP=bar &
INVERSE-PRES='1/bar'
PROP-LIST DHVLB / PC / TC / VC / ZC
PVAL LITHI-01 32.5 / 689 / 3223 / 4220 / .5
PVAL BERYL-01 32.5 / 689 / 3223 / 4220 / .5
PROP-DATA HOCETA-1
IN-UNITS MET PRESSURE=bar TEMPERATURE=C DELTA-T=C PDROP=bar &
INVERSE-PRES='1/bar'
PROP-LIST HOCETA
BPVAL WATER WATER 1.700000000
STREAM 1
SUBSTREAM MIXED TEMP=1025. <F> PRES=47. <psig> &
VOLUME-FLOW=850. <gal/min>
MOLE-FRAC WATER 0. / LITHI-01 0.66 / BERYL-01 0.34 / &
URANI-01 0.
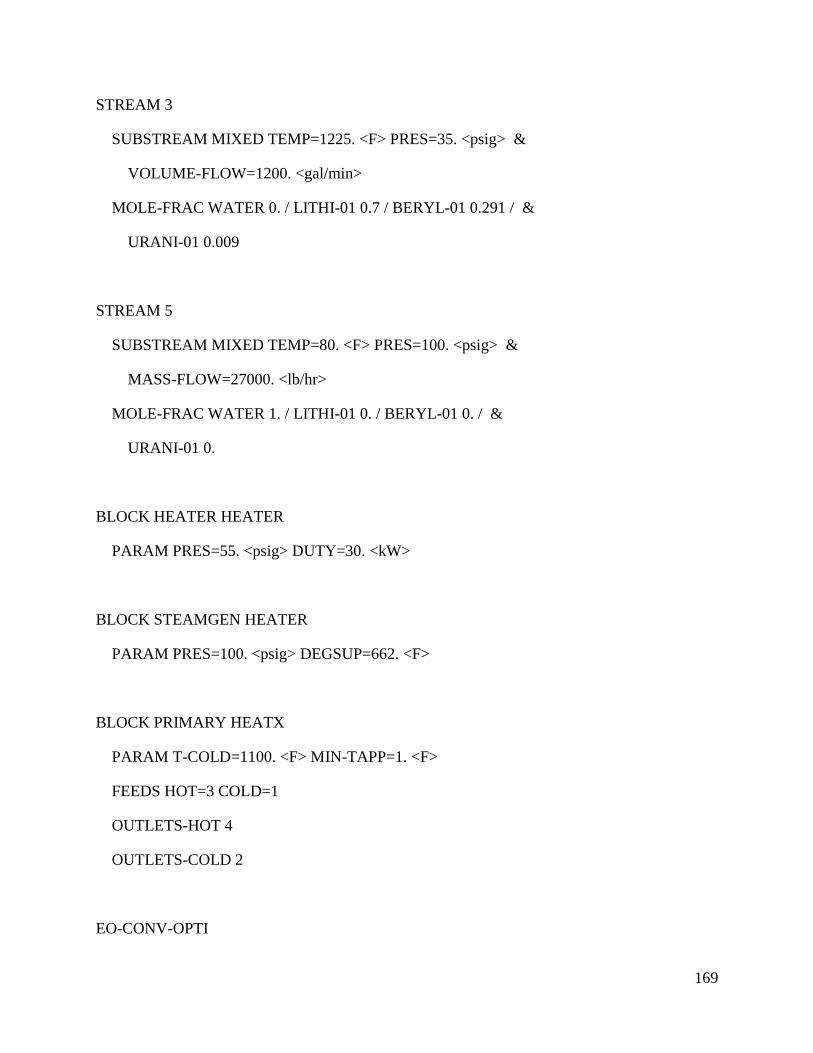
169
STREAM 3
SUBSTREAM MIXED TEMP=1225. <F> PRES=35. <psig> &
VOLUME-FLOW=1200. <gal/min>
MOLE-FRAC WATER 0. / LITHI-01 0.7 / BERYL-01 0.291 / &
URANI-01 0.009
STREAM 5
SUBSTREAM MIXED TEMP=80. <F> PRES=100. <psig> &
MASS-FLOW=27000. <lb/hr>
MOLE-FRAC WATER 1. / LITHI-01 0. / BERYL-01 0. / &
URANI-01 0.
BLOCK HEATER HEATER
PARAM PRES=55. <psig> DUTY=30. <kW>
BLOCK STEAMGEN HEATER
PARAM PRES=100. <psig> DEGSUP=662. <F>
BLOCK PRIMARY HEATX
PARAM T-COLD=1100. <F> MIN-TAPP=1. <F>
FEEDS HOT=3 COLD=1
OUTLETS-HOT 4
OUTLETS-COLD 2
EO-CONV-OPTI

170
SENSITIVITY S-1
DEFINE SGDUTY BLOCK-VAR BLOCK=STEAMGEN VARIABLE=DUTY &
SENTENCE=PARAM
TABULATE 1 "SGDUTY"
VARY STREAM-VAR STREAM=5 SUBSTREAM=MIXED VARIABLE=MASS-FLOW
RANGE LOWER="10000" UPPER="14000" NPOINT="10"
STREAM-REPOR MOLEFLOW
PROPERTY-REP NOPARAM-PLUS
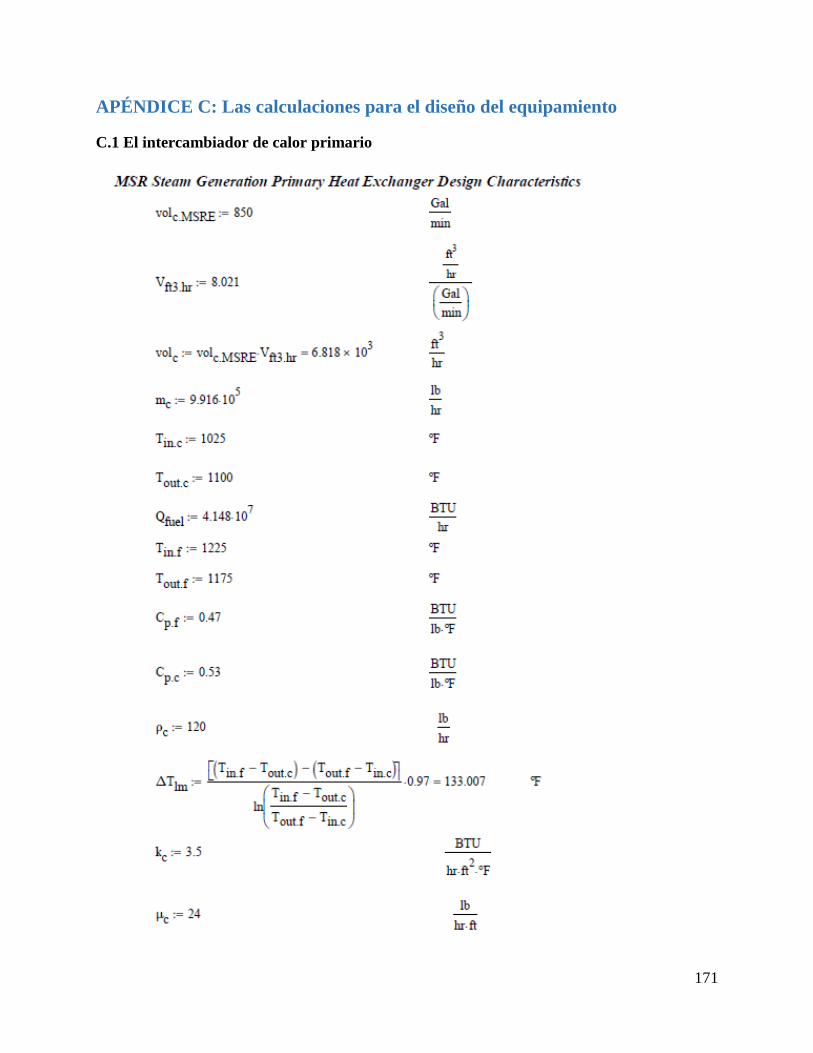
171
APÉNDICE C: Las calculaciones para el diseño del equipamiento
C.1 El intercambiador de calor primario

172
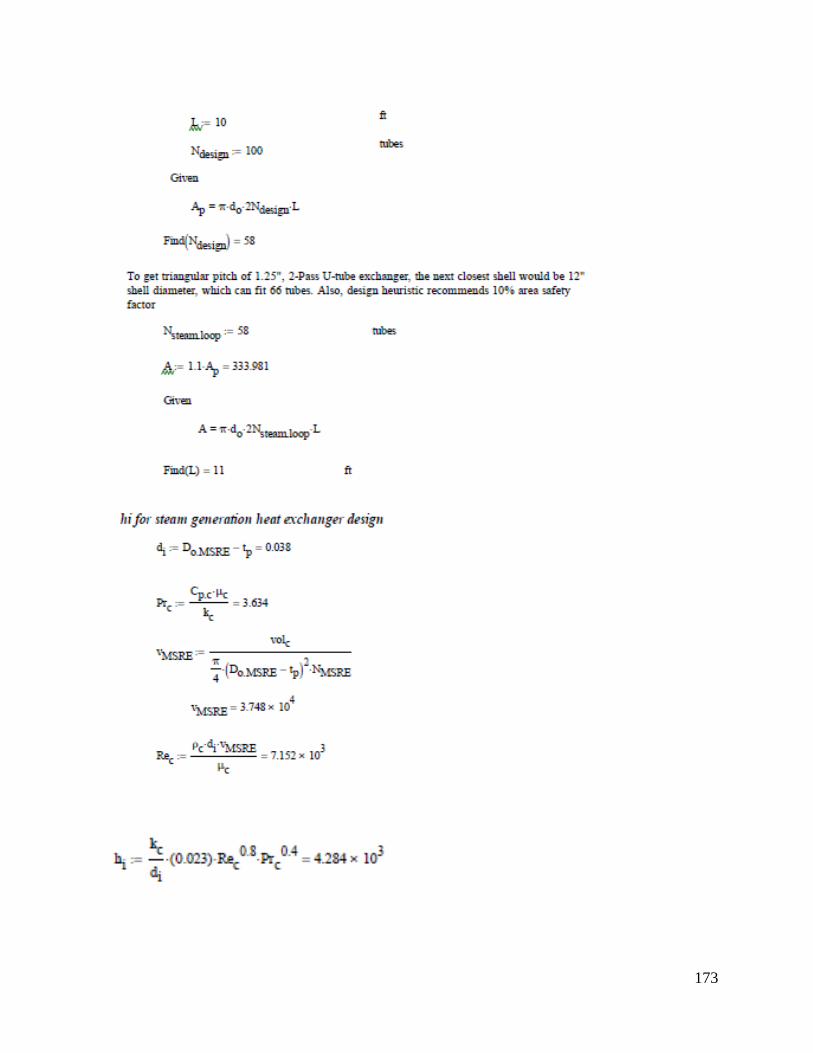
173
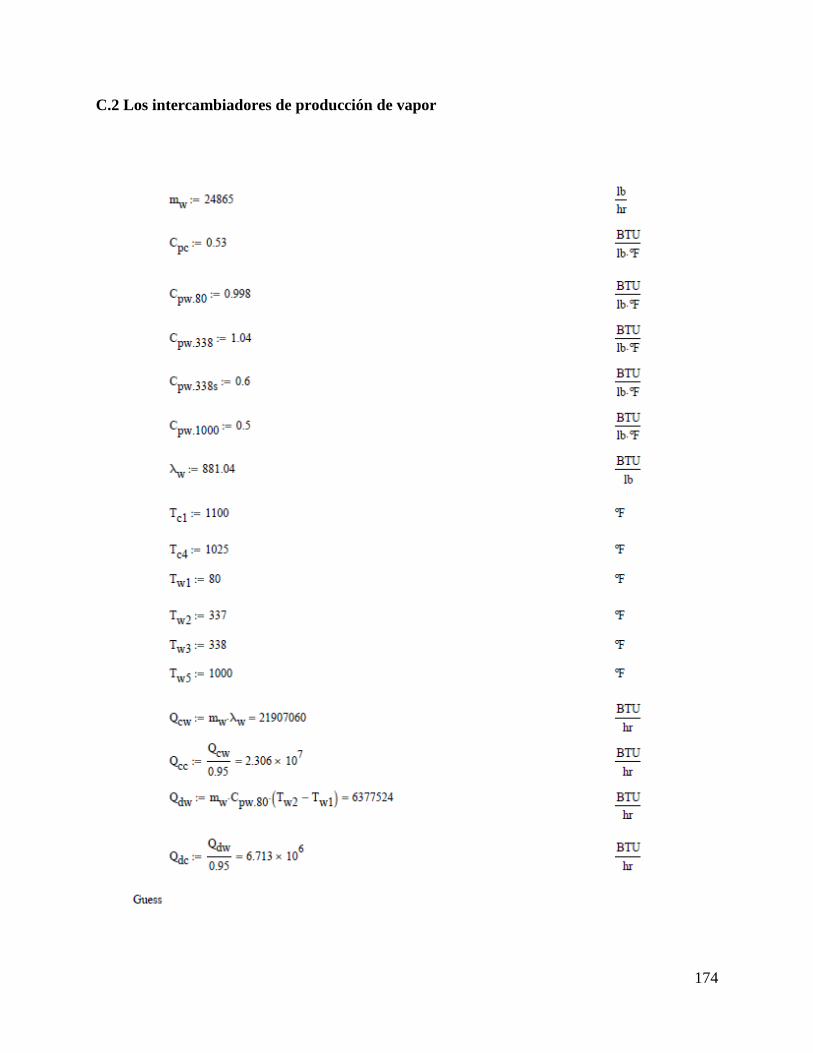
174
C.2 Los intercambiadores de producción de vapor

175
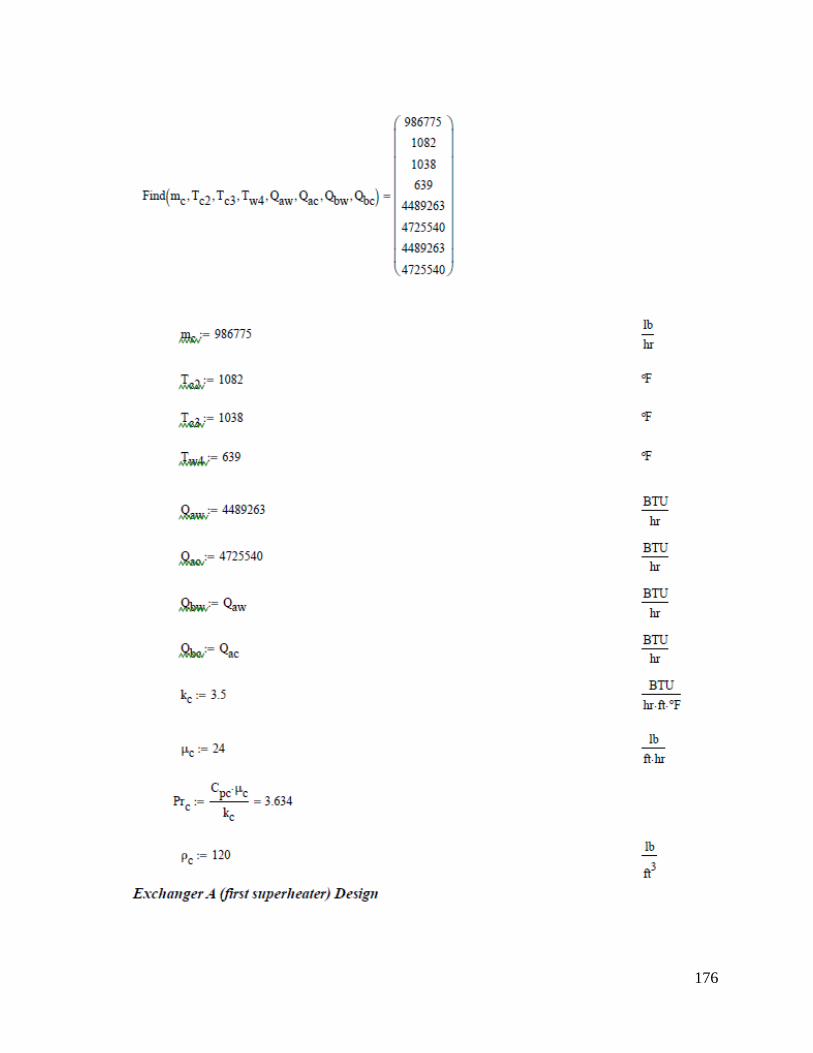
176

177
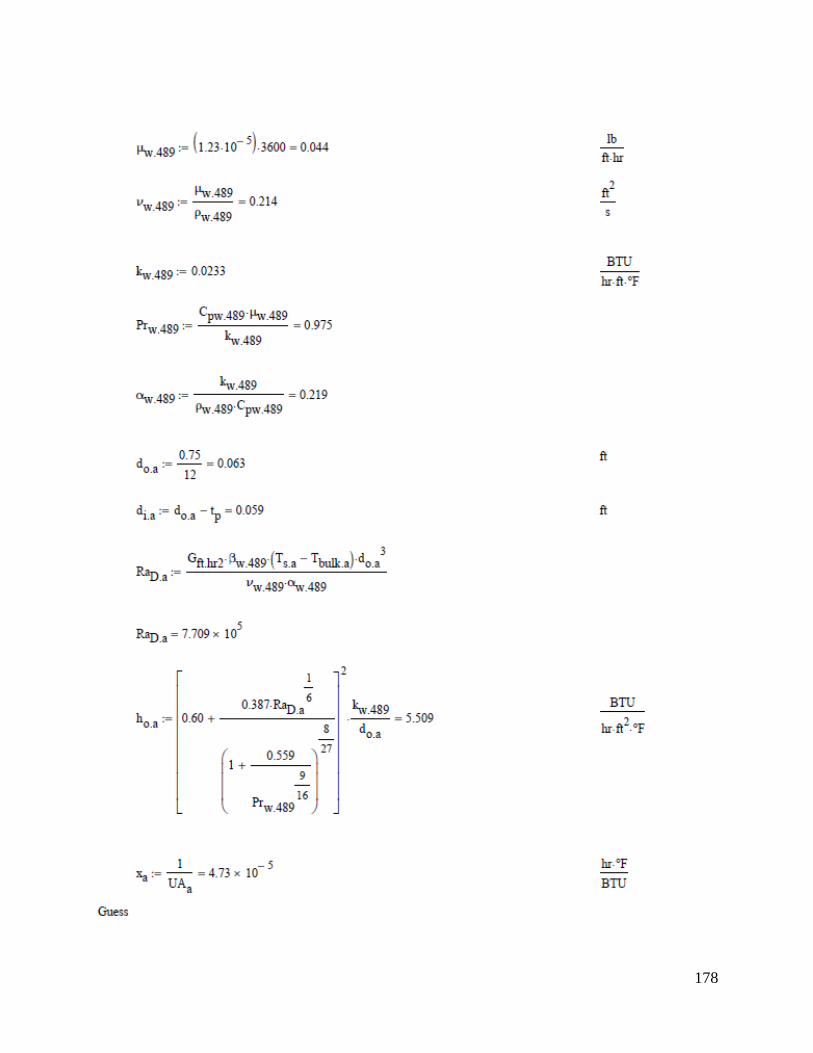
178
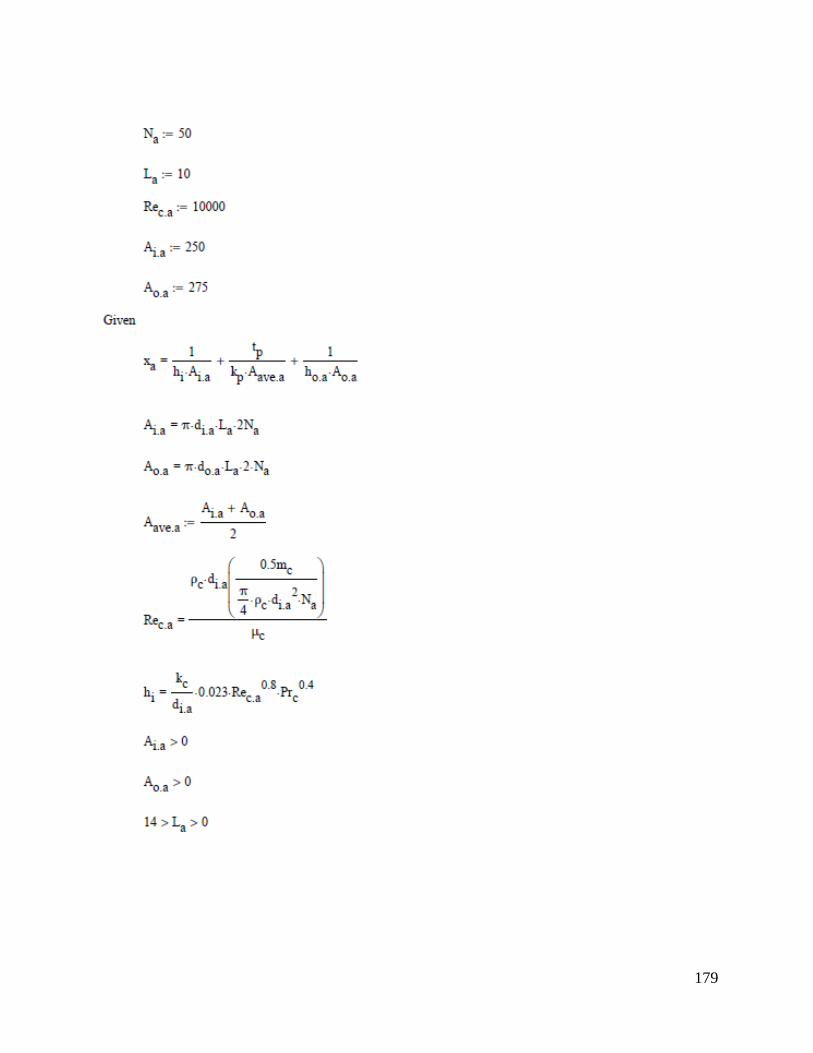
179
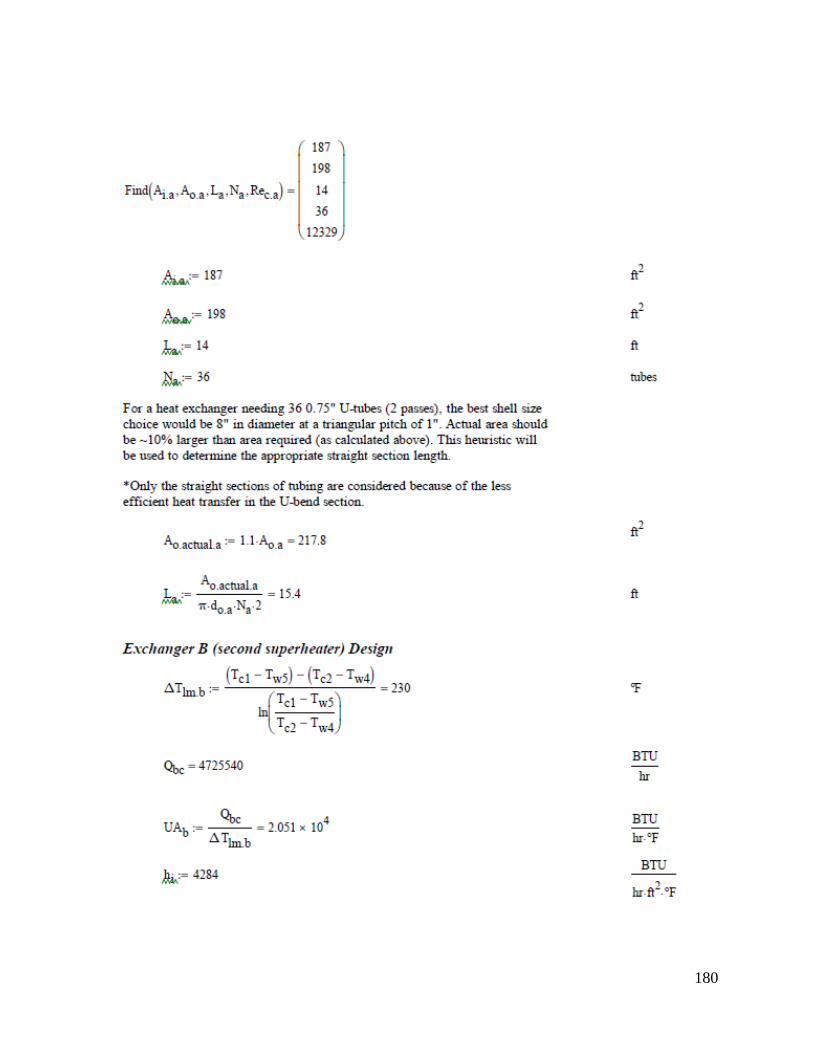
180
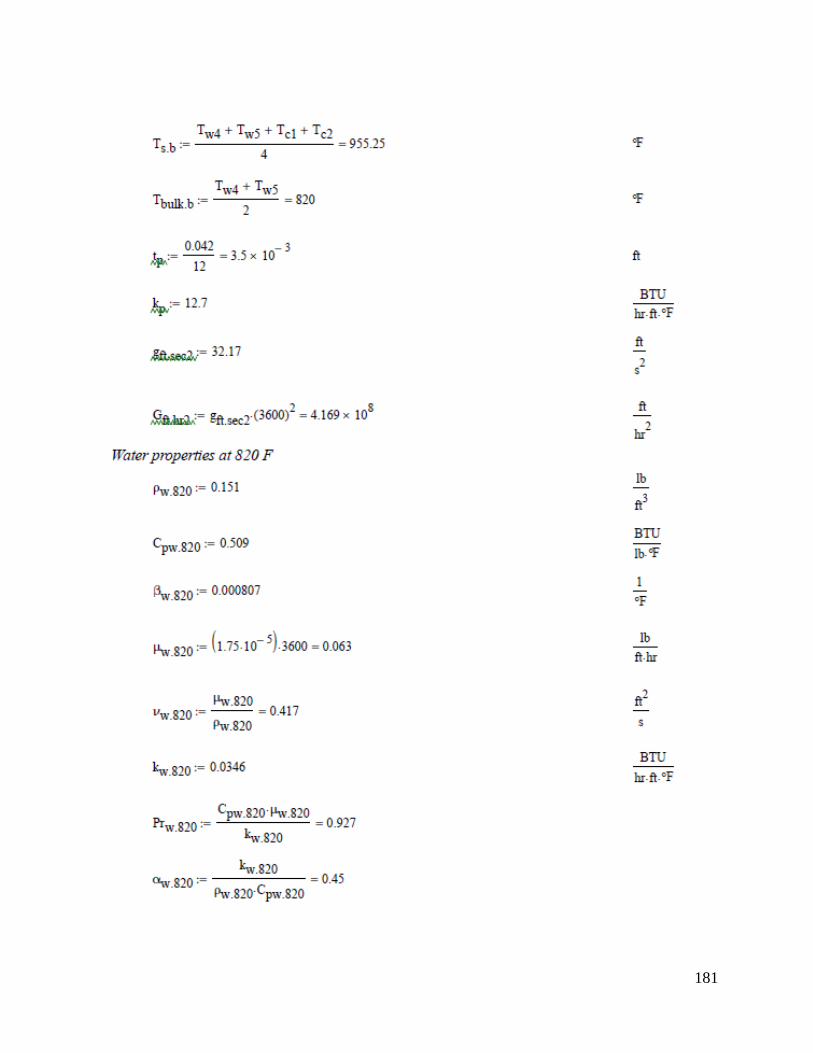
181
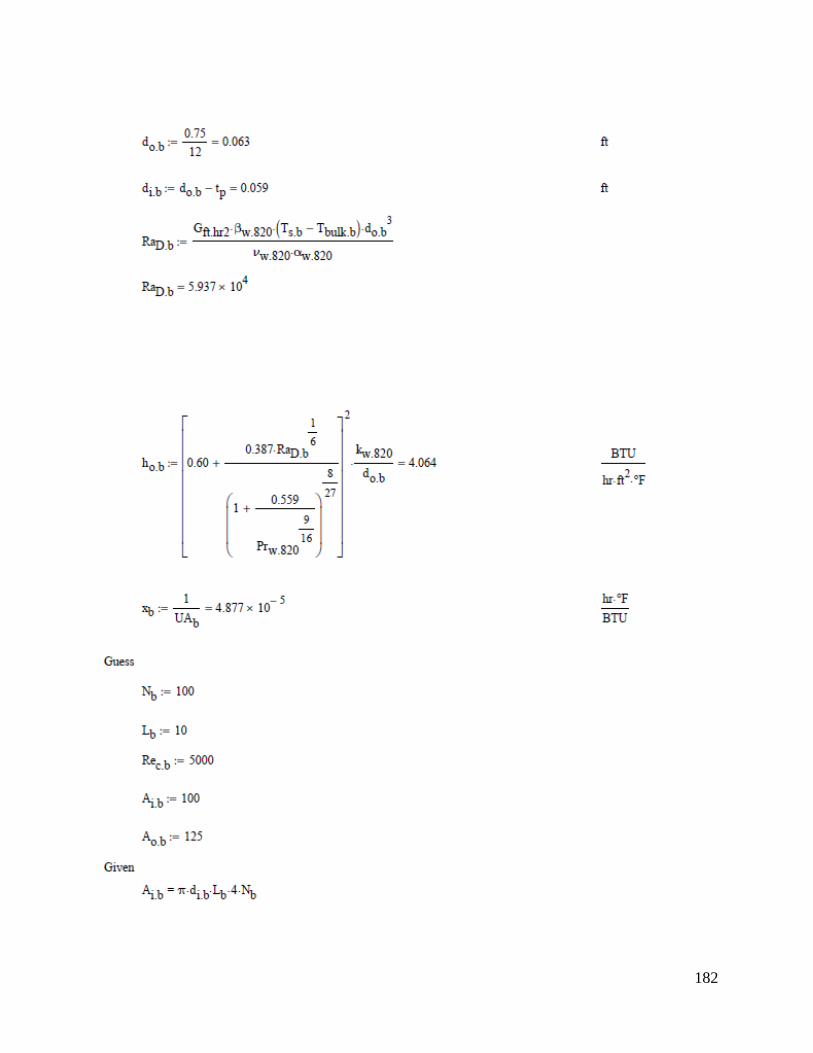
182

183

184
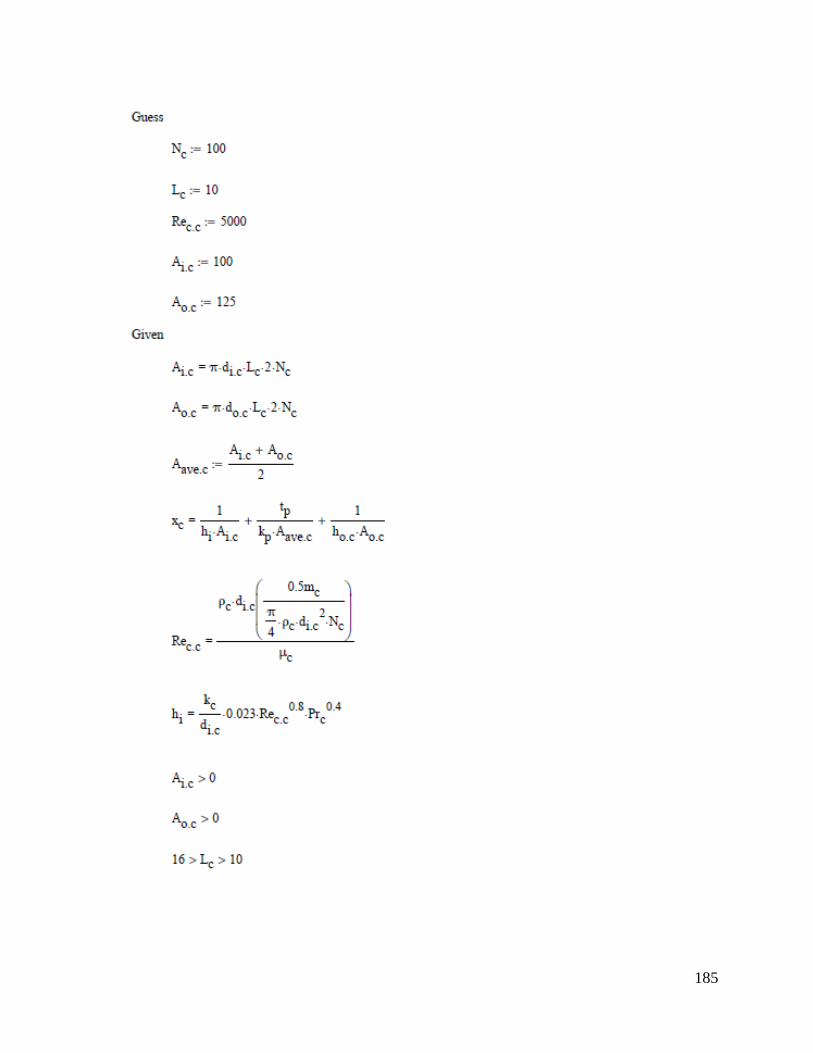
185
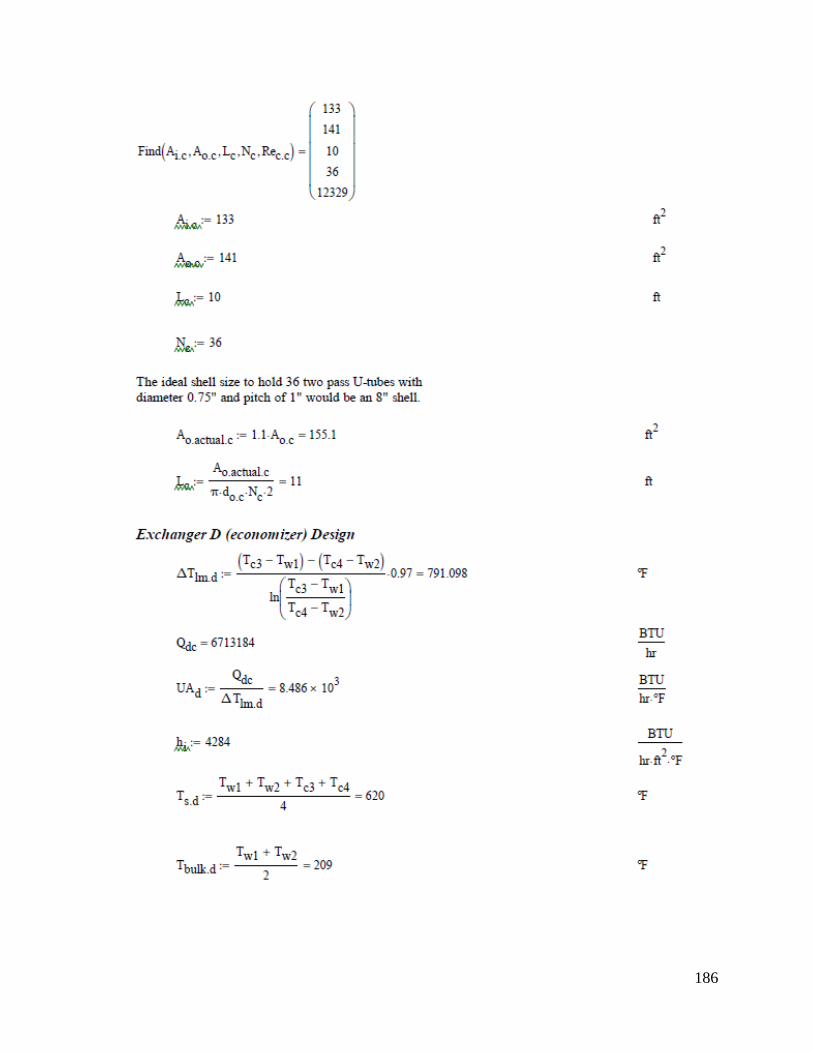
186
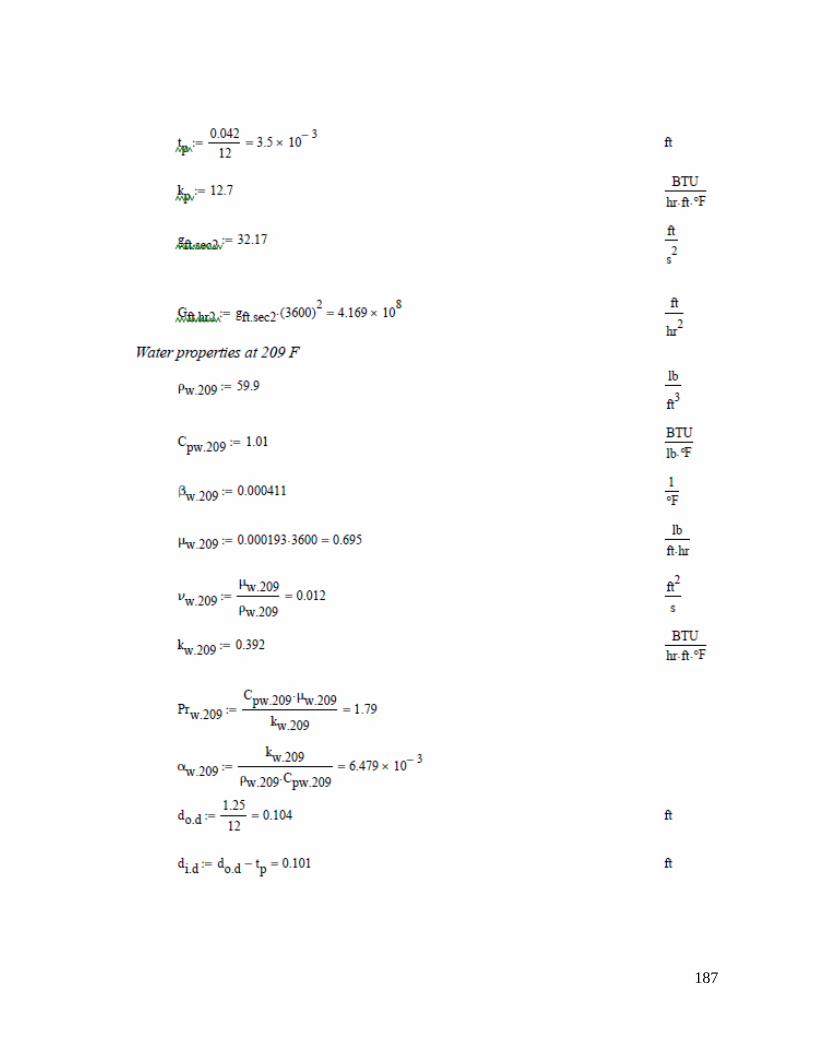
187
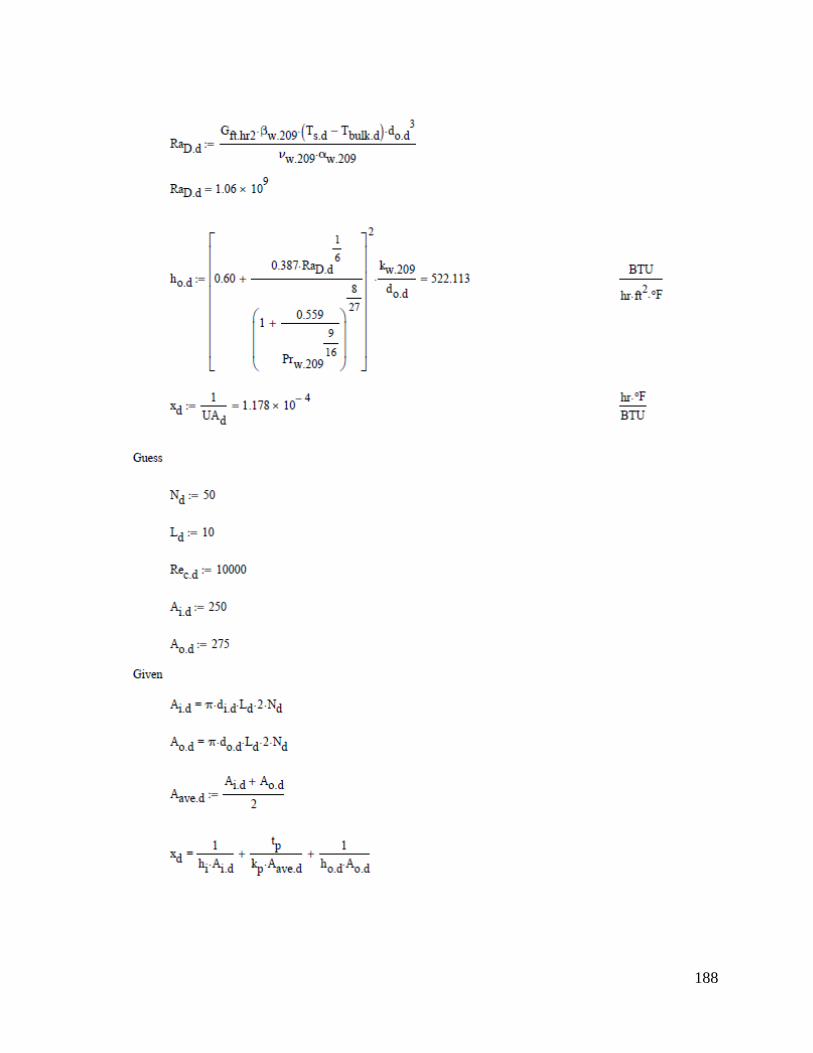
188
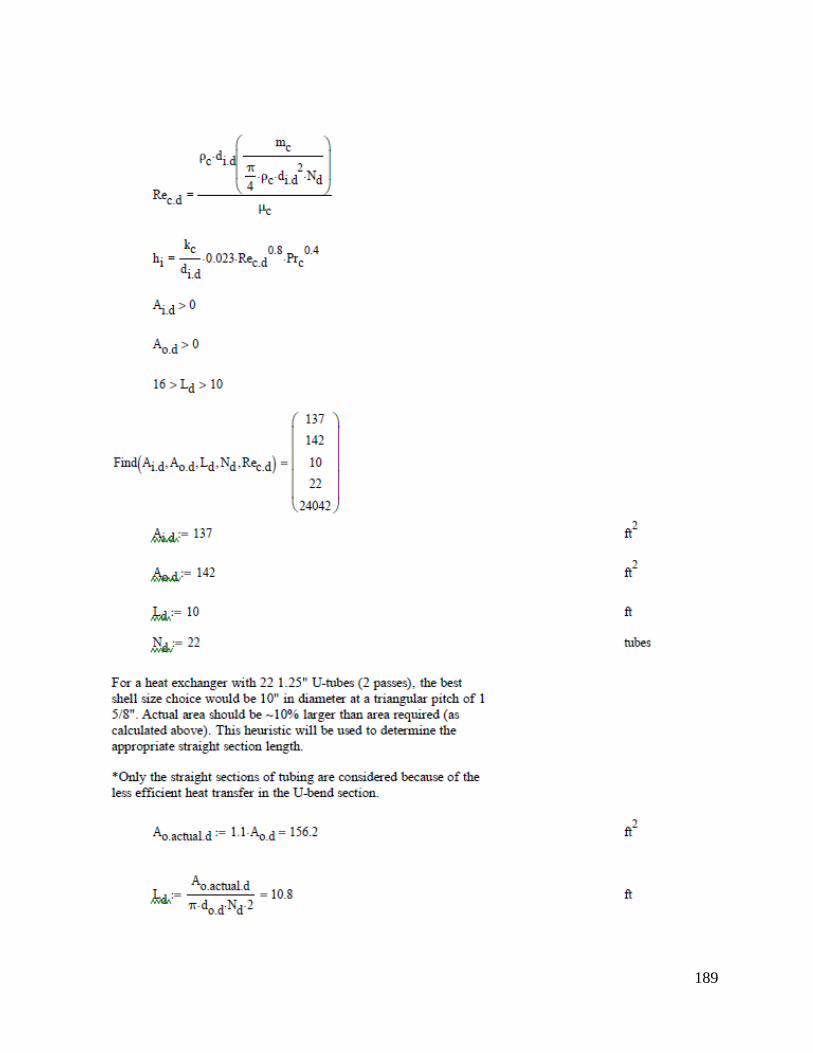
189
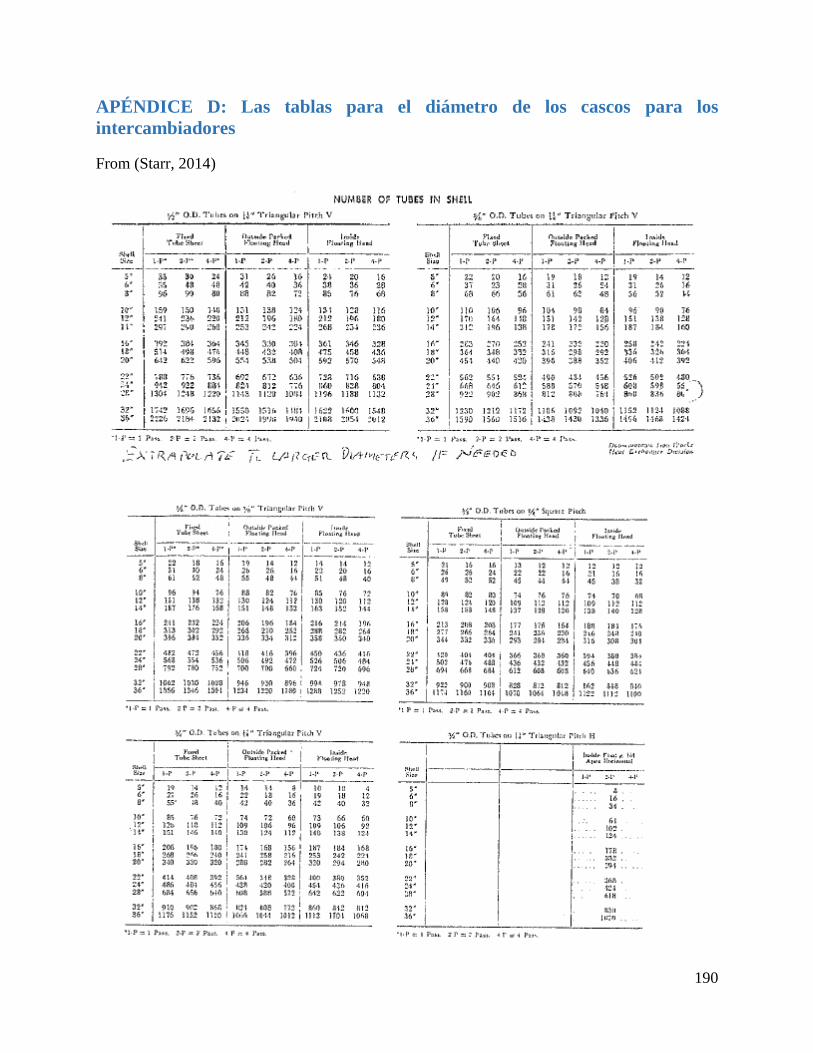
190
APÉNDICE D: Las tablas para el diámetro de los cascos para los
intercambiadores
From (Starr, 2014)
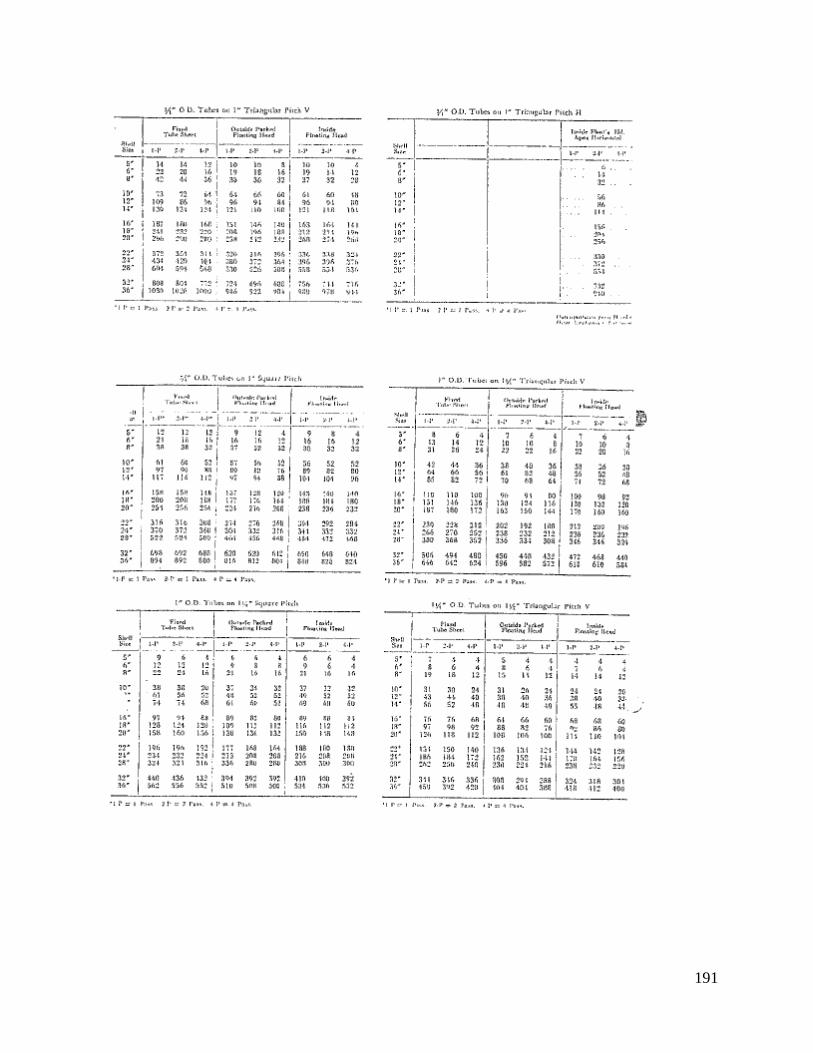
191

192

193