
Molten Carbonate and Phosphoric Acid Stationary Fuel Cells… · · 2013-09-30Molten Carbonate...
51
Technical Report NREL/TP-560-49072 September 2010 Molten Carbonate and Phosphoric Acid Stationary Fuel Cells: Overview and Gap Analysis Robert Remick National Renewable Energy Laboratory Douglas Wheeler DJW Technology, LLC
Transcript of Molten Carbonate and Phosphoric Acid Stationary Fuel Cells… · · 2013-09-30Molten Carbonate...
Technical Report NREL/TP-560-49072 September 2010
Molten Carbonate and Phosphoric Acid Stationary Fuel Cells: Overview and Gap Analysis Robert Remick National Renewable Energy Laboratory
Douglas Wheeler DJW Technology, LLC
National Renewable Energy Laboratory 1617 Cole Boulevard, Golden, Colorado 80401-3393 303-275-3000 • www.nrel.gov
NREL is a national laboratory of the U.S. Department of Energy Office of Energy Efficiency and Renewable Energy Operated by the Alliance for Sustainable Energy, LLC
Contract No. DE-AC36-08-GO28308
Technical Report NREL/TP-560-49072 September 2010
Molten Carbonate and Phosphoric Acid Stationary Fuel Cells: Overview and Gap Analysis Robert Remick National Renewable Energy Laboratory
Douglas Wheeler DJW Technology, LLC
Prepared under Task No. H278.7210
NOTICE
This report was prepared as an account of work sponsored by an agency of the United States government. Neither the United States government nor any agency thereof, nor any of their employees, makes any warranty, express or implied, or assumes any legal liability or responsibility for the accuracy, completeness, or usefulness of any information, apparatus, product, or process disclosed, or represents that its use would not infringe privately owned rights. Reference herein to any specific commercial product, process, or service by trade name, trademark, manufacturer, or otherwise does not necessarily constitute or imply its endorsement, recommendation, or favoring by the United States government or any agency thereof. The views and opinions of authors expressed herein do not necessarily state or reflect those of the United States government or any agency thereof.
Available electronically at http://www.osti.gov/bridge
Available for a processing fee to U.S. Department of Energy and its contractors, in paper, from:
U.S. Department of Energy Office of Scientific and Technical Information P.O. Box 62 Oak Ridge, TN 37831-0062 phone: 865.576.8401 fax: 865.576.5728 email: mailto:[email protected]
Available for sale to the public, in paper, from: U.S. Department of Commerce National Technical Information Service 5285 Port Royal Road Springfield, VA 22161 phone: 800.553.6847 fax: 703.605.6900 email: [email protected] online ordering: http://www.ntis.gov/ordering.htm
Printed on paper containing at least 50% wastepaper, including 20% postconsumer waste

iii
Acknowledgment
The authors would like to acknowledge the DOE Fuel Cell Technologies Program for its support, in particular Fred Joseck and Dimitrios Papageorgopoulos.
iv
Executive Summary
Technical and cost gap analyses were performed to identify pathways for reducing the costs of molten carbonate fuel cell (MCFC) and phosphoric acid fuel cell (PAFC) stationary fuel cell power plants. The MCFC analysis was performed by Dr. Robert Remick at the National Renewable Energy Laboratory (NREL), and the PAFC analysis was performed by Douglas Wheeler of DJW Technology, LLC. The MCFC developer, FuelCell Energy, Inc., of Danbury, Connecticut, provided information on the current costs of manufacturing their products and shared their vision for reducing costs by 2020. The PAFC developer, UTC Power, Inc., provided insight into opportunities for cost reduction that could yield to additional technology advancement, but were more circumspect in providing proprietary cost data. This gap analysis is the follow-on to the results obtained at the MCFC/PAFC Research and Development (R&D) Workshop held in Palm Springs, California, on November 16, 2009, as a pre-meeting to the Fuel Cell Seminar.
No single issue was identified in the MCFC analysis presented here that could achieve major cost reductions. However, results show that significant cost reductions can be achieved through technical advancements on several fronts. The three most important MCFC R&D areas to be addressed are 1) extending stack life to 10 years, 2) increasing power density by 20%, and 3) significantly reducing the cost for contaminant removal from fuel streams, especially from renewable fuel streams. Results also support, to some extent, the claim that volume production will bring down costs. However, even under the most optimistic circumstances, it is not likely that first costs for an MCFC power plant can be brought much below $2,000/kW.
One issue identified in the PAFC analysis that certainly ranks high is platinum costs. At 10% to 15% of the current installed costs of a PAFC power plant, platinum costs represent an Achilles heel of the PAFC technology, as pointed out in the MCFC/PAFC Workshop. In the case of the current PAFC power plants marketed by UTC Power, a reduction in fabrication costs also represents an opportunity for cost reduction. Here, cost reduction can be achieved through innovative redesign of processes and formulations to lower the cost of manufacturing the PAFCs. As with the MCFC power plant, an increase in PAFC power density would help reduce costs. In this instance, solving the anion adsorption problem at the fuel cell cathode would bring about a 20% increase in power density and a concomitant decrease in the cost per kilowatt of the existing technology. It is also important to note that no clear pathway was identified for the PAFC that would lead to power plant costs below $2,000/kW.
One of the most important issues identified, and one that is not specific to any fuel cell type, is contaminant removal. Development of a cost-effective process for removing contaminants, especially those found in renewable fuels, would have an impact well beyond the fuel cell communities.
v
Acronyms
AC alternating current ADG anaerobic gas digester BOP balance-of-power CHP combined heat and power DC direct current DFC direct fuel cell DMS dimethyl sulfide EPRI Electric Power Research Institute ERP electrolyte reservoir plate FCE FuelCell Energy FEP fluorinated ethylene-propylene GRI Gas Research Institute HDS hydrodesulfurization IFC International Fuel Cells IGT Institute of Gas Technology kW kilowatt kW-h kilowatt-hour LDC local distribution company LFG landfill gas MCFC molten carbonate fuel cell MEA membrane electrode assembly NREL National Renewable Energy Laboratory O&M operations and maintenance PAFC phosphoric acid fuel cell PEM polymer exchange membrane PV photovoltaics R&D research and development TBM tertiary butyl mercaptan ThT tetrahydrothiophene UTC United Technologies Corporation
vi
Contents
Acknowledgment ........................................................................................................................... iii Executive Summary ....................................................................................................................... iv Acronyms ........................................................................................................................................ v Contents ......................................................................................................................................... vi Figures........................................................................................................................................... vii Tables ............................................................................................................................................ vii Objective ......................................................................................................................................... 1
Basis of Analysis......................................................................................................................... 2 Fuel Cell Literature and Information .......................................................................................... 2
Introduction ..................................................................................................................................... 3 Fuel Processing and Contaminant Removal—A Common Element .......................................... 4
Gap Analysis—Molten Carbonate Fuel Cell Systems .................................................................... 9 Cost Breakdown .......................................................................................................................... 9 Cost Reduction of Stack Module Overhead Costs Through Volume Production .................... 10 Materials Cost Reduction via Increased Power Density ........................................................... 10 Balance-of-Plant ....................................................................................................................... 12 Operations and Maintenance ..................................................................................................... 13 Cost Analysis ............................................................................................................................ 16 Summary of Molten Carbonate Fuel Cell Results .................................................................... 17
Gap Analysis—Phosphoric Acid Fuel Cell System...................................................................... 19 Carbon/Graphite Catalyst Support Materials ............................................................................ 19 Platinum-Based Catalyst ........................................................................................................... 21 Bipolar Plates ............................................................................................................................ 25 Electrolyte Reservoir Plates and Control of the Phosphoric Acid Electrolyte Content ............ 28 Reformer Technology ............................................................................................................... 32 Balance-of-Plant ....................................................................................................................... 32 Cost Considerations .................................................................................................................. 33 Cost Analysis ............................................................................................................................ 36 Summary of Phosphoric Acid Fuel Cell Results ...................................................................... 36
References ..................................................................................................................................... 38
vii
Figures
Figure 1: Block diagram showing the three major sections of a fuel cell power plant ................... 3
Figure 2: FuelCell Energy vision for future cost reductions of DFC 1500 .................................. 10
Figure 3: Plot of electricity costs (cents/kW-h) as a function of fuel cell power plant costs ....... 17
Figure 4: Reduced electrochemical corrosion of graphitized Vulcan XC-72 ............................... 20
Figure 5: Decrease in catalytic activity with increasing surface area ........................................... 21
Figure 6: Dependence of specific activity at 900 mV on nearest Pt-Pt distance .......................... 22
Figure 7: Specific activity of alloy composition as expressed by lattice parameter ..................... 22
Figure 8: Separator plate concept showing fluorocarbon film used as a barrier to prevent transport of phosphoric acid .......................................................................................................... 26
Figure 9: Electrolyte reservoir configuration for PAFC ............................................................... 29
Figure 10: Cooler design showing the condensation zone where no electrochemistry occurs ..... 31
Figure 11: Potential cost reductions associated with platinum catalyst improvement ................. 35
Figure 12: Plot of electricity costs (cents/kW-h) as a function of fuel cell power plant costs for a PureCell400 unit operating on natural gas .................................................................................... 37
Tables
Table 1: Natural Gas Variability ..................................................................................................... 5
Table 2: Three Common Odorant Blends ....................................................................................... 6
Table 3: Opportunities for MCFC Cost Reduction ....................................................................... 13
Table 4: Stability of Alloy Cathode Catalyst Before and After 9,000 h Test at 200°C ................ 23
Table 5: Candidate Binder Materials for Bipolar Electrode Separators for Fuel Cells ............... 25
Table 6: Estimate of Baseline Case for 400 kW ........................................................................... 34
Table 7: Opportunity for PAFC Cost Reductions ......................................................................... 36
1
Objective
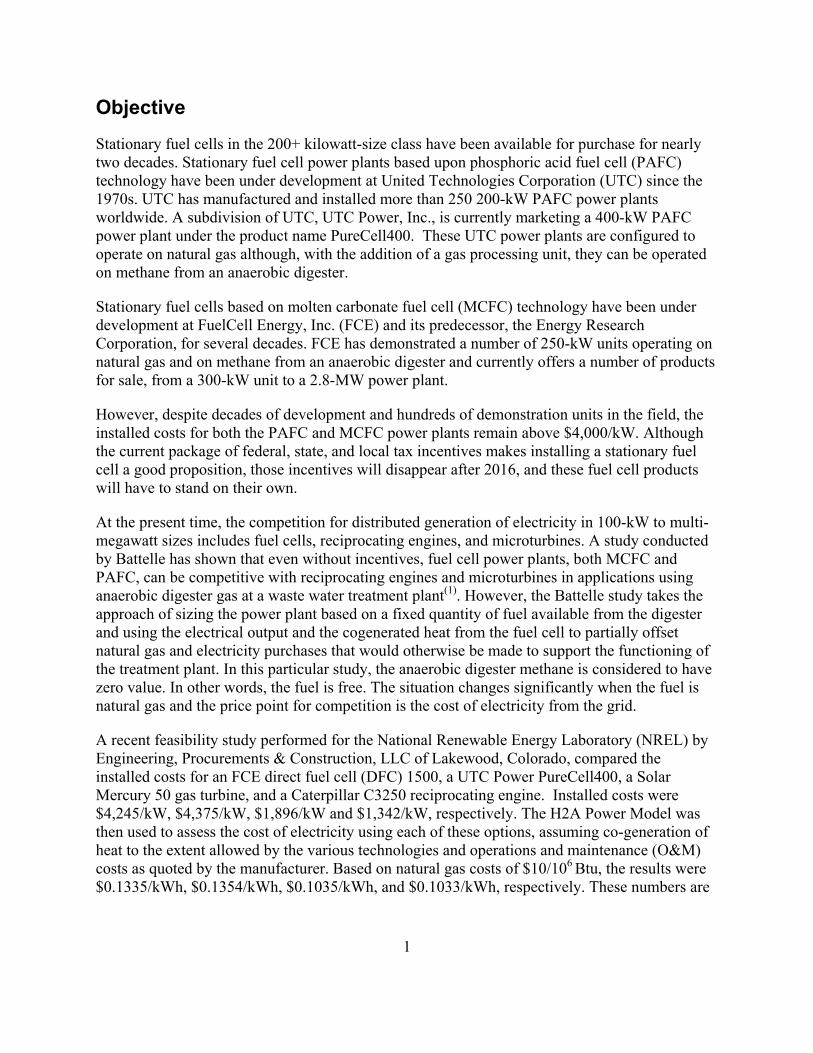
Stationary fuel cells in the 200+ kilowatt-size class have been available for purchase for nearly two decades. Stationary fuel cell power plants based upon phosphoric acid fuel cell (PAFC) technology have been under development at United Technologies Corporation (UTC) since the 1970s. UTC has manufactured and installed more than 250 200-kW PAFC power plants worldwide. A subdivision of UTC, UTC Power, Inc., is currently marketing a 400-kW PAFC power plant under the product name PureCell400. These UTC power plants are configured to operate on natural gas although, with the addition of a gas processing unit, they can be operated on methane from an anaerobic digester.
Stationary fuel cells based on molten carbonate fuel cell (MCFC) technology have been under development at FuelCell Energy, Inc. (FCE) and its predecessor, the Energy Research Corporation, for several decades. FCE has demonstrated a number of 250-kW units operating on natural gas and on methane from an anaerobic digester and currently offers a number of products for sale, from a 300-kW unit to a 2.8-MW power plant.
However, despite decades of development and hundreds of demonstration units in the field, the installed costs for both the PAFC and MCFC power plants remain above $4,000/kW. Although the current package of federal, state, and local tax incentives makes installing a stationary fuel cell a good proposition, those incentives will disappear after 2016, and these fuel cell products will have to stand on their own.
At the present time, the competition for distributed generation of electricity in 100-kW to multi-megawatt sizes includes fuel cells, reciprocating engines, and microturbines. A study conducted by Battelle has shown that even without incentives, fuel cell power plants, both MCFC and PAFC, can be competitive with reciprocating engines and microturbines in applications using anaerobic digester gas at a waste water treatment plant(1). However, the Battelle study takes the approach of sizing the power plant based on a fixed quantity of fuel available from the digester and using the electrical output and the cogenerated heat from the fuel cell to partially offset natural gas and electricity purchases that would otherwise be made to support the functioning of the treatment plant. In this particular study, the anaerobic digester methane is considered to have zero value. In other words, the fuel is free. The situation changes significantly when the fuel is natural gas and the price point for competition is the cost of electricity from the grid.
A recent feasibility study performed for the National Renewable Energy Laboratory (NREL) by Engineering, Procurements & Construction, LLC of Lakewood, Colorado, compared the installed costs for an FCE direct fuel cell (DFC) 1500, a UTC Power PureCell400, a Solar Mercury 50 gas turbine, and a Caterpillar C3250 reciprocating engine. Installed costs were $4,245/kW, $4,375/kW, $1,896/kW and $1,342/kW, respectively. The H2A Power Model was then used to assess the cost of electricity using each of these options, assuming co-generation of heat to the extent allowed by the various technologies and operations and maintenance (O&M) costs as quoted by the manufacturer. Based on natural gas costs of $10/106 Btu, the results were $0.1335/kWh, $0.1354/kWh, $0.1035/kWh, and $0.1033/kWh, respectively. These numbers are
2
based on the outright purchase of the equipment by national laboratories and do not include sales taxes, government incentives, or return on investment calculations. Although fuel cell installed costs are considerably higher than those of the microturbine and the reciprocating engine, the higher efficiency of the fuel cell in turning natural gas into electricity has a leveling effect. Clearly, if fuel cell power plant installed costs can be brought down to $2,000/kW, commensurate with those of a reciprocating engine, the fuel cell power plant would become the preferred choice for distributed generation using natural gas in the 400-kW and larger size class.
Our objective is to address the gap between the current first costs for stationary fuel cell power plants of about $4,000/kW and the first costs for competing technologies of about $1,500/kW and to identify technical areas where the most progress can be made in reducing costs.
Basis of Analysis What follows is a discussion of those particular aspects of the MCFC and PAFC stationary power plants that could benefit from additional research and development (R&D) and the impact that success in those areas might have on bringing down the first costs and the operating costs of those power plants. The installed costs for the PureCell400 and the DFC 1500 used here are taken from feasibility studies underway at several national laboratories for the installation of these fuel cells. Therefore, there is a high degree of confidence in the numbers for the total installed costs of these power plants. Discussions of the costs of the various components and sections of each power plant are the result of private discussions with the developers and of the information they supplied as to the relative breakdown of the cost elements. As one might imagine, many of the costs are considered proprietary information and could not be shared. As a result, there is less confidence in these lesser cost elements. However, because the purpose of this study is to point to areas for future research that would have the biggest impact on cost reduction, it is less important to know if the fuel cell module of the DFC 1500 costs $2,100/kW or $2,400/kW to fabricate than it is to know that it represents the major opportunity for cost reduction R&D.
Fuel Cell Literature and Information As one might imagine, after four decades of research there is a very large volume of literature on MCFC and PAFC technology. Much of the fundamental work was published in the Journal of the Electrochemical Society, (whose name was later changed to the Electrochemical Society Journal). Starting in 1984 and ending in 1999, the Electrochemical Society also held five international symposiums on MCFC technology, complete with bound proceedings volumes. These proceedings are a good place to start to track the development of the MCFC technology. Because a significant amount of engineering and demonstration was funded by the U.S. Department of Energy (DOE) Office of Fossil Energy and, to a lesser extent, the Electric Power Research Institute (EPRI) and the Gas Research Institute (GRI), there is also a significant repository of technical reports available from the National Technical Information Service, EPRI, and the Gas Technology Institute, although not without some costs. However, there is also a body of know-how developed by the various fuel cell practitioners over the past four decades, some of which has been lost and some of which sits in proprietary corporate archives, which could yet prove to be valuable.
3
Introduction
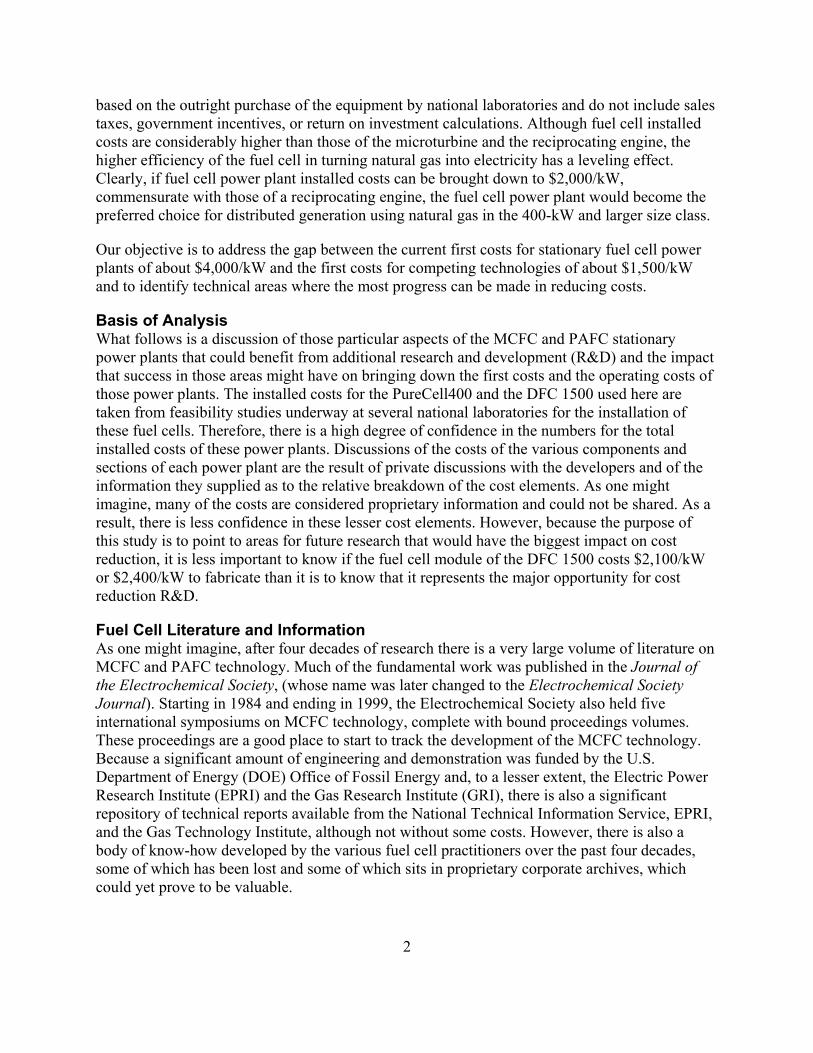
Any discussion of a stationary power plant traditionally is divided into three sections, the fuel processing section, which turns the fuel, usually natural gas, into a clean hydrogen-rich fuel suitable for use by the fuel cell; the power production section, which contains the fuel cell stack; and the power conditioning section, which takes the DC power produced by the fuel cell stack and turns it into AC power for the electrical grid. These three sections are shown schematically in Figure 1.
Figure 1: Block diagram showing the three major sections of a fuel cell power plant
Each of these three sections has its own scaling factor, and the pace of development of each section has taken place at a different rate. A decade ago, the general rule was that each section accounted for about one-third of the total power plant costs. Today, 50% to 70% of the first costs of the power plant are in the fuel cell section. One of the driving forces for cost reduction of the fuel processing section has been its commonality. The processing of natural gas or other light hydrocarbons into clean hydrogen is a large-scale industrial practice in the chemical industry. Because all fuel cells, both stationary and transportation, operate on clean hydrogen, and because the preferred feed stock for making hydrogen, at the present time, is natural gas, all fuel cell development programs have had to wrestle with the problem of producing clean hydrogen from natural gas. As a result of this commonality, much progress has been made in reducing the costs of processing natural gas into hydrogen, with the one exception discussed below, and all have benefited. Likewise, there is a commonality in the development of the power conditioning section. All stationary fuel cells produce DC power, and progress made in the development of power conditioning equipment for one fuel cell type benefits the others. There is also a second driving force for the reduction of power conditioning equipment costs, and that is the burgeoning solar photovoltaic (PV) industry. Solar PV arrays range from grid-connected residential roof-top arrays of a few kilowatts to multi-megawatt arrays tied into power utility grids, all of which must overcome the same technical and cost barriers with respect to conditioning DC power for the AC grid as do the stationary fuel cell developers. So here too the fuel cell developers have benefited. It is only in the fuel cell power section, that portion of the power plant which is unique to each stationary fuel cell technology, where the least progress has been made in cost reduction.
4
Fuel Processing and Contaminant Removal—A Common Element The one area of fuel processing that has been resistant to cost reduction is contaminant removal. All fuel cell anodes, where oxidation of hydrogen takes place, are highly intolerant of sulfur. These include polymer exchange membrane (PEM) and PAFC fuel cells that use supported platinum catalysts and MCFC and solid oxide fuel cells high-temperature fuel cells that use metallic nickel anodes. This is also true of nickel-based steam-methane reforming catalysts used to produce hydrogen from natural gas. However, whereas the steam-methane reforming catalysts used in industry may be removed and regenerated periodically, the fuel cell anodes are locked in place for the full life of the fuel cell stack. The fuel quality specification for the MCFC, for example, is for less than 10 parts per billion (ppb) of sulfur in the fuel stream going to the fuel cell stack. Fuel quality standards being developed for sulfur species contaminating the hydrogen supplied to fuel cell vehicles are even stricter at 4 ppb. This is three orders of magnitude less than the level of organic sulfur compounds added as odorants to natural gas by gas utilities. Therefore, the first step in fuel processing, and one of the most costly, is contaminant removal.
In a recent conversation with an FCE representative,(2) he indicated that the first costs for contaminant removal (gas cleanup) equipment ranged from $400/kW for the cleanest fuel, pipeline-quality natural gas, to $3,000/kW for the most contaminated fuels, methane from municipal waste water treatment plants and landfills. He also indicated that, in addition to the contaminant level and type, the quality of the natural gas varies significantly from location to location and from season to season such that there are geographic areas in the United States where the cost of cleanup equipment rivals the cost of the power plant and makes locating a fuel cell power plant in these localities impractical.
Natural Gas Variability The composition of natural gas varies from location to location, sometimes on an hourly basis. The gas supplied to customers may originate from widely diverse locations throughout North and Central America depending on local distribution company (LDC) and customer gas supply contracts. Large metropolitan areas may be served by several gas transmission pipelines and, as a result, the origin of the gas being supplied to a specific location within a metropolitan area may vary on an hourly basis as the demand profile shifts.
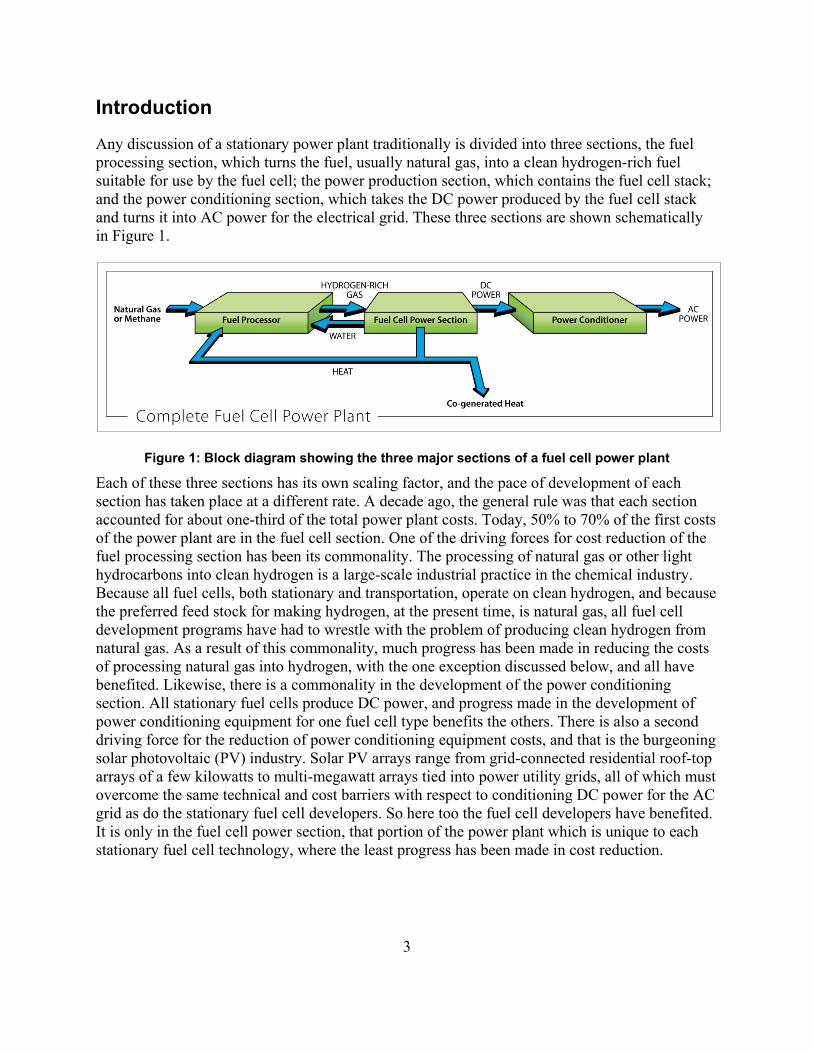
Gas utilities routinely monitor the heating value of the gas they send out to the customer but not the composition. Therefore, statistics on gas composition cannot be compiled on a regular basis across a wide base of LDCs. However, the Institute of Gas Technology (IGT) in 1992 performed a comprehensive study of natural gas composition in which gas samples were taken in the field.(3) The IGT study collected a total of 6,800 samples from 26 metropolitan areas over a 12-month period of time. A capsule summary of the results of this study is shown in Table 1. The middle column of the table lists the extremes of composition by gas species or category. Minimum and maximum extremes of ethane, for example, represent the lowest and the highest ethane content sampled. Developing a system that can operate within the compositional extremes listed in the middle column would mean that the system could be placed on any natural gas service in North America. The right-most column presents the range of variability when the top and bottom 10% of the samples have been excluded.
5
Table 1: Natural Gas Variability(3)
Composition Min to Max Range 80% Range Hydrocarbons
Methane, volume % 73 to 99 89 to 97 Ethane, volume % 0.5 to 13 1 to 5 Propane, volume % 0 to 8 0.2 to 2 Butanes, volume % 0 to 7 Pentanes, volume % 0 to 3 Hexanes, volume % 0 to 1 C4 and above, volume % 0.1 to 2
Inert Gases Nitrogen, volume % 0 to 10 0 to 3 Carbon Dioxide, volume % 0 to 2 0 to 2 Oxygen, volume % 0 to 1 0 to 0.2
Impurities Total Sulfur, ppmv 2 to 17 4 to 12 H2S, ppmv 0 to 1 0 to 1 COS, ppmv 0 to 2 0 to 2 Odorants, ppmv 2 to 12 4 to 10
The fuel processing system of the stationary fuel cell power plant must be designed to handle a wide variety of natural gas compositions. At present, no stationary fuel cell developer is producing a single product that can be installed universally. For example, the UTC Power PureCell400 has a maximum specification for nitrogen in the natural gas supply of less than 4%.
Contaminant Removal The primary contaminants of concern in natural gas are the sulfur-based compounds added as odorants by the LDCs. There are two approaches for the removal of contaminants from natural gas being used by the chemical industry and by fuel cell developers. They are adsorption and hydrodesulfurization (HDS). In the adsorption approach, the incoming fuel is passed through a series of adsorption beds. Typical adsorption materials include activated carbon, molecular sieves, molecular sieves containing copper, and lastly, a high surface-area metal powder used as a polishing bed. The problem of removing odorants from natural gas is exacerbated by the fact that the LDCs use a blend of several odorants, including both high and low molecular weight compounds. High molecular weight compounds such as tertiary butyl mercaptan (TBM) are included in the blend because their odor is easily detected by humans at concentrations of only a few tens of parts per billion in air. However, TBM is readily adsorbed on surfaces so while it is an excellent odorant for detecting an interior gas leak, for example, at a pipe union or a valve, it is readily adsorbed by soil. Therefore, more volatile organic sulfur compounds like dimethyl sulfide (DMS) are blended in the natural gas as well. DMS does not have the strong smell of a mercaptan; however, it is not easily adsorbed by soil and therefore is useful for detecting an external gas leak, for example, in an underground gas supply line leading up to a residential unit.
6
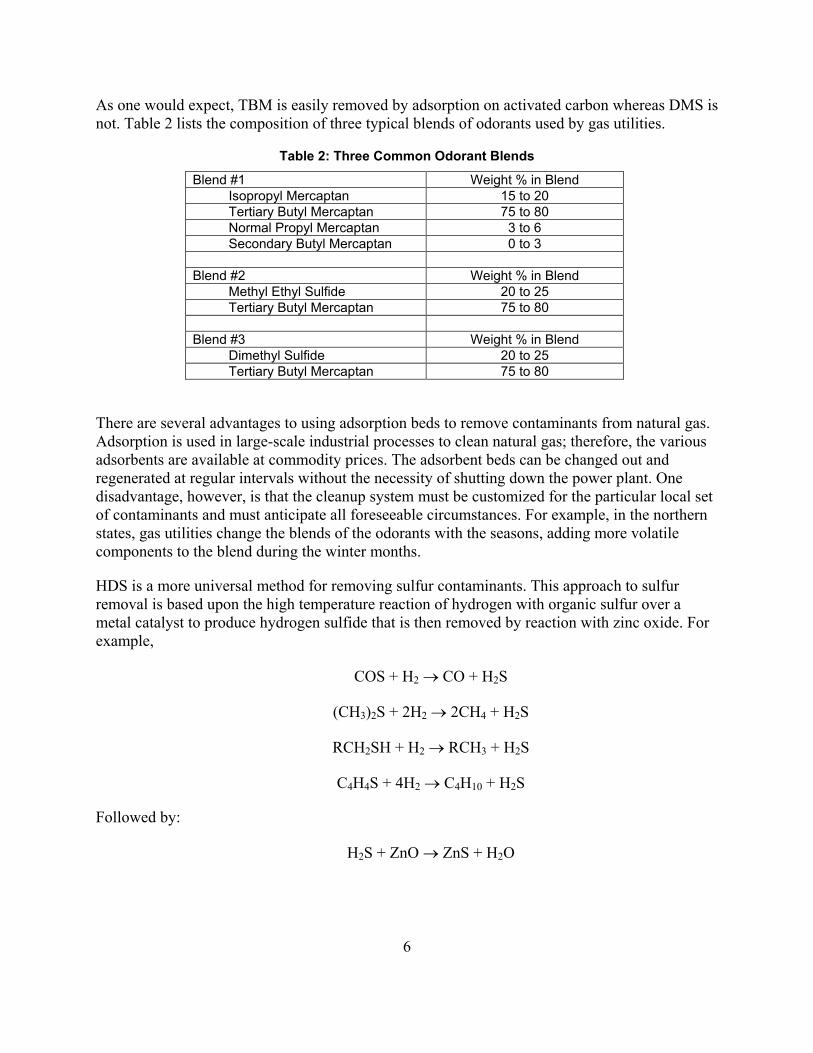
As one would expect, TBM is easily removed by adsorption on activated carbon whereas DMS is not. Table 2 lists the composition of three typical blends of odorants used by gas utilities.
Table 2: Three Common Odorant Blends
Blend #1 Weight % in Blend Isopropyl Mercaptan 15 to 20 Tertiary Butyl Mercaptan 75 to 80 Normal Propyl Mercaptan 3 to 6 Secondary Butyl Mercaptan 0 to 3
Blend #2 Weight % in Blend
Methyl Ethyl Sulfide 20 to 25 Tertiary Butyl Mercaptan 75 to 80
Blend #3 Weight % in Blend
Dimethyl Sulfide 20 to 25 Tertiary Butyl Mercaptan 75 to 80
There are several advantages to using adsorption beds to remove contaminants from natural gas. Adsorption is used in large-scale industrial processes to clean natural gas; therefore, the various adsorbents are available at commodity prices. The adsorbent beds can be changed out and regenerated at regular intervals without the necessity of shutting down the power plant. One disadvantage, however, is that the cleanup system must be customized for the particular local set of contaminants and must anticipate all foreseeable circumstances. For example, in the northern states, gas utilities change the blends of the odorants with the seasons, adding more volatile components to the blend during the winter months.
HDS is a more universal method for removing sulfur contaminants. This approach to sulfur removal is based upon the high temperature reaction of hydrogen with organic sulfur over a metal catalyst to produce hydrogen sulfide that is then removed by reaction with zinc oxide. For example,
COS + H2 → CO + H2S
(CH3)2S + 2H2 → 2CH4 + H2S
RCH2SH + H2 → RCH3 + H2S
C4H4S + 4H2 → C4H10 + H2S
Followed by:
H2S + ZnO → ZnS + H2O
7
In the chemical industry, HDS is conducted at temperatures between 500° and 750°F (260° and 400°C) at pressures between 100 and 500 psi (0.69 and 3.44 MPa) over a cobalt-molybdenum catalyst. However, UTC Power’s PureCell400 uses HDS under milder conditions at only slightly elevated pressures. The process requires a source of dry hydrogen, which can be recovered from the fuel cell exhaust gases or produced by partial oxidation of untreated natural gas. Only small amounts of hydrogen are consumed when removing parts-per-million levels of odorant from natural gas. So, hydrogen supply is not a problem. The effectiveness of the zinc oxide absorbent is reduced when steam is present so HDS is performed upstream of the steam injection required for fuel reforming. It is not economical to recycle the zinc oxide. Therefore, zinc oxide is a consumable. The advantage of HDS is that it is a universal process and can handle a variety of sulfur-based contaminants in a single processing unit. The disadvantage is that it is sensitive to oxygen and to unsaturated hydrocarbons, either of which can overwhelm the HDS reactor.
Contaminants in Renewable Fuels Bio methane produced in landfills and anaerobic digesters is a promising renewable fuel. Although landfills are considered one-way disposal for most wastes, organic materials such as food wastes and forest products are decomposed in the land fill by methanogenic microorganisms to produce methane and carbon dioxide that can be recovered from the landfill. Since the origin of the methane is plant and animal material, it is considered a renewable fuel. Anaerobic digester gas (ADG) and landfill gas (LFG) present significantly more difficult contaminant removal problems than those associated with natural gas. Contaminants found in ADG and LFG include hydrogen sulfide, nitrogen, ammonia, oxygen, halogenated hydrocarbons, and organic silicon compounds. Carbon dioxide content may range as high as 40% of the recovered gas, and sulfur contaminants, rather than being present in only parts-per-million quantities, may range as high as several percent. Most gas-fueled industrial equipment, including fuel cells, reciprocating engines, and gas turbines, are designed to use pipeline quality natural gas. Therefore, for any distributed generation power plant and especially for a fuel cell power plant to operate on ADG or LFG, it is necessary to construct an additional fuel processing system ahead of the power plant to upgrade the fuel and remove the contaminants. Costs for this additional fuel processing equipment can add several thousands of dollars per kilowatt in first costs as well as substantially increasing operating costs. For example, a contaminant removal system loaded with sufficient adsorbents to remove 10 ppm of natural gas odorants over a six-month period would saturate with sulfur in only 15 hours operating on ADG gas containing 0.3% hydrogen sulfide.
Three approaches have been discussed in the past to address the issue of high contaminant removal costs. The first approach addressed the sensitivity of the fuel cell itself. Some research was performed in the 1980s and 1990s addressing the development of contaminant resistant fuel cells and sulfur tolerant anodes. To date, however, this approach has yielded only incremental improvements but no solutions.
Gap—High Contaminant Removal Costs
The second approach was to encourage gas utilities to adopt odorants that were easily removed by an inexpensive adsorption system. Tetrahydrothiophene (ThT), for example, is one such
8
odorant that has become popular in Europe. Most activated carbon adsorbents have a high capacity for removing ThT. Unfortunately, adoption of a single odorant across all of North America is viewed as being unlikely for both codes and standards and liability reasons.
The third approach, which has received little attention, is to develop a method, perhaps a membrane-based system, which can separate methane from the contaminants, rather than the contaminants from the methane. In other words, develop a gas purification membrane for methane that is the analogue of the palladium membrane used to purify hydrogen. While this may be impractical for removing part-per-million levels of contaminants from pipeline quality natural gas, it could prove cost effective for ADG and LFG cleanup.
A fully sulfur-resistant fuel cell stack could reduce the cost of a fuel cell power plant operating on pipeline quality natural gas by $400/kW. Operation on ADG and LFG would still require removal of halogenated hydrocarbons and organic silicon compounds and the reduction of sulfur to part-per-million levels.
Adoption of ThT as a universal odorant would allow removal of the most expensive adsorbent beds from the current system and may reduce cleanup costs for pipeline quality natural gas by as much as $200/kW.
Development of an organic membrane for methane cleanup will be a significant R&D challenge and may not affect much of a cost reduction for removing odorants from natural gas; however, it could bring about a significant decrease in cleanup costs for ADG and LFG renewable-fuel sources. Whether such a membrane can be developed at an affordable price is an open question.
FuelCell Energy suggested(2) that what is needed by the industry is a universal contaminant removal system, a “plug-and-play” unit, that can be mated to any fuel cell power plant or steam-methane reformer. Such a universal cleanup system would benefit all stationary fuel cell developers, regardless of cell type, as well as fabricators of hydrogen filling stations for transportation applications that use on-site steam-methane reforming as a source of hydrogen.
9
Gap Analysis—Molten Carbonate Fuel Cell Systems
Over the past three decades several corporations have tried their hand at developing MCFC power plants, including GE,(4) United Technologies Corporation,(5) and Energy Research Corporation(6) (now FCE). Significant funding for MCFC development has been provided by the DOE Office of Fossil Energy and, to a lesser extent, by EPRI and GRI. As of today, there remains only one developer in the United States of stationary MCFC power plants; FCE of Danbury, Connecticut. The current FCE product lineup includes models designated DFC 300, DFC 1500, and DFC 3000. As of June 2010, these are 300-kW, 1.4-MW, and 2.8-MW power plants, respectively.
Cost Breakdown The current installed costs for a DFC 1500 unit averages about $4,200/kW, broken down as approximately $2,400/kW for the fuel cell module, $1,100 for the balance-of-plant (BOP), and $700/kW for conditioning, installation, and commissioning. It is misleading to compare this breakdown to similar breakdowns for other technologies because, unlike PEM and PAFC units, the DFC line of products incorporates the steam-methane reformer into the fuel cell stack module rather than the BOP making the stack module appear overly expensive.(6,7) BOP costs include the gas cleanup system, a small pre-reformer, the process control system, all heat exchangers and water management systems, and the power conditioning section. As noted above in the section on fuel processing, the gas cleanup system cost can vary substantially depending on fuel quality. The costs used here are for a DFC 1500 operating on pipeline-quality natural gas. The DFC line of products comes with several power output options. The costs here are for power output at 480 voltage in AC and 60 Hz. The BOP costs also include the CHP (combined heat and power) option for hot water at 140°F (60°C).
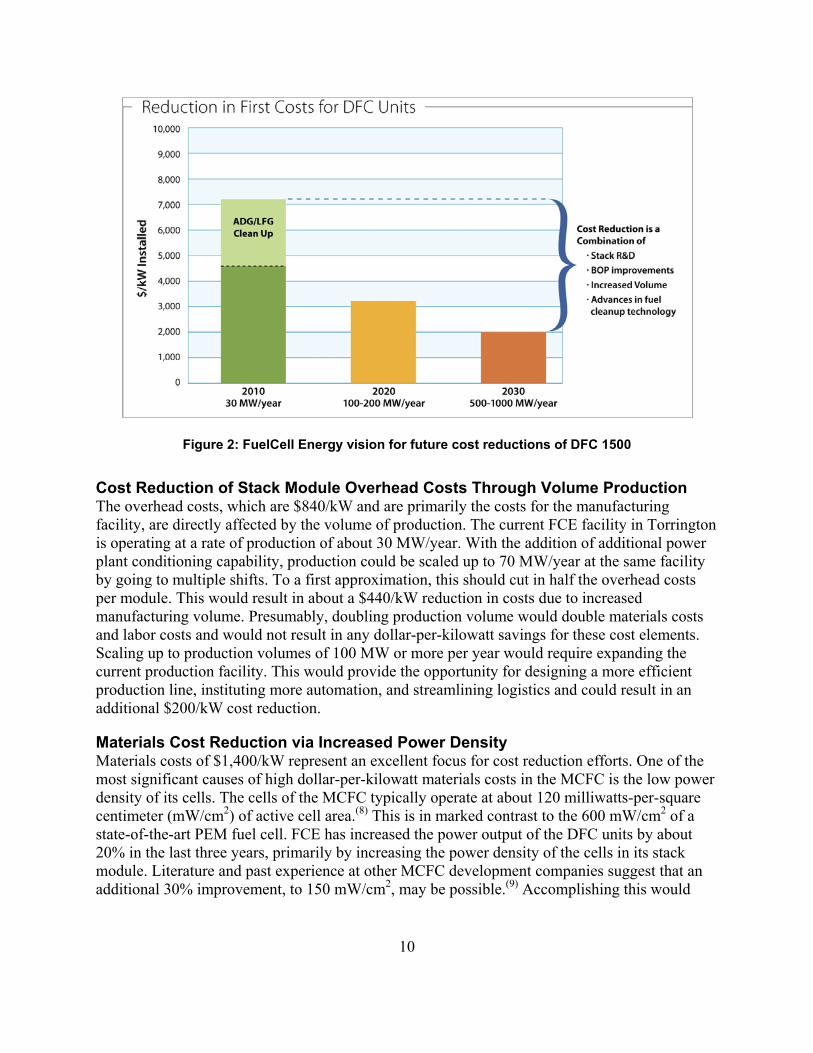
FCE indicates(2) that every DFC 1500 mated to an anaerobic digester at a wastewater treatment plant or food processing plant requires a custom-designed fuel cleanup system that can cost up to an additional $3,000/kW to upgrade and clean up the fuel. The average cost for a DFC 1500 operating at a wastewater treatment plant or landfill is about $7,200/kW. FCE has provided high-level information on its vision for bringing the costs down. This information is summarized in Figure 2. FCE does not see one issue that, being successfully addressed, will result in major cost reductions. Rather, it views the process as requiring a mixture of technical innovation across a broad range of topics and volume production.
Fuel Cell Stack Module At $2,400/kW approximate costs, the stack module should offer the best opportunity for cost reduction. All DFC products use the same basic MCFC cell stack, with one stack in the DFC 300, four in the DFC 1500, and eight in the DFC 3000. FCE has provided information on the cost breakdown for manufacturing the DFC stack module. The costs break down as 59% for materials, 35% for overhead, and 6% direct labor. FCE has instituted a fair amount of automation to the process for module fabrication so the low labor costs do not come as a surprise.
10
Figure 2: FuelCell Energy vision for future cost reductions of DFC 1500
Cost Reduction of Stack Module Overhead Costs Through Volume Production The overhead costs, which are $840/kW and are primarily the costs for the manufacturing facility, are directly affected by the volume of production. The current FCE facility in Torrington is operating at a rate of production of about 30 MW/year. With the addition of additional power plant conditioning capability, production could be scaled up to 70 MW/year at the same facility by going to multiple shifts. To a first approximation, this should cut in half the overhead costs per module. This would result in about a $440/kW reduction in costs due to increased manufacturing volume. Presumably, doubling production volume would double materials costs and labor costs and would not result in any dollar-per-kilowatt savings for these cost elements. Scaling up to production volumes of 100 MW or more per year would require expanding the current production facility. This would provide the opportunity for designing a more efficient production line, instituting more automation, and streamlining logistics and could result in an additional $200/kW cost reduction.
Materials Cost Reduction via Increased Power Density Materials costs of $1,400/kW represent an excellent focus for cost reduction efforts. One of the most significant causes of high dollar-per-kilowatt materials costs in the MCFC is the low power density of its cells. The cells of the MCFC typically operate at about 120 milliwatts-per-square centimeter (mW/cm2) of active cell area.(8) This is in marked contrast to the 600 mW/cm2 of a state-of-the-art PEM fuel cell. FCE has increased the power output of the DFC units by about 20% in the last three years, primarily by increasing the power density of the cells in its stack module. Literature and past experience at other MCFC development companies suggest that an additional 30% improvement, to 150 mW/cm2, may be possible.(9) Accomplishing this would
11
bring the power output of the DFC 300 to 400 kW and the output of the DFC 1500 to 1.8 MW with no substantial increase in materials costs. This would result in a $ 330/kW cost reduction for the DFC 1500 power plant.
There are three traditional approaches to increasing the power density of a stack that do not require substantial changes to stack design: 1) an increase in operating temperature, 2) an increase in ionic conductivity of the electrolyte, and 3) a decrease in polarization losses of the electrodes. Additional improvement in power density also can be achieved by reducing interfacial contact resistance at the electrode/bipolar plate interface.
Gap—Need for Higher Power Density
Increasing the operating temperature of the stack has its limits in the current DFC power plants. The DFC units perform the steam-methane reaction in a series of parallel plates integrated into the stack at selected locations between cells.(7) This allows heat generated by the electrochemistry to supply the heat required for the reforming reaction. Increasing the operating temperature of the stack may adversely impact the operation of the reforming plates, requiring a complete redesign. Increased temperatures also increase corrosion and electrolyte loss by evaporation.
Increasing the conductivity of the electrolyte can be accomplished by cation substitution. The classical electrolyte for the MCFC has been a mixture of lithium carbonate with potassium carbonate. Substitution of sodium carbonate for the potassium carbonate can have several beneficial effects, including an increase in electrolyte conductivity, a decrease in cathode solubility, and a decrease in evaporative losses. Sodium carbonate is also less expensive than potassium carbonate. However, this is not a straightforward substitution. The physicochemical properties of lithium/sodium carbonate electrolytes differ from those of lithium/potassium carbonate to the extent that a variety of electrode and hardware properties may have to be re-optimized in order to use this alternative electrolyte.
The electrode materials used in the MCFC, nickel with small amounts of aluminum alloy in the anode and nickel oxide in the cathode, are well established. It is unlikely that the amount of material required for each electrode can be reduced for the purposes of reducing costs. However, there are opportunities for altering the morphology of the electrodes to increase active surface area and improve electrochemical kinetics.
A common practice in PEMFC and solid oxide fuel cell development is to fabricate components in ever-decreasing thicknesses to both improve performance and reduce costs. Because the MCFC uses a liquid electrolyte supported by an inert matrix and porous electrodes partially filled with electrolyte, there is little opportunity to improve performance of the MCFC by decreasing the thicknesses of the cell components. Elimination or reduction in thickness of inter-cell components such as current collectors and bipolar separator plates may provide some additional cost savings, but in general, decreasing the inventory of materials in the MCFC stack is not viewed as a viable approach for cost reduction.
12
Balance-of-Plant The fuel cell stacks in the fuel cell module have almost no scaling factor. Doubling the size of the power plant approximately doubles the cost of the fuel cell module. However, the BOP is fabricated from standard chemical process hardware, and the same approximate scaling factors apply to the fuel cell BOP as apply to chemical process plants. As a result, there is an overall reduction in the cost per kilowatt as the size of the power plants increases. For example, the current cost for the DFC 300 power plant, including installation, is about $1.7 million ($5,500/kW); the current cost for the DFC 1500 power plant is about $5.9 million ($4,200/kW); while the current cost for a DFC-3000 power plant is about $10 million ($3,500/kW).(2)
Balance-of-Plant Cost Reduction With Volume Production Fuel cell BOPs are essentially miniature chemical factories that use typical chemical process equipment. The fabrication and assembly of much of the BOP for the DFC line of products is outsourced by FCE. As production increases, there are opportunities to decrease the costs of the BOP through a variety of mechanisms, including the institution of assembly line practices for assembling the BOP and cooperative purchase agreements with second and third tier suppliers. Doubling the rate of purchase of BOP equipment, from 30 MW/year to 70 MW/year could be expected to reduce BOP costs by 20%. Increasing BOP orders by a factor of 20, from 30 MW/year to 600 MW/year, could decrease costs by as much as 40%. So it is reasonable to assume that BOP costs could be reduced by as much as $400/kW or more through volume manufacture.
Conditioning, Installation, and Commissioning After fabrication and assembly of the fuel cell module, the module must be conditioned. This process entails heating the fuel cell stack to operating temperature under controlled conditions to melt the electrolyte and impregnate the electrolyte matrix and electrodes with the proper amount of electrolyte. It also allows a variety of chemical reactions between the electrolyte and the hardware to reach a state of equilibrium. This process takes about two weeks after which the module is shipped to the customer and installed. The BOP, shipped in separate units, is installed at the customer’s site, and all electrical, piping, and utility connections are made. In other words, the power plant is assembled at the customer’s site rather than in a factory environment. A rough estimate for the cost of conditioning, installation, and commissioning is $700/kW.
A rough engineering estimate suggests that about $200/kW could be trimmed from conditioning, installation, and commissioning costs at higher production volumes without significantly altering the methods used on the production line. Costs could be reduced still more if the conditioning time could be shortened, or eliminated by changes in the fabrication and assembly process, for example conditioning the cells on the assembly line or reformulating the fabrication process such that conditioning is not required. Another approach, if technically and environmentally feasible, would be to integrate the conditioning process into the commissioning process at the customer’s site. This would effectively eliminate the need for a dedicated conditioning facility at the manufacturing plant.
Gap—Extensive Conditioning of Fuel Cell Stacks Prior to Installation
13
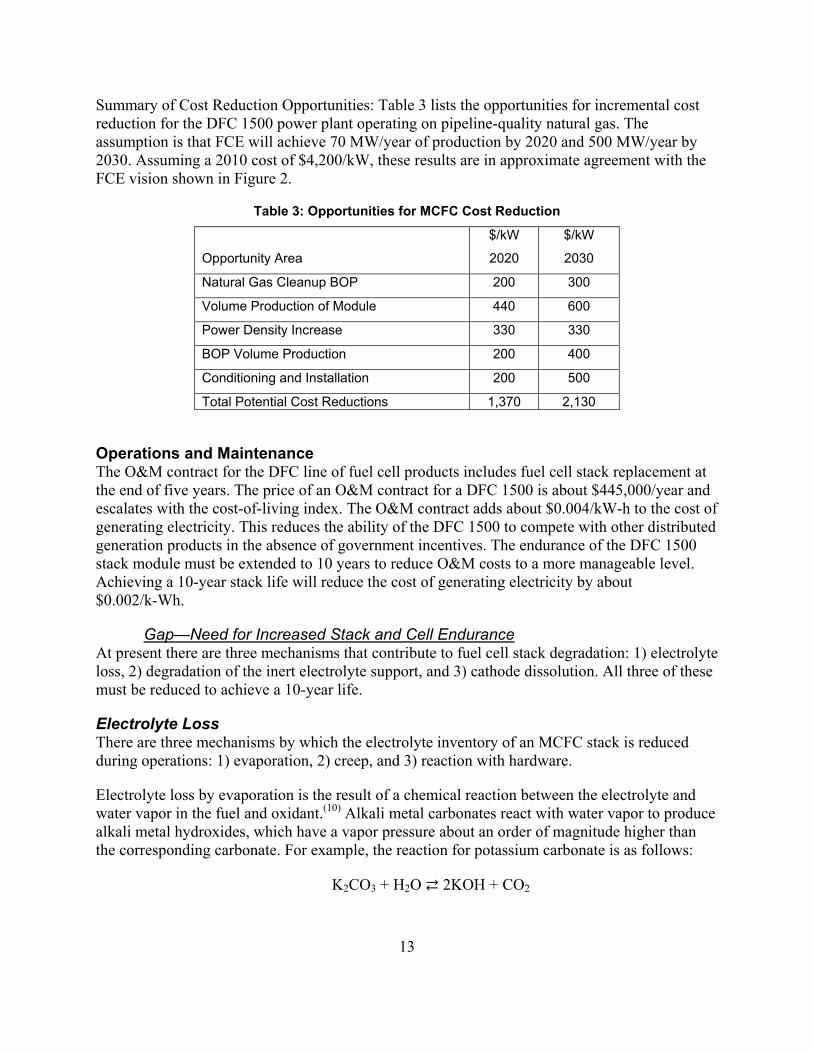
Summary of Cost Reduction Opportunities: Table 3 lists the opportunities for incremental cost reduction for the DFC 1500 power plant operating on pipeline-quality natural gas. The assumption is that FCE will achieve 70 MW/year of production by 2020 and 500 MW/year by 2030. Assuming a 2010 cost of $4,200/kW, these results are in approximate agreement with the FCE vision shown in Figure 2.
Table 3: Opportunities for MCFC Cost Reduction
Opportunity Area
$/kW
2020
$/kW
2030
Natural Gas Cleanup BOP 200 300
Volume Production of Module 440 600
Power Density Increase 330 330
BOP Volume Production 200 400
Conditioning and Installation 200 500
Total Potential Cost Reductions 1,370 2,130
Operations and Maintenance The O&M contract for the DFC line of fuel cell products includes fuel cell stack replacement at the end of five years. The price of an O&M contract for a DFC 1500 is about $445,000/year and escalates with the cost-of-living index. The O&M contract adds about $0.004/kW-h to the cost of generating electricity. This reduces the ability of the DFC 1500 to compete with other distributed generation products in the absence of government incentives. The endurance of the DFC 1500 stack module must be extended to 10 years to reduce O&M costs to a more manageable level. Achieving a 10-year stack life will reduce the cost of generating electricity by about $0.002/k-Wh.
At present there are three mechanisms that contribute to fuel cell stack degradation: 1) electrolyte loss, 2) degradation of the inert electrolyte support, and 3) cathode dissolution. All three of these must be reduced to achieve a 10-year life.
Gap—Need for Increased Stack and Cell Endurance
Electrolyte Loss There are three mechanisms by which the electrolyte inventory of an MCFC stack is reduced during operations: 1) evaporation, 2) creep, and 3) reaction with hardware.
Electrolyte loss by evaporation is the result of a chemical reaction between the electrolyte and water vapor in the fuel and oxidant.(10) Alkali metal carbonates react with water vapor to produce alkali metal hydroxides, which have a vapor pressure about an order of magnitude higher than the corresponding carbonate. For example, the reaction for potassium carbonate is as follows:
K2CO3 + H2O ⇄ 2KOH + CO2
14
This is an equilibrium reaction, and potassium loss is greatly reduced, but not eliminated, by the presence of carbon dioxide in the fuel. Of the three alkali metal hydroxides, lithium, sodium, and potassium, potassium hydroxide is the most volatile. Therefore, the opportunity exists for reformulating the electrolyte to reduce evaporative losses. Argonne National Laboratory investigated the use of alkaline earth additives to a lithium/sodium carbonate electrolyte to stabilize electrolyte performance over long periods.(9)
Electrolyte loss via creep is the result of the electrolyte wetting the protective oxide layer that forms on stainless steel hardware used to fabricate the bipolar separator plates and the intake and exhaust manifolds. This is a problem on the oxidant side of the bipolar plate. The fuel side of the bipolar plate is nickel clad and does not oxidize but remains metallic in the presence of fuel. Nickel metal is not wet by the electrolyte, and therefore electrolyte creep is not a problem in the fuel environment. Kunz addressed the migration of electrolyte along external pathways, primarily along manifold gaskets, in 1987.(11) Having recognized the problem, significant progress has been made reducing electrolyte loss via creep, but the problem has not completely disappeared.
Electrolyte loss via reaction with the metal hardware can be mitigated somewhat by adding additional electrolyte to the stack to compensate. Here the culprit is lithium. Lithium ions in the electrolyte react with the nickel oxide cathode to produce a form of lithiated nickel oxide in which a few atom-percent of lithium is integrated into the nickel oxide crystal structure. This is a beneficial reaction that significantly improves the electrical conductivity of the cathode. It does, however, consume lithium. Lithium also reacts with the metal oxide protective layer that forms on the surface of the stainless steel hardware. To some extent this is also beneficial in that lithium ferrite is formed and is a good electrical conductor, thus serving to improve interfacial conductivity between the stainless steel bipolar plate and cathode. It is virtually insoluble in the electrolyte and helps to reduce the rate of corrosion of the bipolar plate. However, this oxide layer does wet with electrolyte, facilitating electrolyte creep, and it also slowly grows with time, consuming additional electrolyte.
All these consumptive processes must be taken into account and the initial composition of the electrolyte adjusted to compensate for both evaporative losses of potassium ions and reactive losses of lithium ions. The usual practice is to load a slight excess of electrolyte into the stack initially, over and above optimum filling levels, so that, despite the gradual loss of electrolyte over time, the stack will have sufficient electrolyte throughout its service life.
Degradation of the Electrolyte Support Over the past four decades of work on molten carbonate systems, lithium aluminate (LiAlO2) has emerged as the preferred material for use as an electrolyte support in the MCFC.(12, 13) The electrolyte support structure consists of a finely divided powder held in place by mechanical compression. The particle size of the lithium aluminate is selected such that the structure is about 50% porous with an average pore size that is very much smaller than the pore size of the electrodes. In fabricating the support, the lithium aluminate is mixed with binder and cast into a tape. During the stacking process, a lithium aluminate tape is placed between the two electrodes,
15
anode on the bottom and cathode on the top. A layer of electrolyte powder is then spread on top of the cathode in the gas flow channels that carry oxidant when the power plant is operating. During the initial heatup of the stack in the conditioning process, the organic binder holding the lithium aluminate powder together is evaporated, leaving behind the porous powder trapped between the electrodes. As the temperature increases, the electrolyte powder in the flow channels melts and wicks, by capillary action, through the cathode and into the lithium aluminate powder and the anode. Ideally, when the conditioning process is completed, the pores in the lithium aluminate will be 100% filled with electrolyte and the electrode pores 30 to 50% flooded with electrolyte. Optimum performance of the electrodes occurs when the smallest pores are filled with electrolyte while the largest pores remain unfilled and serve as passages for the gaseous reactants and products to move in and out of the electrode structure. Since electrolyte inventory is slowly lost with time, the usual practice is to initially fill the cells with extra electrolyte. As a consequence, the performance of the stack may actually improve slightly with time as the electrolyte inventory slowly drops and the electrode filling approaches optimum.
Because the electrolyte support is essentially a powder held together by mechanical compression of the stack, it has considerable compressive strength but no tensile or shear strength. As a result, the electrolyte support may be damaged by rapid thermal cycle during which the temperature rapidly drops below the freezing point of the electrolyte in the matrix. Micro-cracks may form in the electrolyte support as the result of differential thermal contraction and expansion during the rapid thermal cycle. These micro-cracks may remain after the stack is reheated and provide pathways for fuel or oxidant to cross from one side of the cell to the other. This lowers the net electrical efficiency of the cell and contributes an additional source of heating.
There is an additional process going on in the electrolyte. Lithium aluminate has a very slight solubility in the molten electrolyte. As a result, the larger particles of lithium aluminate will grow still larger at the expense of the smallest particles due to a process known as Ostwald ripening. Also, the finely divided lithium aluminate particles used to form the support are milled to optimum size from large particles, and thus have an irregular shape. Over time, Ostwald ripening tends to round off the sharp corners and form a smoother particle. The end result is that the average pore size of the electrolyte support structure increases with time.(13) The combination of the decreasing inventory of electrolyte and the increasing average pore size of the support results in the electrolyte support structure slowly losing electrolyte such that it no longer remains 100% filled. Percolation theory suggests that once electrolyte pore-filling falls below 95%, communicating pathways of unfilled pores will develop, allowing fuel and oxidant to cross through the electrolyte support structure. As stated above, this lowers the net electrical efficiency of the power plant and increases internal heating of the cells. Increased heating leads to accelerated electrolyte loss.
Cathode Dissolution The lithiated nickel oxide cathode of the MCFC has a very slight solubility in the molten electrolyte in the cathode environment.(14, 15) Within a few hours of reaching operating temperature, the electrolyte filling the small cathode pores becomes saturated with nickel ions, although “saturated” may be a misnomer in this case because the concentration of nickel ions in
16
the electrolyte is only a few parts per million. Nevertheless, over long periods of time these nickel ions can migrate into the electrolyte support structure, where they can deposit as nickel metal inclusions. There is an excellent study of this process in the Proceedings of the Second Symposium on Molten Carbonate Fuel Cell Technology.(16) In work as early as 1984(5), UTC claimed that the nickel deposited in such a way as to create an electrical short between anode and cathode. Other developers reported that nickel deposition in the electrolyte support structure was a common occurrence, but did not report shorting. The usual equation written for the dissolution reaction is as follows.
NiO + CO2 ⇄ Ni2+ + CO32⁻
Much work has been done in the United States and internationally addressing this issue. The link between carbon dioxide partial pressure and nickel migration was established. Thus, those developers developing MCFC prototypes designed to operate at elevated pressure were expected to have a greater problem than those working at atmospheric pressure. A link also was found between the acid/base character of the electrolyte and the solubility of nickel, which suggested that a lithium/sodium carbonate electrolyte would exhibit lower nickel solubility than a lithium/potassium carbonate electrolyte.(16) Programs also were launched in Europe, Asia, and the United States addressing development of alternative cathode materials that had very low to no solubility in the electrolyte. Argonne National Laboratory led the U.S. effort. None of the alternatives studied proved to be superior to lithiated nickel oxide with respect to electrochemical performance, ease of fabrication, and cost. In the meantime, empirical formulas were developed to predict the length of time required to develop an electrical short through nickel deposits in the electrolyte support structure, based on the carbon dioxide partial pressure in the cathode environment and the average current density of the cell. Unfortunately, each developer seemed to have his own formula. The consensus, after many years of work and discussion, was that an MCFC stack operating at atmospheric pressure with less than 30% carbon dioxide in the oxidant should survive for 40,000 hours without shorting. The longevity of the DFC product line has at least proven this assertion. However, if the life of the DFC products is to be extended to 80,000 hours (10 years), this issue will undoubtedly need to be revisited.
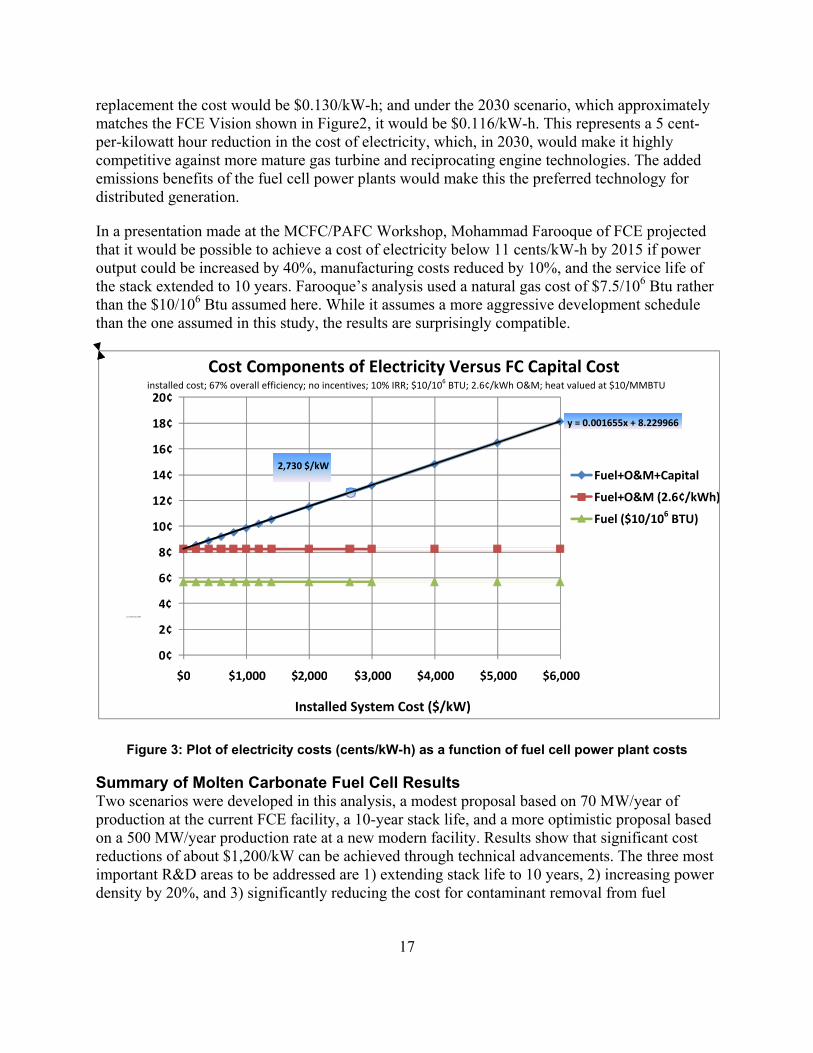
Cost Analysis Using the H2A Fuel Cell Power model, a projection for the cost of electricity was plotted as a function of first costs for the DFC 1500. Two assumptions were made: 1) O&M costs were reduced by 40% from $445,000/year to $267,000/year by extending stack life to 10 years, and 2) the cost of fuel is $10/106 Btu. This higher natural gas cost was used because this is projected to be the cost of renewable gas certificates in the future. Unlike the cost estimate provided by Engineering, Procurement & Construction, LLC (EPC) for the direct purchase of a DFC 1500 by NREL, as discussed in the introduction, these costs do include all applicable taxes and return on investment. The plot is shown in Figure 3.
Using today’s costs of about $4,000/kW, $10/106 Btu gas, and the higher $445,000 O&M costs necessitated by today’s 5-year stack replacement, the Power Model predicts $0.166/kW-h (not shown on plot.) Under the 2020 scenario shown in Table 3 ($2,730/kW), with a 10-year stack
17
replacement the cost would be $0.130/kW-h; and under the 2030 scenario, which approximately matches the FCE Vision shown in Figure2, it would be $0.116/kW-h. This represents a 5 cent-per-kilowatt hour reduction in the cost of electricity, which, in 2030, would make it highly competitive against more mature gas turbine and reciprocating engine technologies. The added emissions benefits of the fuel cell power plants would make this the preferred technology for distributed generation.
In a presentation made at the MCFC/PAFC Workshop, Mohammad Farooque of FCE projected that it would be possible to achieve a cost of electricity below 11 cents/kW-h by 2015 if power output could be increased by 40%, manufacturing costs reduced by 10%, and the service life of the stack extended to 10 years. Farooque’s analysis used a natural gas cost of $7.5/106 Btu rather than the $10/106 Btu assumed here. While it assumes a more aggressive development schedule than the one assumed in this study, the results are surprisingly compatible.
Figure 3: Plot of electricity costs (cents/kW-h) as a function of fuel cell power plant costs
Summary of Molten Carbonate Fuel Cell Results Two scenarios were developed in this analysis, a modest proposal based on 70 MW/year of production at the current FCE facility, a 10-year stack life, and a more optimistic proposal based on a 500 MW/year production rate at a new modern facility. Results show that significant cost reductions of about $1,200/kW can be achieved through technical advancements. The three most important R&D areas to be addressed are 1) extending stack life to 10 years, 2) increasing power density by 20%, and 3) significantly reducing the cost for contaminant removal from fuel
2,730 $/kW
y = 0.001655x + 8.229966
0¢
2¢
4 ¢
6¢
8¢
10¢
12¢
14¢
16¢
18¢
20¢
$0 $1,000 $ 2 , 000 $3,000 $4,000 $5,000 $6,000
Fuel+O&M+Capital
Fuel+O&M (2.6¢/kWh)
Fuel ($10/106 BTU)
Cost Components of Electricity Versus FC Capital Cost installed cost; 67% overall efficiency; no incentives; 10% IRR; $10/106 BTU; 2.6¢/kWh O&M; heat valued at $10/MMBTU
Cost of Electricity (¢/kWh)
Installed System Cost ($/kW)
18
streams, especially renewable fuel streams. These results also validate to some extent the claim that volume production will bring down costs by showing up to $1,100/kW in reduced costs for the most optimistic scenario of 500 MW/year of production. These results also suggest that neither volume production or R&D advancements will likely have an impact on reducing materials costs for the fuel cell stack, although redesign of the fabrication facility for volume production can lower overhead and labor costs. However, even under the most optimistic scenario reviewed here, it is not likely that first costs for a DFC 1500 power plant can be brought below $2,000/kW in the foreseeable future. On the other hand, if the same scaling factor holds for larger scale power plants as holds today for the DFC 3000, the installed costs of a DFC 3000 could be below $ 1,700/kW by 2030.
Although the door is open for achieving still greater cost reductions through volume production as production volumes move beyond 1 gigawatt per year, insufficient information is available to make a realistic projection of what mature technology costs would be at the multi-gigawatt production levels.
19
Gap Analysis—Phosphoric Acid Fuel Cell System
A majority of the successful R&D on PAFC components was initiated in the 1970s and continued into the early 1990s. This was the groundbreaking period for the development of high-surface-area platinum catalyst, platinum alloy catalyst (17, 18, 19), catalyst support materials, phosphoric acid electrolyte management, and corrosion resistant materials. The R&D during this 20-year period is the foundation for the commercial development of PAFC systems. A majority of the R&D was conducted by UTC through the fuel cell group International Fuel Cells (IFC). The results of this effort were four demonstration phases: 1) the first phase demonstrated the 12.5-kW PAFC system was under the T.A.R.G.E.T. program(20) with an international demonstration of 65 natural-gas–fueled power systems (21); 2) the second phase demonstrated 48 PAFC cogeneration plants rated at 40 kW and sponsored by the Energy Research and Development Administration, EPRI, and GRI; 3) the third phase demonstrated 1-MW to 11-MW PAFC power stations with the 11-MW PAFC accumulating 23,000 hours of operation (22); and 4) the fourth phase initiated in 1992 with over 250 PAFC commercial systems rated at 200 kW delivered by IFC. Although IFC (renamed UTC Power) terminated production of the 200-kW PAFC system, several of these systems still remain in operation.
To fully appreciate the significance of the gaps in the PAFC system technology, each of the following sections discussing the present status of a PAFC component or material also will be the launching point for a discussion of the R&D that will be necessary to resolve the gaps in PAFC technology. The information contained in the following discussions is abstracted from several overviews of phosphoric acid fuel cells, with heavy dependence on the following: 1) “Oxygen Electrocatalysis in Phosphoric Acid Fuel Cells” (23), 2) “Phosphoric Acid Fuel Cells for Utilities” (24), 3) Carbon—Electrochemical and Physicochemical Properties (25), and 4) the patent literature. Additional resources inputs are referenced where appropriate.
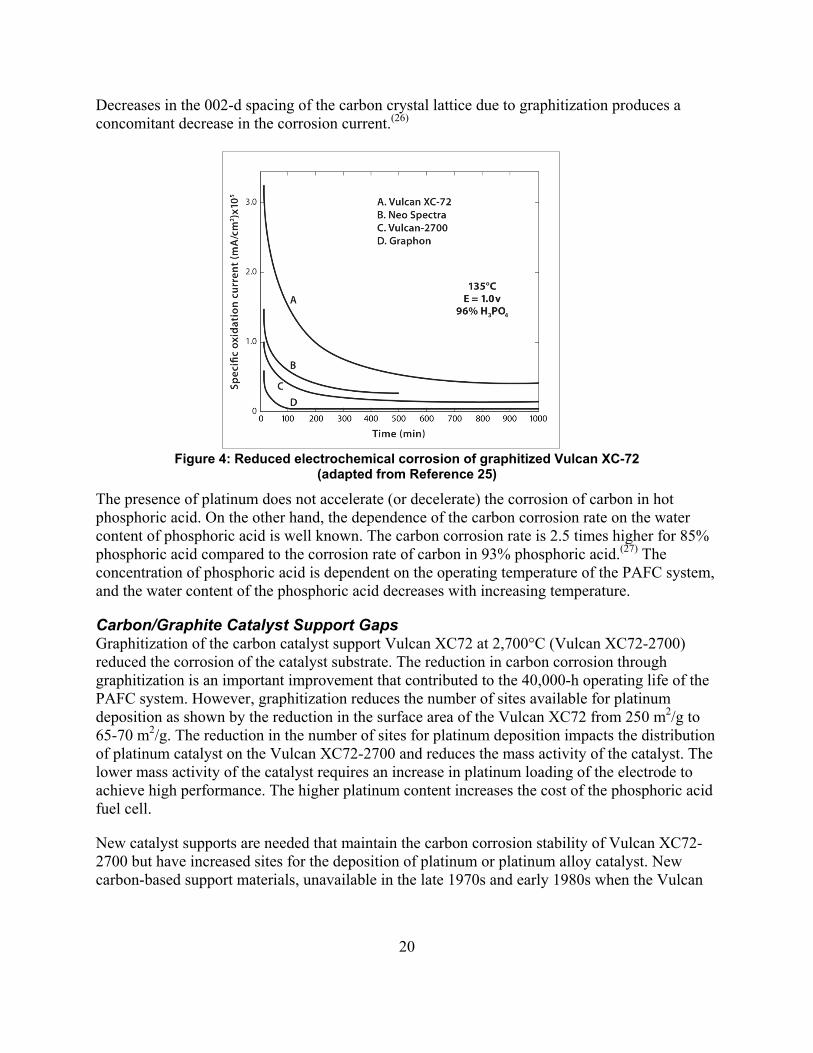
Carbon/Graphite Catalyst Support Materials The development of highly dispersed platinum on carbon black and the resulting development of gas diffusion electrodes was a major breakthrough in the development of phosphoric acid fuel cells and facilitated improved performance at low platinum loading. Corrosion of carbon blacks used as a support for the platinum catalyst became a major problem leading to degradation in the performance of the PAFCs through the loss of platinum. Oxidation undercuts the carbon support and separates the platinum crystallites from the support removing the platinum crystallite from the electrochemical process. The carbon corrosion rate increase with increasing temperature and pressure.(25) While Kinoshita’s classic book(25) is an overview of the R&D and contains the early references to this work, the book was written in 1987 and does not include the new technologies developed since that time, such as carbon nanotubes. Reduction in the rate of corrosion of the carbon supports was accomplished by the graphitization of the carbon black Vulcan XC72 at 2,700°C. The electrochemical corrosion rates were lower for graphitized Vulcan XC72 than for the carbon blacks, as shown in Figure 4. The corrosion products formed by electrochemical oxidation of the carbon support are carbon dioxide and surface oxides. Corrosion of carbon at edge sites was proposed as the mechanism of corrosion and graphitization of the carbon reduces the number of edge sites and increases the degree of organization of the carbon particles.
20
Decreases in the 002-d spacing of the carbon crystal lattice due to graphitization produces a concomitant decrease in the corrosion current.(26)
Figure 4: Reduced electrochemical corrosion of graphitized Vulcan XC-72 (adapted from Reference 25)
The presence of platinum does not accelerate (or decelerate) the corrosion of carbon in hot phosphoric acid. On the other hand, the dependence of the carbon corrosion rate on the water content of phosphoric acid is well known. The carbon corrosion rate is 2.5 times higher for 85% phosphoric acid compared to the corrosion rate of carbon in 93% phosphoric acid.(27) The concentration of phosphoric acid is dependent on the operating temperature of the PAFC system, and the water content of the phosphoric acid decreases with increasing temperature.
Carbon/Graphite Catalyst Support Gaps Graphitization of the carbon catalyst support Vulcan XC72 at 2,700°C (Vulcan XC72-2700) reduced the corrosion of the catalyst substrate. The reduction in carbon corrosion through graphitization is an important improvement that contributed to the 40,000-h operating life of the PAFC system. However, graphitization reduces the number of sites available for platinum deposition as shown by the reduction in the surface area of the Vulcan XC72 from 250 m2/g to 65-70 m2/g. The reduction in the number of sites for platinum deposition impacts the distribution of platinum catalyst on the Vulcan XC72-2700 and reduces the mass activity of the catalyst. The lower mass activity of the catalyst requires an increase in platinum loading of the electrode to achieve high performance. The higher platinum content increases the cost of the phosphoric acid fuel cell.
New catalyst supports are needed that maintain the carbon corrosion stability of Vulcan XC72-2700 but have increased sites for the deposition of platinum or platinum alloy catalyst. New carbon-based support materials, unavailable in the late 1970s and early 1980s when the Vulcan
21
XC72-2700 was developed, should be evaluated. The obvious choices are carbon nanotubes and graphene. Non-carbon materials should be considered for support materials as well.
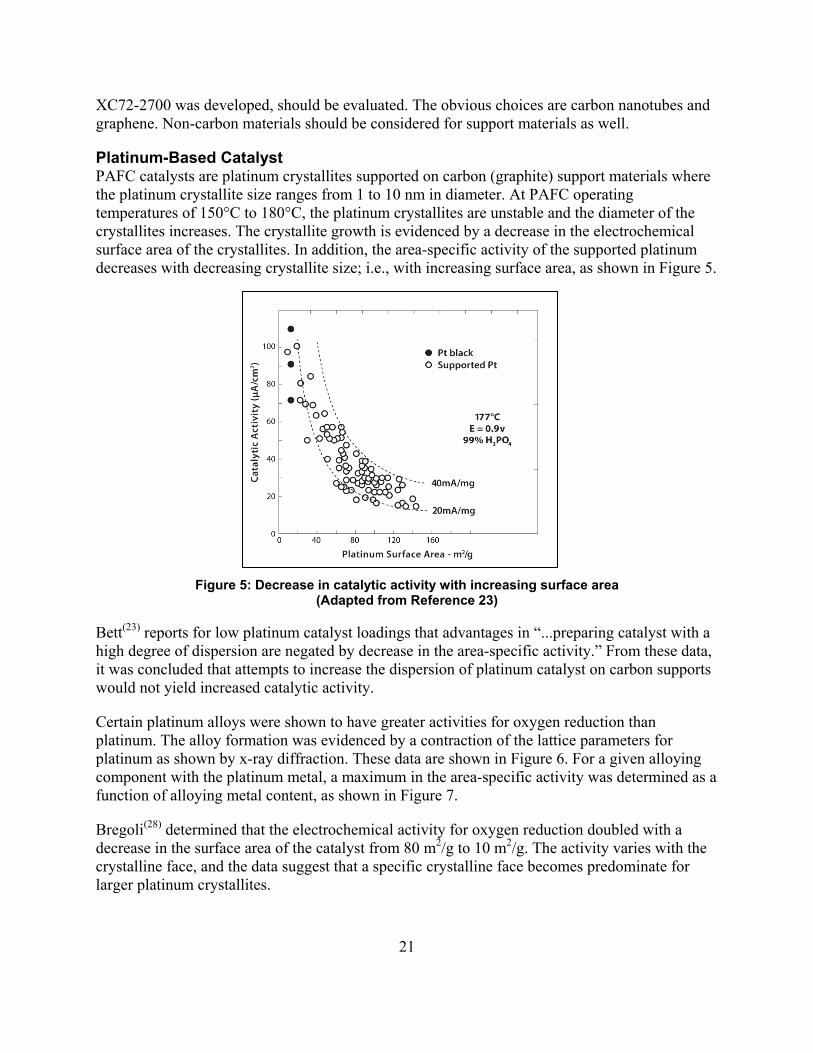
Platinum-Based Catalyst PAFC catalysts are platinum crystallites supported on carbon (graphite) support materials where the platinum crystallite size ranges from 1 to 10 nm in diameter. At PAFC operating temperatures of 150°C to 180°C, the platinum crystallites are unstable and the diameter of the crystallites increases. The crystallite growth is evidenced by a decrease in the electrochemical surface area of the crystallites. In addition, the area-specific activity of the supported platinum decreases with decreasing crystallite size; i.e., with increasing surface area, as shown in Figure 5.
Figure 5: Decrease in catalytic activity with increasing surface area (Adapted from Reference 23)
Bett(23) reports for low platinum catalyst loadings that advantages in “...preparing catalyst with a high degree of dispersion are negated by decrease in the area-specific activity.” From these data, it was concluded that attempts to increase the dispersion of platinum catalyst on carbon supports would not yield increased catalytic activity.
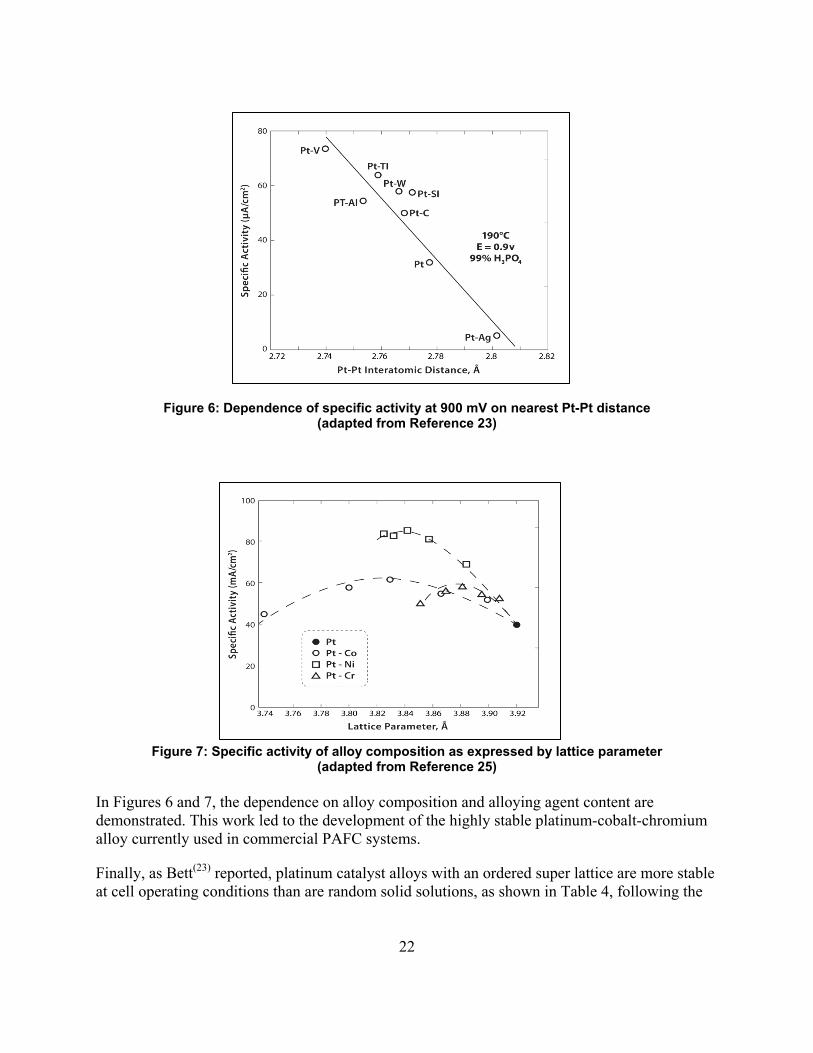
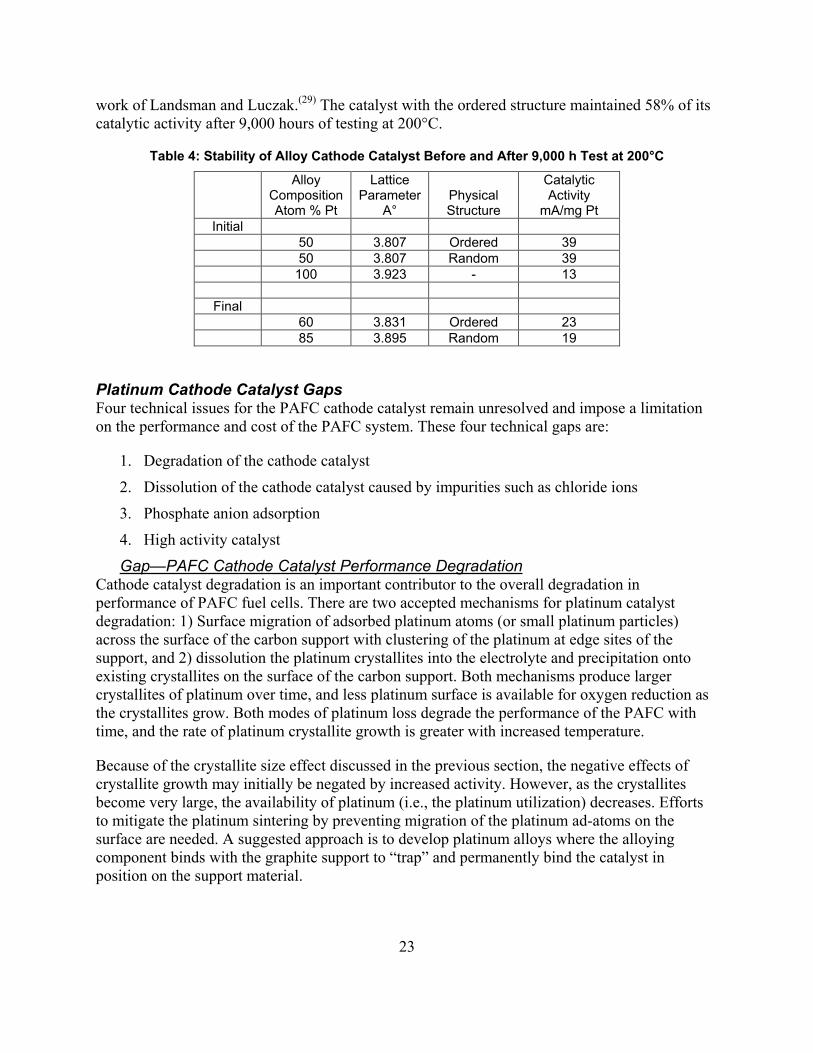
Certain platinum alloys were shown to have greater activities for oxygen reduction than platinum. The alloy formation was evidenced by a contraction of the lattice parameters for platinum as shown by x-ray diffraction. These data are shown in Figure 6. For a given alloying component with the platinum metal, a maximum in the area-specific activity was determined as a function of alloying metal content, as shown in Figure 7.
Bregoli(28) determined that the electrochemical activity for oxygen reduction doubled with a decrease in the surface area of the catalyst from 80 m2/g to 10 m2/g. The activity varies with the crystalline face, and the data suggest that a specific crystalline face becomes predominate for larger platinum crystallites.
22
Figure 6: Dependence of specific activity at 900 mV on nearest Pt-Pt distance (adapted from Reference 23)
Figure 7: Specific activity of alloy composition as expressed by lattice parameter (adapted from Reference 25)
In Figures 6 and 7, the dependence on alloy composition and alloying agent content are demonstrated. This work led to the development of the highly stable platinum-cobalt-chromium alloy currently used in commercial PAFC systems.
Finally, as Bett(23) reported, platinum catalyst alloys with an ordered super lattice are more stable at cell operating conditions than are random solid solutions, as shown in Table 4, following the
23
work of Landsman and Luczak.(29) The catalyst with the ordered structure maintained 58% of its catalytic activity after 9,000 hours of testing at 200°C.
Table 4: Stability of Alloy Cathode Catalyst Before and After 9,000 h Test at 200°C
Alloy Composition Atom % Pt
Lattice Parameter
A° Physical Structure
Catalytic Activity
mA/mg Pt Initial
50 3.807 Ordered 39 50 3.807 Random 39 100 3.923 - 13
Final 60 3.831 Ordered 23 85 3.895 Random 19
Platinum Cathode Catalyst Gaps Four technical issues for the PAFC cathode catalyst remain unresolved and impose a limitation on the performance and cost of the PAFC system. These four technical gaps are:
1. Degradation of the cathode catalyst
2. Dissolution of the cathode catalyst caused by impurities such as chloride ions
3. Phosphate anion adsorption
4. High activity catalyst
Cathode catalyst degradation is an important contributor to the overall degradation in performance of PAFC fuel cells. There are two accepted mechanisms for platinum catalyst degradation: 1) Surface migration of adsorbed platinum atoms (or small platinum particles) across the surface of the carbon support with clustering of the platinum at edge sites of the support, and 2) dissolution the platinum crystallites into the electrolyte and precipitation onto existing crystallites on the surface of the carbon support. Both mechanisms produce larger crystallites of platinum over time, and less platinum surface is available for oxygen reduction as the crystallites grow. Both modes of platinum loss degrade the performance of the PAFC with time, and the rate of platinum crystallite growth is greater with increased temperature.
Gap—PAFC Cathode Catalyst Performance Degradation
Because of the crystallite size effect discussed in the previous section, the negative effects of crystallite growth may initially be negated by increased activity. However, as the crystallites become very large, the availability of platinum (i.e., the platinum utilization) decreases. Efforts to mitigate the platinum sintering by preventing migration of the platinum ad-atoms on the surface are needed. A suggested approach is to develop platinum alloys where the alloying component binds with the graphite support to “trap” and permanently bind the catalyst in position on the support material.
24
A change in the oxygen reduction reaction on platinum occurs when chloride impurities are present in the electrolyte. Even at lower temperatures, such as PEM fuel cell temperatures, partial dissolution of the platinum catalyst is reported.(30) Sulfur impurities are detrimental to the platinum cathode catalyst, and sulfur compounds are common atmospheric impurities, especially in industrial environments. Development of platinum alloy catalysts with high stability in the presence of chloride and other impurities is needed. Alternatively, scrubbing systems that remove these critical impurities from the air prior to the air entering the fuel cell could be developed.
Gap—Dissolution of Cathode Catalyst by Impurities
A compilation of the air impurities and their effects on PAFC performance does not exist. R&D should be initiated to identify air impurities and their effect on PAFC performance.
Phosphate anion adsorption was identified by UTC Power and BASF as an important performance inhibitor for the oxygen reduction reaction at the MCFC and PAFC R&D Workshop.(31) Ross and Andriacacos(32) report phosphate anion adsorption reduces the oxygen reduction activity by a factor of 15 for trifluoromethane sulfonic acid solutions. He et al.(33) report that a Pt-Ni/C catalyst is less susceptible to phosphate anion adsorption than Pt/C. The development of a platinum alloy catalyst with a lower phosphate anion adsorption will increase the oxygen reduction reaction and improve the efficiency of the PAFC system. The voltage penalty for the reported phosphate anion adsorption varies in the open literature, but improvements of 40–100 mV are considered reasonable. Elimination of phosphate anion adsorption is the goal, and there are several approaches:
Gap—Phosphate Anion Adsorption
• Development of platinum alloy catalysts that minimize the phosphate anion adsorption is an R&D route.
• Development of alternative phosphoric acid-based electrolytes is another approach considered beneficial. PBI membranes were initially thought to eliminate or restrict phosphate ion adsorption; unfortunately, reduction of phosphate ion adsorption by PBI has not been observed.
• Development of an intermediate interface between the phosphoric acid electrolyte and the cathode catalyst is another approach.
Catalyst loading for the PAFC cathode is 0.7–1.0 mg/cm2. The development of new high performance platinum catalyst structures in PEM R&D, e.g., the nanostructure thin film catalyst developed by 3M Corp., offer the promise of increased activity and performance at reduced catalyst loadings. The 0.1 mg Pt/cm2 catalyst loadings reported for PEM are a good target; however, reduction of the PAFC cathode platinum catalyst loading by 50% would be an important improvement. A critical factor in reducing the platinum catalyst loading is to maintain durability, which requires that the research process include degradation studies.
Gap—High Performance Catalyst
25
Bipolar Plates The bipolar plates used for fuel cell systems are mixtures of carbon/graphite powder and binding resin. The corrosion of graphite in hot phosphoric acid is very low compared to non-graphitized carbon. The stability of the binding resin at phosphoric acid fuel cell operating temperatures (130°C–180°C) is a critical material property, and the corrosion of the resins limits the stability of the bipolar plates. Kinoshita(25) lists the resins classified by their material properties, as shown in Table 5.
The properties of the binders are critical to the stability of the bipolar plates. For example, bipolar plates made using polyphenylene sulfide binder cannot be operated at temperatures exceeding 163°C (325°F). Other binder materials identified from the patent literature for the formation of dense graphitic structures include furfural alcohol and furan additions to graphitic powder binders.(34)
In the fabrication of the PAFC bipolar plate, graphite powder is mixed with the resin dissolved in an organic solvent; the recommended range of graphite powder and resin is 50-60% and 50-40% by weight respectively.(35) Emanuelson et al.(35) identify the preferred resin to be a thermoset phenolic resin that has a carbon yield of greater than 50% when carbonized.
Table 5: Candidate Binder Materials for Bipolar Electrode Separators for Fuel Cells, After Kinoshita(25)
Thermoset Resins: Phenolic Resin Phenol-Formaldehyde Resin Thermoplastic Polymers: Polyphenylene Sulfide Polyether Sulfone Polyphenyl Sulfone Polyamide
The graphite particles used for the separator plates must have specific properties regarding particle size, purity, particle shape, and density.
• 45% of the particle sizes should be smaller than 50 µ in diameter, and the distribution of particle sizes should promote the greatest densification of the separator plate.
• High purity requirements eliminate volatile materials that otherwise would be lost during graphitization and result in uncontrolled porosity.
• High purity requirements also eliminate contaminants that would dissolve in phosphoric acid and poison the fuel cell catalyst.
• A granular shape is preferred to optimize the packing density and to produce uniform shrinkage in all three dimensions.
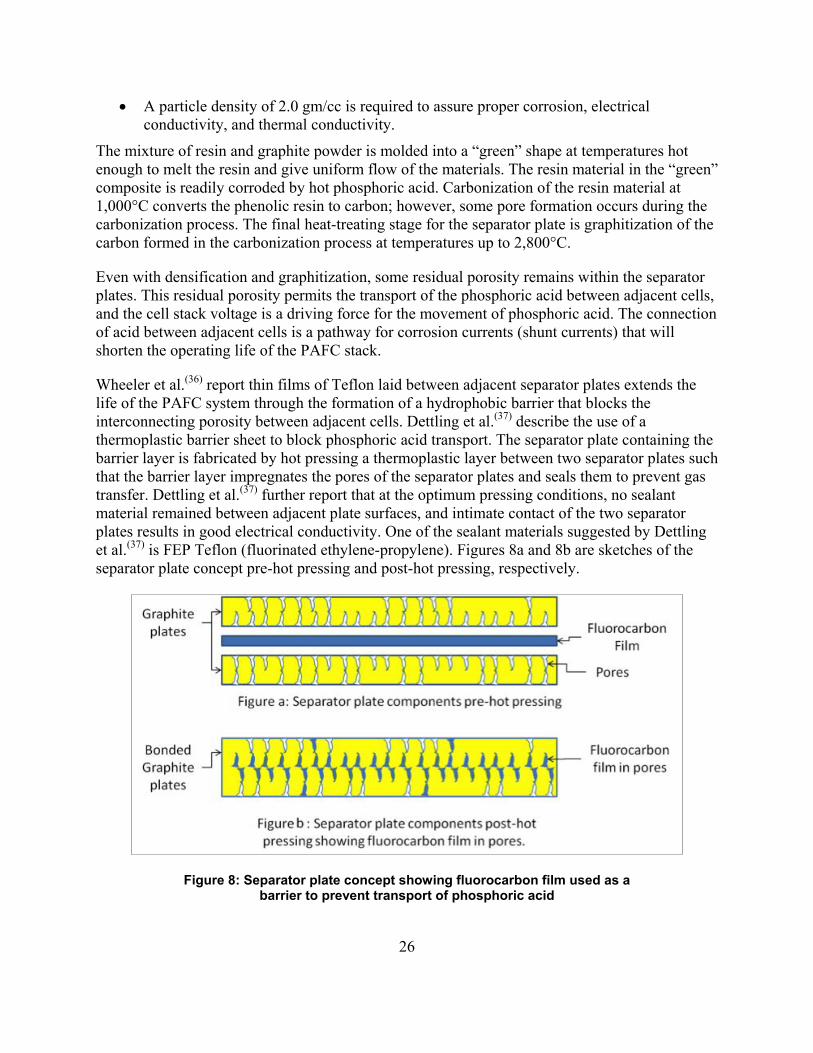
26
• A particle density of 2.0 gm/cc is required to assure proper corrosion, electrical conductivity, and thermal conductivity.
The mixture of resin and graphite powder is molded into a “green” shape at temperatures hot enough to melt the resin and give uniform flow of the materials. The resin material in the “green” composite is readily corroded by hot phosphoric acid. Carbonization of the resin material at 1,000°C converts the phenolic resin to carbon; however, some pore formation occurs during the carbonization process. The final heat-treating stage for the separator plate is graphitization of the carbon formed in the carbonization process at temperatures up to 2,800°C.
Even with densification and graphitization, some residual porosity remains within the separator plates. This residual porosity permits the transport of the phosphoric acid between adjacent cells, and the cell stack voltage is a driving force for the movement of phosphoric acid. The connection of acid between adjacent cells is a pathway for corrosion currents (shunt currents) that will shorten the operating life of the PAFC stack.
Wheeler et al.(36) report thin films of Teflon laid between adjacent separator plates extends the life of the PAFC system through the formation of a hydrophobic barrier that blocks the interconnecting porosity between adjacent cells. Dettling et al.(37) describe the use of a thermoplastic barrier sheet to block phosphoric acid transport. The separator plate containing the barrier layer is fabricated by hot pressing a thermoplastic layer between two separator plates such that the barrier layer impregnates the pores of the separator plates and seals them to prevent gas transfer. Dettling et al.(37) further report that at the optimum pressing conditions, no sealant material remained between adjacent plate surfaces, and intimate contact of the two separator plates results in good electrical conductivity. One of the sealant materials suggested by Dettling et al.(37) is FEP Teflon (fluorinated ethylene-propylene). Figures 8a and 8b are sketches of the separator plate concept pre-hot pressing and post-hot pressing, respectively.
Figure 8: Separator plate concept showing fluorocarbon film used as a barrier to prevent transport of phosphoric acid
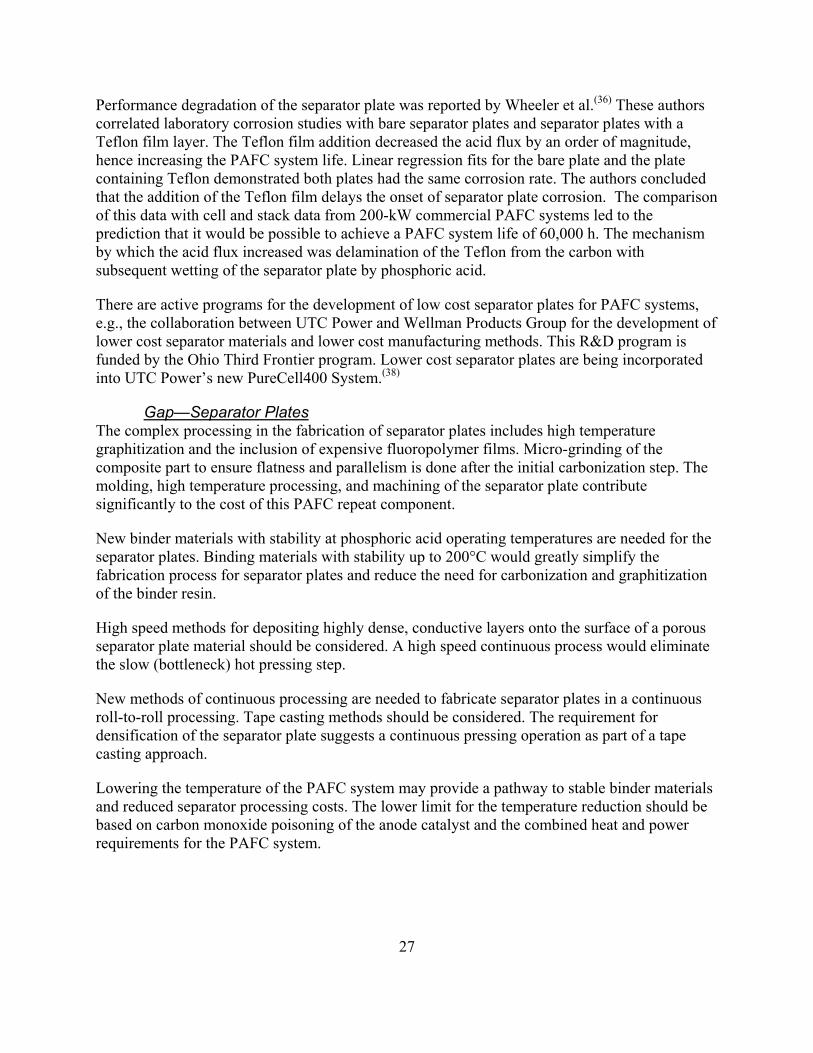
27
Performance degradation of the separator plate was reported by Wheeler et al.(36) These authors correlated laboratory corrosion studies with bare separator plates and separator plates with a Teflon film layer. The Teflon film addition decreased the acid flux by an order of magnitude, hence increasing the PAFC system life. Linear regression fits for the bare plate and the plate containing Teflon demonstrated both plates had the same corrosion rate. The authors concluded that the addition of the Teflon film delays the onset of separator plate corrosion. The comparison of this data with cell and stack data from 200-kW commercial PAFC systems led to the prediction that it would be possible to achieve a PAFC system life of 60,000 h. The mechanism by which the acid flux increased was delamination of the Teflon from the carbon with subsequent wetting of the separator plate by phosphoric acid.
There are active programs for the development of low cost separator plates for PAFC systems, e.g., the collaboration between UTC Power and Wellman Products Group for the development of lower cost separator materials and lower cost manufacturing methods. This R&D program is funded by the Ohio Third Frontier program. Lower cost separator plates are being incorporated into UTC Power’s new PureCell400 System.(38)
The complex processing in the fabrication of separator plates includes high temperature graphitization and the inclusion of expensive fluoropolymer films. Micro-grinding of the composite part to ensure flatness and parallelism is done after the initial carbonization step. The molding, high temperature processing, and machining of the separator plate contribute significantly to the cost of this PAFC repeat component.
Gap—Separator Plates
New binder materials with stability at phosphoric acid operating temperatures are needed for the separator plates. Binding materials with stability up to 200°C would greatly simplify the fabrication process for separator plates and reduce the need for carbonization and graphitization of the binder resin.
High speed methods for depositing highly dense, conductive layers onto the surface of a porous separator plate material should be considered. A high speed continuous process would eliminate the slow (bottleneck) hot pressing step.
New methods of continuous processing are needed to fabricate separator plates in a continuous roll-to-roll processing. Tape casting methods should be considered. The requirement for densification of the separator plate suggests a continuous pressing operation as part of a tape casting approach.
Lowering the temperature of the PAFC system may provide a pathway to stable binder materials and reduced separator processing costs. The lower limit for the temperature reduction should be based on carbon monoxide poisoning of the anode catalyst and the combined heat and power requirements for the PAFC system.
28
Electrolyte Reservoir Plates and Control of the Phosphoric Acid Electrolyte Content At the higher operating temperatures of the PAFC system, the vapor pressure of phosphoric acid is high and loss of the phosphoric acid through evaporation can limit the operating life of the PAFC system. Replacement of the acid by spraying fresh electrolyte into the gas stream was considered.(39) However, this approach was problematic since electrolyte would coat the outside of the cell stack and provide pathways for shorting between adjacent cells.(40) The shorting current would lead to localized corrosion of the cell components and shorten the life of the fuel PAFC system.
Electrolyte Reservoir Plate An electrolyte reservoir plate (ERP) is a porous graphite composite fabricated from graphite and binder resin but pressed and heat treated to yield a plate with controlled porosity and pore size distribution. The ERP is positioned in each cell adjacent to the anode, cathode or both electrodes.(41, 42, 43) The pore size distribution of the ERP is fabricated to assure overlap with the pore size distribution of the electrode to guarantee communication of the electrolyte between the ERP and the electrode. For the PAFC system, the ERP is a source of phosphoric acid that aids in extending the life of the PAFC to 40,000 h or more. The phosphoric acid in the pores of the ERP replaces the phosphoric acid lost through evaporation. The PAFC operates as a “trapped” electrolyte fuel cell with each individual cell containing the entire electrolyte needed for 40,000 h operation and no sharing of phosphoric acid electrolyte permitted between cells. The ERP is also a volume buffer for changes in the electrolyte volume caused by increased water content in the electrolyte, which occur as a result of large temperature swings; e.g., shutdown of the PAFC to room temperature.
In many designs, the ERP contains the flow field for the distribution of reactants. In one design, the flow field of the ERP is in contact with the separator plate, and the opposite side of the ERP is in contact with the catalyst layer. This is shown as Configuration 1 in Figure 9a. The ERP in contact with the electrode must have a pore size distribution and hydrophilic/hydrophobic properties that allow gaseous reactants and products to transport to and from the electrodes from the flow fields while still facilitating sharing of the phosphoric acid electrolyte between electrode and ERP. This is a highly engineered materials design with potentially prohibitive fabrication costs because of the need to control the physical and chemical properties of the ERP during fabrication.
In Figure 9b, an alternative configuration for the EPR with the alternative electrode/ERP/separator plate is shown. Configuration 2 has the flow fields in contact with the electrode along with the ERP. Configuration 2 relieves the requirements for transport of reactants and products through the ERP while maintaining the requirement for transport and storage of phosphoric acid. The physical and chemical properties of the ERP in Configuration 2, while more relaxed than those of ERP Configuration 1, are still consistent with a highly engineered and costly component design.
29
Figure 9: Electrolyte reservoir configuration for PAFC
The purpose of the ERP is to replenish the phosphoric acid that is lost through evaporation and to be a volume buffer for the phosphoric acid when the water content of the acid increases; e.g., at room temperature, the concentration of acid is approximately 85% while at operating temperatures the water content of the acid is effectively less than 1%. The EPR is a highly engineered materials design with high manufacturing cost and high quality control demands.
Gap—Electrolyte Reservoir Plate
• Lowering the operating temperature will reduce the vapor pressure of the phosphoric acid; a 10°F reduction produces an order of magnitude reduction in vapor pressure. The lower temperatures would reduce the volume of acid needed in the individual cells.
• Development of an alternative electrolyte membrane could lower the vapor pressure of the phosphoric acid by binding the phosphoric acid to the membrane.
• The combination of reduced temperature and a membrane that binds the phosphoric acid could eliminate the need for the highly engineered ERP.
• Development of continuous manufacturing processes is needed that would produce ERPs at high rates.
• New binder materials with stability at phosphoric acid operating temperatures are needed for the separator plates. Binding materials with stability up to 200°C also would greatly
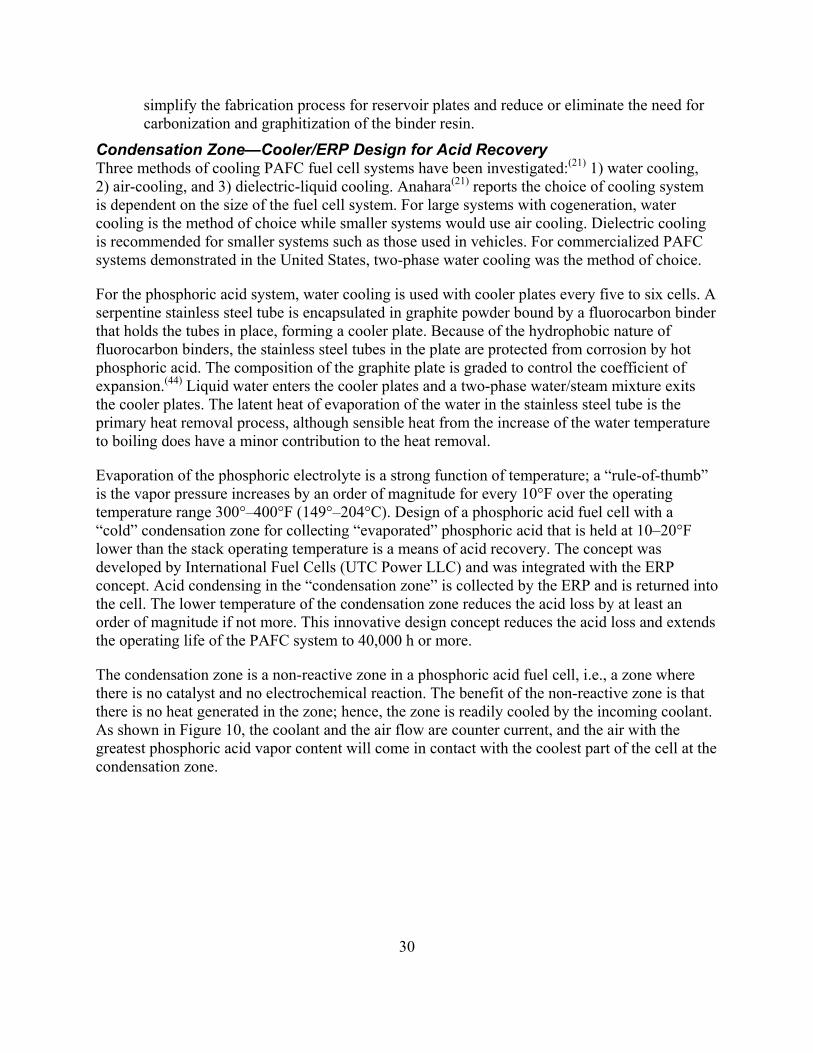
30
simplify the fabrication process for reservoir plates and reduce or eliminate the need for carbonization and graphitization of the binder resin.
Condensation Zone—Cooler/ERP Design for Acid Recovery Three methods of cooling PAFC fuel cell systems have been investigated:(21) 1) water cooling, 2) air-cooling, and 3) dielectric-liquid cooling. Anahara(21) reports the choice of cooling system is dependent on the size of the fuel cell system. For large systems with cogeneration, water cooling is the method of choice while smaller systems would use air cooling. Dielectric cooling is recommended for smaller systems such as those used in vehicles. For commercialized PAFC systems demonstrated in the United States, two-phase water cooling was the method of choice.
For the phosphoric acid system, water cooling is used with cooler plates every five to six cells. A serpentine stainless steel tube is encapsulated in graphite powder bound by a fluorocarbon binder that holds the tubes in place, forming a cooler plate. Because of the hydrophobic nature of fluorocarbon binders, the stainless steel tubes in the plate are protected from corrosion by hot phosphoric acid. The composition of the graphite plate is graded to control the coefficient of expansion.(44) Liquid water enters the cooler plates and a two-phase water/steam mixture exits the cooler plates. The latent heat of evaporation of the water in the stainless steel tube is the primary heat removal process, although sensible heat from the increase of the water temperature to boiling does have a minor contribution to the heat removal.
Evaporation of the phosphoric electrolyte is a strong function of temperature; a “rule-of-thumb” is the vapor pressure increases by an order of magnitude for every 10°F over the operating temperature range 300°–400°F (149°–204°C). Design of a phosphoric acid fuel cell with a “cold” condensation zone for collecting “evaporated” phosphoric acid that is held at 10–20°F lower than the stack operating temperature is a means of acid recovery. The concept was developed by International Fuel Cells (UTC Power LLC) and was integrated with the ERP concept. Acid condensing in the “condensation zone” is collected by the ERP and is returned into the cell. The lower temperature of the condensation zone reduces the acid loss by at least an order of magnitude if not more. This innovative design concept reduces the acid loss and extends the operating life of the PAFC system to 40,000 h or more.
The condensation zone is a non-reactive zone in a phosphoric acid fuel cell, i.e., a zone where there is no catalyst and no electrochemical reaction. The benefit of the non-reactive zone is that there is no heat generated in the zone; hence, the zone is readily cooled by the incoming coolant. As shown in Figure 10, the coolant and the air flow are counter current, and the air with the greatest phosphoric acid vapor content will come in contact with the coolest part of the cell at the condensation zone.
31
The temperature of the active region of the cell cannot be reduced below a “critical” temperature because carbon monoxide in the hydrogen-rich anode gas poisons the platinum catalyst at low temperatures. There exists a critical temperature condition within the phosphoric acid fuel cell where poisoning of the anode catalyst is minimized. Gang et al.(45) demonstrated, using contaminant-free fuel, that there was little or no polarization at 150°C but the polarization increased with decreasing temperature below this critical temperature. In the same study, the polarization at 150°C increased dramatically with increasing CO concentration. The fuel processing of natural gas in PAFC systems produces a hydrogen-rich stream with 0.5–1% CO. At an optimum fuel processing condition with the system operating temperature reduced to minimize acid evaporation, the size of the condensation zone can be reduced and the electrochemically active area of each cell increased without changing the footprint.
Figure 10: Cooler design showing the condensation zone where no electrochemistry occurs
The condensation zone was developed to collect the phosphoric acid lost through evaporation and recycle it using the EPR to replenish the electrolyte level.
Gap—Cooler and Condensation Zone
• Reduction of the PAFC system operating temperature would reduce the evaporation of the phosphoric acid and could eliminate the complex cooler-ERP design associated with the condensation zone.
• The development of a membrane that binds the acid would lower the vapor pressure of the acid and could eliminate the complex cooler-ERP design associated with the condensation zone.
Cre
dit:
Dou
glas
Whe
eler
, DJW
Tec
hnol
ogy,
LLC
32
• Replacement of the stainless steel cooler tube with lower-cost metals or with composite materials would be a cost improvement that could be combined with lower operating temperature.
• The development of improved manufacturing processes that would reduce the cost of fabrication of the cooler also should be considered. Molding of the cooler structure could be one approach.
Reformer Technology Steam reforming of natural gas is the fuel processing method used for high efficiency PAFC systems. Nitrogen impurities in the natural gas produce ammonia in the steam reforming process. The ammonia poisons the PAFC fuel cell system through the formation of (NH4)H2PO4 in the phosphoric acid(46), which lowers the conductivity of the phosphoric acid electrolyte. Methods for removing the ammonia prior to its entering the fuel cell include scrubbers containing phosphoric acid that absorb the ammonia.(47) UTC Power reported at the DOE MCFC/PAFC Workshop(31) that the cost for removal of the ammonia and the penalties associated with ammonia poisoning were excessive.
The cost of the fuel processing system could be greater than 30% of the total PAFC system cost. The high operating temperatures of the reformer require specialize materials and catalyst. The design of the reformer is based on tubes filled with catalyst (nickel) contained in a chamber heated by spent anode fuel. This design for the PAFC reformer was developed in the 1980s.
The development of a reformer catalyst that does not form ammonia in the steam reforming process is needed to reduce the operating cost of PAFC systems.
Gap—PAFC Reformers
Fuel processing systems incorporating some of the more recent reformer concepts developed by the Pacific Northwest National Laboratory(48) and others,(49) such as microchannel reformer concepts, may be a pathway to lower cost fuel processors.
Balance-of-Plant Interviews and presentations by UTC Power and BASF(31) were not particularly productive in specifying the gaps for the BOP components. Capital cost reduction is an important requirement for the BOP, which includes the development of low-cost radiator systems, low-cost condensers, and lower-cost power conditioning.
While industry has established research priorities that reflect the high cost of PAFC systems, analysis of the materials, component, and manufacturing costs are considered proprietary data. A detailed cost analysis for the PAFC system is needed similar to those conducted for the U.S. DOE PEM automotive program by TIAX(50) and Directed Technologies Inc.(51) The proposed cost analysis would provide the basis for cell component (repeat part) R&D targets and for BOP R&D targets.
Gap—Balance-of-Plant
33
Participants of the MCFC/PAFC R&D Workshop(31) agreed that first costs, consisting of capital equipment, manufacturing processes, installation, and warrantee, need to be reduced.
Cost Considerations UTC Power LLC and Fuji Electric Group are the two organizations developing and marketing large PAFC stationary systems 400 kW and 100 kW, respectively. Both UTC Power and Fuji Electric Group were contacted; and the responses were varied.
UTC Power LLC UTC Power was invited to and participated in the MCFC and PAFC R&D Workshop in January 2010(31) at which it identified key technical areas for improvement. As part of a manufacturing support project at NREL, UTC Power was visited. A tour of its manufacturing facilities identified a mixture of automated manufacturing and “Pick & Place” labor-intensive operations. UTC Power is investing in automated and continuous flow manufacturing methods as a means of increasing product throughput and driving down the cost of the 400-kW PureCell400.
UTC Power will deliver 20 PureCell400 units in 2010. It only manufactures units based on firm orders. UTC Power anticipates delivering 100 PureCell400 systems in 2011. UTC Power did not address when production rates could reach 1,000 to 10,000 units per year.
UTC Power considers cost a critical, proprietary component for its business and identifies as proprietary the specific costs for materials, components, manufacturing costs, supplier costs, subsystem costs, and assembly costs. UTC Power did provide some general information regarding costs:
• Cell stack costs need to be reduced. Cell stack components are identified as “repeat” parts by UTC Power because the number of these parts is extremely large. Repeat parts include the membrane electrode assemblies (MEAs) (and the components to make MEAs), bipolar separator plates, electrolyte reservoir plates, and perimeter seals.
• The fuel processing system contributes a large cost to the 400-kW stationary system; and the natural gas reformer is largest cost component for fuel processing. It is possible that the reformer cost could equal or exceed the cost of the stack.
• Power conditioning is a high subsystem cost that needs to be lowered.
• BOP components need a cost reduction effort. Because of the low production rates (20 PureCell400 units in 2010, driving down radiator, heat exchanger, and blower costs is difficult.
A top-level estimate of critical materials costs was developed to determine what levels of improvement could be anticipated for platinum catalyst reductions and for materials cost reduction for the separator plates. The assumed baseline case for the estimate is given in Table 6. Detailed technical specifications for the PureCell400 are not available, so values from the PAFC literature were used where necessary.
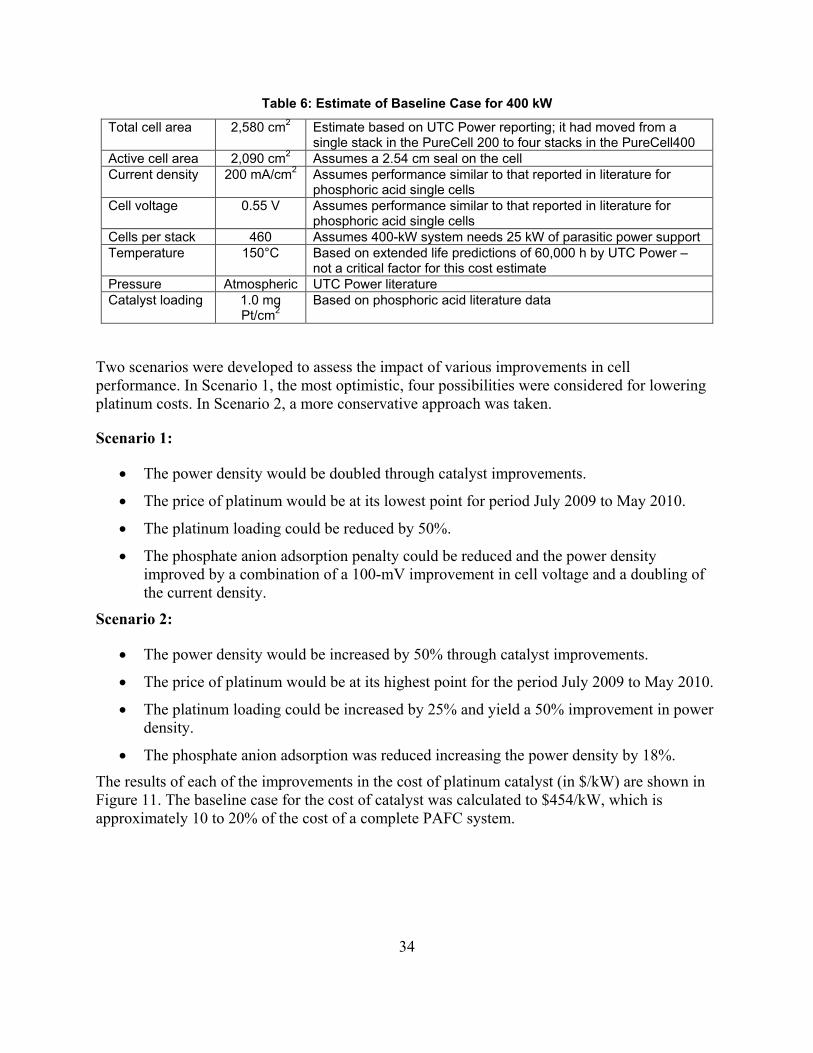
34
Table 6: Estimate of Baseline Case for 400 kW
Total cell area 2,580 cm2 Estimate based on UTC Power reporting; it had moved from a single stack in the PureCell 200 to four stacks in the PureCell400
Active cell area 2,090 cm2 Assumes a 2.54 cm seal on the cell Current density 200 mA/cm2 Assumes performance similar to that reported in literature for
phosphoric acid single cells Cell voltage 0.55 V Assumes performance similar to that reported in literature for
phosphoric acid single cells Cells per stack 460 Assumes 400-kW system needs 25 kW of parasitic power support Temperature 150°C Based on extended life predictions of 60,000 h by UTC Power –
not a critical factor for this cost estimate Pressure Atmospheric UTC Power literature Catalyst loading 1.0 mg
Pt/cm2 Based on phosphoric acid literature data
Two scenarios were developed to assess the impact of various improvements in cell performance. In Scenario 1, the most optimistic, four possibilities were considered for lowering platinum costs. In Scenario 2, a more conservative approach was taken.
Scenario 1:
• The power density would be doubled through catalyst improvements.
• The price of platinum would be at its lowest point for period July 2009 to May 2010.
• The platinum loading could be reduced by 50%.
• The phosphate anion adsorption penalty could be reduced and the power density improved by a combination of a 100-mV improvement in cell voltage and a doubling of the current density.
Scenario 2:
• The power density would be increased by 50% through catalyst improvements.
• The price of platinum would be at its highest point for the period July 2009 to May 2010.
• The platinum loading could be increased by 25% and yield a 50% improvement in power density.
• The phosphate anion adsorption was reduced increasing the power density by 18%.
The results of each of the improvements in the cost of platinum catalyst (in $/kW) are shown in Figure 11. The baseline case for the cost of catalyst was calculated to $454/kW, which is approximately 10 to 20% of the cost of a complete PAFC system.
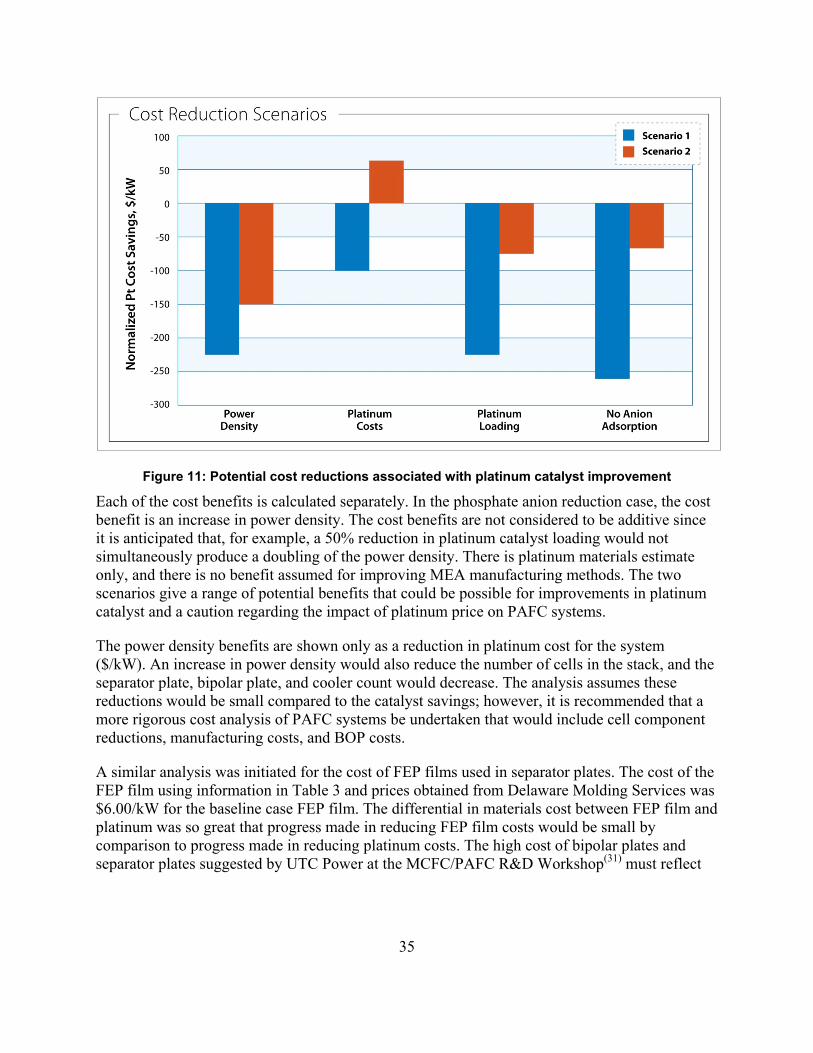
35
Figure 11: Potential cost reductions associated with platinum catalyst improvement
Each of the cost benefits is calculated separately. In the phosphate anion reduction case, the cost benefit is an increase in power density. The cost benefits are not considered to be additive since it is anticipated that, for example, a 50% reduction in platinum catalyst loading would not simultaneously produce a doubling of the power density. There is platinum materials estimate only, and there is no benefit assumed for improving MEA manufacturing methods. The two scenarios give a range of potential benefits that could be possible for improvements in platinum catalyst and a caution regarding the impact of platinum price on PAFC systems.
The power density benefits are shown only as a reduction in platinum cost for the system ($/kW). An increase in power density would also reduce the number of cells in the stack, and the separator plate, bipolar plate, and cooler count would decrease. The analysis assumes these reductions would be small compared to the catalyst savings; however, it is recommended that a more rigorous cost analysis of PAFC systems be undertaken that would include cell component reductions, manufacturing costs, and BOP costs.
A similar analysis was initiated for the cost of FEP films used in separator plates. The cost of the FEP film using information in Table 3 and prices obtained from Delaware Molding Services was $6.00/kW for the baseline case FEP film. The differential in materials cost between FEP film and platinum was so great that progress made in reducing FEP film costs would be small by comparison to progress made in reducing platinum costs. The high cost of bipolar plates and separator plates suggested by UTC Power at the MCFC/PAFC R&D Workshop(31) must reflect
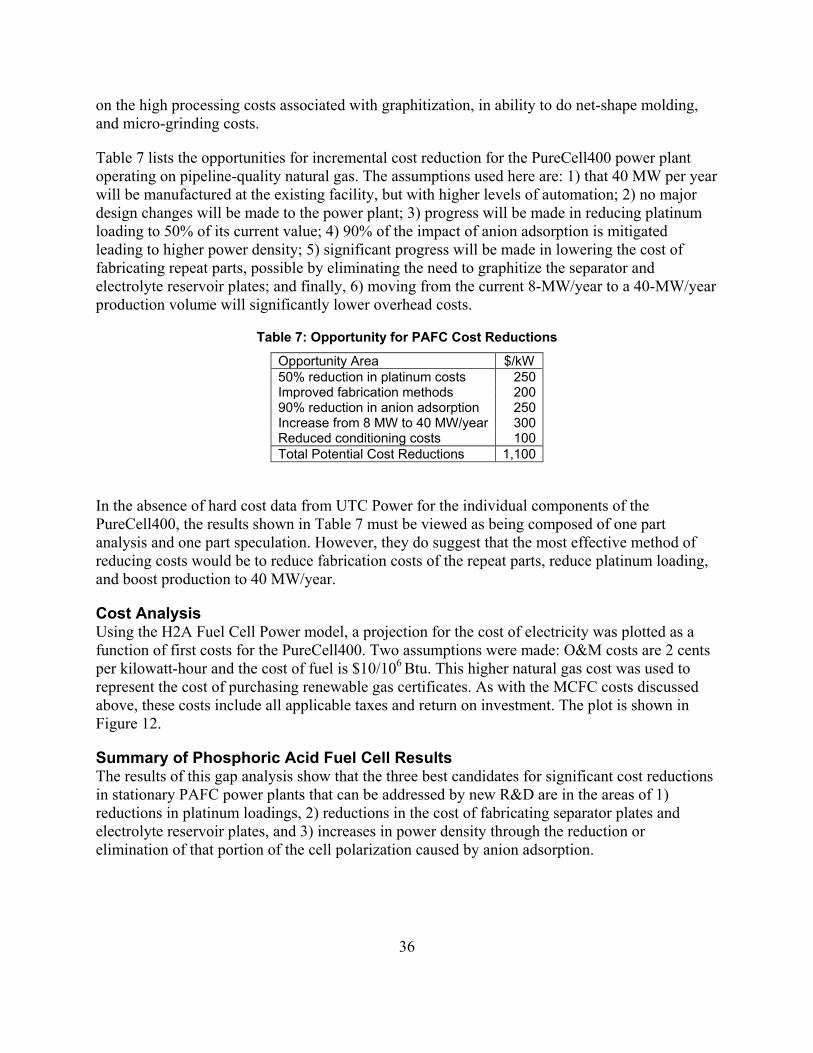
36
on the high processing costs associated with graphitization, in ability to do net-shape molding, and micro-grinding costs.
Table 7 lists the opportunities for incremental cost reduction for the PureCell400 power plant operating on pipeline-quality natural gas. The assumptions used here are: 1) that 40 MW per year will be manufactured at the existing facility, but with higher levels of automation; 2) no major design changes will be made to the power plant; 3) progress will be made in reducing platinum loading to 50% of its current value; 4) 90% of the impact of anion adsorption is mitigated leading to higher power density; 5) significant progress will be made in lowering the cost of fabricating repeat parts, possible by eliminating the need to graphitize the separator and electrolyte reservoir plates; and finally, 6) moving from the current 8-MW/year to a 40-MW/year production volume will significantly lower overhead costs.
Table 7: Opportunity for PAFC Cost Reductions
Opportunity Area $/kW 50% reduction in platinum costs 250 Improved fabrication methods 200 90% reduction in anion adsorption 250 Increase from 8 MW to 40 MW/year 300 Reduced conditioning costs 100 Total Potential Cost Reductions 1,100
In the absence of hard cost data from UTC Power for the individual components of the PureCell400, the results shown in Table 7 must be viewed as being composed of one part analysis and one part speculation. However, they do suggest that the most effective method of reducing costs would be to reduce fabrication costs of the repeat parts, reduce platinum loading, and boost production to 40 MW/year.
Cost Analysis Using the H2A Fuel Cell Power model, a projection for the cost of electricity was plotted as a function of first costs for the PureCell400. Two assumptions were made: O&M costs are 2 cents per kilowatt-hour and the cost of fuel is $10/106 Btu. This higher natural gas cost was used to represent the cost of purchasing renewable gas certificates. As with the MCFC costs discussed above, these costs include all applicable taxes and return on investment. The plot is shown in Figure 12.
Summary of Phosphoric Acid Fuel Cell Results The results of this gap analysis show that the three best candidates for significant cost reductions in stationary PAFC power plants that can be addressed by new R&D are in the areas of 1) reductions in platinum loadings, 2) reductions in the cost of fabricating separator plates and electrolyte reservoir plates, and 3) increases in power density through the reduction or elimination of that portion of the cell polarization caused by anion adsorption.
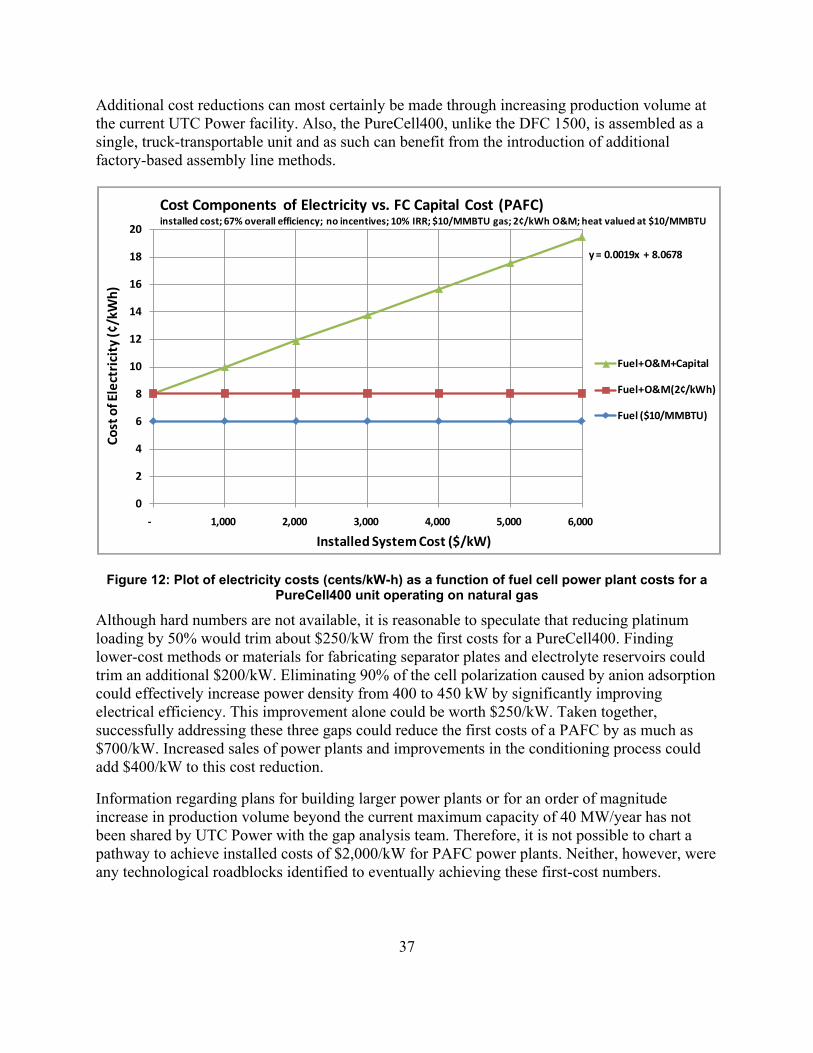
37
Additional cost reductions can most certainly be made through increasing production volume at the current UTC Power facility. Also, the PureCell400, unlike the DFC 1500, is assembled as a single, truck-transportable unit and as such can benefit from the introduction of additional factory-based assembly line methods.
Figure 12: Plot of electricity costs (cents/kW-h) as a function of fuel cell power plant costs for a PureCell400 unit operating on natural gas
Although hard numbers are not available, it is reasonable to speculate that reducing platinum loading by 50% would trim about $250/kW from the first costs for a PureCell400. Finding lower-cost methods or materials for fabricating separator plates and electrolyte reservoirs could trim an additional $200/kW. Eliminating 90% of the cell polarization caused by anion adsorption could effectively increase power density from 400 to 450 kW by significantly improving electrical efficiency. This improvement alone could be worth $250/kW. Taken together, successfully addressing these three gaps could reduce the first costs of a PAFC by as much as $700/kW. Increased sales of power plants and improvements in the conditioning process could add $400/kW to this cost reduction.
Information regarding plans for building larger power plants or for an order of magnitude increase in production volume beyond the current maximum capacity of 40 MW/year has not been shared by UTC Power with the gap analysis team. Therefore, it is not possible to chart a pathway to achieve installed costs of $2,000/kW for PAFC power plants. Neither, however, were any technological roadblocks identified to eventually achieving these first-cost numbers.
y = 0.0019x + 8.0678
0
2
4
6
8
10
12
14
16
18
20
- 1,000 2,000 3,000 4,000 5,000 6,000
Fuel+O&M+Capital
Fuel+O&M(2¢/kWh)
Fuel ($10/MMBTU)
Installed System Cost ($/kW)
Cost
of E
lect
rici
ty (¢
/kW
h)
Cost Components of Electricity vs. FC Capital Cost (PAFC)installed cost; 67% overall efficiency; no incentives; 10% IRR; $10/MMBTU gas; 2¢/kWh O&M; heat valued at $10/MMBTU
38
References
1. Mahadevan, K., Judd, K., Boczek, B., Leibrand, A., and Sommer, A., “Analysis and Opportunity for Fuel Cell Application at Data Centers and Wastewater Treatment Plants,” Presented at the 2008 Fuel Cell Seminar, Phoenix, Arizona, October 29, 2008.
2. Patel, P., FuelCell Energy, Inc., Private conversation, June 10, 2010.
3. Liss, W.E., Thrasher, W.H., Steinmetz, G.F., Chowdiah, P., and Attari, A., Variability of Natural Gas Composition in Selected Major Metropolitan Areas of the United States, Gas Research Institute report number GRI-92/0123 (1992).
4. Development of Molten Carbonate Fuel Cell Power Plant, Final Report for US DOE Contract No. DE-AC02-80ET17019, DOE Report No. DOE/ET/17019-20, prepared by General Electric (March 1985).
5. King, J.M., Meyer, A.P., Reiser, C.A., and Schroll, C.R., Molten Carbonate Fuel Cell System Verification and Scale-Up, Final Report for EPRI Research Project EM 1273-1, prepared by United Technologies Corporation, Power Systems Division (October 1984).
6. Paetsch, L., Pigeaud, A., Chamberlin, R., and Maru, H., Development of Molten Carbonate Fuel Cell Components, Final Report for EPRI Research Project No. 1085-3, EPRI Report No. AP-5789, prepared by Energy Research Corporation (July 1988).
7. Patel, P.S., Paetsch, L.M., and Maru, H.C., Development of Internal Reforming Molten Carbonate Fuel Cells, Final Report for EPRI Research Project No. 2344-1, EPRI Report No. GS-7221, prepared by Energy Research Corporation (May 1991).
8. Marianowski, L.G., Ong, E.T., Petri, R.J., and Remick, R.J., “Development of Internal Manifold Heat Exchanger Molten Carbonate Fuel Cell Stacks,” Presented at the 42nd Meeting of the International Society of Electrochemistry, Montreux, Switzerland, August 25-30, 1991.
9. Kaun, T.D., Shoeler, A., Centeno, C.J., and Krumpelt, M., “Improved MCFC Performance with Li/Na/Ba/Ca Carbonate Electrolyte,” Proceedings of the Fifth International Symposium on Carbonate Fuel Cell Technology, The Electrochemical Society, Pennington, NJ Proceedings Volume 99-20, pp. 219-227 (1999).
10. Fuel Cell Research on Second-Generation Molten-Carbonate Systems, Final Report for US DOE for Contract No. DE-AC03-78-ET-11276, prepared by the Institute of Gas Technology, DOE Report No. SAN-11276-4.
11. Kunz, H.R., “Transport of Electrolyte in Molten Carbonate Fuel Cells,” J. Electrochemical Soc.; 134, 1987; pp. 105-113.
39
12. Paetsch, L.M., Doyon, J.D., and Farooque, M., “Review of Carbonate Fuel Cell Matrix and Electrolyte Developments,” Proceedings of the Third International Symposium on Carbonate Fuel Cell Technology, pages 89-105 Vol. 93-3, The Electrochemical Society, Pennington, NJ (1993).
13. Ota, K., “Materials Durability for MCFC,” Proceedings of the Forth International Symposium on Carbonate Fuel Cell Technology, pp 238-252 Vol. 97-4, The Electrochemical Society, Pennington, NJ (1997).
14. Ong, E.T., and Camara, E.H., Molten Carbonate Fuel Cell Research and Development, Final Report on EPRI Project No. 1085-10, EPRI Report No. GS-7166, prepared by Institute of Gas Technology, (February 1991).
15. Shores, D.A., “Materials Problems and Solutions in the Molten Carbonate Fuel Cell,” Proceedings of the 14th RISØ International Symposium on Materials Science: High Temperature Electrochemical Behavior of Fast Ion and Mixed Conductors, RISØ National Laboratory, Roskilde, Denmark (1993) p. 137.
16. Shores, D.A., Selman, J.R., Israni, S., and Ong, E.T., “Degradation of NiO Cathodes: Modeling and Experimental Studies,” Proceedings of the Second Symposium on Molten Carbonate Fuel Cell Technology, Vol. 90-16, The Electrochemical Society, Pennington, NJ (1990).
17. Jalan, V.M., and Bushnell, C.L., “Method for Producing Highly Dispersed Catalytic Platinum,” U.S. Patent No. 4,136,059 (December 12, 1977)
18. Luczak, F.J., and Landsman, D.A., “Ternary Fuel Cell Catalysts Containing Platinum, Cobalt, and Chromium,” U.S. Patent No. 4,447,506. 17 January 1983.
19. Luczak, F.J., “Ternary Alloy Fuel Cell Catalysts and Phosphoric Acid Fuel Cell Containing the Catalysts,” U.S. Patent No. 5,013,618. 5 September 1989.
20. Appleby, John A., Fuel Cell Handbook, Van Reinhold, Co., New York (1989).
21. Anahara, R., “Phosphoric Acid Fuel Cell Systems,” Blomen, L.M.J., and Mugerwas, M.N., eds. Fuel Cell Systems, Plenum Press, (1993) ISBN 0-306-44158-6.
22. Hoffman, P., and Harken, T., Tomorrow’s Energy: Hydrogen, Fuel Cells, and the Prospects for a Cleaner Planet. MIT Press, Cambridge, MA 2002.
23. Bett, J.A.S., “Oxygen Electrocatalysis in Phosphoric Acid Fuel Cells,” invited lecture at the Workshop on Structural Effects in Electrocatalysis and Oxygen Electrochemistry, Cleveland, Ohio, October 29 to November 1, 1991.
40
24. Stonehart, P., and Wheeler, D., “Phosphoric Acid Fuel-Cells (PAFCs) for Utilities: Electrocatalysis Crystallite Design, Carbon Support, and Matrix Materials Challenges,” Chapter 4. Conway, B.E., Vayenas, C.G., White, R.E., and Gamboa-Adelco, M.E., eds. Modern Aspects of Electrochemistry, No. 38, Kluwer Academic/Plenum Publishers, New York (2005) ISBN 978-0-306-48703-3.
25. Kinoshita, K., Carbon – Electrochemical and Physiochemical Properties. [Location]: John Wiley & Sons. 1987.
26. Kinoshita, K., “Influence of Heat-Treatment and Physiochemical Properties on the Electrochemical Oxidation of Carbon Blacks in Phosphoric Acid,” Proceedings of the Workshop on the Electrochemistry of Carbon. 1984.
27. Kinoshita, K., and Bett, J., “Electrochemical Oxidation of Carbon Black in Concentrated Phosphoric Acid at 135°C,” Carbon, 11. 1975. page 237.
28. Bregoli, L.J., “The Influence of Platinum Crystallite Size on the Electrochemical Reduction of Oxygen in Phosphoric Acid,” Electrochimca Acta, 23, 1976, p. 489.
29. Luczak, F.J., and Landsman, D.A., “Ordered Ternary Fuel Cell Catalyst Containing Platinum and Cobalt and Method for Making the Catalyst,”, U.S. Patent No. 4,677,092. 23 December 1985.
30. Matsuoka, K., Sakamoto, S., Nakato, K., Hamada, A., and Itoh, Y., “Degradation of Polymer Electrolyte Fuel Cells Under the Existence of Anion Species,” J. Power Sources, 179, 2008.
31. Remick, R., and Wheeler, D., MCFC and PAFC R&D Workshop Summary Report, prepared for the U.S. Department of Energy, January 2010. Available on line at http://www1.eere.energy.gov/hydrogenandfuelcells/mcfc_pafc.html
32. Ross, P., and Andriacacos, P.C., J. Electroanal. Chem. 154, 1983.
33. He, Q., Shyam, B., Ramaswany, N., Ramaker, D., and Mukerjee, S., “Towards Mediation of Phosphate Anion Poisoning to Anodic platinum/C Catalyst by Alloying Pt with Ni in. Phosphoric Acid Fuel Cell,” Meeting Abstract, Electrochem. Soc. 901, 119, 2009.
34. McWhorter, W.C., and Dykes, N.L., “Method and Composition for Preparing Graphite Products,” U.S. Patent No. 3,708,451. 8 September 1971.
35. Emanuelson, R.C., Luoma, W.L., and Taylor, W.A., “Method for Making Improved Separator Plates for Electrochemical Cells,” U.S. Patent No. 4,360,485. 8 June 1981.
36. Wheeler, D., Luczak, F., Fredley, R., and Cipollini, N., “Carbon and Fluorinated Carbon Materials for Fuel Cells,” Ginley, D.S., Doughty, D.H., Takamura, T., Zhang, Z., and Scrosati,
41
B., eds, Materials for Electrochemical Energy Storage and Conversion II – Batteries, Capacitors, and Fuel Cells, Mater. Res. Soc. Symp. Proceedings, Volume 496, Pittsburgh, PA, 1998.
37. Dettling, C.J., and Terry, P.L., “Integral Gas Seal for Fuel Cell Gas Distribution Assemblies and Method of Fabrication,” U.S. Patent No. 4,505,992. 11 April 1983.
38. Note: Ohio Third Frontier Fuel Cell Program, 2010
39. Katz, M., and Kunz, H.R., “Method for Replacing Lost Electrolyte in Fuel Cells,” U.S. Patent No. 4,596,748. 11 April 1984.
40. Katz, M., “Analysis of Electrolyte Shunt Currents in Fuel Cell Power Plants,” J. Electrochem. Soc., 125, 4, 1978.
41. Lamarine, J.H., Stewart Jr., R.C., and Vine, R.W., “Electrode Reservoir for a Fuel Cell,” U.S. Patent No. 4,038,463 (September 1, 1976)
42. Grevstad, P.E., “Electrolyte Reservoir for a Fuel Cell,” U.S. Patent No. 4,035,551. 1 September 1, 1976.
43. Bushness, C.L., and Kunz, H.R., “Electrolyte Reservoir for a Fuel Cell,” U.S. Patent No. 4,064,322. 1 September 1976.
44. Breault, R.D., Martin, R.E., Roche, R.P., Scheffler, G.W., and O’Brien, J.J., “Coolant Plate Assembly for a Fuel Cell Stack,” U.S. Patent No. 6,050,331. 22 March 1996.
45. Gang, X., Qingfeng, L., Hjuler, H.A., and Bjerrum, N.J., “Hydrogen Oxidation on Gas Diffusion Electrodes for Phosphoric Acid Fuel Cells in the Presence of Carbon Monoxide and Oxygen,” J. Electrochem. Soc., 142, 9. 1995.
46. Szmanski, S.T., Gruver, G.A., Katz, M., and Kunz, H.R., “The Effects of Ammonia on Hydrogen-Air Phosphoric Acid Fuel Cell Performance,” J. Electrochem. Soc., 127, 7. 1980.
47. Foley, P.F., Luczak, F.J., Preston Jr., J.L., Teeling, C.R., Breault, R.D., Fredley, R.R., and Scheffler, G.W., “System for Treatment of Acid Fuel Cell Fuel Gas Stream,” U.S. Patent No. 5,792,572. 31 May 1996.
48. Lee, A., Tonkovich, Y., and Wang, Y., “Overview of Early-Stage Microchannel Reactor Development at Pacific Northwest National Laboratory,” Microreactor Technology and Process Intensification, Chapter 3, ACS Symposium Series, Volume 914, 2005.
49. Patil, A.S., Dubois, T.G., Sifer, N., Bostic, E., Gardner, K., Quah, M., and Bolten, C., “Portable Fuel Cell Systems for America’s Army: Technology Transition to the Field,” J. Power Sources, 136. 2004.

42
50. Sinha, J., Lasher, S., and Yang, Y., “Direct Hydrogen PEMFC Manufacturing Cost Estimation for Automotive Applications,” Presented at the 2009 DOE Hydrogen Program Review, May 2009
51. James, B., and Kalinoski, J., “Mass-Production Cost Estimation of Automotive Fuel Cell Systems,” presented at the 2009 DOE Hydrogen Program Review. May 2009.
F1147-E(10/2008)
REPORT DOCUMENTATION PAGE Form Approved OMB No. 0704-0188
The public reporting burden for this collection of information is estimated to average 1 hour per response, including the time for reviewing instructions, searching existing data sources, gathering and maintaining the data needed, and completing and reviewing the collection of information. Send comments regarding this burden estimate or any other aspect of this collection of information, including suggestions for reducing the burden, to Department of Defense, Executive Services and Communications Directorate (0704-0188). Respondents should be aware that notwithstanding any other provision of law, no person shall be subject to any penalty for failing to comply with a collection of information if it does not display a currently valid OMB control number. PLEASE DO NOT RETURN YOUR FORM TO THE ABOVE ORGANIZATION. 1. REPORT DATE (DD-MM-YYYY)
September 2010 2. REPORT TYPE
Technical Report 3. DATES COVERED (From - To)
4. TITLE AND SUBTITLE
Molten Carbonate and Phosphoric Acid Stationary Fuel Cells: Overview and Gap Analysis
5a. CONTRACT NUMBER DE-AC36-08-GO28308
5b. GRANT NUMBER
5c. PROGRAM ELEMENT NUMBER
6. AUTHOR(S) R. Remick and D. Wheeler
5d. PROJECT NUMBER NREL/TP-560-49072
5e. TASK NUMBER H278.2106
5f. WORK UNIT NUMBER
7. PERFORMING ORGANIZATION NAME(S) AND ADDRESS(ES) National Renewable Energy Laboratory 1617 Cole Blvd. Golden, CO 80401-3393
8. PERFORMING ORGANIZATION REPORT NUMBER NREL/TP-560-49072
9. SPONSORING/MONITORING AGENCY NAME(S) AND ADDRESS(ES)
10. SPONSOR/MONITOR'S ACRONYM(S) NREL
11. SPONSORING/MONITORING AGENCY REPORT NUMBER
12. DISTRIBUTION AVAILABILITY STATEMENT National Technical Information Service U.S. Department of Commerce 5285 Port Royal Road Springfield, VA 22161
13. SUPPLEMENTARY NOTES
14. ABSTRACT (Maximum 200 Words) Technical and cost gap analyses were performed to identify pathways for reducing the costs of molten carbonate fuel cell (MCFC) and phosphoric acid fuel cell (PAFC) stationary fuel cell power plants. No single issue was identified that could achieve major cost reductions. However, the three most important MCFC R&D areas to be addressed are 1) extending stack life to 10 years, 2) increasing power density by 20%, and 3) significantly reducing the cost for contaminant removal from fuel streams, especially from renewable fuel streams. One issue is platinum costs. At 10% to 15% of the current installed costs of a PAFC power plant, platinum costs represent an Achilles heel of the PAFC technology. In the case of the current PAFC power plants marketed by UTC Power, a reduction in fabrication costs also represents an opportunity for cost reduction. One of the most important issues is contaminant removal. Development of a cost-effective process for removing contaminants, especially those found in renewable fuels, would have an impact well beyond the fuel cell communities.
15. SUBJECT TERMS molten carbonate fuel cell; mcfc; pafc; phosphoric acid fuel cell; stationary fuel cell analysis; fuel cell power plant
16. SECURITY CLASSIFICATION OF: 17. LIMITATION OF ABSTRACT
UL
18. NUMBER OF PAGES
19a. NAME OF RESPONSIBLE PERSON a. REPORT
Unclassified b. ABSTRACT Unclassified
c. THIS PAGE Unclassified 19b. TELEPHONE NUMBER (Include area code)
Standard Form 298 (Rev. 8/98) Prescribed by ANSI Std. Z39.18