PHYSIOLOGICAL AND MOLECULAR MECHANISMS OF HEAVY METAL TOLERANCE

1
Molecular Surface Chemistry by Metal Single Crystals and
Nanoparticles from Vacuum to High Pressure
Gabor A. Somorjai 1, 2,* and Jeong Y. Park1, 2 1Department of Chemistry, University of California, Berkeley, CA 94720
2Materials Sciences Division and Chemical Sciences Division, Lawrence Berkeley
National Laboratory, Berkeley, CA 94720
Abstract
Model systems for studying molecular surface chemistry have evolved from single
crystal surfaces at low pressure to colloidal nanoparticles at high pressure. Low pressure
surface structure studies of platinum single crystals using molecular beam surface
scattering and low energy electron diffraction techniques probe the unique activity of
defects, steps and kinks at the surface for dissociation reactions (H-H, C-H, C-C, O=O
bonds). High-pressure investigations of platinum single crystals using sum frequency
generation vibrational spectroscopy have revealed the presence and the nature of reaction
intermediates. High pressure scanning tunneling microscopy of platinum single crystal
surfaces showed adsorbate mobility during a catalytic reaction. Nanoparticle systems are
used to determine the role of metal-oxide interfaces, site blocking and the role of surface
structures in reactive surface chemistry. The size, shape and composition of nanoparticles
play important roles in determining reaction activity and selectivity.
*To whom correspondence should be addressed. E-mail: [email protected]

2
I. Introduction
Much of the research by Gerhard Ertl’s group is focused on vacuum studies of
reactive chemistry on single crystal surfaces, with a special emphasis on chemisorption 1,
2. During the last forty years, both molecular surface science and surface technologies
underwent explosive development 3. Instruments are now available that permit atomic
scale analysis of the structure and composition of surfaces in a vacuum and at solid-gas
and solid-liquid interfaces during active catalytic reactions4,5,6,7.
The three types of surfaces studied are shown in Figure 1. External surfaces are
generally single crystals (Figure 1a) 8. Internal surfaces are where most of the surface
area is located inside the micropores or mesopores 9, 10. These surfaces may contain metal
nanoparticles for catalytic purposes (Figure 1b). Nanoparticles are fabricated by
lithography techniques or synthesized in colloidal solutions (Figure 1c) 11-13.
The current technologies developing most rapidly within modern surface
chemistry are shown in Figure 2 14. These applications include catalysis, biointerfaces,
electrochemistry and corrosion. The properties and technologies based on these
properties can now be revisited, allowing for studies and increased understanding on the
molecular scale. For example tribology, the science of friction, lubrication and wear, has
experienced a renaissance with the development of new technologies of superior
lubricants, wear-resistant coatings, and new nanotribological tools such as friction force
microscopy 15, 16.
This review focuses on the catalytic reactivity of platinum to show how the
evolution of molecular surface chemistry led to more advanced applications of this metal.
Platinum is the grandfather of all catalysts and is outstanding for carrying out many
chemical reactions. It was first used in 1823 to produce flames, aiding the combustion of
hydrogen in air. Paul Sabatier compiled a book on organic reactions accelerated by
platinum at the end of the 19th Century 17, 18. Today, platinum is the main component of
the catalytic converter in automobiles that cleans the exhaust gases. The metal is also
used to produce high-octane gasoline from naphtha.
Our studies indicate that the platinum surface restructures during catalytic
reactions. It has a different structure when it carries out oxidation reactions than when it
3
rearranges organic molecules. This chameleon-like behavior makes it very versatile in
many catalytic reactions19-21. Three aspects of the study of molecular surface chemistry
of the metal are highlighted here; the study of platinum single crystal surfaces in a
vacuum, the catalytic activity of platinum single crystal surfaces in high pressures and
the synthesis, characterization and catalytic reactions on platinum nanoparticles 1-10 nm
in size.
II. The Study of Platinum Single Crystal Surfaces in a Vacuum and at Low (‹ 10-5
Torr) Pressures
II.a. Low energy electron diffraction (LEED)
The surface structure of clean surfaces and adsorbed molecules were uncovered
using Low energy electron diffraction (LEED) surface crystallography 8, 22, 23. A
schematic of LEED is shown in Figure 3a. The small (~1 cm2) single-crystal sample is
cleaned in an ultrahigh vacuum chamber, usually using a chemical wash or ion-
bombardment. Afterwards, the crystal is heated to permit the ordering of surface atoms
through diffusion to equilibrium positions. An electron beam, in the energy range of 10-
200 eV, is back-scattered from the surface and detected as a function of energy and angle.
Due to the small mean free path of low energy electrons, this technique is sensitive to the
atomic surface arrangement. Figure 3b show the LEED patterns of Pt(111) and Pt(557)
surfaces representing the hexagonal and stepped surface structures.
LEED surface crystallography studies resulted in the discovery of the
reconstruction of clean surfaces. A surface is formed by cutting through the solid parallel
to a chosen plane of atoms. Surface reconstruction is caused by the asymmetry of the
atomic arrangement at the interface, leading to a change in the electronic states near and
at the surface that reduces surface free energy. This results in a change in the equilibrium
position of surface atoms. Figure 4a shows the surface reconstruction of the clean Pt
(100) 24 surface to the (l x 5) surface structure.

4
By monitoring the intensity of the diffracted beams as a function of their kinetic
energy, the surface structure of many organic molecules, such as ethylene on Pt (111),
was determined 25. The surface structure includes such details as precise bond distances
and bond angles. Figure 4b shows metal surface restructuring induced by ethylene (C2H4)
adsorption in the form of ethylidyne (C2H3), indicating that the adsorbate-surface
interaction induces both the molecular rearrangement of the adsorbate and the
reconstruction of metal surfaces around the adsorption site. These studies and others25
show that adsorbate-induced restructuring of metal surfaces form configurations similar
to metal-organic complexes.
II. b. Molecular beam surface scattering
Parallel with these studies of surface structures, molecular beam surface scattering
was developed and used for studying reactions and energy transfer between incident
molecules and the metal surface atoms 26. A well-collimated beam of molecules with a
uniform and known translational energy and known rotational and vibrational state
populations strikes a clean metal surface. Some of the molecules are back-reflected after
a very short residence time, while others are trapped for much longer times before
desorbing. By measuring the amount of translational energy exchanged by detecting the
velocity and angular distribution of the scattered molecules with a suitable time-of-flight
analysis, the gas-surface energy transfer process can be described. Figure 5a shows a
schematic of molecular beam surface scattering where the beams of molecules are
directed towards the surface.
Figure 5b shows molecular beam scattering results from studies of H2-D2
exchange. These results indicate that atomic steps on metal surfaces break chemical
bonds, in this case hydrogen-hydrogen bonds, with unit reaction probability. That is,
every hydrogen molecule dissociated when scattered from the stepped platinum surface.
When a defect-free platinum (111) crystal face was studied, the dissociation probability
of molecular hydrogen was below the detection limit of 10-3 27. Combined molecular
beam surface scattering and LEED-surface structure studies revealed the unique activity

5
of defects, atomic steps and kinks on metal surfaces in dissociating H-H, C-H, C-C, C≡O
and O=O bonds.
III. Catalytic Activity of Platinum Single Crystal Surfaces at High Pressures
III.a. Development of instruments for high pressure studies
Catalytic reactions cannot be fully studied in a vacuum because of the very low
reaction probability inhibiting their detection. Techniques utilized to study surfaces
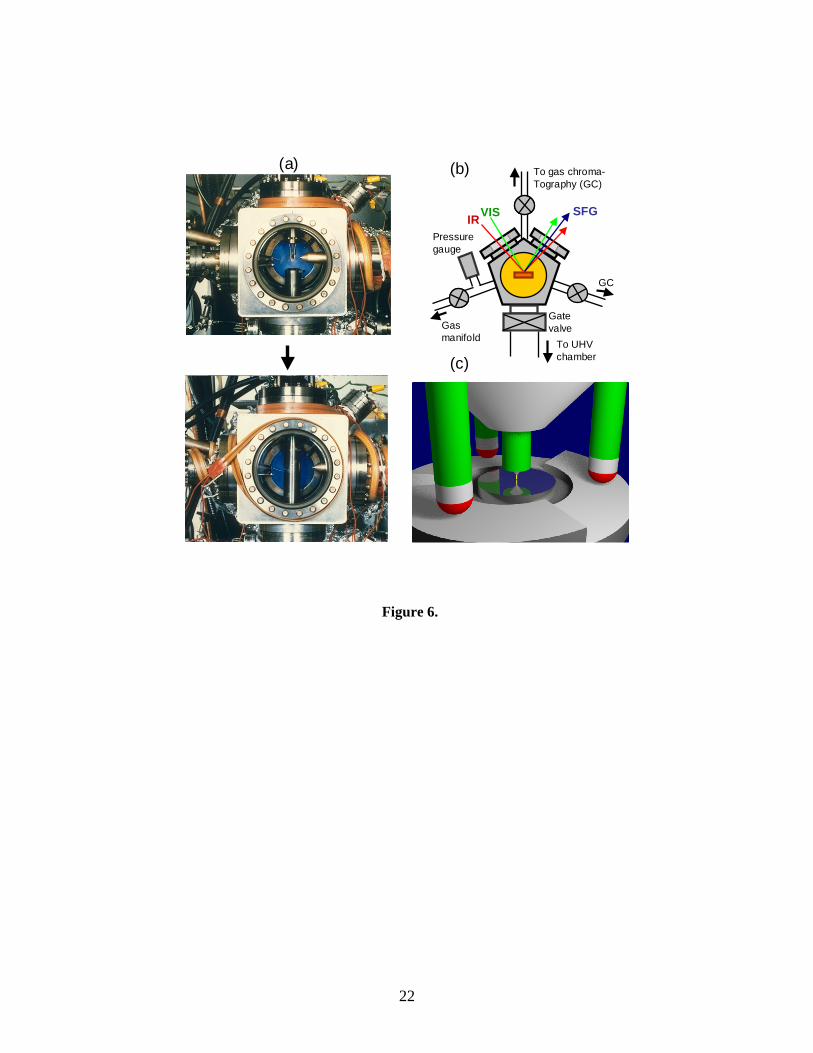
under pressure have been developed. This review highlights three techniques developed
for studying surfaces at high pressure: a high pressure-ultra high vacuum combined
system, sum frequency generation (SFG) vibrational spectroscopy and scanning tunneling
microscopy. Schematics of these three techniques are shown in Figure 6.
A high pressure-ultra high vacuum combined system permitted both reaction
studies at high pressures and surface analysis, which needed vacuum before and after
reactions (Figure 6a). Using these hybrid systems, we investigated various catalytic
reactions, including ammonia synthesis on iron, rhenium crystal surfaces and
hydrocarbon conversion reactions over platinum. The reaction rate and product
composition was found to depend upon the surface structure 28.
SFG vibrational spectroscopy is a surface-specific optical technique (Figure 6b) 6 ,
29, 30, 31 , 32. One or both laser frequencies are tuned and overlapped both spatially and
temporally on the surface of interest. SFG is a second-order nonlinear optical process,
and as such a signal is forbidden from a centrosymmetric medium, such as the bulk of
face centered cubic crystals or an isotropic high pressure gas or a liquid 33, 34. However,
at the surface or interface, the second order susceptibility is non-zero. The overall
efficiency of the SFG process will be enhanced when one of the beams is in resonance
with a vibrational level of a species at the interface. By scanning one of the lasers in the
infrared frequency regime, a sum frequency signal can be obtained, and the surface yields
a vibrational spectrum that is sensitive only to molecules adsorbed on the surface. This
signal is in the visible frequency range.

6
High pressure scanning tunneling microscopy (HPSTM) provides atomically
resolved images of surfaces under high gas pressures and during catalytic reactions 35-37
(Figure 6c). While most spectroscopic techniques yield time-averaged information of
structure and bonding, STM detects surface dynamics when motion of adsorbates and
metal atoms occurs at speeds comparable to or less than the scan rate of approximately 10
µm/s.
III.b. Study of benzene hydrogenation with high pressure techniques
SFG vibrational spectroscopy and high pressure STM were used to monitor the
surface reaction intermediates and surface mobility during benzene hydrogenation38.
Benzene hydrogenation is an industrially relevant reaction in petroleum refining and
downstream chemical processing and has two products: cyclohexene and cyclohexane.
SFG vibrational spectroscopy under high-pressure benzene hydrogenation revealed three
characteristic vibrational bands on the Pt (111) surface, H-C-C-, vinylic (H-C=C-), and
physisorbed benzene bands (Figure 7a) 38, 39 .
Interestingly, when the surface is scanned during the reaction turnover of benzene
hydrogenation, no scanning tunneling microscopy pictures are seen. Large scale images
(~1000 Å) still reveal the same platinum steps regularly observed, but no molecular
surface structure can be resolved (Figure 7b). This indicates that the adsorbed monolayer
of molecules and atoms is now too mobile to be imaged with STM. The maximum
scanning speed at which high resolution images can be obtained is 10 nm/msec, but
several scans may be necessary to image an entire molecule. Molecules that diffuse or
adsorb/desorb on a faster time scale than this are not able to be resolved. The formation
of this mobile overlayer also corresponds to the onset of catalytic activity, as monitored
by the mass spectrometer 37. Once the reaction stops due to surface poisoning by carbon
monoxide, ordered structures form and no reaction product is formed (Figure 7c). The
high-coverage pure CO structure corresponds to the (√19 x √19) R23.4° structure 40. All
benzene adsorbates have been displaced by the strongly bound and closely packed CO
molecules. The high mobility of adsorbates on the surface under reaction conditions is
important in freeing up active sites, which results in catalytic turnover.

7
IV. Synthesis, Characterization and Catalytic Reactions on Platinum
Nanoparticles in the 1-10 nm Range. Influence of Size, Shape and Support
IV.a. Synthesis of Pt nanoparticles and development of 2D and 3D nanoparticle
arrays
Model single crystal catalysts cannot identify all of the active sites that are
important for catalytic selectivity, since catalysts are usually nanoparticles supported on
oxide surfaces. Therefore, we developed model nanoparticles by lithography techniques
and colloid chemistry-controlled nanoparticle synthesis (Figure 1c and Figure 8). These
nanoparticles are placed on a Langmuir-Blodgett trough and pulled as a monolayer film at
various densities. This approach allows two-dimensional metal nanoparticle arrays to be
formed41. The average inter-particle spacing can be tuned by varying surface pressure.
This approach has the advantage that size and composition of the nanoparticles can be
controlled. The formation of an oxide–metal interface between nanoparticles and substrate
can also be obtained when synthesized using this colloidal process. Various surface
techniques, such as X-ray photoelectron spectroscopy (XPS) and atomic force microscopy
(AFM), can be utilized to characterize chemical composition and morphology of 2D
nanoparticle arrays before and after chemical reactions. Figure 8 shows an SEM image of
hexadecylthiol-capped Pt nanoparticle arrays on a silicon wafer. Nanoparticles can be
incorporated in mesoporous high surface area oxides such as SBA-15 42. A TEM image of
platinum nanoparticles encapsulated in mesoporous silica with a channel structure (SBA-
15) is also shown in Figure 8. This process forms a 3-dimensional model catalyst system
with high surface area (> 1 m2/g).
With stabilizing agents, the colloid nanoparticles permit us to control the size and
shape that are required to precisely quantify catalytic influences. This is in contrast to the
approach using Pt clusters to prepare conventional oxide-supported Pt catalysts that have
been used for several decades. The nanoparticles created are within a single crystalline
domain, meaning the particles can be created with a precise control of both shape and size.
This allows for very controlled experiments that answer questions about the roles of steps
8
and kinks as reactive sites, as well as better understanding of the role surface structure
plays in determining catalytic activity and selectivity. The porous nature of capping layers
allows the reactants and products to travel through the capping layer, exhibiting
reproducible measurements of turnover rate.
Our focus was to create platinum, rhodium or bimetallic nanoparticles that can be
produced with monodispersity and well-controlled shape 34, 42, 43. Using hexachloro
platinic acid or rhodium acetyl-acetonate as a precursor monomer, we could produce
monodispersed metal nanoparticles that were individually coated with a polymer cap to
prevent aggregation in solution. As the particles nucleate and grow, they are held in a
polymer with pores sized to allow growth to 1-8 nm as shown in Fig 9a. Particle size is
controlled by the monomer concentration. With suitable changes to the growth parameters,
the shape of these particles is controlled. Figure 9b shows cubic, cuboctahedral, and
porous Pt nanoparticles prepared using tetradecyltrimethylammonium tromide (TTAB) as
a surface-stabilizing reagent. By changing the pH value of the NaBH4 (reducing solution
which contributes to control of the reduction rate), shape evolution from cuboctahedra to
cubes was observed. Porous particles were obtained by reduction in ascorbic acid.
IV.b. Influence of size, shape and composition of metallic nanoparticles on the
activity and selectivity
Size dependence of Pt nanoparticles
Reaction selectivity is a major focus of 21st century catalysis science. That is, if
there are several thermodynamically stable products, only one desired product is formed 44-46. We have investigated some typical multipath reaction selectivities: benzene and
cyclohexene hydrogenation. Reaction selectivity is much less understood than reaction
activity of single-product catalytic reactions, such as ammonia synthesis or ethylene
hydrogenation. A very small change in competing potential energy barriers changes the
product selectivity dramatically. These changes can be caused by structural changes or
the use of additives.

9
Figures 10a and 10b shows reaction selectivity and activation energy for
cyclohexene hydrogenation/dehydrogenation on Pt nanoparticles in SBA-15 as a function
of particle size. These results show that benzene formation declines as particle size
increases, while cyclohexene formation remains unchanged with changes in particle size.
The activation energy for dehydrogenation to benzene increases with increasing particle
size. This result implies that the size of the nanoparticles is important for control of
reaction selectivity.
Shape dependence of Pt nanoparticles
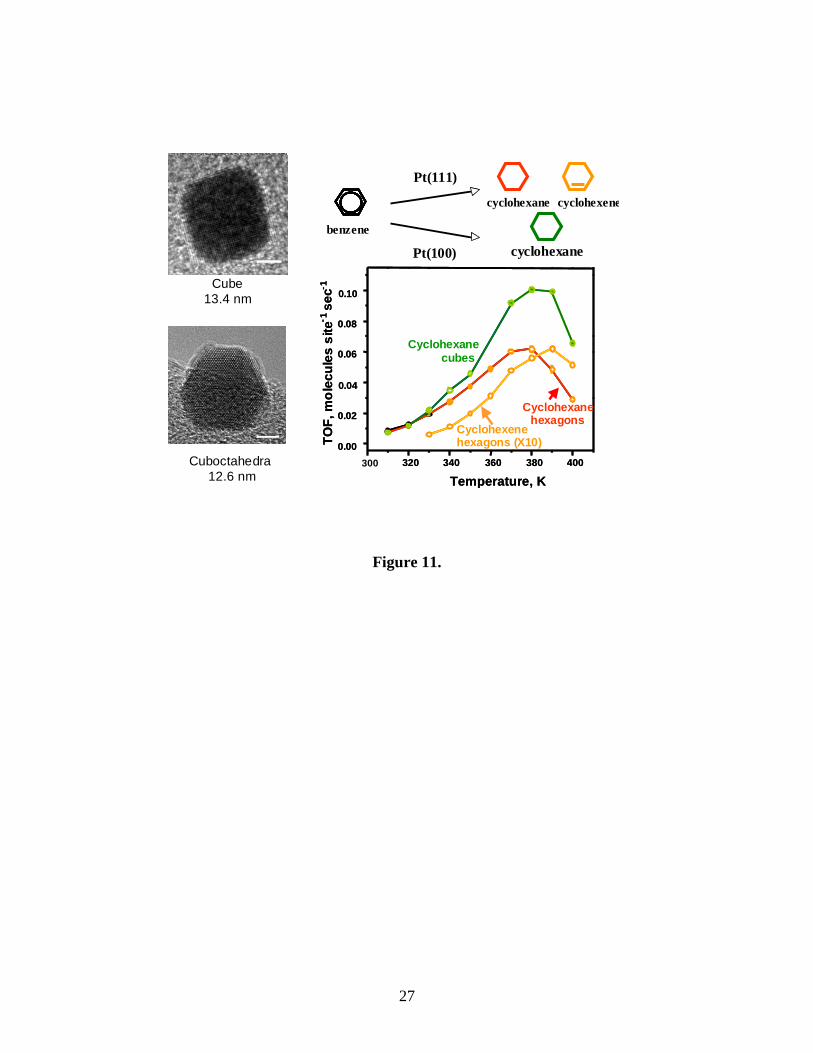
We studied the form of benzene hydrogenation that produces cyclohexane and
cyclohexene on the platinum (111) surface and cyclohexene on the (100) face. SFG
studies on platinum (100) and (111) identified π-allyl c-C6H9 as the most abundant
reactive intermediate47. This reaction intermediate was found on the Pt(100) surface, but
not on the Pt (111) surface. This indicates that adsorbed cyclohexene more readily
dehydrogenates to form π-allyl c- C6H9 on the Pt(100) surface than on the Pt(111)
surface.
This face specificity of benzene hydrogenation makes it suitable for probing
nanoparticle shape-dependent reaction selectivity. Benzene hydrogenation studies on
cubooctahedra and cubic Pt nanoparticles demonstrated that cyclohexene and
cyclohexane formed on cuboctahedral nanoparticles, while only cyclohexane formed on
cubic nanoparticles, consistent with previous results for single-crystal Pt surfaces (Figure
11) 46. This study indicates the importance of nanoparticle shape in determining reaction
selectivity.
Composition dependence of catalytic reaction rates of bimetallic nanoparticles
Composition is another important factor that influences catalytic activity and
selectivity. Pt-Rh bimetallic nanoparticles with variable composition and constant size (9

10
± 1 nm) were synthesized by a one-pot polyol synthetic method 48. The activity of CO
oxidation on these bimetallic nanoparticles was studied 49.
Colloid techniques are used to take chloroplatinic acid or a rhodium precursor (like
rhodium acetyl/acetonate), and in the presence of a polymer (PVP). These metal ions are
then reduced in alcohol. Figure 12b shows the TEM images of monodispersed Rh0.4Pt0.6
nanoparticles. The size was 9.3 ± 1.2 nm, which was determined by measuring 150
nanocrystals from a TEM image. Once monodispersed particles with the desired size and
composition are obtained, we can put them in a Langmuir trough and apply a certain
surface pressure to deposit different densities of nanoparticle monolayer films. Figure 12b
shows the XPS spectra measured on two dimensional RhxPt1-x (x = 0-1) nanoparticle
arrays on a silicon surface. We found that the intensity of the Rh3d peak increases, while
the Pt4f and Pt4d peaks decrease as the composition of Rh increases.
We found that the turnover rate of a pure Rh nanoparticle is 20 times that of a Pt
nanoparticle under the reaction conditions used (100 Torr O2, 40 Torr CO at 180 °C).
RhxPt1-x (x =0.2-0.8) particles exhibit an intermediate activity as shown in Figure 12c,
while the activation energy increases from 25 to 27 kcal/mol with increasing rhodium
content.
The observation that pure Rh nanoparticles are more reactive than Pt nanoparticles
is consistent with the earlier CO oxidation studies on thin films 50 and single crystals 30, 51.
It is associated with differences in the initial dissociative sticking probability of oxygen (Pt
is 0.2 and Rh is 1.0) 52, 53. As shown in Figure 12c, the reactivity of CO oxidation increases
nonlinearly as a function of Rh composition. This tendency could be due to preferential
migration of Pt to the surface, giving rise to a higher surface concentration of Pt compared
to the bulk concentration 54. The results demonstrate the possibility of controlling catalytic
activity in metal nanoparticle-oxide systems via tuning the composition of the
nanoparticles.
V. Correlations and Future Directions
It is necessary to use in-situ, surface sensitive techniques (SFG and STM), to
monitor nanoparticles as they undergo reactions, just as single crystal surfaces were

11
monitored during chemical reactions 34, as shown in the schematic in Figure 13. The
SFG studies of pyridine hydrogenation were successful in detecting pyridinium cation
(C5H5NH+) reaction intermediates on TTAB covered platinum nanoparticles and the
formation of fully hydrogenated piperidine molecules as reaction products in the gas
phase 55. Preliminary studies using STM indicate that the metal nanoparticles cannot be
imaged because of the polymer capping. Work is in progress to remove the polymer
capping to prepare the exposed nanoparticles for STM studies.
Enzyme catalysts, homogeneous or heterogeneous catalysts are all nanoparticles.
For example, cytochrome C has a 4 nm catalytic site, where inside the protein ligands are
1.4 nm in size. A single site olefin polymerization catalyst, which is homogeneous, is 1.6
nm in size. Platinum nanoparticles are available that are active in the 1-10 nm regime.
Nature and technology produce catalysts in nanometer scales because the small
number of atoms permits the flexible rearrangement of atomic position in the catalyst.
Rearranging the catalyst surface requires breaking metal-metal bonds that requires energy.
When a metal atom has fewer neighbors, as would be the case in a nanoparticle, less
energy is required for rearrangement to occur. The reacting molecules, reaction
intermediates and products must alter their bond distances to rearrange rapidly. Reaction
is favored when relatively small number of bonds of the reacting molecules to be broken
and reformed. Catalysis takes place more easily in a nanoparticle form, where less atoms
and molecules participate in the restructuring during the catalytic turnover. The unique
catalytic properties of nanoparticles and capability of controlling catalytic activity and
selectivity by tuning their shape, size and composition can bring new opportunities in
fundamental understanding of molecular surface chemistry and in major chemical energy
conversion technologies.
Acknowledgement
This work was supported by the Director, Office of Science, Office of Basic Energy
Sciences, Division of Materials Sciences and Engineering of the U.S. Department of
Energy under Contract No. DE-AC02-05CH11231.

12
Figure Captions
Figure 1. The three types of surfaces studied. (a) External surfaces: Platinum (111) surface.
(b) Internal surfaces: the surface area located inside the structure, such as mesoporous
silica. (c) Nanoparticles: atomic force microscopy (AFM) image of platinum nanoparticles
made by electron beam lithography; transmission electron microscopy (TEM) image of
cubic nanoparticles synthesized in colloidal solutions.
Figure 2. The current technologies developing most rapidly within modern surface
chemistry
Figure 3. (a) Schematic of LEED instrumentation and (b) LEED patterns on Pt(111) and
Pt(755) surfaces.
Figure 4. (a) Surface reconstruction of Pt(100) revealed with LEED. (b) Illustration of
adsorbate-induced restructuring of metal surfaces for ethylene on Pt (111).
Figure 5. (a) Schematic of molecular beam scattering studies. Detection of the scattered
beam, desorbed reaction products or adsorbed species permits an understanding of the
interaction between molecules and the surface. (b) High reactivity of H2-D2 exchange
revealed by molecular beam scattering.
Figure 6. (a) Photograph of a high pressure-ultra high vacuum combined system. The
high-pressure cell is shown in both the open (top) and closed (bottom) positions.
Schematics of (b) high pressure sum frequency generation (HP-SFG) vibrational
spectroscopy and (c) high pressure scanning tunneling microscopy (HP-STM).
Figure 7. (a) SFG spectra of benzene hydrogenation on Pt(111) surface. The reaction
occurs in excess hydrogen of about 100 Torr and 10 Torr of benzene. SFG vibration
spectra reveal that the presence of three different species on the surface in this reactant
mixture: H-C-C-, vinylic (H-C=C-), and physisorbed benzene bands. (b) 20 nm x 20 nm

13
STM images of Pt(111) in the presence of 10 Torr of benzene, 100 Torr of H2, and 650
Torr of Ar at 353 K. (c) 20 nm x 20 nm STM image of Pt(111) in the presence of 10 Torr
of benzene, 100 Torr of H2, and 630 Torr of Ar heated to 353 K, 5 Torr of CO added, and
cooled to 298 K.
Figure 8. Evolution of model surfaces from single crystal Pt surfaces to nanoparticle
arrays supported in two- or three-dimensional oxide structures. An SEM image of two-
dimensional (2D) nanoparticle arrays and a TEM image of three-dimensional (3D) arrays
are shown.
Figure 9. (a) TEM images of Pt nanoparticles with various sizes capped with PVP poly
(vinylpyrrolidone). Size of nanoparticles can be controlled within the range of 1.7 ~ 7.1
nm. The scale bars refer to 10 nm. (b) TEM image of Pt nanoparticles with different
shapes (cube, cuboctahedra, and porous particles) stabilized with TTAB. The scale bar in
the images refer to 20 nm.
Figure 10. Size dependence of Pt nanoparticles on the selectivity and activation energy for
(a) cyclohexene hydrogenation and (b) cyclohexene dehydrogenation.
Figure 11. Structural dependence of selectivity in benzene hydrogenation. Benzene
hydrogenation studies demonstrated that both cyclohexene and cyclohexane formed on
cuboctahedral nanoparticles and only cyclohexane formed on cubic nanoparticles,
consistent with previous results for single-crystal Pt surfaces.
Figure 12. (a) The XPS plots measured on two dimensional RhxPt1-x (x = 0-1) nanoparticle
arrays on a silicon surface. (b) TEM images of the Rh0.4Pt0.6 nanoparticles. (c) Plot of the
turnover frequency (TOF), measured at 180 °C and 200 °C, of RhxPt1-x and the activation
energies of nanoparticle arrays as a function of Rh composition (x = 0-1).
Figure 13. Schematic of in-situ monitoring of nanoparticles with (a) high pressure sum
frequency generation (SFG) spectroscopy and (b) high pressure STM.

14
References
1. G. Ertl and H. J. Freund, Physics Today, 1999, 52, 32-38. 2. G. Ertl, H. Knözinger, J. Weitkamp, Eds.,Handbook of Heterogeneous Catalysis
(Wiley-VCH, Weinheim, 1997). 3. G. A. Somorjai and J. Y. Park, Physics Today, 2007, 60, 48-53. 4. A. Stierle and A. M. Molenbroek, Mrs Bulletin, 2007, 32, 1001-1005. 5. G. A. Somorjai, R. L. York, D. Butcher and J. Y. Park, Physical Chemistry
Chemical Physics, 2007, 9, 3500-3513. 6. H. J. Freund, H. Kuhlenbeck, J. Libuda, G. Rupprechter, M. Baumer and H.
Hamann, Topics in Catalysis, 2001, 15, 201-209. 7. L. Osterlund, P. B. Rasmussen, P. Thostrup, E. Laegsgaard, I. Stensgaard
and F. Besenbacher, Physical Review Letters, 2001, 86, 460-463. 8. G. A. Somorjai, Introduction to Surface Chemistry and Catalysis, Wiley, New York 1994. 9. G. D. Stucky and J. E. Macdougall, Science, 1990, 247, 669-678. 10. C. T. Kresge, M. E. Leonowicz, W. J. Roth, J. C. Vartuli and J. S. Beck,
Nature, 1992, 359, 710-712. 11. N. Toshima and T. Yonezawa, New Journal of Chemistry, 1998, 22, 1179-1201. 12. R. Narayanan and M. A. El-Sayed, Nano Letters, 2004, 4, 1343-1348. 13. J. Grunes, J. Zhu, M. C. Yang and G. A. Somorjai, Catalysis Letters, 2003, 86,
157-161. 14. G. A. Somorjai and J. Y. Park, Catalysis Letters, 2007, 115, 87-98. 15. B. Bhushan, J. N. Israelachvili and U. Landman, Nature, 1995, 374, 607-616. 16. J. Y. Park, D. F. Ogletree, P. A. Thiel and M. Salmeron, Science, 2006, 313,
186-186. 17. Sabatier, P., Kataliz v organicheskoi khimii (Catalysis in Organic Chemistry),
Orlov, N.A. and Petrov, A.D., Eds. and authors of supplements, Leningrad: Goskhimtekhizdat, 1932.
18. P. Sabatier, Industrial and Engineering Chemistry, 1926, 18, 1005-1008. 19. C. T. Campbell, Surface Science Reports, 1997, 27, 1-111. 20. C. B. Duke, Chemical Reviews, 1996, 96, 1237-1259. 21. G. A. Somorjai, K. M. Bratlie, M. O. Montano and J. Y. Park, Journal of
Physical Chemistry B, 2006, 110, 20014-20022. 22. M.A. Van Hove, W.H. Weinberg and C.-M. Chan, Low-Energy Electron
Diffraction, Springer Verlag, 1986. 23. J.B. Pendry, Low Energy Electron Diffraction, Academic Press, 1974. 24. S. Hagstrom, H. B. Lyon and G. A. Somorjai, Physical Review Letters, 1965,
15, 491. 25. L. L. Kesmodel, L. H. Dubois and G. A. Somorjai, Chemical Physics Letters,
1978, 56, 267-271. 26. S. L. Bernasek and G. A. Somorjai, Journal of Chemical Physics, 1975, 62,
3149-3161. 27. M. Salmeron, R. J. Gale and G. A. Somorjai, Journal of Chemical Physics,
1979, 70, 2807-2818.

15
28. N. D. Spencer, R. C. Schoonmaker and G. A. Somorjai, Journal of Catalysis, 1982, 74, 129-135.
29. Y. R. Shen, Annual Review of Physical Chemistry, 1989, 40, 327-350. 30. X. C. Su, P. S. Cremer, Y. R. Shen and G. A. Somorjai, Journal of the
American Chemical Society, 1997, 119, 3994-4000. 31. P. S. Cremer, X. C. Su, Y. R. Shen and G. A. Somorjai, Journal of the
American Chemical Society, 1996, 118, 2942-2949. 32. G. Rupprechter, Mrs Bulletin, 2007, 32, 1031-1037. 33. Z. Chen, D. H. Gracias and G. A. Somorjai, Applied Physics B-Lasers and
Optics, 1999, 68, 549-557. 34. S. J. Kweskin, R. M. Rioux, S. E. Habas, K. Komvopoulos, P. Yang and G. A.
Somorjai, Journal of Physical Chemistry B, 2006, 110, 15920-15925. 35. B. J. McIntyre, M. Salmeron and G. A. Somorjai, Journal of Vacuum Science
& Technology a-Vacuum Surfaces and Films, 1993, 11, 1964-1968. 36. B. L. M. Hendriksen and J. W. M. Frenken, Physical Review Letters, 2002, 89,
046101. 37. M. Montano, M. Salmeron and G. A. Somorjai, Surface Science, 2006, 600,
1809-1816. 38. K. M. Bratlie, M. O. Montano, L. D. Flores, M. Paajanen and G. A. Somorjai,
Journal of the American Chemical Society, 2006, 128, 12810-12816. 39. S. L. Yau, Y. G. Kim and K. Itaya, Journal of the American Chemical Society,
1996, 118, 7795-7803. 40. S. R. Longwitz, J. Schnadt, E. K. Vestergaard, R. T. Vang, E. Laegsgaard, I.
Stensgaard, H. Brune and F. Besenbacher, Journal of Physical Chemistry B, 2004, 108, 14497-14502.
41. H. Lee, S. E. Habas, S. Kweskin, D. Butcher, G. A. Somorjai and P. D. Yang, Angewandte Chemie-International Edition, 2006, 45, 7824-7828.
42. H. Song, R. M. Rioux, J. D. Hoefelmeyer, R. Komor, K. Niesz, M. Grass, P. D. Yang and G. A. Somorjai, Journal of the American Chemical Society, 2006, 128, 3027-3037.
43. R. M. Rioux, H. Song, M. Grass, S. Habas, K. Niesz, J. D. Hoefelmeyer, P. Yang and G. A. Somorjai, Topics in Catalysis, 2006, 39, 167-174.
44. G. A. Somorjai and R. M. Rioux, Catalysis Today, 2005, 100, 201-215. 45. C. Mohr, H. Hofmeister, J. Radnik and P. Claus, Journal of the American
Chemical Society, 2003, 125, 1905-1911. 46. K. M. Bratlie, H. Lee, K. Komvopoulos, P. Yang and G. A. Somorjai, Nano
Letters, 2007, 7, 3097-3101. 47. K. M. Bratlie, C. J. Kliewer and G. A. Somorjai, Journal of Physical
Chemistry B, 2006, 110, 17925-17930. 48. Y. Zhang, M. E. Grass, S. E. Habas, F. Tao, T. Zhang, P. Yang and G. A.
Somorjai, Journal of Physical Chemistry C, 2007, 111, 12243-12253. 49. J. Y. Park, Y. Zhang, M. Grass, T. Zhang and G. A. Somorjai, Nano Letters,
2008, 8, 673 -677. 50. A. V. Kalinkin, A. V. Pashis and V. I. Bukhtiyarov, Reaction Kinetics and
Catalysis Letters, 2003, 78, 121-127.

16
51. C. H. F. Peden, D. W. Goodman, D. S. Blair, P. J. Berlowitz, G. B. Fisher and S. H. Oh, Journal of Physical Chemistry, 1988, 92, 1563-1567.
52. W. M. Daniel, Y. Kim, H. C. Peebles and J. M. White, Surface Science, 1981, 111, 189-204.
53. C. R. Helms, H. P. Bonzel and S. Kelemen, Journal of Chemical Physics, 1976, 65, 1773-1782.
54. A. D. Vanlangeveld and J. W. Niemantsverdriet, Surface Science, 1986, 178, 880-887.
55. K. M. Bratlie, K. Komvopoulos and G. A. Somorjai, unpublished.

17
(a)
fcc (111)
(b)
Nanoparticles in mesoporous Silica (SBA-15)
(c)
Pt nanoparticleson silicon oxide
50nm
Colloid Pt nanoparticles
Figure 1.

18
SurfacesSurfaces
Biointerfaces
Nanomaterials
Coatings
Corrosion
Integrated Circuitry
Sensors
Magnetic InformationStorage
Electrochemistry
Tribology
Catalysts
Figure 2.

19
Figure 3.

20
Figure 4.

21
Figure 5.
22
(a) (b)
(c)To UHV chamber
Gatevalve
Pressuregauge
Gasmanifold
To gas chroma-Tography (GC)
GC
IRVIS SFG
Figure 6.

23
1.8
2.3
2.8
3.3
3.8
4.3
4.8
5.3
5.8
2750 2850 2950 3050 3150 3250
Wave Number, cm-1
Norm
aliz
ed Inte
nsi
ty, a
.u.
300K
320K
360K
380K
400K
440K
cool down
to 300K
physorbedBenzene
H-C=C-
H-C-C-
Physisorbed benzene
C6H6
Dienyl chemisorbed
benzeneC6H6
(a) (b)
(c)
Figure 7.

24
Metal single crystal surface
3D nanoparticle array(7.1nm Pt nanoparticles in
SBA-15)
20nm
2D Pt nanoparticle arrays on silicon surface
colloid nanoparticles
Figure 8.

25
Figure 9.
1.73 1.73 ±±±±±±±± 0.26 nm0.26 nm 7.16 ±±±± 0.37 nm3.39 ±±±± 0.26 nm
(a)
(b)
Cube Cuboctahedra Porous particleCube Cuboctahedra Porous particle

26
Figure 10.
0
5
10
15
20
25
30
0 2 4 6 8
Particle Size (nm)
TO
F (C
6H12
/Pt s
urf
/s)
0.0
2.0
4.0
6.0
8.0
10.0
12.0
Activatio
n E
nerg
y (kcal/mo
l)
0
5
10
15
20
25
30
0 2 4 6 8
Particle Size (nm)
TO
F (C
6H6/
Pt s
urf
/s)
15.0
16.0
17.0
18.0
19.0
20.0
21.0
22.0
23.0
24.0
25.0
Activatio
n E
nerg
y (kcal/mo
l)
(a) (b)
BenzeneCyclohexene
- H2
BenzeneCyclohexene
- H2
BenzeneCyclohexene
- H2
BenzeneCyclohexene
- H2
Cyclohexene Cyclohexane
+ H 2
Cyclohexene Cyclohexane
+ H 2
Cyclohexene Cyclohexane
+ H 2
Cyclohexene Cyclohexane
+ H 2
27
Cuboctahedra12.6 nm
Cube13.4 nm
300 320 340 360 380 400
0.00
0.02
0.04
0.06
0.08
0.10
TO
F, m
ole
cule
s s
ite- 1
sec- 1
Temperature, K
Cyclohexenehexagons (X10)
cubes
320 340 360 380 400
0.00
0.02
0.04
0.06
0.08
0.10
TO
F, m
ole
cule
s s
ite- 1
sec- 1
Temperature, K
Cyclohexanehexagons
Cyclohexane
cyclohexane cyclohexene
benzene
Pt(111)
Pt(100) cyclohexane
Figure 11.

28
Figure 12.
XP
S in
tens
ity (
a.u.
)X
PS
inte
nsi
ty (
a.u.
)
360 240320 280Binding energy (eV)
6090
Rh=100%
Rh=0%
Rh=20%
Rh=40%
Rh=60%
Rh=80%
Pt4fC1s
Rh3d
Pt4d
XP
S in
tens
ity (
a.u.
)X
PS
inte
nsi
ty (
a.u.
)
360 240320 280Binding energy (eV)
6090
Rh=100%
Rh=0%
Rh=20%
Rh=40%
Rh=60%
Rh=80%
Pt4fC1s
Rh3d
Pt4d
(b)(a)
(c)
0.00
1.00
2.00
3.00
4.00
5.00
6.00
0.00 0.20 0.40 0.60 0.80 1.00Rh / [Rh +Pt] (XPS)
0.00
5.00
10.00
15.00
20.00
25.00
30.00
Turn
ove
r ra
te (
/met
al s
ite/
s)
TOF
Ea
Rh composition (x)
Ea
(kca
l/mo
l)

29
Sapphire
VisIR
Sum
RXN CellTo GCPt NPs
Sapphire
VisIR
Sum
RXN CellTo GCPt NPs
Reactioncell
To gas chromato-
graphy
SFG
(a)
(b)Colloid
nanoparticleson conductive
substrate
STM tip
Figure 13.