Molecular phylogenetic analyses of Bryozoa, Brachiopoda ... · Brachiopoda, and Phoronida,...
143
Molecular phylogenetic analyses of Bryozoa, Brachiopoda, and Phoronida Dissertation Zur Erlangung des akademischen Grades Doctor rerum naturalium des Departments Biologie der Fakultät für Mathematik, Informatik und Naturwissenschaften an der Universität Hamburg Vorgelegt von Martin Helmkampf Hamburg, 2009
Transcript of Molecular phylogenetic analyses of Bryozoa, Brachiopoda ... · Brachiopoda, and Phoronida,...
Molecular phylogenetic analyses of Bryozoa, Brachiopoda, and Phoronida
Dissertation
Zur Erlangung des akademischen Grades
Doctor rerum naturalium
des Departments Biologie
der Fakultät für Mathematik, Informatik und Naturwissenschaften
an der Universität Hamburg
Vorgelegt von
Martin Helmkampf
Hamburg, 2009
2

3
“The affinities of all the beings of the same class have sometimes been represented by a great tree. [...] As
buds give rise by growth to fresh buds, and these, if vigorous, branch out and overtop on all sides many a
feebler branch, so by generation I believe it has been with the great Tree of Life, which fills with its dead
and broken branches the crust of the earth, and covers the surface with its ever branching and beautiful
ramifications.“
—Charles Darwin, On The Origin Of Species (1959)
4
Summary
The present thesis focuses on molecular and computational analyses to elucidate the phylogenetic
position of the lophophorate lineages, i.e., ectoproct bryozoans, brachiopods, and phoronids. Its main
section is organized in chapters corresponding to manuscripts that have been published in or submitted
to scientific journals.
For the first manuscript, “Multigene analysis of lophophorate and chaetognath phylogenetic relationships”,
seven nuclear housekeeping gene fragments of seven representatives of ectoproct bryozoans, brachiopods,
phoronids, and chaetognaths were PCR amplified and sequenced. According to phylogenetic analyses
based on this dataset — and strongly supported by topology tests — the lophophorate lineages are more
closely related to molluscs and annelids than to deuterostomes. While this study also suggests that they
are polyphyletic, the data was neither sufficient to place chaetognaths, nor to robustly resolve the
phylogenetic relations among lophophorates or among lophotrochozoans in general.
Consequently, this approach was abandoned in favour of EST sequencing. More than 4000
expressed sequence tags (ESTs) of the cheilostome ectoproct Flustra foliacea were incorporated into a
second study, “Spiralian phylogenomics supports the resurrection of Bryozoa comprising Ectoprocta and Entoprocta.”
Accessing additional EST projects and public archives, a super-alignment derived from 79 ribosomal
protein gene sequences of 38 metazoan taxa was compiled. Maximum likelihood and Bayesian inference
analyses based on this dataset indicate the monophyly of Bryozoa including ectoprocts and entoprocts —
two taxa that have been separated for more than a century due to seemingly profound morphological
differences. These and other findings suggest that classical developmental and morphological key
characters such as cleavage pattern, coelomic cavities, gut architecture and body segmentation are
subject to greater evolutionary plasticity than traditionally assumed.
This dataset was further complemented by 2000 ESTs each of the craniiform brachiopod
Novocrania anomala and the phoronid Phoronis muelleri, leading to the publication of the third study,
“Phylogenomic analyses of lophophorates (brachiopods, phoronids and bryozoans) confirm the Lophotrochozoa concept.”
According to this analysis, all three lophophorate lineages are clearly to be placed within
5
Lophotrochozoa. Their monophyly, however, was not recovered; instead, ectoprocts and entoprocts
presumably branch off at the lophotrochozoan base, while brachiopods and phoronids, robustly united to
Brachiozoa, appear to be more closely allied to molluscs, annelids, and nemertines. These results are
congruent with recent and careful re-evaluations of morphological characters traditionally used to unite
lophophorate taxa with deuterostomes, e.g., archimery, possession of a mesodermal tentacular apparatus
and the mode of mesoderm formation.
With robust interphyletic resolution still lacking, additional EST projects were performed to
improve the taxon sampling within Lophotrochozoa. A total of 2000 ESTs each of the cyclostome
bryozoan Tubulipora sp. and the ctenostome bryozoan Alcyonidium diaphanum were generated for the study
“Reducing compositional heterogeneity improves phylogenomic inference of lophotrochozoan relationships.” Again,
ribosomal protein sequences were retrieved and supplemented by all data available of bryozoan,
brachiopod, and phoronid taxa to date. To mitigate the potential impact of compositional heterogeneity
displayed by metazoan taxa, several approaches were applied to reduce this trait. Among these, recoding
amino acids into groups of functional interchangeability proved to be the most efficient, and provides
further evidence for the monophyly of Bryozoa and Brachiozoa. Although internal relations of both taxa
could also be elucidated, most interphyletic relationships within Lophotrochozoa remain nevertheless
poorly supported, nourishing the idea that this group underwent a rapid series of cladogenetic events in
the Precambrium.
As paralogy has been identified as another pitfall of phylogenetic inference, a novel, phylogenetic
approach to evaluate gene homology relations is finally proposed in „Tree-based orthology assessment illustrated
by the evaluation of ribosomal protein genes.” By reconstructing gene trees of ribosomal proteins gathered from
genomic datasets using an automated pipeline, and assigning each gene to one of three categories
representing varying degrees of evidence for orthology or paralogy, most ribosomal protein genes were
identified as suitable for the reconstruction of bilaterian phylogeny. A final, comprehensive phylogenetic
analysis restricted to these genes confirms the central results of the previous phylogenetic studies,
emphasising that these were not misled by artefacts related to paralogy.
6
Zusammenfassung
Ziel der vorliegenden Arbeit ist mittels molekulargenetischer Analysen die phylogenetische Stellung der
lophophoraten Linien, d.h. der ektoprokten Bryozoen, der Brachiopoden und der Phoroniden,
aufzudecken. Der zentrale Forschungsbericht ist in Kapitel gegliedert, die in Fachzeitschriften
publizierten oder zur Veröffentlichung eingereichten Manuskripten entsprechen.
Im Rahmen der ersten Studie, “Multigene analysis of lophophorate and chaetognath phylogenetic
relationships”, wurden partielle Sequenzen von sieben nukleären Haushaltsgenen mittels PCR in sieben
Vertretern der ektoprokten Bryozoen, Brachiopoden, Phoroniden und Chaetognathen bestimmt. Den
phylogenetischen Analysen dieses Datensatzes zufolge — und gut gestützt durch Topologie-Tests —
sind die lophophoraten Linien näher mit Mollusken und Anneliden verwandt als mit Deuterstomiern.
Zwar legt die Studie auch die Polyphylie dieser Taxa nahe, jedoch erwiesen sich die Daten sowohl als
ungenügend, die phylogenetische Position der Chaetognathen zu bestimmen, als auch die
verwandtschaftlichen Beziehungen zwischen den Lophophoraten oder den Lophotrochozoen im
Allgemeinen aufzuklären.
Infolgedessen wurde dieser Ansatz zugunsten der EST-Technik verworfen. Mehr als 4000
“Expressed Sequence Tags” (ESTs) des cheilostomen Ektoprokten Flustra foliacea flossen in eine zweite
Studie ein, “Spiralian phylogenomics supports the resurrection of Bryozoa comprising Ectoprocta and Entoprocta.” Unter
Einsatz zusätzlicher EST-Projekte und Zugriff auf öffentliche Datenbanken wurde ein Alignment erstellt,
das Sequenzen von 79 ribosomalen Proteinen aus 38 Taxa enthielt. Maximum-Likelihood und
Bayes’sche Analysen basierend auf diesem Datensatz zeigen die Monophylie der Bryozoa einschließlich
Ectoprocta und Entoprocta, zweier Taxa, die aufgrund scheinbar tief greifender morphologischer
Unterschiede vor über einem Jahrhundert getrennt wurden. Diese und andere Ergebnisse legen nahe,
dass klassische ontogenetische und morphologische Schlüssel-Merkmale wie Furchungsmuster,
Coelomräume, Architektur des Darms und Segmentierung im Lauf der Evolution Gegenstand größerer
Plastizität sind als traditionell angenommen.
7
Die Erweiterung dieses Datensatzes um jeweils 2000 ESTs des craniiformen Brachiopoden
Novocrania anomala und des Phoroniden Phoronis muelleri führte zur Publikation einer dritten Studie,
“Phylogenomic analyses of lophophorates (brachiopods, phoronids and bryozoans) confirm the Lophotrochozoa concept.”
Dieser Untersuchung zufolge müssen alle drei lophophoraten Linien eindeutig innerhalb der
Lophotrochozoa platziert werden. Deren Monophylie konnte jedoch nicht bestätigt werden; stattdessen
zweigen Ekto- und Entoprokten vermutlich an der Basis der Lophotrochozoen ab, während die robust zu
Brachiozoa vereinigten Brachiopoden und Phoroniden näher mit Anneliden, Mollusken und Nemertinen
verwandt zu sein scheinen. Diese Ergebnisse sind kongruent zu sorgfältigen Neubewertungen jener
morphologischer Merkmale, die traditionell verwendet werden, um die nähere Verwandtschaft der
Lophophoraten zu den Deuterostomiern zu untermauern, z.B. Archimerie, der Besitz eines
mesodermalen Tentakel-Apparats und der Modus der Mesoderm-Bildung.
Nachdem eine robuste Auflösung zwischen den Stämmen noch immer nicht erreicht wurde,
wurden weitere EST-Projekte durchgeführt, um die Zahl der Taxa zu erhöhen. Insgesamt jeweils 2000
ESTs des cyclostomen Bryozoen Tubulipora sp. und des ctenostomen Bryozoen Alcyonidium diaphanum
wurden für die Studie “Reducing compositional heterogeneity improves phylogenomic inference of lophotrochozoan
relationships” erhoben. Wie zuvor wurden ribosomale Protein-Sequenzen erfasst und durch entsprechende
Daten aller bis dato verfügbaren Bryozoen, Brachiopoden und Phoroniden ergänzt. Um den potentiellen
Einfluss heterogener Aminosäure-Zusammensetzung zu mindern, wurden mehrere Ansätze verfolgt. Am
effizientesten erwies sich die Rekodierung der Aminosäuren in Gruppen funktioneller Ähnlichkeit,
wodurch weitere Belege für die Monophylie der Bryozoen und der Brachiozoen erbracht werden
konnten. Obwohl Verwandtschaftsverhältnisse innerhalb beider Taxa ebenfalls beleuchtet werden
konnten, bleiben die Beziehungen zwischen den Stämmen der Lophotrochozoen dennoch schlecht
unterstützt, was die Vorstellung nährt, dass diese Gruppe im Präkambrium durch eine schnelle Folge
kladogenetischer Ereignisse entstand.
Da Paralogie eine weiteres Problem in der phylogenetischen Rekonstruktion darstellt, wurde in
„Tree-based orthology assessment illustrated by the evaluation of ribosomal protein genes” ein neuartiger,
phylogenetischer Ansatz zur Evaluation von Homologie-Verhältnissen von Genen vorgestellt. Mithilfe

8
eines automatisierten Arbeitsablaufs wurden Gen-Bäume ribosomaler Proteine rekonstruiert, und jedes
Gen einer von dreien Kategorien zugeteilt, die Grade unterschiedlicher Beweiskraft für Orthologie oder
Paralogie repräsentieren. Dadurch konnte der Großteil der ribosomalen Proteine als geeignet identifiziert
werden, die Stammesgeschichte der Bilateria zu untersuchen. Eine abschließende, umfassende
phylogenetische Analyse, die sich auf diese Gene beschränkt, bestätigt die zentralen Ergebnisse der
vorherigen Studien und zeigt, dass diese nicht durch paraloge Genkopien beeinflusst wurden.
9
Table of contents
Summary 4
Zusammenfassung 6
1. Introduction 10
1.1. The lophophorate lineages 10
1.2. Phylogenetic hypotheses 13
1.3. Study taxa and data collection 15
1.4. Objectives 16
2. Research report 17
2.1. Multigene analysis of lophophorate and chaetognath phylogenetic relationships 18
2.2. Spiralian phylogenomics supports the resurrection of Bryozoa comprising
Ectoprocta and Entoprocta 28
2.3. Phylogenomic analyses of lophophorates (brachiopods, phoronids and bryozoans)
confirm the Lophotrochozoa concept 36
2.4. Reducing compositional heterogeneity improves phylogenomic inference of
lophotrochozan relationships 44
2.5. Tree-based orthology assessment illustrated by the evaluation of ribosomal protein genes 73
2.6. Summary of achieved results 104
3. Conclusion and perspectives 129
4. Author’s Contributions 132
5. References 134
Acknowledgments 142
Declaration 143
10
1. Introduction
Resolving the phylogenetic relationships of the animal phyla is an important prerequisite to understand
many aspects central to modern biology. Knowledge of the animal kingdom’s evolutionary history will
provide insights into underlying internal and external processes, e.g., how the diversification of body
plans has been shaped by genetic innovation, embryonic development, and palaeoecological conditions.
The present work aims to contribute to this goal by investigating the phylogenetic position of Bryozoa,
Brachiopoda, and Phoronida, collectively known as lophophorate lineages. Below, general information
about these enigmatic taxa is provided, followed by an introduction to the conflicting views concerning
their phylogeny, and a list of data collected for this study. Finally, the objectives of this work are
formulated.
1.1. The lophophorate lineages
1.1.1. Ectoproct Bryozoa
Ectoproct bryozoans or moss animals comprise a moderately speciose phylum of aquatic, sessile animals
that are organized exclusively in colonies. The group is predominantly marine, although it includes a
minority of freshwater and estuarine species. Bryozoans are surprisingly common animals occurring
worldwide, and form a notable part of the hard substratum epifauna on most rocky shores. Although
they are especially abundant in shallow sublittoral habitats, some species have been found to inhabit
deep-sea environments as well. Many species form encrusting sheets on stones, shells or kelp blades, while
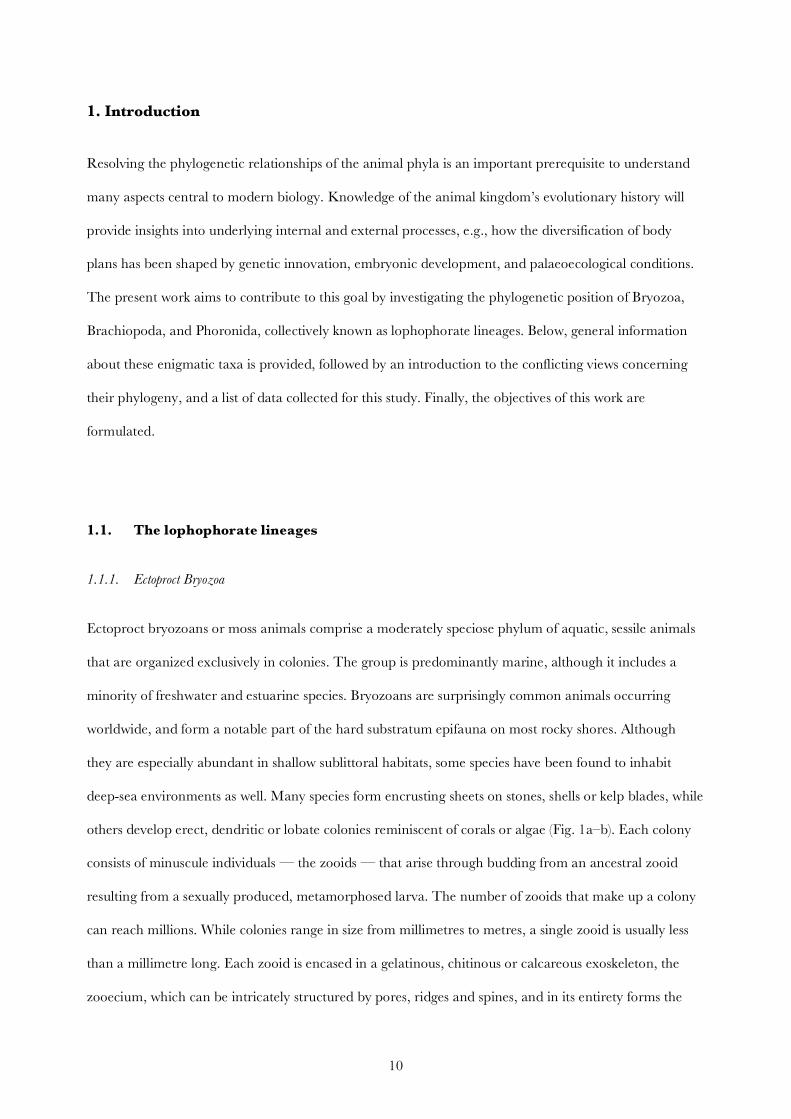
others develop erect, dendritic or lobate colonies reminiscent of corals or algae (Fig. 1a–b). Each colony
consists of minuscule individuals — the zooids — that arise through budding from an ancestral zooid
resulting from a sexually produced, metamorphosed larva. The number of zooids that make up a colony
can reach millions. While colonies range in size from millimetres to metres, a single zooid is usually less
than a millimetre long. Each zooid is encased in a gelatinous, chitinous or calcareous exoskeleton, the
zooecium, which can be intricately structured by pores, ridges and spines, and in its entirety forms the
11
colonial skeleton. Individual zooids consist of two parts: the cystid, a box- or tube-shaped lower body
encased in a usually rather stiff body wall, and a retractable upper body or polypide. The latter is
composed of the U-shaped gut and a ciliated ring of tentacles surrounding the mouth opening, the
lophophore. This current-producing structure is used by the animals to filter food particles including
diatoms and other unicellular algae from the water column, but also serves respiratory functions. Many
bryozoan species are characterized by zooid polymorphism, and display a bewildering variety of
heterozooids specialized in reproduction, defence or cleaning, which are dependant on food-gathering
autozooids for nourishment. Over 5000 extant species of ectoproct bryozoans are known, and there is an
extensive fossil record dating back to the Lower Ordovician. However, the actual number of species is
supposed to be twice as big (Hayward and Ryland, 1998). Living bryozoans can be classified into the
following major groups (Ax, 2001): Phylactolaemata, a small group of putatively primitive freshwater
forms, Stenolaemata, whose only extant member Cyclostomata is characterized by cylindrical, calcified
zooids, and the speciose Eurystomata, which can be further divided into the uncalcified Ctenostomata
and the typically box-shaped, calcified Cheilostomata.
1.1.2. Brachiopoda
Brachiopods or lamp shells are a small phylum of exclusively marine, sessile and solitary invertebrates.
Superficially, most resemble clams due to their two-valved calcareous shell, but in contrast to the
molluscs’ lateral symmetry, brachiopods possess a dorsal and a ventral valve of usually different shape.
The valves are lined and secreted by the mantle folds, and are held together by muscles and a hinge in
most species („articulate“ brachiopods). Apart from some burrowing species, they live attached to rocky
substrate or coarse sediment by means of a fleshy stalk, the pedicle, and filter food particles by opening
their valves and drawing water into a cavity enclosing the lophophore, a coiled pair of tentacle-bearing
arms. No habitual predators of brachiopods are known, although their shells are often damaged by
boring carnivorous gastropods, or boring or encrusting sponges and bryozoans seeking habitation
substrate. Brachiopods reproduce exclusively sexually, and possess predominantly discrete genders;
fertilization outside the body is the norm, as are free-swimming, highly derived larvae. The animals can
12
be found from polar seas to tropical reefs, and from intertidal environments to abyssal depths. However,
in terms of abundance and species diversity they reach a peak at the continental slopes. While there are
only about living 300 species described, tens of thousands of fossil forms dating back to the Lower
Cambrian are known, underlining that brachiopods constituted an important faunal element of many
palaeozoic ecosystems (Brunton and Curry, 1979). The group has been divided into three subphyla
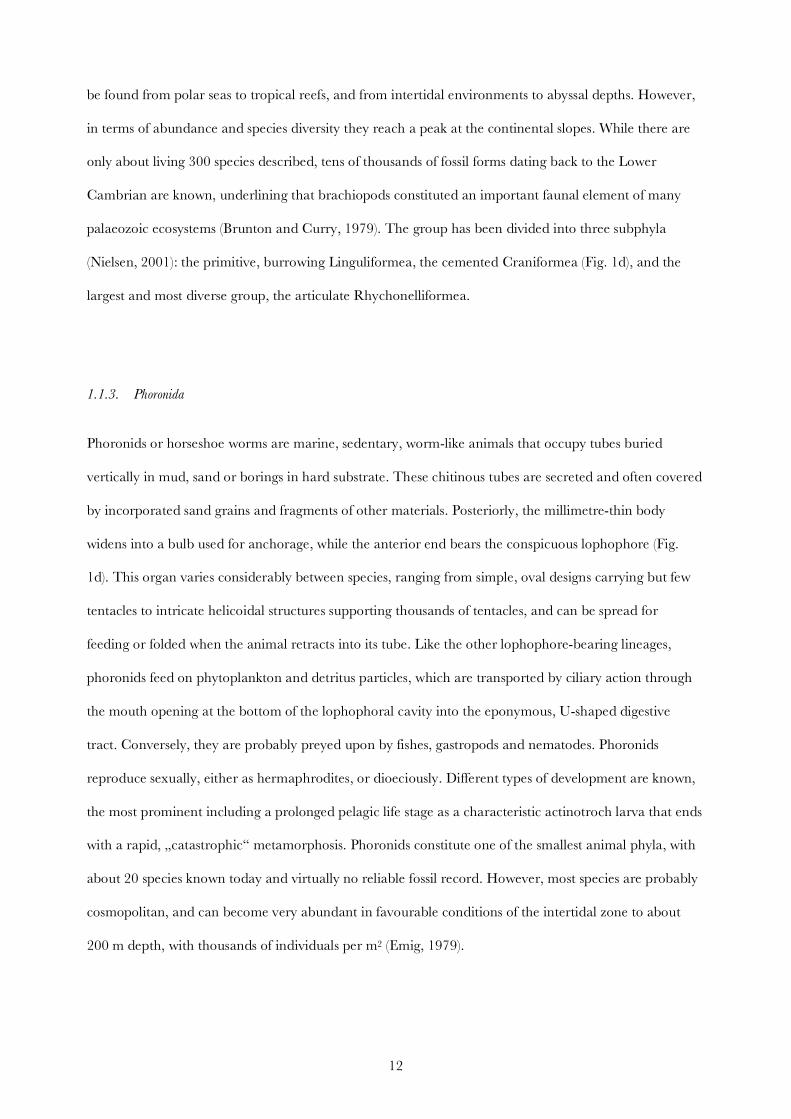
(Nielsen, 2001): the primitive, burrowing Linguliformea, the cemented Craniformea (Fig. 1d), and the
largest and most diverse group, the articulate Rhychonelliformea.
1.1.3. Phoronida
Phoronids or horseshoe worms are marine, sedentary, worm-like animals that occupy tubes buried
vertically in mud, sand or borings in hard substrate. These chitinous tubes are secreted and often covered
by incorporated sand grains and fragments of other materials. Posteriorly, the millimetre-thin body
widens into a bulb used for anchorage, while the anterior end bears the conspicuous lophophore (Fig.
1d). This organ varies considerably between species, ranging from simple, oval designs carrying but few
tentacles to intricate helicoidal structures supporting thousands of tentacles, and can be spread for
feeding or folded when the animal retracts into its tube. Like the other lophophore-bearing lineages,
phoronids feed on phytoplankton and detritus particles, which are transported by ciliary action through
the mouth opening at the bottom of the lophophoral cavity into the eponymous, U-shaped digestive
tract. Conversely, they are probably preyed upon by fishes, gastropods and nematodes. Phoronids
reproduce sexually, either as hermaphrodites, or dioeciously. Different types of development are known,
the most prominent including a prolonged pelagic life stage as a characteristic actinotroch larva that ends
with a rapid, „catastrophic“ metamorphosis. Phoronids constitute one of the smallest animal phyla, with
about 20 species known today and virtually no reliable fossil record. However, most species are probably
cosmopolitan, and can become very abundant in favourable conditions of the intertidal zone to about
200 m depth, with thousands of individuals per m2 (Emig, 1979).
13
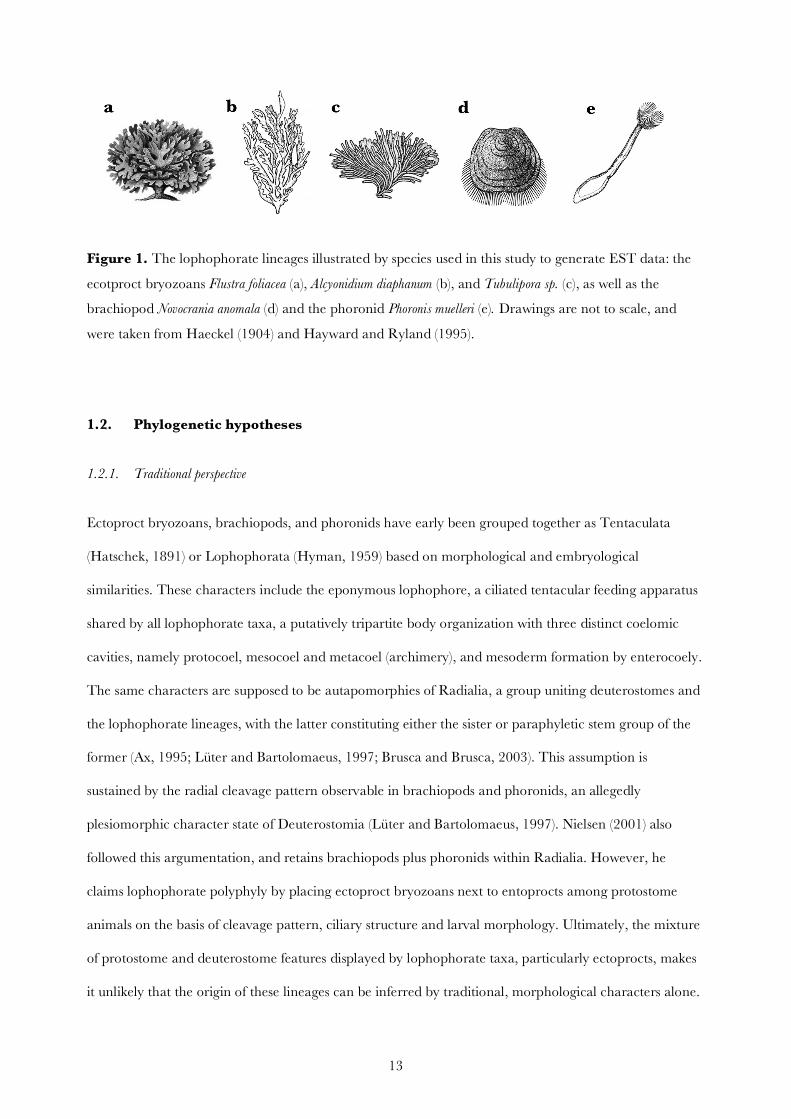
Figure 1. The lophophorate lineages illustrated by species used in this study to generate EST data: the
ecotproct bryozoans Flustra foliacea (a), Alcyonidium diaphanum (b), and Tubulipora sp. (c), as well as the
brachiopod Novocrania anomala (d) and the phoronid Phoronis muelleri (e). Drawings are not to scale, and
were taken from Haeckel (1904) and Hayward and Ryland (1995).
1.2. Phylogenetic hypotheses
1.2.1. Traditional perspective
Ectoproct bryozoans, brachiopods, and phoronids have early been grouped together as Tentaculata
(Hatschek, 1891) or Lophophorata (Hyman, 1959) based on morphological and embryological
similarities. These characters include the eponymous lophophore, a ciliated tentacular feeding apparatus
shared by all lophophorate taxa, a putatively tripartite body organization with three distinct coelomic
cavities, namely protocoel, mesocoel and metacoel (archimery), and mesoderm formation by enterocoely.
The same characters are supposed to be autapomorphies of Radialia, a group uniting deuterostomes and
the lophophorate lineages, with the latter constituting either the sister or paraphyletic stem group of the
former (Ax, 1995; Lüter and Bartolomaeus, 1997; Brusca and Brusca, 2003). This assumption is
sustained by the radial cleavage pattern observable in brachiopods and phoronids, an allegedly
plesiomorphic character state of Deuterostomia (Lüter and Bartolomaeus, 1997). Nielsen (2001) also
followed this argumentation, and retains brachiopods plus phoronids within Radialia. However, he
claims lophophorate polyphyly by placing ectoproct bryozoans next to entoprocts among protostome
animals on the basis of cleavage pattern, ciliary structure and larval morphology. Ultimately, the mixture
of protostome and deuterostome features displayed by lophophorate taxa, particularly ectoprocts, makes
it unlikely that the origin of these lineages can be inferred by traditional, morphological characters alone.
14
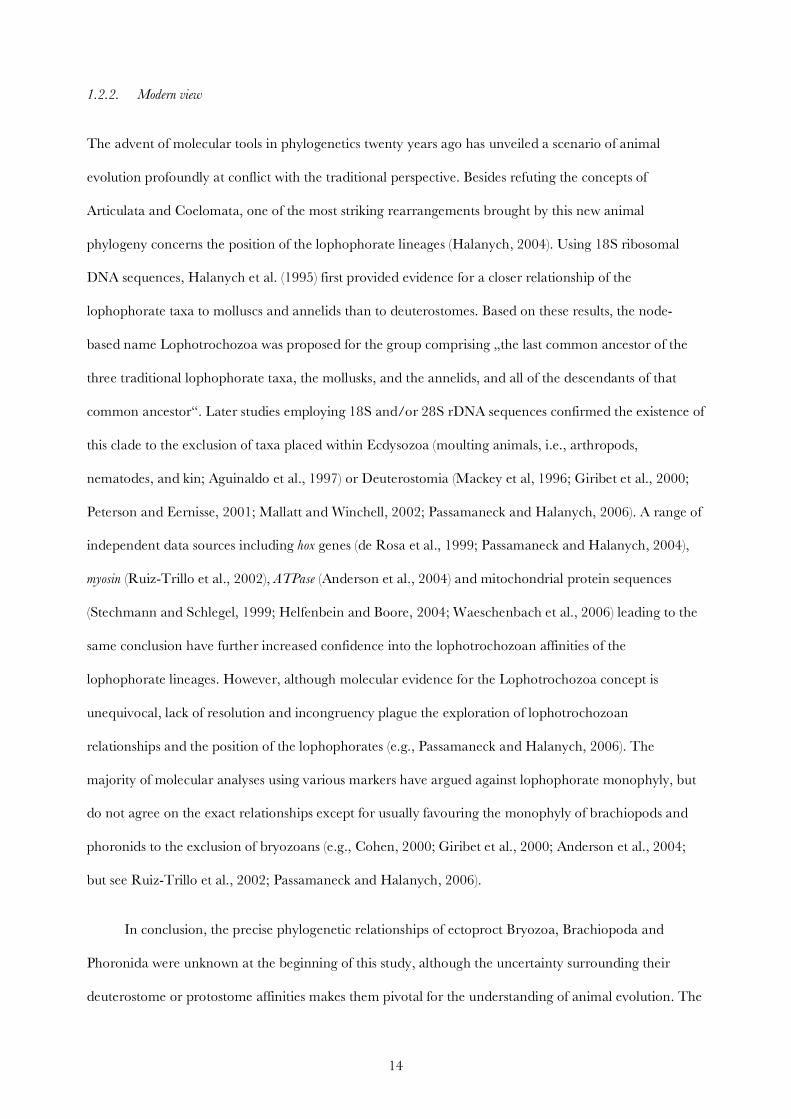
1.2.2. Modern view
The advent of molecular tools in phylogenetics twenty years ago has unveiled a scenario of animal
evolution profoundly at conflict with the traditional perspective. Besides refuting the concepts of
Articulata and Coelomata, one of the most striking rearrangements brought by this new animal
phylogeny concerns the position of the lophophorate lineages (Halanych, 2004). Using 18S ribosomal
DNA sequences, Halanych et al. (1995) first provided evidence for a closer relationship of the
lophophorate taxa to molluscs and annelids than to deuterostomes. Based on these results, the node-
based name Lophotrochozoa was proposed for the group comprising „the last common ancestor of the
three traditional lophophorate taxa, the mollusks, and the annelids, and all of the descendants of that
common ancestor“. Later studies employing 18S and/or 28S rDNA sequences confirmed the existence of
this clade to the exclusion of taxa placed within Ecdysozoa (moulting animals, i.e., arthropods,
nematodes, and kin; Aguinaldo et al., 1997) or Deuterostomia (Mackey et al, 1996; Giribet et al., 2000;
Peterson and Eernisse, 2001; Mallatt and Winchell, 2002; Passamaneck and Halanych, 2006). A range of
independent data sources including hox genes (de Rosa et al., 1999; Passamaneck and Halanych, 2004),
myosin (Ruiz-Trillo et al., 2002), ATPase (Anderson et al., 2004) and mitochondrial protein sequences
(Stechmann and Schlegel, 1999; Helfenbein and Boore, 2004; Waeschenbach et al., 2006) leading to the
same conclusion have further increased confidence into the lophotrochozoan affinities of the
lophophorate lineages. However, although molecular evidence for the Lophotrochozoa concept is
unequivocal, lack of resolution and incongruency plague the exploration of lophotrochozoan
relationships and the position of the lophophorates (e.g., Passamaneck and Halanych, 2006). The
majority of molecular analyses using various markers have argued against lophophorate monophyly, but
do not agree on the exact relationships except for usually favouring the monophyly of brachiopods and
phoronids to the exclusion of bryozoans (e.g., Cohen, 2000; Giribet et al., 2000; Anderson et al., 2004;
but see Ruiz-Trillo et al., 2002; Passamaneck and Halanych, 2006).
In conclusion, the precise phylogenetic relationships of ectoproct Bryozoa, Brachiopoda and
Phoronida were unknown at the beginning of this study, although the uncertainty surrounding their
deuterostome or protostome affinities makes them pivotal for the understanding of animal evolution. The
15
incomplete resolution of this and other parts of the animal tree of life has made it increasingly clear that
both traditional morphological characters and single genes lack the resolving power to robustly infer
phylogenetic relationships at the depth of phyla (Adoutte et al., 2000). In this study, efforts were therefore
made to procure and analyse a larger number of genes from lophophorate and other taxa. Approaches to
do so included the targeted amplification of multiple genes by PCR, and the generation of EST data
from selected taxa, which is to date the most economical method to obtain large amounts of data for the
purpose of molecular systematics (Philippe and Telford, 2006).
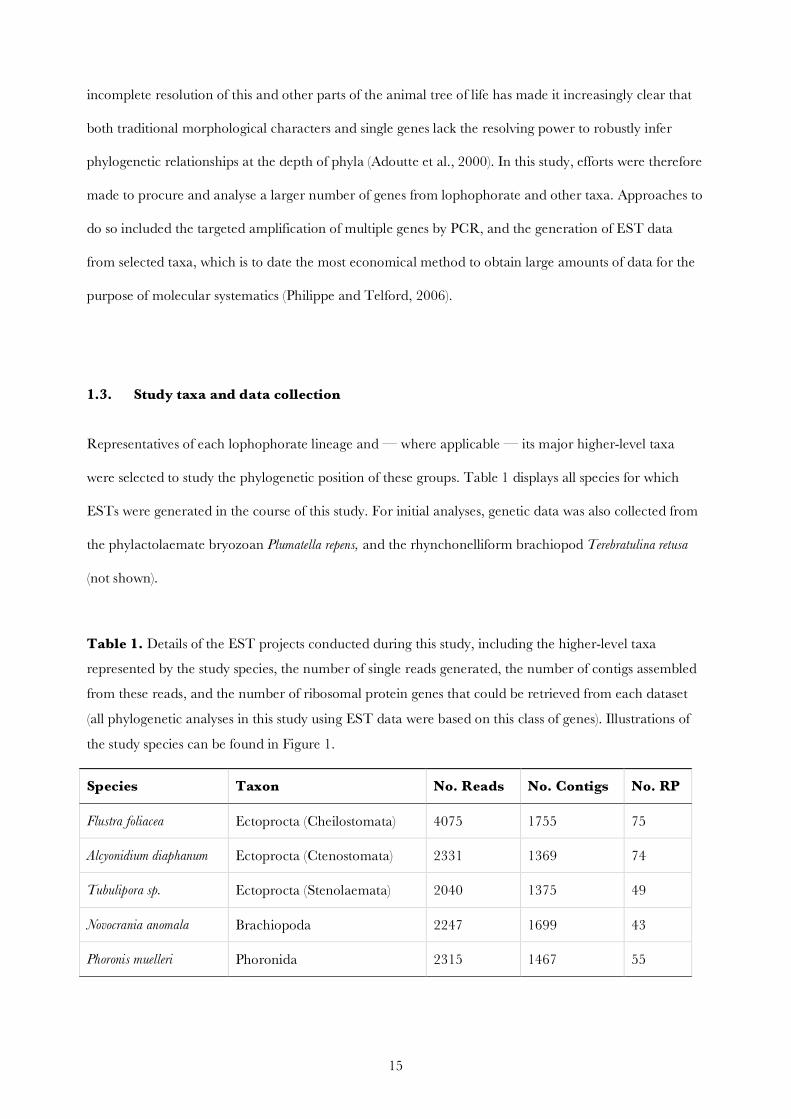
1.3. Study taxa and data collection
Representatives of each lophophorate lineage and — where applicable — its major higher-level taxa
were selected to study the phylogenetic position of these groups. Table 1 displays all species for which
ESTs were generated in the course of this study. For initial analyses, genetic data was also collected from
the phylactolaemate bryozoan Plumatella repens, and the rhynchonelliform brachiopod Terebratulina retusa
(not shown).
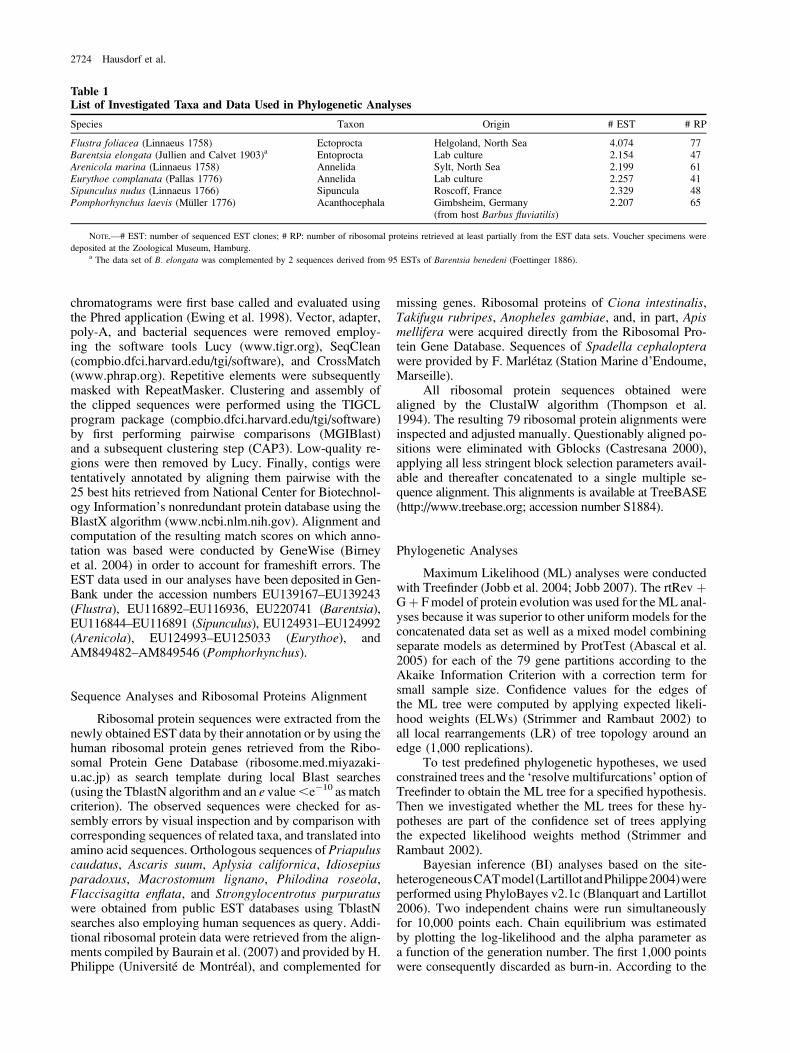
Table 1. Details of the EST projects conducted during this study, including the higher-level taxa
represented by the study species, the number of single reads generated, the number of contigs assembled
from these reads, and the number of ribosomal protein genes that could be retrieved from each dataset
(all phylogenetic analyses in this study using EST data were based on this class of genes). Illustrations of
the study species can be found in Figure 1.
Species Taxon No. Reads No. Contigs No. RP
Flustra foliacea Ectoprocta (Cheilostomata) 4075 1755 75
Alcyonidium diaphanum Ectoprocta (Ctenostomata) 2331 1369 74
Tubulipora sp. Ectoprocta (Stenolaemata) 2040 1375 49
Novocrania anomala Brachiopoda 2247 1699 43
Phoronis muelleri Phoronida 2315 1467 55
16
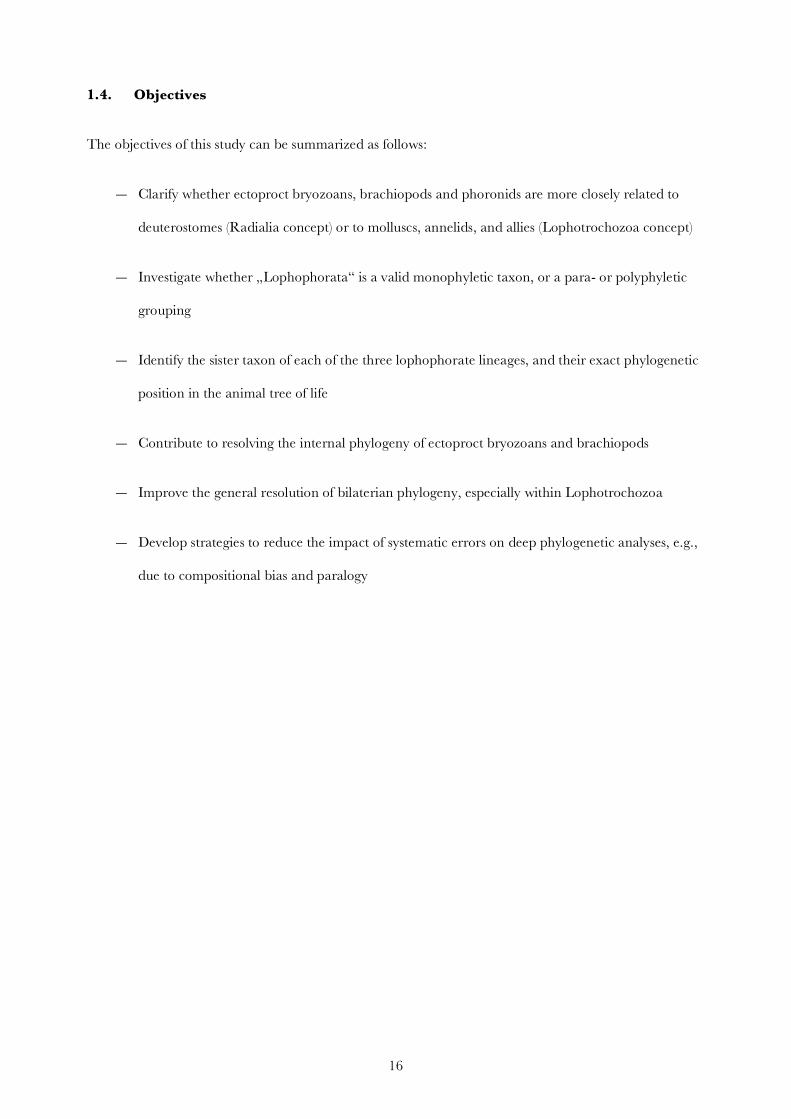
1.4. Objectives
The objectives of this study can be summarized as follows:
— Clarify whether ectoproct bryozoans, brachiopods and phoronids are more closely related to
deuterostomes (Radialia concept) or to molluscs, annelids, and allies (Lophotrochozoa concept)
— Investigate whether „Lophophorata“ is a valid monophyletic taxon, or a para- or polyphyletic
grouping
— Identify the sister taxon of each of the three lophophorate lineages, and their exact phylogenetic
position in the animal tree of life
— Contribute to resolving the internal phylogeny of ectoproct bryozoans and brachiopods
— Improve the general resolution of bilaterian phylogeny, especially within Lophotrochozoa
— Develop strategies to reduce the impact of systematic errors on deep phylogenetic analyses, e.g.,
due to compositional bias and paralogy

17
2. Research report
The following chapters reproduce the major research results that have been obtained during this study.
Each corresponds to an article that has been published in a scientific journal, or a manuscript that has
recently been submitted for publication. The final chapter summarizes the results of these articles.
18
2.1. Multigene analysis of lophophorate and chaetognath phylogenetic relationships
Helmkampf M., Bruchhaus I., and Hausdorf B. 2008. Multigene analysis of lophophorate and
chaetognath phylogenetic relationships. Molecular Phylogenetics and Evolution 46: 206–214.
Multigene analysis of lophophorate and chaetognathphylogenetic relationships
Martin Helmkampf a, Iris Bruchhaus b, Bernhard Hausdorf a,*
a Zoological Museum of the University of Hamburg, Martin-Luther-King-Platz 3, D-20146 Hamburg, Germanyb Bernhard Nocht Institute for Tropical Medicine, Bernhard-Nocht-Strasse 74, D-20359 Hamburg, Germany
Received 24 April 2007; revised 20 August 2007; accepted 5 September 2007Available online 12 September 2007
Abstract
Maximum likelihood and Bayesian inference analyses of seven concatenated fragments of nuclear-encoded housekeeping genes indi-cate that Lophotrochozoa is monophyletic, i.e., the lophophorate groups Bryozoa, Brachiopoda and Phoronida are more closely relatedto molluscs and annelids than to Deuterostomia or Ecdysozoa. Lophophorates themselves, however, form a polyphyletic assemblage.The hypotheses that they are monophyletic and more closely allied to Deuterostomia than to Protostomia can be ruled out with boththe approximately unbiased test and the expected likelihood weights test. The existence of Phoronozoa, a putative clade including Bra-chiopoda and Phoronida, has also been rejected. According to our analyses, phoronids instead share a more recent common ancestorwith bryozoans than with brachiopods. Platyhelminthes is the sister group of Lophotrochozoa. Together these two constitute Spiralia.Although Chaetognatha appears as the sister group of Priapulida within Ecdysozoa in our analyses, alternative hypothesis concerningchaetognath relationships could not be rejected.� 2007 Elsevier Inc. All rights reserved.
Keywords: Lophophorata; Lophotrochozoa; Bryozoa; Brachiopoda; Phoronida; Chaetognatha; Metazoa; Phylogeny
1. Introduction
In the past two decades, the predominating ideas aboutanimal evolution have changed radically based mainly onanalyses of 18S rDNA sequences (Halanych, 2004). Themajor new hypotheses concerning the relationships of thelarger metazoan phyla like the subdivision of Protostomiainto two main groups, Lophotrochozoa and Ecdysozoa,have also been corroborated by studies of nuclear-encodedprotein sequences (e.g., Ruiz-Trillo et al., 2002; Andersonet al., 2004; Peterson et al., 2004; Philippe et al., 2005).However, so far only few nuclear-encoded proteinsequences are available from some smaller taxa like Lopho-phorata or Chaetognatha. In such cases, more informationfrom additional markers is necessary to corroborate thenew hypotheses based on rDNA sequence analyses.
The position of the lophophorate taxa assessed byrDNA studies is particularly conflicting with the traditionalperspective. Lophophorata includes Bryozoa (Ectoprocta),Brachiopoda and Phoronida, and is characterized by theeponymous lophophore, a ciliated, tentacular feedingapparatus surrounding the mouth opening which is sharedby these taxa. Based on embryological and morphologicalcharacters Lophophorata was traditionally considered thesister or paraphyletic stem group of Deuterostomia (Hen-nig, 1979; Schram, 1991; Ax, 1995; Luter and Bartoloma-eus, 1997; Luter, 2000; Brusca and Brusca, 2002).However, Nielsen (2001) challenged the homology of thelophophore of Bryozoa and Brachiopoda plus Phoronidaand considered Lophophorata polyphyletic. Analyses ofrDNA (Halanych et al., 1995; Mackey et al., 1996; Little-wood et al., 1998; Cohen, 2000; Giribet et al., 2000; Peter-son and Eernisse, 2001; Mallatt and Winchell, 2002;Halanych, 2004; Passamaneck and Halanych, 2006), Hox
genes (de Rosa et al., 1999; Passamaneck and Halanych,
1055-7903/$ - see front matter � 2007 Elsevier Inc. All rights reserved.
doi:10.1016/j.ympev.2007.09.004
* Corresponding author. Fax: +49 40 428383937.E-mail address: [email protected] (B. Hausdorf).
www.elsevier.com/locate/ympev
Available online at www.sciencedirect.com
Molecular Phylogenetics and Evolution 46 (2008) 206–214
2004) and mitochondrial protein sequences (Stechmannand Schlegel, 1999; Helfenbein and Boore, 2004; Wae-schenbach et al., 2006) consistently indicated that Bryozoa,Brachiopoda and Phoronida are more closely related toprotostome phyla than to Deuterostomia. More precisely,these studies showed that Lophophorata is presumablypolyphyletic and that the lophophorate lineages are moreclosely related to Trochozoa, i.e., Annelida, Mollusca,and related groups than to other protostomes (i.e., Ecdyso-zoa). Halanych et al. (1995) therefore united Lophophorataand Trochozoa to Lophotrochozoa. There is also one totalevidence analysis combining morphological and rDNAdata which assigned all lophophorate lineages to Lopho-trochozoa (Peterson and Eernisse, 2001). However, a simi-lar study placed Bryozoa basal to the main group ofprotostomes including Trochozoa, Platyzoa and Ecdyso-zoa (Giribet et al., 2000). Brachiopoda and Phoronida clus-ter in total evidence analyses either with Deuterostomia(Zrzavy et al., 1998) or with Trochozoa (Giribet et al.,2000).
Chaetognatha is another minor phylum with uncertainphylogenetic relationships. Based on embryological andmorphological characters, it has been supposed that Chae-tognatha is more closely related to Deuterostomia than toProtostomia (Ghirardelli, 1981; Brusca and Brusca, 2002).However, other morphological investigations indicated clo-ser relationships to some ‘‘aschelminth’’ groups (Schram,1991; Nielsen, 2001). The first analyses of 18S rDNAsequences already rejected the hypothesis that Chaetog-natha is more closely allied to Deuterostomia than to Pro-tostomia (Telford and Holland, 1993; Wada and Satoh,1994). In later analyses of 18S rDNA, chaetognaths formeda monophyletic group with nematodes (Halanych, 1996;Littlewood et al., 1998) or nematomorphs (Peterson andEernisse, 2001). In the total evidence analysis of Zrzavyet al. (1998) and Peterson and Eernisse (2001) chaetognathsalso clustered with ecdysozoan phyla, whereas theyappeared as the sister group of Nemertodermatida at thebase of Protostomia in another total evidence analysis(Giribet et al., 2000). Giribet et al. (2000) therefore con-cluded, ‘‘the position of the phylum Chaetognatha contin-ues to be one of the most enigmatic issues in metazoanphylogeny’’. More recent investigations of chaetognathrelationships based on mitochondrial protein-coding genes(Papillon et al., 2004) and an EST derived dataset (Matuset al., 2006) indicated that chaetognaths are more closelyrelated to lophotrochozoans than to ecdysozoans. In con-trast, a second analysis of mitochondrial protein-codinggenes (Helfenbein et al., 2004) and another EST dataset(Marletaz et al., 2006) provide support for a placementof Chaetognatha as sister group of Lophotrochozoa plusEcdysozoa. The contradictory outcomes of phylogeneticanalyses concerning the position of chaetognaths are prob-ably mainly the result of increased substitution rates andconsequential long branch attraction effects.
In order to provide a more robust basis for the resolu-tion of the phylogenetic relationships of these controversial
taxa, we compiled a data set of seven nuclear protein-cod-ing genes covering all major lophophorate lineages and achaetognath representative.
2. Materials and methods
2.1. Material
Samples of Flustra foliacea (Bryozoa, Gymnolaemata),Alcyonidium diaphanum (Bryozoa, Gymnolaemata) andPhoronis muelleri (Phoronida) were obtained from the Bio-logische Anstalt Helgoland (Germany). Specimens of Tere-
bratulina retusa (Brachiopoda, Rhynchonelliformea) fromStomstad (Sweden) and from Norway were purchasedfrom the Tjarno Marine Biological Laboratory (Sweden)or supplied by G. Jarms (University of Hamburg), respec-tively. Novocrania anomala (Brachiopoda, Craniiformea),collected offshore Gothenburg (Sweden) and from Ram-søy, Hjeltefjord (Norway), were respective gifts of M. Obst(Kristineberg Marine Research Station, Sweden) and C.Schander (University of Bergen, Norway). H. Kapp(Deutsches Zentrum fur Marine Biodiversitat sforschung,Hamburg) kindly provided specimens of Sagitta setosa(Chaetognatha) from Helgoland. Specimens of Plumatella
repens (Bryozoa, Phylactolaemata) were collected in lakeZotzensee near Mirow (Mecklenburg-Vorpommern, Ger-many). Voucher specimens were deposited in the Zoologi-cal Museum Hamburg.
2.2. Molecular techniques
Total RNA was extracted from tissue fixed in RNAlater(Sigma) or from living animals using TRIzol (Invitrogen)and purified by precipitation or column-based methods(Quiagen RNeasy or Invitrogen TRIzol Plus). First-strandcDNA was synthesized from 0.3–1.0 lg total RNA byreverse transcription using the SuperScript III system(Invitrogen). To increase cDNA yield, a subsequent PCRtargeting adaptor sequences attached to cDNA moleculesduring first-strand synthesis was performed, therebyobtaining amplified cDNA from even minute amounts ofRNA (Schramm et al., 2000). Fragments of sevennuclear-encoded genes, namely aldolase, methionine ade-nosyltransferase, ATP synthase b, elongation factor 1-a,triosephosphate isomerase, phosphofructokinase and cata-lase, were amplified with GoTaq polymerase (Promega) viatouchdown style PCR using universal primers designed byPeterson et al. (2004). To minimize replication errors,proof-reading Pwo polymerase (Roche) was added to thereaction mix. In the case of T. retusa, a fragment of elonga-tion factor 1-a could only be obtained after using a nestedprimer pair (nETf 50-ATHTAYAARTGYGGNGGNAT-30
and nETr 50-AYTTRCANGCDATRTGNGC-30). PCRfragments of the expected sizes were excised from agarosegel and purified (Macherey-Nagel NucleoSpin Extract). Ifno visible amounts of amplificates of the expected size wereproduced, a second amplification using DNA purified from
M. Helmkampf et al. / Molecular Phylogenetics and Evolution 46 (2008) 206–214 207
gel slices excised at the appropriate height as template wasperformed. Each purified fragment was ligated into thepCR2.1-TOPO cloning vector (Invitrogen) and trans-formed into Escherichia coli TOP10 cells (Invitrogen).Clones containing inserts of the correct size were sequencedin both directions on an ABI 377 automated sequencer(Applied Biosystems) using BigDye sequencing chemistry(Applied Biosystems). In those cases where we could notconfidently span the gap with both reads, specific internalprimers were designed. Usually, multiple clones weresequenced per fragment and organism. Sequences weretranslated and aligned with orthologous sequences of othertaxa obtained from GenBank employing the ClustalWalgorithm implemented in MacVector 9.0.2 (MacVector,Inc.). The resulting alignments were inspected and adjustedmanually. The concatenated alignment has been depositedin TreeBASE (http://www.treebase.org) under the studyaccession number S1855.
2.3. Phylogenetic analysis
The appropriate likelihood model of protein evolutionwas determined for each gene fragment as well as for thecomplete data set by ProtTest (Abascal et al., 2005) usingthe ‘‘slow’’ optimization strategy and the AICc criterion.The goodness of fit of the model to the data of separatemodels for each of the gene fragments was compared tothat of the best uniform model for the complete datasetusing Treefinder (Jobb et al., 2004; Jobb, 2007).
The phylogenetic information content of the alignmentwas visualized by likelihood-mapping (Strimmer and vonHaeseler, 1997) as implemented in Tree-Puzzle 5.2(Schmidt et al., 2002).
Maximum likelihood (ML) analyses were conductedwith Treefinder (Jobb et al., 2004; Jobb, 2007). Confidencevalues for the edges of the ML tree were computed bybootstrapping (Felsenstein, 1985) (100 replications).
To test predefined phylogenetic hypotheses we used con-strained trees and the ‘resolve multifurcations’ option ofTreefinder to obtain the ML tree for a specified hypothesis.Then we investigated whether the ML trees for thesehypotheses are part of the confidence set of trees applyingthe approximately unbiased test (Shimodaira, 2002) andthe expected likelihood weights method (Strimmer andRambaut, 2002).
Bayesian inference (BI) analyses were performed usingthe parallel version of MrBayes 3.1.2 (Huelsenbeck andRonquist, 2001). Two independent runs were carried outsimultaneously for 1,000,000 generations starting from ran-domly chosen trees. Each run employed one cold and fiveheated chains set to a heating parameter of 0.5. Trees weresampled every 250 generations, resulting in 4000 trees col-lected in total. Both runs reached convergence after260,000 generations as defined by the average standard devi-ation of split frequencies dropping below 0.1. Chain equilib-rium was also analysed using Tracer v1.3 (Rambaut andDrummond, 2004). To allow for burn-in of the Markov
chains, the first 26% of all sampled trees were discardedbefore calculating a 50% majority rule consensus tree fromthe remaining 2960 trees. The frequency of a clade amongthe sampled trees was interpreted as its posterior probability.
3. Results
Fragments of seven nuclear genes coding for ATPsynthase b (427 amino acids), catalase (264 aa), elongationfactor 1-a (411–423 aa), fructose-bisphosphate aldolase(196–199 aa), methionine adenosyltransferase (319 aa),phosphofructokinase (172 aa) and triosephosphate isomer-ase (210–213 aa) were sequenced from six lophophoratetaxa and a chaetognath. GenBank accession numbers ofthese sequences are listed in Table 1. A few gene fragmentscould not be amplified by PCR. The concatenated data setwas complemented by orthologous sequences of 31 addi-tional taxa obtained from GenBank and encompasses2033 amino acid positions.
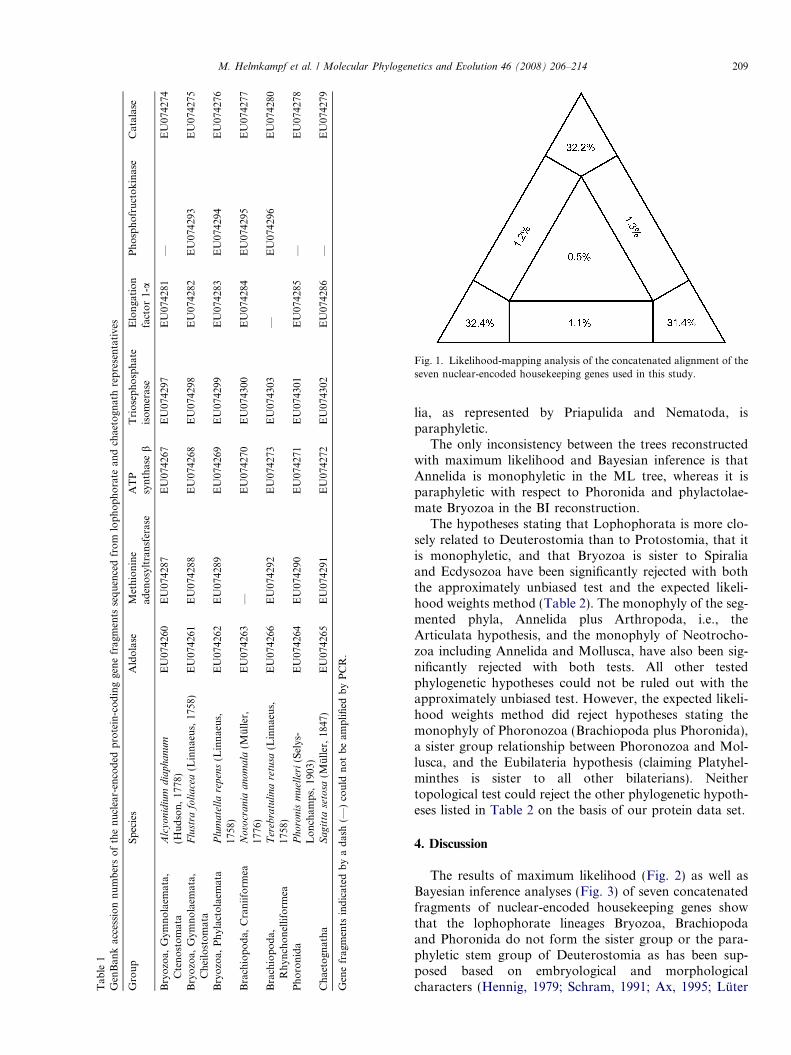
The likelihood-mapping analysis shows that the concat-enated alignment has a high phylogenetic information con-tent and is suitable for phylogenetic reconstruction, since96.0% of the quartets (in the corner areas of attraction inFig. 1) were fully resolved. When analysing the seven genesindividually, 69.5–85.0% of the quartets were fully resolved(mean ± SD 79.2 ± 6.0%). The phylogenetic informationcontent of the individual gene fragments was correlatedwith their length (r = 0.77; p = 0.04).
The use of separate models of protein evolution for eachof the seven gene fragments improved the goodness of fit ofthe model to the data in comparison to the best uniformmodel for the complete dataset according to the AICc cri-terion. Thus, all phylogenetic analyses were based on thepartitioned dataset with separate models for each of theseven gene fragments.
The results of maximum likelihood and Bayesian infer-ence analyses of this dataset are shown in Figs. 2 and 3,respectively. Both analyses recover the main bilaterianclades, i.e., Deuterostomia, Ecdysozoa and Spiralia includ-ing Lophotrochozoa and Platyhelminthes. The lophoph-orate groups Bryozoa, Brachiopoda and Phoronida aremore closely related to nemerteans, molluscs and annelidsthan to deuterostomes or ecdysozoans. Thus, Lophotro-chozoa is monophyletic, although the support for this cladeis not strong. Platyhelminthes appears as the sister group ofLophotrochozoa.
Lophophorata does not constitute a monophyleticgroup: bryozoans and phoronids apparently share a morerecent common ancestor with annelids and molluscs thanwith brachiopods. While articulate and inarticulate bra-chiopods are sister to each other, bryozoans also do notappear as a monophyletic taxon. Instead, phylactolaematebryozoans seem to be more closely related to Phoronidathan to gymnolaemate bryozoans.
Chaetognatha emerges within Ecdysozoa as the sistergroup of Priapulida, while nematodes turn up more closelyrelated to arthropods than to priapulids. Thus Cycloneura-
208 M. Helmkampf et al. / Molecular Phylogenetics and Evolution 46 (2008) 206–214
lia, as represented by Priapulida and Nematoda, isparaphyletic.
The only inconsistency between the trees reconstructedwith maximum likelihood and Bayesian inference is thatAnnelida is monophyletic in the ML tree, whereas it isparaphyletic with respect to Phoronida and phylactolae-mate Bryozoa in the BI reconstruction.
The hypotheses stating that Lophophorata is more clo-sely related to Deuterostomia than to Protostomia, that itis monophyletic, and that Bryozoa is sister to Spiraliaand Ecdysozoa have been significantly rejected with boththe approximately unbiased test and the expected likeli-hood weights method (Table 2). The monophyly of the seg-mented phyla, Annelida plus Arthropoda, i.e., theArticulata hypothesis, and the monophyly of Neotrocho-zoa including Annelida and Mollusca, have also been sig-nificantly rejected with both tests. All other testedphylogenetic hypotheses could not be ruled out with theapproximately unbiased test. However, the expected likeli-hood weights method did reject hypotheses stating themonophyly of Phoronozoa (Brachiopoda plus Phoronida),a sister group relationship between Phoronozoa and Mol-lusca, and the Eubilateria hypothesis (claiming Platyhel-minthes is sister to all other bilaterians). Neithertopological test could reject the other phylogenetic hypoth-eses listed in Table 2 on the basis of our protein data set.
4. Discussion
The results of maximum likelihood (Fig. 2) as well asBayesian inference analyses (Fig. 3) of seven concatenatedfragments of nuclear-encoded housekeeping genes showthat the lophophorate lineages Bryozoa, Brachiopodaand Phoronida do not form the sister group or the para-phyletic stem group of Deuterostomia as has been sup-posed based on embryological and morphologicalcharacters (Hennig, 1979; Schram, 1991; Ax, 1995; LuterT
able
1G
enB
ank
acce
ssio
nn
um
ber
so
fth
en
ucl
ear-
enco
ded
pro
tein
-co
din
gge
ne
frag
men
tsse
qu
ence
dfr
om
lop
ho
ph
ora
tean
dch
aeto
gnat
hre
pre
sen
tati
ves
Gro
up
Sp
ecie
sA
ldo
lase
Met
hio
nin
ead
eno
sylt
ran
sfer
ase
AT
Psy
nth
ase
bT
rio
sep
ho
sph
ate
iso
mer
ase
Elo
nga
tio
nfa
cto
r1-
aP
ho
sph
ofr
uct
ok
inas
eC
atal
ase
Bry
ozo
a,G
ymn
ola
emat
a,C
ten
ost
om
ata
Alc
yo
nid
ium
dia
pha
nu
m
(Hu
dso
n,
1778
)E
U07
4260
EU
0742
87E
U07
4267
EU
0742
97E
U07
4281
—E
U07
4274
Bry
ozo
a,G
ymn
ola
emat
a,C
hei
lost
om
ata
Flu
stra
foli
ace
a(L
inn
aeu
s,17
58)
EU
0742
61E
U07
4288
EU
0742
68E
U07
4298
EU
0742
82E
U07
4293
EU
0742
75
Bry
ozo
a,P
hyl
acto
laem
ata
Plu
ma
tell
are
pen
s(L
inn
aeu
s,17
58)
EU
0742
62E
U07
4289
EU
0742
69E
U07
4299
EU
0742
83E
U07
4294
EU
0742
76
Bra
chio
po
da,
Cra
nii
form
eaN
ovo
cra
nia
an
om
ala
(Mu
ller
,17
76)
EU
0742
63—
EU
0742
70E
U07
4300
EU
0742
84E
U07
4295
EU
0742
77
Bra
chio
po
da,
Rh
ynch
on
elli
form
eaT
ereb
ratu
lina
retu
sa(L
inn
aeu
s,17
58)
EU
0742
66E
U07
4292
EU
0742
73E
U07
4303
—E
U07
4296
EU
0742
80
Ph
oro
nid
aP
horo
nis
muel
leri
(Sel
ys-
Lo
nch
amp
s,19
03)
EU
0742
64E
U07
4290
EU
0742
71E
U07
4301
EU
0742
85—
EU
0742
78
Ch
aeto
gnat
ha
Sag
itta
seto
sa(M
ull
er,
1847
)E
U07
4265
EU
0742
91E
U07
4272
EU
0743
02E
U07
4286
—E
U07
4279
Gen
efr
agm
ents
ind
icat
edb
ya
das
h(—
)co
uld
no
tb
eam
pli
fied
by
PC
R.
Fig. 1. Likelihood-mapping analysis of the concatenated alignment of theseven nuclear-encoded housekeeping genes used in this study.
M. Helmkampf et al. / Molecular Phylogenetics and Evolution 46 (2008) 206–214 209
and Bartolomaeus, 1997; Luter, 2000; Brusca and Brusca,2002). The hypothesis that lophophorates are more closelyrelated to Deuterostomia than to Protostomia has been sig-nificantly rejected with both the approximately unbiasedtest and the expected likelihood weights method (Table 2).
Instead, the analyses based on our protein data set(Figs. 2 and 3) indicate that the lophophorate groupsBryozoa, Brachiopoda and Phoronida share a morerecent common ancestor with molluscs and annelids thanwith deuterostomes or ecdysozoans. Even though the
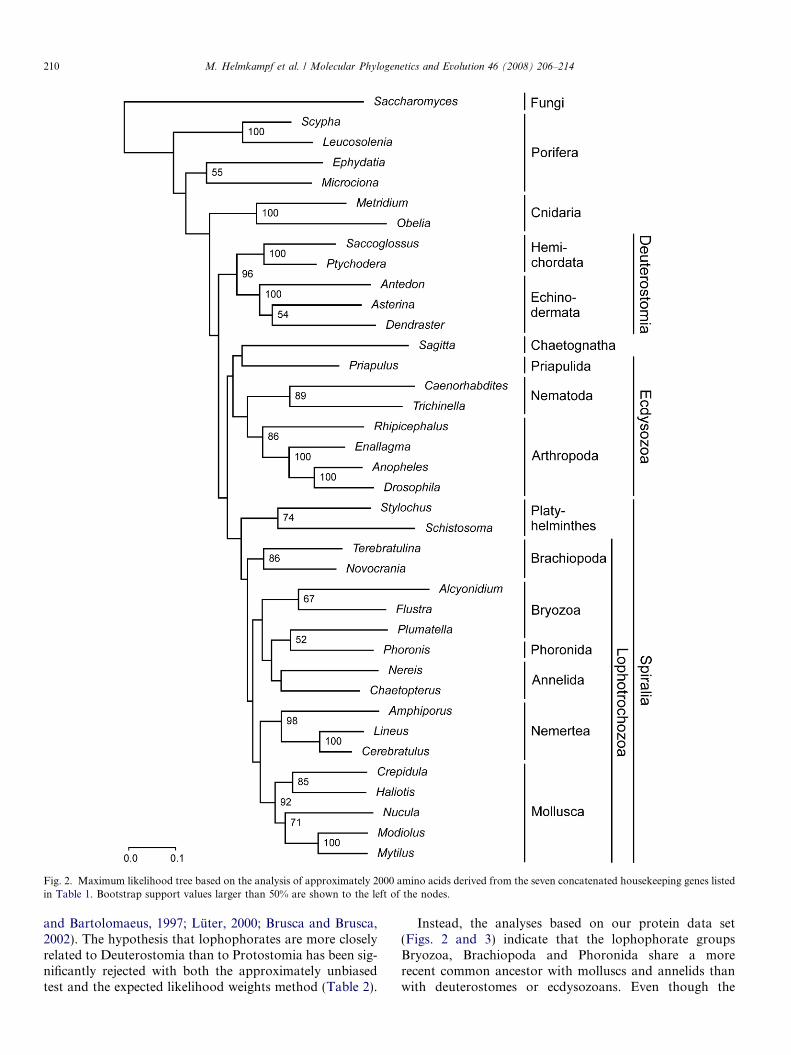
Fig. 2. Maximum likelihood tree based on the analysis of approximately 2000 amino acids derived from the seven concatenated housekeeping genes listedin Table 1. Bootstrap support values larger than 50% are shown to the left of the nodes.
210 M. Helmkampf et al. / Molecular Phylogenetics and Evolution 46 (2008) 206–214
support for this clade is not strong, this confirms themonophyly of Lophotrochozoa and corroborates theresults of studies based on rDNA (Halanych et al.,1995; Littlewood et al., 1998; Cohen, 2000; Petersonand Eernisse, 2001; Mallatt and Winchell, 2002;
Halanych, 2004; Passamaneck and Halanych, 2006),Hox genes (de Rosa et al., 1999; Passamaneck and Hala-nych, 2004) and mitochondrial protein sequences (Stech-mann and Schlegel, 1999; Helfenbein and Boore, 2004;Waeschenbach et al., 2006).
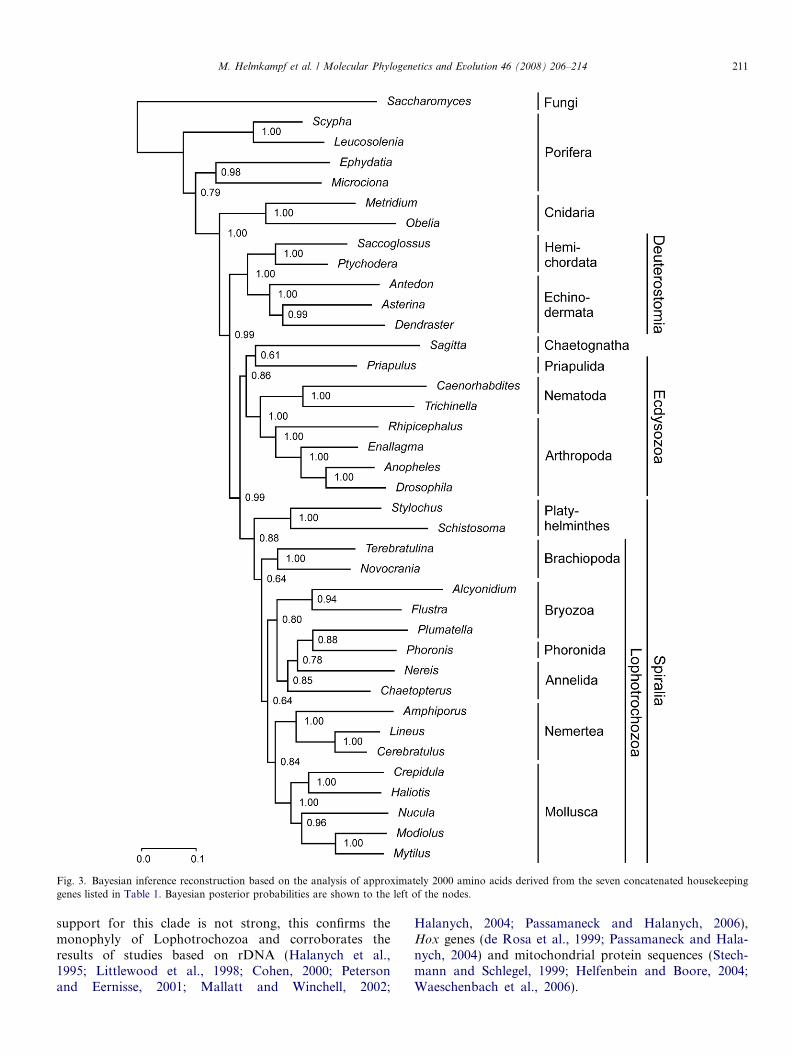
Fig. 3. Bayesian inference reconstruction based on the analysis of approximately 2000 amino acids derived from the seven concatenated housekeepinggenes listed in Table 1. Bayesian posterior probabilities are shown to the left of the nodes.
M. Helmkampf et al. / Molecular Phylogenetics and Evolution 46 (2008) 206–214 211
The Articulata hypothesis (Hennig, 1979; Schram,1991; Nielsen, 2001; Brusca and Brusca, 2002), i.e., themonophyly of the segmented phyla Annelida andArthropoda as an alternative to Lophotrochozoa, hasbeen rejected with both topology tests (Table 2), indicat-ing that segmentation originated independently in thesephyla.
As rDNA and mtDNA analyses have shown before(Halanych et al., 1995; Littlewood et al., 1998; Giribetet al., 2000; Peterson and Eernisse, 2001; Halanych, 2004;Passamaneck and Halanych, 2006; Waeschenbach et al.,2006), our multigene analyses also indicate that Lophopho-rata is polyphyletic. The monophyly of this group has beenrejected with both topology tests (Table 2), suggesting thatlophophore structures originated several times indepen-dently during animal evolution.
Moreover, our results (Figs. 2 and 3, Table 2) questionthe existence of Phoronozoa, a putative clade includingBrachiopoda and Phoronida. Phoronozoa was found inanalyses based on rDNA (Mackey et al., 1996; Cohenet al., 1998; Littlewood et al., 1998; Cohen, 2000; Mallattand Winchell, 2002; Halanych, 2004; Cohen and Weyd-mann, 2005; but see Passamaneck and Halanych, 2006),sodium–potassium ATPase a-subunit (Anderson et al.,2004), and in total evidence analyses (Zrzavy et al., 1998;Giribet et al., 2000; Peterson and Eernisse, 2001). However,this clade could not be recovered by the present investiga-tion and has been rejected by the expected likelihoodweights method (Table 2). The same applies to the hypoth-esis of Halanych (2004) suggesting that Phoronozoa is thesister group of Mollusca.
The analyses of the protein data set presented herein(Figs. 2 and 3) further indicate that ectoproct bryozoansare polyphyletic. Phylactolaemate bryozoans seem to bemore closely related to phoronids than to gymnolaematebryozoans. Actually, Mundy et al. (1981) have proposedsuch a relationship based on similarities in lophophorearchitecture and other morphological features. However,the support for the clade including phylactolaemate bry-ozoans and phoronids is not strong and the monophylyof bryozoans could not be rejected by topological tests(Table 2). The two bryozoan lineages and Phoronida forma clade also comprising Annelida. Nevertheless, a sistergroup relation of Bryozoa and all other Lophotrochozoa(or Spiralia, according to our trees) as advocated by Hala-nych et al. (1995) and Halanych (2004) can not be ruled outaccording to the topology tests (Table 2). In contrast, thehypothesis that Bryozoa is the sister group of Spiraliaand Ecdysozoa (Giribet et al., 2000) has been rejected withthe expected likelihood weights method (Table 2).
Peterson and Eernisse (2001) proposed several cladeswithin Lophotrochozoa, e.g., Neotrochozoa that includesAnnelida, Mollusca, Echiura and Sipuncula, and Eutro-chozoa that comprises Neotrochozoa and Nemertea. Sofar these clades were found only in total evidence analyses(Zrzavy et al., 1998; Giribet et al., 2000; Peterson and Eer-nisse, 2001). We did not recover them in the analyses of ourprotein data set (Figs. 2 and 3). The Neotrochozoa hypoth-esis could be rejected with topology tests, whereas theEutrochozoa hypothesis could not (Table 2).
Platyhelminths (as the only members of Platyzoa repre-sented in our analysis) are the sister group of Lophotrocho-
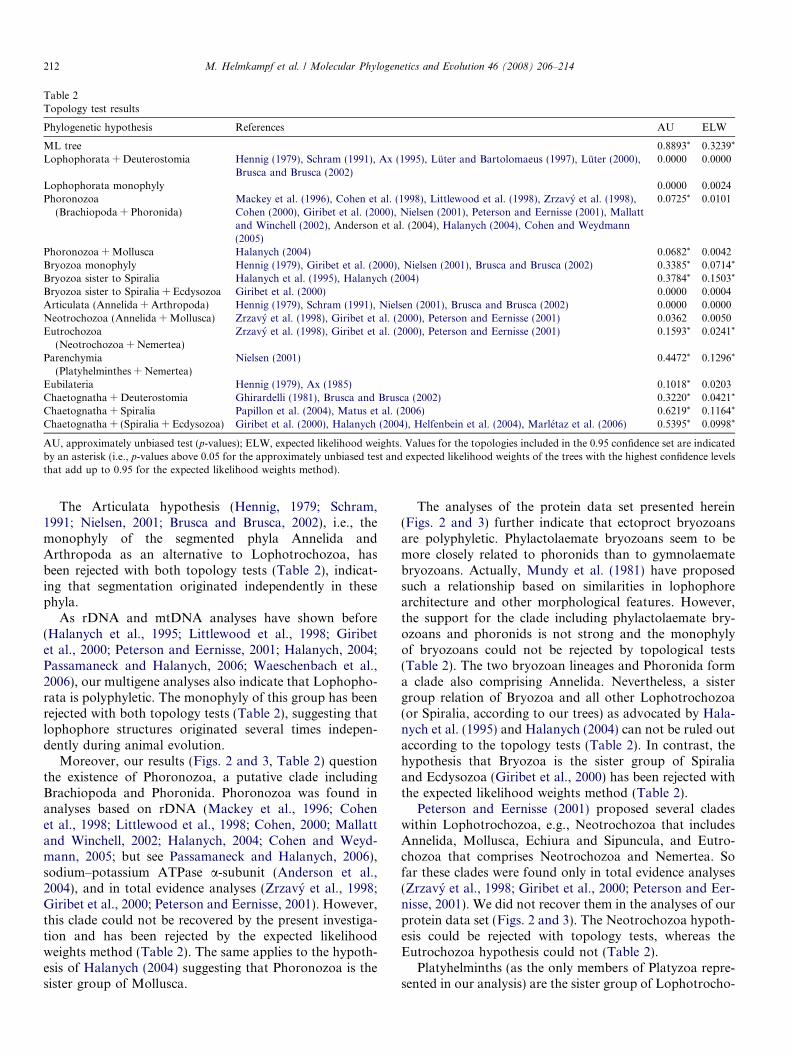
Table 2Topology test results
Phylogenetic hypothesis References AU ELW
ML tree 0.8893* 0.3239*
Lophophorata + Deuterostomia Hennig (1979), Schram (1991), Ax (1995), Luter and Bartolomaeus (1997), Luter (2000),Brusca and Brusca (2002)
0.0000 0.0000
Lophophorata monophyly 0.0000 0.0024Phoronozoa
(Brachiopoda + Phoronida)Mackey et al. (1996), Cohen et al. (1998), Littlewood et al. (1998), Zrzavy et al. (1998),Cohen (2000), Giribet et al. (2000), Nielsen (2001), Peterson and Eernisse (2001), Mallattand Winchell (2002), Anderson et al. (2004), Halanych (2004), Cohen and Weydmann(2005)
0.0725* 0.0101
Phoronozoa + Mollusca Halanych (2004) 0.0682* 0.0042Bryozoa monophyly Hennig (1979), Giribet et al. (2000), Nielsen (2001), Brusca and Brusca (2002) 0.3385* 0.0714*
Bryozoa sister to Spiralia Halanych et al. (1995), Halanych (2004) 0.3784* 0.1503*
Bryozoa sister to Spiralia + Ecdysozoa Giribet et al. (2000) 0.0000 0.0004Articulata (Annelida + Arthropoda) Hennig (1979), Schram (1991), Nielsen (2001), Brusca and Brusca (2002) 0.0000 0.0000Neotrochozoa (Annelida + Mollusca) Zrzavy et al. (1998), Giribet et al. (2000), Peterson and Eernisse (2001) 0.0362 0.0050Eutrochozoa
(Neotrochozoa + Nemertea)Zrzavy et al. (1998), Giribet et al. (2000), Peterson and Eernisse (2001) 0.1593* 0.0241*
Parenchymia(Platyhelminthes + Nemertea)
Nielsen (2001) 0.4472* 0.1296*
Eubilateria Hennig (1979), Ax (1985) 0.1018* 0.0203Chaetognatha + Deuterostomia Ghirardelli (1981), Brusca and Brusca (2002) 0.3220* 0.0421*
Chaetognatha + Spiralia Papillon et al. (2004), Matus et al. (2006) 0.6219* 0.1164*
Chaetognatha + (Spiralia + Ecdysozoa) Giribet et al. (2000), Halanych (2004), Helfenbein et al. (2004), Marletaz et al. (2006) 0.5395* 0.0998*
AU, approximately unbiased test (p-values); ELW, expected likelihood weights. Values for the topologies included in the 0.95 confidence set are indicatedby an asterisk (i.e., p-values above 0.05 for the approximately unbiased test and expected likelihood weights of the trees with the highest confidence levelsthat add up to 0.95 for the expected likelihood weights method).
212 M. Helmkampf et al. / Molecular Phylogenetics and Evolution 46 (2008) 206–214
zoa according to our analyses (Figs. 2 and 3), consistentwith some rDNA analyses (Littlewood et al., 1998; Peter-son and Eernisse, 2001; but see Mallatt and Winchell,2002; Halanych, 2004; Passamaneck and Halanych,2006). However, a sister group relationship between Platy-helminthes and Nemertea (Parenchymia in the sense ofNielsen, 2001) could not be rejected with topology tests(Table 2). Nonetheless, both maximum likelihood andBayesian inference analyses indicate that Platyhelminthesdo not belong to Lophotrochozoa, which is defined asthe last common ancestor of the three traditional lophoph-orate taxa, the molluscs, and the annelids, and all descen-dants of that ancestor (Halanych et al., 1995). Assumingthat the spiral-quartet cleavage of plathyhelminths ishomologous to that of nemerteans, annelids, and molluscs,we use the name Spiralia for the clade including platyhelm-inths (and possibly other Platyzoa) and lophotrochozoansas has been done by Garey and Schmidt-Rhaesa (1998)and Giribet et al. (2000). The analyses based on our proteindata set thus contradict the result of a combined analysis of18S and 28S rDNA sequences that suggested a topologi-cally derived position of Platyzoa within Lophotrochozoa(Passamaneck and Halanych, 2006). However, we cannotrule out that Platyhelminthes indeed belong to Lophotro-chozoa, because the topology tests did not reject a positionof the bryozoan lineages as sister to Spiralia (Table 2).Since platyhelminths are the only representatives of Platy-zoa in our data set, a denser sampling of Platyzoa isrequired for conclusions that are more robust.
The Eubilateria hypothesis (Hennig, 1979; Ax, 1985),according to which Platyhelminthes is not related toLophotrochozoa, but is instead the sister group of all otherbilaterians, has been rejected with the expected likelihoodweights method (Table 2).
Chaetognaths appear as the sister group of Priapulidawithin Ecdysozoa in our phylogenetic analyses (Figs. 2and 3). Actually, a relationship of chaetognaths with ecdy-sozoans has been proposed several times based on 18SrDNA sequences (Littlewood et al., 1998; Zrzavy et al.,1998; Peterson and Eernisse, 2001). However, there are sev-eral alternative hypotheses concerning the relationships ofChaetognatha. Firstly, a relationship of Chaetognatha withDeuterostomia has been supposed based on embryologicaland morphological data (Ghirardelli, 1981; Brusca andBrusca, 2002). Secondly, Chaetognatha has been placedbasal to the remaining protostomes in a total evidenceanalysis (Giribet et al., 2000), an analysis of mitochondrialprotein sequences (Helfenbein et al., 2004), and an ESTanalysis (Marletaz et al., 2006). Thirdly, another analysisof mitochondrial protein sequences (Papillon et al., 2004)and a second EST analysis (Matus et al., 2006) placed chae-tognaths and Spiralia in a clade. Unfortunately, none ofthese hypotheses can be ruled out according to topologicaltests based on this multigene analysis (Table 2).
Although we were able to recover the main clades withinBilateria, namely Deuterostomia, Ecdysozoa and Spiraliaincluding Lophotrochozoa and Platyhelminthes, the
sequences of seven gene fragments were not sufficient fora robust resolution of the phylogenetic relationships ofthe lophophorate groups and chaetognaths. This indicatesthat still more data are necessary. We thus plan EST pro-jects to obtain information on a genomic scale to shed fur-ther light on the relationships of the lophophorate lineages.
Acknowledgments
We thank R. Gramckov, G. Jarms, H. Kapp, M. Kruß,M. Obst and C. Schander for providing and identifyingspecimens, G. Jobb for his help in running Treefinderand U. Willhoft for her help in running MrBayes. Thisstudy was funded by the priority program ‘‘Deep Meta-zoan Phylogeny’’ of the Deutsche Forschungsgemeinschaft(HA2763/5-1).
References
Abascal, F., Zardoya, R., Posada, D., 2005. ProtTest: selection of best-fitmodels of protein evolution. Bioinformatics 21, 2104–2105.
Anderson, F.E., Cordoba, A.J., Thollesson, M., 2004. Bilaterian phylog-eny based on analyses of a region of the sodium-potassium ATPase a-subunit gene. J. Mol. Evol. 58, 252–268.
Ax, P., 1985. The position of the Gnathostomulida and Platyhelminthes inthe phylogenetic system of the Bilateria. In: Conway Morris, S., George,J.D., Gibson, R., Platt, H.M. (Eds.), The Origins and Relationships ofLower Invertebrates. Clarendon Press, Oxford, UK, pp. 168–180.
Ax, P., 1995. Das System der Metazoa I. Gustav Fischer Verlag, Stuttgart.Brusca, R.C., Brusca, G.J., 2002. Invertebrates, second ed. Sinauer,
Sunderland, MA.Cohen, B.L., 2000. Monophyly of brachiopods and phoronids: reconcil-
iation of molecular evidence with Linnaean classification (the subphy-lum Phoroniformea nov.). Proc. R. Soc. Lond. B 267, 225–231.
Cohen, B.L., Gawthrop, A.B., Cavalier-Smith, T., 1998. Molecularphylogeny of brachiopods and phoronids based on nuclear-encodedsmall subunit ribosomal RNA gene sequences. Philos. Trans. R. Soc.Lond. B 353, 2039–2061.
Cohen, B.L., Weydmann, A., 2005. Molecular evidence that phoronids area subtaxon of brachiopods (Brachiopoda: Phoronata) and that geneticdivergence of metazoan phyla began long before the early Cambrian.Organ. Diver. Evol. 5, 253–273.
de Rosa, R., Grenier, J.K., Andreeva, T., Cook, C.E., Adoutte, A., Akam,M., Carroll, S.B., Balavoine, G., 1999. Hox genes in brachiopods andpriapulids and protostome evolution. Nature 399, 772–776.
Felsenstein, J., 1985. Confidence limits on phylogenies: an approach usingthe bootstrap. Evolution 39, 783–791.
Garey, J.R., Schmidt-Rhaesa, A., 1998. The essential role of ‘‘minor’’phyla in molecular studies of animal evolution. Am. Zool. 38, 907–917.
Ghirardelli, E., 1981. I Chaetognati: posizione sistematica, affinita edevoluzione del phylum. In: Origine dei grande phyla dei metazoi.Accademia dei Lincei, Rome, pp. 191–233.
Giribet, G., Distel, D.L., Polz, M., Sterrer, W., Wheeler, W.C., 2000.Triploblastic relationships with emphasis on the Acoelomates and theposition of Gnathostomulida, Cycliophora, Plathelminthes, andChaetognatha: a combined approach of 18S rDNA sequences andmorphology. Syst. Biol. 49, 539–562.
Halanych, K.M., 1996. Testing hypotheses of chaetognath origins: longbranches revealed by 18S ribosomal DNA. Syst. Biol. 45, 223–246.
Halanych, K.M., 2004. The new view of animal phylogeny. Annu. Rev.Ecol. Evol. Syst. 35, 229–256.
Halanych, K.M., Bacheller, J.D., Aguinaldo, A.A., Liva, S.M., Hillis,D.M., Lake, J.A., 1995. Evidence from 18S ribosomal DNA that theLophophorates are protostome animals. Science 267, 1641–1642.
M. Helmkampf et al. / Molecular Phylogenetics and Evolution 46 (2008) 206–214 213
Helfenbein, K.G., Boore, J.L., 2004. The mitochondrial genome ofPhoronis architecta—comparisons demonstrate that phoronids arelophotrochozoan protostomes. Mol. Biol. Evol. 21, 153–157.
Helfenbein, K.G., Fourcade, H.M., Vanjani, R.G., Boore, J.L., 2004. Themitochondrial genome of Paraspadella gotoi is highly reduced andreveals that chaetognaths are a sister group to protostomes. Proc. Natl.Acad. Sci. USA 101, 10639–10643.
Hennig, W., 1979. Wirbellose I (ausgenommen Gliedertiere). Taschenbuchder Speziellen Zoologie, fourth ed. vol. 2 Fischer, Jena.
Huelsenbeck, J.P., Ronquist, F., 2001. MRBAYES: Bayesian inference ofphylogenetic trees. Bioinformatics 17, 754–755.
Jobb, G., 2007. TREEFINDER version of February 2007. Munich,Germany. Distributed by the author at www.treefinder.de.
Jobb, G., von Haeseler, A., Strimmer, K., 2004. TREEFINDER: apowerful graphical analysis environment for molecular phylogenetics.BMC Evol. Biol. 4, 18.
Littlewood, D.T.J., Telford, M.J., Clough, K.A., Rohde, K., 1998.Gnathostomulida—an enigmatic Metazoan Phylum from both mor-phological and molecular perspective. Mol. Phylogenet. Evol. 9, 72–79.
Luter, C., 2000. The origin of the coelom in Brachiopoda and itsphylogenetic significance. Zoomorphology 120, 15–28.
Luter, C., Bartolomaeus, T., 1997. The phylogenetic position of Brachio-poda A comparison of morphological and molecular data. Zool.Scripta 26, 245–254.
Mackey, L.Y., Winnepenninckx, B., De Wachter, R., Backeljau, T.,Emschermann, P., Garey, J.R., 1996. 18S rRNA suggests thatEntoprocta are protostomes, unrelated to Ectoprocta. J. Mol. Evol.42, 552–559.
Mallatt, J., Winchell, C.J., 2002. Testing the new animal phylogeny:first use of combined large-subunit and small-subunit rRNA genesequences to classify the protostomes. Mol. Biol. Evol. 19, 289–301.
Marletaz, F., Martin, E., Perez, Y., Papillon, D., Caubit, X., Lowe, C.J.,Freeman, B., Fasano, L., Dossat, C., Wincker, P., Weissenbach, J., LeParco, Y., 2006. Chaetognath phylogenomics: a protostome withdeuterostome-like development. Curr. Biol. 16, R577–R578.
Matus, D.Q., Copley, R.R., Dunn, C.W., Hejnol, A., Eccleston, H.,Halanych, K.M., Martindale, M.Q., Telford, M.J., 2006. Broad taxonand gene sampling indicate that chaetognaths are protostomes. Curr.Biol. 16, R575–R576.
Mundy, S.P., Taylor, P.D., Thorpe, J.P., 1981. A reinterpretation ofPhylactolaemate phylogeny. In: Larwood, G.P., Nielsen, C. (Eds.),Recent and Fossil Bryozoa. Olsen, Fredensborg, pp. 185–190.
Nielsen, C., 2001. Animal Evolution: Interrelationships of the LivingPhyla, second ed. Oxford University Press, Oxford.
Papillon, D., Perez, Y., Caubit, X., Le Parco, Y., 2004. Identification ofchaetognaths as protostomes is supported by the analysis of theirmitochondrial genome. Mol. Biol. Evol. 21, 2122–2129.
Passamaneck, Y.J., Halanych, K.M., 2004. Evidence from Hox genes thatbryozoans are lophotrochozoans. Evol. Dev. 6, 275–281.
Passamaneck, Y., Halanych, K.M., 2006. Lophotrochozoan phylogenyassessed with LSU and SSU data: evidence of lophophorate polyphyly.Mol. Phylogenet. Evol. 40, 20–28.
Peterson, K.J., Eernisse, D.J., 2001. Animal phylogeny and the ancestry ofbilaterians: inferences from morphology and 18S rDNA genesequences. Evol. Dev. 3, 170–205.
Peterson, K.J., Lyons, J.B., Nowak, K.S., Takacs, C.M., Wargo, M.J.,McPeek, M.A., 2004. Estimating metazoan divergence times with amolecular clock. Proc. Natl. Acad. Sci. USA 101, 6536–6541.
Philippe, H., Lartillot, N., Brinkmann, H., 2005. Multigene analyses ofbilaterian animals corroborate the monophyly of Ecdysozoa, Lopho-trochozoa, and Protostomia. Mol. Biol. Evol. 22, 1246–1253.
Rambaut, A., Drummond, A.J., 2004. Tracer v1.3. Available from:<http://evolve.zoo.ox.ac.uk/software.html>.
Ruiz-Trillo, I., Paps, J., Loukota, M., Ribera, C., Jondelius, U., Baguna,J., Riutort, M., 2002. A phylogenetic analysis of myosin heavy chaintype II sequences corroborates that Acoela and Nemertodermatida arebasal bilaterians. Proc. Natl. Acad. Sci. USA 99, 11246–11251.
Schmidt, H.A., Strimmer, K., Vingron, M., von Haeseler, A., 2002.TREE-PUZZLE: maximum likelihood phylogenetic analysis usingquartets and parallel computing. Bioinformatics 18, 502–504.
Schram, F.R., 1991. Cladistic analysis of metazoan phyla and theplacement of fossil problematica. In: Simonetta, A.M., Conway-Morris, S. (Eds.), The Early Evolution of Metazoa and the Significanceof Problematic Taxa. Cambridge Univ. Press, Cambridge, pp. 35–46.
Schramm, G., Bruchhaus, I., Roeder, T., 2000. A simple and reliable 50-race approach. Nucleic Acids Res. 28 (e96), 1–4.
Shimodaira, H., 2002. An approximately unbiased test of phylogenetictree selection. Syst. Biol. 51, 492–508.
Stechmann, A., Schlegel, M., 1999. Analysis of the complete mitochon-drial DNA sequence of the brachiopod Terebratulina retusa placesBrachiopoda within the protostomes. Proc. R. Soc. Lond. B 266, 2043–2052.
Strimmer, K., Rambaut, A., 2002. Inferring confidence sets of possiblymisspecified gene trees. Proc. R. Soc. Lond. B 269, 137–142.
Strimmer, K., von Haeseler, A., 1997. Likelihood-mapping: a simplemethod to visualize phylogenetic content of a sequence alignment.Proc. Natl. Acad. Sci. USA 94, 6815–6819.
Telford, M.J., Holland, P.W.H., 1993. The phylogenetic affinities of theChaetognaths: a molecular analysis. Mol. Biol. Evol. 10, 660–676.
Wada, H., Satoh, N., 1994. Details of the evolutionary history frominvertebrates to vertebrates, as deduced from the sequences of 18SrDNA. Proc. Natl. Acad. Sci. USA 91, 1801–1804.
Waeschenbach, A., Telford, M.J., Porter, J.S., Littlewood, D.T.J., 2006.The complete mitochondrial genome of Flustrellidra hispida and thephylogenetic position of Bryozoa among the Metazoa. Mol. Phyloge-net. Evol. 40, 195–207.
Zrzavy, J., Mihulka, S., Kepka, P., Bezdek, A., Tietz, D., 1998. Phylogenyof the Metazoa based on morphological and 18S ribosomal DNAevidence. Cladistics 14, 249–285.
214 M. Helmkampf et al. / Molecular Phylogenetics and Evolution 46 (2008) 206–214

28
2.2. Spiralian phylogenomics supports the resurrection of Bryozoa comprising
Ectoprocta and Entoprocta
Hausdorf B., Helmkampf M., Meyer A., Witek A., Herlyn H., Hankeln T., Struck T. H., and Lieb B.
2007. Sprialian phylogenomics supports the resurrection of Bryozoa comprising Ectoprocta and
Entoprocta. Molecular Biology and Evolution 24: 2723–2729.
Spiralian Phylogenomics Supports the Resurrection of Bryozoa ComprisingEctoprocta and Entoprocta
Bernhard Hausdorf,* Martin Helmkampf,* Achim Meyer,� Alexander Witek,§ Holger Herlyn,kIris Bruchhaus,{ Thomas Hankeln,§ Torsten H. Struck,# and Bernhard Lieb�*Zoological Museum, University of Hamburg, Hamburg, Germany; �Institute of Zoology, Johannes Gutenberg University, Mainz,Germany; §Institute of Molecular Genetics, Biosafety Research and Consulting, Johannes Gutenberg University, Mainz, Germany;kInstitute of Anthropology, Johannes Gutenberg University, Mainz, Germany; {Bernhard Nocht Institute for Tropical Medicine,Hamburg, Germany; and #FB05 Biology/Chemistry, AG Zoology, University of Osnabruck, Osnabruck, Germany
Phylogenetic analyses based on 79 ribosomal proteins of 38 metazoans, partly derived from 6 new expressed sequencetag projects for Ectoprocta, Entoprocta, Sipuncula, Annelida, and Acanthocephala, indicate the monophyly of Bryozoacomprising Ectoprocta and Entoprocta, 2 taxa that have been separated for more than a century based on seeminglyprofound morphological differences. Our results also show that bryozoans are more closely related to Neotrochozoa,including molluscs and annelids, than to Syndermata, the latter comprising Rotifera and Acanthocephala. Furthermore,we find evidence for the position of Sipuncula within Annelida. These findings suggest that classical developmental andmorphological key characters such as cleavage pattern, coelomic cavities, gut architecture, and body segmentation aresubject to greater evolutionary plasticity than traditionally assumed.
Introduction
With the establishment of Lophotrochozoa andEcdysozoa (Halanych et al. 1995; Aguinaldo et al. 1997),molecular data have substantially changed our view of an-imal evolution. Recent phylogenomic approaches have gen-erally sustained these hypotheses (Philippe et al. 2005;Philippe and Telford 2006; Baurain et al. 2007), but ade-quate genomic data are still lacking for many minor phylawhose affinities are still in dispute (Giribet et al. 2000;Halanych 2004). Two of the most enigmatic minor animalphyla are the moss animals, that is, Ectoprocta and Ento-procta. When first discovered, entoprocts (Kamptozoa)were treated together with the ectoproct bryozoans becauseof their sessile life style and ciliated tentacles. Nitsche(1869) pointed to the differences between the position ofthe anus and the retractability of the tentacle crowns andproposed the names Entoprocta and Ectoprocta for the 2main groups of bryozoans. Subsequently, the 2 groups havealmost unanimously been treated as separate higher taxa,mainly based on the differences in cleavage patterns andbody cavities (Hatschek 1891; Korschelt and Heider1893; Hennig 1979; Emschermann 1982; Schram 1991;Zrzavy et al. 1998; Ax 1999; Giribet et al. 2000; Sørensenet al. 2000; Brusca and Brusca 2002). So far, all analyses ofrDNA sequences have supported the assumption that they donot constitute sister taxa (Mackey et al. 1996; Littlewoodet al. 1998; Zrzavy et al. 1998; Giribet et al. 2000; Petersonand Eernisse 2001; Passamaneck and Halanych 2006). How-ever, Nielsen (1971, 1985, 2001) and Cavalier-Smith (1998)maintained the monophyly of Bryozoa in the broader sense.
To acquire molecular data sufficient for a resolution ofthe phylogenetic relationships of ectoprocts and entoprocts,we generated 2,000–4,000 expressed sequence tags (ESTs)from representatives of Ectoprocta, Entoprocta, Sipuncula,Annelida, and Acanthocephala (table 1). The comparison ofthe 6 analyzed transcriptomes revealed a broad coverage of
ribosomal proteins, which are valuable markers for phylo-genomic analyses (Veuthey and Bittar 1998; Philippe et al.2004; Hughes et al. 2006; Marletaz et al. 2006) because ofthe rarity of known gene duplications resulting in paralogsand their conservation among eukaryotes. We compiledfrom our EST projects a data set comprising 79 ribosomalproteins, whichwe complemented byorthologous sequencesof 32 additional taxa obtained from public databases.
Materials and MethodsIsolation of RNA and Library Construction
Total RNA of the organisms specified in table 1 wasextracted from living or frozen tissue employing TRIzol (In-vitrogen, Karlsruhe, Germany) or column-based methods(Qiagen RNeasy Plant Mini Kit). FlustraRNA was addition-ally purified by the RNeasy Mini Kit cleanup procedure(Qiagen, Hilden, Germany), whereas for the purificationof Barentsia RNA, we applied the NucleoSpin RNA II kit(Macherey-Nagel, Duren, Germany). Quality of totalRNA was visually checked on agarose gel, and mRNAwas subsequently captured by using the polyATract mRNAIsolation System III (Promega, Mannheim, Germany) or Dy-nabeads (Invitrogen, Karlsruhe, Germany) for Sipunculus.All cDNA libraries were constructed at the Max Planck In-stitute for Molecular Genetics in Berlin by primer extension,size fractioning, and directional cloning applying theCreator SMART cDNA Libraries Kit (Clontech, Heidelberg,Germany) or Invitrogen’s CloneMiner technology(Arenicola only), using the respective vectors pDNR-LIBor pDONR222. Clones containing cDNA inserts were se-quenced from the 5# end on the automated capillary se-quencer systems ABI 3730 XL (Applied Biosystems,Darmstadt, Germany) and MegaBace 4500 (GE Healthcare,Munchen, Germany) using BigDye chemistry (Applied Bio-systems). If possible, clones containing ribosomal proteinsfrom the libraries of Barentsia and Sipunculus were com-pleted by reverse sequencing with polyT- and vector-specific reverse primer to maximize sequence coverage.
EST Processing
EST processing was accomplished at the Centerfor Integrative Bioinformatics in Vienna. Sequencing
Key words: Metazoa, phylogenomics, Bryozoa, Ectoprocta,Entoprocta, Spiralia.
E-mail: [email protected].
Mol. Biol. Evol. 24(12):2723–2729. 2007doi:10.1093/molbev/msm214Advance Access publication October 5, 2007
� The Author 2007. Published by Oxford University Press on behalf ofthe Society for Molecular Biology and Evolution. All rights reserved.For permissions, please e-mail: [email protected]
chromatograms were first base called and evaluated usingthe Phred application (Ewing et al. 1998). Vector, adapter,poly-A, and bacterial sequences were removed employ-ing the software tools Lucy (www.tigr.org), SeqClean(compbio.dfci.harvard.edu/tgi/software), and CrossMatch(www.phrap.org). Repetitive elements were subsequentlymasked with RepeatMasker. Clustering and assembly ofthe clipped sequences were performed using the TIGCLprogram package (compbio.dfci.harvard.edu/tgi/software)by first performing pairwise comparisons (MGIBlast)and a subsequent clustering step (CAP3). Low-quality re-gions were then removed by Lucy. Finally, contigs weretentatively annotated by aligning them pairwise with the25 best hits retrieved from National Center for Biotechnol-ogy Information’s nonredundant protein database using theBlastX algorithm (www.ncbi.nlm.nih.gov). Alignment andcomputation of the resulting match scores on which anno-tation was based were conducted by GeneWise (Birneyet al. 2004) in order to account for frameshift errors. TheEST data used in our analyses have been deposited in Gen-Bank under the accession numbers EU139167–EU139243(Flustra), EU116892–EU116936, EU220741 (Barentsia),EU116844–EU116891 (Sipunculus), EU124931–EU124992(Arenicola), EU124993–EU125033 (Eurythoe), andAM849482–AM849546 (Pomphorhynchus).
Sequence Analyses and Ribosomal Proteins Alignment
Ribosomal protein sequences were extracted from thenewly obtained EST data by their annotation or by using thehuman ribosomal protein genes retrieved from the Ribo-somal Protein Gene Database (ribosome.med.miyazaki-u.ac.jp) as search template during local Blast searches(using the TblastN algorithm and an e value ,e�10 as matchcriterion). The observed sequences were checked for as-sembly errors by visual inspection and by comparison withcorresponding sequences of related taxa, and translated intoamino acid sequences. Orthologous sequences of Priapuluscaudatus, Ascaris suum, Aplysia californica, Idiosepiusparadoxus, Macrostomum lignano, Philodina roseola,Flaccisagitta enflata, and Strongylocentrotus purpuratuswere obtained from public EST databases using TblastNsearches also employing human sequences as query. Addi-tional ribosomal protein data were retrieved from the align-ments compiled by Baurain et al. (2007) and provided by H.Philippe (Universite de Montreal), and complemented for
missing genes. Ribosomal proteins of Ciona intestinalis,Takifugu rubripes, Anopheles gambiae, and, in part, Apismellifera were acquired directly from the Ribosomal Pro-tein Gene Database. Sequences of Spadella cephalopterawere provided by F. Marletaz (Station Marine d’Endoume,Marseille).
All ribosomal protein sequences obtained werealigned by the ClustalW algorithm (Thompson et al.1994). The resulting 79 ribosomal protein alignments wereinspected and adjusted manually. Questionably aligned po-sitions were eliminated with Gblocks (Castresana 2000),applying all less stringent block selection parameters avail-able and thereafter concatenated to a single multiple se-quence alignment. This alignments is available at TreeBASE(http://www.treebase.org; accession number S1884).
Phylogenetic Analyses
Maximum Likelihood (ML) analyses were conductedwith Treefinder (Jobb et al. 2004; Jobb 2007). The rtRev þGþ F model of protein evolution was used for the ML anal-yses because it was superior to other uniform models for theconcatenated data set as well as a mixed model combiningseparate models as determined by ProtTest (Abascal et al.2005) for each of the 79 gene partitions according to theAkaike Information Criterion with a correction term forsmall sample size. Confidence values for the edges ofthe ML tree were computed by applying expected likeli-hood weights (ELWs) (Strimmer and Rambaut 2002) toall local rearrangements (LR) of tree topology around anedge (1,000 replications).
To test predefined phylogenetic hypotheses, we usedconstrained trees and the ‘resolve multifurcations’ option ofTreefinder to obtain the ML tree for a specified hypothesis.Then we investigated whether the ML trees for these hy-potheses are part of the confidence set of trees applyingthe expected likelihood weights method (Strimmer andRambaut 2002).
Bayesian inference (BI) analyses based on the site-heterogeneousCATmodel(LartillotandPhilippe2004)wereperformed using PhyloBayes v2.1c (Blanquart and Lartillot2006). Two independent chains were run simultaneouslyfor 10,000 points each. Chain equilibrium was estimatedby plotting the log-likelihood and the alpha parameter asa function of the generation number. The first 1,000 pointswere consequently discarded as burn-in. According to the
Table 1List of Investigated Taxa and Data Used in Phylogenetic Analyses
Species Taxon Origin # EST # RP
Flustra foliacea (Linnaeus 1758) Ectoprocta Helgoland, North Sea 4.074 77Barentsia elongata (Jullien and Calvet 1903)a Entoprocta Lab culture 2.154 47Arenicola marina (Linnaeus 1758) Annelida Sylt, North Sea 2.199 61Eurythoe complanata (Pallas 1776) Annelida Lab culture 2.257 41Sipunculus nudus (Linnaeus 1766) Sipuncula Roscoff, France 2.329 48Pomphorhynchus laevis (Muller 1776) Acanthocephala Gimbsheim, Germany
(from host Barbus fluviatilis)2.207 65
NOTE.—# EST: number of sequenced EST clones; # RP: number of ribosomal proteins retrieved at least partially from the EST data sets. Voucher specimens were
deposited at the Zoological Museum, Hamburg.a The data set of B. elongata was complemented by 2 sequences derived from 95 ESTs of Barentsia benedeni (Foettinger 1886).
2724 Hausdorf et al.
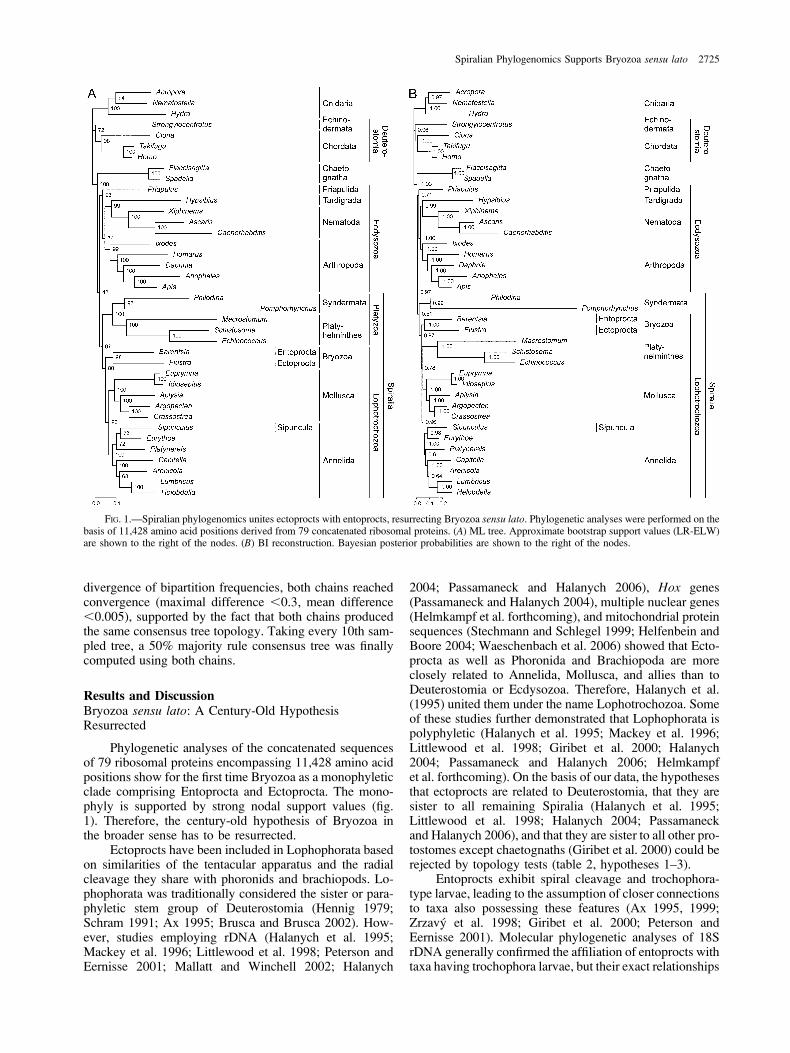
divergence of bipartition frequencies, both chains reachedconvergence (maximal difference ,0.3, mean difference,0.005), supported by the fact that both chains producedthe same consensus tree topology. Taking every 10th sam-pled tree, a 50% majority rule consensus tree was finallycomputed using both chains.
Results and DiscussionBryozoa sensu lato: A Century-Old HypothesisResurrected
Phylogenetic analyses of the concatenated sequencesof 79 ribosomal proteins encompassing 11,428 amino acidpositions show for the first time Bryozoa as a monophyleticclade comprising Entoprocta and Ectoprocta. The mono-phyly is supported by strong nodal support values (fig.1). Therefore, the century-old hypothesis of Bryozoa inthe broader sense has to be resurrected.
Ectoprocts have been included in Lophophorata basedon similarities of the tentacular apparatus and the radialcleavage they share with phoronids and brachiopods. Lo-phophorata was traditionally considered the sister or para-phyletic stem group of Deuterostomia (Hennig 1979;Schram 1991; Ax 1995; Brusca and Brusca 2002). How-ever, studies employing rDNA (Halanych et al. 1995;Mackey et al. 1996; Littlewood et al. 1998; Peterson andEernisse 2001; Mallatt and Winchell 2002; Halanych
2004; Passamaneck and Halanych 2006), Hox genes(Passamaneck and Halanych 2004), multiple nuclear genes(Helmkampf et al. forthcoming), and mitochondrial proteinsequences (Stechmann and Schlegel 1999; Helfenbein andBoore 2004; Waeschenbach et al. 2006) showed that Ecto-procta as well as Phoronida and Brachiopoda are moreclosely related to Annelida, Mollusca, and allies than toDeuterostomia or Ecdysozoa. Therefore, Halanych et al.(1995) united them under the name Lophotrochozoa. Someof these studies further demonstrated that Lophophorata ispolyphyletic (Halanych et al. 1995; Mackey et al. 1996;Littlewood et al. 1998; Giribet et al. 2000; Halanych2004; Passamaneck and Halanych 2006; Helmkampfet al. forthcoming). On the basis of our data, the hypothesesthat ectoprocts are related to Deuterostomia, that they aresister to all remaining Spiralia (Halanych et al. 1995;Littlewood et al. 1998; Halanych 2004; Passamaneckand Halanych 2006), and that they are sister to all other pro-tostomes except chaetognaths (Giribet et al. 2000) could berejected by topology tests (table 2, hypotheses 1–3).
Entoprocts exhibit spiral cleavage and trochophora-type larvae, leading to the assumption of closer connectionsto taxa also possessing these features (Ax 1995, 1999;Zrzavy et al. 1998; Giribet et al. 2000; Peterson andEernisse 2001). Molecular phylogenetic analyses of 18SrDNA generally confirmed the affiliation of entoprocts withtaxa having trochophora larvae, but their exact relationships
FIG. 1.—Spiralian phylogenomics unites ectoprocts with entoprocts, resurrecting Bryozoa sensu lato. Phylogenetic analyses were performed on thebasis of 11,428 amino acid positions derived from 79 concatenated ribosomal proteins. (A) ML tree. Approximate bootstrap support values (LR-ELW)are shown to the right of the nodes. (B) BI reconstruction. Bayesian posterior probabilities are shown to the right of the nodes.
Spiralian Phylogenomics Supports Bryozoa sensu lato 2725
remained controversial (Mackey et al. 1996; Littlewoodet al. 1998; Zrzavy et al. 1998; Giribet et al. 2000; Petersonand Eernisse 2001). Combined analyses of 18S and 28S rDNAdata resulted in a placement within Platyzoa, but also withoutsignificant support (Passamaneck and Halanych 2006).
With our data, most alternative hypotheses concerningthe phylogenetic position of Entoprocta, in particular a sistergroup relationship between Entoprocta and Mollusca(Bartolomaeus 1993; Haszprunar 1996, 2000; Ax 1999),a neotenic origin of entoprocts from annelids (Emschermann1982), and their placement within Platyzoa (Halanych2004; Passamaneck and Halanych 2006) could be ruledout according to the expected likelihood weights test (table2, hypotheses 4–6). However, a sister group relationshipbetween Entoprocta and Neotrochozoa, which comprisesMollusca, Sipuncula, and Annelida (Zrzavy et al. 1998;Giribet et al. 2000; Peterson and Eernisse 2001), couldnot be significantly rejected (table 2, hypothesis 7). None-theless, our analyses strongly support the monophyly ofBryozoa in the broader sense including Ectoprocta and En-toprocta and thus confirm the morphology-based argumen-tation of Nielsen (1971, 1985, 2001) and Cavalier-Smith(1998). Morphological data (Funch and Kristensen 1995;Zrzavy et al. 1998; Sørensen et al. 2000) and rDNA se-quences (Passamaneck and Halanych 2006) indicate thatEntoprocta and Cycliophora are sister groups. Althoughgenomic data for Cycliophora are unfortunately still miss-ing, we suggest to also include Cycliophora in Bryozoa sen-su lato as has been done by Cavalier-Smith (1998).
Sipuncula as an Annelid Taxon
Both ML (fig. 1A) and BI analyses (fig. 1B) recoveredNeotrochozoa, which comprises Mollusca, Sipuncula, and
Annelida, thus confirming studies using morphologicaland molecular data (Zrzavy et al. 1998; Giribet et al.2000; Peterson and Eernisse 2001). Based on segmentation,Annelida has traditionally been regarded as sister to Arthro-poda (Hennig 1979; Schram 1991; Sørensen et al. 2000;Nielsen 2001; Brusca and Brusca 2002), but this so-calledArticulata hypothesis is significantly rejected by topologytesting (table 2, hypothesis 8).
In accordance with mitochondrial amino acid sequencesand gene order data (Boore and Staton 2002; Staton 2003;Jennings and Halanych 2005; Bleidorn et al. 2006), our anal-yses indicate with strong support that Sipuncula is moreclosely related to Annelida than to Mollusca (fig. 1). Moreprecisely, these unsegmented worms appear as a subtaxonof Annelida, which has also been suggested in some previousanalyses (Peterson and Eernisse 2001; Bleidorn et al. 2006;Struck et al. 2007). However, the monophyly of Annelidaexcluding Sipuncula (Schram 1991; Zrzavy et al. 1998;Ax 1999; Giribet et al. 2000; Sørensen et al. 2000; Nielsen2001; Brusca and Brusca 2002; Passamaneck and Halanych2006) could not be ruled out by topology testing (table 2, hy-pothesis 9). On the other hand, the alternative hypotheses thatSipuncula forms a monophyletic group with Mollusca(Scheltema 1993; Zrzavy et al. 1998) and that Sipuncula issister to Annelida plus Mollusca (Giribet et al. 2000) wererejected (table 2, hypotheses 10 and 11).
Spiralia—Syndermata, Platyhelminthes, andLophotrochozoa
Our analyses strongly support the clade Syndermata,formed by Rotifera and Acanthocephala (fig. 1). This taxonhas been established on the basis of morphological evi-dence (Ahlrichs 1995a, 1995b, 1997) and has been further
Table 2Topology Test Results
Number Phylogenetic Hypothesis References ELW Test
ML tree (fig. 1A) 0.3452*1 Lophophorata þ Deuterostomia Hennig (1979); Schram (1991); Ax (1995); Sørensen et al. (2000);
Brusca and Brusca (2002)0.0000
2 Ectoprocta sister to other Spiralia Halanych et al. (1995); Halanych (2004); Passamaneck andHalanych (2006)
0.0007
3 Ectoprocta sister to other Spiralia þ Ecdysozoa Giribet et al. (2000) 0.00064 Lacunifera (5Entoprocta þ Mollusca) Bartolomaeus (1993); Haszprunar (1996); Ax (1999);
Haszprunar (2000)0.0037
5 Entoprocta þ Annelida (þSipuncula) Emschermann (1982) 0.00946 Entoprocta þ Platyzoa Halanych (2004); Passamaneck and Halanych (2006) 0.02627 Entoprocta þ Neotrochozoa Zrzavy et al. (1998); Giribet et al. (2000); Peterson and Eernisse (2001) 0.0804*8 Articulata (5Annelida þ Arthropoda) Hennig (1979); Schram (1991); Ax (1999); Sørensen et al. (2000);
Nielsen (2001); Brusca and Brusca (2002)0.0000
9 Annelida monophyly (exclusive Sipuncula) Schram (1991); Zrzavy et al. (1998); Ax (1999); Giribet et al. (2000);Sørensen et al. (2000); Nielsen (2001); Brusca and Brusca (2002);Passamaneck and Halanych (2006)
0.1000*
10 Sipuncula þ Mollusca Scheltema (1993); Zrzavy et al. (1998) 0.000011 Sipuncula sister to (Annelida þ Mollusca) Giribet et al. (2000) 0.000012 Eubilateria Hennig (1979); Ax (1985) 0.000013 Chaetognatha þ Deuterostomia Ghirardelli (1981); Sørensen et al. (2000); Brusca and Brusca (2002) 0.0271*14 Chaetognatha sister to Spiralia Matus et al. (2006) 0.2221*15 Chaetognatha þ Ecdysozoa Littlewood et al. (1998); Zrzavy et al. (1998); Peterson and
Eernisse (2001)0.1847*
NOTE.—Numbers refer to the order of appearance in the text. Values for the topologies included in the 0.95 confidence set are indicated by an asterisk (i.e., ELW of the
trees with the highest confidence levels that added up to 0.95).
2726 Hausdorf et al.
supported by analyses of 18S rDNA sequences (Garey et al.1996; Garey and Schmidt-Rhaesa 1998; Littlewood et al.1998; Zrzavy et al. 1998; Giribet et al. 2000; Herlynet al. 2003).
The position of Platyhelminthes differs in our analysesas either being sister to Syndermata (fig. 1A) or to Neotro-chozoa (fig. 1B). The former confirms the Platyzoa hypoth-esis. Platyzoa comprise Platyhelminthes, Syndermata,Gastrotricha, and Gnathostomulida (Garey and Schmidt-Rhaesa 1998; Cavalier-Smith 1998; Giribet et al. 2000)and has first been hypothesized by Ahlrichs (1995a) basedon sperm morphology. Platyzoa was either corroborated(Giribet et al. 2000; Passamaneck and Halanych 2006)or contradicted (Zrzavy et al. 1998; Peterson and Eernisse2001) by rDNA and total evidence analyses. The lack ofa robust resolution of the phylogenetic relationships ofPlatyhelminthes within Spiralia despite the large availabledata set is probably due to increased substitution rates inPlatyhelminthesandSyndermatacausinglong-branchattrac-tion artifacts. However, the Eubilateria hypothesis (Hennig1979; Ax 1985) can clearly be rejected by topology testing(table 2, hypothesis 12). According to this hypothesis, Pla-tyhelminthes, which do not have an anus, are considered tobe the sister group of all other Bilateria possessing a 1-waygut and an anus.
Lophotrochozoa is defined as including the last com-mon ancestor of lophophorates, molluscs, and annelids, andits descendants (Halanych et al. 1995). Because Bryozoa ismore closely related to Neotrochozoa than to Syndermata inour analyses (fig. 1), syndermatans (and according to theML analysis also platyhelminths) are not lophotrochozo-ans, even though to further substantiate this conclusion ge-nomic data of Phoronida and Brachiopoda are necessary.
For the clade including Lophotrochozoa, Platyhel-minthes, and Syndermata, some authors have used the nameSpiralia (Garey and Schmidt-Rhaesa 1998; Giribet et al.2000; Helmkampf et al. forthcoming). We follow this usagebecause spiral quartet cleavage might be an autapomorphyof that taxon (see below).
Chaetognatha Remain Enigmatic
Chaetognatha, or arrow worms, represents the sistergroup of Spiralia and Ecdysozoa in our analyses (fig. 1).This confirms previous findings based on analyses of18S rDNA (Giribet et al. 2000), mitochondrial DNA(Helfenbein et al. 2004), and an EST data set (Marletazet al. 2006). However, alternative hypotheses, namely acommon ancestry with Deuterostomia (Ghirardelli 1981;Brusca and Brusca 2002) or Ecdysozoa (Littlewood et al.1998; Zrzavy et al. 1998; Peterson and Eernisse 2001) ora sister group relationship to Spiralia (Matus et al. 2006),could not be excluded (table 2, hypotheses 13–15). The phy-logenetic position of chaetognaths thus remains elusive.
Implications for Character Evolution
Cleavage pattern was often considered a key characterfor the reconstruction of metazoan phylogeny. Typical spi-ral quartet cleavage with mesoderm formation by the 4dmesoteloblast or one of its daughter cells (Sørensen et al.
2000; Nielsen 2001) is known from several lophotrochozo-an groups (Mollusca, Annelida, Nemertea, and Entoprocta),Platyhelminthes, and Gnathostomulida. If we map thischaracter state on our tree (fig. 1) considering the close re-lationship of Syndermata to Gnathostomulida (Ahlrichs1995a, 1995b, 1997; Cavalier-Smith 1998; Garey andSchmidt-Rhaesa 1998; Giribet et al. 2000; Sørensenet al. 2000; Nielsen 2001), it turns out to be a possible au-tapomorphy of the clade including Syndermata, Plathyhel-minthes, and Lophotrochozoa, for which we accepted thename Spiralia, although it has been secondarily modifiedseveral times within this clade (e.g., in Syndermata, Neo-ophora, Ectoprocta, Brachiopoda, and Cephalopoda). Thesister group relation of ectoprocts and entoprocts demon-strates that the transition from spiral to radial cleavagecan happen within a clade without any transitional stagesbeing preserved. After all, the different cleavage types wereone of the main reasons that the 2 taxa were classified indifferent major groups for more than a century.
Often coelomic cavities were considered an autapo-morphy of a clade Coelomata (Hennig 1979; Blair et al.2002; Philip et al. 2005). If the coelomic cavities of lopho-trochozoans are considered homologous to those of deuter-ostomes and to the small coelomic cavities present in someecdysozoans, our trees would indicate a frequent reductionof coelomic cavities in several bilaterian lineages (e.g., inchaetognaths, priapulids, nematodes, platyzoans, and ento-procts). However, the differing developmental origin ofcoelomic cavities in the different bilaterian lineages castdoubts on the homology of the coelom across bilaterians(Nielsen 2001).
The significant rejection of the Eubilateria hypothesisand the derived position of platyhelminths within Spiraliaindicates that the anus has been secondarily reduced inplatyhelminths, in which the mouth is the only opening tothe intestinal system.
Finally, the significant rejection of Articulata as wellas the derived position of Annelida within Spiralia supportsthe hypothesis that segmentation originated convergently inannelids and arthropods. The placement of unsegmentedworms within Annelida, namely Sipuncula (this study;Peterson and Eernisse 2001; Bleidorn et al. 2006; Strucket al. 2007) and Echiura (McHugh 1997; Bleidorn et al.2003; Struck et al. 2007), further reveals that segmentationhas been secondarily lost in annelid subtaxa. Sipunculanspossess a U-shaped gut, a feature already established inCambrian fossils (Huang et al. 2004). The movement ofthe anus in the anterior direction requires the disorganizationof segmentation, a factor that may have eased inhabitingholes in solid substrates.
The results presented herein, therefore, indicate thatseveral of the supposed key characters of animal phylogenysuch as cleavage pattern, coelomic cavities, body segmen-tation, and gut architecture are much more variable duringevolution than previously thought.
Acknowledgments
We would like to thank P. Emschermann (UniversityFreiburg) for providing us with samples of the ento-procts Barentsia elongata and B. benedeni and C. Nielsen
Spiralian Phylogenomics Supports Bryozoa sensu lato 2727
(University Copenhagen) and an unknown referee for help-ful comments on the manuscript. We are also grateful to M.Kube and R. Reinhardt (Max Planck Institute for MolecularGenetics, Berlin) for the construction and sequencing ofcDNA libraries and to I. Ebersberger, S. Strauss, and A.von Haeseler (Max F. Perutz Laboratories, Center for Inte-grative Bioinformatics, Vienna) for the processing of ourESTs. This study was funded by the priority program‘‘Deep Metazoan Phylogeny’’ of the Deutsche Forschungs-gemeinschaft (grants HA 2103/4-1 to T.H.; HA 2763/5-11to B.H. and I.B.; LI 338/3-1 to B.L.; and STR 683/3-1 toT.H.S.).
Literature Cited
Abascal F, Zardoya R, Posada D. 2005. ProtTest: selection of best-fit models of protein evolution. Bioinformatics. 21:2104–2105.
Aguinaldo AMA, Turbeville JM, Linford LS, Rivera MC,Garey JR, Raff RA, Lake JA. 1997. Evidence for a clade ofnematodes, arthropods and other moulting animals. Nature.387:489–493.
Ahlrichs WH. 1995a. Seison annulatus und Seison nebaliae—Ultrastruktur und Phylogenie. Verh dtsch zool Ges. 88.1:155.
Ahlrichs WH. 1995b. Zur Ultrastruktur und Phylogenie vonSeison nebaliae Grube, 1859 und Seison annulatus Claus,1876—Hypothesen zu phylogenetischen Verwandtschaftsver-haltnissen innerhalb der Bilateria. Gottingen: Cuvillier.
Ahlrichs WH. 1997. Epidermal ultrastructure of Seison nebaliaeand Seison annulatus, and a comparison of epidermalstructures within the Gnathifera. Zoomorphology. 117:41–48.
Ax P. 1985. The position of the Gnathostomulida and Platyhel-minthes in the phylogenetic system of the Bilateria. In: ConwayMorris S, George JD, Gibson R, Platt HM, editors. The originsand relationships of lower invertebrates. Oxford: ClarendonPress. p. 168–180.
Ax P. 1995. Das System der Metazoa I. Stuttgart (Germany): G.Fischer.
Ax P. 1999. Das System der Metazoa II. Stuttgart (Germany): G.Fischer.
Bartolomaeus T. 1993. Die Leibeshohlenverhaltnisse undVerwandtschaftsbeziehungen der Spiralia. Verh dtsch zoolGes. 86.1:42.
Baurain D, Brinkmann H, Philippe H. 2007. Lack of resolution inthe animal phylogeny: closely spaced cladogeneses orundetected systematic errors? Mol Biol Evol. 24:6–9.
Birney E, Clamp M, Durbin R. 2004. GeneWise and Genome-wise. Genome Res. 14:988–995.
Blair JE, Ikeo K, Gojobori T, Hedges SB. 2002. The evolutionaryposition of nematodes. BMC Evol Biol. 2:7.
Blanquart S, Lartillot N. 2006. A Bayesian compound stochasticprocess for modeling nonstationary and nonhomogeneoussequence evolution. Mol Biol Evol. 23:2058–2071.
Bleidorn C, Podsiadlowski L, Bartolomaeus T. 2006. Thecomplete mitochondrial genome of the orbiniid polychaeteOrbinia latreillii (Annelida, Orbiniidae)—A novel gene orderfor Annelida and implications for annelid phylogeny. Gene.370:96–103.
Bleidorn C, Vogt L, Bartolomaeus T. 2003. A contribution tosedentary polychaete phylogeny using 18S rRNA sequencedata. J Zool Syst Evol Res. 41:186–195.
Boore JL, Staton JL. 2002. The mitochondrial genome of thesipunculid Phascolopsis gouldii supports its association withAnnelida rather than Mollusca. Mol Biol Evol. 19:127–137.
Brusca RC, Brusca GJ. 2002. Invertebrates, 2nd ed. Sunderland(MA): Sinauer Associates.
Castresana J. 2000. Selection of conserved blocks from multiplealignments for their use in phylogenetic analysis. Mol BiolEvol. 17:540–552.
Cavalier-Smith T. 1998. A revised six-kingdom system of life.Biol Rev. 73:203–266.
Emschermann P. 1982. Les Kamptozoaires. Etat actuel de nosconnaissances sur leur anatomie, leur developpement, leurbiologie et leur position phylogenetique. Bull Soc zool Fr.107:317–344 pl. 1–3.
Ewing B, Hillier L, Wendl MC, Green P. 1998. Base-calling ofautomated sequencer traces using Phred. I. Accuracyassessment. Genome Res. 8:175–185.
Funch P, Kristensen RM. 1995. Cycliophora is a new phylum withaffinities to Entoprocta and Ectoprocta. Nature. 378:711–714.
Garey JR, Near TJ, Nonnemacher MR, Nadler SA. 1996. Molecularevidence for Acanthocephala as a subtaxon of Rotifera. J MolEvol. 43:287–292.
Garey JR, Schmidt-Rhaesa A. 1998. The essential role of‘‘minor’’ phyla in molecular studies of animal evolution. AmZool. 38:907–917.
Ghirardelli E. 1981. I Chaetognati: posizione sistematica, affinitaed evoluzione del phylum. In: Origine dei grande phylaNazionale dei metazoi. Rome: Accademia Nazionale dei Lincei.p. 191–233.
Giribet G, Distel DL, Polz M, Sterrer W, Wheeler WC. 2000.Triploblastic relationships with emphasis on the acoelomatesand the position of Gnathostomulida, Cycliophora, Plathel-minthes, and Chaetognatha: a combined approach of 18SrDNA sequences and morphology. Syst Biol. 49:539–562.
Halanych KM. 2004. The new view of animal phylogeny. AnnuRev Ecol Evol Syst. 35:229–256.
Halanych KM, Bacheller JD, Aguinaldo AA, Liva SM,Hillis DM, Lake JA. 1995. Evidence from 18S ribosomalDNA that the Lophophorates are protostome animals. Science.267:1641–1642.
Haszprunar G. 1996. The Mollusca: coelomate turbellarians ormesenchymate annelids? In: Taylor JD, editor. Origin andevolutionary radiation of the Mollusca. Oxford: Oxford UniversityPress. p. 3–28.
Haszprunar G. 2000. Is the Aplacophora monophyletic? Acladistic point of view. Am Malacol Bull. 15:115–130.
Hatschek B. 1891. Lehrbuch der Zoologie, 3. Lieferung. Jena(Germany): G. Fischer.
Helfenbein KG, Boore JL. 2004. The mitochondrial genome ofPhoronis architecta—Comparisons demonstrate that phoro-nids are lophotrochozoan protostomes. Mol Biol Evol.21:153–157.
Helfenbein KG, Fourcade HM, Vanjani RG, Boore JL. 2004. Themitochondrial genome of Paraspadella gotoi is highlyreduced and reveals that chaetognaths are a sister group toprotostomes. Proc Natl Acad Sci USA. 101:10639–10643.
Helmkampf M, Bruchhaus I, Hausdorf B. Forthcoming. Multi-gene analysis of lophophorate and chaetognath phylogeneticrelationships. Mol Phylogenet Evol.
Hennig W. 1979. Wirbellose I (ausgenommen Gliedertiere).Taschenbuch der Speziellen Zoologie, 4th ed. Volume 2. Jena(Germany): G. Fischer.
Herlyn H, Piskurek O, Schmitz J, Ehlers U, Zischler H. 2003.The syndermatan phylogeny and the evolution of acantho-cephalan endoparasitism as inferred from 18S rDNAsequences. Mol Phylogenet Evol. 26:155–164.
Huang D-Y, Chen J-Y, Vannier J, Saiz Salinas JI. 2004. EarlyCambrian sipunculan worms from southwest China. Proc RSoc Lond B. 271:1671–1676.
Hughes J, Longhorn SJ, Papadopoulou A, Theodorides K, deRiva A, Mejia-Chang M, Foster PG, Vogler AP. 2006. Densetaxonomic EST sampling and its applications for molecular
2728 Hausdorf et al.
systematics of the Coleoptera (beetles). Mol Biol Evol.23:268–278.
Jennings RM, Halanych KM. 2005. Mitochondrial genomes ofClymenella torquata (Maldanidae) and Rifta pachyptila(Siboglinidae): evidence for conserved gene order in Anne-lida. Mol Biol Evol. 22:210–222.
Jobb G. 2007. TREEFINDER version of May 2007. Availablefrom Munich, distributed by the author at www.treefinder.de.
Jobb G, von Haeseler A, Strimmer K. 2004. TREEFINDER:a powerful graphical analysis environment for molecularphylogenetics. BMC Evol Biol. 4:18.
Korschelt E, Heider K. 1893. Lehrbuch der vergleichendenEntwicklungsgeschichte der wirbellosen Thiere. SpeciellerTheil, 3. Heft. Jena (Germany): G. Fischer.
Lartillot N, Philippe H. 2004. A Bayesian mixture model foracross-site heterogeneities in the amino-acid replacementprocess. Mol Biol Evol. 21:1095–1109.
Littlewood DTJ, Telford MJ, Clough KA, Rohde K. 1998.Gnathostomulida—An enigmatic metazoan phylum from bothmorphological and molecular perspective. Mol PhylogenetEvol. 9:72–79.
Mackey LY, Winnepenninckx B, De Wachter R, Backeljau T,Emschermann P, Garey JR. 1996. 18S rRNA suggests thatEntoprocta are protostomes, unrelated to Ectoprocta. J MolEvol. 42:552–559.
Mallatt J, Winchell CJ. 2002. Testing the new animal phylogeny:first use of combined large-subunit and small-subunit rRNAgene sequences to classify the protostomes. Mol Biol Evol.19:289–301.
Marletaz F, Martin E, Perez Y, et al. 2006. Chaetognathphylogenomics: a protostome with deuterostome-like de-velopment. Curr Biol. 16:R577–R578.
Matus DQ, Copley RR, Dunn CW, Hejnol A, Eccleston H,Halanych KM, Martindale MQ, Telford MJ. 2006. Broad taxonand gene sampling indicate that chaetognaths are protostomes.Curr Biol. 16:R575–R576.
McHugh D. 1997. Molecular evidence that echiurans andpogonophorans are derived annelids. Proc Natl Acad Sci USA.94:8006–8009.
Nielsen C. 1971. Entoproct life-cycles and the entoproct/ectoproct relationship. Ophelia. 9:209–341.
Nielsen C. 1985. Animal phylogeny in the light of the trochaeatheory. Biol J Linn Soc. 25:243–299.
Nielsen C. 2001. Animal evolution: interrelationships of theliving phyla, 2nd ed. Oxford: Oxford University Press.
Nitsche H. 1869. Beitrage zur Kenntnis der Bryozoen. I-II. ZWiss Zool. 20:1–36 1–3.
Passamaneck YJ, Halanych KM. 2004. Evidence from Hoxgenes that bryozoans are lophotrochozoans. Evol Dev. 6:275–281.
Passamaneck Y, Halanych KM. 2006. Lophotrochozoan phylog-eny assessed with LSU and SSU data: evidence oflophophorate polyphyly. Mol Phylogenet Evol. 40:20–28.
Peterson KJ, Eernisse DJ. 2001. Animal phylogeny and theancestry of bilaterians: inferences from morphology and 18SrDNA gene sequences. Evol Dev. 3:170–205.
Philip GK, Creevey CJ, McInerney JO. 2005. The Opisthokontaand the Ecdysozoa may not be clades: stronger support for the
grouping of plant and animal than for animal and fungi and
stronger support for the Coelomata than Ecdysozoa. Mol BiolEvol. 22:1175–1184.
Philippe H, Lartillot N, Brinkmann H. 2005. Multigene analyses
of bilaterian animals corroborate the monophyly of Ecdyso-zoa, Lophotrochozoa and Protostomia. Mol Biol Evol.
22:1246–1253.Philippe H, Snell EA, Bapteste E, Lopez P, Holland PWH,
Casane D. 2004. Phylogenomics of eukaryotes: impact ofmissing data on large alignments. Mol Biol Evol. 21:1740–1752.
Philippe H, Telford MJ. 2006. Large-scale sequencing and thenew animal phylogeny. TREE. 21:614–620.
Scheltema AH. 1993. Aplacophora as progenetic aculiferans and
the coelomate origin of mollusks as the sister taxon ofSipuncula. Biol Bull. 184:57–78.
Schram FR. 1991. Cladistic analysis of metazoan phyla and theplacement of fossil problematica. In: Simonetta AM, Conway-
Morris S, editors. The early evolution of Metazoa and thesignificance of problematic taxa. Cambridge: Cambridge
University Press. p. 35–46.Sørensen MV, Funch P, Willerslev E, Hansen AJ, Olesen J.
2000. On the phylogeny of the Metazoa in the light of
Cycliophora and Micrognathozoa. Zool Anz. 239:297–318.Staton JL. 2003. Phylogenetic analysis of the mitochondrial
cytochrome c oxidase subunit 1 gene from 13 sipunculan genera:intra- and interphylum relationships. Invert Biol. 122:252–264.
Stechmann A, Schlegel M. 1999. Analysis of the complete
mitochondrial DNA sequence of the brachiopod Terebratu-lina retusa places Brachiopoda within the protostomes. ProcR Soc Lond B. 266:2043–2052.
Strimmer K, Rambaut A. 2002. Inferring confidence sets of
possibly misspecified gene trees. Proc R Soc Lond B.269:137–142.
Struck TH, Schult N, Kusen T, Hickman E, Bleidorn C,McHugh D, Halanych KM. 2007. Annelid phylogeny and
the status of Sipuncula and Echiura. BMC Evol Biol. 7:57.Thompson JD, Higgins DG, Gibson TJ. 1994. ClustalW:
improving the sensitivity of progressive multiple sequence
alignment through sequence weighting, position-specific gappenalties and weight matrix choice. Nucleic Acids Res.
22:4673–4680.Veuthey AL, Bittar G. 1998. Phylogenetic relationships of fungi,
plantae, and animalia inferred from homologous comparisonof ribosomal proteins. J Mol Evol. 47:81–92.
Waeschenbach A, Telford MJ, Porter JS, Littlewood DTJ. 2006.
The complete mitochondrial genome of Flustrellidra hispidaand the phylogenetic position of Bryozoa among the Metazoa.
Mol Phylogenet Evol. 40:195–207.Zrzavy J, Mihulka S, Kepka P, Bezdek A, Tietz D. 1998.
Phylogeny of the Metazoa based on morphological and 18Sribosomal DNA evidence. Cladistics. 14:249–285.
Billie Swalla, Associate Editor
Accepted September 16, 2007
Spiralian Phylogenomics Supports Bryozoa sensu lato 2729
36
2.3. Phylogenomic analyses of lophophorates (brachiopods, phoronids and
bryozoans) confirm the Lophotrochozoa concept
Helmkampf M., Bruchhaus I., and Hausdorf B. 2008. Phylogenomic analyses of lophophorates
(brachiopods, phoronids and bryozoans) confirm the Lophotrochozoa concept. Proceedings of the Royal
Society B 275: 1927–1933.
Phylogenomic analyses of lophophorates(brachiopods, phoronids and bryozoans)confirm the Lophotrochozoa concept
Martin Helmkampf 1, Iris Bruchhaus2 and Bernhard Hausdorf 1,*1Zoological Museum, University of Hamburg, Martin-Luther-King-Platz 3, 20146 Hamburg, Germany
2Bernhard Nocht Institute for Tropical Medicine, Bernhard-Nocht-Strasse 74, 20359 Hamburg, Germany
Based on embryological and morphological evidence, Lophophorata was long considered to be the sister or
paraphyletic stem group of Deuterostomia. By contrast, molecular data have consistently indicated that the
three lophophorate lineages, Ectoprocta, Brachiopoda and Phoronida, are more closely related to
trochozoans (annelids, molluscs and related groups) than to deuterostomes. For this reason, the
lophophorate groups and Trochozoa were united to Lophotrochozoa. However, the relationships of
the lophophorate lineages within Lophotrochozoa are still largely unresolved. Maximum-likelihood and
Bayesian analyses were performed based on a dataset comprising 11 445 amino acid positions derived from
79 ribosomal proteins of 39 metazoan taxa including new sequences obtained from a brachiopod and a
phoronid. These analyses show that the three lophophorate lineages are affiliated with trochozoan rather
than deuterostome phyla. All hypotheses claiming that they are more closely related to Deuterostomia than
to Protostomia can be rejected by topology testing. Monophyly of lophophorates was not recovered but
that of Bryozoa including Ectoprocta and Entoprocta and monophyly of Brachiozoa including
Brachiopoda and Phoronida were strongly supported. Alternative hypotheses that are refuted include
(i) Brachiozoa as the sister group of Mollusca, (ii) ectoprocts as sister to all other Lophotrochozoa
including Platyzoa, and (iii) ectoprocts as sister or to all other protostomes except chaetognaths.
Keywords: Brachiopoda; Bryozoa; Lophophorata; Metazoa; Phoronida; phylogeny
1. INTRODUCTIONPhylogenetic analyses of molecular markers have sub-
stantially changed our view of animal evolution in the past
two decades (Halanych 2004). The new subdivision of
Protostomia into two main groups, Lophotrochozoa and
Ecdysozoa, originally based on 18S rDNA sequences
(Halanych et al. 1995; Aguinaldo et al. 1997), has been
corroborated by sequences of single nuclear protein-
encoding genes (e.g. Ruiz-Trillo et al. 2002; Anderson
et al. 2004), datasets combining multiple nuclear protein-
encoding sequences (Peterson et al. 2004; Helmkampf
et al. 2008) and phylogenomic approaches (Philippe et al.
2005; Philippe & Telford 2006; Baurain et al. 2007;
Hausdorf et al. 2007).
However, the relationships within Lophotrochozoa
could not be resolved robustly so far, neither with a large
dataset of combined small and large subunit rDNAs
(Passamaneck & Halanych 2006), nor with a dataset
including several nuclear protein-encoding sequences
(Helmkampf et al. 2008). Phylogenomic data were able
to resolve some disputed relationships within Lophotro-
chozoa (Hausdorf et al. 2007), but such data are still
missing for some phylogenetically important phyla such as
Brachiopoda and Phoronida.
The placement of the lophophorate taxa within
Lophotrochozoa as indicated by molecular phylogenetic
studies is particularly inconsistent with the morphological
evidence (Luter & Bartolomaeus 1997). As originally
defined based on morphology, Lophophorata consists of
Ectoprocta, Brachiopoda and Phoronida, taxa that share a
ciliated, tentacular feeding apparatus around the mouth
opening called lophophore. Based on embryological and
morphological characters, Lophophorata was traditionally
considered the sister or paraphyletic stem group of
Deuterostomia (Hennig 1979; Schram 1991; Ax 1995;
Luter & Bartolomaeus 1997; Sørensen et al. 2000; Brusca &
Brusca 2003). However, Nielsen (2001) argued that the
lophophore of Bryozoa is not homologous to that of
Brachiopoda plus Phoronida, and considered Lophophor-
ata diphyletic. He suggested that ectoprocts are more
closely related to entoprocts within Spiralia, whereas he
still considered BrachiopodaCPhoronida as the sister
group of Deuterostomia sensu stricto (his Neorenalia). By
contrast, the molecular phylogenetic studies have shown
Ectoprocta as well as Brachiopoda and Phoronida to be
more closely related to Trochozoa, i.e. Annelida, Mollusca
and related groups, than to Deuterostomia; these include
analyses that used rDNA (Halanych et al. 1995; Mackey
et al. 1996; Littlewood et al. 1998; Cohen 2000; Giribet
et al. 2000; Peterson & Eernisse 2001; Mallatt & Winchell
2002; Passamaneck & Halanych 2006), Hox genes
(de Rosa et al. 1999; Passamaneck & Halanych 2004),
mitochondrial protein genes (Stechmann & Schlegel
1999; Helfenbein & Boore 2004; Waeschenbach et al.
2006), single nuclear protein genes (e.g. Ruiz-Trillo et al.
2002; Anderson et al. 2004) and sets of multiple nuclear
Proc. R. Soc. B (2008) 275, 1927–1933
doi:10.1098/rspb.2008.0372
Published online 20 May 2008
Electronic supplementary material is available at http://dx.doi.org/10.1098/rspb.2008.0372 or via http://journals.royalsociety.org.
*Author for correspondence ([email protected]).
Received 17 March 2008Accepted 30 April 2008
1927 This journal is q 2008 The Royal Society
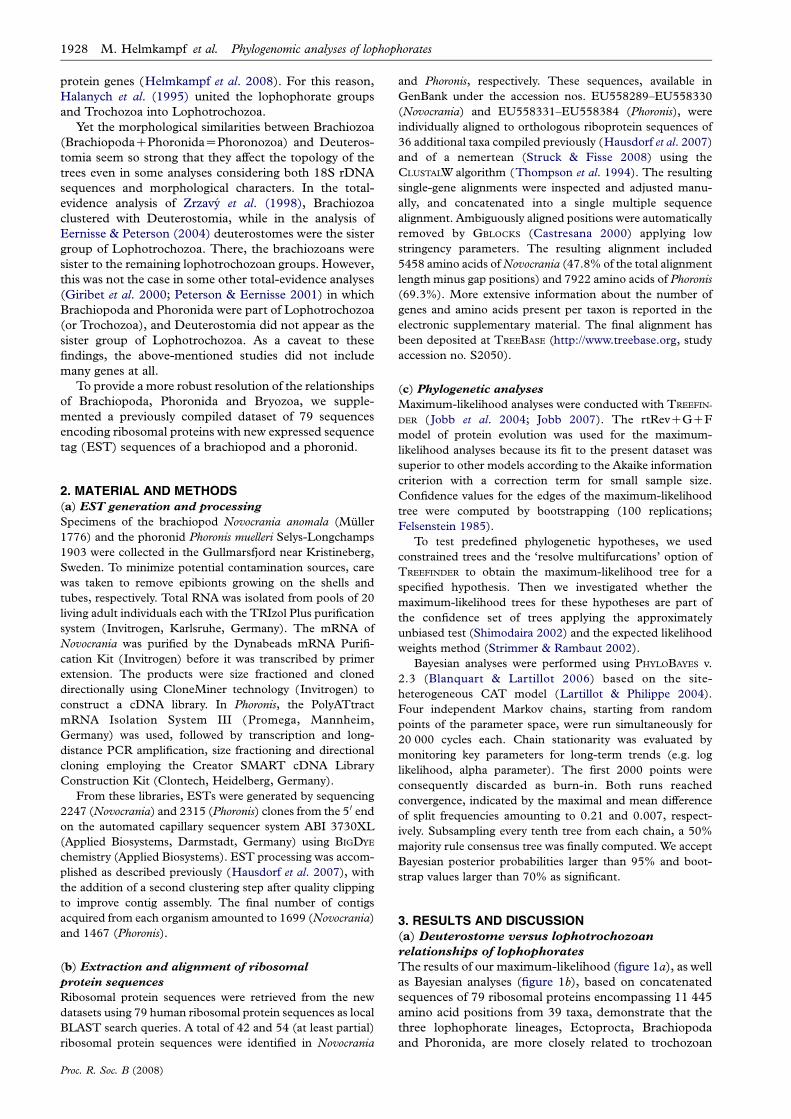
protein genes (Helmkampf et al. 2008). For this reason,
Halanych et al. (1995) united the lophophorate groups
and Trochozoa into Lophotrochozoa.
Yet the morphological similarities between Brachiozoa
(BrachiopodaCPhoronidaZPhoronozoa) and Deuteros-
tomia seem so strong that they affect the topology of the
trees even in some analyses considering both 18S rDNA
sequences and morphological characters. In the total-
evidence analysis of Zrzavy et al. (1998), Brachiozoa
clustered with Deuterostomia, while in the analysis of
Eernisse & Peterson (2004) deuterostomes were the sister
group of Lophotrochozoa. There, the brachiozoans were
sister to the remaining lophotrochozoan groups. However,
this was not the case in some other total-evidence analyses
(Giribet et al. 2000; Peterson & Eernisse 2001) in which
Brachiopoda and Phoronida were part of Lophotrochozoa
(or Trochozoa), and Deuterostomia did not appear as the
sister group of Lophotrochozoa. As a caveat to these
findings, the above-mentioned studies did not include
many genes at all.
To provide a more robust resolution of the relationships
of Brachiopoda, Phoronida and Bryozoa, we supple-
mented a previously compiled dataset of 79 sequences
encoding ribosomal proteins with new expressed sequence
tag (EST) sequences of a brachiopod and a phoronid.
2. MATERIAL AND METHODS(a) EST generation and processing
Specimens of the brachiopod Novocrania anomala (Muller
1776) and the phoronid Phoronis muelleri Selys-Longchamps
1903 were collected in the Gullmarsfjord near Kristineberg,
Sweden. To minimize potential contamination sources, care
was taken to remove epibionts growing on the shells and
tubes, respectively. Total RNA was isolated from pools of 20
living adult individuals each with the TRIzol Plus purification
system (Invitrogen, Karlsruhe, Germany). The mRNA of
Novocrania was purified by the Dynabeads mRNA Purifi-
cation Kit (Invitrogen) before it was transcribed by primer
extension. The products were size fractioned and cloned
directionally using CloneMiner technology (Invitrogen) to
construct a cDNA library. In Phoronis, the PolyATtract
mRNA Isolation System III (Promega, Mannheim,
Germany) was used, followed by transcription and long-
distance PCR amplification, size fractioning and directional
cloning employing the Creator SMART cDNA Library
Construction Kit (Clontech, Heidelberg, Germany).
From these libraries, ESTs were generated by sequencing
2247 (Novocrania) and 2315 (Phoronis) clones from the 5 0 end
on the automated capillary sequencer system ABI 3730XL
(Applied Biosystems, Darmstadt, Germany) using BIGDYE
chemistry (Applied Biosystems). EST processing was accom-
plished as described previously (Hausdorf et al. 2007), with
the addition of a second clustering step after quality clipping
to improve contig assembly. The final number of contigs
acquired from each organism amounted to 1699 (Novocrania)
and 1467 (Phoronis).
(b) Extraction and alignment of ribosomal
protein sequences
Ribosomal protein sequences were retrieved from the new
datasets using 79 human ribosomal protein sequences as local
BLAST search queries. A total of 42 and 54 (at least partial)
ribosomal protein sequences were identified in Novocrania
and Phoronis, respectively. These sequences, available in
GenBank under the accession nos. EU558289–EU558330
(Novocrania) and EU558331–EU558384 (Phoronis), were
individually aligned to orthologous riboprotein sequences of
36 additional taxa compiled previously (Hausdorf et al. 2007)
and of a nemertean (Struck & Fisse 2008) using the
CLUSTALW algorithm (Thompson et al. 1994). The resulting
single-gene alignments were inspected and adjusted manu-
ally, and concatenated into a single multiple sequence
alignment. Ambiguously aligned positions were automatically
removed by GBLOCKS (Castresana 2000) applying low
stringency parameters. The resulting alignment included
5458 amino acids of Novocrania (47.8% of the total alignment
length minus gap positions) and 7922 amino acids of Phoronis
(69.3%). More extensive information about the number of
genes and amino acids present per taxon is reported in the
electronic supplementary material. The final alignment has
been deposited at TREEBASE (http://www.treebase.org, study
accession no. S2050).
(c) Phylogenetic analyses
Maximum-likelihood analyses were conducted with TREEFIN-
DER ( Jobb et al. 2004; Jobb 2007). The rtRevCGCF
model of protein evolution was used for the maximum-
likelihood analyses because its fit to the present dataset was
superior to other models according to the Akaike information
criterion with a correction term for small sample size.
Confidence values for the edges of the maximum-likelihood
tree were computed by bootstrapping (100 replications;
Felsenstein 1985).
To test predefined phylogenetic hypotheses, we used
constrained trees and the ‘resolve multifurcations’ option of
TREEFINDER to obtain the maximum-likelihood tree for a
specified hypothesis. Then we investigated whether the
maximum-likelihood trees for these hypotheses are part of
the confidence set of trees applying the approximately
unbiased test (Shimodaira 2002) and the expected likelihood
weights method (Strimmer & Rambaut 2002).
Bayesian analyses were performed using PHYLOBAYES v.
2.3 (Blanquart & Lartillot 2006) based on the site-
heterogeneous CAT model (Lartillot & Philippe 2004).
Four independent Markov chains, starting from random
points of the parameter space, were run simultaneously for
20 000 cycles each. Chain stationarity was evaluated by
monitoring key parameters for long-term trends (e.g. log
likelihood, alpha parameter). The first 2000 points were
consequently discarded as burn-in. Both runs reached
convergence, indicated by the maximal and mean difference
of split frequencies amounting to 0.21 and 0.007, respect-
ively. Subsampling every tenth tree from each chain, a 50%
majority rule consensus tree was finally computed. We accept
Bayesian posterior probabilities larger than 95% and boot-
strap values larger than 70% as significant.
3. RESULTS AND DISCUSSION(a) Deuterostome versus lophotrochozoan
relationships of lophophorates
The results of our maximum-likelihood (figure 1a), as well
as Bayesian analyses (figure 1b), based on concatenated
sequences of 79 ribosomal proteins encompassing 11 445
amino acid positions from 39 taxa, demonstrate that the
three lophophorate lineages, Ectoprocta, Brachiopoda
and Phoronida, are more closely related to trochozoan
1928 M. Helmkampf et al. Phylogenomic analyses of lophophorates
Proc. R. Soc. B (2008)
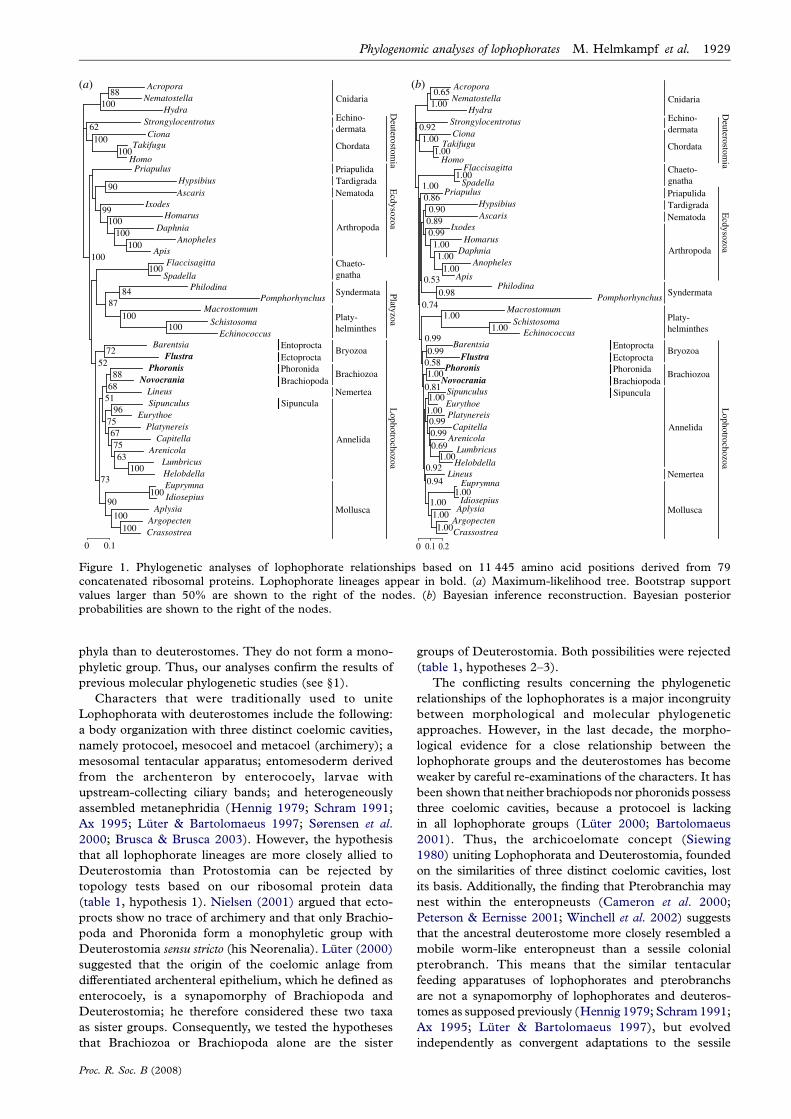
phyla than to deuterostomes. They do not form a mono-
phyletic group. Thus, our analyses confirm the results of
previous molecular phylogenetic studies (see §1).
Characters that were traditionally used to unite
Lophophorata with deuterostomes include the following:
a body organization with three distinct coelomic cavities,
namely protocoel, mesocoel and metacoel (archimery); a
mesosomal tentacular apparatus; entomesoderm derived
from the archenteron by enterocoely, larvae with
upstream-collecting ciliary bands; and heterogeneously
assembled metanephridia (Hennig 1979; Schram 1991;
Ax 1995; Luter & Bartolomaeus 1997; Sørensen et al.
2000; Brusca & Brusca 2003). However, the hypothesis
that all lophophorate lineages are more closely allied to
Deuterostomia than Protostomia can be rejected by
topology tests based on our ribosomal protein data
(table 1, hypothesis 1). Nielsen (2001) argued that ecto-
procts show no trace of archimery and that only Brachio-
poda and Phoronida form a monophyletic group with
Deuterostomia sensu stricto (his Neorenalia). Luter (2000)
suggested that the origin of the coelomic anlage from
differentiated archenteral epithelium, which he defined as
enterocoely, is a synapomorphy of Brachiopoda and
Deuterostomia; he therefore considered these two taxa
as sister groups. Consequently, we tested the hypotheses
that Brachiozoa or Brachiopoda alone are the sister
groups of Deuterostomia. Both possibilities were rejected
(table 1, hypotheses 2–3).
The conflicting results concerning the phylogenetic
relationships of the lophophorates is a major incongruity
between morphological and molecular phylogenetic
approaches. However, in the last decade, the morpho-
logical evidence for a close relationship between the
lophophorate groups and the deuterostomes has become
weaker by careful re-examinations of the characters. It has
been shown that neither brachiopods nor phoronids possess
three coelomic cavities, because a protocoel is lacking
in all lophophorate groups (Luter 2000; Bartolomaeus
2001). Thus, the archicoelomate concept (Siewing
1980) uniting Lophophorata and Deuterostomia, founded
on the similarities of three distinct coelomic cavities, lost
its basis. Additionally, the finding that Pterobranchia may
nest within the enteropneusts (Cameron et al. 2000;
Peterson & Eernisse 2001; Winchell et al. 2002) suggests
that the ancestral deuterostome more closely resembled a
mobile worm-like enteropneust than a sessile colonial
pterobranch. This means that the similar tentacular
feeding apparatuses of lophophorates and pterobranchs
are not a synapomorphy of lophophorates and deuteros-
tomes as supposed previously (Hennig 1979; Schram 1991;
Ax 1995; Luter & Bartolomaeus 1997), but evolved
independently as convergent adaptations to the sessile
AcroporaNematostella
88
Hydra100
StrongylocentrotusCiona
Takifugu
Homo100
10062
PriapulusHypsibiusAscaris
90
IxodesHomarus
DaphniaAnopheles
Apis100
100100
99
Flaccisagitta
Spadella100
PhilodinaPomphorhynchus
84
Macrostomum
SchistosomaEchinococcus
100100
87
BarentsiaFlustra
72
PhoronisNovocrania88
Lineus68
SipunculusEurythoe
96
PlatynereisCapitella
ArenicolaLumbricusHelobdella
10063
7567
75
51
EuprymnaIdiosepius100
AplysiaArgopectenCrassostrea100
100
90
73
52
100
0 0.1
Lophotrochozoa
Ecdysozoa
Deuterostom
ia
Cnidaria
Chaeto-gnatha
Bryozoa
Syndermata
Sipuncula
Annelida
Mollusca
Entoprocta
Platy-helminthes
Priapulida
Nematoda
Arthropoda
Chordata
Echino-dermata
Tardigrada
Ectoprocta
Platyzoa
PhoronidaBrachiopoda
Brachiozoa
Nemertea
AcroporaNematostella
0.65
Hydra1.00
StrongylocentrotusCiona
Takifugu
Homo1.00
1.000.92
Flaccisagitta
Spadella1.00
PriapulusHypsibiusAscaris
0.90
IxodesHomarus
DaphniaAnopheles
Apis1.00
1.001.00
0.990.89
PhilodinaPomphorhynchus0.98
0.53
0.86
MacrostomumSchistosoma
Echinococcus1.001.00
BarentsiaFlustra
0.99
PhoronisNovocrania
1.00
SipunculusEurythoe
1.00
PlatynereisCapitella
ArenicolaLumbricus
Helobdella1.00
0.690.990.99
1.00
LineusEuprymna
Idiosepius1.00
AplysiaArgopectenCrassostrea1.00
1.001.00
0.94
0.92
0.81
0.58
0.99
0.74
1.00
0 0.1 0.2
Lophotrochozoa
Ecdysozoa
Deuterostom
ia
Cnidaria
Chaeto-gnatha
Bryozoa
Syndermata
Sipuncula
Annelida
Mollusca
Entoprocta
Platy-helminthes
Priapulida
Nematoda
Arthropoda
Chordata
Echino-dermata
Tardigrada
EctoproctaPhoronidaBrachiopoda
Brachiozoa
Nemertea
(a) (b)
Figure 1. Phylogenetic analyses of lophophorate relationships based on 11 445 amino acid positions derived from 79concatenated ribosomal proteins. Lophophorate lineages appear in bold. (a) Maximum-likelihood tree. Bootstrap supportvalues larger than 50% are shown to the right of the nodes. (b) Bayesian inference reconstruction. Bayesian posteriorprobabilities are shown to the right of the nodes.
Phylogenomic analyses of lophophorates M. Helmkampf et al. 1929
Proc. R. Soc. B (2008)
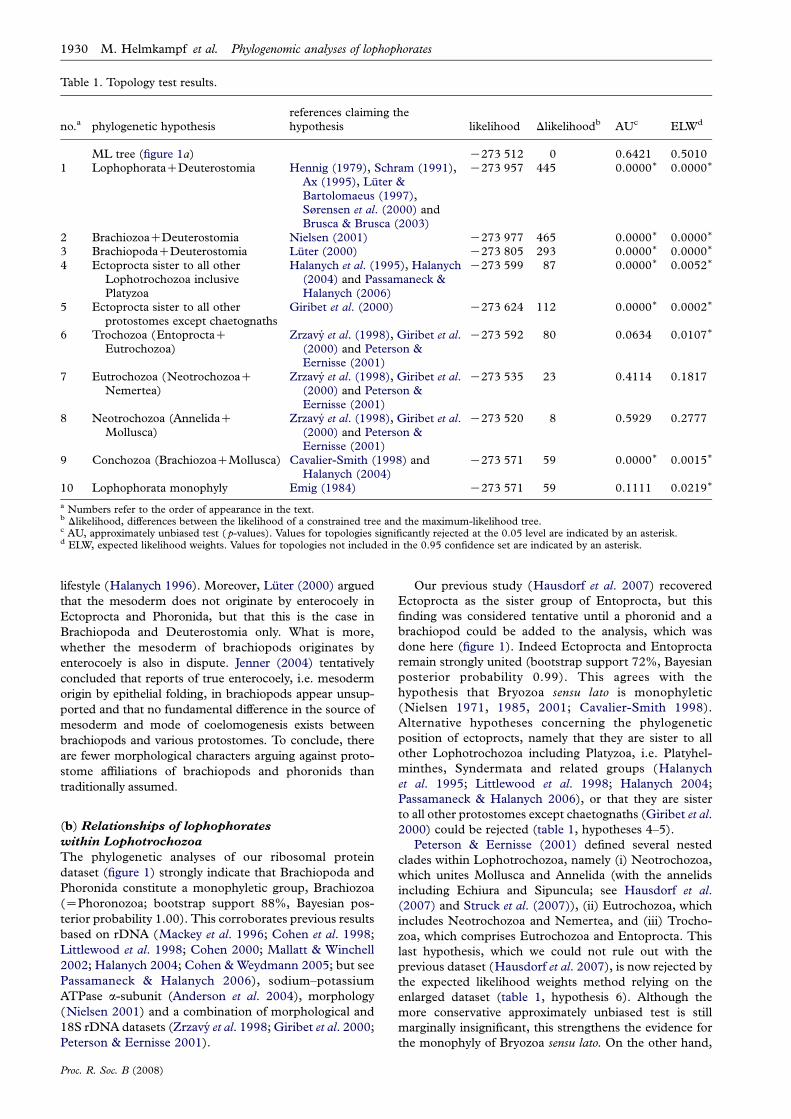
lifestyle (Halanych 1996). Moreover, Luter (2000) argued
that the mesoderm does not originate by enterocoely in
Ectoprocta and Phoronida, but that this is the case in
Brachiopoda and Deuterostomia only. What is more,
whether the mesoderm of brachiopods originates by
enterocoely is also in dispute. Jenner (2004) tentatively
concluded that reports of true enterocoely, i.e. mesoderm
origin by epithelial folding, in brachiopods appear unsup-
ported and that no fundamental difference in the source of
mesoderm and mode of coelomogenesis exists between
brachiopods and various protostomes. To conclude, there
are fewer morphological characters arguing against proto-
stome affiliations of brachiopods and phoronids than
traditionally assumed.
(b) Relationships of lophophorates
within Lophotrochozoa
The phylogenetic analyses of our ribosomal protein
dataset (figure 1) strongly indicate that Brachiopoda and
Phoronida constitute a monophyletic group, Brachiozoa
(ZPhoronozoa; bootstrap support 88%, Bayesian pos-
terior probability 1.00). This corroborates previous results
based on rDNA (Mackey et al. 1996; Cohen et al. 1998;
Littlewood et al. 1998; Cohen 2000; Mallatt & Winchell
2002; Halanych 2004; Cohen & Weydmann 2005; but see
Passamaneck & Halanych 2006), sodium–potassium
ATPase a-subunit (Anderson et al. 2004), morphology
(Nielsen 2001) and a combination of morphological and
18S rDNA datasets (Zrzavy et al. 1998; Giribet et al. 2000;
Peterson & Eernisse 2001).
Our previous study (Hausdorf et al. 2007) recovered
Ectoprocta as the sister group of Entoprocta, but this
finding was considered tentative until a phoronid and a
brachiopod could be added to the analysis, which was
done here (figure 1). Indeed Ectoprocta and Entoprocta
remain strongly united (bootstrap support 72%, Bayesian
posterior probability 0.99). This agrees with the
hypothesis that Bryozoa sensu lato is monophyletic
(Nielsen 1971, 1985, 2001; Cavalier-Smith 1998).
Alternative hypotheses concerning the phylogenetic
position of ectoprocts, namely that they are sister to all
other Lophotrochozoa including Platyzoa, i.e. Platyhel-
minthes, Syndermata and related groups (Halanych
et al. 1995; Littlewood et al. 1998; Halanych 2004;
Passamaneck & Halanych 2006), or that they are sister
to all other protostomes except chaetognaths (Giribet et al.
2000) could be rejected (table 1, hypotheses 4–5).
Peterson & Eernisse (2001) defined several nested
clades within Lophotrochozoa, namely (i) Neotrochozoa,
which unites Mollusca and Annelida (with the annelids
including Echiura and Sipuncula; see Hausdorf et al.
(2007) and Struck et al. (2007)), (ii) Eutrochozoa, which
includes Neotrochozoa and Nemertea, and (iii) Trocho-
zoa, which comprises Eutrochozoa and Entoprocta. This
last hypothesis, which we could not rule out with the
previous dataset (Hausdorf et al. 2007), is now rejected by
the expected likelihood weights method relying on the
enlarged dataset (table 1, hypothesis 6). Although the
more conservative approximately unbiased test is still
marginally insignificant, this strengthens the evidence for
the monophyly of Bryozoa sensu lato. On the other hand,
Table 1. Topology test results.
no.a phylogenetic hypothesisreferences claiming thehypothesis likelihood Dlikelihoodb AUc ELWd
ML tree (figure 1a) K273 512 0 0.6421 0.50101 LophophorataCDeuterostomia Hennig (1979), Schram (1991),
Ax (1995), Luter &Bartolomaeus (1997),Sørensen et al. (2000) andBrusca & Brusca (2003)
K273 957 445 0.0000� 0.0000�
2 BrachiozoaCDeuterostomia Nielsen (2001) K273 977 465 0.0000� 0.0000�
3 BrachiopodaCDeuterostomia Luter (2000) K273 805 293 0.0000� 0.0000�
4 Ectoprocta sister to all otherLophotrochozoa inclusivePlatyzoa
Halanych et al. (1995), Halanych(2004) and Passamaneck &Halanych (2006)
K273 599 87 0.0000� 0.0052�
5 Ectoprocta sister to all otherprotostomes except chaetognaths
Giribet et al. (2000) K273 624 112 0.0000� 0.0002�
6 Trochozoa (EntoproctaCEutrochozoa)
Zrzavy et al. (1998), Giribet et al.(2000) and Peterson &Eernisse (2001)
K273 592 80 0.0634 0.0107�
7 Eutrochozoa (NeotrochozoaCNemertea)
Zrzavy et al. (1998), Giribet et al.(2000) and Peterson &Eernisse (2001)
K273 535 23 0.4114 0.1817
8 Neotrochozoa (AnnelidaCMollusca)
Zrzavy et al. (1998), Giribet et al.(2000) and Peterson &Eernisse (2001)
K273 520 8 0.5929 0.2777
9 Conchozoa (BrachiozoaCMollusca) Cavalier-Smith (1998) andHalanych (2004)
K273 571 59 0.0000� 0.0015�
10 Lophophorata monophyly Emig (1984) K273 571 59 0.1111 0.0219�
a Numbers refer to the order of appearance in the text.b Dlikelihood, differences between the likelihood of a constrained tree and the maximum-likelihood tree.c AU, approximately unbiased test ( p-values). Values for topologies significantly rejected at the 0.05 level are indicated by an asterisk.d ELW, expected likelihood weights. Values for topologies not included in the 0.95 confidence set are indicated by an asterisk.
1930 M. Helmkampf et al. Phylogenomic analyses of lophophorates
Proc. R. Soc. B (2008)
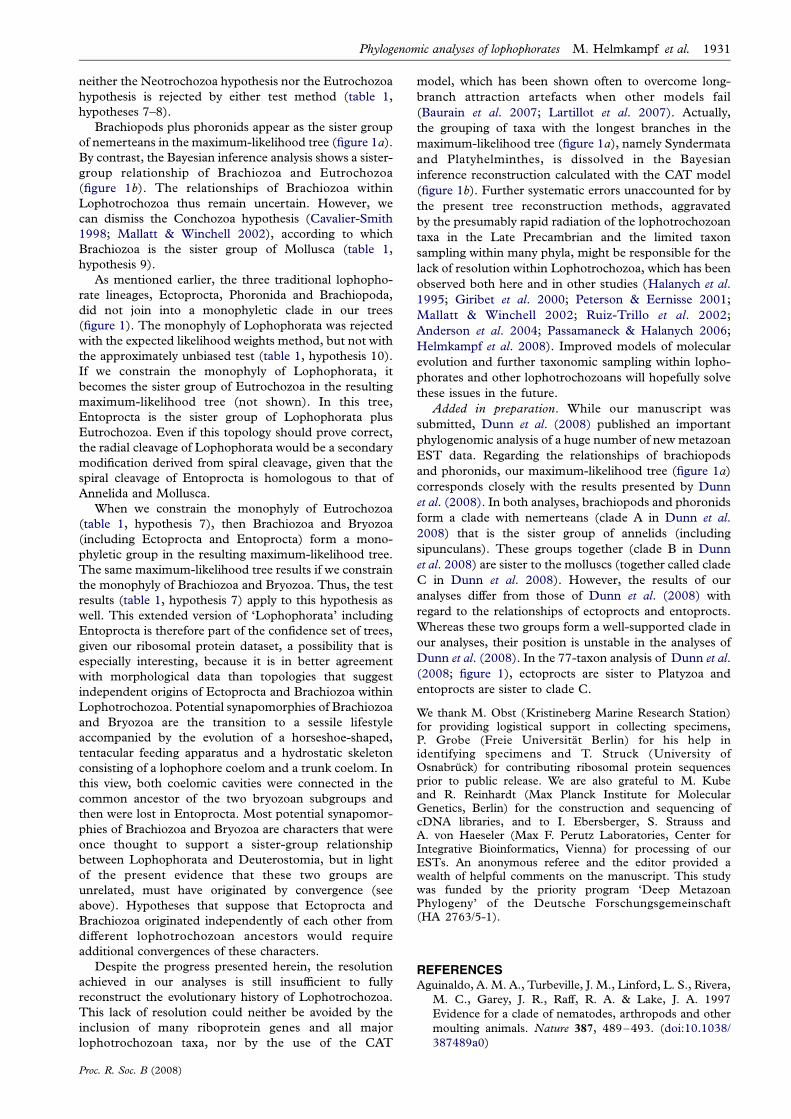
neither the Neotrochozoa hypothesis nor the Eutrochozoa
hypothesis is rejected by either test method (table 1,
hypotheses 7–8).
Brachiopods plus phoronids appear as the sister group
of nemerteans in the maximum-likelihood tree (figure 1a).
By contrast, the Bayesian inference analysis shows a sister-
group relationship of Brachiozoa and Eutrochozoa
(figure 1b). The relationships of Brachiozoa within
Lophotrochozoa thus remain uncertain. However, we
can dismiss the Conchozoa hypothesis (Cavalier-Smith
1998; Mallatt & Winchell 2002), according to which
Brachiozoa is the sister group of Mollusca (table 1,
hypothesis 9).
As mentioned earlier, the three traditional lophopho-
rate lineages, Ectoprocta, Phoronida and Brachiopoda,
did not join into a monophyletic clade in our trees
(figure 1). The monophyly of Lophophorata was rejected
with the expected likelihood weights method, but not with
the approximately unbiased test (table 1, hypothesis 10).
If we constrain the monophyly of Lophophorata, it
becomes the sister group of Eutrochozoa in the resulting
maximum-likelihood tree (not shown). In this tree,
Entoprocta is the sister group of Lophophorata plus
Eutrochozoa. Even if this topology should prove correct,
the radial cleavage of Lophophorata would be a secondary
modification derived from spiral cleavage, given that the
spiral cleavage of Entoprocta is homologous to that of
Annelida and Mollusca.
When we constrain the monophyly of Eutrochozoa
(table 1, hypothesis 7), then Brachiozoa and Bryozoa
(including Ectoprocta and Entoprocta) form a mono-
phyletic group in the resulting maximum-likelihood tree.
The same maximum-likelihood tree results if we constrain
the monophyly of Brachiozoa and Bryozoa. Thus, the test
results (table 1, hypothesis 7) apply to this hypothesis as
well. This extended version of ‘Lophophorata’ including
Entoprocta is therefore part of the confidence set of trees,
given our ribosomal protein dataset, a possibility that is
especially interesting, because it is in better agreement
with morphological data than topologies that suggest
independent origins of Ectoprocta and Brachiozoa within
Lophotrochozoa. Potential synapomorphies of Brachiozoa
and Bryozoa are the transition to a sessile lifestyle
accompanied by the evolution of a horseshoe-shaped,
tentacular feeding apparatus and a hydrostatic skeleton
consisting of a lophophore coelom and a trunk coelom. In
this view, both coelomic cavities were connected in the
common ancestor of the two bryozoan subgroups and
then were lost in Entoprocta. Most potential synapomor-
phies of Brachiozoa and Bryozoa are characters that were
once thought to support a sister-group relationship
between Lophophorata and Deuterostomia, but in light
of the present evidence that these two groups are
unrelated, must have originated by convergence (see
above). Hypotheses that suppose that Ectoprocta and
Brachiozoa originated independently of each other from
different lophotrochozoan ancestors would require
additional convergences of these characters.
Despite the progress presented herein, the resolution
achieved in our analyses is still insufficient to fully
reconstruct the evolutionary history of Lophotrochozoa.
This lack of resolution could neither be avoided by the
inclusion of many riboprotein genes and all major
lophotrochozoan taxa, nor by the use of the CAT
model, which has been shown often to overcome long-
branch attraction artefacts when other models fail
(Baurain et al. 2007; Lartillot et al. 2007). Actually,
the grouping of taxa with the longest branches in the
maximum-likelihood tree (figure 1a), namely Syndermata
and Platyhelminthes, is dissolved in the Bayesian
inference reconstruction calculated with the CAT model
(figure 1b). Further systematic errors unaccounted for by
the present tree reconstruction methods, aggravated
by the presumably rapid radiation of the lophotrochozoan
taxa in the Late Precambrian and the limited taxon
sampling within many phyla, might be responsible for the
lack of resolution within Lophotrochozoa, which has been
observed both here and in other studies (Halanych et al.
1995; Giribet et al. 2000; Peterson & Eernisse 2001;
Mallatt & Winchell 2002; Ruiz-Trillo et al. 2002;
Anderson et al. 2004; Passamaneck & Halanych 2006;
Helmkampf et al. 2008). Improved models of molecular
evolution and further taxonomic sampling within lopho-
phorates and other lophotrochozoans will hopefully solve
these issues in the future.
Added in preparation. While our manuscript was
submitted, Dunn et al. (2008) published an important
phylogenomic analysis of a huge number of new metazoan
EST data. Regarding the relationships of brachiopods
and phoronids, our maximum-likelihood tree (figure 1a)
corresponds closely with the results presented by Dunn
et al. (2008). In both analyses, brachiopods and phoronids
form a clade with nemerteans (clade A in Dunn et al.
2008) that is the sister group of annelids (including
sipunculans). These groups together (clade B in Dunn
et al. 2008) are sister to the molluscs (together called clade
C in Dunn et al. 2008). However, the results of our
analyses differ from those of Dunn et al. (2008) with
regard to the relationships of ectoprocts and entoprocts.
Whereas these two groups form a well-supported clade in
our analyses, their position is unstable in the analyses of
Dunn et al. (2008). In the 77-taxon analysis of Dunn et al.
(2008; figure 1), ectoprocts are sister to Platyzoa and
entoprocts are sister to clade C.
We thank M. Obst (Kristineberg Marine Research Station)for providing logistical support in collecting specimens,P. Grobe (Freie Universitat Berlin) for his help inidentifying specimens and T. Struck (University ofOsnabruck) for contributing ribosomal protein sequencesprior to public release. We are also grateful to M. Kubeand R. Reinhardt (Max Planck Institute for MolecularGenetics, Berlin) for the construction and sequencing ofcDNA libraries, and to I. Ebersberger, S. Strauss andA. von Haeseler (Max F. Perutz Laboratories, Center forIntegrative Bioinformatics, Vienna) for processing of ourESTs. An anonymous referee and the editor provided awealth of helpful comments on the manuscript. This studywas funded by the priority program ‘Deep MetazoanPhylogeny’ of the Deutsche Forschungsgemeinschaft(HA 2763/5-1).
REFERENCESAguinaldo, A. M. A., Turbeville, J. M., Linford, L. S., Rivera,
M. C., Garey, J. R., Raff, R. A. & Lake, J. A. 1997
Evidence for a clade of nematodes, arthropods and other
moulting animals. Nature 387, 489–493. (doi:10.1038/
387489a0)
Phylogenomic analyses of lophophorates M. Helmkampf et al. 1931
Proc. R. Soc. B (2008)
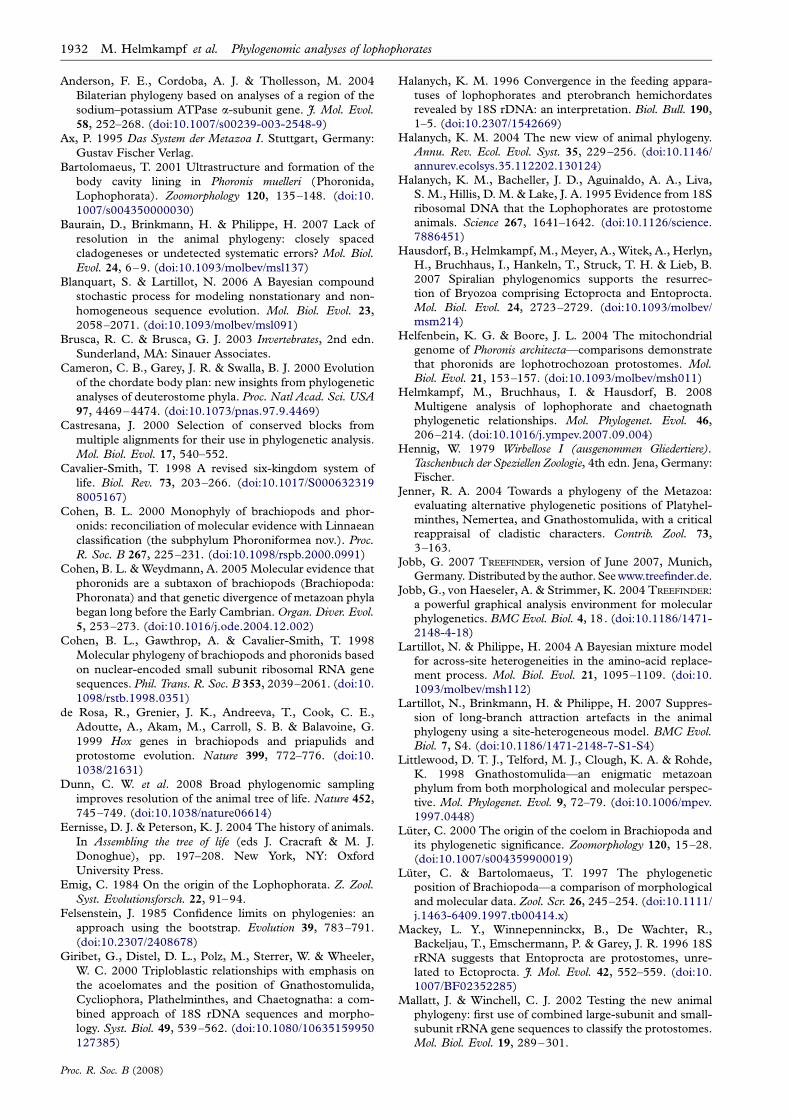
Anderson, F. E., Cordoba, A. J. & Thollesson, M. 2004
Bilaterian phylogeny based on analyses of a region of the
sodium–potassium ATPase a-subunit gene. J. Mol. Evol.
58, 252–268. (doi:10.1007/s00239-003-2548-9)
Ax, P. 1995 Das System der Metazoa I. Stuttgart, Germany:
Gustav Fischer Verlag.
Bartolomaeus, T. 2001 Ultrastructure and formation of the
body cavity lining in Phoronis muelleri (Phoronida,
Lophophorata). Zoomorphology 120, 135–148. (doi:10.
1007/s004350000030)
Baurain, D., Brinkmann, H. & Philippe, H. 2007 Lack of
resolution in the animal phylogeny: closely spaced
cladogeneses or undetected systematic errors? Mol. Biol.
Evol. 24, 6–9. (doi:10.1093/molbev/msl137)
Blanquart, S. & Lartillot, N. 2006 A Bayesian compound
stochastic process for modeling nonstationary and non-
homogeneous sequence evolution. Mol. Biol. Evol. 23,
2058–2071. (doi:10.1093/molbev/msl091)
Brusca, R. C. & Brusca, G. J. 2003 Invertebrates, 2nd edn.
Sunderland, MA: Sinauer Associates.
Cameron, C. B., Garey, J. R. & Swalla, B. J. 2000 Evolution
of the chordate body plan: new insights from phylogenetic
analyses of deuterostome phyla. Proc. Natl Acad. Sci. USA
97, 4469–4474. (doi:10.1073/pnas.97.9.4469)
Castresana, J. 2000 Selection of conserved blocks from
multiple alignments for their use in phylogenetic analysis.
Mol. Biol. Evol. 17, 540–552.
Cavalier-Smith, T. 1998 A revised six-kingdom system of
life. Biol. Rev. 73, 203–266. (doi:10.1017/S000632319
8005167)
Cohen, B. L. 2000 Monophyly of brachiopods and phor-
onids: reconciliation of molecular evidence with Linnaean
classification (the subphylum Phoroniformea nov.). Proc.
R. Soc. B 267, 225–231. (doi:10.1098/rspb.2000.0991)
Cohen, B. L. & Weydmann, A. 2005 Molecular evidence that
phoronids are a subtaxon of brachiopods (Brachiopoda:
Phoronata) and that genetic divergence of metazoan phyla
began long before the Early Cambrian. Organ. Diver. Evol.
5, 253–273. (doi:10.1016/j.ode.2004.12.002)
Cohen, B. L., Gawthrop, A. & Cavalier-Smith, T. 1998
Molecular phylogeny of brachiopods and phoronids based
on nuclear-encoded small subunit ribosomal RNA gene
sequences. Phil. Trans. R. Soc. B 353, 2039–2061. (doi:10.
1098/rstb.1998.0351)
de Rosa, R., Grenier, J. K., Andreeva, T., Cook, C. E.,
Adoutte, A., Akam, M., Carroll, S. B. & Balavoine, G.
1999 Hox genes in brachiopods and priapulids and
protostome evolution. Nature 399, 772–776. (doi:10.
1038/21631)
Dunn, C. W. et al. 2008 Broad phylogenomic sampling
improves resolution of the animal tree of life. Nature 452,
745–749. (doi:10.1038/nature06614)
Eernisse, D. J. & Peterson, K. J. 2004 The history of animals.
In Assembling the tree of life (eds J. Cracraft & M. J.
Donoghue), pp. 197–208. New York, NY: Oxford
University Press.
Emig, C. 1984 On the origin of the Lophophorata. Z. Zool.
Syst. Evolutionsforsch. 22, 91–94.
Felsenstein, J. 1985 Confidence limits on phylogenies: an
approach using the bootstrap. Evolution 39, 783–791.
(doi:10.2307/2408678)
Giribet, G., Distel, D. L., Polz, M., Sterrer, W. & Wheeler,
W. C. 2000 Triploblastic relationships with emphasis on
the acoelomates and the position of Gnathostomulida,
Cycliophora, Plathelminthes, and Chaetognatha: a com-
bined approach of 18S rDNA sequences and morpho-
logy. Syst. Biol. 49, 539–562. (doi:10.1080/10635159950
127385)
Halanych, K. M. 1996 Convergence in the feeding appara-
tuses of lophophorates and pterobranch hemichordates
revealed by 18S rDNA: an interpretation. Biol. Bull. 190,
1–5. (doi:10.2307/1542669)
Halanych, K. M. 2004 The new view of animal phylogeny.
Annu. Rev. Ecol. Evol. Syst. 35, 229–256. (doi:10.1146/
annurev.ecolsys.35.112202.130124)
Halanych, K. M., Bacheller, J. D., Aguinaldo, A. A., Liva,
S. M., Hillis, D. M. & Lake, J. A. 1995 Evidence from 18S
ribosomal DNA that the Lophophorates are protostome
animals. Science 267, 1641–1642. (doi:10.1126/science.
7886451)
Hausdorf, B., Helmkampf, M., Meyer, A., Witek, A., Herlyn,
H., Bruchhaus, I., Hankeln, T., Struck, T. H. & Lieb, B.
2007 Spiralian phylogenomics supports the resurrec-
tion of Bryozoa comprising Ectoprocta and Entoprocta.
Mol. Biol. Evol. 24, 2723–2729. (doi:10.1093/molbev/
msm214)
Helfenbein, K. G. & Boore, J. L. 2004 The mitochondrial
genome of Phoronis architecta—comparisons demonstrate
that phoronids are lophotrochozoan protostomes. Mol.
Biol. Evol. 21, 153–157. (doi:10.1093/molbev/msh011)
Helmkampf, M., Bruchhaus, I. & Hausdorf, B. 2008
Multigene analysis of lophophorate and chaetognath
phylogenetic relationships. Mol. Phylogenet. Evol. 46,
206–214. (doi:10.1016/j.ympev.2007.09.004)
Hennig, W. 1979 Wirbellose I (ausgenommen Gliedertiere).
Taschenbuch der Speziellen Zoologie, 4th edn. Jena, Germany:
Fischer.
Jenner, R. A. 2004 Towards a phylogeny of the Metazoa:
evaluating alternative phylogenetic positions of Platyhel-
minthes, Nemertea, and Gnathostomulida, with a critical
reappraisal of cladistic characters. Contrib. Zool. 73,
3–163.
Jobb, G. 2007 TREEFINDER, version of June 2007, Munich,
Germany. Distributed by the author. See www.treefinder.de.
Jobb, G., von Haeseler, A. & Strimmer, K. 2004 TREEFINDER:
a powerful graphical analysis environment for molecular
phylogenetics. BMC Evol. Biol. 4, 18. (doi:10.1186/1471-
2148-4-18)
Lartillot, N. & Philippe, H. 2004 A Bayesian mixture model
for across-site heterogeneities in the amino-acid replace-
ment process. Mol. Biol. Evol. 21, 1095–1109. (doi:10.
1093/molbev/msh112)
Lartillot, N., Brinkmann, H. & Philippe, H. 2007 Suppres-
sion of long-branch attraction artefacts in the animal
phylogeny using a site-heterogeneous model. BMC Evol.
Biol. 7, S4. (doi:10.1186/1471-2148-7-S1-S4)
Littlewood, D. T. J., Telford, M. J., Clough, K. A. & Rohde,
K. 1998 Gnathostomulida—an enigmatic metazoan
phylum from both morphological and molecular perspec-
tive. Mol. Phylogenet. Evol. 9, 72–79. (doi:10.1006/mpev.
1997.0448)
Luter, C. 2000 The origin of the coelom in Brachiopoda and
its phylogenetic significance. Zoomorphology 120, 15–28.
(doi:10.1007/s004359900019)
Luter, C. & Bartolomaeus, T. 1997 The phylogenetic
position of Brachiopoda—a comparison of morphological
and molecular data. Zool. Scr. 26, 245–254. (doi:10.1111/
j.1463-6409.1997.tb00414.x)
Mackey, L. Y., Winnepenninckx, B., De Wachter, R.,
Backeljau, T., Emschermann, P. & Garey, J. R. 1996 18S
rRNA suggests that Entoprocta are protostomes, unre-
lated to Ectoprocta. J. Mol. Evol. 42, 552–559. (doi:10.
1007/BF02352285)
Mallatt, J. & Winchell, C. J. 2002 Testing the new animal
phylogeny: first use of combined large-subunit and small-
subunit rRNA gene sequences to classify the protostomes.
Mol. Biol. Evol. 19, 289–301.
1932 M. Helmkampf et al. Phylogenomic analyses of lophophorates
Proc. R. Soc. B (2008)
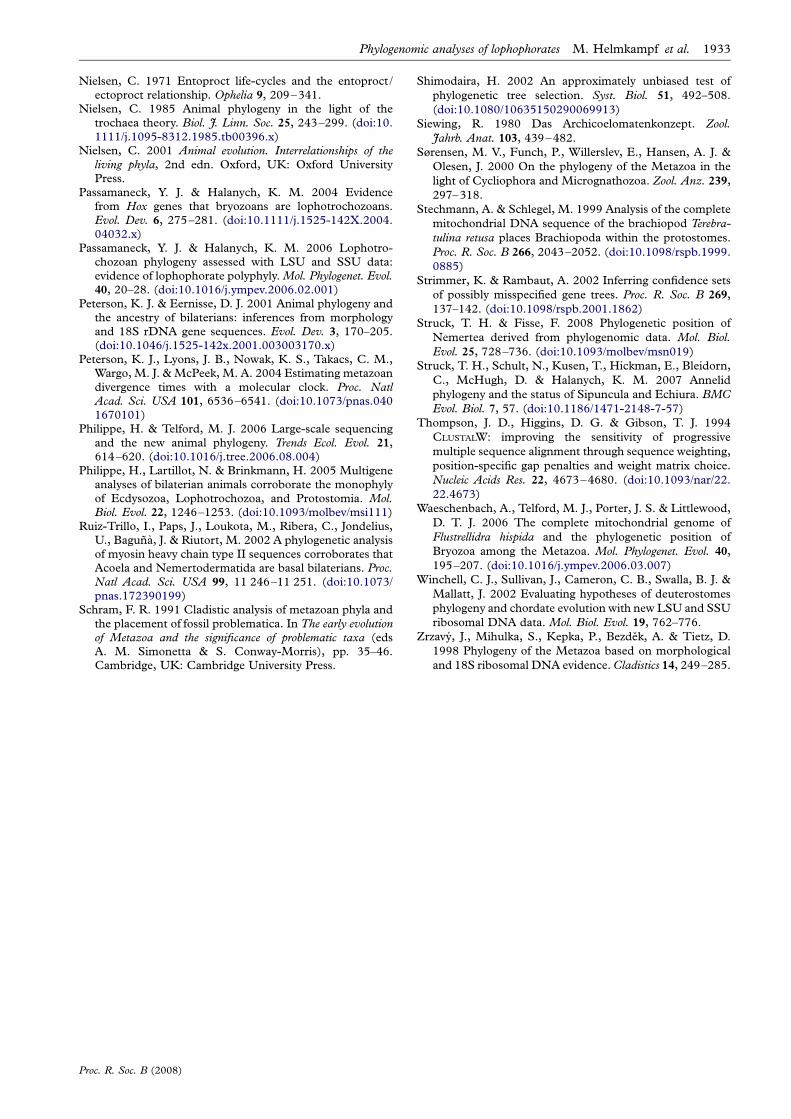
Nielsen, C. 1971 Entoproct life-cycles and the entoproct /ectoproct relationship. Ophelia 9, 209–341.
Nielsen, C. 1985 Animal phylogeny in the light of thetrochaea theory. Biol. J. Linn. Soc. 25, 243–299. (doi:10.1111/j.1095-8312.1985.tb00396.x)
Nielsen, C. 2001 Animal evolution. Interrelationships of theliving phyla, 2nd edn. Oxford, UK: Oxford UniversityPress.
Passamaneck, Y. J. & Halanych, K. M. 2004 Evidencefrom Hox genes that bryozoans are lophotrochozoans.Evol. Dev. 6, 275–281. (doi:10.1111/j.1525-142X.2004.04032.x)
Passamaneck, Y. J. & Halanych, K. M. 2006 Lophotro-chozoan phylogeny assessed with LSU and SSU data:evidence of lophophorate polyphyly. Mol. Phylogenet. Evol.40, 20–28. (doi:10.1016/j.ympev.2006.02.001)
Peterson, K. J. & Eernisse, D. J. 2001 Animal phylogeny andthe ancestry of bilaterians: inferences from morphologyand 18S rDNA gene sequences. Evol. Dev. 3, 170–205.(doi:10.1046/j.1525-142x.2001.003003170.x)
Peterson, K. J., Lyons, J. B., Nowak, K. S., Takacs, C. M.,Wargo, M. J. & McPeek, M. A. 2004 Estimating metazoandivergence times with a molecular clock. Proc. NatlAcad. Sci. USA 101, 6536–6541. (doi:10.1073/pnas.0401670101)
Philippe, H. & Telford, M. J. 2006 Large-scale sequencingand the new animal phylogeny. Trends Ecol. Evol. 21,614–620. (doi:10.1016/j.tree.2006.08.004)
Philippe, H., Lartillot, N. & Brinkmann, H. 2005 Multigeneanalyses of bilaterian animals corroborate the monophylyof Ecdysozoa, Lophotrochozoa, and Protostomia. Mol.Biol. Evol. 22, 1246–1253. (doi:10.1093/molbev/msi111)
Ruiz-Trillo, I., Paps, J., Loukota, M., Ribera, C., Jondelius,U., Baguna, J. & Riutort, M. 2002 A phylogenetic analysisof myosin heavy chain type II sequences corroborates thatAcoela and Nemertodermatida are basal bilaterians. Proc.Natl Acad. Sci. USA 99, 11 246–11 251. (doi:10.1073/pnas.172390199)
Schram, F. R. 1991 Cladistic analysis of metazoan phyla andthe placement of fossil problematica. In The early evolutionof Metazoa and the significance of problematic taxa (edsA. M. Simonetta & S. Conway-Morris), pp. 35–46.Cambridge, UK: Cambridge University Press.
Shimodaira, H. 2002 An approximately unbiased test of
phylogenetic tree selection. Syst. Biol. 51, 492–508.
(doi:10.1080/10635150290069913)
Siewing, R. 1980 Das Archicoelomatenkonzept. Zool.
Jahrb. Anat. 103, 439–482.
Sørensen, M. V., Funch, P., Willerslev, E., Hansen, A. J. &
Olesen, J. 2000 On the phylogeny of the Metazoa in the
light of Cycliophora and Micrognathozoa. Zool. Anz. 239,
297–318.
Stechmann, A. & Schlegel, M. 1999 Analysis of the complete
mitochondrial DNA sequence of the brachiopod Terebra-
tulina retusa places Brachiopoda within the protostomes.
Proc. R. Soc. B 266, 2043–2052. (doi:10.1098/rspb.1999.
0885)
Strimmer, K. & Rambaut, A. 2002 Inferring confidence sets
of possibly misspecified gene trees. Proc. R. Soc. B 269,
137–142. (doi:10.1098/rspb.2001.1862)
Struck, T. H. & Fisse, F. 2008 Phylogenetic position of
Nemertea derived from phylogenomic data. Mol. Biol.
Evol. 25, 728–736. (doi:10.1093/molbev/msn019)
Struck, T. H., Schult, N., Kusen, T., Hickman, E., Bleidorn,
C., McHugh, D. & Halanych, K. M. 2007 Annelid
phylogeny and the status of Sipuncula and Echiura. BMC
Evol. Biol. 7, 57. (doi:10.1186/1471-2148-7-57)
Thompson, J. D., Higgins, D. G. & Gibson, T. J. 1994
CLUSTALW: improving the sensitivity of progressive
multiple sequence alignment through sequence weighting,
position-specific gap penalties and weight matrix choice.
Nucleic Acids Res. 22, 4673–4680. (doi:10.1093/nar/22.
22.4673)
Waeschenbach, A., Telford, M. J., Porter, J. S. & Littlewood,
D. T. J. 2006 The complete mitochondrial genome of
Flustrellidra hispida and the phylogenetic position of
Bryozoa among the Metazoa. Mol. Phylogenet. Evol. 40,
195–207. (doi:10.1016/j.ympev.2006.03.007)
Winchell, C. J., Sullivan, J., Cameron, C. B., Swalla, B. J. &
Mallatt, J. 2002 Evaluating hypotheses of deuterostomes
phylogeny and chordate evolution with new LSU and SSU
ribosomal DNA data. Mol. Biol. Evol. 19, 762–776.
Zrzavy, J., Mihulka, S., Kepka, P., Bezdek, A. & Tietz, D.
1998 Phylogeny of the Metazoa based on morphological
and 18S ribosomal DNA evidence. Cladistics 14, 249–285.
Phylogenomic analyses of lophophorates M. Helmkampf et al. 1933
Proc. R. Soc. B (2008)

44
2.4. Reducing compositional heterogeneity improves phylogenomic inference of
lophotrochozan relationships
Hausdorf B., Helmkampf M., Nesnidal M., and Bruchhaus I. Reducing compositional heterogeneity
improves phylogenomic inference of lophotrochozan relationships. Submitted.
45
Reducing compositional heterogeneity improves phylogenomic inference of
lophotrochozoan relationships
Research Article
Bernhard Hausdorf,*† Martin Helmkampf,* Maximilian Nesnidal,* Iris Bruchhaus‡
*Zoological Museum, University of Hamburg, Hamburg, Germany; ‡Bernhard Nocht Institute for
Tropical Medicine, Hamburg, Germany
Corresponding author:
Dr. Bernhard Hausdorf, Zoological Museum, University of Hamburg, Martin-Luther-King-Platz 3, D-
20146 Hamburg, Germany, telephone +49-40-428382284, fax +49-40-428383937, e-mail
Key words: Metazoa, phylogenomics, compositional bias, Bryozoa, Ectoprocta, Brachiozoa.
Running head: Compositional bias and phylogenomic inference
46
The amino acid composition of proteins is not homogenous across Metazoa. We studied the influence of
compositional heterogeneity on phylogenomic analyses of metazoan relationships. Approaches to reduce
this heterogeneity like the exclusion of taxa with strongly differing amino acid composition, the use of
LogDet distances or the recoding of amino acids into groups with similar properties diminish artifacts
and result in higher confidence values. Given a fixed threshold of accepted significant pairwise differences
in the composition of the sequences used, fewer taxa have to be excluded from the recoded data set than
from the unmodified amino acid data set. Despite the loss of information that results from employing a
reduced amino acid alphabet, the support for Bryozoa and Brachiozoa is higher in the maximum
likelihood tree based on the analysis of the recoded data set than in the one resulting from the analysis of
the unmodified amino acid data set from which the taxa most strongly differing in amino acid
composition have been excluded or the neighbor-joining tree based on LogDet + Γ distances. Thus,
using reduced amino acid alphabets is a more efficient method for mitigating artifacts in phylogenetic
analyses that arise from compositional heterogeneity than the simple exclusion of taxa with a divergent
amino acid composition or the employment of distance methods using LogDet distances. Applying these
approaches to reduce compositional heterogeneity on a data set with eleven representatives of the
lophophorate lineages and entoprocts, we could confirm the monophyly of Bryozoa and Brachiozoa.
This data set includes two new EST data sets of major ectoproct groups not covered so far. Within
Bryozoa our analyses validate the monophyly of Ectoprocta and a sister group relationship of
Phylactolaemata and Gymnolaemata including Stenolaemata and Eurystomata.
47
Introduction
In the 1990’ the analyses of 18S rDNA sequences profoundly changed our understanding of
metazoan phylogeny. The polyphyly of taxa like Articulata, Aschelminthes, Radialia and Coelomata has
been recognized, and Lophotrochozoa and Ecdysozoa were newly delimited based on these data
(Halanych et al. 1995; Aguinaldo et al. 1997). Analyses of alignments containing large amounts of protein
sequences but only few taxa indicated that the new findings might have been artifacts (Blair et al. 2002;
Wolf et al. 2004; Philip et al. 2005). These concerns were rejected by investigating protein-coding genes
with a better taxon sampling (Ruiz-Trillo et al. 2002; Anderson et al. 2004; Peterson et al. 2004;
Helmkampf et al. 2008a). However, the relationships of the phyla within the larger clades could be
resolved robustly neither with rDNA, nor with single protein coding genes or small multigene data sets.
The advent of phylogenomics based on large EST data sets or genome projects resulted in
alignments that are a magnitude larger than previously available data sets, and promised the resolution of
the relationships of metazoan phyla (Philippe et al. 2005; Philippe and Telford 2006; Baurain et al. 2007).
Taxon sampling has been improved so that genomic scale data are now available from most metazoan
phyla (Hausdorf et al. 2007; Brinkmann and Philippe 2008; Dunn et al. 2008; Helmkampf et al. 2008b;
Struck and Fisse 2008; Witek et al. 2008). Despite these progresses, many internal nodes are still poorly
supported, and different analyses produce contradictory results. One such example concerns ectoprocts
and entoprocts that form a monophylum in some phylogenomic analyses (Hausdorf et al. 2007;
Helmkampf et al. 2008b; Struck and Fisse 2008; Witek et al. 2008), whereas ectoprocts are sister to
Platyzoa and entoprocts to the remaining lophotrochozoans in the tree of Dunn et al. (2008). One reason
for such incongruent results may be violations of the assumptions of the models used for tree
reconstruction that lead to systematic errors (Delsuc et al. 2005).
Most models of protein evolution assume that amino acids evolve according to a time-reversible
Markov model. Violations of this assumption can result in incorrect topological estimation.
Compositional heterogeneity (Lockhart et al. 1994; Foster and Hickey 1999; Foster 2004; Jermiin et al.
2004; Phillips et al. 2004; Collins et al. 2005) or a combination of compositional heterogeneity and rate
heterogeneity among lineages (Ho and Jermiin 2004) are common problems in this respect. Lartillot and

48
Philippe (2008) noted that the assumption of a time-homogeneous amino acid replacement process made
by conventional protein models is strongly violated in the metazoan phylogenomic data set they
examined. As this entails a risk of observing artifacts as a result of compositional bias, we studied the
influence of compositional heterogeneity on phylogenetic analyses of metazoan relationships. We show
that approaches to reduce compositional heterogeneity like the exclusion of taxa with strongly differing
amino acid composition, the employment of distance methods using LogDet distances (Lockhart et al.
1994; Tamura and Kumar 2002) or the recoding of amino acids in groups with similar properties
(Embley et al. 2003; Rodríguez-Ezpeleta et al. 2007; Susko and Roger 2007) diminish artifacts and result
in higher confidence values. We focused on the relationships of the lophophorate lineages and entoprocts
and improved the taxon sampling of these groups by adding two new expressed sequence tag (EST) data
sets for so far uncovered clades of ectoprocts and by combining all data sets of lophophorates and
entoprocts existing to date. The new data set includes eleven representatives of the lophophorate lineages
and entoprocts, which more than doubles the amount of data of these groups compared with previous
phylogenomic analyses that comprised four (Helmkampf et al. 2008b) or five (Dunn et al. 2008) of these
taxa. Using this data set we investigated especially hypotheses concerning the relationships of ectoprocts
and entoprocts, and the relationships of the major clades within ectoprocts.
Materials and Methods
EST generation and processing
Two new EST (expressed sequence tag) data sets of the ectoproct bryozoans Alcyonidium diaphanum
Lamouroux, 1813 and Tubulipora sp. were generated for this study. Both species represent major
ectoproct clades that have not been covered by genomic-scale data so far, namely Ctenotomata and
Cyclostomata, respectively. Specimens of Alcyonidium were from Helgoland, Germany, whereas Tubulipora
was obtained from a culture kept at the laboratories of the Marine Biological Association in Plymouth,
Great Britain, that is descended from a specimen collected off Stoke Point, South Devon, Great Britain.
Total RNA was extracted from a lobe of an adult Alcyonidium colony by homogenization in liquid
49
nitrogen and employing the TRIzol Plus purification system (Invitrogen, Karlsruhe, Germany). The
subsequent cDNA library construction was carried out at the Max Planck Institute for Molecular
Genetics in Berlin as follows. Isolation of mRNA was performed with the Dynabeads mRNA Purification
Kit (Invitrogen, Karlsruhe, Germany), and transcription into cDNA achieved by the primer extension
method. The products were fractioned according to size and cloned directionally using CloneMiner
technology (Invitrogen, Karlsruhe, Germany) and the vector pDONR222. In the case of Tubulipora, total
RNA and mRNA were isolated from a whole colony as above; the mRNA was transcribed and amplified
by long distance PCR. The products were size fractioned and cloned directionally by the Creator
SMART cDNA Library Construction Kit (Clontech, Heidelberg, Germany) using the vector pDNR-
LIB. By 5’ sequencing clones with the automated capillary sequencer system ABI 3730 XL (Applied
Biosystems, Darmstadt, Germany), 2331 and 2040 ESTs were generated from the Alcyonidium and
Tubulipora libraries, respectively. These single reads are available at NCBI’s dbEST. EST assembly was
accomplished by a processing pipeline at the Center for Integrative Bioinformatics in Vienna as
previously described (Hausdorf et al. 2007, with the addition of a second clustering step to improve
contig assembly), and resulted in a total of 1369 contigs obtained from Alcyonidium, and 1375 from
Tubulipora.
Extraction and alignment of ribosomal protein sequences
Ribosomal protein gene sequences were retrieved from the newly-generated ESTs and 46
additional, publicly available data sets. These sets comprised both non-redundant transcriptome data
derived from whole genome projects (e.g., NCBI’s RefSeq and JGI’s filtered model data sets) as well as
EST data processed as described above, and included all lophophorate and ectoproct taxa currently
represented by genomic-scale data. Slow-evolving taxa were selected instead of fast-evolving ones
whenever possible (e.g., Paraplanocera, Xiphinema). These data were surveyed by the tblastn algorithm
based on a query set of 78 human cytoplasmic ribosomal protein sequences acquired from the Ribosomal
Protein Gene Database (http://ribosome.med.miyazaki-u.ac.jp, excluding rps4y and rpl41, which are
redundant or too short, respectively). All hits with an e-value lower than 1×10⁻¹⁰ were again queried
50
against the human ribosomal protein sequences by employing the genewisedb algorithm (score cut-off <
50) as implemented in the Wise2 package (Birney et al. 2004). This was done to receive protein
translations corrected for frameshift errors due to sequencing inaccuracy. Of each gene and taxon, the
longest sequence was taken. The resulting, non-redundant gene sets were individually aligned by the L-
INS-i algorithm implemented in MAFFT (Katoh et al. 2002; Katoh and Toh 2008) and edited by
Gblocks (Castresana 2000) using low stringency parameters. The final alignment, spanning 11544 amino
acid positions, was attained by concatenating all single alignments and has been deposited at TreeBASE
(http://www.treebase.org, preliminary accession number SN4402). In this dataset, Alcyonidium is
represented by 10383 positions (89.9 %) derived from 74 genes, and Tubulipora by 7192 positions (62.3 %)
gathered from 49 genes. The overall density of the matrix, i.e. the proportion of determined amino acid
positions, amounts to 82.6 %. Alignments with reduced taxon sets were attained by removing taxa from
the final, complete alignment.
Phylogenetic analyses
Maximum likelihood analyses were conducted with Treefinder, version of October 2008 (Jobb et
al. 2004; Jobb 2007). An appropriate model for protein evolution was determined with the ‘propose
model’ option of Treefinder based on the Akaike Information Criterion with a correction term for small
sample size. According to this criterion a mixed model that is a linear combination of 14 empirical
models of protein evolution considering among-site rate variation with a four-category discrete gamma-
distribution for rates was chosen. Confidence values for the edges of the maximum likelihood tree were
computed by bootstrapping (Felsenstein 1985) (100 replications).
Some amino acid substitutions are found less frequently in real data than predicted by empirical
models, which may lead to biases in phylogenetic reconstruction. Thus, we also used the class frequency
mixture model LG + cF + Γ that adjusts for site-specific amino acid frequencies proposed by Wang et al.
(2008) and implemented in the maximum likelihood program QmmRAxML. No bootstrap analyses were
performed with this model, because the calculations proved as computationally too extensive.
51
We used the disparity index test (Kumar and Gadagkar 2001a, 2001b) as implemented in MEGA
version 4.1 (Tamura et al. 2007) with pairwise deletion of positions with gaps or missing data to identify
sequence pairs characterized by dissimilar amino acid compositions, which indicate differences in the
substitution process among lineages. We applied three approaches to reduce the potential impact of
compositional bias on phylogeny reconstruction. First, we excluded those species which have most
significant differences with the remaining species. Secondly, we constructed a neighbor-joining tree
(Saitou and Nei 1987) with MEGA based on LogDet distances as modified by Tamura and Kumar
(2002) considering among-site rate variation using gamma distributed rates with a shape parameter as
determined in the maximum likelihood analysis (called Equal Input model with rate variation and
pattern heterogeneity in MEGA). Thirdly, we recoded the data using the six groups of amino acids
(AGPST, C, DENQ, FWY, HKR, ILMV) that tend to replace one another (Dayhoff et al. 1978). The
recoded sequences were analyzed with Treefinder with a 6-state general time-reversible model treating
each of these groups as one state (Embley et al. 2003), modeling among-site rate variation with a four-
category discrete gamma-distribution.
To test predefined phylogenetic hypotheses, we used constrained trees and the ‘resolve
multifurcations’ option of Treefinder to obtain the maximum likelihood tree for a specified hypothesis.
Then we investigated whether the maximum likelihood trees for these hypotheses are part of the
confidence set of trees applying the approximately unbiased test (Shimodaira 2002) and the expected
likelihood weights method (Strimmer and Rambaut 2002).
Results and Discussion
Reducing compositional bias improves molecular phylogenetic inference
In the maximum likelihood tree based on 11544 amino acid positions derived from 78 ribosomal
protein genes of 48 metazoan taxa and calculated with a mixed protein model (fig. 1A; this tree has been
found by constrained searches), Brachiopoda and Phoronida are sister groups (bootstrap value 71 %).
The corresponding clade, Brachiozoa, has been recovered in previous phylogenomic analyses with a
52
more sparse sampling of lophophorate taxa (Helmkampf et al. 2008b) as well as some other molecular
(Mackey et al. 1996; Cohen et al. 1998; Cohen 2000; Halanych 2004; Anderson et al. 2004; Cohen and
Weydmann 2005; Baguñà et al. 2008; Paps et al. 2009; but see Passamaneck and Halanych 2006) and
morphological (Nielsen 2001) analyses. Also congruent with earlier phylogenomic studies (Dunn et al.
2008; Helmkampf et al. 2008b), Brachiozoa constitutes a clade with Nemertea. These relationships were
also confirmed by the maximum likelihood analysis with the class frequency mixture model that adjusts
for site-specific amino acid frequencies proposed by Wang et al. (2008) (fig. 2A). In contrast to previous
phylogenomic (Hausdorf et al. 2007; Helmkampf et al. 2008b; Struck and Fisse 2008; Witek et al. 2008)
and rDNA analyses (Baguñà et al. 2008; Paps et al. 2009) Ectoprocta and Entoprocta do not compose a
monophylum in the maximum likelihood trees with the complete taxon sampling (fig. 1A, 2A). Instead,
ectoprocts are the sister group of Eutrochozoa + Brachiozoa in the analysis with the mixed protein model
(fig. 1A) respectively of all Lophotrochozoa including entoprocts and platyhelminths in the analysis with
the class frequency mixture model (fig. 2A). Entoprocts appear as sister group of Platyzoa in analyses with
either of these models. However, the bootstrap values of these new groupings are below 50 %. These
contradictory results indicate that there might be systematic errors as a result of model assumption
violations either in previous or in the present analyses.
To evaluate one possible cause of systematic errors we examined the amino acid composition of
the used sequences. A total of 53.7% of the sequence pairs of the examined 48 taxa show significantly
dissimilar amino acid compositions according to the disparity index test (Kumar and Gadagkar,
2001a,b). This confirms the observation of Lartillot and Philippe (2008) that the assumption of a time-
homogeneous amino acid replacement process made by conventional protein models is strongly violated
in metazoan phylogenomic data and, thus, there is a risk of observing artifacts related to compositional
bias.
We tried to reduce the potential impact of dissimilar amino acid compositions in our sequence
data set on phylogenetic analyses using three approaches. First, we reduced the number of sequence pairs
with dissimilar amino acid compositions by excluding those species that significantly differ in amino acid
composition from more than half of the examined species. Consequently, we had to exclude 21 species,
53
among others all representatives of Platyhelminthes and Syndermata, because these significantly deviated
in amino acid composition from at least 33 of the 48 originally included taxa. Maximum likelihood
analyses of the remaining 27 taxa with the mixed protein model (fig. 1B) resulted in monophyletic, but
weakly supported Bryozoa (bootstrap value 59 %) and also an increased support for Brachiozoa
(bootstrap value 88 %). Another topological change in the tree obtained with the 27 taxa set concerns the
position of Brachiozoa, which is no longer the sister group of Nemertea, but instead of Eutrochozoa, i.e.,
Nemertea + Annelida + Mollusca. Similar topological changes occurred also in the maximum likelihood
tree obtained with the class frequency mixture model (fig. 2B).
Secondly, we constructed a neighbor-joining tree based on LogDet + Γ distances as modified by
Tamura and Kumar (2002) considering among-site rate variation (fig. 3). In this tree Bryozoa is also
monophyletic, but not supported in a bootstrap analysis. The support for Brachiozoa increased
(bootstrap value 86 %). In the neighbor-joining tree based on modified LogDet + Γ distances Brachiozoa
is the sister group of Nemertea + Annelida. Moreover, Chaetognatha, Platyhelminthes and Syndermata
form a group with Nematoda and Tardigrada, which is probably the result of long branch attraction.
Thirdly, we recoded the amino acid sequences using the six groups of chemically similar amino
acids that tend to replace one another (Dayhoff et al. 1978) to reduce compositional bias as suggested by
Embley et al. (2003). After recoding, 30.8 % of the pairs of sequences still show significantly dissimilar
compositions according to the disparity index test. Again, we reduced the number of sequence pairs with
dissimilar amino acid compositions by excluding those species that significantly differ in amino acid
composition from more than half of the examined species. Fortunately, only six taxa had to be excluded
and the reduced 42 taxa data set still includes representatives of Platyhelminthes and Syndermata.
Phylogenetic analyses of the recoded 42 taxa data set with a 6-state general time-reversible model
(Embley et al. 2003) and considering among-site rate variation confirmed the monophyly of Bryozoa
(bootstrap value 86 %) and Brachiozoa (bootstrap value 92 %) (fig. 4). Despite the loss of information
resulting from using a reduced amino acid alphabet, the support for these groups was higher in the tree
based on the analysis of the recoded data set than in the tree resulting from the maximum likelihood
analysis of the unmodified amino acid data set from which the taxa most strongly differing in amino acid
54
composition had been excluded (fig. 1B) and in the neighbor-joining tree based on modified LogDet + Γ
distances (fig. 3). Other aspects of the tree were improved as well. Whereas the monophyly of
Deuterostomia was not recovered in the maximum likelihood analyses of the 27 taxa amino acid data set
(fig. 1B, 2B) and the neighbor-joining tree using modified LogDet + Γ distances (fig. 3), it was more
strongly supported in the maximum likelihood analyses of the recoded data set (fig. 4) than in the analyses
of the 48 amino acid data set (fig. 1A). This shows that using reduced amino acid alphabets is a more
efficient method for mitigating artifacts in phylogenetic analyses resulting from compositional
heterogeneity than is the simple exclusion of taxa with a divergent amino acid composition or the use of
distance methods based on LogDet distances.
Testing hypotheses concerning relationships of the lophophorate lineages and the entoprocts
We used the approximately unbiased test (Shimodaira 2002) and the expected likelihood weights
method (Strimmer and Rambaut 2002) to test predefined phylogenetic hypotheses. These maximum
likelihood based topology tests also depend on the assumption of a time-homogeneous amino acid
replacement process. Therefore, we employed both the 27 taxa amino acid data set from which the taxa
that differ most strongly in amino acid composition have been deleted, and the 42 taxa recoded data set
for these tests (Table 1). For the analysis of ectoproct interrelationships (Table 2) we constructed an
additional data set restricted to Bryozoa and Brachiozoa as reciprocal outgroups, because Cristatella, the
only representative of Phylactolaemata, is not contained in the other reduced data sets. In the recoded
data set restricted to Bryozoa and Brachiozoa, the composition of the sequences of Cristatella is not
significantly different from the majority of the other species. The relationships of the considered groups in
the maximum likelihood tree based on this data set are identical with those shown in the maximum
likelihood trees based on the complete data set (fig. 1A, 2A).
Hypotheses derived from morphology and embryology suggesting relationships of lophophorates
and deuterostomes (Ax 1995; Lüter and Bartolomaeus 1997; Sørensen et al. 2000; Nielsen 2001) have
already been rejected in previous phylogenomic analyses (Hausdorf et al. 2007; Helmkampf et al. 2008b).
55
Here we focused on alternative hypotheses concerning the phylogenetic position of ectoprocts and
entoprocts. The hypotheses that ectoprocts are sister to all other Lophotrochozoa including Platyzoa
(Halanych et al. 1995; Halanych 2004; Passamaneck and Halanych 2006), and that entoprocts belong to
Platyzoa (Halanych 2004) could be rejected by both topology tests (Table 1, hypotheses 1-2). The
rejection of the last hypothesis is especially remarkable, because entoprocts cluster with Platyzoa in the
maximum likelihood trees based on the complete amino acid data set (fig. 1A, 2A). The hypothesis that
entoprocts are sister to molluscs that has been strongly favored by morphological studies (Bartolomaeus
1993; Haszprunar 1996; 2000; Ax 1999; Wanninger 2004; Wanninger et al. 2007; Haszprunar and
Wanninger 2008) could be rejected by both topology tests with the 42 taxa recoded data set, and also by
the expected likelihood weights method with the 27 taxa amino acid data set (Table 1, hypothesis 3).
Haszprunar and Wanninger (2008) provided a list of nine potential synapomorphies of entoprocts and
molluscs, but this list is not based on an analysis of a character matrix of these and possibly related phyla
like ectoprocts (such a matrix is actually missing), and Haszprunar (1996) conceded that several of these
potential synapomorphies are of low phylogenetic significance. However, it could not yet be excluded
that entoprocts are sister to Eutrochozoa, together forming Trochozoa (Table 1, hypothesis 4). The in
some respect complementary hypothesis that Lophophorata is monophyletic (Emig, 1984) could be
rejected only by the expected likelihood weights method with the 42 taxa recoded data set (Table 1,
hypothesis 5).
According to the analyses of both the complete and the reduced data sets (fig. 1-4), brachiopods
are monophyletic and the sister group of Phoronida. The hypotheses that Brachiopoda is paraphyletic
and that phoronids are the sister group of articulate brachiopods (Halanych et al. 1995; Zrzavý et al.
1998) or inarticulate brachiopods (Cohen et al. 1998; Cohen 2000; Cohen and Weydmann 2005) have
been significantly rejected by both topology tests based on the 27 taxa amino acid data set (Table 1,
hypotheses 6-7). However, none of these hypotheses could be rejected on the basis of the 42 taxa recoded
data set (Table 1, hypotheses 6-7), and only a sister group relationship of phoronids and articulate
brachiopods could be discarded based on the recoded data set restricted to Bryozoa and Brachiozoa
(Table 2, hypotheses 1-2). A denser taxon sampling within brachiopods is necessary to clarify the
relationships within Brachiozoa definitively.
56
In other respects the relationships within Lophotrochozoa remain unclear as well. In the
maximum likelihood trees based on the 48 taxa amino acid data set (fig. 1A, 2A) and the recoded data set
(fig. 4) Brachiozoa is sister to Nemertea as in the phylogenomic analyses of Dunn et al. (2008) and
Helmkampf et al. (2008). In contrast, it is sister to Eutrochozoa including Nemertea, Mollusca and
Annelida in the maximum likelihood trees based on the 27 taxa amino acid data set (fig. 1B, 2B), and to
Nemertea + Annelida in the neighbour-joining tree using modified LogDet + Γ distances. Neotrochozoa
including Mollusca and Annelida (with the annelids comprising Sipuncula and Echiura; see Struck et al.
2007, Hausdorf et al. 2007) has been found only in the maximum likelihood analyses with the mixed
protein model (fig. 1). Most of these relationships are not strongly supported by bootstrap tests and none
can be rejected by topology tests (Table 1, hypotheses 8-10).
Phylogenetic relationships within Ectoprocta
This is the first analysis in which all four recent major groups of Ectoprocta, i.e., Phylactolaemata,
Stenolaemata, Ctenostomata and Cheilostomata, are covered by large protein sequence data sets. The
results of our phylogenetic analyses (fig. 1-4) demonstrate the monophyly of Ectoprocta and a sister group
relationship between Phylactolaemata, the freshwater bryozoans, and the predominantly marine
Gymnolaemata (= Stenolaemata + Ctenostomata + Cheilostomata; as originally defined by Allman 1856
and used, e.g., by Bassler 1953; Jebram 1973; Todd 2000; Ax 2001) as has been suggested by Jebram
(1973), Cuffey and Blake (1991), Todd (2000) and Ax (2001). Within Gymnolaemata, Ctenostomata and
Cheilostomata form a monophyletic group, Eurystomata (as proposed by Marcus 1938; and equivalent to
Gymnolaemata as used by Cuffey 1973 and Fuchs et al. forthcoming). This is corroborated by recent
analyses of Fuchs et al. (forthcoming) based on 18S rDNA, 28S rDNA and COI, which have also shown
that neither Ctenostomata nor Cheilostomata is monophyletic. However, some ctenostomate bryozoans
that have not been included in molecular phylogenetic analyses so far might be the sister group of all
other Ctenostomata + Cheilostomata + Stenolaemata (Todd, 2000). Contrary to one of the phylogenetic
trees of Todd (1990: fig. 7; this has been questioned by Todd himself), the Alcyonidiidae do not belong to
these basal groups, but cluster with Cheilostomata in our tree.
57
Diphyletic Ectoprocta with phylactolaemates forming a clade with recent phoronids as
hypothesized by Mundy et al. (1981) could be significantly rejected by topology tests (Table 2, hypothesis
3). The hypotheses that Stenolaemata constitutes a monophyletic group with Cheilostomata (Cuffey and
Blake 1991) and that Phylactolaemata may have been derived from Ctenostomata (Bassler 1953) have
also been significantly rejected in the topology tests based on the recoded data set restricted to Bryozoa
and Brachiozoa (Table 2, hypotheses 4 and 5). The same is true for the topology proposed by Anstey
(1990), (Ctenostomata, (Cheilostomata, (Phylactolaemata, Stenolaemata))) (Table 2, hypothesis 6).
However, a sister group relationship between Stenolaemata and all other groups of ectoprocts as
proposed by Cuffey (1973) could not be excluded with the available sequence data (Table 2, hypothesis
7), but is unlikely according to morphological characters (Jebram 1973; Cuffey and Blake 1991; Todd
2000; Ax 2001).
Conclusions
As suggested by Baurain et al. (2007), improved taxon sampling, replacing fast-evolving species by
more slowly evolving species, and using better models of sequence evolution resulted in a reduction of
non-phylogenetic signal and a better resolution of animal phylogeny compared with other analyses (e.g.,
Rokas et al. 2005). Heterogeneity of the amino acid composition is a widespread among metazoan taxa,
with potentially detrimental effects on phylogenetic inference. Despite the loss of information involved,
recoding amino acids into groups of functional interchangeability proved to be a more efficient approach
to reduce the impact of compositional bias on phylogenetic analyses than simply excluding taxa with
strongly deviating amino acid composition or employing distance methods based on LogDet distances.
All these methods provided additional evidence for the monophyly of Bryozoa and of Brachiozoa. In
addition, by considerably improving the taxon sampling within both groups on the phylogenomic scale,
we were able to shed light on their internal relations.
Most relationships between metazoan phyla, however, remained nevertheless and contrary to the
expectations raised by Baurain et al. (2007) poorly supported. Even if the support for some of these
58
relationships might further increase by sampling additional genes and taxa, the generally low support for
the relationships between metazoan phyla and the short internodes between the phyla still support the
conclusion of Rokas et al. (2005) that many of the phyla originated by a closely spaced series of
cladogenetic events. It is possible that the phylogenetic signal of the relatively few amino acid
transformations that happened between these events in the Precambrian has mostly eroded and has been
obscured by other signals like similarities in amino acid composition in the following 500 million years of
evolution to a degree that too little of this signal is left to resolve lophotrochozoan phylogeny robustly.
The identification of rare genomic changes shared between phyla will probably be the next major step
towards a more robust reconstruction of the relationships of lophotrochozoan phyla.
Acknowledgments
We would like to thank J. Bishop (Marine Biological Association, Plymouth) and M. Krüß
(Biologische Anstalt Helgoland) for providing specimens. We are also grateful to M. Kube and R.
Reinhardt (Max Planck Institute for Molecular Genetics, Berlin) for the construction and sequencing of
cDNA libraries, and to I. Ebersberger, S. Strauss and A. von Haeseler (Max F. Perutz Laboratories,
Center for Integrative Bioinformatics, Vienna) for the processing of our ESTs. This study was funded by
the priority program “Deep Metazoan Phylogeny” of the Deutsche Forschungsgemeinschaft (HA
2763/5).
Literature Cited
Aguinaldo AMA, Turbeville JM, Linford LS, Rivera MC, Garey JR, Raff RA, Lake JA. 1997. Evidence
for a clade of nematodes, arthropods and other moulting animals. Nature. 387:489–493.
Allman GJ. 1856. Monograph of the fresh-water Polyzoa, including all the known species, both British
and foreign. London: The Ray Society.
59
Anderson FE, Cordoba AJ, Thollesson M. 2004. Bilaterian phylogeny based on analyses of a region of
the sodium-potassium ATPase α-subunit gene. J Mol Evol. 58:252–268.
Anstey RL. 1990. Bryozoans. In: McNamara KJ, editor. Evolutionary trends. London: Belhaven Press.
p. 232–252.
Ax P. 1995. Das System der Metazoa I. Stuttgart: Gustav Fischer Verlag.
Ax P. 1999. Das System der Metazoa II. Stuttgart: Gustav Fischer Verlag.
Ax P. 2001. Das System der Metazoa III. Heidelberg: Spektrum Akademischer Verlag.
Baguñà J, Martinez P, Paps J, Riutort M. 2008. Back in time: a new systematic proposal for the Bilateria.
Phil Trans R Soc B. 363:1481–1491.
Bartolomaeus T. 1993. Die Leibeshöhlenverhältnisse und Verwandtschaftsbeziehungen der Spiralia.
Verh dtsch zool Ges. 86:42.
Bassler RS. 1953. Bryozoa. In: Moore RC, editor. Treatise on invertebrate paleontology. Lawrence:
University of Kansas Press.
Baurain D, Brinkmann H, Philippe H. 2007. Lack of resolution in the animal phylogeny: closely spaced
cladogeneses or undetected systematic errors? Mol Biol Evol. 24:6–9.
Birney E, Clamp M, Durbin R. 2004. GeneWise and Genomewise. Genome Res. 14:988–995.
Blair JE, Ikeo K, Gojobori T, Hedges SB. 2002. The evolutionary position of nematodes. BMC Evol
Biol. 2:7.
Brinkmann H, Philippe H. 2008. Animal phylogeny and large-scale sequencing: progress and pitfalls.
Journal of Systematics and Evolution. 46:274–286.
Castresana J. 2000. Selection of conserved blocks from multiple alignments for their use in phylogenetic
analysis. Mol Biol Evol. 17:540–552.
Cavalier-Smith T. 1998. A revised six-kingdom system of life. Biol Rev. 73:203–266.
Cohen BL. 2000. Monophyly of brachiopods and phoronids: reconciliation of molecular evidence with
Linnaean classification (the subphylum Phoroniformea nov.). Proc R Soc London B. 267:225–231.
Cohen BL, Gawthrop A, Cavalier-Smith T. 1998. Molecular phylogeny of brachiopods and phoronids
based on nuclear-encoded small subunit ribosomal RNA gene sequences. Phil Trans R Soc
London B. 353: 2039–2061.
60
Cohen BL, Weydmann A. 2005. Molecular evidence that phoronids are a subtaxon of brachiopods
(Brachiopoda: Phoronata) and that genetic divergence of metazoan phyla began long before the
early Cambrian. Organ Diver Evol. 5:253–273.
Collins TM, Fedrigo O, Naylor GJP. 2005. Choosing the best genes for the job: The case for stationary
genes in genome-scale phylogenetics. Syst Biol. 54:493–500.
Cuffey RJ. 1973. An improved classification, based upon numerical-taxonomic analyses, for the higher
taxa of entoproct and ectoproct bryozoans. In: Larwood GP, editor. Living and fossil Bryozoa.
London: Academic Press. p. 549–564.
Cuffey RJ, Blake DB. 1991. Cladistic analysis of the phylum Bryozoa. In: Bigey FP, editor. Bryozoaires
actuels et fossiles. Bull Soc Sci Nat l'Ouest France Mém. HS 1: 97–108.
Dayhoff MO, Schwartz RM, Orcutt BC. 1978. A model of evolutionary change in proteins. In: Dayhoff
MO, editor. Atlas of protein sequence and structure, Volume 5, Suppl. 3. Washington: National
Biomedical Research Foundation. p. 345–352.
Delsuc F, Brinkmann H, Philippe H. 2005. Phylogenomics and the reconstruction of the tree of life. Nat
Rev Genet. 6:361–375.
Dunn CW, Hejnol A, Matus DQ, Pang K, Browne WE, Smith SA, Seaver E, Rouse GW, Obst M,
Edgecombe GD, Sørensen MV, Haddock SHD, Schmidt-Rhaesa A, Okusu A, Kristensen RM,
Wheeler WC, Martindale MQ, Giribet G. 2008. Broad phylogenomic sampling improves
resolution of the animal tree of life. Nature. 452:745–749.
Embley TM, van der Giezen M, Horner DS, Dyal PL, Foster P. 2003. Mitochondria and
hydrogenosomes are two forms of the same fundamental organelle. Phil Trans R Soc London B.
358:191–203.
Emig C. 1984. On the origin of the Lophophorata. Z Zool Syst Evolutionsforsch. 22:91–94.
Foster PG. 2004. Modeling compositional heterogeneity. Syst Biol. 53:485–495.
Foster PG, Hickey DA. 1999. Compositional bias may affect both DNA-based and protein-based
phylogenetic reconstructions. J Mol Evol. 48:284–290.
Felsenstein J. 1985. Confidence limits on phylogenies: an approach using the bootstrap. Evolution.
39:783–791.
61
Fuchs J, Obst M, Sundberg P. Forthcoming. The first comprehensive molecular phylogeny of Bryozoa
(Ectoprocta) based on combined analyses of nuclear and mitochondrial genes. Mol Phylogenet
Evol.
Giribet G, Distel DL, Polz M, Sterrer W, Wheeler WC. 2000. Triploblastic relationships with emphasis
on the acoelomates and the position of Gnathostomulida, Cycliophora, Plathelminthes, and
Chaetognatha: A combined approach of 18S rDNA sequences and morphology. Syst Biol.
49:539–562.
Halanych KM. 2004. The New View of Animal Phylogeny. Annu Rev Ecol Evol Syst. 35:229–256.
Halanych KM, Bacheller JD, Aguinaldo AA, Liva SM, Hillis DM, Lake JA. 1995. Evidence from 18S
ribosomal DNA that the Lophophorates are protostome animals. Science. 267:1641–1642.
Haszprunar G. 1996. The Mollusca: Coelomate turbellarians or mesenchymate annelids? In: Taylor JD,
editor. Origin and evolutionary radiation of the Mollusca. Oxford: Oxford University Press. p. 3–
28.
Haszprunar G. 2000. Is the Aplacophora monophyletic? A cladistic point of view. Am Malacol Bull.
15:115–130.
Haszprunar G, Wanninger A. 2008. On the fine structure of the creeping larva of Loxosomella murmanica:
additional evidence for a clade of Kamptozoa (Entoprocta) and Mollusca. Acta Zool. 89:137–148.
Hausdorf B, Helmkampf M, Meyer A, Witek A, Herlyn H, Bruchhaus I, Hankeln T, Struck TH, Lieb B.
2007. Spiralian phylogenomics supports the resurrection of Bryozoa comprising Ectoprocta and
Entoprocta. Mol Biol Evol. 24:2723–2729.
Helmkampf M, Bruchhaus I, Hausdorf B. 2008a. Multigene analysis of lophophorate and chaetognath
phylogenetic relationships. Mol Phylogenet Evol. 46:206–214.
Helmkampf M, Bruchhaus I, Hausdorf B. 2008b. Phylogenomic analyses of lophophorates (brachiopods,
phoronids and bryozoans) confirm the Lophotrochozoa concept. Proc R Soc London B.
275:1927–1933.
Ho SYW, Jermiin LS. 2004. Tracing the decay of the historical signal in biological sequence data. Syst
Biol. 53:623–637.
62
Jebram, D. 1973. The importance of different growth directions in the Phylactolaemata and
Gymnolaemata for reconstructing the phylogeny of the Bryozoa. In: Larwood GP, editor. Living
and fossil Bryozoa. London: Academic Press. p. 565–576.
Jermiin LS, Ho SYW, Ababneh F, Robinson J, Larkum AWD. 2004. The biasing effect of compositional
heterogeneity on phylogenetic estimates may be underestimated. Syst Biol. 53:638–643.
Jobb G. 2007. TREEFINDER version of October 2008. Distributed by the author at www.treefinder.de.
Jobb G, von Haeseler A, Strimmer K. 2004. TREEFINDER: a powerful graphical analysis environment
for molecular phylogenetics. BMC Evol Biol. 4:18.
Katoh K, Misawa K, Kuma K, Miyata T. 2002. MAFFT: a novel method for rapid multiple sequence
alignment based on fast Fourier transform. Nucleic Acids Res. 30:3059–3066.
Katoh K, Toh H. 2008. Recent developments in the MAFFT multiple sequence alignment program.
Brief Bioinform. 9:286–298.
Kumar S, Gadagkar SR. 2001a. Disparity index: a simple statistic to measure and test the homogeneity
of substitution patterns between molecular sequences. Genetics. 158:1321–1327.
Kumar S, Gadagkar SR. 2001b. Corrigendum. Genetics. 159:913–914.
Lartillot N, Philippe H. 2008. Improvement of molecular phylogenetic inference and the phylogeny of
Bilateria. Phil Trans R Soc B. 363:1463–1472.
Lockhart PJ, Steel MA, Hendy MD, Penny D. 1994. Recovering evolutionary trees under a more
realistic model of sequence evolution. Mol Biol Evol. 11:605–612.
Lüter C, Bartolomaeus T. 1997. The phylogenetic position of Brachiopoda—a comparison of
morphological and molecular data. Zool Scripta. 26:245–254.
Mackey LY, Winnepenninckx B, De Wachter R, Backeljau T, Emschermann P, Garey JR. 1996. 18S
rRNA suggests that Entoprocta are protostomes, unrelated to Ectoprocta. J Mol Evol. 42:552–559.
Marcus E. 1938. Bryozoarios marinhos Brasileiros II. Bol Fac Philos Sci Letr Univ São Paulo, IV, Zool.
2:1–196.
Mundy SP, Taylor PD, Thorpe JP. 1981. A reinterpretation of Phylactolaemate phylogeny. In: Larwood
GP, Nielsen C, editors. Recent and fossil Bryozoa. Fredensborg: Olsen and Olsen. p. 185–190.
63
Nielsen C. 2001. Animal evolution: Interrelationships of the living phyla, Second Edition. Oxford:
Oxford University Press.
Paps J, Baguñà J, Riutort M. 2009. Lophotrochozoa internal phylogeny: new insights from an up-to-date
analysis of nuclear ribosomal genes. Proc R Soc London B. 276:1245–1254.
Passamaneck Y, Halanych KM. 2006. Lophotrochozoan phylogeny assessed with LSU and SSU data:
Evidence of lophophorate polyphyly. Mol Phylogenet Evol. 40:20–28.
Peterson KJ, Eernisse DJ. 2001. Animal phylogeny and the ancestry of bilaterians: inferences from
morphology and 18S rDNA gene sequences. Evol Dev. 3:170–205.
Peterson KJ, Lyons JB, Nowak KS, Takacs CM, Wargo MJ, McPeek MA. 2004. Estimating metazoan
divergence times with a molecular clock. Proc Natl Acad Sci USA. 101:6536–6541.
Philip GK, Creevey CJ, McInerney JO. 2005. The Opisthokonta and the Ecdysozoa may not be clades:
stronger support for the grouping of plant and animal than for animal and fungi and stronger
support for the Coelomata than Ecdysozoa. Mol Biol Evol. 22:1175–1184.
Philippe H, Brinkmann H, Martinez P, Riutort M, Baguñà J. 2007. Acoel flatworms are not
Platyhelminthes: evidence from phylogenomics. PLOS One. 2:e717.
Philippe H, Lartillot N, Brinkmann H. 2005. Multigene analyses of bilaterian animals corroborate the
monophyly of Ecdysozoa, Lophotrochozoa, and Protostomia. Mol Biol Evol. 22:1246–1253.
Philippe H, Telford MJ. 2006. Large-scale sequencing and the new animal phylogeny. Trends Ecol Evol.
21:614–620.
Phillips MJ, Delsuc F, Penny D. 2004. Genome-scale phylogeny and the detection of systematic biases.
Mol Biol Evol 21:1455–1458.
Rodríguez-Ezpeleta N, Brinkmann H, Roure B, Lartillot N, Lang BF, Philippe H. 2007. Detecting and
overcoming systematic errors in genome-scale phylogenies. Syst Biol. 56:389–399.
Rokas A, Krüger D, Carroll SB. 2005. Animal evolution and the molecular signature of radiations
compressed in time. Science. 310:1933–1938.
Ruiz-Trillo I, Paps J, Loukota M, Ribera C, Jondelius U, Baguñà J, Riutort M. 2002. A phylogenetic
analysis of myosin heavy chain type II sequences corroborates that Acoela and Nemertodermatida
are basal bilaterians. Proc Natl Acad Sci USA. 99:11246–11251.
64
Saitou N, Nei M. 1987. The Neighbor-joining Method: A New Method for Reconstructing Phylogenetic
Trees. Mol Biol Evol. 4:406–425.
Shimodaira H. 2002. An approximately unbiased test of phylogenetic tree selection. Syst Biol. 51:492–
508.
Sørensen MV, Funch P, Willerslev E, Hansen AJ, Olesen J. 2000. On the phylogeny of the Metazoa in
the light of Cycliophora and Micrognathozoa. Zool Anz. 239:297–318.
Strimmer K, Rambaut A. 2002. Inferring confidence sets of possibly misspecified gene trees. Proc R Soc
Lond B 269:137–142.
Struck TH, Fisse F. 2008. Phylogenetic position of Nemertea derived from phylogenomic data. Mol Biol
Evol. 25:728–736.
Struck TH, Schult N, Kusen T, Hickman E, Bleidorn C, McHugh D, Halanych KM. 2007. Annelid
phylogeny and the status of Sipuncula and Echiura. BMC Evol Biol. 7:57.
Susko E, Roger AJ. 2007. On reduced amino acid alphabets for phylogenetic inference. Mol Biol Evol.
24:2139–2150.
Tamura K, Dudley J, Nei M, Kumar S. 2007. MEGA4: Molecular Evolutionary Genetics Analysis
(MEGA) software version 4.0. Mol Biol Evol. 24:1596–1599.
Tamura K, Kumar, S. 2002. Evolutionary distance estimation under heterogeneous substitution pattern
among lineages. Mol Biol Evol. 19:1727–1736.
Todd JA. 2000. The central role of ctensotomes in bryozoan phylogeny. In: Herrera Cubilla A, Jackson
JBC, editors. Proceedings of the 11th International Bryozoology Association Conference. Balboa:
Smithsonian Tropical Research Institute. p. 104–135.
Wang HC, Li K, Susko E, Roger AJ. 2008. A class frequency mixture model that adjusts for site-specific
amino acid frequencies and improves inference of protein phylogeny. BMC Evol Biol. 8:331
Wanninger A. 2004. Myo-anatomy of juvenile and adult loxosomatid Entoprocta and the use of
muscular body plans for phylogenetic inferences. J Morph. 261:249–257.
65
Wanninger A, Fuchs J, Haszprunar G. 2007. Anatomy of the serotonergic nervous system of an
entoproct creeping-type larva and its phylogenetic implications. Invert Biol. 126:268–278.
Witek A, Herlyn H, Meyer A, Boell L, Bucher G, Hankeln T. 2008. EST based phylogenomics of
Syndermata questions monophyly of Eurotatoria. BMC Evol Biol. 8:345.
Wolf YI, Rogozin IB, Koonin EV. 2004. Coelomata and not Ecdysozoa: evidence from genome-wide
phylogenetic analysis. Genome Res. 14:29–36.
Zrzavý J, Mihulka S, Kepka P, Bezděk A, Tietz D. 1998. Phylogeny of the Metazoa based on
morphological and 18S ribosomal DNA evidence. Cladistics 14:249–285.
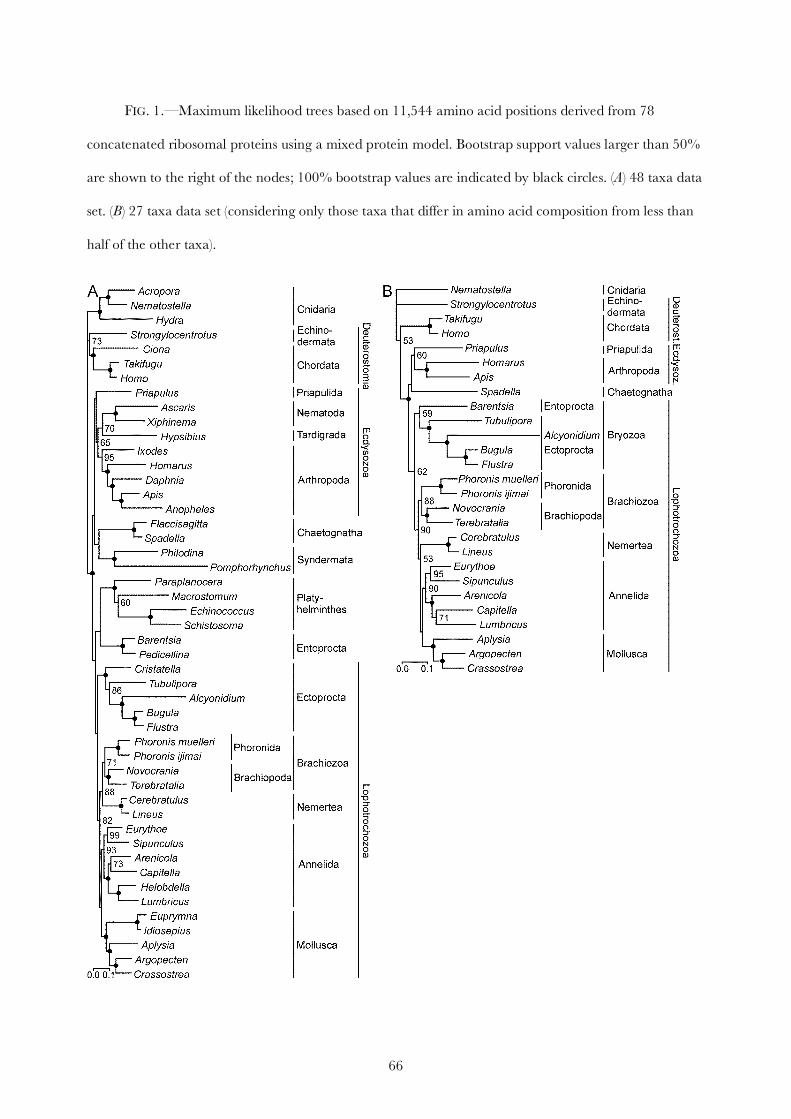
66
FIG. 1.—Maximum likelihood trees based on 11,544 amino acid positions derived from 78
concatenated ribosomal proteins using a mixed protein model. Bootstrap support values larger than 50%
are shown to the right of the nodes; 100% bootstrap values are indicated by black circles. (A) 48 taxa data
set. (B) 27 taxa data set (considering only those taxa that differ in amino acid composition from less than
half of the other taxa).
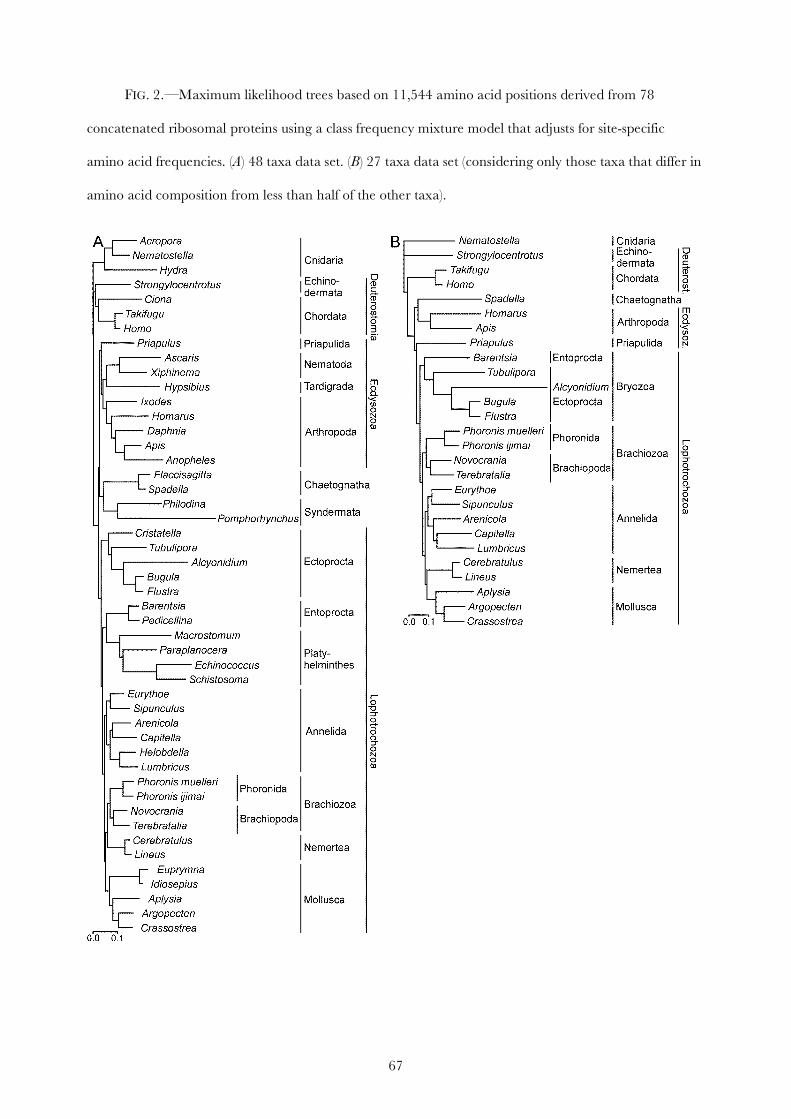
67
FIG. 2.—Maximum likelihood trees based on 11,544 amino acid positions derived from 78
concatenated ribosomal proteins using a class frequency mixture model that adjusts for site-specific
amino acid frequencies. (A) 48 taxa data set. (B) 27 taxa data set (considering only those taxa that differ in
amino acid composition from less than half of the other taxa).
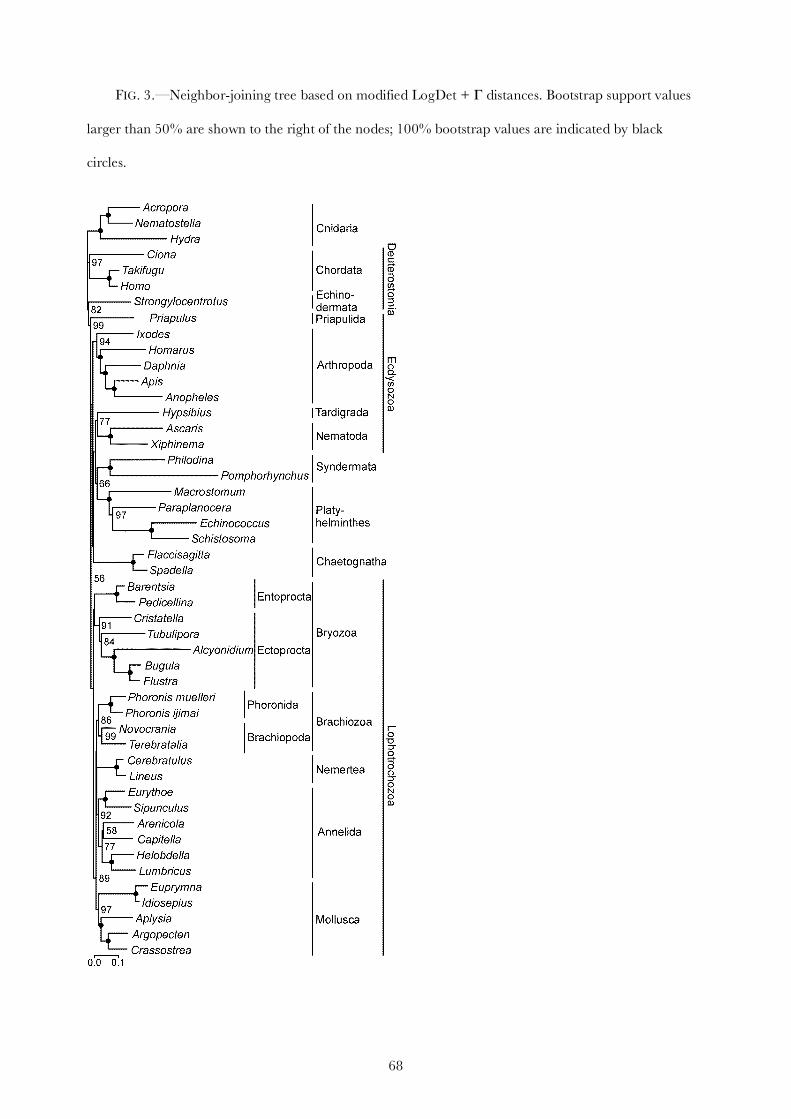
68
FIG. 3.—Neighbor-joining tree based on modified LogDet + Γ distances. Bootstrap support values
larger than 50% are shown to the right of the nodes; 100% bootstrap values are indicated by black
circles.
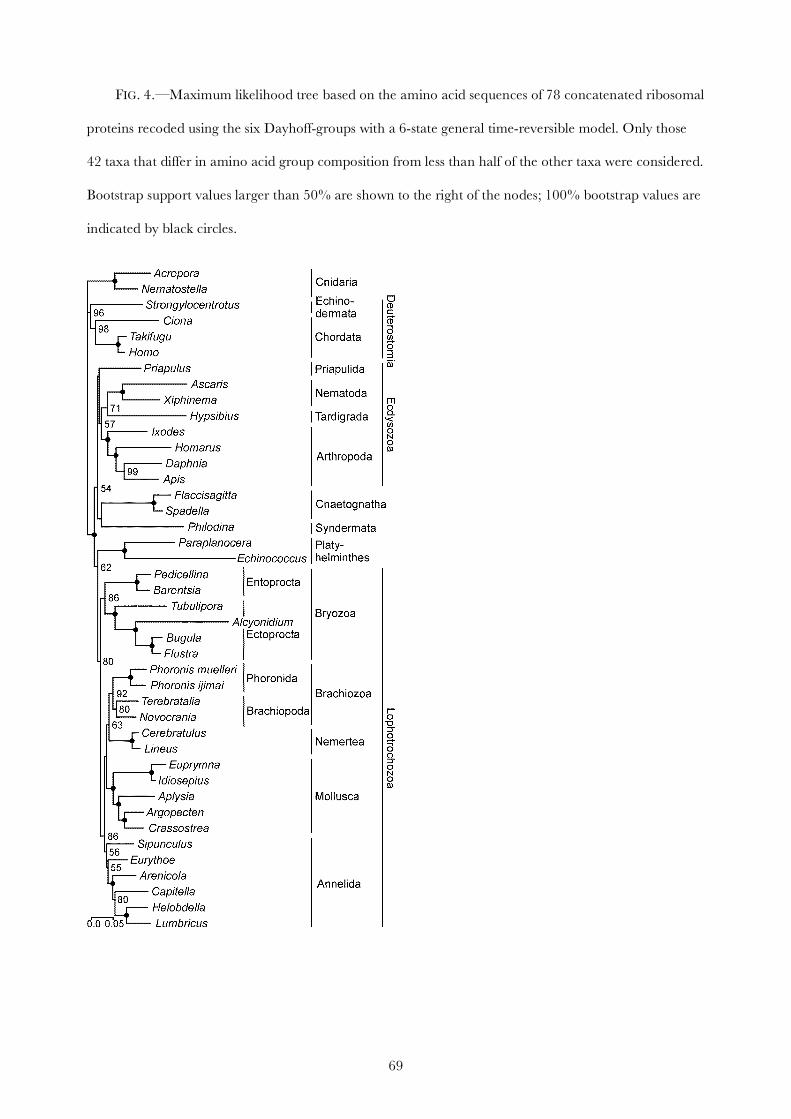
69
FIG. 4.—Maximum likelihood tree based on the amino acid sequences of 78 concatenated ribosomal
proteins recoded using the six Dayhoff-groups with a 6-state general time-reversible model. Only those
42 taxa that differ in amino acid group composition from less than half of the other taxa were considered.
Bootstrap support values larger than 50% are shown to the right of the nodes; 100% bootstrap values are
indicated by black circles.
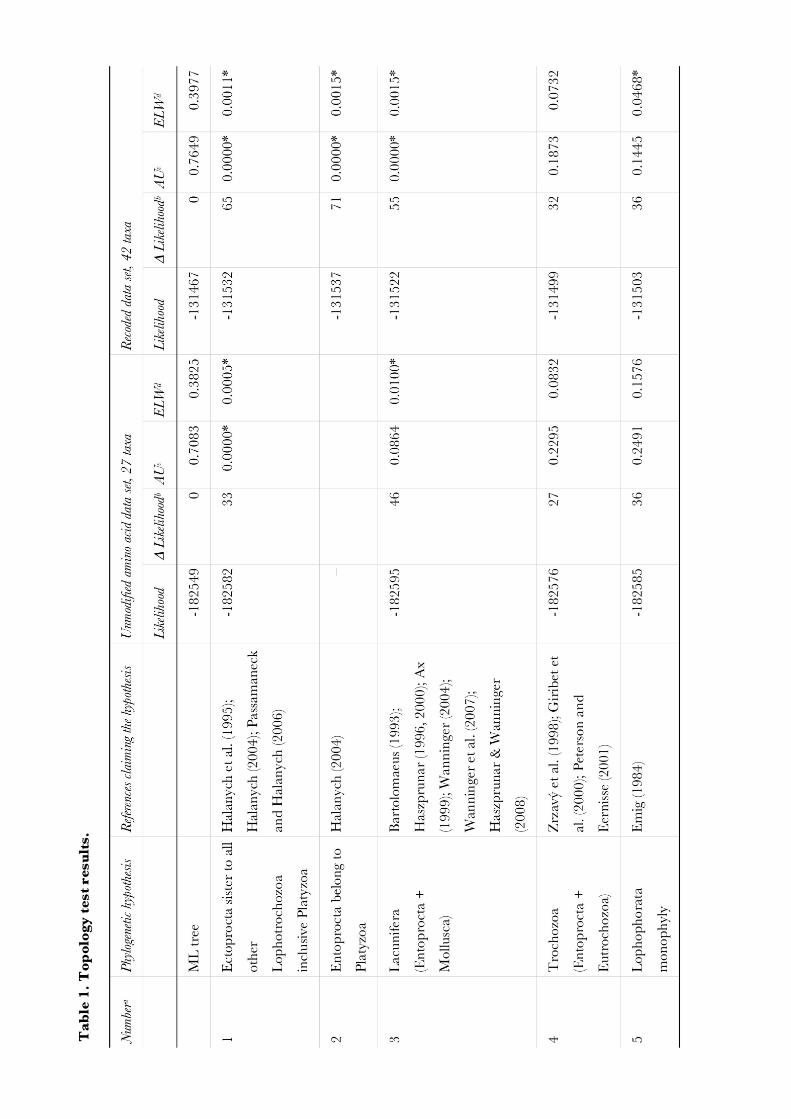
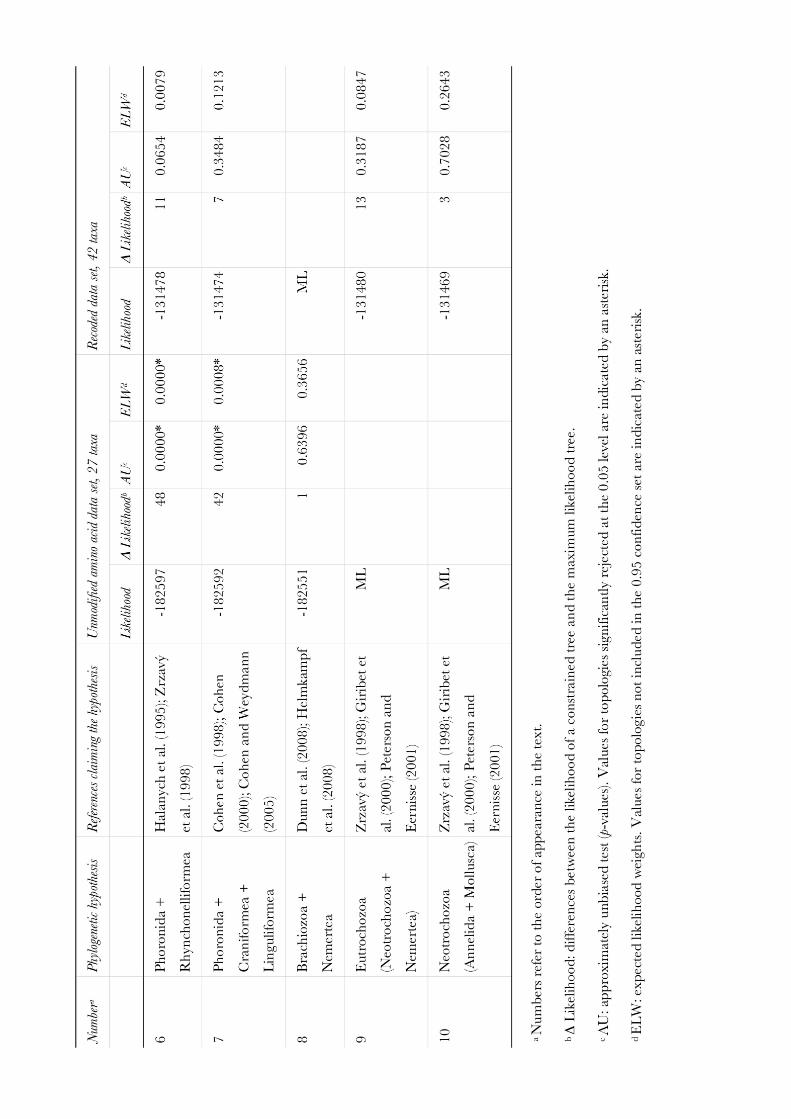
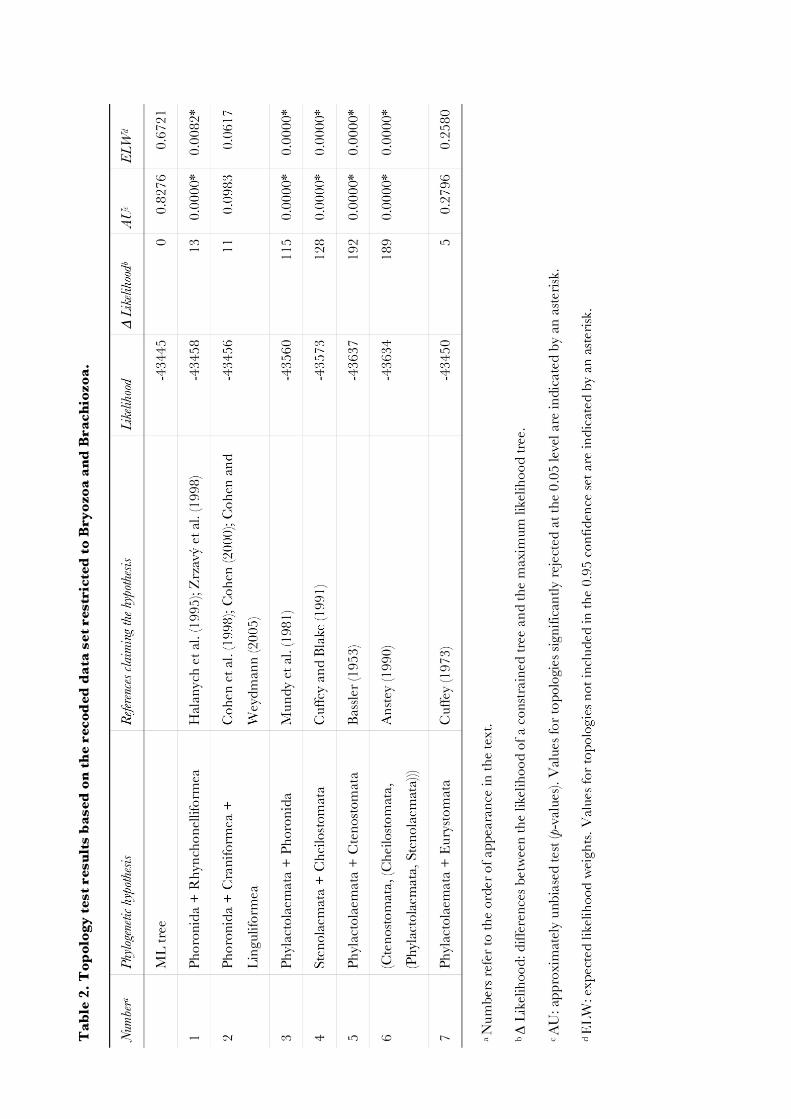

73
2.5. Tree-based orthology assessment illustrated by the evaluation of ribosomal
protein genes
Helmkampf M., Bruchhaus I., and Hausdorf B. Tree-based orthology assessment illustrated by the
evaluation of ribosomal protein genes. Submitted.
74
TREE-BASED ORTHOLOGY ASSESSMENT
Tree-based Orthology Assessment Illustrated by the Evaluation of Ribosomal Protein
Genes
Martin Helmkampf1,*, Iris Bruchhaus2, and Bernhard Hausdorf1
1Zoological Museum of the University of Hamburg, Martin-Luther-King-Platz 3, 20146 Hamburg, Germany
2Bernhard Nocht Institute for Tropical Medicine, Bernhard-Nocht-Strasse 74, 20359 Hamburg, Germany
* Author for correspondence ([email protected]).
75
Abstract
Despite the availability of unprecedented amounts of molecular data, current efforts to resolve the
evolutionary history of animals are still impeded by lack of resolution or even incongruency. One of the
sources of systematic error that may mislead phylogenetic inference is the use of paralogs, gene copies
arising from gene duplication rather than speciation. The identification of orthologous gene sets is
therefore a fundamental requirement of molecular phylogenetic inference.
We propose a novel approach to select genes suitable for a given phylogenetic problem by directly
applying the tree-based definitions of paralogy and orthology. Employing an automated pipeline, clusters
of homologous gene copies are initially compiled from whole genome and EST data. Subsequently, gene
trees are carefully reconstructed for each cluster. Each gene is then assigned to one of three categories
representing varying degrees of evidence for orthology or paralogy according to the species overlap
criterion, which grants independence from the necessity to match gene trees to a species tree as it is
required by alternative phylogenetic orthology assessment methods. In contrast to clustering methods
based on reciprocal similarity, this approach allows to decide for which phylogenetic question a gene can
be used without problems and for which it should be excluded because gene duplications may affect
phylogenetic inference.
As a case study, we evaluated ribosomal protein genes, a functional group of genes used extensively
in phylogenomic studies of Metazoa. Most of these genes are characterized by frequent lineage-specific,
recent gene duplication events. However, indication for ancient gene duplications is rare and scarcely
substantial, making these genes suitable to infer deep metazoan relationships with respect to orthology.
Key words: orthology, orthology assessment, paralogy, phylogenetics, ribosomal proteins
76
Phylogenomic analyses employing large numbers of genes have become the standard method to infer
deep phylogenetic relationships. However, the unprecedented availability of molecular data provides no
guarantee to obtain true phylogenies. Despite continuing efforts, lack of resolution or even incongruency
still riddle significant parts of the animal tree of life (Rokas et al., 2005; Helmkampf et al., 2008; Lartillot
and Philippe, 2008; Dunn et al., 2008). While phylogenomic approaches are effective in overcoming
stochastic errors, they are still plagued by a range of systematic error sources. Most of these are related to
inadequate modelling of molecular evolution due to diverging evolutionary rates among taxa,
heterotachy, compositional bias or selective constraints (Delsuc et al., 2005). Another source of systematic
error in phylogenetics are gene duplications that may result in disagreement between a gene’s trees and
the evolutionary history of the species (Zmasek and Eddy, 2002). The different homology relations arising
from speciation and gene duplication are described by the concepts of orthology and paralogy: two genes
are defined to be orthologous if they originate by a speciation event, i.e., a single ancestral gene in the last
common ancestor of the respective species, while paralogous genes are related via gene duplication
(Fitch, 1970; Koonin, 2005). More precise terms like inparalog, outparalog and co-ortholog have been
proposed to better reflect the more complex homology relations occurring when both types of event are
subsequently involved (Remm et al., 2001; Sonnhammer and Koonin, 2002).
The availability of large amounts of molecular data allows and demands novel ways to address this
issue by carefully selecting genes forming orthologous relationships prior to phylogenetic reconstruction.
Most methods to infer homology relations can be classified into two broad categories, similarity-based
methods and phylogenetic approaches. The former rely on the simple assumption that the sequences of
orthologous genes are more similar to each other than to any other genes from the compared genomes.
Usually, two genes in two species are considered orthologous if each is the others’ best reciprocal hit
using the Blast algorithm (Altschul et al., 1997; Wall et al., 2003). Related methods have been developed
that extend this principle by comparing more than two taxa (e.g., COG/KOG database: Tatusov et al.,
1997, 2003), discriminate between recent, lineage-specific, and ancient gene duplications (e.g.,
Inparanoid: Remm et al., 2001; Berglund et al., 2007; OrthoMCL: Li et al., 2003) and incorporate
information about synteny, i.e., gene order conservation between genes (HomoloGene database: Sayers
et al., 2009).
77
In contrast, phylogenetic approaches (Page and Charleston, 1997; Zmasek and Eddy, 2001; 2002;
Storm and Sonnhammer, 2002; Arvestad et al. 2003; Dufayard et al., 2004) present a more direct way to
assess homology relations. By reconstructing the evolutionary history of a related group of genes and
establishing for each node of the gene tree whether it represents a speciation or duplication event, these
methods come closest to the original definition of orthology and paralogy (Fitch, 1970). There are two
ways to use phylogenetic information in homology assessment, tree reconciliation and analyses of species
overlap between clades in gene trees. In tree reconciliation, homology assessment is done by mapping the
presumed species tree onto the gene tree. Gene duplications and gene loss events can then be inferred
from incongruence between both trees. However, this approach cannot be used for gene homology
assessment prior to phylogenetic reconstruction, because it requires that the true species tree is known. In
contrast, rules based on species overlap between clades in a gene tree allow employing tree-based
orthology assessment when inferring phylogenetic relationships is intended (van der Heijden et al., 2007).
Although concatenating alignments of many genes combined with thorough orthology assessment
is one of the most promising approaches to resolve phylogenetic relationships (Dutilh et al., 2007), tree-
based orthology evaluation has rarely been applied systematically for the purpose of analysing metazoan
systematics. This is due to the fact that such an approach is computationally intensive and usually
requires manual curation. However, in comparison to methods based on sequence similarity, tree-based
homology assessment confers several advantages that are valuable in a phylogenetic context, including
increased accuracy and scalability to various levels of phylogenetic resolution (van der Heijden et al.,
2007; Gabaldón, 2008). We thus present a novel, tree-based method to assess gene homology relations
expressly for phylogenetic purposes. It is implemented in a mostly automated pipeline to carefully
reconstruct gene trees, which allows evaluating large gene sets with a moderate effort of time and labour.
Since EST data are an indispensable resource in molecular phylogenetics as long as many critically
important taxa are not yet represented by whole genome data, our approach is also designed to
incorporate this type of data. In contrast, many established methods and orthology databases have
primarily been designed to predict gene function and rely on (often annotated) whole genome data only
(e.g., KOG, Inparanoid, HomoloGene, TreeFam: Li et al., 2006; Ruan et al., 2008, OrthologID: Chiu et
78
al., 2007, PhylomeDB: Huerta-Cepas et al., 2007; 2008), making them unsuited to assess orthology for
the purpose of a comprehensive phylogenetic study of the animal kingdom.
As a case study, we evaluated ribosomal protein genes, which frequently constitute the largest
functional group of genes used in phylogenomic studies. While some large-scale analyses rely on all
(Helmkampf et al., 2008) or an almost complete selection of these genes (Lartillot and Philippe, 2008), the
most extensive study of animal phylogeny to date excludes almost half of the about 80 eukaryotic
riboprotein genes due to putative evidence for paralogy. This stands in stark contrast to the assumption
that — at least in mammals — each ribosomal protein is encoded by only one functional gene (Wool et
al., 1995). By testing our approach on riboprotein genes, the present study also provides a more in-depth
look at the homology relations of these genes in order to resolve the uncertainties concerning their
phylogenetic suitability.
Material and methods
We developed a semi-automatic procedure for tree-based gene homology assessment, which was realized
by Perl programming and a combination of several established software packages used in data mining
and phylogenetic reconstruction (Fig. 1). The process is organized in three main stages, namely the
compilation of homologous gene clusters (1), the reconstruction of gene trees for each cluster (2), and the
visual evaluation of these gene trees to assess orthology on the basis of the species overlap criterion (3).
1.Compilation of Homologous Gene Clusters
Transcriptomic datasets derived from 10 genome and 13 EST projects representing all major
eumetazoan clades were obtained from public archives (supplementary material, Table S1). This
included three datasets from lophotrochozoan taxa that constitute the first whole genome datasets
available of this critically important animal group. Data from genome projects was restricted to non-
redundant datasets of transcribed sequences, e.g., NCBI’s RefSeq and JGI’s filtered model datasets. This
approach allowed the inclusion of transcript variants and transcribed pseudogenes, but excluded
processed pseudogenes that are common for ribosomal proteins (Zhang et al., 2002). EST data were
assembled to contigs as described previously (Hausdorf et al., 2007, with the addition of a second
79
clustering step to improve contig assembly). For our case study, putative ribosomal protein gene
homologs were extracted from this data set using the tblastn algorithm (Altschul et al., 1997) with an e-
value cut-off < 1×10⁻¹⁰ based on a query set of 78 human cytoplasmic ribosomal protein sequences
acquired from the Ribosomal Protein Gene Database (http://ribosome.med.miyazaki-u.ac.jp, excluding
the extremely short rpl41, and arbitrarily favouring isoform rps4x over rps4y as representative of rps4). To
obtain a protein translation corrected for frameshift errors due to sequencing inaccuracy, these homologs
were again queried against the human ribosomal protein sequences employing the genewisedb algorithm
(score cut-off < 50) as implemented in the Wise2 package (Birney et al., 2004).
2. Gene Tree Reconstruction
The resulting protein clusters were aligned using the iterative MAFFT L-INS-i algorithm as of version 6
(Katoh et al., 2002; Katoh and Toh, 2008). Sequences of less than 25 % length in relation to the longest
sequence in the cluster were eliminated to mitigate the influence of incomplete sequences on the
alignment editing. Then, positions of ambiguous alignment were removed using Gblocks set to low
stringency parameters (Castresana, 2000). In a further removal step, sequences covering less than 33 % of
the edited alignment length were excluded, as were all but one of several identical sequences from the
same taxon (e.g., protein sequences resulting from transcript variants differing only in untranslated
regions or synonymous substitutions). This was done to disburden further analyses from redundant
sequences or short fragments most likely caused by technical errors. Arithmetic means and medians of
the number of sequences per taxon were calculated for each cluster both before and after these removal
steps. Each cluster was then phylogenetically analysed by first identifying the best-fitting model of protein
evolution according to the Akaike Information Criterion corrected for alignment length by ProtTest 1.4
(Abascal et al., 2005). Based on this model, gene trees were computed by maximum likelihood
reconstruction with RAxML 7.0.4 (Stamatakis, 2006) using the batch processing Perl script
batchRAxML.pl written by Olaf Bininda-Emonds (pers. comm.). Support values were calculated from
100 rapid bootstrap calculations (Stamatakis et al., 2008).
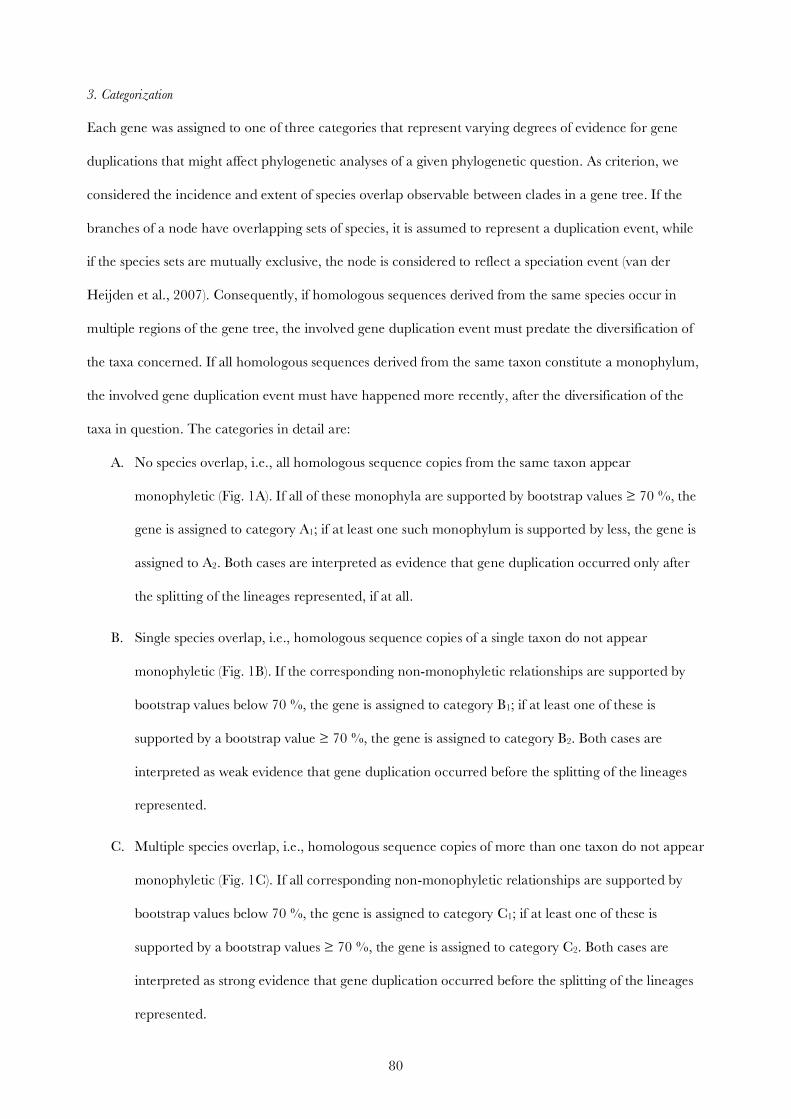
80
3. Categorization
Each gene was assigned to one of three categories that represent varying degrees of evidence for gene
duplications that might affect phylogenetic analyses of a given phylogenetic question. As criterion, we
considered the incidence and extent of species overlap observable between clades in a gene tree. If the
branches of a node have overlapping sets of species, it is assumed to represent a duplication event, while
if the species sets are mutually exclusive, the node is considered to reflect a speciation event (van der
Heijden et al., 2007). Consequently, if homologous sequences derived from the same species occur in
multiple regions of the gene tree, the involved gene duplication event must predate the diversification of
the taxa concerned. If all homologous sequences derived from the same taxon constitute a monophylum,
the involved gene duplication event must have happened more recently, after the diversification of the
taxa in question. The categories in detail are:
A. No species overlap, i.e., all homologous sequence copies from the same taxon appear
monophyletic (Fig. 1A). If all of these monophyla are supported by bootstrap values ≥ 70 %, the
gene is assigned to category A1; if at least one such monophylum is supported by less, the gene is
assigned to A2. Both cases are interpreted as evidence that gene duplication occurred only after
the splitting of the lineages represented, if at all.
B. Single species overlap, i.e., homologous sequence copies of a single taxon do not appear
monophyletic (Fig. 1B). If the corresponding non-monophyletic relationships are supported by
bootstrap values below 70 %, the gene is assigned to category B1; if at least one of these is
supported by a bootstrap value ≥ 70 %, the gene is assigned to category B2. Both cases are
interpreted as weak evidence that gene duplication occurred before the splitting of the lineages
represented.
C. Multiple species overlap, i.e., homologous sequence copies of more than one taxon do not appear
monophyletic (Fig. 1C). If all corresponding non-monophyletic relationships are supported by
bootstrap values below 70 %, the gene is assigned to category C1; if at least one of these is
supported by a bootstrap values ≥ 70 %, the gene is assigned to category C2. Both cases are
interpreted as strong evidence that gene duplication occurred before the splitting of the lineages
represented.
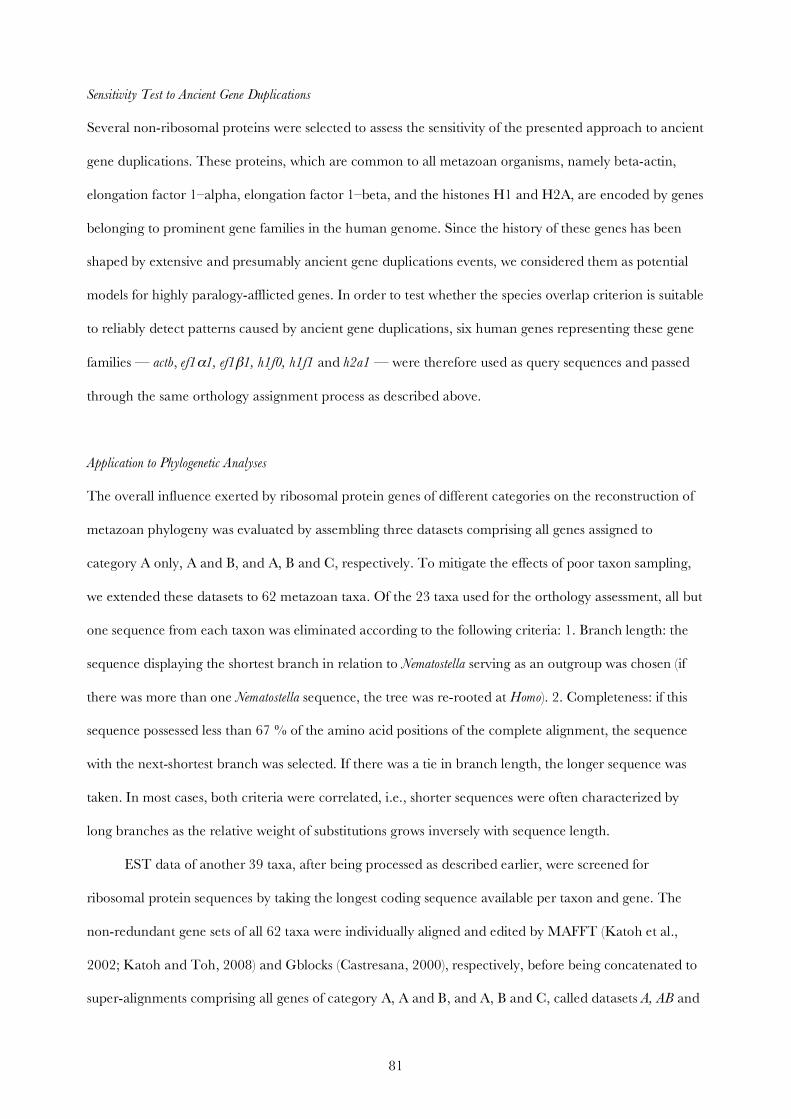
81
Sensitivity Test to Ancient Gene Duplications
Several non-ribosomal proteins were selected to assess the sensitivity of the presented approach to ancient
gene duplications. These proteins, which are common to all metazoan organisms, namely beta-actin,
elongation factor 1–alpha, elongation factor 1–beta, and the histones H1 and H2A, are encoded by genes
belonging to prominent gene families in the human genome. Since the history of these genes has been
shaped by extensive and presumably ancient gene duplications events, we considered them as potential
models for highly paralogy-afflicted genes. In order to test whether the species overlap criterion is suitable
to reliably detect patterns caused by ancient gene duplications, six human genes representing these gene
families — actb, ef1α1, ef1β1, h1f0, h1f1 and h2a1 — were therefore used as query sequences and passed
through the same orthology assignment process as described above.
Application to Phylogenetic Analyses
The overall influence exerted by ribosomal protein genes of different categories on the reconstruction of
metazoan phylogeny was evaluated by assembling three datasets comprising all genes assigned to
category A only, A and B, and A, B and C, respectively. To mitigate the effects of poor taxon sampling,
we extended these datasets to 62 metazoan taxa. Of the 23 taxa used for the orthology assessment, all but
one sequence from each taxon was eliminated according to the following criteria: 1. Branch length: the
sequence displaying the shortest branch in relation to Nematostella serving as an outgroup was chosen (if
there was more than one Nematostella sequence, the tree was re-rooted at Homo). 2. Completeness: if this
sequence possessed less than 67 % of the amino acid positions of the complete alignment, the sequence
with the next-shortest branch was selected. If there was a tie in branch length, the longer sequence was
taken. In most cases, both criteria were correlated, i.e., shorter sequences were often characterized by
long branches as the relative weight of substitutions grows inversely with sequence length.
EST data of another 39 taxa, after being processed as described earlier, were screened for
ribosomal protein sequences by taking the longest coding sequence available per taxon and gene. The
non-redundant gene sets of all 62 taxa were individually aligned and edited by MAFFT (Katoh et al.,
2002; Katoh and Toh, 2008) and Gblocks (Castresana, 2000), respectively, before being concatenated to
super-alignments comprising all genes of category A, A and B, and A, B and C, called datasets A, AB and
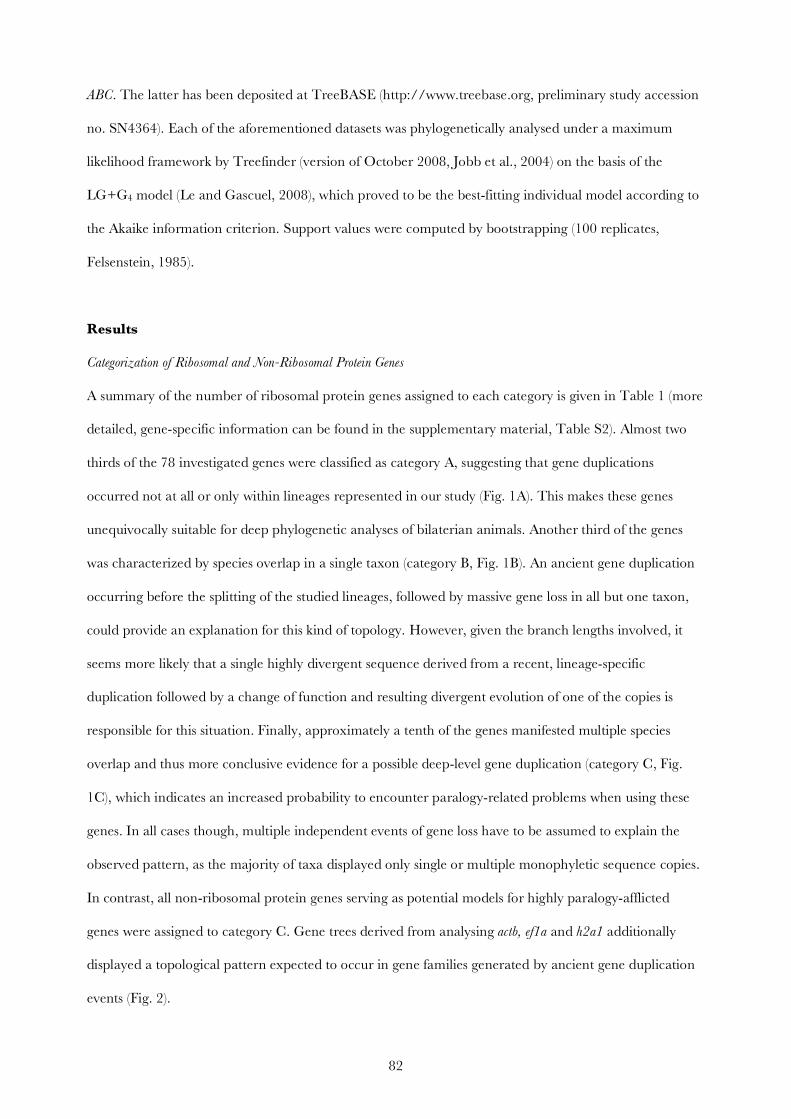
82
ABC. The latter has been deposited at TreeBASE (http://www.treebase.org, preliminary study accession
no. SN4364). Each of the aforementioned datasets was phylogenetically analysed under a maximum
likelihood framework by Treefinder (version of October 2008, Jobb et al., 2004) on the basis of the
LG+G4 model (Le and Gascuel, 2008), which proved to be the best-fitting individual model according to
the Akaike information criterion. Support values were computed by bootstrapping (100 replicates,
Felsenstein, 1985).
Results
Categorization of Ribosomal and Non-Ribosomal Protein Genes
A summary of the number of ribosomal protein genes assigned to each category is given in Table 1 (more
detailed, gene-specific information can be found in the supplementary material, Table S2). Almost two
thirds of the 78 investigated genes were classified as category A, suggesting that gene duplications
occurred not at all or only within lineages represented in our study (Fig. 1A). This makes these genes
unequivocally suitable for deep phylogenetic analyses of bilaterian animals. Another third of the genes
was characterized by species overlap in a single taxon (category B, Fig. 1B). An ancient gene duplication
occurring before the splitting of the studied lineages, followed by massive gene loss in all but one taxon,
could provide an explanation for this kind of topology. However, given the branch lengths involved, it
seems more likely that a single highly divergent sequence derived from a recent, lineage-specific
duplication followed by a change of function and resulting divergent evolution of one of the copies is
responsible for this situation. Finally, approximately a tenth of the genes manifested multiple species
overlap and thus more conclusive evidence for a possible deep-level gene duplication (category C, Fig.
1C), which indicates an increased probability to encounter paralogy-related problems when using these
genes. In all cases though, multiple independent events of gene loss have to be assumed to explain the
observed pattern, as the majority of taxa displayed only single or multiple monophyletic sequence copies.
In contrast, all non-ribosomal protein genes serving as potential models for highly paralogy-afflicted
genes were assigned to category C. Gene trees derived from analysing actb, ef1a and h2a1 additionally
displayed a topological pattern expected to occur in gene families generated by ancient gene duplication
events (Fig. 2).
83
Observed Gene Copy Numbers
In 92 % of the cases where a riboprotein gene was represented by more than one sequence per taxon,
these formed — almost exclusively well supported — monophyletic groups. In fact, many taxa possessed
several copies of a gene: on average, each gene in our dataset comprised 1.5 (genome data) and 1.6 (EST
data) sequences per taxon before short or identical sequences were removed. Removal steps decreased
the total number of sequences across all gene clusters by 12 %, resulting in a decline of the species-
specific average number of sequences per gene to 1.2 and 1.4, respectively. While ESTs were thus
confined to adequately informative sequences by discarding technical fragments (identical sequences had
been merged during contig assembly), genome data was predominantly affected by eliminating copies
that differed only in untranslated regions (transcript variants) or at the level of nucleotides (e.g., copies
with synonymous substitutions).
Only a small number of genes were represented by more than 2.0 sequences per taxon on average.
All of these were strongly influenced by one or two taxa exhibiting ten or more sequences. Except in
three cases, this always concerned ESTs of the platyhelminth Macrostomum lignano. A closer look at these
sequences revealed sequencing errors as one, but not the only source of this profusion, especially as the
affected genes are among the longest ribosomal protein genes (making them prone to sequencing
inaccuracies at the 3’ end). Because the Macrostomum ESTs were generated from thousands of sexually
reproducing individuals (Morris et al., 2006), allelic variation offers another explanation. Species-specific
median values larger than 1.0 regarding the number of sequences per gene were likewise the exception,
and generally not accompanied by mean values above 2.0. Also, assignment to category C did not —
except in one case — coincide with mean or median values concerning the number of sequences per
taxon and gene larger than 2.0 and 1.0, respectively.
Most cases of non-monophyly regarding sequences derived from the same taxon were caused by
EST taxa, above all Philodina and Crassostrea. The overall number of ribosomal protein gene sequences
found per taxon and the number of times a taxon violated the requirement of sequence monophyly was
significantly correlated at the 5 % level (Spearman rank correlation test, N = 23, P = 0.02), although the
number of contigs in the case of EST taxa was not (Spearman rank correlation test, N = 13, P = 0.08).
84
Phylogenetic Analyses of Differently Categorized Genes
The restriction of ribosomal protein genes to categorical ranges reflecting various levels of stringency
produced three concatenated alignments of different length: dataset A, composed of 7328 amino acid
positions of all category A genes, dataset AB, comprising 10264 positions of all genes assigned to category
A or B, and dataset ABC consisting of 11544 positions derived from all genes of any category. The
maximum likelihood trees based on the datasets AB (Fig. 4) and ABC differ only slightly in topology (even
though rotifers, acanthocephalans and gnathostomulids are artefactually attracted to nematodes in
dataset AB), recover what is known as the modern view of animal phylogeny and are congruent with the
most extensive phylogenomic analysis to date (Dunn et al., 2008, stable taxon analysis). In contrast, the
maximum likelihood tree obtained from dataset A displays more noticeable evidence of probable tree
reconstruction artefacts like the attraction of platyhelminths to Ecdysozoa, or deuterostome paraphyly.
Average support values calculated from bootstrapping datasets A, AB and ABC amount to 78, 82 and 84
%, respectively.
Discussion
Overcoming Limitations of Established Methods
Inferring phylogenetic relations between organisms based on sequence data fundamentally requires the
establishment of gene orthology. Many phylogenetic studies rely on similarity-based strategies to predict
orthology, which represent only rough approximations (e.g., Rokas et al., 2005; Regier et al., 2007) that
cannot accurately reflect the complexity of gene homology relations at different levels of resolution. In
addition, these strategies usually depend on (often annotated) whole genome data (e.g., COG/KOG,
Inparanoid, HomoloGene), restricting their predictive power to certain branches of the tree of life. The
present approach has been designed to overcome these limitations, and to provide a homology
assessment tool specifically tailored to application in phylogenetics.
The limitations of accuracy and resolution displayed by similarity-based methods were addressed
by adopting a tree-based strategy, which offers the possibility to identify orthologs at high levels of
resolution, allowing to pinpoint duplication events to specific lineages and taking the complex,
hierarchical nature of gene homology relations into account. This permits the selection of genes qualified
85
to address a given phylogenetic problem. Partitions of a phylogenetic tree in which a gene is suitable to
reconstruct phylogenetic relationships may be identified, even if the same gene is afflicted by paralogy in
other parts. For instance, many vertebrate genes exist in multiple copies (e.g., aldolase, enolase) due to
genome duplication events in this lineage, making these genes prone to paralogy and requiring particular
caution when investigating vertebrate phylogeny. However, non-vertebrate relationships may be safely
inferred from the same genes — for instance, no episodes of gene duplication could be identified within
protostome animals (data not shown). In other cases, it may be possible to break gene families down into
smaller, orthologous groups (e.g., ef1α1 clades, Fig. 3).
These kinds of relationships are directly observable only by the reconstruction of a gene’s
phylogenetic tree, and in an amount of detail that is not achieved by similarity-based methods. The latter
do not preserve the non-transitivity and hierarchical nature of homology relations (but see Jothi et al.,
2006), and have often been criticized as too inclusive (e.g., KOG, see Berglund et al., 2008). Even more
balanced methods (e.g., OrthoMCL, see Chen et al., 2007) are vulnerable to varying evolutionary rates
that lead to orthology misevaluation (van der Heijden et al., 2007). In contrast, tree-based methods are
more robust and provide higher specificity, which is of particular interest in phylogenetics. While sharing
the benefits of high resolution and specificity with other phylogenetic orthology assessment methods
(Page and Charleston, 1997; Zmasek and Eddy, 2001; 2002; Storm and Sonnhammer, 2002; Arvestad et
al. 2003; Dufayard et al., 2004), using the species overlap criterion avoids the most severe limitation of
tree reconciliation: the dependency on a reliable, fully resolved species tree (but see Dufayard et al.,
2004), which precludes this strategy from use in phylogenetics. Although the price of doing without a
species tree is the loss of ability to detect hidden paralogy, i.e., gene duplication followed by reciprocal
gene loss, similarity-based methods are equally misled by this kind of situation (van der Heijden et al.,
2007). On the plus side, species-overlap is less sensitive to gene tree inaccuracies than tree reconciliation,
which may lead to the erroneous exclusion of genes due to putative gene duplication followed by
reciprocal loss because of gene tree reconstruction artefacts. Using gene order information from fully
annotated genomes, van der Heijden et al. (2007) estimated the proportion of correctly assigned
orthology relations based on the species overlap criterion to be 95 %, which is higher than what can be
obtained by similarity-base methods and at least on par with the results attainable by tree reconciliation.
86
EST Incorporation, and Gene Tree Reliability
Because several lineages that are of critical importance for analysing the tree of life are not yet
represented by annotated genome data, we designed the present approach to include draft genome and
EST data. Some cases of paralogy may be missed in taxa represented by EST data, because the absence
of a gene in an EST dataset may arise from the fact that it is not represented in the data rather than
missing in the organism itself. The taxon set used here was selected to be representative for bilaterians,
allowing conclusions about a gene’s general susceptibility to paralogy at the level of bilaterian phyla.
Especially the variate yet neglected Lophotrochozoa are represented for the first time by several genome
data sets in an orthology assessment study. When focussing on other phylogenetic questions, the taxon set
may be tailored to the problem at hand by increasing the density of taxon sampling in the tree partition
of interest.
Only a few other orthology assessment strategies that are suitable to evaluate EST data have been
proposed for phylogenetic inference so far. Dunn et al. (2008) developed an explicit method for selecting
orthologous genes from EST data sets by combining similarity-based Markov clustering, gene tree
reconstruction, and a threshold concerning the mean number of sequences observed per taxon and gene.
However, of the 38 ribosomal protein genes excluded due to these criteria, all but three displayed no or
only weak (category A and B, respectively) evidence for gene duplication preceding the radiation of
Bilateria according to the present study (conversely, five genes of category C were included by Dunn et
al., 2008). Eight of these were rejected due to above-threshold values regarding the mean number of
sequences observed per taxon and gene, although, as we were able to show, this does not coincide with
phylogenetic evidence for ancient gene duplication. This strategy therefore leads to the exclusion of genes
that are merely characterized by high rates of lineage-specific duplication, which pose no threat of
generating paralogy-related tree reconstruction artefacts in the context of deep phylogeny. Another
eleven of category A or B genes were eliminated due to phylogenetic indication by Dunn et al. (2008).
We suppose gene tree reconstruction artefacts are responsible for this incongruency. As a precaution
against this problem, we took efforts to increase gene tree reliability as much as possible, e.g., by careful
taxon sampling, alignment editing, calculating best-fit models of protein evolution for each gene, and
using maximum likelihood methods including bootstrap analysis. In contrast, alternative phylogenetic
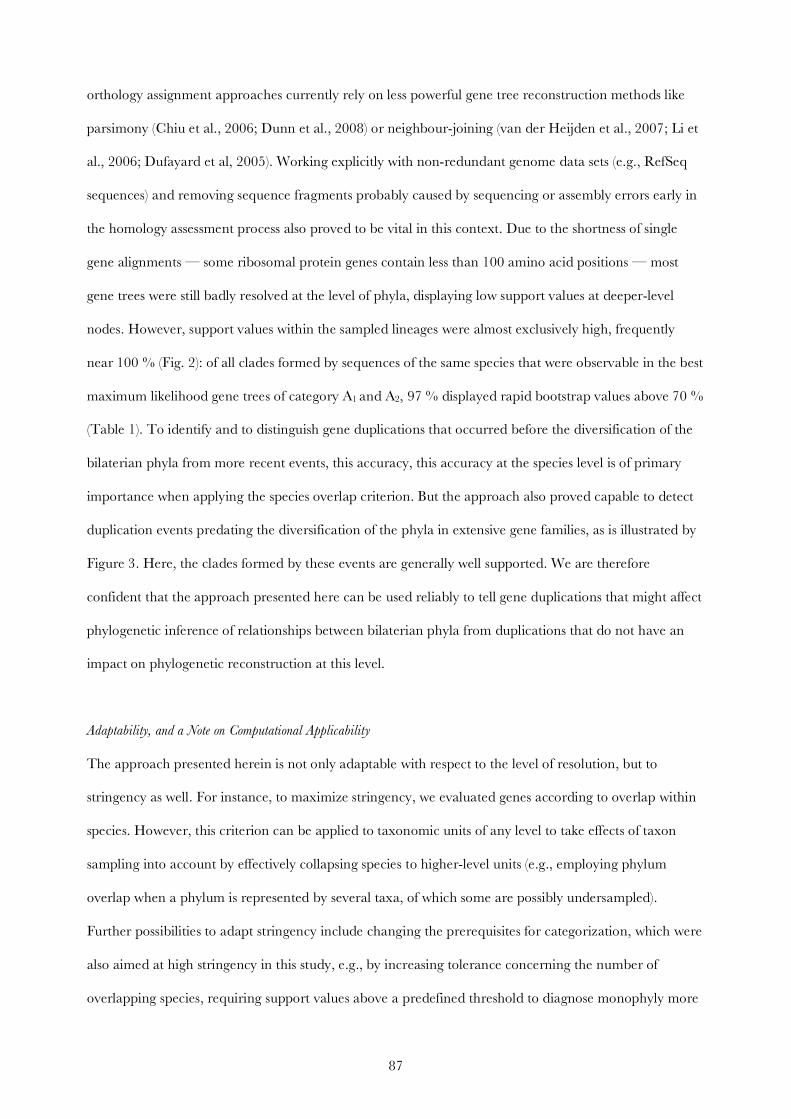
87
orthology assignment approaches currently rely on less powerful gene tree reconstruction methods like
parsimony (Chiu et al., 2006; Dunn et al., 2008) or neighbour-joining (van der Heijden et al., 2007; Li et
al., 2006; Dufayard et al, 2005). Working explicitly with non-redundant genome data sets (e.g., RefSeq
sequences) and removing sequence fragments probably caused by sequencing or assembly errors early in
the homology assessment process also proved to be vital in this context. Due to the shortness of single
gene alignments — some ribosomal protein genes contain less than 100 amino acid positions — most
gene trees were still badly resolved at the level of phyla, displaying low support values at deeper-level
nodes. However, support values within the sampled lineages were almost exclusively high, frequently
near 100 % (Fig. 2): of all clades formed by sequences of the same species that were observable in the best
maximum likelihood gene trees of category A1 and A2, 97 % displayed rapid bootstrap values above 70 %
(Table 1). To identify and to distinguish gene duplications that occurred before the diversification of the
bilaterian phyla from more recent events, this accuracy, this accuracy at the species level is of primary
importance when applying the species overlap criterion. But the approach also proved capable to detect
duplication events predating the diversification of the phyla in extensive gene families, as is illustrated by
Figure 3. Here, the clades formed by these events are generally well supported. We are therefore
confident that the approach presented here can be used reliably to tell gene duplications that might affect
phylogenetic inference of relationships between bilaterian phyla from duplications that do not have an
impact on phylogenetic reconstruction at this level.
Adaptability, and a Note on Computational Applicability
The approach presented herein is not only adaptable with respect to the level of resolution, but to
stringency as well. For instance, to maximize stringency, we evaluated genes according to overlap within
species. However, this criterion can be applied to taxonomic units of any level to take effects of taxon
sampling into account by effectively collapsing species to higher-level units (e.g., employing phylum
overlap when a phylum is represented by several taxa, of which some are possibly undersampled).
Further possibilities to adapt stringency include changing the prerequisites for categorization, which were
also aimed at high stringency in this study, e.g., by increasing tolerance concerning the number of
overlapping species, requiring support values above a predefined threshold to diagnose monophyly more
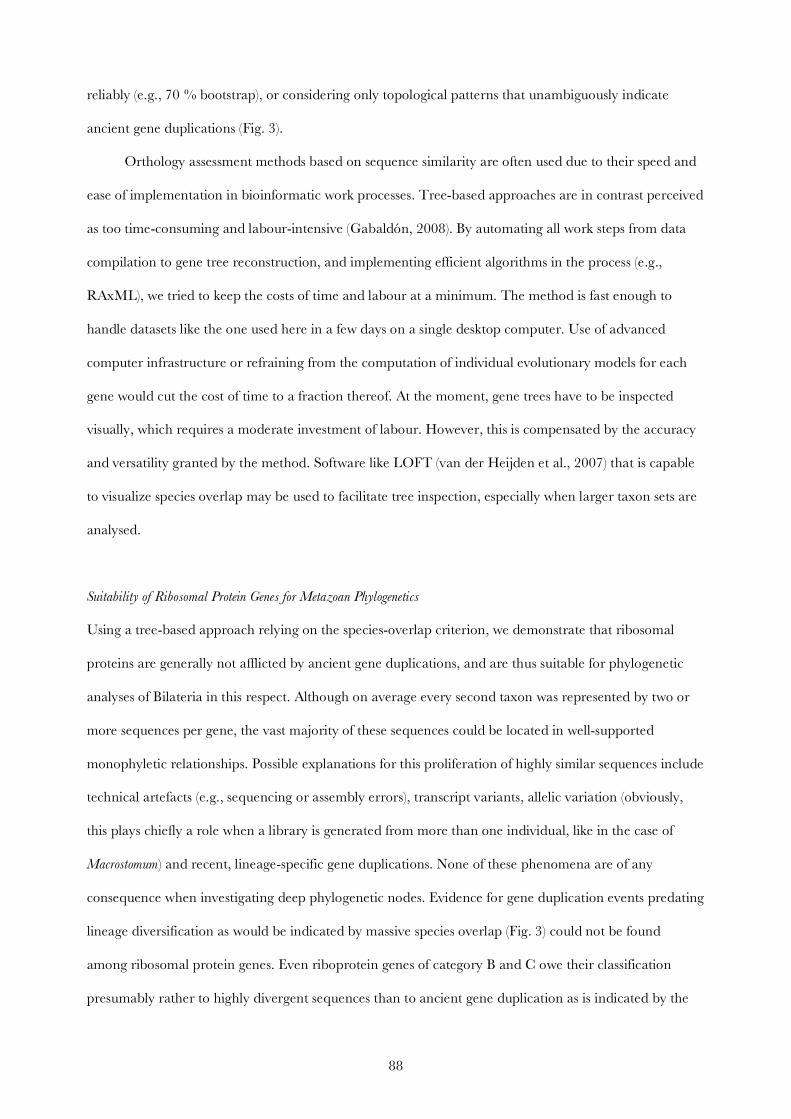
88
reliably (e.g., 70 % bootstrap), or considering only topological patterns that unambiguously indicate
ancient gene duplications (Fig. 3).
Orthology assessment methods based on sequence similarity are often used due to their speed and
ease of implementation in bioinformatic work processes. Tree-based approaches are in contrast perceived
as too time-consuming and labour-intensive (Gabaldón, 2008). By automating all work steps from data
compilation to gene tree reconstruction, and implementing efficient algorithms in the process (e.g.,
RAxML), we tried to keep the costs of time and labour at a minimum. The method is fast enough to
handle datasets like the one used here in a few days on a single desktop computer. Use of advanced
computer infrastructure or refraining from the computation of individual evolutionary models for each
gene would cut the cost of time to a fraction thereof. At the moment, gene trees have to be inspected
visually, which requires a moderate investment of labour. However, this is compensated by the accuracy
and versatility granted by the method. Software like LOFT (van der Heijden et al., 2007) that is capable
to visualize species overlap may be used to facilitate tree inspection, especially when larger taxon sets are
analysed.
Suitability of Ribosomal Protein Genes for Metazoan Phylogenetics
Using a tree-based approach relying on the species-overlap criterion, we demonstrate that ribosomal
proteins are generally not afflicted by ancient gene duplications, and are thus suitable for phylogenetic
analyses of Bilateria in this respect. Although on average every second taxon was represented by two or
more sequences per gene, the vast majority of these sequences could be located in well-supported
monophyletic relationships. Possible explanations for this proliferation of highly similar sequences include
technical artefacts (e.g., sequencing or assembly errors), transcript variants, allelic variation (obviously,
this plays chiefly a role when a library is generated from more than one individual, like in the case of
Macrostomum) and recent, lineage-specific gene duplications. None of these phenomena are of any
consequence when investigating deep phylogenetic nodes. Evidence for gene duplication events predating
lineage diversification as would be indicated by massive species overlap (Fig. 3) could not be found
among ribosomal protein genes. Even riboprotein genes of category B and C owe their classification
presumably rather to highly divergent sequences than to ancient gene duplication as is indicated by the
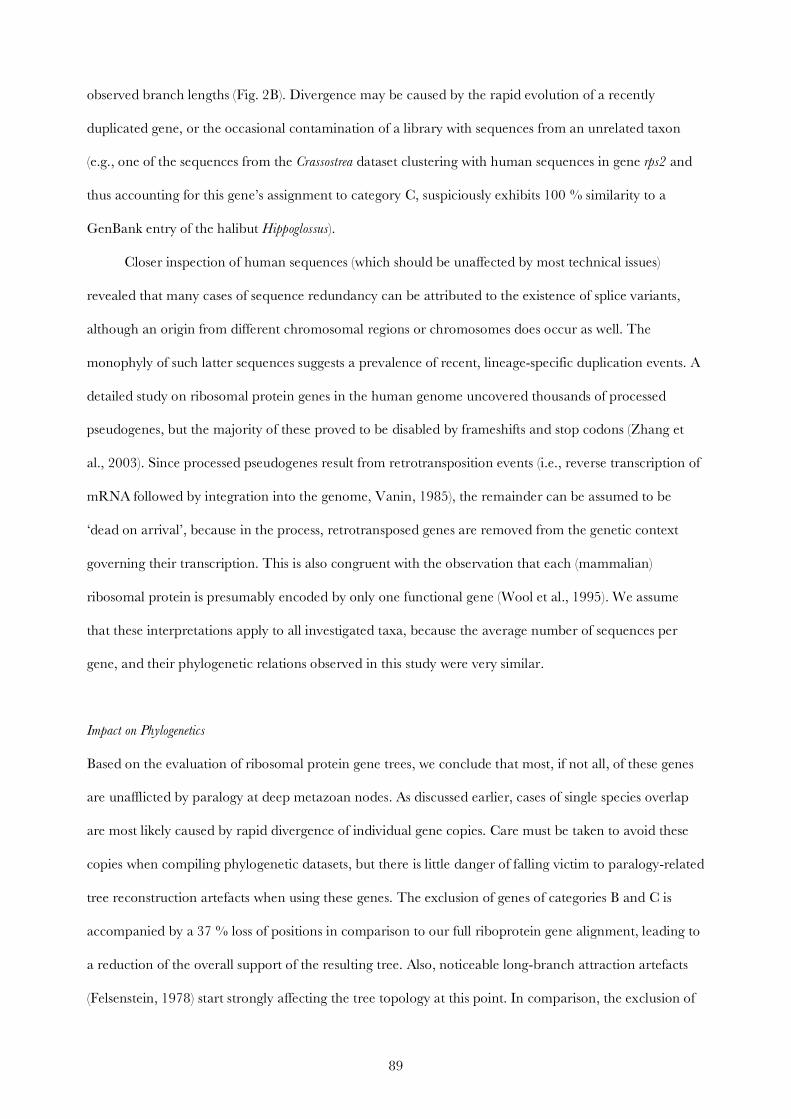
89
observed branch lengths (Fig. 2B). Divergence may be caused by the rapid evolution of a recently
duplicated gene, or the occasional contamination of a library with sequences from an unrelated taxon
(e.g., one of the sequences from the Crassostrea dataset clustering with human sequences in gene rps2 and
thus accounting for this gene’s assignment to category C, suspiciously exhibits 100 % similarity to a
GenBank entry of the halibut Hippoglossus).
Closer inspection of human sequences (which should be unaffected by most technical issues)
revealed that many cases of sequence redundancy can be attributed to the existence of splice variants,
although an origin from different chromosomal regions or chromosomes does occur as well. The
monophyly of such latter sequences suggests a prevalence of recent, lineage-specific duplication events. A
detailed study on ribosomal protein genes in the human genome uncovered thousands of processed
pseudogenes, but the majority of these proved to be disabled by frameshifts and stop codons (Zhang et
al., 2003). Since processed pseudogenes result from retrotransposition events (i.e., reverse transcription of
mRNA followed by integration into the genome, Vanin, 1985), the remainder can be assumed to be
‘dead on arrival’, because in the process, retrotransposed genes are removed from the genetic context
governing their transcription. This is also congruent with the observation that each (mammalian)
ribosomal protein is presumably encoded by only one functional gene (Wool et al., 1995). We assume
that these interpretations apply to all investigated taxa, because the average number of sequences per
gene, and their phylogenetic relations observed in this study were very similar.
Impact on Phylogenetics
Based on the evaluation of ribosomal protein gene trees, we conclude that most, if not all, of these genes
are unafflicted by paralogy at deep metazoan nodes. As discussed earlier, cases of single species overlap
are most likely caused by rapid divergence of individual gene copies. Care must be taken to avoid these
copies when compiling phylogenetic datasets, but there is little danger of falling victim to paralogy-related
tree reconstruction artefacts when using these genes. The exclusion of genes of categories B and C is
accompanied by a 37 % loss of positions in comparison to our full riboprotein gene alignment, leading to
a reduction of the overall support of the resulting tree. Also, noticeable long-branch attraction artefacts
(Felsenstein, 1978) start strongly affecting the tree topology at this point. In comparison, the exclusion of
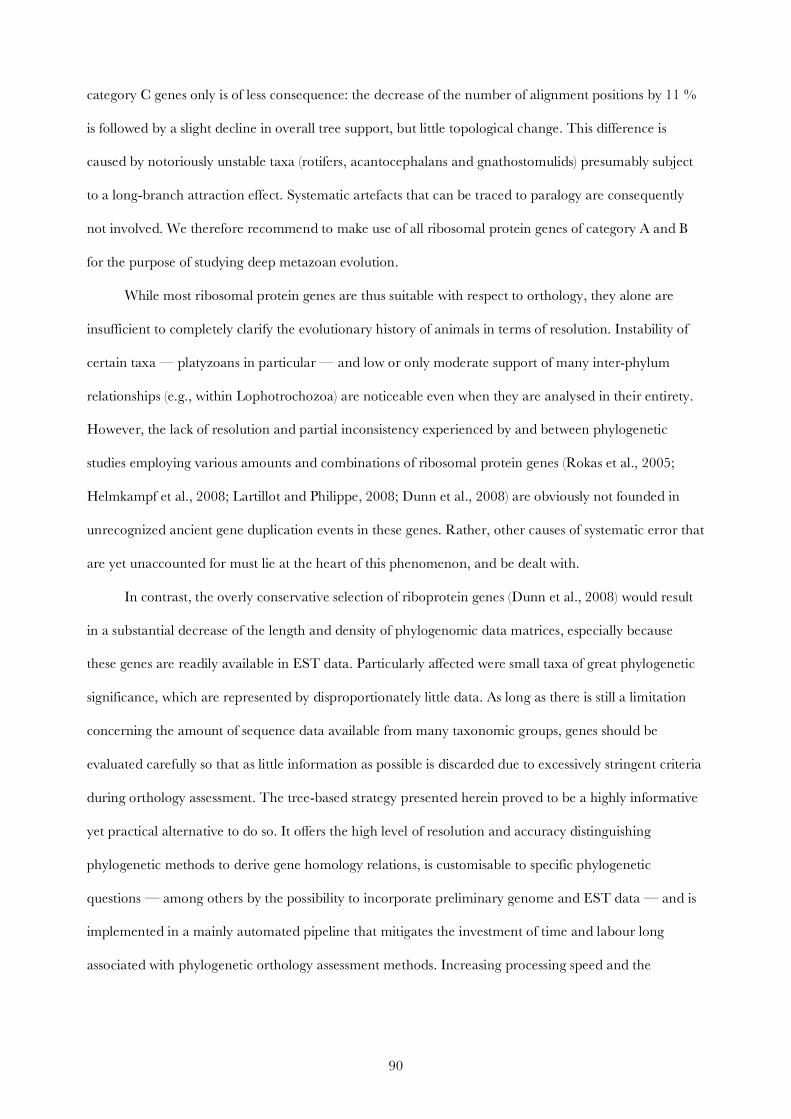
90
category C genes only is of less consequence: the decrease of the number of alignment positions by 11 %
is followed by a slight decline in overall tree support, but little topological change. This difference is
caused by notoriously unstable taxa (rotifers, acantocephalans and gnathostomulids) presumably subject
to a long-branch attraction effect. Systematic artefacts that can be traced to paralogy are consequently
not involved. We therefore recommend to make use of all ribosomal protein genes of category A and B
for the purpose of studying deep metazoan evolution.
While most ribosomal protein genes are thus suitable with respect to orthology, they alone are
insufficient to completely clarify the evolutionary history of animals in terms of resolution. Instability of
certain taxa — platyzoans in particular — and low or only moderate support of many inter-phylum
relationships (e.g., within Lophotrochozoa) are noticeable even when they are analysed in their entirety.
However, the lack of resolution and partial inconsistency experienced by and between phylogenetic
studies employing various amounts and combinations of ribosomal protein genes (Rokas et al., 2005;
Helmkampf et al., 2008; Lartillot and Philippe, 2008; Dunn et al., 2008) are obviously not founded in
unrecognized ancient gene duplication events in these genes. Rather, other causes of systematic error that
are yet unaccounted for must lie at the heart of this phenomenon, and be dealt with.
In contrast, the overly conservative selection of riboprotein genes (Dunn et al., 2008) would result
in a substantial decrease of the length and density of phylogenomic data matrices, especially because
these genes are readily available in EST data. Particularly affected were small taxa of great phylogenetic
significance, which are represented by disproportionately little data. As long as there is still a limitation
concerning the amount of sequence data available from many taxonomic groups, genes should be
evaluated carefully so that as little information as possible is discarded due to excessively stringent criteria
during orthology assessment. The tree-based strategy presented herein proved to be a highly informative
yet practical alternative to do so. It offers the high level of resolution and accuracy distinguishing
phylogenetic methods to derive gene homology relations, is customisable to specific phylogenetic
questions — among others by the possibility to incorporate preliminary genome and EST data — and is
implemented in a mainly automated pipeline that mitigates the investment of time and labour long
associated with phylogenetic orthology assessment methods. Increasing processing speed and the
91
development of more efficient algorithms to infer phylogenetic trees will likely contribute to popularise
tree-based orthology assessment strategies in future phylogenetic studies.
Acknowledgments
We wish to acknowledge Ingo Ebersberger and Sascha Strauss (Center for Integrative Bioinformatics,
Vienna) for writing code used in this pipeline, Olaf Bininda-Emonds (University of Osnabrück) for
adapting batchRAxML.pl to our needs, and Bernhard Lieb and Achim Meyer (University of Mainz) for
providing Barentsia ESTs prior to public release. This study was funded by the research priority program
‘Deep Metazoan Phylogeny’ (DMP) of the German Research Foundation (grant HA 2763/5).
References
Abascal, F., R. Zardoya, and D. Posada. 2005. ProtTest: selection of best-fit models of protein evolution.
Bioinformatics. 21:2104–2105.
Altschul, S. F., T. L. Madden, A. A. Schäffer, J. Zhang, Z. Zhang, W. Miller, and D. J. Lipman.1997.
Gapped BLAST and PSI-BLAST: a new generation of protein database search programs. Nucleic
Acids Res. 25:3389–3402.
Arvestad, L., A. Berglund, J. Lagergren, and B. Sennblad. 2003. Bayesian gene/species tree
reconciliation and orthology analysis using MCMC. Bioinformatics. 19:i7–i15.
Berglund, A., E. Sjölund, G. Östlund, and E. L. L. Sonnhammer. 2007. InParanoid 6: eukaryotic
ortholog clusters with inparalogs. Nucleic Acids Res. 36:D263–D266.
Birney, E., M. Clamp, and R. Durbin. 2004. GeneWise and Genomewise. Genome Res. 14:988–995.
Castresana, J. 2000. Selection of conserved blocks from multiple alignments for their use in phylogenetic
analysis. Mol. Biol. Evol. 17:540–552.
92
Chen, F., A. J. Mackey, J. K. Vermunt, and D. S. Roos. 2007. Assessing performance of orthology
detection strategies applied to eukaryotic genomes. PLsS ONE. 2: e383.
Chiu, J. C., E. K. Lee, M. G. Egan, I. N. Sarkar, G. M. Coruzzi, and R. DeSalle. 2006. OrthologID:
automation of genome-scale ortholog identification within a parsimony framework. Bioinformatics.
22:699–707.
Delsuc, F., H. Brinkmann and H. Philippe. 2005. Phylogenomics and the reconstruction of the tree of
life. Nat. Rev. Genet. 6:361–375.
Dufayard, J.-F., L. Duret, S. Penel, M. Gouy, F. Rechenmann, and G. Perrière. 2005. Tree pattern
matching in phylogenetic trees: automatic search for orthologs or paralogs in homologous gene
sequence databases. Bioinformatics. 21:2596–2603.
Dunn, C., A. Hejnol, D. Q. Matus, K. Pang, W. E. Browne, S. A. Smith, E. Seaver, G. W. Rouse, M.
Obst, G. D. Edgecomb, M. V. Sorensen, S. H. Haddock, A. Schmidt-Rhaesa, A. Okusu, R. M.
Kristensen, W. C. Wheeler, M. Q. Martindale, and G. Giribet. 2008. Broad phylogenomic
sampling improves resolution of the animal tree of life. Nature. 452:745–749.
Dutilh, B. E., V. van Noort, R. T. van der Heijden, T. Boekhout, B. Snel, and M. A. Huynen. 2007.
Assessment of phylogenomic and orthology approaches for phylogenetic inference. Bioinformatics.
23:815–824.
Fitch, W. M. 1970. Distinguishing homologous from analogous proteins. Syst. Zool. 19:99–113.
Felsenstein, J. 1978. Cases in which parsimony or compatibility methods will be positively misleading.
Syst. Zool. 27:401–410.
Felsenstein, J. 1985. Confidence limits on phylogenies: an approach using the bootstrap. Evolution.
39:783–791.
Gabaldon, T. 2008. Large-scale assignment of othology: back to phylogenetics? Genome Biol. 9:235.
93
Hausdorf, B., M. Helmkampf, A. Meyer, A. Witek, H. Herlyn, I. Bruchhaus, T. Hankeln, T. H. Struck,
and B. Lieb. 2007. Spiralian phylogenomics supports the resurrection of Bryozoa comprising
Ectoprocta and Entoprocta. Mol. Biol. Evol. 24:2723–2729.
Helmkampf, M., I. Bruchhaus, and B. Hausdorf. 2008. Phylogenomic analyses of lophophorates
(brachiopods, phoronids and bryozoans) confirm the Lophotrochozoa concept. Proc. R. Soc. B.
275:1927–1933.
Huerta-Cepas J., H. Dopazo, J. Dopazo, and T. Gabaldón. 2007. The human phylome. Genome Biol.
8:R109.
Huerta-Cepas J., A. Bueno, J. Dopazo, and T. Gabaldón. 2008. PhylomeDB: a database for genome-
wide collections of gene phylogenies. Nucleic Acids Res. 36:D491–D496.
Jobb, G., A. von Haeseler, and K. Strimmer. 2004. TREEFINDER: a powerful graphical analysis
environment for molecular phylogenetics. BMC Evol. Biol. 4:18.
Jothi, R., E. Zotenko, A. Tasneem, and T. M. Przytycka. 2006. COCO-CL: hierarchical clustering of
homology relations based on evolutionary correlations. Bioinformatics. 22:779–788.
Katoh, K., K. Misawa, K. Kuma, and T. Miyata. 2002. MAFFT: a novel method for rapid multiple
sequence alignment based on fast Fourier transform. Nucleic Acids Res. 30:3059–3066.
Katoh, K., and H. Toh. 2008. Recent developments in the MAFFT multiple sequence alignment
program. Brief. Bioinform. 9:286–298.
Kellis, M., B. W. Birren and E. S. Lander. 2004. Proof and evolutionary analysis of ancient genome
duplication in the yeast Saccharomyces cerevisiae. Nature. 428: 617–624.
Koonin, E. V. 2005. Orthologs, paralogs, and evolutionary genomics. Annu. Rev. Genet. 39:309–338.
Lartillot, N. and H. Philippe. 2008. Improvement of molecular phylogenetic inference and the phylogeny
of Bilateria. Phil. Trans. R. Soc. B. 363:1463–1472.
94
Le, S. Q., and O. Gascuel. 2008. An improved general amino acid replacement matrix. Mol. Biol. Evol.
25:1307–1320.
Li, H., A. Coghlan, J. Ruan, L. J. Coin, J. K. Hériché, L. Osmotherly, R. Q. Li, T. Liu, Z. Zhang, L.
Bolund, G. K. Wong, W. Zheng, P. Dehal, J. Wang, and R. Durbin. 2006. TreeFam: a curated
database of phylogenetic trees of animal gene families. Nucleic Acids Res. 34:D572–D580.
Li, L., C. J. Jr. Stoeckert, and D. S. Ross. 2003. OrthoMCL: identification of ortholog groups for
eukaryotic genomes. Genome Res. 13:2178–2189.
Morris, J., P. Ladurner, R. Rieger, D. Pfister, M. Del Mar De Miguel-Bonet, D. Jacobs, and V.
Hartenstein. The Macrostomum lignano EST database as a molecular resource for studying
platyhelminth development and phylogeny. Dev. Genes Evol. 216:695–707.
Ohno, S. 1970. Evolution by gene duplication. Springer, New York
Page, R. D., and M. A. Charleston. 1997. From gene to organismal phylogeny: reconciled trees and the
gene tree/species tree problem. Mol. Phylogenet. Evol. 7:231–240.
Remm, M., C. E. Storm, and E. L. Sonnhammer. 2001. Automatic clustering of orthologs and in-
paralogs from pairwise species comparisons. J. Mol. Biol. 314:1041–1052.
Rokas, A., D. Krüger, and S. B. Carroll. 2005. Animal evolution and the molecular signature of
radiations compressed in time. Science. 310:1933–1938
Ruan, J., H. Li, Z. Z. Chen, A. Coghlan, L. J. Coin, Y. Guo, J. K. Heriche, Y. F. Hu, K. Kristiansen, R.
Li, T. Liu, A. Moses, J. Qin, S. Vang, A. J. Vilella, A. Ureta-Vidal, L. Bolund, J. Wang, and R.
Durbin. 2008. TreeFam: 2008 update. Nucleic Acids Res. 36:D735–D740.
Sayers, E. W., T. Barrett, D. A. Benson, S. H. Bryant, K. Canese, V. Chetvernin, D. M. Church, M.
DiCuccio, R. Edgar, S. Ferderhen, et al. 2009. Database resources of the National Center for
Biotechnology Information. Nucleic Acids Res. 37:D5–D15.
95
Stamatakis, A. 2006. RAxML-VI-HPC: Maximum likelihood-based phylogenetic analyses with
thousands of taxa and mixed models. Bioinformatics. 22:2688–2690.
Stamatakis, A., P. Hoover, and J. Rougemont. 2008. A rapid boostrap algorithm for the RAxML web
servers. Syst. Biol. 57:758–771.
Sonnhammer, E. L., and E. V. Koonin. 2002. Orthology, paralogy and proposed classification for
paralog subtypes. Trends Genet. 18:619–620.
Storm, C. E., and E. L. Sonnhammer. 2002. Automated ortholog inference from phylogenetic trees and
calculation of orthology reliability. Bioinformatics. 18:92–99.
Tatusov R. L., E. V. Koonin, and D. J. Lipman. 1997. A genomic perspective on protein families.
Science. 278:631–637.
Tatusov, R. L., N. D. Fedorova, J. D. Jackson, A. R. Jacobs, B. Kiryutin, E. V. Koonin, D. M. Krylov,
R. Mazumder, S. L. Mekhedov, A. N. Nikolskaya, B. S. Rao, S. Smirnov, Al V. Sverdlov, S.
Vasudevan, Y. I. Wolf, J. J. Yin, and D. A. Natale. 2003. The COG database: an updated version
includes eukaryotes. BMC Bioinformatics. 4:41.
Van der Heijden, R. T. J. M., B. Snel, V. van Noort, and M. A. Huynen. 2007. Orthology prediction at
scalable resolution by phylogenetic tree analysis. BMC Bioinformatics. 8:83.
Vanin, E. F. 1985. Processed pseudogenes – characteristics and evolution. Annu. Rev. Genet. 79:253–
272.
Wall, D. P., H. B. Fraser, and A. E. Hirsh. 2003. Detecting putative orthologs. Bioinformatics. 19:1710–
1711.
Wool, I. G., Y.-L. Chan, and A. Glück. 1995. Structure and evolution of mammalian ribosomal proteins.
Biochem. Cell Biol. 73:933–947.
Wapinski, I., A. Pfeffer, N. Friedman, and A. Regev. 2007. Automatic genome-wide reconstruction of
phylogenetic gene trees. Bioinformatics. 23:i549–i558.

96
Zhang, Z., P. Harrison, and M. Gerstein. 2002. Identification and analysis of over 2000 ribosomal
pseudogenes in the human genome. Genome Res. 12:1466–1482.
Zmasek, C. M. and S. R. Eddy. 2001. A simple algorithm to infer gene duplication and speciation events
on a gene tree. Bioinformatics. 17:821–828.
Zmasek, C. M. and S. R. Eddy. 2002. RIO: Analyzing proteomes by automated phylgenomics using
resampled inference of orthologs. BMC Bioinformatics. 3:14.
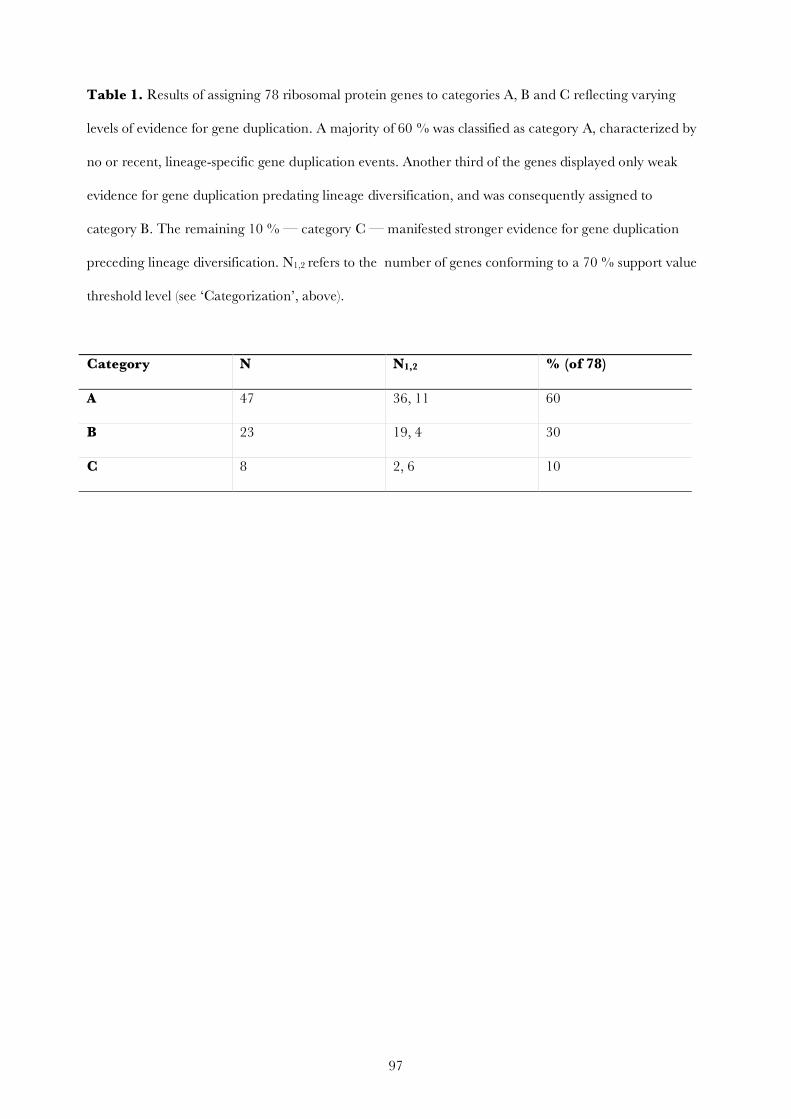
97
Table 1. Results of assigning 78 ribosomal protein genes to categories A, B and C reflecting varying
levels of evidence for gene duplication. A majority of 60 % was classified as category A, characterized by
no or recent, lineage-specific gene duplication events. Another third of the genes displayed only weak
evidence for gene duplication predating lineage diversification, and was consequently assigned to
category B. The remaining 10 % — category C — manifested stronger evidence for gene duplication
preceding lineage diversification. N1,2 refers to the number of genes conforming to a 70 % support value
threshold level (see ‘Categorization’, above).
Category N N1,2 % (of 78)
A 47 36, 11 60
B 23 19, 4 30
C 8 2, 6 10
98
Figure captions
Figure 1. Flow chart depicting the process used to evaluate gene homology relations. Initially, homologs
of predefined query sequences are retrieved from a database and sorted into gene clusters (1). A gene tree
is subsequently reconstructed for each gene cluster employing advanced inference techniques (2). Finally,
each gene tree is inspected visually and assigned to one of three categories representing varying degrees
of evidence for gene duplication, depending on the incidence and extent of species overlap (3).
Embedded software and other essential work steps are listed at the right of each column.
Figure 2. Gene trees illustrating the three categories established to classify genes according to varying
levels of evidence for gene duplication preceding lineage diversification. Category A genes like rpl6 are
characterized by the absence of species overlap, indicating that gene duplications did not occur at all or
only recently within lineages represented in this study. In contrast, single or multiple species overlap is
observable in genes assigned to categories B (rpl10a) and C (rpl24), respectively. Overlapping species, i.e.,
species represented by several sequences not forming monophyletic groups, are indicated by an arrow.
Species overlap may be due to recently duplicated yet highly diverging sequences — which appears most
likely in singular cases exhibiting long branches — or to gene duplications ancestral to some or all
represented lineages, thus causing paralogy that interferes with phylogenetic reconstruction. Vertical bars
at the edges of the best maximum likelihood trees shown here denote rapid bootstrap support values
above 70 % (one bar) or 95 % (two bars) obtained from RAxML.
Figure 3. Part of the gene tree of ef1α1 highlighting a topological pattern likely caused by a gene
duplication predating lineage diversification. Sequences of all major eumetazoan groups including
Cnidaria are sorted into clades that display nearly complete species overlap. This indicates that multiple
rounds of gene duplication occurred before the splitting of these groups, and demonstrates that the tree-
based orthology assessment approach presented here is capable of detecting this problematic type of gene
history. In ribosomal protein genes, a similar pattern was never found. Vertical bars at the edges of the
best maximum likelihood tree shown here denote rapid bootstrap support values above 70 % (one bar) or
95 % (two bars) obtained from RAxML.

99
Figure 4. Maximum likelihood tree of 62 metazoan taxa based on all 70 ribosomal protein genes assigned
to category A or B. Topology and support values differ only slightly from the tree obtained from all
ribosomal protein genes of all categories, further demonstrating that these genes are generally suitable to
phylogenetic reconstruction of Bilateria with respect to paralogy. Numbers at the nodes denote bootstrap
support values calculated by Treefinder (100 replications), corresponding to analyses based on all genes
(first number), category A and B genes (second number), and category A genes only (third number).
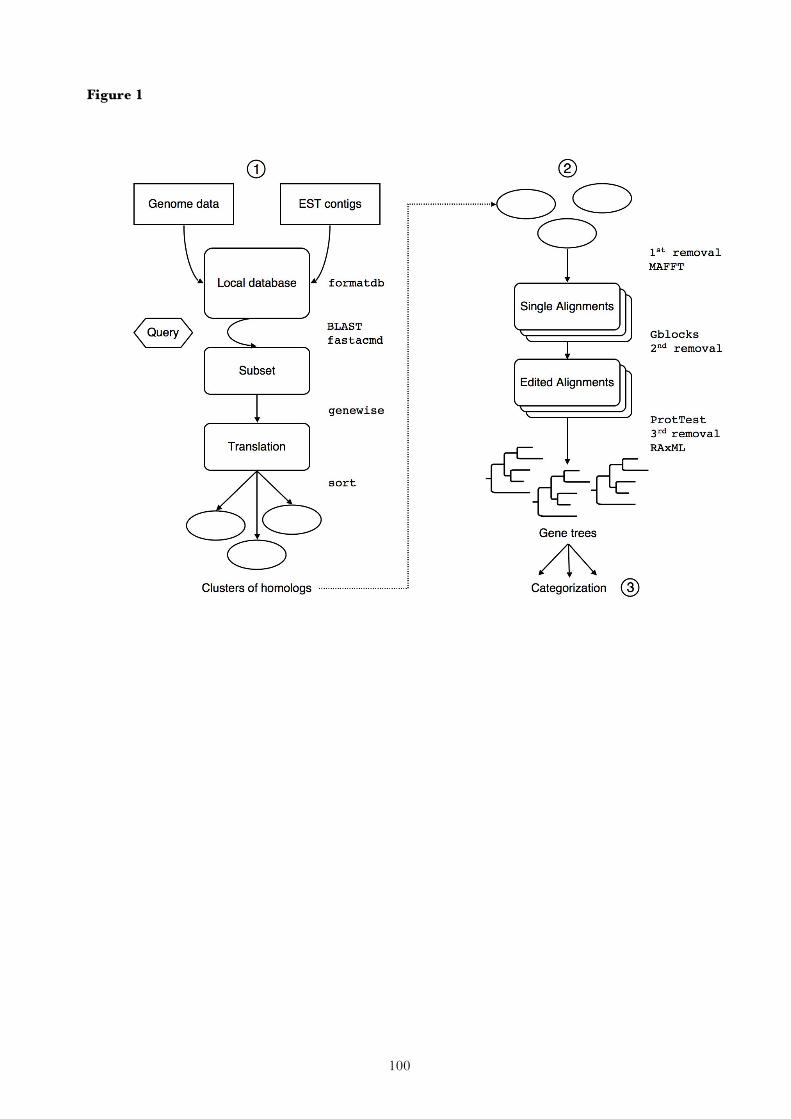
100
Figure 1
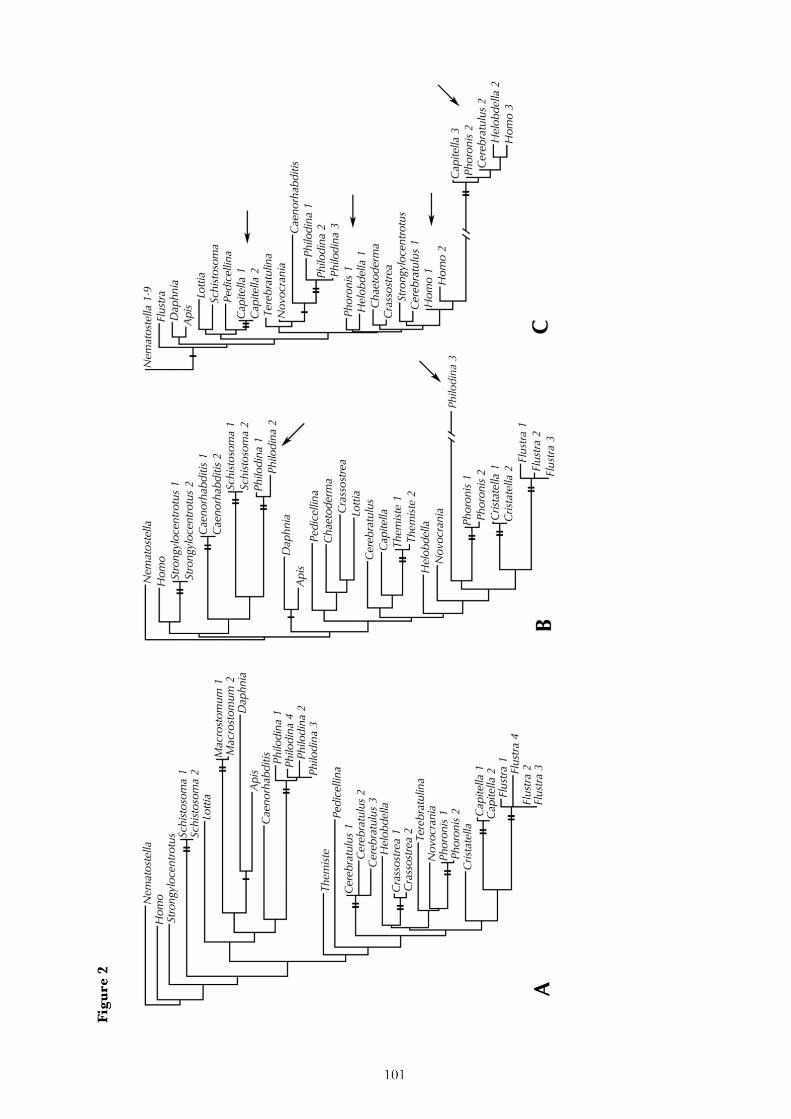
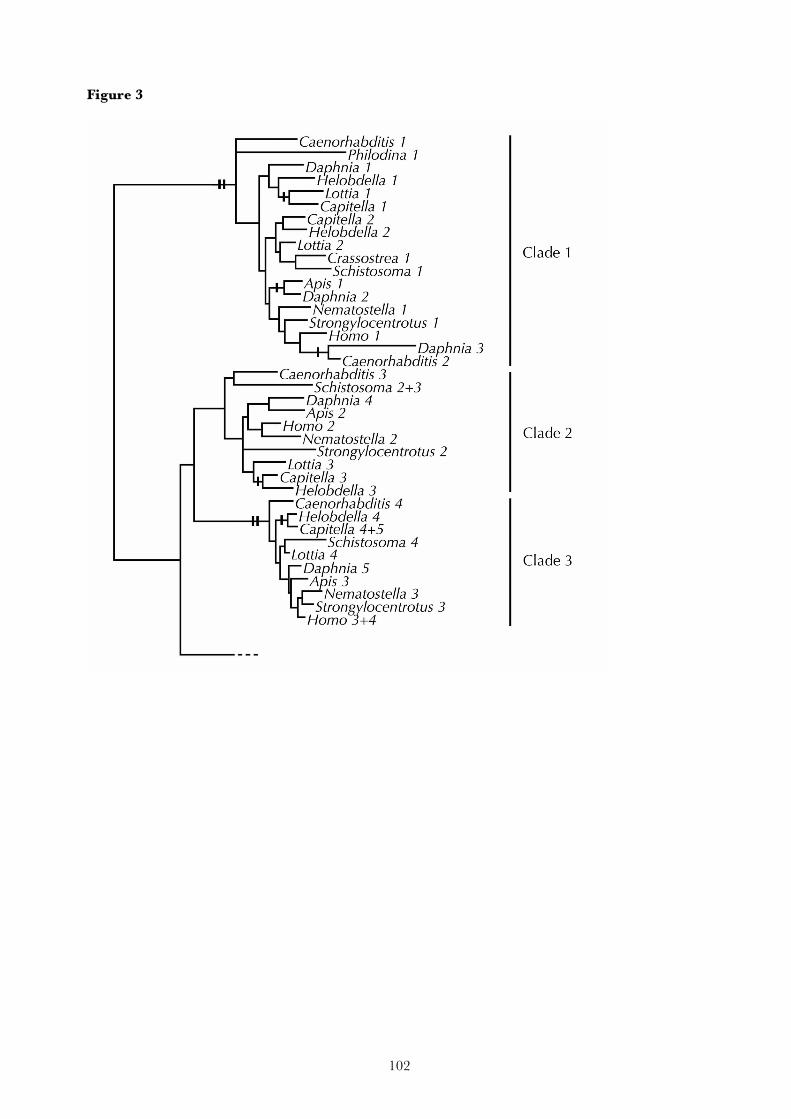
102
Figure 3
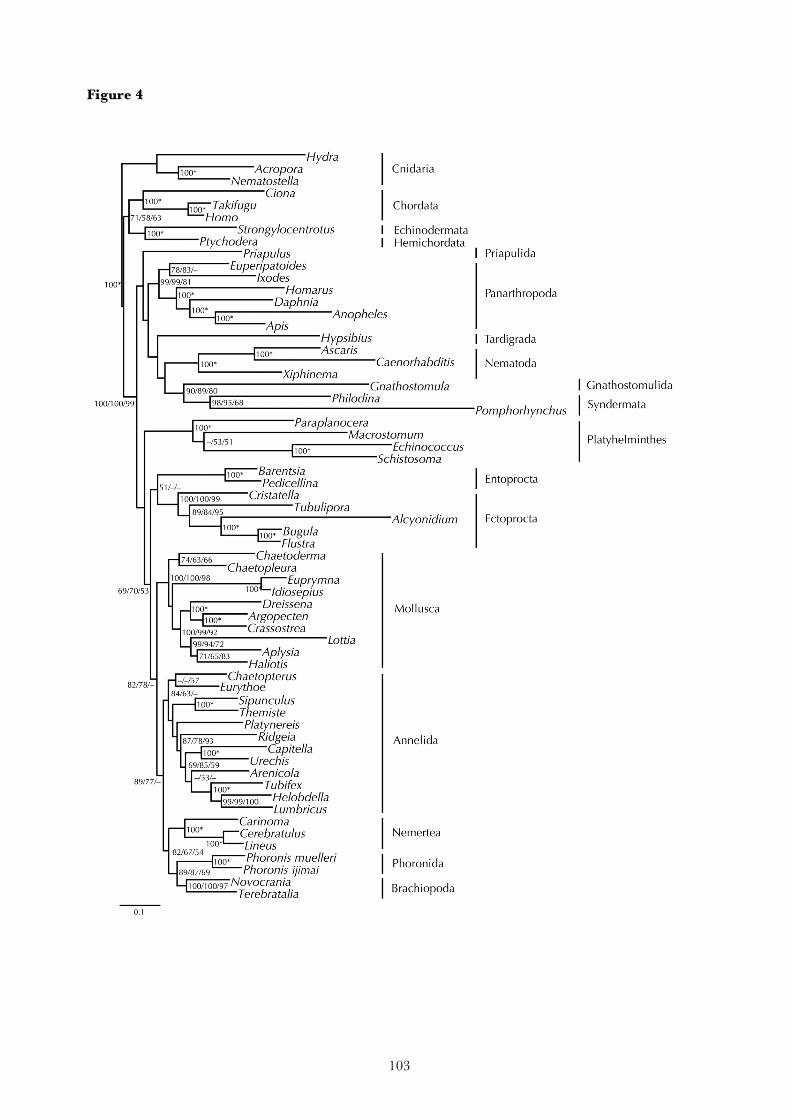
103
Figure 4
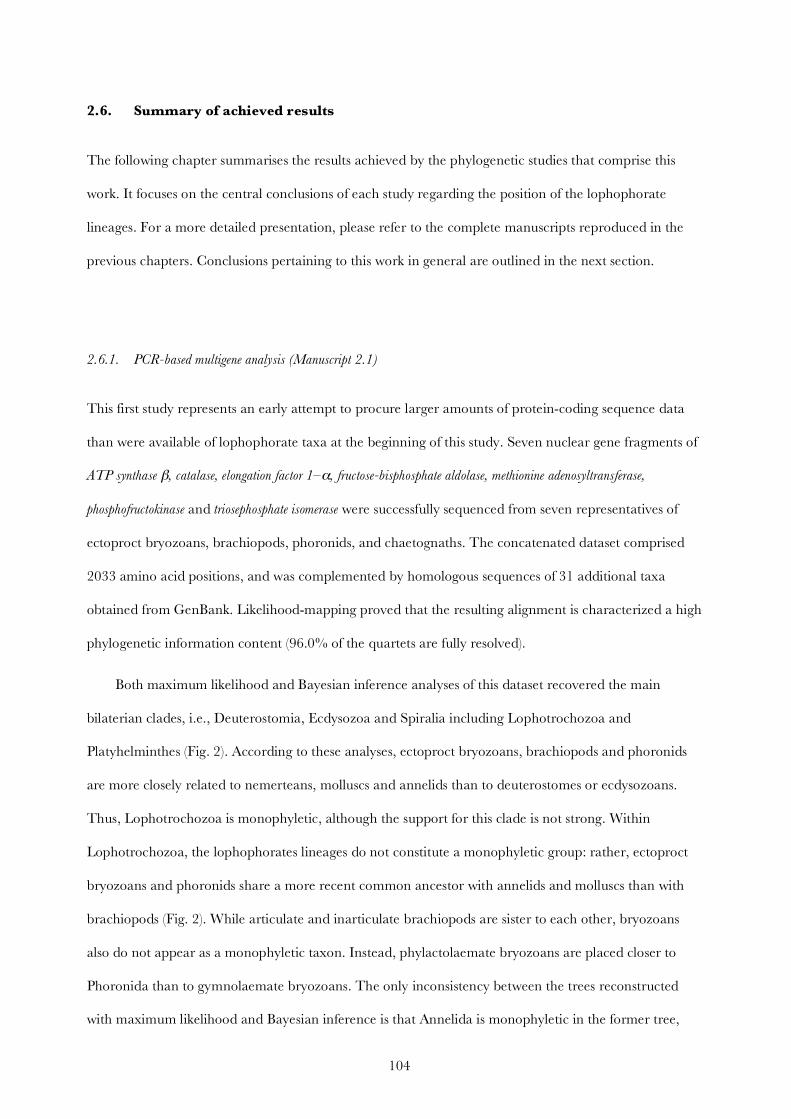
104
2.6. Summary of achieved results
The following chapter summarises the results achieved by the phylogenetic studies that comprise this
work. It focuses on the central conclusions of each study regarding the position of the lophophorate
lineages. For a more detailed presentation, please refer to the complete manuscripts reproduced in the
previous chapters. Conclusions pertaining to this work in general are outlined in the next section.
2.6.1. PCR-based multigene analysis (Manuscript 2.1)
This first study represents an early attempt to procure larger amounts of protein-coding sequence data
than were available of lophophorate taxa at the beginning of this study. Seven nuclear gene fragments of
ATP synthase β, catalase, elongation factor 1–α, fructose-bisphosphate aldolase, methionine adenosyltransferase,
phosphofructokinase and triosephosphate isomerase were successfully sequenced from seven representatives of
ectoproct bryozoans, brachiopods, phoronids, and chaetognaths. The concatenated dataset comprised
2033 amino acid positions, and was complemented by homologous sequences of 31 additional taxa
obtained from GenBank. Likelihood-mapping proved that the resulting alignment is characterized a high
phylogenetic information content (96.0% of the quartets are fully resolved).
Both maximum likelihood and Bayesian inference analyses of this dataset recovered the main
bilaterian clades, i.e., Deuterostomia, Ecdysozoa and Spiralia including Lophotrochozoa and
Platyhelminthes (Fig. 2). According to these analyses, ectoproct bryozoans, brachiopods and phoronids
are more closely related to nemerteans, molluscs and annelids than to deuterostomes or ecdysozoans.
Thus, Lophotrochozoa is monophyletic, although the support for this clade is not strong. Within
Lophotrochozoa, the lophophorates lineages do not constitute a monophyletic group: rather, ectoproct
bryozoans and phoronids share a more recent common ancestor with annelids and molluscs than with
brachiopods (Fig. 2). While articulate and inarticulate brachiopods are sister to each other, bryozoans
also do not appear as a monophyletic taxon. Instead, phylactolaemate bryozoans are placed closer to
Phoronida than to gymnolaemate bryozoans. The only inconsistency between the trees reconstructed
with maximum likelihood and Bayesian inference is that Annelida is monophyletic in the former tree,
105
whereas it is paraphyletic with respect to Phoronida and phylactolaemate Bryozoa in the latter
reconstruction.
Several disputed hypotheses, among others that lophophorates are more closely related to
Deuterostomia than to Protostomia, that it is monophyletic, and that Bryozoa is sister to Spiralia plus
Ecdysozoa could be significantly rejected with both the approximately unbiased test and the expected
likelihood weights method. The monophyly of the segmented phyla, Annelida plus Arthropoda, i.e., the
Articulata hypothesis, and the monophyly of Neotrochozoa including Annelida and Mollusca, have also
been significantly excluded with both tests. All other tested phylogenetic hypotheses could not be ruled
out with the approximately unbiased test. However, the expected likelihood weights method did reject
hypotheses stating the monophyly of Phoronozoa (Brachiopoda plus Phoronida, also known as
Brachiozoa), and a sister group relationship between Phoronozoa and Mollusca.
Thus, the results based on the present multigene dataset disagree with the traditional perspective based
on embryological and morphological characters that the lophophorate lineages, i.e., Bryozoa,
Brachiopoda, and Phoronida, form the sister group or the paraphyletic stem group of Deuterostomia (Ax,
1995; Lüter and Bartolomaeus, 1997; Brusca and Brusca, 2003). Instead, the analyses support the
Lophotrochozoa concept. Even though the support for this clade is not strong, this corroborates studies
based on rDNA (Halanych et al., 1995; Peterson and Eernisse, 2001; Mallatt and Winchell, 2002;
Passamaneck and Halanych, 2006), hox genes (de Rosa et al., 1999; Passamaneck and Halanych, 2004),
myosin (Ruiz-Trillo et al., 2002), ATPase (Anderson et al., 2004) and mitochondrial protein sequences
(Stechmann and Schlegel, 1999; Helfenbein and Boore, 2004; Waeschenbach et al., 2006). As most of
these studies also have shown before, the multigene analyses presented here further indicate that
Lophophorata is not a valid monophyletic taxon, suggesting that lophophore structures originated several
times independently during animal evolution. In contrast to many previous investigations (e.g., Cohen,
2000; Giribet et al., 2000; Peterson and Eernisse, 2001; Anderson et al., 2004; but see Ruiz-Trillo et al.,
2002; Passamaneck and Halanych, 2006), Phoronozoa (=Brachiozoa) was not recovered, and neither was
the monophyly of ectoproct bryozoans. However, the support for the responsible clade that includes
phylactolaemate bryozoans and phoronids is not strong and the monophyly of bryozoans could not be
106
rejected by topological tests. The phylogenetic position of the lophophorate lineages within
Lophotrochozoa proved to be difficult to assess more reliably, reflected by weak support values within the
trees, and lack of statistical significance of the topology tests. Although, for instance, the hypothesis that
Bryozoa is the sister group of Spiralia and Ecdysozoa (Giribet et al., 2000) has been rejected with the
expected likelihood weights method, a sister group relation of Bryozoa and all other Lophotrochozoa (or
Spiralia, according to our trees) as advocated by Halanych et al. (1995) and Halanych (2004) can not be
ruled out according to both topology test methods.
Both maximum likelihood and Bayesian inference analyses indicate that Platyhelminthes do not
belong to Lophotrochozoa, which is defined as the last common ancestor of the three traditional
lophophorate taxa, the molluscs, and the annelids, and all descendants of that ancestor (Halanych et al.,
1995). Assuming that the spiral-quartet cleavage of plathyhelminths is homologous to that of nemerteans,
annelids, and molluscs, the name Spiralia for the clade including platyhelminths (and possibly other
platyzoans) and lophotrochozoans suggests itself (Giribet et al., 2000). However, it cannot be ruled out
that Platyhelminthes indeed belong to Lophotrochozoa, because the topology tests did not reject a
position of the bryozoan lineages as sister to Spiralia. Since platyhelminths are the only representatives of
Platyzoa in this dataset, a denser sampling of Platyzoa is required for more robust conclusions.
Although the data presented here constituted one of the largest molecular datasets with respect to deep
metazoan phylogeny at the date of publication, drawing further conclusions with confidence proved to be
difficult. The lack of resolution provided by this amount of data is reflected by weak support values in the
trees, particularly within Lophotrochozoa, and the statistical insignificance of many tests concerning
alternative topologies. This situation may be remedied by increasing the number of taxa and genes
analysed. Since the most efficient method to do so at the moment includes the sequencing of expressed
sequence tags (ESTs), the following studies rely exclusively on this technique.
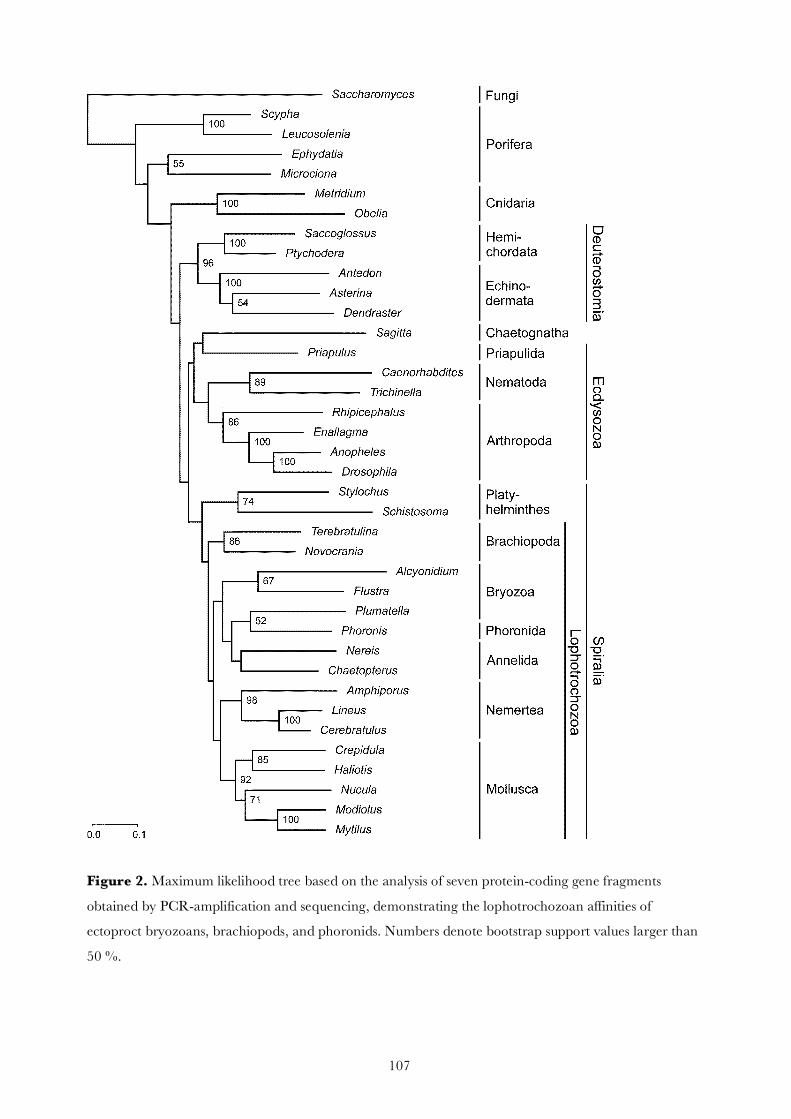
107
Figure 2. Maximum likelihood tree based on the analysis of seven protein-coding gene fragments
obtained by PCR-amplification and sequencing, demonstrating the lophotrochozoan affinities of
ectoproct bryozoans, brachiopods, and phoronids. Numbers denote bootstrap support values larger than
50 %.
108
2.6.2. EST-based phylogenetic analysis of Bryozoa (Manuscript 2.2)
The first study based on genomic-scale data presented in this work includes ESTs of the ectoproct Flustra
foliacea and the entoproct Barentsia elongata. Both phyla were represented for the first time in a
phylogenomic investigation. The analyses were based on 79 ribosomal protein sequences derived from 38
metazoan taxa, and demonstrate for the first time in a molecular study that Bryozoa comprises both
Entoprocta and Ectoprocta in a monophyletic group positioned at the base of Lophotrochozoa (Fig. 3).
This arrangement is supported by strong nodal support values and topology tests. Most alternative
hypotheses concerning the phylogenetic position of ectoprocts and entoprocts can be rejected by topology
tests, including the hypotheses that ectoprocts are related to Deuterostomia, that they are sister to all
remaining Spiralia (Halanych et al., 1995; Halanych, 2004; Passamaneck and Halanych, 2006), and that
they are sister to all other protostomes except chaetognaths (Giribet et al., 2000). With regard to
entoprocts, a sister group relationship between these and Mollusca (Bartolomaeus, 1993; Haszprunar,
1996; Ax, 1999), a neotenic origin of entoprocts from annelids (Emschermann, 1982) and its placement
within Platyzoa (Halanych, 2004; Passamaneck and Halanych, 2006) can be ruled out according to the
expected-likelihood weights test based on this data. However, a sister group relationship between
Entoprocta and Neotrochozoa, which comprises Mollusca, Sipuncula and Annelida (Zrzavý et al., 1998;
Giribet et al., 2000; Peterson and Eernisse, 2001), cannot be significantly rejected. Nonetheless, these
results strongly support the monophyly of Bryozoa in the broader sense, suggesting that this controversial,
century-old hypothesis has to be resurrected.
When first discovered, entoprocts (Kamptozoa) were treated together with the ectoproct bryozoans
because of their sessile life style and ciliated tentacles. Nitsche (1869) pointed to the differences between
the position of the anus and the retractability of the tentacle crowns and proposed the names Entoprocta
and Ectoprocta for the two main groups of bryozoans. Subsequently, the two groups have almost
unanimously been treated as separate higher taxa, mainly based on the differences in cleavage patterns
and body cavities (Hatschek, 1891; Hennig, 1979; Emschermann, 1982; Zrzavý et al., 1998; Ax, 1999;
Giribet et al., 2000; Sørensen et al., 2000; Brusca and Brusca, 2003). Only Nielsen (1971, 2001) and
Cavalier-Smith (1998) maintained the monophyly of Bryozoa in the broader sense.
109
Ectoprocts have been included in Lophophorata based on similarities of the tentacular apparatus
and the radial cleavage they share with phoronids and brachiopods. As discussed earlier, this taxon was
traditionally considered the sister or paraphyletic stem group of Deuterostomia (Hennig, 1979; Ax, 1995;
Brusca and Brusca, 2003). In contrast, studies based on various molecular markers, including rDNA, hox
genes, myosin, atpase, and mitochondrial protein sequences unequivocally showed that Ectoprocta as well
as Phoronida and Brachiopoda are more closely related to Annelida, Mollusca and allies than to
Deuterostomia or Ecdysozoa (Halanych et al., 1995; Peterson and Eernisse, 2001; Mallatt and Winchell,
2002; Ruiz-Trillo et al., 2002; Anderson et al., 2004; Passamaneck and Halanych, 2004; Passamaneck
and Halanych, 2006; Waeschenbach et al., 2006), leading to the establishment of Lophotrochozoa
(Halanych et al., 1995). Some of these studies further demonstrated that Lophophorata is polyphyletic
(Halanych et al. 1995; Mackey et al. 1996; Giribet et al. 2000; Passamaneck and Halanych 2006).
On the other hand, since entoprocts exhibit spiral cleavage and trochophora-type larvae, a closer
connection to taxa also displaying these features was assumed (Ax, 1995, 1999; Zrzavý et al., 1998;
Giribet et al., 2000; Peterson and Eernisse, 2001). Molecular phylogenetic analyses of 18S rDNA
generally confirmed the affiliation of entoprocts with taxa possessing trochophora larvae, but their exact
relationships remained contentious (e.g., Mackey et al., 1996; Giribet et al., 2000; Peterson and Eernisse,
2001). However, so far all analyses of rDNA sequences did support the assumption that ectoprocts and
entoprocts do not constitute sister taxa (Mackey et al., 1996; Zrzavý et al., 1998; Giribet et al., 2000;
Peterson and Eernisse, 2001; Passamaneck and Halanych, 2006).
These results are now clearly called into question by the reestablishment of Bryozoa in the broader
sense proposed by the present study, the first employing large amounts of protein-coding genes that
include both taxa. Because morphological data (Funch and Kristensen, 1995; Zrzavý et al., 1998;
Sørensen et al., 2000) and rDNA sequences (Passamaneck and Halanych, 2006) indicate that Entoprocta
and Cycliophora are sister groups, the latter should be included in Bryozoa as well (as has been done by
Cavalier-Smith, 1998), even though genomic data for Cycliophora is unfortunately still missing.
Further, the analyses strongly support the clade Syndermata, formed by Rotifera and Acanthocephala
(Fig. 3). This taxon has been established on the basis of morphological evidence (Ahlrichs, 1995a, b,
110
1997) and has been further supported by analyses of 18S rDNA sequences (Garey et al., 1996; Garey and
Schmidt-Rhaesa, 1998; Zrzavý et al., 1998; Giribet et al., 2000). The position of Platyhelminthes remains
ambiguous: while the Bayesian inference analysis favours a sister-group position to Neotrochozoa,
maximum likelihood methodology places Platyhelminthes next to Syndermata. The latter confirms the
Platyzoa hypothesis. Platyzoa comprise Platyhelminthes, Syndermata, Gastrotricha and
Gnathostomulida (Garey & Schmidt-Rhaesa, 1998; Cavalier-Smith, 1998; Giribet et al., 2000) and has
first been hypothesized by Ahlrichs (1995a) based on sperm morphology. Previously, Platyzoa was either
corroborated (Giribet et al., 2000; Passamaneck and Halanych, 2006) or contradicted (Zrzavý et al.,
1998; Peterson and Eernisse, 2001) by rDNA and total evidence analyses. The lack of a robust resolution
of the phylogenetic relationships of Platyhelminthes within Spiralia despite the large available dataset is
probably due to increased substitution rates in Platyhelminthes and Syndermata causing long-branch
attraction artefacts. However, the Eubilateria hypothesis (Hennig, 1979) can clearly be rejected by
topology testing. According to this hypothesis, Platyhelminthes, which do not have an anus, are
considered to be the sister group of all other Bilateria possessing a one-way gut and an anus. Because
Bryozoa is more closely related to Neotrochozoa than to Syndermata in the present analyses,
syndermatans (and platyhelminths, depending on the inference method) are not lophotrochozoans
according to the node-based definition of this clade (Halanych et al., 1995), even though to further
substantiate this conclusion genomic data of Phoronida and Brachiopoda are necessary. For the clade
including Lophotrochozoa, Platyhelminthes and Syndermata, some authors have used the name Spiralia
(Garey & Schmidt-Rhaesa, 1998; Giribet et al., 2000). This usage seems adequate, because spiral quartet
cleavage might be an autapomorphy of that taxon (see below).
Cleavage pattern was often considered a key character for the reconstruction of metazoan phylogeny.
Typical spiral quartet cleavage with mesoderm formation by the 4d mesoteloblast or one of its daughter
cells (Sørensen et al., 2000; Nielsen, 2001) is known from several lophotrochozoan groups (Mollusca,
Annelida, Nemertea, Entoprocta), Platyhelminthes, and Gnathostomulida. If this character state is
mapped on the tree (Fig. 3), considering the close relationship of Syndermata to Gnathostomulida
discussed above, it turns out to be a possible autapomorphy of the clade including Syndermata,
111
Platyhelminthes and Lophotrochozoa. For this clade, the name Spiralia lends itself, even though spiral
cleavage must have been secondarily modified several times within this group (e.g., in Syndermata,
Neoophora, Ectoprocta, Brachiopoda, Cephalopoda). The sister group relation of ectoprocts and
entoprocts demonstrates that the transition from spiral to radial cleavage can happen within a clade
without any transitional stages being preserved. After all, the different cleavage types were one of the
main reasons that the two taxa were classified in different major groups for more than a century. Often
coelomic cavities were considered an autapomorphy of a clade Coelomata (Hennig, 1979; Philip et al.,
2005). If the coelomic cavities of lophotrochozoans are considered homologous to those of deuterostomes
and to the small coelomic cavities present in some ecdysozoans, the tree would indicate a frequent
reduction of coelomic cavities in several bilaterian lineages (e.g., in chaetognaths, priapulids, nematodes,
platyzoans, entoprocts). However, the varying developmental origin of coelomic cavities in the different
bilaterian lineages cast doubts on the homology of the coelom across bilaterians (Nielsen, 2001). The
results presented herein therefore indicate that several of the supposed key characters of animal
phylogeny such as cleavage pattern and coelomic cavities are subject to greater evolutionary plasticity
previously thought.
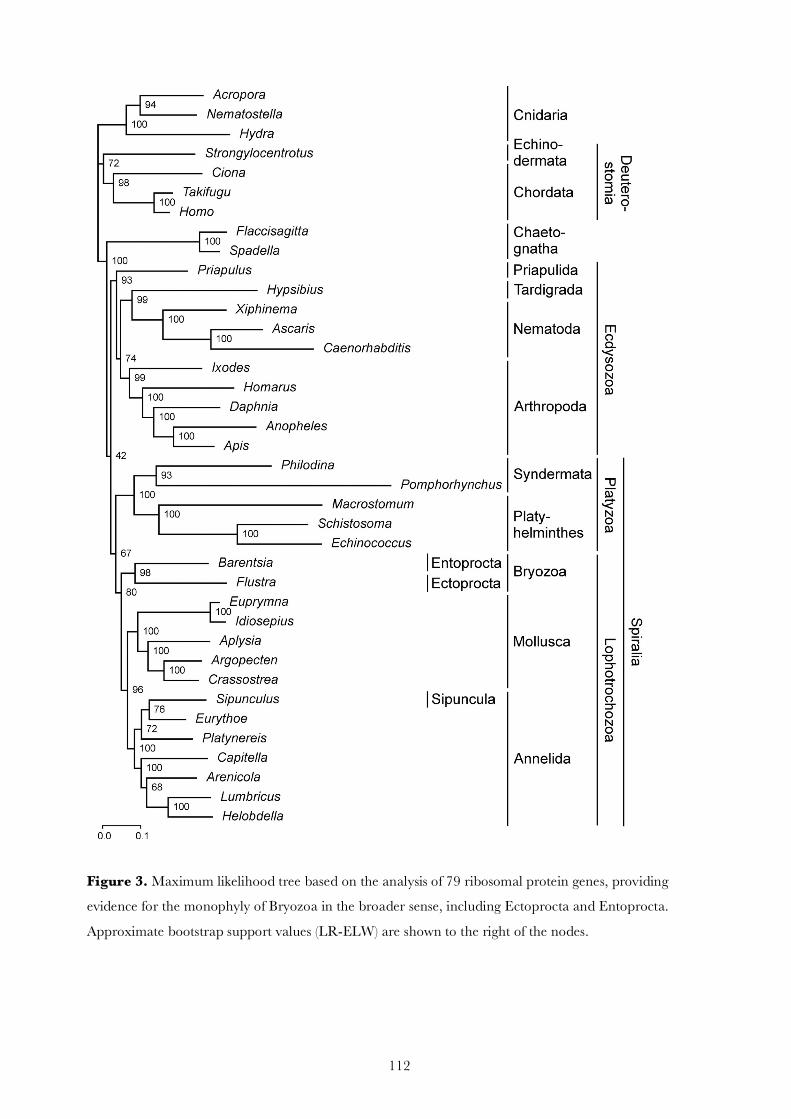
112
Figure 3. Maximum likelihood tree based on the analysis of 79 ribosomal protein genes, providing
evidence for the monophyly of Bryozoa in the broader sense, including Ectoprocta and Entoprocta.
Approximate bootstrap support values (LR-ELW) are shown to the right of the nodes.
113
2.6.3. EST-based phylogenetic analysis of Brachiopoda and Phoronida (Manuscript 2.3)
By including EST data of a brachiopod (Novocrania anomala) and a phoronid (Phoronis muelleri), the validity
of the Lophotrochozoa concept and the monophyly of the lophophorate lineages could be investigated
for the first time by genomic-scale data. The results of maximum-likelihood as well as Bayesian analyses,
based on concatenated sequences of 79 ribosomal proteins encompassing 11,445 amino acid positions
from 39 taxa, demonstrate that the three lophophorate lineages Ectoprocta, Brachiopoda and Phoronida
are more closely related to trochozoan phyla than to deuterostomes. In addition, they do not form a
monophyletic group (Fig. 4). Thus, the analyses confirm the results previously obtained by the smaller
multigene dataset (see above).
Characters that were traditionally used to unite Lophophorata with deuterostomes include a body
organization with three distinct coelomic cavities, namely protocoel, mesocoel and metacoel (archimery,
Siewing, 1980), a mesosomal tentacular apparatus, entomesoderm derived from the archenteron by
enterocoely, larvae with upstream-collecting ciliary bands and heterogeneously assembled metanephridia
(Hennig, 1979; Ax, 1995; Lüter and Bartolomaeus, 1997; Sørensen et al., 2000; Brusca and Brusca,
2003). However, the hypothesis that all lophophorate lineages are more closely allied to Deuterostomia
than to Protostomia can be rejected by topology tests based on the present ribosomal protein data.
Nielsen (2001) argued that ectoprocts show no trace of archimery and that only Brachiopoda and
Phoronida form a monophyletic group with Deuterostomia sensu stricto. Lüter (2000) suggested that the
origin of the coelomic anlage from differentiated archenteral epithelium, which he defined as
enterocoely, is a synapomorphy of Brachiopoda and Deuterostomia; he therefore considered these two
taxa as sister-groups. Consequently, the hypotheses that Brachiozoa or Brachiopoda alone are the sister-
group of Deuterostomia were tested, and both possibilities were rejected.
The conflicting results concerning the phylogenetic relationships of the lophophorates is a major
incongruity between morphological and molecular phylogenetic approaches. However, in the last decade
the morphological evidence for a close relationship between the lophophorate groups and the
deuterostomes has become weaker by careful re-examinations of the characters. It has been shown that
neither brachiopods nor phoronids possess three coelomic cavities, because a protocoel is lacking in all
114
lophophorate groups (Lüter, 2000; Bartolomaeus, 2001). Thus, the archicoelomate concept (Siewing,
1980) uniting Lophophorata and Deuterostomia, founded on the similarities of three distinct coelomic
cavities, lost its basis. Additionally, the finding that Pterobranchia may nest within the enteropneusts (e.g.,
Peterson and Eernisse, 2001) suggests that the ancestral deuterostome more closely resembled a mobile
worm-like enteropneust than a sessile colonial pterobranch. This means that the similar tentacular
feeding structures of lophophorates and pterobranchs are not a synapomorphy of lophophorates and
deuterostomes as supposed previously (Hennig, 1979; Ax, 1995; Lüter and Bartolomaeus, 1997), but
evolved independently as convergent adaptations to the sessile lifestyle (Halanych, 1996). Moreover,
Lüter (2000) argued that the mesoderm does not originate by enterocoely in Ectoprocta and Phoronida,
but that this is the case in Brachiopoda and Deuterostomia only. What is more, whether the mesoderm of
brachiopods originates by enterocoely is also in dispute. Jenner (2004) tentatively concluded that reports
of true enterocoely, i.e., mesoderm origin by epithelial folding, in brachiopods appear unsupported and
that no fundamental difference in the source of mesoderm and mode of coelomogenesis exists between
brachiopods and various protostomes. Thus, there are fewer morphological characters arguing against
protostome affiliations of brachiopods and phoronids than traditionally assumed.
The phylogenetic analyses discussed here further indicate that Brachiopoda and Phoronida constitute a
monophyletic group, Brachiozoa (= Phoronozoa) (Fig. 4). This corroborates previous results based on
rDNA (Cohen, 2000; Mallatt and Winchell, 2002; but see Passamaneck and Halanych, 2006), atpase
(Anderson et al., 2004), morphology (Nielsen, 2001), and a combination of morphological and 18S rDNA
datasets (Zrzavý et al., 1998; Giribet et al., 2000; Peterson and Eernisse, 2001). Brachiopods plus
phoronids appear as the sister-group of nemerteans in the maximum-likelihood tree (Fig. 4). In contrast,
the Bayesian inference analysis shows a sister-group relation of Brachiozoa and Eutrochozoa. The
relationships of Brachiozoa within Lophotrochozoa thus remain uncertain. Merely the Conchozoa
hypothesis (Cavalier-Smith, 1998; Mallatt and Winchell, 2002), according to which Brachiozoa is the
sister-group of Mollusca, can be clearly dismissed on the basis of topology tests.
The central findings of the previous study — considered tentative until a phoronid and a
brachiopod could be added to the analysis — were recovered. In particular, Ectoprocta and Entoprocta
115
remain strongly united (Fig. 4). This agrees with the hypothesis that Bryozoa in the broader sense is
monophyletic (Nielsen, 1971, 2001; Cavalier-Smith, 1998). Alternative hypotheses concerning the
phylogenetic position of ectoprocts, namely that they are sister to all other Lophotrochozoa including
Platyzoa, i.e., Platyhelminthes, Syndermata and allies (Halanych et al., 1995; Halanych, 2004;
Passamaneck and Halanych, 2006), or that they are sister to all other protostomes except chaetognaths
(Giribet et al., 2000) were again rejected.
From this follows that the three traditional lophophorate lineages, Ectoprocta, Phoronida, and
Brachiopoda, do not join into a monophyletic clade in this study (Fig. 4). The monophyly of
Lophophorata was rejected with the expected likelihood weights method (but not with the approximately
unbiased test). If the monophyly of Lophophorata is constrained, it becomes the sister-group of
Eutrochozoa (Peterson and Eernisse, 2001) in the resulting maximum-likelihood tree (not shown). In this
tree, Entoprocta is the sister-group of Lophophorata plus Eutrochozoa. Even if this topology should
prove correct, the radial cleavage of Lophophorata would be a secondary modification derived from
spiral cleavage given that the spiral cleavage of Entoprocta is homologous to that of Annelida and
Mollusca. When in contrast the monophyly of Eutrochozoa is enforced, then Brachiozoa and Bryozoa
(including Ecto- and Entoprocta) form a monophyletic group in the resulting maximum-likelihood tree.
This extended version of “Lophophorata” including Entoprocta is part of the confidence set of trees
given the present ribosomal protein dataset, a possibility that is especially interesting, because it is in
better agreement with morphological data than topologies that suggest independent origins of Ectoprocta
and Brachiozoa within Lophotrochozoa. Potential synapomorphies of Brachiozoa and Bryozoa are the
transition to a sessile lifestyle accompanied by the evolution of a horseshoe-shaped, tentacular feeding
apparatus and a hydrostatic skeleton consisting of a lophophore coelom and a trunk coelom. In this view,
both coelomic cavities were connected in the common ancestor of the two bryozoan subgroups and then
were lost in Entoprocta. Most potential synapomorphies of Brachiozoa and Bryozoa are characters that
were once thought to support a sister-group relationship between Lophophorata and Deuterostomia, but
in light of current evidence that these two groups are unrelated, must have originated by convergence
(see above). Hypotheses that suppose that Ectoprocta and Brachiozoa originated independently of each
116
other from different lophotrochozoan ancestors would require additional convergences of these
characters.
Despite the progress presented here, the resolution achieved is still insufficient to fully reconstruct the
evolutionary history of Lophotrochozoa. This lack of resolution could neither be avoided by the inclusion
of many riboprotein genes and all major lophotrochozoan taxa, nor by the use of the CAT model, which
has been shown often to overcome long branch attraction artefacts when other models fail (Baurain et al.,
2007; Lartillot et al., 2007). The grouping of taxa with the longest branches in the maximum-likelihood
tree (Fig. 4), namely Syndermata and Platyhelminthes, is indeed dissolved in the Bayesian inference
reconstruction calculated with the CAT model. Further systematic errors unaccounted for by current tree
reconstruction methods, aggravated by the presumably rapid radiation of the lophotrochozoan taxa in
the late Precambrian and the limited taxon sampling within many phyla, might be responsible for the
lack of resolution within Lophotrochozoa that has been observed both here and in other studies
(Halanych et al., 1995; Giribet et al., 2000; Peterson and Eernisse, 2001; Mallatt and Winchell, 2002;
Ruiz-Trillo et al., 2002; Anderson et al., 2004, Passamaneck and Halanych, 2006). Promising strategies
to combat these issues include improved taxonomic sampling within lophophorates and other
lophotrochozoans, and taking measures to reduce the impact of systematic error sources. Two of these,
compositional heterogeneity and paralogy, are specifically addressed in the following studies.
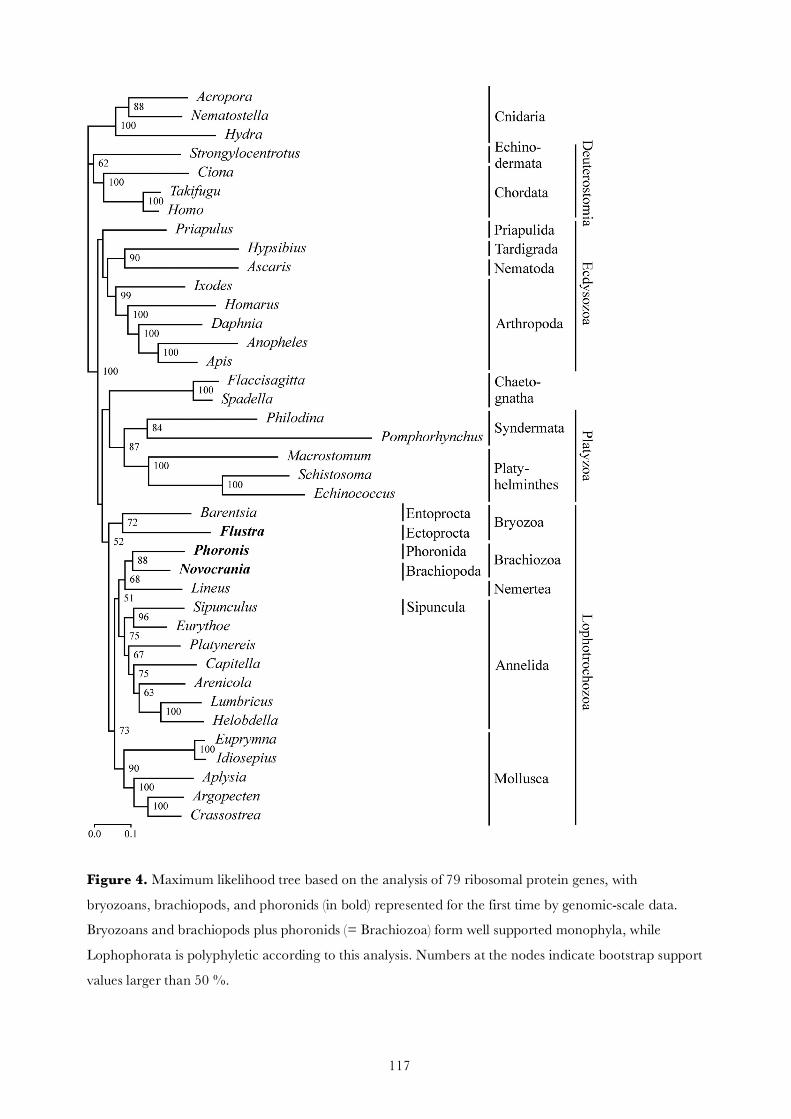
117
Figure 4. Maximum likelihood tree based on the analysis of 79 ribosomal protein genes, with
bryozoans, brachiopods, and phoronids (in bold) represented for the first time by genomic-scale data.
Bryozoans and brachiopods plus phoronids (= Brachiozoa) form well supported monophyla, while
Lophophorata is polyphyletic according to this analysis. Numbers at the nodes indicate bootstrap support
values larger than 50 %.
118
2.6.4. Reduction of compositional heterogeneity (Manuscript 2.4)
For studying the impact of heterogeneity of the amino acid composition across lineages, the previously
used dataset was updated. New taxa were added to account for all lophophorate and entoproct taxa
currently represented by EST data, including two EST datasets conducted for this study (Alcyonidium
diaphanum and Tubulipora sp.). In addition, selected taxa employed previously were substituted by more
slowly evolving species. Maximum likelihood analysis of the resulting dataset derived from 78 ribosomal
protein genes of 48 metazoan taxa recover Brachiopoda and Phoronida are sister groups using an
improved taxon sampling. Also congruent with earlier studies and the most extensive phylogenomic
analysis to date (Dunn et al., 2008), Brachiozoa constitutes a clade with Nemertea. These relationships
were also confirmed by the maximum likelihood analysis with the class frequency mixture model that
adjusts for site-specific amino acid frequencies proposed by Wang et al. (2008). In contrast to previous
results (and Paps et al., 2009), however, Ectoprocta and Entoprocta do not compose a monophylum in
either analysis. Instead, entoprocts appear as sister group of Platyzoa, even though the bootstrap values of
these new groupings are below 50 %. These contradictory results indicate that there might be systematic
errors as a result of model assumption violations either in previous or in the present analyses.
To evaluate one possible cause of systematic error that may have plagued previous analyses, the
amino acid composition of the new dataset was examined: a total of 53.7% of the sequence pairs of the
48 taxa represented showed indeed significantly dissimilar amino acid compositions according to the
disparity index test (Kumar and Gadagkar, 2001a,b). This confirms the observation of Lartillot and
Philippe (2008) that the assumption of a time-homogeneous amino acid replacement process made by
conventional protein models is strongly violated in metazoan phylogenomic data and, thus, there is a risk
of observing artefacts related to compositional bias. Three approaches to reduce the potential impact of
dissimilar amino acid compositions on the phylogenetic investigation of the present dataset were
subsequently attempted:
First, the number of sequence pairs with dissimilar amino acid compositions was reduced by
excluding those species that significantly differ in amino acid composition from more than half of all
examined species. Accordingly, 21 species had to be excluded, among others all representatives of
119
Platyhelminthes and Syndermata. Maximum likelihood analyses of the remaining 27 taxa with a mixed
protein model recovered monophyletic, but weakly supported Bryozoa and also an increased support for
Brachiozoa in comparison to the analysis of the complete dataset.
Secondly, a neighbour-joining tree based on LogDet + Γ distances as modified by Tamura and
Kumar (2002) considering among-site rate variation was constructed. In this tree Bryozoa is also
monophyletic, but not supported in a bootstrap analysis. The support for Brachiozoa increased, though.
However, chaetognaths, platyhelminths, syndermatans and nematodes are clearly subjected to long
branch attraction.
Thirdly, the amino acid sequences were recoded using the six groups of chemically similar amino
acids that tend to replace one another (Dayhoff et al., 1978) to mitigate compositional bias as suggested
by Embley et al. (2003). After recoding, 30.8 % of the pairs of sequences still showed significantly
dissimilar compositions according to the disparity index test. The number of sequence pairs with
dissimilar amino acid compositions was thus reduced again by excluding those species that significantly
differ in amino acid composition from more than half of all examined species. This time, only six taxa
had to be excluded and the reduced 42 taxa dataset still includes representatives of Platyhelminthes and
Syndermata. Phylogenetic analyses of the recoded 42 taxa dataset with a six-state general time-reversible
model (Embley et al., 2003) and considering among-site rate variation confirmed the monophyly of
Bryozoa and Brachiozoa with strong support values (Fig. 5). Despite the loss of information resulting
from using a reduced amino acid alphabet, the support for these groups was higher in this tree than in
those resulting from the first two approaches. Other aspects of the tree were improved as well, including
the recovery of Deuterostomia. This shows that using reduced amino acid alphabets is a more efficient
method for mitigating artefacts in phylogenetic analyses resulting from compositional heterogeneity than
is the simple exclusion of taxa with a divergent amino acid composition or the use of distance methods
based on LogDet distances.
Topology tests of alternative hypotheses focused on the phylogenetic position of ectoprocts and
entoprocts. The hypotheses that ectoprocts are sister to all other Lophotrochozoa including Platyzoa
120
(Halanych et al., 1995; Halanych, 2004; Passamaneck and Halanych, 2006), and that entoprocts belong
to Platyzoa (Halanych, 2004) could be thus rejected. The latter is especially remarkable, because
entoprocts cluster with Platyzoa in the maximum likelihood trees based on the complete amino acid
dataset. The hypothesis that entoprocts are sister to molluscs that has been strongly favoured by
morphological studies (Bartolomaeus, 1993; Haszprunar, 1996; Wanninger et al., 2007; Haszprunar and
Wanninger, 2008) could be rejected by both topology tests with the 42 taxa recoded dataset. Haszprunar
and Wanninger (2008) provided a list of nine potential synapomorphies of entoprocts and molluscs, but
this list is not based on an analysis of a character matrix of these and possibly related phyla like ectoprocts
(such a matrix is actually missing). Haszprunar (1996) conceded that several of these potential
synapomorphies are of low phylogenetic significance. However, it could not yet be excluded that
entoprocts are sister to Eutrochozoa, together forming Trochozoa. The in some respect complementary
hypothesis that Lophophorata is monophyletic (Emig, 1984) could be rejected only by the expected
likelihood weights method with the 42 taxa recoded dataset, and should therefore be considered unlikely
but conceivable. The hypotheses that Brachiopoda is paraphyletic and that phoronids are the sister group
of articulate brachiopods (Halanych et al., 1995; Zrzavý et al., 1998) or inarticulate brachiopods (Cohen
et al., 1998; Cohen, 2000; Cohen and Weydmann, 2005) have been significantly rejected by both
topology tests based on the 27 taxa amino acid dataset. However, none of these hypotheses could be
rejected on the basis of the 42 taxa recoded dataset, and only a sister group relationship of phoronids and
articulate brachiopods could be discarded based on the recoded dataset restricted to Bryozoa and
Brachiozoa. A denser taxon sampling within brachiopods is necessary to clarify the relationships within
Brachiozoa definitively. In other respects the relationships within Lophotrochozoa remain unclear as
well. In the maximum likelihood trees based on the 48 taxa amino acid dataset and the recoded dataset
(Fig. 5) Brachiozoa is sister to Nemertea as in previous analyses and those of Dunn et al. (2008). In
contrast, it is sister to Eutrochozoa including Nemertea, Mollusca and Annelida in the maximum
likelihood trees based on the 27 taxa amino acid dataset, and to Nemertea + Annelida in the neighbour-
joining tree using modified LogDet + Γ distances. Neotrochozoa including Mollusca and Annelida (with
the annelids comprising Sipuncula and Echiura) has been found only in the maximum likelihood analysis
121
with the mixed protein model. Most of these relationships are not strongly supported by bootstrap tests
and none can be rejected by topology tests.
The present study also provided the unprecedented possibility to investigate the internal relationships of
ectoprocts on a phylogenomic scale, as all four recent major groups of Ectoprocta, i.e., Phylactolaemata,
Stenolaemata, Ctenostomata and Cheilostomata were represented by EST data for the first time. The
results presented here (Fig. 5) demonstrate the monophyly of Ectoprocta and a sister group relationship
between Phylactolaemata, the freshwater bryozoans, and the predominantly marine Gymnolaemata (=
Stenolaemata + Ctenostomata + Cheilostomata; as originally defined by Allman, 1856 and used, e.g., by
Ax, 2001). Within Gymnolaemata, Ctenostomata and Cheilostomata form a monophyletic group,
Eurystomata (as proposed by Marcus, 1938; and equivalent to Gymnolaemata as used by Cuffey, 1973
and Fuchs et al., in press). This is corroborated by recent analyses of Fuchs et al. (in press) based on 18S
rDNA, 28S rDNA and COI, which have also shown that neither Ctenostomata nor Cheilostomata is
monophyletic. However, some ctenostomate bryozoans that have not been included in molecular
phylogenetic analyses so far might be the sister group of all other Ctenostomata + Cheilostomata +
Stenolaemata (Alcyonidiidae do obviously not belong to these basal groups, as Alcyonidium clusters here
with the cheilostomatans). Diphyletic Ectoprocta with phylactolaemates forming a clade with recent
phoronids as hypothesized by Mundy et al. (1981) could be significantly rejected by topology tests, as
were most alternative hypotheses concerning ectoproct phylogeny discussed in the literature.
To conclude, the present study explicitly addresses the impact of compositional heterogeneity on
phylogenetic inference, and provides additional support for the central results of the previous studies, i.e.,
the lophotrochozoan affinity of the lophophorate lineages, their polyphyly, the monophyly of
brachiopods plus phoronids, and of Bryozoa in the broader sense, including both ectoprocts and
entoprocts. It also elucidates the internal relationships of ectoprocts. As suggested by Baurain et al.
(2007), improved taxon sampling, replacing fast-evolving species by more slowly evolving species, and
using better models of sequence evolution resulted in a reduction of non-phylogenetic signal and a better
122
resolution of animal phylogeny compared with other analyses (e.g., Rokas et al., 2005). Heterogeneity of
the amino acid composition is a widespread among metazoan taxa, with potentially detrimental effects
on phylogenetic inference. Despite the loss of information involved, recoding amino acids into groups of
functional interchangeability proved to be a more efficient approach to reduce the impact of
compositional bias on phylogenetic analyses than simply excluding taxa with strongly deviating amino
acid composition or employing distance methods based on LogDet distances. Most relationships between
metazoan phyla, however, remained nevertheless and contrary to the expectations raised by Baurain et
al. (2007) poorly supported. Even if the support for some of these relationships might further increase by
sampling additional genes and taxa, the generally low support for the relationships between metazoan
phyla and the short internodes between the phyla still support the conclusion of Rokas et al. (2005) that
many of the phyla originated by a closely spaced series of cladogenetic events. It is conceivable that the
phylogenetic signal of the relatively few amino acid transformations that occurred between these events
in the Precambrian has eroded and been obscured since then by other signals like similarities in amino
acid composition to a degree that too little of this signal is left to resolve lophotrochozoan phylogeny
robustly.
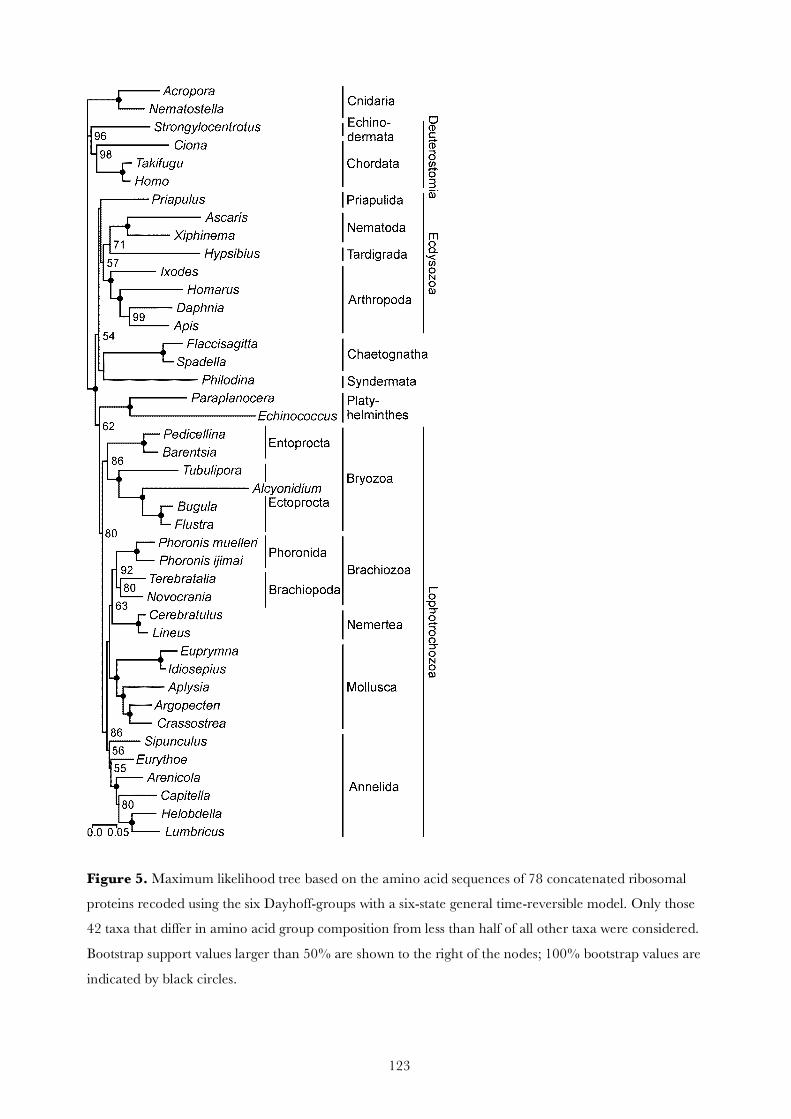
123
Figure 5. Maximum likelihood tree based on the amino acid sequences of 78 concatenated ribosomal
proteins recoded using the six Dayhoff-groups with a six-state general time-reversible model. Only those
42 taxa that differ in amino acid group composition from less than half of all other taxa were considered.
Bootstrap support values larger than 50% are shown to the right of the nodes; 100% bootstrap values are
indicated by black circles.
124
2.6.5. Tree-based gene orthology assessment (Manuscript 2.5)
Another source of systematic error in phylogenetics are gene duplications that may result in disagreement
between a gene’s trees and the evolutionary history of the species. Only orthologous genes, i.e., those
arising from speciation rather than gene duplication events (the latter leading to paralogous genes, Fitch,
1970) can be used reliably to infer phylogenetic relationships. Since the availability of large amounts of
molecular data allows and demands novel ways to carefully select genes forming orthologous
relationships prior to phylogenetic reconstruction, the final study of this work presents a novel, tree-based
approach to assess gene homology relations specifically for phylogenetic purposes. To this end, a semi-
automatic procedure was realized by Perl programming and a combination of several established
software packages used in data mining and phylogenetic reconstruction. The process is organized in three
main stages, namely the compilation of homologous gene clusters, the careful reconstruction of gene trees
for each cluster, and the visual evaluation of these gene trees to assess homology relations. Each gene was
assigned to one of three categories representing varying degrees of evidence for gene duplications,
provided by the incidence and extent of species overlap observable between clades in a gene tree. As a
case study, ribosomal protein genes were evaluated, because the previous studies relied on this group of
genes, and because they are also used extensively in other phylogenomic studies (i.e., Lartillot and
Philippe, 2008; Dunn et al., 2008). This allowed to investigate whether artefacts related to paralogy are
involved in the incongruencies afflicting these studies.
As a result, ribosomal protein genes were frequently found to be represented by more than one copy per
taxon (1.4 on average after fragmentary or identical homologs were removed). However, 92 % of these
redundant sequences formed almost exclusively well supported monophyletic groups. Only a small
number of genes were represented by more than 2.0 sequences per taxon on average (median values
larger than 1.0 were likewise the exception).
Almost two thirds of the 78 investigated genes were classified as category A (defined as lack of
species overlap), suggesting that gene duplications occurred not at all or only within lineages represented
in this study. This makes these genes unequivocally suitable for deep phylogenetic analyses of bilaterian
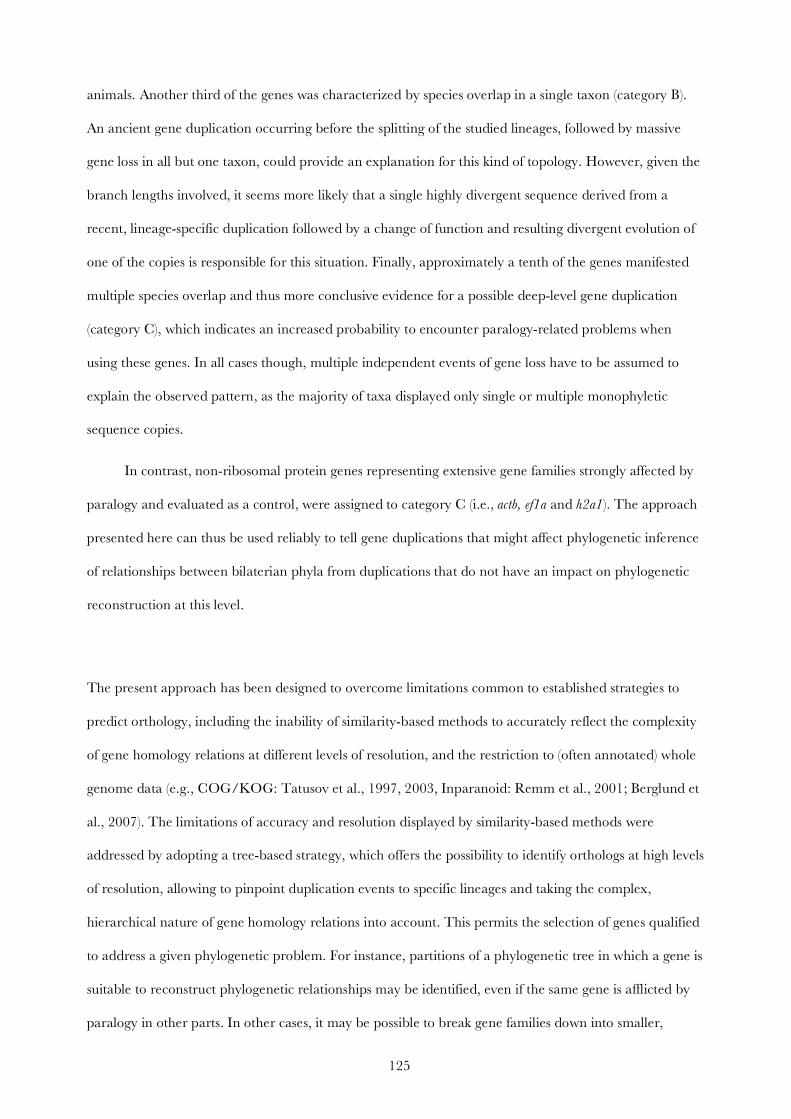
125
animals. Another third of the genes was characterized by species overlap in a single taxon (category B).
An ancient gene duplication occurring before the splitting of the studied lineages, followed by massive
gene loss in all but one taxon, could provide an explanation for this kind of topology. However, given the
branch lengths involved, it seems more likely that a single highly divergent sequence derived from a
recent, lineage-specific duplication followed by a change of function and resulting divergent evolution of
one of the copies is responsible for this situation. Finally, approximately a tenth of the genes manifested
multiple species overlap and thus more conclusive evidence for a possible deep-level gene duplication
(category C), which indicates an increased probability to encounter paralogy-related problems when
using these genes. In all cases though, multiple independent events of gene loss have to be assumed to
explain the observed pattern, as the majority of taxa displayed only single or multiple monophyletic
sequence copies.
In contrast, non-ribosomal protein genes representing extensive gene families strongly affected by
paralogy and evaluated as a control, were assigned to category C (i.e., actb, ef1a and h2a1). The approach
presented here can thus be used reliably to tell gene duplications that might affect phylogenetic inference
of relationships between bilaterian phyla from duplications that do not have an impact on phylogenetic
reconstruction at this level.
The present approach has been designed to overcome limitations common to established strategies to
predict orthology, including the inability of similarity-based methods to accurately reflect the complexity
of gene homology relations at different levels of resolution, and the restriction to (often annotated) whole
genome data (e.g., COG/KOG: Tatusov et al., 1997, 2003, Inparanoid: Remm et al., 2001; Berglund et
al., 2007). The limitations of accuracy and resolution displayed by similarity-based methods were
addressed by adopting a tree-based strategy, which offers the possibility to identify orthologs at high levels
of resolution, allowing to pinpoint duplication events to specific lineages and taking the complex,
hierarchical nature of gene homology relations into account. This permits the selection of genes qualified
to address a given phylogenetic problem. For instance, partitions of a phylogenetic tree in which a gene is
suitable to reconstruct phylogenetic relationships may be identified, even if the same gene is afflicted by
paralogy in other parts. In other cases, it may be possible to break gene families down into smaller,
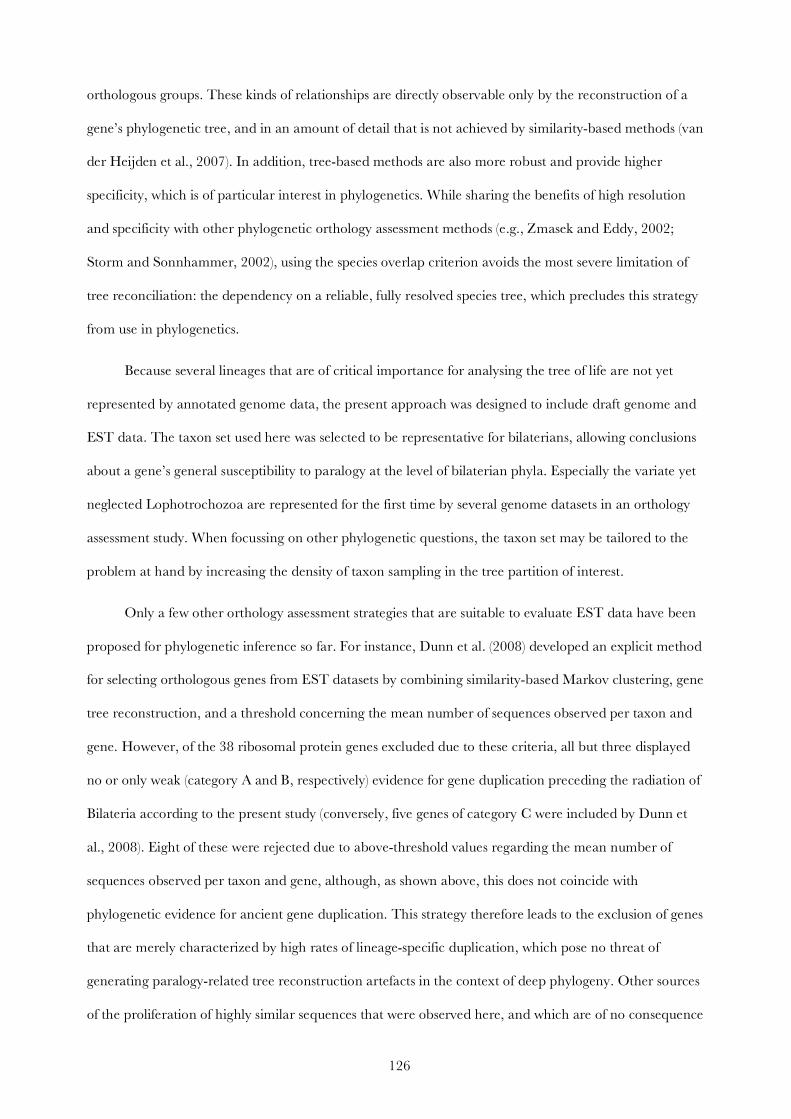
126
orthologous groups. These kinds of relationships are directly observable only by the reconstruction of a
gene’s phylogenetic tree, and in an amount of detail that is not achieved by similarity-based methods (van
der Heijden et al., 2007). In addition, tree-based methods are also more robust and provide higher
specificity, which is of particular interest in phylogenetics. While sharing the benefits of high resolution
and specificity with other phylogenetic orthology assessment methods (e.g., Zmasek and Eddy, 2002;
Storm and Sonnhammer, 2002), using the species overlap criterion avoids the most severe limitation of
tree reconciliation: the dependency on a reliable, fully resolved species tree, which precludes this strategy
from use in phylogenetics.
Because several lineages that are of critical importance for analysing the tree of life are not yet
represented by annotated genome data, the present approach was designed to include draft genome and
EST data. The taxon set used here was selected to be representative for bilaterians, allowing conclusions
about a gene’s general susceptibility to paralogy at the level of bilaterian phyla. Especially the variate yet
neglected Lophotrochozoa are represented for the first time by several genome datasets in an orthology
assessment study. When focussing on other phylogenetic questions, the taxon set may be tailored to the
problem at hand by increasing the density of taxon sampling in the tree partition of interest.
Only a few other orthology assessment strategies that are suitable to evaluate EST data have been
proposed for phylogenetic inference so far. For instance, Dunn et al. (2008) developed an explicit method
for selecting orthologous genes from EST datasets by combining similarity-based Markov clustering, gene
tree reconstruction, and a threshold concerning the mean number of sequences observed per taxon and
gene. However, of the 38 ribosomal protein genes excluded due to these criteria, all but three displayed
no or only weak (category A and B, respectively) evidence for gene duplication preceding the radiation of
Bilateria according to the present study (conversely, five genes of category C were included by Dunn et
al., 2008). Eight of these were rejected due to above-threshold values regarding the mean number of
sequences observed per taxon and gene, although, as shown above, this does not coincide with
phylogenetic evidence for ancient gene duplication. This strategy therefore leads to the exclusion of genes
that are merely characterized by high rates of lineage-specific duplication, which pose no threat of
generating paralogy-related tree reconstruction artefacts in the context of deep phylogeny. Other sources
of the proliferation of highly similar sequences that were observed here, and which are of no consequence
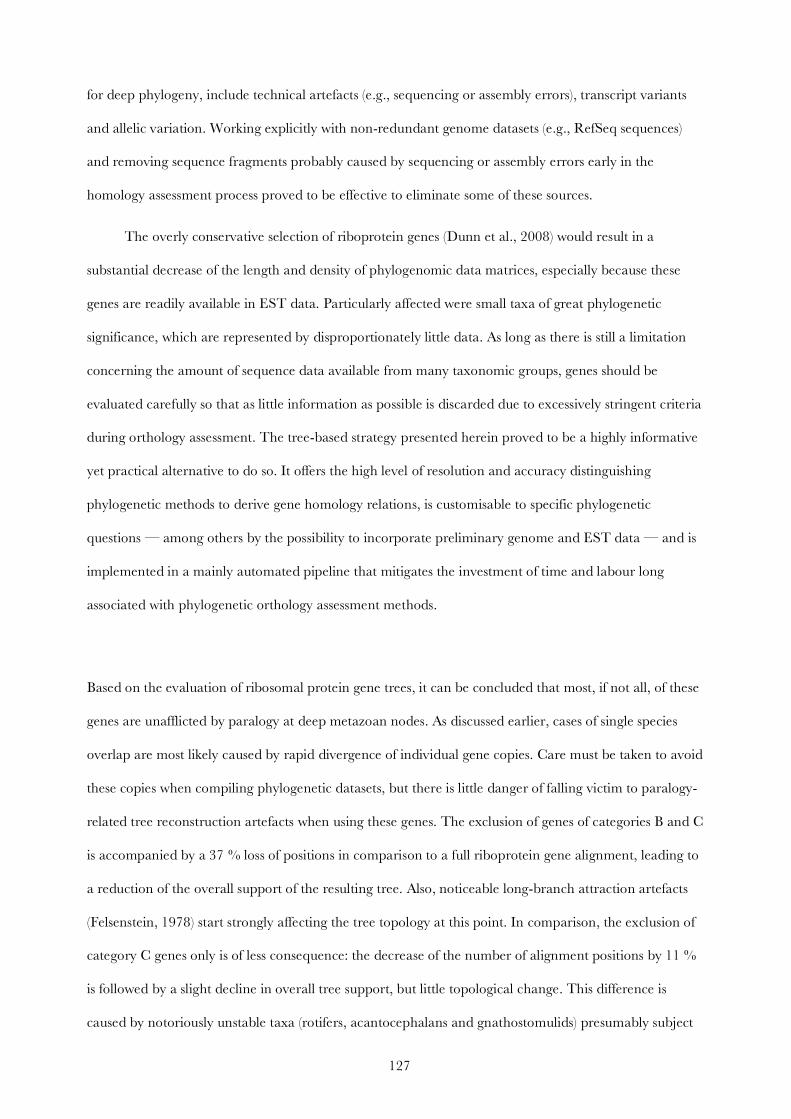
127
for deep phylogeny, include technical artefacts (e.g., sequencing or assembly errors), transcript variants
and allelic variation. Working explicitly with non-redundant genome datasets (e.g., RefSeq sequences)
and removing sequence fragments probably caused by sequencing or assembly errors early in the
homology assessment process proved to be effective to eliminate some of these sources.
The overly conservative selection of riboprotein genes (Dunn et al., 2008) would result in a
substantial decrease of the length and density of phylogenomic data matrices, especially because these
genes are readily available in EST data. Particularly affected were small taxa of great phylogenetic
significance, which are represented by disproportionately little data. As long as there is still a limitation
concerning the amount of sequence data available from many taxonomic groups, genes should be
evaluated carefully so that as little information as possible is discarded due to excessively stringent criteria
during orthology assessment. The tree-based strategy presented herein proved to be a highly informative
yet practical alternative to do so. It offers the high level of resolution and accuracy distinguishing
phylogenetic methods to derive gene homology relations, is customisable to specific phylogenetic
questions — among others by the possibility to incorporate preliminary genome and EST data — and is
implemented in a mainly automated pipeline that mitigates the investment of time and labour long
associated with phylogenetic orthology assessment methods.
Based on the evaluation of ribosomal protein gene trees, it can be concluded that most, if not all, of these
genes are unafflicted by paralogy at deep metazoan nodes. As discussed earlier, cases of single species
overlap are most likely caused by rapid divergence of individual gene copies. Care must be taken to avoid
these copies when compiling phylogenetic datasets, but there is little danger of falling victim to paralogy-
related tree reconstruction artefacts when using these genes. The exclusion of genes of categories B and C
is accompanied by a 37 % loss of positions in comparison to a full riboprotein gene alignment, leading to
a reduction of the overall support of the resulting tree. Also, noticeable long-branch attraction artefacts
(Felsenstein, 1978) start strongly affecting the tree topology at this point. In comparison, the exclusion of
category C genes only is of less consequence: the decrease of the number of alignment positions by 11 %
is followed by a slight decline in overall tree support, but little topological change. This difference is
caused by notoriously unstable taxa (rotifers, acantocephalans and gnathostomulids) presumably subject
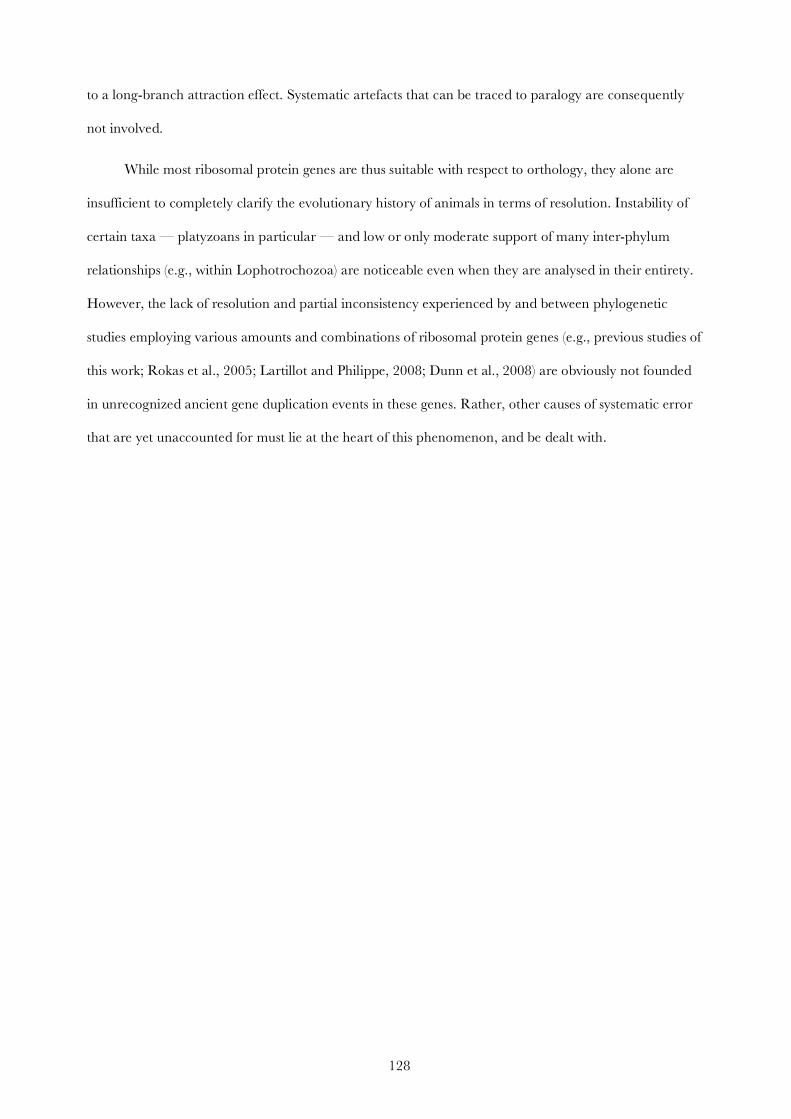
128
to a long-branch attraction effect. Systematic artefacts that can be traced to paralogy are consequently
not involved.
While most ribosomal protein genes are thus suitable with respect to orthology, they alone are
insufficient to completely clarify the evolutionary history of animals in terms of resolution. Instability of
certain taxa — platyzoans in particular — and low or only moderate support of many inter-phylum
relationships (e.g., within Lophotrochozoa) are noticeable even when they are analysed in their entirety.
However, the lack of resolution and partial inconsistency experienced by and between phylogenetic
studies employing various amounts and combinations of ribosomal protein genes (e.g., previous studies of
this work; Rokas et al., 2005; Lartillot and Philippe, 2008; Dunn et al., 2008) are obviously not founded
in unrecognized ancient gene duplication events in these genes. Rather, other causes of systematic error
that are yet unaccounted for must lie at the heart of this phenomenon, and be dealt with.
129
3. Conclusion and perspectives
The phylogenetic analyses underlying the present work unambiguously demonstrate that bryozoans,
brachiopods, and phoronids are closely related to molluscs, annelids, and relatives, and thus support the
Lophotrochozoa instead of the Radialia concept. This could be shown for the first time using large
multigene datasets, and convincingly confirms previous single-gene or small multigene analyses (e.g.,
Mallatt and Winchell, 2002; Ruiz-Trillo et al., 2002; Anderson et al., 2004; Passamaneck and Halanych,
2004; Passamaneck and Halanych, 2006, Waeschenbach et al., 2006). The most comprehensive
phylogenomic study on metazoan relationships to date arrives at the same conclusion (Dunn et al., 2008).
Considering that many morphological synapomorphies of lophophorates and deuterostomes, including
archimery and the mode of mesoderm formation, do not withstand closer scrutiny (see chapter 2.3,
“Phylogenomic analyses of lophophorates (brachiopods, phoronids and bryozoans) confirm the Lophotrochozoa concept” for a
more detailed discussion), evidence for the Lophotrochozoa concept is compelling.
Also consistent with earlier investigations (e.g., Mackey et al., 1996; Giribet et al., 2000; Ruiz-
Trillo et al., 2002; Anderson et al., 2004; Passamaneck and Halanych, 2006; Waeschenbach et al., 2006),
the analyses presented here strongly indicate lophophorate polyphyly. This conclusion recently received
additional support by the phylogenomic study of Dunn et al. (2008) and an up-to-date analysis of rDNA
data (Paps et al., 2009). The most likely topology according to the present results is characterized by a
basal position of bryozoans within Lophotrochozoa, while brachiopods and phoronids form a more
derived lophotrochozoan clade together with molluscs, annelids, and nemertines.
The sister group of ectoproct bryozoans has been identified as Entoprocta, an unexpected
grouping that is corroborated by a recent study based on rDNA data (Paps et al., 2009), although
morphological evidence is scarce (Nielsen, 2001). However, both ectoprocts and entoprocts also
experience — presumably artefactual — attraction by platyzoan taxa (see chapter 2.4, “Reducing
compositional heterogeneity improves phylogenomic inference of lophotrochozoan relationships”, and Passamaneck and
Halanych, 2006; Dunn et al., 2008), which makes the validation of bryozoan monophyly difficult, and
obscures the branching order of these three groups. Within Bryozoa the present work confirms the
130
monophyly of Ectoprocta and a sister group relationship between phylactolaemates, the freshwater
forms, and the predominantly marine gymnolaemates.
Evidence for Brachiozoa in the form of a sister group relationship between brachiopods and
phoronids is likewise strong, and consistent with many other molecular analyses (Giribet et al., 2000;
Anderson et al., 2004; Dunn et al., 2008; Paps et al., 2009) and morphology (Nielsen, 2001). No
indication was observed that phoronids constitute derived brachiopods (Cohen, 2000). There is
uncertainty, however, concerning the sister group of Brachiozoa, with the most probable aspirant
according to the phylogenomic analyses included in this work being Nemertea. This grouping also finds
support by Dunn et al. (2008), although morphological synapomorphies are unknown at the moment.
Despite these achievements, the resolution of the animal tree of life that is obtained by the analyses
presented here is still incomplete, and — as implied above — many questions remain unsolved. This
circumstance, however, is shared with comparable studies (e.g., Rokas et al., 2005; Dunn et al., 2008;
Lartillot and Philippe, 2008). Some parts of the metazoan tree are even characterized by contradictory
results between analyses, e.g. concerning the monophyly of Bryozoa (Dunn et al., 2008) or the position of
Platyhelminthes (Lartillot and Philippe, 2008). In contrast to the beginning of this study, most animal
phyla are now represented by genomic-scale data, which allows phylogenomic analyses not constrained
by insufficient taxon sampling. Yet while approaches employing large numbers of genes from many taxa
are effective in overcoming stochastic errors that plagued earlier, single-gene studies, they are prone to a
range of systematic error sources. Most of these are related to inadequate modelling of molecular
evolution due to diverging evolutionary rates across taxa, heterotachy, compositional bias or selective
constraints (Delsuc et al., 2005). During this study, efforts were undertaken not only to improve taxon
sampling and replace fast-evolving species by more slowly evolving ones, but also to account for
compositional heterogeneity observable in metazoan protein sequences, and to provide evidence for the
suitability of the genes used with respect to orthology. While sampling additional genes and taxa will
continue to be useful, e.g., by permitting to break long branches or select slow-evolving taxa and genes
(Regier et al., 2008), improved models of molecular evolution directly accounting for rate differences
131
among lineages and across time, compositional heterogeneity, and selective constraints are required to
more reliably infer interphyletic relationships.
However, another explanation for the lack of resolution related to the evolutionary process itself is
conceivable. The generally low support values and short internodes consistently observed between many
phyla indicate that the early evolutionary history of animals was characterized by rapid episodes of
radiation. In this case, the phylogenetic signal that has been accumulated between these closely spaced
cladogenetic events might be too weak and obscured by non-phylogenetic signal to elucidate metazoan
— and particularly lophotrochozoan — phylogeny (Rokas et al., 2005). Simply increasing the amount of
sequence data, as is promised by the advent of next-generation sequencing techniques, will then not be
sufficient to confidently resolve the branching order within animals. There is hope, though, that rare
genomic events that have occurred between these rapid splits, e.g., intron and transposon integration,
microRNA innovation or large-scale genome modifications, may serve as phylogenetic signatures shared
between phyla. The identification and analysis of these novel markers will probably present the next step
in phylogenetics, and might finally grant a more precise understanding of the course of animal evolution.
132
4. Author’s Contributions
The following section describes in detail my own contributions to the studies that comprise this work.
Manuscript 2.1: Multigene analysis of lophophorate and chaetognath phylogenetic relationships
For this study, I collected specimens of Plumatella repens, and performed all laboratory work, including
RNA preparation, target gene amplification and sequencing. I was also responsible for most
computational work including sequence and alignment assembly, Bayesian inference analysis and data
submission to public archives. I revised the manuscript in close cooperation with Bernhard Hausdorf,
who composed the initial draft.
Manuscript 2.2: Spiralian phylogenomics supports the resurrection of Bryozoa comprising Ectoprocta and Entoprocta
My contributions to this study included the preparation of RNA from Flustra foliacea, and the
compilation and editing of the alignment in cooperation with Alexander Witek (University of Mainz). I
coordinated the protein model evaluation for each gene, conducted the Bayesian inference analysis, and
submitted the majority of data to public archives. Finally, I contributed parts to and edited the
manuscript written by Bernhard Hausdorf.
Manuscript 2.3: Phylogenomic analyses of lophophorates (brachiopods, phoronids and bryozoans) confirm the
Lophotrochozoa concept
For this study, I collected samples of Novocrania anomala and Phoronis muelleri in Sweden, and carried
out the RNA preparation. Computational work performed by me included the retrieval of ribosomal
protein sequences from EST data, alignment building and editing, and the submission of the data to
133
public archives. I conducted all Bayesian as well as individual maximum-likelihood analyses, and wrote
and revised the manuscript together with Bernhard Hausdorf.
Manuscript 2.4: Reducing compositional heterogeneity improves phylogenomic inference of lophotrochozoan relationships
Experimental work conducted by me for this study involved RNA preparation from Alcyonidium
diaphanum and Tubulipora sp. I also compiled the dataset, and participated in the computation of the
phylogenetic trees. I contributed parts to and edited the manuscript written by Bernhard Hausdorf.
Manuscript 2.5: Tree-based orthology assessment illustrated by the evaluation of ribosomal protein genes
The approach underlying this manuscript was developed, programmed and implemented by me. I
further performed all phylogenetic computations, and wrote the manuscript, which was edited by
Bernhard Hausdorf, who also conceived the initial idea.
134
5. References
Adoutte A., Balavoine G., Lartillot N., Lespinet O., Prud’homme B., and de Rosa R. 2000. The new
animal phylogeny: reliability and implications. Proc. Natl. Acad. Sci. USA. 97: 4453–4456.
Aguinaldo A. M., Turbeville J. M., Linford L. S., Rivera M. C., Garey J. R., Raff R. A., and Lake J. A.
1997. Evidence for a clade of nematodes, arthropods and other moulting animals. Nature 387: 489–
493.
Ahlrichs W. H. 1995a. Zur Ultrastruktur und Phylogenie von Seison nebaliae Grube, 1859 und Seison
annulatus Claus, 1876 – Hypothesen zu phylogenetischen Verwandtschaftsverhältnissen innerhalb
der Bilateria. Cuvillier, Göttingen.
Ahlrichs W. H. 1995b. Seison annulatus und Seison nebaliae – Ultrastruktur und Phylogenie. Verh. Dtsch. Zool.
Ges. 88: 1–155.
Ahlrichs W. H. 1997. Epidermal ultrastructure of Seison nebaliae and Seison annulatus, and a comparison of
epidermal structures within the Gnathifera. Zoomorphology 117: 41–48.
Allman G. J. 1856. Monograph of the fresh-water Polyzoa, including all the known species, both British
and foreign. The Ray Society, London.
Anderson F. E., Cordoba A. J., and Thollesson M. 2004. Bilaterian phylogeny based on analyses of a
region of the sodium-potassium ATPase α-subunit gene. J. Mol. Evol. 58: 252–268.
Ax P. 1995. Das System der Metazoa I. Gustav Fischer Verlag, Stuttgart.
Ax P. 1999. Das System der Metazoa II. Gustav Fischer Verlag, Stuttgart.
Ax P. 2001. Das System der Metazoa III. Spektrum Akademischer Verlag, Heidelberg.
Baguñà J., Martinez P., Paps J., and Riutort M. 2008. Back in time: a new systematic proposal for the
Bilateria. Phil. Trans. R. Soc. B 363: 1481–1491.
135
Bartolomaeus T. 1993. Die Leibeshöhlenverhältnisse und Verwandtschaftsbeziehungen der Spiralia.
Verh. Dtsch. Zool. Ges. 86: 1–42.
Bartolomaeus T. 2001. Ultrastructure and formation of the body cavity lining in Phoronis muelleri
(Phoronida, Lophophorata). Zoomorphology 120: 135–148.
Baurain D., Brinkmann H., and Philippe H. 2007. Lack of resolution in the animal phylogeny: closely
spaced cladogeneses or undetected systematic errors? Mol. Biol. Evol. 24: 6–9.
Berglund A., Sjölund E., Östlund G., and Sonnhammer E. L. 2007. InParanoid 6: eukaryotic ortholog
clusters with inparalogs. Nucleic Acids Res. 36: D263–D266.
Brunton, C. H., and Curry G. B. 1979. British brachiopods. Academic Press Inc., London.
Brusca R. C., and Brusca G. J. 2003. Invertebrates, 2nd edition. Sinauer Associates, Sunderland.
Cavalier-Smith T. 1998. A revised six-kingdom system of life. Biol. Rev. 73: 203–266.
Cohen B. L. 2000. Monophyly of brachiopods and phoronids: reconciliation of molecular evidence with
Linnaean classification (the subphylum Phoroniformea nov.). Proc. R. Soc. B 267: 225–231.
Cohen B. L., Gawthrop A., and Cavalier-Smith T. 1998. Molecular phylogeny of brachiopods and
phoronids based on nuclear-encoded small subunit ribosomal RNA gene sequences. Phil. Trans. R.
Soc. B 353: 2039–2061.
Cohen B. L., and Weydmann A. 2005. Molecular evidence that phoronids are a subtaxon of brachiopods
(Brachiopoda: Phoronata) and that genetic divergence of metazoan phyla began long before the
early Cambrian. Organ. Diver. Evol. 5: 253–273.
Cuffey R. J. 1973. An improved classification, based upon numerical-taxonomic analyses, for the higher
taxa of entoproct and ectoproct bryozoans. In: Larwood G. P., editor. Living and fossil Bryozoa.
Academic Press, London.
Dayhoff M. O., Schwartz R. M., and Orcutt B. C. 1978. A model of evolutionary change in proteins. In:
Dayhoff M. O., editor. Atlas of protein sequence and structure, Volume 5, Suppl. 3. National
Biomedical Research Foundation, Washington
136
de Rosa R., Grenier J. K., Andreeva T., Cook C. E., Adoutte A., Akam M., Carroll S. B., and Balavoine
G. 1999. Hox genes in brachiopods and priapulids and protostome evolution. Nature 399: 772–776.
Dunn C. W., Hejnol A., Matus D. Q., Pang K., Browne W. E., Smith S. A., Seaver E., Rouse G. W.,
Obst M., Edgecombe G. D., Sørensen M. V., Haddock S. H., Schmidt-Rhaesa A., Okusu A.,
Kristensen R. M., Wheeler W. C., Martindale M. Q., and Giribet G. 2008. Broad phylogenomic
sampling improves resolution of the animal tree of life. Nature 452: 745–749.
Delsuc F., Brinkmann H., and Philippe H. 2005. Phylogenomics and the reconstruction of the tree of life.
Nat. Rev. Genet. 6: 361–375.
Embley T. M., van der Giezen M., Horner D. S., Dyal P. L., and Foster P. 2003. Mitochondria and
hydrogenosomes are two forms of the same fundamental organelle. Phil. Trans. R. Soc. B 358: 191–
203.
Emig, C. C. 1979. British and other phoronids. Academic Press Inc., London.
Emig C. C. 1984. On the origin of the Lophophorata. Z. Zool. Syst. Evolutionsforsch. 22: 91–94.
Emschermann P. 1982. Les Kamptozoaires. État actuel de nos connaissances sur leur anatomie, leur
développement, leur biologie et leur position phylogénétique. Bull. Soc. Zool. Fr. 107: 317–344, pl.
1–3.
Felsenstein J. 1985. Confidence limits on phylogenies: an approach using the bootstrap. Evolution 39:
783–791.
Fitch W. M. 1970. Distinguishing homologous from analogous proteins. Syst. Zool. 19: 99–113.
Fuchs J., Obst M., and Sundberg P. In press. The first comprehensive molecular phylogeny of Bryozoa
(Ectoprocta) based on combined analyses of nuclear and mitochondrial genes. Mol. Phylogenet. Evol.
Funch P., and Kristensen R. M. 1995. Cycliophora is a new phylum with affinities to Entoprocta and
Ectoprocta. Nature 378: 711–714.
137
Garey J. R., Near T. J., Nonnemacher M. R., and Nadler S. A. 1996. Molecular evidence for
Acanthocephala as a subtaxon of Rotifera. J. Mol. Evol. 43: 287–292.
Garey J. R., and Schmidt-Rhaesa A. 1998. The essential role of “minor” phyla in molecular studies of
animal evolution. Am. Zool. 38: 907–917.
Giribet G., Distel D. L., Polz M., Sterrer W., and Wheeler W. C. 2000. Triploblastic relationships with
emphasis on the acoelomates and the position of Gnathostomulida, Cycliophora, Plathelminthes,
and Chaetognatha: a combined approach of 18S rDNA sequences and morphology. Syst. Biol. 49:
539–562.
Haeckel E. 1904. Kunstformen der Natur. Electronic edition published by Kurt Stüber, 1999.
Halanych K. M. 1996. Convergence in the feeding apparatuses of lophophorates and pterobranch
hemichordates revealed by 18S rDNA: An interpretation. Biol. Bull. 190: l–5.
Halanych K. M. 2004. The new view of animal phylogeny. Annu. Rev. Ecol. Evol. Syst. 35: 229–256.
Halanych K. M., Bacheller J. D., Aguinaldo A. A., Liva S. M., Hillis D. M., and Lake J. A. 1995.
Evidence from 18S ribosomal DNA that the Lophophorates are protostome animals. Science 267:
1641–1642.
Haszprunar G. 1996. The Mollusca: Coelomate turbellarians or mesenchymate annelids? In: Taylor J.
D. editor. Origin and evolutionary radiation of the Mollusca. Oxford University Press, Oxford.
Haszprunar G., and Wanninger A. 2008. On the fine structure of the creeping larva of Loxosomella
murmanica: additional evidence for a clade of Kamptozoa (Entoprocta) and Mollusca. Acta Zool. 89:
137–148.
Hatschek B. 1891. Lehrbuch der Zoologie, 3rd edition. Gustav Fischer Verlag, Jena.
Hayward P. J., and Ryland J. S. 1985. Cyclostome bryozoans. Brill, Leiden.
Hayward P. J., and Ryland J. S. 1995. Handbook of the marine fauna of north-west Europe. Oxford
University Press, Oxford.
138
Hayward P. J., and Ryland J. S. 1998. Cheilostomatous Bryozoa. Field Studies Council Publications,
Shrewsbury.
Helfenbein K. G., and Boore J. L. 2004. The mitochondrial genome of Phoronis architecta — comparisons
demonstrate that phoronids are lophotrochozoan protostomes. Mol. Biol. Evol. 21: 153–157.
Hennig W. 1979. Wirbellose I (ausgenommen Gliedertiere). Taschenbuch der Speziellen Zoologie,
Volume 2, 4th edition. Gustav Fischer Verlag, Jena.
Hyman L. H. 1959. The invertebrates: smaller coelomate groups, volume 5. McGraw-Hill, New York.
Jenner R. A. 2004. Towards a phylogeny of the Metazoa: Evaluating alternative phylogenetic positions of
Platyhelminthes, Nemertea, and Gnathostomulida, with a critical reappraisal of cladistic
characters. Contributions to Zoology 73: 3–163.
Kumar S., and Gadagkar S. R. 2001a. Disparity index: a simple statistic to measure and test the
homogeneity of substitution patterns between molecular sequences. Genetics 158: 1321–1327.
Kumar S., and Gadagkar S. 2001b. Corrigendum. Genetics 159: 913–914.
Lartillot N., and Philippe H. 2008. Improvement of molecular phylogenetic inference and the phylogeny
of Bilateria. Phil. Trans. R. Soc. B. 363: 1463–1472.
Lartillot N., Brinkmann H., and Philippe H. 2007. Suppression of long-branch attraction artefacts in the
animal phylogeny using a site-heterogeneous model. BMC Evol. Biol. 7: S4.
Lüter C. 2000. The origin of the coelom in Brachiopoda and its phylogenetic significance. Zoomorphology
120: 15–28.
Lüter C., and Bartolomaeus T. 1997. The phylogenetic position of Brachiopoda — a comparison of
morphological and molecular data. Zool. Scripta 26: 245–254.
Mackey L. Y., Winnepenninckx B., de Wachter R., Backeljau T., Emschermann P., and Garey J. R.
1996 18S rRNA suggests that Entoprocta are protostomes, unrelated to Ectoprocta. J. Mol. Evol.
42: 552–559.
139
Mallatt J., and Winchell C. J. 2002. Testing the new animal phylogeny: First use of combined large-
subunit and small-subunit rRNA gene sequences to classify the protostomes. Mol. Biol. Evol. 19:
289–301.
Mundy S. P., Taylor P. D., and Thorpe J. P. 1981. A reinterpretation of Phylactolaemate phylogeny. In:
Larwood G. P., and Nielsen C., editors. Recent and fossil Bryozoa. Olsen and Olsen, Fredensborg.
Nielsen C. 1971. Entoproct life-cycles and the entoproct/ectoproct relationship. Ophelia 9: 209–341.
Nielsen C. 2001. Animal evolution – interrelationships of the living phyla, 2nd edition. Oxford University
Press, Oxford.
Philip G. K., Creevey C. J., and McInerney J. O. 2005. The Opisthokonta and the Ecdysozoa may not
be clades: stronger support for the grouping of plant and animal than for animal and fungi and
stronger support for the Coelomata than Ecdysozoa. Mol. Biol. Evol. 22: 1175–1184.
Paps J., Baguñà J., and Riutort M. 2009. Lophotrochozoa internal phylogeny: new insights from an up-
to-date analysis of nuclear ribosomal genes. Proc. R. Soc. B 276: 1245–1254.
Passamaneck Y. J., and Halanych K. M. 2004. Evidence from Hox genes that bryozoans are
lophotrochozoans. Evol. Dev. 6: 275–281.
Passamaneck Y. J., and Halanych K. M. 2006. Lophotrochozoan phylogeny assessed with LSU and SSU
data: Evidence of lophophorate polyphyly. Mol. Phyl. Evol. 40: 20–28.
Peterson K. J., and Eernisse D. J. 2001. Animal phylogeny and the ancestry of bilaterians: Inferences
from morphology and 18S rDNA gene sequences. Evol. Dev. 3: 170–205.
Philippe H., and Telford M. J. 2006. Large-scale sequencing and the new animal phylogeny. Trends Ecol.
Evol. 21: 614–620.
Rokas A., Krüger D., and Carroll S. B. 2005. Animal evolution and the molecular signature of radiations
compressed in time. Science 310: 1933–1938.
140
Regier J. C., Shultz J. W., Ganley A. R., Hussey A., Shi D., Ball B., Zwick A., Stajich J. E., Cummings
M. P., Martin J. W., and Cunnigham C. W. 2008. Resolving arthropod phylogeny: exploring
phylogenetic signal within 41 kb of protein-coding nuclear gene sequence. Syst. Biol. 57: 920–938.
Remm M., Storm C. E., and Sonnhammer E. L. 2001. Automatic clustering of orthologs and in-paralogs
from pairwise species comparisons. J. Mol. Biol. 314: 1041–1052.
Ruiz-Trillo I., Paps J., Loukota M., Ribera C., Jondelius U., Baguñà J., and Riutort M. 2002. A
phylogenetic analysis of myosin heavy chain type II sequences corroborates that Acoela and
Nemertodermatida are basal bilaterians. Proc. Natl. Acad. Sci. USA 99: 11246–11251.
Siewing, R. 1980. Das Archicoelomatenkonzept. Zool. Jahrb. Anat. 103: 439–482.
Sørensen M. V., Funch P., Willerslev E., Hansen A. J., and Olesen J. 2000. On the phylogeny of the
Metazoa in the light of Cycliophora and Micrognathozoa. Zool. Anz. 239: 297–318.
Stechmann A., and Schlegel M. 1999. Analysis of the complete mitochondrial DNA sequence of the
brachiopod Terebratulina retusa places Brachiopoda within the protostomes. Proc. R. Soc. B 266:
2043–2052.
Storm C. E., and Sonnhammer E. L. 2002. Automated ortholog inference from phylogenetic trees and
calculation of orthology reliability. Bioinformatics 18: 92–99.
Tatusov R. L., Koonin E. V., and Lipman D. J. 1997. A genomic perspective on protein families. Science
278: 631–637.
Tatusov R. L., Fedorova N. D., Jackson J. D., Jacobs A. R., Kiryutin B., Koonin E. V., Krylov D. M.,
Mazumder R., Mekhedov S. L., Nikolskaya A. N., Rao B. S., Smirnov S., Sverdlov A. V.,
Vasudevan S., Wolf Y. I., Yin J. J., and Natale D. A. 2003. The COG database: an updated
version includes eukaryotes. BMC Bioinformatics 4: 41.
Tamura K., Dudley J., Nei M., and Kumar S. 2007. MEGA4: Molecular Evolutionary Genetics Analysis
(MEGA) software version 4.0. Mol. Biol. Evol. 24: 1596–1599.
141
Van der Heijden R. T., Snel B., van Noort V., and Huynen M. A. 2007. Orthology prediction at
scalable resolution by phylogenetic tree analysis. BMC Bioinformatics 8: 83.
Waeschenbach A., Telford M. J., Porter J. S., and Littlewood, D. T. 2006. The complete mitochondrial
genome of Flustrellidra hispida and the phylogenetic position of Bryozoa among the Metazoa. Mol.
Phyl. Evol. 40: 195–207.
Wang H. C., Li K., Susko E., and Roger A.J. 2008. A class frequency mixture model that adjusts for site-
specific amino acid frequencies and improves inference of protein phylogeny. BMC Evol. Biol. 8:
331.
Wanninger A., Fuchs J., and Haszprunar G. 2007. Anatomy of the serotonergic nervous system of an
entoproct creeping-type larva and its phylogenetic implications. Invert. Biol. 126: 268–278.
Westheide W., and Rieger R. 1996. Spezielle Zoologie – Teil 1: Einzeller und wirbellose Tiere. 1st
edition. Gustav Fischer Verlag, Stuttgart.
Zmasek C. M., and Eddy S. R. 2002. RIO: Analyzing proteomes by automated phylgenomics using
resampled inference of orthologs. BMC Bioinformatics 3: 14.
Zrzavý J., Mihulka S., Kepka P., Bezdek A., and Tietz D. 1998. Phylogeny of the Metazoa based on
morphological and 18S ribosomal DNA evidence. Cladistics 14: 249–285.
142
Acknowledgments
First and foremost, I would like to express my gratitude to my advisors: Bernhard Hausdorf for imparting
his expertise in phylogenetics, the amount of time and effort he spent on supervising this project mainly
by phone, and for contributing so much to its publications. Iris Bruchhaus for all her advise, the cordial
welcome in her work group, and the possibility to stay there after the laboratory work was finished.
Egbert Tannich is gratefully acknowledged for granting logistical support to a project completely
unrelated to his research interests, and integrating me and my project into all activities of his work group.
Many colleagues that contributed to this work by providing samples, data, program code or advise are
listed in the acknowledgment section of each manuscript. Of these, I would like to give special mention to
Matthias Obst (Gothenburg) and Sascha Strauss (Vienna).
Further thanks go to all members of the work group Tannich in lab 4, 5 and 6 for their helpfulness and
cordiality, and in particular Anna Bachmann, Laura Biller and Manuela Tillack for their friendship.
Franziska Holfert I thank for her love and support, and her growing interest in the natural world.
Finally, and again, I wish to thank my parents — for everything.
This work was financed by the priority program “Deep Metazoan Phylogeny“ of the German Research
Foundation (DFG), grant no. HA 2763/5.
143
Declaration
The linguistic correctness of this work has been verified by Dr. Rebecca Stanway.
Dr. Rebecca Stanway
Bernhard Nocht Institute for Tropical Medicine
Bernhard-Nocht-Str. 74
20359 Hamburg