Molecular Modelling of Estrogren-Producing Enzymes CYP450 ...
109
Molecular Modelling of Estrogen-Producing Enzymes CYP450 Aromatase and 17β-Hydroxysteroid Dehydrogenase Type 1 Sampo Karkola Laboratory of Organic Chemistry Department of Chemistry Faculty of Science University of Helsinki Finland Academic Dissertation To be presented with the permission of the Faculty of Science of the University of Helsinki for public criticism in Auditorium A110 in the Department of Chemistry, February 28th, at 12 o’clock. Helsinki 2009
Transcript of Molecular Modelling of Estrogren-Producing Enzymes CYP450 ...

Molecular Modelling ofEstrogen-Producing Enzymes CYP450Aromatase and 17β-Hydroxysteroid
Dehydrogenase Type 1
Sampo Karkola
Laboratory of Organic ChemistryDepartment of Chemistry
Faculty of ScienceUniversity of Helsinki
Finland
Academic Dissertation
To be presented with the permission of the Faculty of Science of the University ofHelsinki for public criticism in Auditorium A110 in the Department of Chemistry,
February 28th, at 12 o’clock.
Helsinki 2009

SupervisorProfessor Kristiina WahalaLaboratory of Organic ChemistryDepartment of ChemistryFaculty of ScienceUniversity of HelsinkiFinland
ReviewersProfessor Wolfgang SipplInstitute of PharmacyFaculty I of Natural Science–Biological ScienceThe Martin Luther University of Halle–WittenbergGermany
Professor Jerzy AdamskiGenome Analysis CentreInstitute of Experimental GeneticsGerman Research Center for Environmental HealthGermany
OpponentDr. Hugo Kubinyiass. Professor of Pharmaceutical ChemistryUniversity of HeidelbergGermany
ISBN 978-952-92-4942-8 (paperback)ISBN 978-952-10-5186-9 (PDF)
Edita Prima OyHelsinki 2009
ii

Contents
1 Introduction 1
2 Estrogen biosynthesis 5
3 CYP450 aromatase 9
3.1 Substrate recognition sites . . . . . . . . . . . . . . . . . . . . . 12
3.2 Mechanism of the catalytic reaction . . . . . . . . . . . . . . . . 13
3.3 Homology modelling of aromatase . . . . . . . . . . . . . . . . 15
3.4 Mutagenesis studies on aromatase . . . . . . . . . . . . . . . . 20
3.5 Phytoestrogens as aromatase inhibitors . . . . . . . . . . . . . 23
3.6 Commercial aromatase inhibitors . . . . . . . . . . . . . . . . . 28
4 17β-Hydroxysteroid dehydrogenase type 1 31
4.1 Structure and catalytic mechanism of 17β-HSD1 . . . . . . . . 32
4.2 Molecular modelling of 17β-HSD1 . . . . . . . . . . . . . . . . 34
5 Methods used in molecular modelling 39
5.1 Force fields . . . . . . . . . . . . . . . . . . . . . . . . . . . . . . 39
5.2 Homology modelling . . . . . . . . . . . . . . . . . . . . . . . . 43
iii

5.3 Molecular dynamics simulations . . . . . . . . . . . . . . . . . 46
5.3.1 Periodic boundary conditions . . . . . . . . . . . . . . . 47
5.3.2 Long-range interactions . . . . . . . . . . . . . . . . . . 47
5.3.3 Temperature and pressure monitoring . . . . . . . . . . 48
5.4 MDS trajectory analysis and protein model validation . . . . . 48
5.5 Ligand–protein docking . . . . . . . . . . . . . . . . . . . . . . 52
Search methods and scoring functions . . . . . . . . . . . . . . 53
5.6 QSAR methods . . . . . . . . . . . . . . . . . . . . . . . . . . . 54
5.7 Pharmacophore modelling and virtual screening . . . . . . . . 57
6 Aims of the study 59
7 Results and discussion 61
7.1 The aromatase model and the bindingof phytoestrogens (I and II) . . . . . . . . . . . . . . . . . . . . 61
7.2 Molecular modelling of 17β-HSD1and its inhibitors (III and IV) . . . . . . . . . . . . . . . . . . . . 69
8 Conclusions 79
Bibliography
Structures of the essential amino acids
Original publications
iv
Abstract
Breast cancer is the most common cancer in women in the western coun-
tries. Approximately two-thirds of breast cancer tumours are hormone de-
pendent, requiring estrogens to grow. Estrogens are formed in the human
body via a multistep route starting from cholesterol. The final steps in the
biosynthesis include the CYP450 aromatase enzyme, converting the male
hormones androgens (preferred substrate androstenedione ASD) into estro-
gens (estrone E1), and the 17β-HSD1 enzyme, converting the biologically
less active E1 into the active hormone 17β-hydroxyestradiol E2. E2 is bound
to the nuclear estrogen receptors causing a cascade of biochemical reactions
leading to cell proliferation in normal tissue, and to tumour growth in can-
cer tissue. Aromatase and 17β-HSD1 are expressed in or near the breast tu-
mour, locally providing the tissue with estrogens. One approach in treating
hormone dependent breast tumours is to block the local estrogen produc-
tion by inhibiting these two enzymes. Aromatase inhibitors are already on
the market in treating breast cancer, despite the lack of an experimentally
solved structure. The structure of 17β-HSD1, on the other hand, has been
solved, but no commercial drugs have emerged from the drug discovery
projects reported in the literature.
Computer-assisted molecular modelling is an invaluable tool in modern
drug design projects. Modelling techniques can be used to generate a model
of the target protein and to design novel inhibitors for them even if the tar-
get protein structure is unknown. Molecular modelling has applications in
predicting the activities of theoretical inhibitors and in finding possible ac-
tive inhibitors from a compound database. Inhibitor binding at atomic level

can also be studied with molecular modelling.
To clarify the interactions between the aromatase enzyme and its substrate
and inhibitors, we generated a homology model based on a mammalian
CYP450 enzyme, rabbit progesterone 21-hydroxylase CYP2C5. The model
was carefully validated using molecular dynamics simulations (MDS) with
and without the natural substrate ASD. Binding orientation of the inhibitors
was based on the hypothesis that the inhibitors coordinate to the heme iron,
and were studied using MDS. The inhibitors were dietary phytoestrogens,
which have been shown to reduce the risk for breast cancer. To further val-
idate the model, the interactions of a commercial breast cancer drug were
studied with MDS and ligand–protein docking. In the case of 17β-HSD1, a
3D QSAR model was generated on the basis of MDS of an enzyme complex
with active inhibitor and ligand–protein docking, employing a compound
library synthesised in our laboratory. Furthermore, four pharmacophore
hypotheses with and without a bound substrate or an inhibitor were devel-
oped and used in screening a commercial database of drug-like compounds.
The homology model of aromatase showed stable behaviour in MDS and
was capable of explaining most of the results from mutagenesis studies. We
were able to identify the active site residues contributing to the inhibitor
binding, and explain differences in coordination geometry corresponding
to the inhibitory activity. Interactions between the inhibitors and aromatase
were in agreement with the mutagenesis studies reported for aromatase.
Simulations of 17β-HSD1 with inhibitors revealed an inhibitor binding mode
with hydrogen bond interactions previously not reported, and a hydropho-
bic pocket capable of accommodating a bulky side chain. Pharmacophore
hypothesis generation, followed by virtual screening, was able to identify
several compounds that can be used in lead compound generation. The
visualisation of the interaction fields from the QSAR model and the phar-
macophores provided us with novel ideas for inhibitor development in our
drug discovery project.
vi

Acknowledgements
This study was carried out in the Laboratory of Organic Chemistry, Depart-
ment of Chemistry, University of Helsinki. I am most grateful to my super-
visor, Professor Kristiina Wahala for introducing me to the field of molecu-
lar modelling. She has provided me with excellent tools to work with, from
computer hardware to state-of-the-art software. Moreover, her positive atti-
tude during the whole research project has encouraged me to never give up
in finding solutions to the problems encountered during the work. She has
also provided me with several interesting side projects, including organising
conferences, building the NetLab website and generating the EChemTest
database. I want to express my gratitude also to Professor Emeritus Tapio
Hase for accepting me as a graduate student to the Laboratory and for al-
ways being available to guide me through chemical problems.
My first steps in the field of molecular modelling were taken in the Heinrich
Heine University, Dusseldorf, Germany, under the supervision of Professor
Doctor h.c. Hans-Dieter Holtje. I am ever so grateful to him for accepting me
as a member of his research group and teaching me the basics of molecular
modelling. His excellent advice have helped me during my research work.
Professor Wolfgang Sippl and Professor Jerzy Adamski are thanked for re-
viewing this manuscript and for their constructive comments, and Doctor
Kathleen Ahonen is thanked for revising the language in this manuscript.
The research work and several trips to conferences would not have been
possible without The Finnish Academy, The National Graduate School of

Organic Chemistry and Chemical Biology, The University of Helsinki Re-
search Fund and the University of Helsinki Chancellor’s travel grant.
CSC – IT Center for Science Ltd. is thanked for supercomputer time and
excellent scientific and technical advice during the work.
I would like to thank the personnel at the Laboratory of Organic Chemistry
for always providing me with advice whenever I needed it. Special thanks
go to Dr. Jorma Koskimies for being a casual supervisor at the teaching
laboratory and a colleague in ECTN projects. Dr. Leena Kaisalo has been
an excellent colleague in organising conferences and Anna-Maaret Jarvikivi
has helped me in many administrative issues.
All the former and present members of our Phyto-Syn research group have
always made the working environment very pleasant, both on and off the
working hours. Special thanks go to Nanna and Antti for being such good
friends and giving at least one good laugh per day. Valtteri has helped me in
several computer-related problems, and despite my initial reluctance, talked
me into using Linux and LATEX.
My parents Liisa and Kape are, of course, thanked for their endless sup-
port and encouragement in every decision I have ever made in my life. My
siblings Petri, Venla, Eliisa and Teppana, together with their spouses, my
friends and cousins, and godparents Malla and Lasu, have always let me re-
lax and forget molecular modelling by not asking too many questions about
my work. Lauri Karmila / citronacid.com is thanked for designing the cover
of this book.
Finally and most importantly: Minttu, Aada and Lassi, you are the world to
me.
Helsinki, January 2009
Sampo Karkola
viii
List of original publications
This thesis is based on the following original publications, which are re-
ferred to in the text by their Roman numerals, and on unpublished results
described in the text.
I Sampo Karkola, Hans-Dieter Holtje and Kristiina Wahala, A three-
dimensional model of CYP19 aromatase for structure-based drug de-
sign. The Journal of Steroid Biochemistry and Molecular Biology 105, 63-70,
2007.
II Sampo Karkola and Kristiina Wahala, The binding of lignans, flavo-
noids and coumestrol to CYP450 aromatase: A molecular modelling
study. Molecular and Cellular Endocrinology, in press.
DOI:10.1016/j.mce.2008.10.003
III Sampo Karkola, Annamaria Lilienkampf and Kristiina Wahala, A 3D
QSAR model of 17β-HSD1 inhibitors based on a thieno[2,3-d]pyrim-
idin-4(3H)-one core applying molecular dynamics simulations and li-
gand–protein docking. ChemMedChem 3, 461-472, 2008.
IV Sampo Karkola, Sari Alho-Richmond and Kristiina Wahala, Pharma-
cophore modelling of 17β-HSD1 enzyme based on active inhibitors
and enzyme structure. Molecular and Cellular Endocrinology, in press.
DOI:10.1016/j.mce.2008.08.030

The author’s contribution to the publications is as follows:
I Model building, validation, analyses and manuscript preparation.
II Simulations and analyses of the complexes, dockings and their analy-
sis and manuscript preparation.
III Simulations and analyses, dockings and their analysis, building and
analysis of the 3D QSAR model and most of the manuscript prepara-
tion. This publication was also part of Dr. Annamaria Lilienkampf’s
thesis (University of Helsinki, 2007) concerning the synthesis of 17β-
HSD1 inhibitors.
IV Pharmacophore generations, virtual screening experiments, analyses
and manuscript preparation.
x

List of Abbreviations
17β-HSDcl . . . . . . 17β-hydroxysteroid dehydrogenase
from Cochliobolus lunatus
17β-HSD1 . . . . . . . human 17β-hydroxysteroid dehydrogenase
type 1 enzyme
AI . . . . . . . . . . . . . . . aromatase inhibitor
ANF . . . . . . . . . . . . α-naphthoflavone
ASD . . . . . . . . . . . . . androstenedione
CoMFA . . . . . . . . . . comparative molecular field analysis
CoMSIA . . . . . . . . . comparative molecular similarity indices analysis
CYP2C5 . . . . . . . . . rabbit cytochrome P450 2C5, progesterone 21-hydroxylase
CYP2C9 . . . . . . . . . human cytochrome P450 2C9, a drug
metabolising enzyme
CYP450 . . . . . . . . . cytochrome P450
CYP450arom . . . . . . cytochrome P450 aromatase
CYP450BM−3 . . . . . cytochrome P450 fatty acid monooxygenase
from Bacillus megaterium
CYP450cam . . . . . . . cytochrome P450 camphor monooxygenase
from Pseudomonas putida
CYP450eryF . . . . . . cytochrome P450 6-deoxyerythronolide B hydroxylase
from Saccaropolyspora erthrea
CYP450scc . . . . . . . cytochrome P450 side-chain cleavage enzyme
CYP450terp . . . . . . . cytochrome P450 α-terpineol monooxygenase
from Pseudomonas putida
xi

DFT . . . . . . . . . . . . . density functional theory
DHEA . . . . . . . . . . . dehydroepiandrosterone
DHEA-S . . . . . . . . . dehydroepiandrosterone sulfate
END . . . . . . . . . . . . enterodiol
ENL . . . . . . . . . . . . . enterolactone
E1 . . . . . . . . . . . . . . . estrone
E2 . . . . . . . . . . . . . . . 17β-estradiol
GA . . . . . . . . . . . . . . genetic algorithm
HTS . . . . . . . . . . . . . high-throughput screening
IC50 . . . . . . . . . . . . . inhibition concentration required to reduce
the biological activity by half
Ki . . . . . . . . . . . . . . . equilibrium dissociation constant
KM . . . . . . . . . . . . . . Michaelis-Menten constant
MAT . . . . . . . . . . . . matairesinol
MDS . . . . . . . . . . . . molecular dynamics simulation
NADPH . . . . . . . . . reduced form of nicotinamide adenine dinucleotide
phosphate
NADP+ . . . . . . . . . nicotinamide adenine dinucleotide phosphate
NDGA . . . . . . . . . . nordihydroguaiaretic acid
PDB . . . . . . . . . . . . . The Protein Data Bank
PLS . . . . . . . . . . . . . partial least squares analysis
PME . . . . . . . . . . . . particle-mesh Ewald method
QSAR . . . . . . . . . . . quantitative structure-activity relationship
SDR . . . . . . . . . . . . . short-chain dehydrogenase/reductase enzyme
SERM . . . . . . . . . . . selective estrogen receptor modulator
SI . . . . . . . . . . . . . . . secoisolariciresinol
STS . . . . . . . . . . . . . . steroid sulfatase
ST . . . . . . . . . . . . . . . steroid sulfotransferase
T . . . . . . . . . . . . . . . . testosterone
Vmax . . . . . . . . . . . . . the maximal reaction velocity of an enzyme
xii

Chapter 1
Introduction
Molecular modelling has become an essential tool in several fields of sci-
ence, including chemistry, physics, drug discovery, and biochemistry, to
name a few. The first efforts to model the structure of molecules were the
hand-drawn sketches of atoms joined together with bonds that appeared
in 1860s. Understandably, these models provided little (and then proba-
bly false) information about the actual 3D structure or the physico-chemical
properties of the molecule. In 1874, the Dutch chemist Jacobus Henricus
van’t Hoff and the French chemist Joseph Le Bel independently identified
the tetrahedral carbon as responsible for phenomena observed during their
studies on optical activity and stereochemistry. Since then, modelling has
developed to the Dreiding stick models used in solving the structure of
DNA, and now to computer-assisted studies. Today, modelling is done
solely on computers, and as the computational resources and method de-
velopment continue to expand, increasingly sophisticated models can be
built, simulated and analysed. With multi-core supercomputers and par-
allel computing, highly accurate calculations can be performed on small
molecules and larger biological systems, such as membrane-bound proteins
and lipid membranes containing large biomolecules totalling as many as
million atoms, can be modelled an simulated.
1

Chapter 1. Introduction
Breast cancer is the most common cancer in women in Western countries.
More than 180,000 new cases and over 40,000 deaths are expected to occur
in the United States in 2008 [1]. Approximately 60 % of pre-menopausal
and 75 % of post-menopausal cancers are hormone dependent [2]. In these
cancers, the cell proliferation and, therefore, tumour formation and devel-
opment are dependent on the availability of endogenous estrogens. These
are produced mainly by the ovaries, but also in adipose tissue, breast, skin
and bone [3]. Estrogen receptor-positive breast cancer can be treated by in-
terfering with either estrogen production or estrogen action [4]. To block
estrogen production, it is necessary to inhibit the enzymes responsible for
producing the estrogens: namely, CYP450 aromatase by using aromatase
inhibitors (AI), or 17β-hydroxysteroid dehydrogenase type 1 (17β-HSD1).
Inhibitors for 17β-HSD1 have not yet been developed. To prevent estrogen
action, the estrogen receptors in the tumour tissue cells are blocked with
selective estrogen receptor modulators (SERM). While SERMs can be used
in treating the breast cancer of both pre- and post-menopausal women, AIs
are only effective administered to post-menopausal women since they do
not stop the estrogen production in the ovaries of pre-menopausal women
[1] but only the local estrogen production in the cancer tissue. AIs are also
used to induce ovulation in pre-menopausal women [5]. When estrogen
production in the ovaries of pre-menopausal women is reduced, the levels
of gonadotropins become elevated and follicular growth is stimulated.
This thesis describes molecular modelling studies on two estrogen-produc-
ing human enzymes, aromatase and 17β-HSD1. The structure of aromatase
has yet to be solved, and therefore homology modelling (comparative mod-
elling) was used to predict its 3D structure. The model of aromatase was
built using the first crystallised mammalian CYP450 enzyme, rabbit CYP2C5,
as template. The model was validated with exhaustive molecular dynamics
simulations (MDS) with and without the natural substrate, androstenedione
(ASD). With the model in hand, the binding of dietary phytoestrogens and
their metabolites was studied.
2

The crystal structure of 17β-HSD1 was solved in 1995, and it was used in
the modelling work to study the interactions between the 17β-HSD1 en-
zyme and inhibitors synthesised in our laboratory. The dynamic process of
inhibitor binding to 17β-HSD1 was studied by MDS with use of the crys-
tal structure of the enzyme. Plausible binding modes of our 17β-HSD1 in-
hibitors were predicted with ligand–protein docking. A 3D QSAR model of
the inhibitors was created using biological data measured at Hormos Ltd.
and the alignment obtained from the dockings. Additionally, the important
interactions between the enzyme and the inhibitors were identified by phar-
macophore modelling. The resulting pharmacophore models were used as
a query in virtual screening searches aimed at finding new lead compounds
for our drug discovery project.
The topics reviewed in the following chapters 2-5 concern estrogen biosyn-
thesis and the roles of aromatase and 17β-HSD1 in it, previous molecular
modelling studies performed on these two enzymes, the role of phytoe-
strogens as aromatase inhibitors, and methods used in modern computer-
assisted molecular modelling.
3

Chapter 1. Introduction
4

Chapter 2
Estrogen biosynthesis
Estrogens are endogenous female hormones having a tetracyclic structure
with three six-membered rings and one five-membered ring fused together
to form a rigid and planar molecular skeleton. Estrogens differ from male
hormones, androgens, in having an aromatic ring A and lacking the C19
methyl group. Figure 2.1 shows the structures and stereochemistry of an-
drostenedione 1 (ASD) and estradiol 2 (E2).
22
33
4455
1010
11
66
77
88
99 1414
1313
1212
1111
1515
1616
1717
1818 O
O
an androgen(androstenedione ASD 1)
1919
OH
HO
an estrogen(17β-estradiol E2 2)
H
H
H H
H
H
Figure 2.1 – The structures of an androgen and an estrogen withstereochemistry and atom numbering shown. For clarity, hydro-gens connected to carbon atoms are omitted from the 3D models.Oxygen atoms are coloured red.
5

Chapter 2. Estrogen biosynthesis
Estrogens are produced in a multistep route starting from cholesterol 3,
which is first converted to pregnenolone 4 by cytochrome P450 side-chain
cleavage enzyme (CYP11A1, CYP450scc) (Figure 2.2). [6, 7] From pregnen-
olone 4, two major routes are possible. The ∆5 pathway, preferred in hu-
mans, proceeds via conversion to 17α-hydroxypregnenolone 5 by CYP17
(17α-hydroxylase), and to dehydroepiandrosterone 6 (DHEA) by the same
enzyme. DHEA 6 is converted to ASD 1 by 3β-hydroxysteroid dehydro-
genase (3β-HSD) and can be further converted to testosterone 7 (T) by 17β-
hydroxysteroid dehydrogenase (17β-HSD) enzymes. The ∆4 pathway, dom-
inant in rat, hamster and guinea-pig [8], proceeds via the conversion of preg-
nenolone to progesterone, 17α-hydroxyprogesterone and ASD. Either way,
the aliphatic ring A of the androgen (ASD 1 or T 7) is finally aromatised
by the aromatase enzyme complex to produce the estrogen (estrone E1 8 or
estradiol E2 2) (Figure 2.3). E1 8, the less potent estrogen, is converted to
the biologically active estrogen E2 2 by 17β-HSD1. After menopause, the
main sites for estrogen production are the peripheral tissues such as adi-
pose tissue, breast tissue and skin. [9] Here, estrogens, not to be delivered to
the circulation, but to be used in situ, are produced from adrenal precursors
DHEA 6 and its 3-sulfate (DHEA-S).
HO
cholesterol 3
HO
O
pregnenolone 4
CYP11A1 CYP17
HO
O
dehydroepiandrosterone DHEA 6
HO
O
17α-hydroxypregnenolone 5
OH
CYP17
O
O
androstenedione ASD 1
3β-HSD
Figure 2.2 – The formation of androstenedione from cholesterol.
6

Aromatase and 17β-HSD1 enzymes are the key players in the final steps of
estrogen biosynthesis leading to the inactive precursor E1 8 and the active
estrogen E2 2, respectively. The storage forms of estrogens (estrone-3-sulfate
9 and estradiol-3-sulfate 10) are formed by linkage of a sulfate group to the
phenolic 3-hydroxy group by steroid sulfotransferase (ST) (Figure 2.3). [10]
Most of the circulating estrogens are, in fact, sulfoconjugates, cleaved by
the steroid sulfatase enzyme (STS) when needed.[11] Estrogens bind to the
nuclear estrogen receptors (α or β) and cause a cascade of reactions lead-
ing to cell proliferation and, in cancer tissue, to tumour development [10].
Estrogens also exert extra-nuclear effects via kinases, ion channels, G pro-
teins and growth factor receptors, in addition to the genomic effects caused
by nuclear receptor binding.[12] Interfering with either estrogen formation
or its cellular effects has been a target for controlling hormone-dependent
tumour formation and development. The interference of estrogen forma-
tion involves blocking the actions of the endogenous enzymes producing
estrogens. Estrogen-producing enzymes include aromatase, which converts
O
HO
estrone E1 8
O
O
androstenedione ASD 1
aromatase
OH
O
testosterone T 7
OH
HO
estradiol E2 2
17β-HSD217β-HSD417β-HSD817β-HSD10
17β-HSD117β-HSD517β-HSD7
17β-HSD217β-HSD8
17β-HSD317β-HSD5
aromatase
O
O
OH
O
estradiol-3-sulfate 10
S
O
OHO
S
O
OHO
estrone-3-sulfate 9
STS
ST
STS
ST
Figure 2.3 – The final steps and the enzymes involved in estrogenbiosynthesis.
androgens to estrogens; 17β-HSD1, which converts estrone E1 8 (the prod-
uct of aromatase) to the biologically active estradiol E2 2, and STS, which
7

Chapter 2. Estrogen biosynthesis
releases estrogens from their sulfate storage forms. Interfering with the cel-
lular effects of estrogen, when it binds to cell nuclear receptors, involves
blocking of the estrogen receptor functions. This can be achieved with se-
lective estrogen receptor modulators (SERMs), which bind to the estrogen
receptors in place of the actual hormone. Commercial drugs representing
both aromatase inhibitors and SERMs are now widely used in the treatment
of hormone-dependent cancers.
8
Chapter 3
CYP450 aromatase
CYP450 enzymes catalyse a wide range of reactions from xenobiotic me-
tabolism to drug metabolism and steroid biosynthesis [13, 14]. Despite the
marked variation in sequence identities, the CYP450 enzymes share a com-
mon tertiary fold consisting of 12 – 15 α-helices (A through L) and four
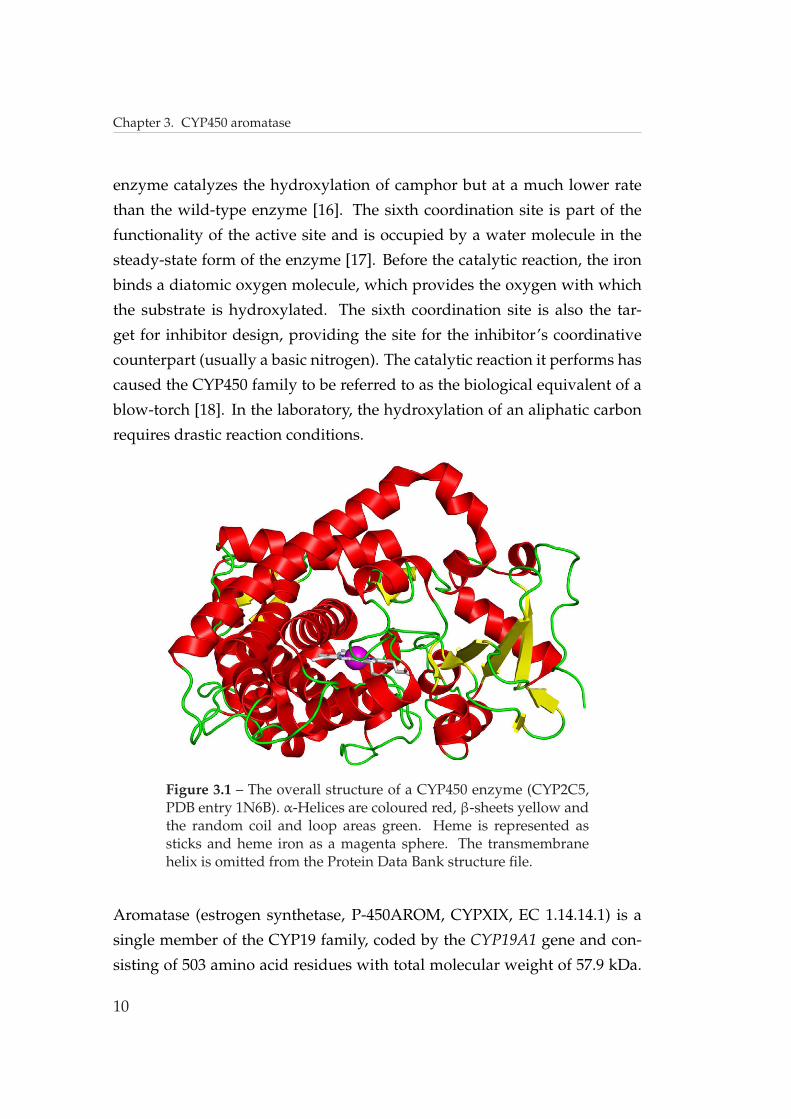
β-sheets (1 through 4) (Figure 3.1) [15]. The eucaryotic CYP450 enzymes are
bound to the endoplasmic reticulum via a transmembrane helix located at
the N-terminus of the sequence. Because of this binding, solubilisation of
the enzymes requires the use of detergents, which easily destroy the del-
icate protein fold. A catalytically crucial protoporphyrin IX group with a
bound iron atom (the heme group, Figure 3.2) is located in the active site
of the enzymes. The iron atom is responsible for the oxidations performed
to the substrates. The iron in the heme ring has an octahedral coordina-
tion geometry with six coordination sites, with four of them occupied by
the nitrogens of the planar protoporphyrin ring. In contrast to other cy-
tochromes having a nitrogenous base coordinating to the heme iron as a
fifth ligand, the CYP450 enzymes have a thiolate anion, the side chain of
a cysteine, as fifth ligand (C437 in aromatase). The thiolate anion is essen-
tial for the activity, as is shown by mutating the coordinating cysteine to
a histidine for CYP450 camphor monooxygenase (CYP450cam): the mutant
9
Chapter 3. CYP450 aromatase
enzyme catalyzes the hydroxylation of camphor but at a much lower rate
than the wild-type enzyme [16]. The sixth coordination site is part of the
functionality of the active site and is occupied by a water molecule in the
steady-state form of the enzyme [17]. Before the catalytic reaction, the iron
binds a diatomic oxygen molecule, which provides the oxygen with which
the substrate is hydroxylated. The sixth coordination site is also the tar-
get for inhibitor design, providing the site for the inhibitor’s coordinative
counterpart (usually a basic nitrogen). The catalytic reaction it performs has
caused the CYP450 family to be referred to as the biological equivalent of a
blow-torch [18]. In the laboratory, the hydroxylation of an aliphatic carbon
requires drastic reaction conditions.
Figure 3.1 – The overall structure of a CYP450 enzyme (CYP2C5,PDB entry 1N6B). α-Helices are coloured red, β-sheets yellow andthe random coil and loop areas green. Heme is represented assticks and heme iron as a magenta sphere. The transmembranehelix is omitted from the Protein Data Bank structure file.
Aromatase (estrogen synthetase, P-450AROM, CYPXIX, EC 1.14.14.1) is a
single member of the CYP19 family, coded by the CYP19A1 gene and con-
sisting of 503 amino acid residues with total molecular weight of 57.9 kDa.
10
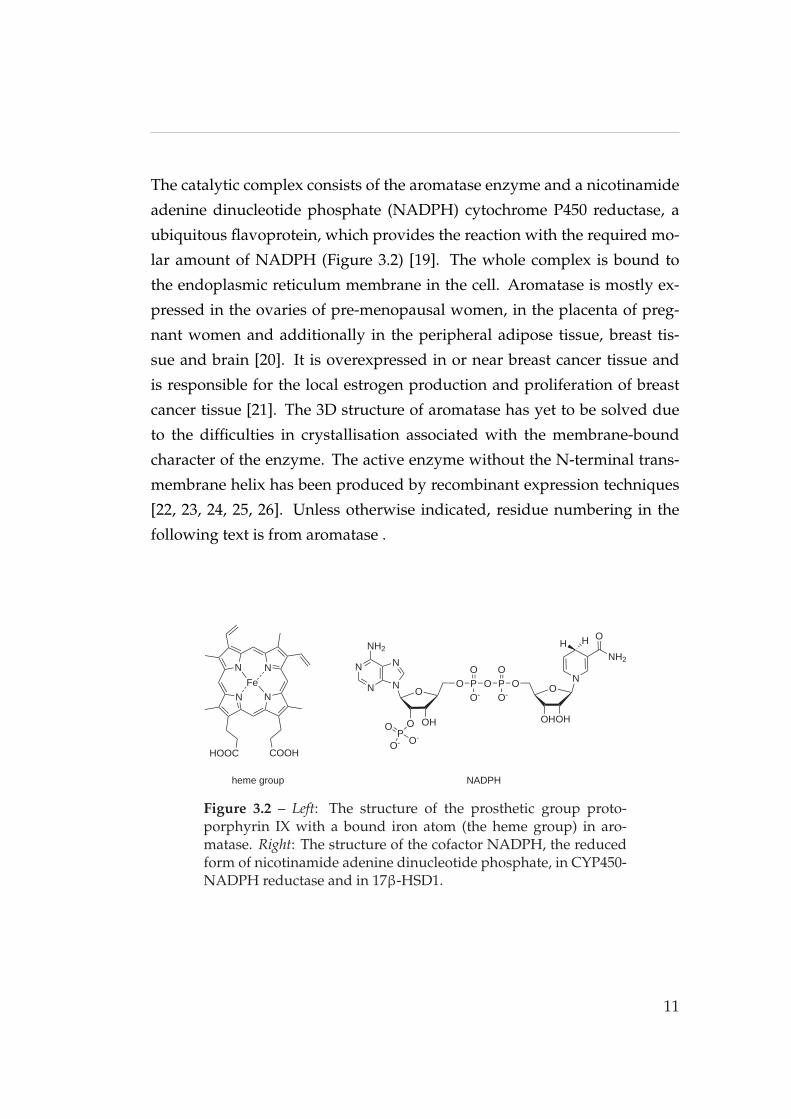
The catalytic complex consists of the aromatase enzyme and a nicotinamide
adenine dinucleotide phosphate (NADPH) cytochrome P450 reductase, a
ubiquitous flavoprotein, which provides the reaction with the required mo-
lar amount of NADPH (Figure 3.2) [19]. The whole complex is bound to
the endoplasmic reticulum membrane in the cell. Aromatase is mostly ex-
pressed in the ovaries of pre-menopausal women, in the placenta of preg-
nant women and additionally in the peripheral adipose tissue, breast tis-
sue and brain [20]. It is overexpressed in or near breast cancer tissue and
is responsible for the local estrogen production and proliferation of breast
cancer tissue [21]. The 3D structure of aromatase has yet to be solved due
to the difficulties in crystallisation associated with the membrane-bound
character of the enzyme. The active enzyme without the N-terminal trans-
membrane helix has been produced by recombinant expression techniques
[22, 23, 24, 25, 26]. Unless otherwise indicated, residue numbering in the
following text is from aromatase .
N
N N
N
HOOC COOH
Fe
N
N
NH2
N
N
OP
OO-
O-
O PO
O-O P
O
O-O N
O
NH2
H H
OH
O O
OHOH
heme group NADPH
Figure 3.2 – Left: The structure of the prosthetic group proto-porphyrin IX with a bound iron atom (the heme group) in aro-matase. Right: The structure of the cofactor NADPH, the reducedform of nicotinamide adenine dinucleotide phosphate, in CYP450-NADPH reductase and in 17β-HSD1.
11

Chapter 3. CYP450 aromatase
3.1 Substrate recognition sites
The active site of the CYP450 enzymes consists of the heme ring at one
wall and six common substrate recognition sites (SRS), as defined by Go-
toh [27] for CYP2 family enzymes (Figure 3.3). SRS-1 is located between the
B- and C-helices, where an additional B’-helix is observed in some CYP450
enzymes. SRS-2 and SRS-3, or the C-terminus of the F-helix and the N-
terminus of the G-helix, are located on the opposite wall of the active site
from the heme ring. This area varies among CYP450 family members show-
ing helices and loops of different lengths and with none, one or two addi-
tional helices (F’ and G’).[28] SRS-4 is located in the I-helix, which protrudes
through the whole enzyme and includes residues that are highly conserved
among the CYP450 enzymes. An interesting residue at SRS-4 is P308, which,
due to the inability to form a stabilising backbone hydrogen bond to the ad-
jacent L304, causes a kink in the I-helix. The active-site wall opposite the
I-helix consists mainly of SRS-5, the hydrophobic coil between the K-helix
and the β1-4-strand. SRS-6 is located in the β-sheet 4 or, more accurately, in
the hairpin turn between the two strands β4-1 and β4-2. This site includes
amino acids thought to be important not only to substrate recognition but
also to the catalytic activity (see Section 3.4 on page 20).
Figure 3.3 – A stereo image of the structural elements correspond-ing to the substrate recognition sites (SRS) of CYP2C5. SRS-1 iscoloured red, SRS-2 green, SRS-3 blue, SRS-4 yellow, SRS-5 cyanand SRS-6 orange. Heme is represented as sticks and the hemeiron as a magenta sphere.
12

3.2. Mechanism of the catalytic reaction
3.2 Mechanism of the catalytic reaction
Human aromatase catalyses a reaction in which the aliphatic ring A of an an-
drogen (ASD 1 or T 7) is converted to the aromatic ring A of an estrogen (E1 8
or E2 2). ASD is the preferred substrate (Figure 3.4) [29]. The overall reaction
requires three moles of oxygen and three moles of NADPH per one mole of
the substrate. The conversion from an aliphatic C19 androgen to an aromatic
C18 estrogen occurs in a sequence of three hydroxylation steps. Before the
O
O
androstenedione ASD 1
O
O
HO
O
O
HOOH
19-hydroxyandrostenedione 11
19-gem-dihydroxyandrostenedione 12
O2, NADPH
aromatase
O
HO
estrone E1 8
+ HCOOH + H2O
C19
O2, NADPH
aromatase
O2, NADPH
aromatase
Figure 3.4 – The overall aromatisation reaction of androgens. TheC19 is hydroxylated in three consecutive steps producing the es-trogen, formic acid and water.
catalytic reaction, the hydroxylating agent iron(IV)-oxo porphyrin radical
cation is formed by the addition of an electron pair, an oxygen molecule
and two protons to the heme iron (Figure 3.5) [17]. The catalysis starts with
the hydroxylation of C19 of ASD to give C19-hydroxyandrostenedione 11
by hydrogen abstraction–oxygen rebound mechanism [17, 30], followed by
another hydroxylation to the same carbon producing C19-gem-dihydroxy-
androstenedione 12. Although the mechanism of the third step has not
yet been solved, density functional theory (DFT) calculations and ab initio
dynamics simulations [31] suggest that first the 1β-hydrogen is abstracted
by the oxygen atom bound to the iron, facilitated by the enolisation of the
3-carbonyl. Subsequently, an electron is transferred from the alkyl radical
13

Chapter 3. CYP450 aromatase
FeIIIIII
FeIIII
e- O2Fe
IIIIII
OO
e-Fe
IIIIII
OO
H+
FeIIIIII
OOH
H+,-H2OFe
VV
O
Fe N
N N
NFe
COOHHOOC
=
FeIVIV
O
+
iron(V)-oxo species
Figure 3.5 – The formation of the iron(V)-oxo species, redrawnfrom reference [17].
FeIVIV
O
+
H
OH
HOOH
FeIVIV
O
OH
HOOH H
e- transfer
FeIIIIII
O
OH
HOO
H
H
FeIIIIII
OHH
-HCOOH
1β-H abstraction
OH
Figure 3.6 – The third step of the aromatase catalysed reaction pro-ducing the estrogen, formic acid and water, redrawn from refer-ence [31].
14

3.3. Homology modelling of aromatase
to the iron, and the gem-diol 12 is deformylated to the estrogen, formic acid
and water (Figure 3.6).
3.3 Homology modelling of aromatase
The lack of an experimental structure for aromatase requires other meth-
ods to be used in studying the overall protein fold and the structure of the
active site. These methods include in silico structure prediction tools such
as homology modelling and threading, as well as mutagenesis studies. Aro-
matase is a distant relative of other CYP450 enzymes, and the amino acid se-
quence identity to other CYP450 enzymes is approximately 20 % [32]. Build-
ing a homology model on the basis of a template with such a low sequence
identity is usually considered to be difficult and the results to be unreliable.
Despite the low sequence identity, however, all CYP450 enzymes possess a
common tertiary fold [28] (see Figure 3.1 on page 10), which makes it possi-
ble to derive the structure of an unknown CYP450 protein from on a known
one. Certain residues and the secondary structures are conserved in vary-
ing degrees throughout the CYP450 enzymes, although α-helices, β-strands,
turns and loops vary in length and amino acid constitution.
Differing from mammalian CYP450 enzymes, bacterial CYP450 enzymes
are not bound to the endoplasmic reticulum but are soluble. This prop-
erty makes it easier to crystallise them and to determine the 3D structure by
X-ray diffraction methods. Once the first bacterial CYP450 enzyme struc-
ture, cytochrome P450 camphor monooxygenase from Pseudomonas putida
(CYP450cam), was solved, in 1985 [33], the homology modelling of CYP450
enzymes could commence. The first aromatase models were based on this
and other bacterial crystal structures. Graham-Lorence et al. [34] created
an active site model by aligning the sequences of aromatase and CYP450cam.
The residues in the heme binding region and the I-helix of CYP450cam were
replaced by residues from aromatase. The other parts of the protein were
15

Chapter 3. CYP450 aromatase
deleted and energy minimisations were performed. Examination of the
model and the orientation of camphor in the CYP450cam crystal structure
suggested the orientation of the substrate androstenedione (ASD). The ac-
tive site model was also used to study the effects of mutagenesis experi-
ments performed on aromatase (see Section 3.4 on page 20).
Zhou et al. [35] developed an active site model for aromatase using a similar
approach, that is, replacing the residues of CYP450cam in the I-helix with
those of aromatase. The resulting I-helix was then energy minimised and
the substrate ASD was placed in the active site. A similar positioning of
ASD as in the work of Graham-Lorence [34] was suggested.
Laughton et al. [36] in 1993, were the first to use molecular dynamics sim-
ulations (MDS) in relaxing and validating the aromatase model. The se-
quences of aromatase and CYP450cam were aligned using an automated mul-
tiple alignment procedure [37], and the secondary structure elements were
predicted by the algorithm developed by Zvelebil et al [38]. The backbone
coordinates of the core parts of aromatase were assigned from the template,
and the loop backbone coordinates were generated with the loop-fitting pro-
cedure in QUANTA software [39]. The coordinates for the side chains were
assigned from the template, where applicable, and the rest of the side chains
were assigned arbitrary conformations. The system was energy minimised
starting from the least-well-defined parts and gradually moving to the bet-
ter predicted parts. Simulated annealing (a series of heating and cooling
of the system) was applied to the loops and undetermined core structures.
ASD was inserted into the active site cavity, and a 10 ps MDS at 300 K was
performed. As a result, a model for the active site and the orientation of the
substrate were suggested.
Later, in 1993 and 1994, two more bacterial CYP450 enzyme crystal struc-
tures were solved (cytochrome P450 bacterial fatty acid monooxygenase
CYP450BM−3 from Bacillus megaterium [40] and cytochrome P450 α-terpineol
monooxygenase CYP450terp from Pseudomonas putida [41]). CYP450BM−3 was
16

3.3. Homology modelling of aromatase
the first class II CYP450 enzyme, that is, a CYP450 enzyme interacting with
an NADPH-P450 reductase, whose structure was solved. These new struc-
tures provided more information on the sequence alignments between aro-
matase and the templates, and therefore, on the 3D structure of aromatase.
On the basis of the new sequence alignment, a new core structure was sug-
gested for aromatase [42]. A de novo structure construction was combined
with replacement of CYP450BM−3 residues by ones from aromatase. Min-
imisations and MDS for a few picoseconds in vacuum were applied to relax
the model. The orientation of the substrate ASD was also suggested.
Koymans et al. [43] developed a model of aromatase using CYP450cam as
the template. After sequence alignment, ASD and several non-steroidal
aromatase inhibitors were manually placed inside the active site and the
complexes were energy minimised. Analyses of the minimised structures
indicated that the C-terminus of the aromatase sequence (471-486) is an im-
portant part of the active site.
A CYP450BM−3 based model was generated by Kao et al. [44] using an
alignment from Nelson [45]. The alignment was manually refined and main
chain coordinates of the core region were taken from the template. The loop
areas were searched from a database and the side-chain conformations were
predicted on the basis of a local homology relationship [46] followed by min-
imisation. The generated model was compared with the CYP450cam -based
model of Laughton et al. [36]. Because of differences in the lengths of helices
F and G, and thus, difficulties in positioning the substrate ASD, the authors
preferred the model based on CYP450cam.
Lewis and Lee-Robichaud [47] generated homology models for four steroido-
genic CYP450 enzymes (cholesterol side-chain cleavage enzyme, 17-α-hy-
droxylase, aromatase and 21-hydroxylase) based on the crystal structure of
CYP450BM−3. After a computer-assisted sequence alignment, a manual re-
finement was performed and the models were generated by the Biopolymer
module implemented in the Sybyl software [48]. The crude models were en-
17
Chapter 3. CYP450 aromatase
ergy minimised, and substrates and inhibitors were docked into the models.
The results were in broad agreement with mutagenesis data at hand.
Cavalli et al. [49] generated an aromatase model based on an alignment
taken from Graham-Lorence et al [42] that was refined by aromatase sec-
ondary structure predictions from the PsiPred server [50, 51]. The authors
used the structure of CYP450cam with a bound phenylethylimidazole deriva-
tive because they were generating a model for the interaction between a
specific class of inhibitors and aromatase. SCR regions of aromatase were
generated from the template, while the SVR regions were built de novo. Be-
fore the optimisation of the generated structures, two inhibitors were placed
in the active site, using their crystal coordinates and interacting them with
the heme iron. After energy minimisations, the complexes were subjected to
molecular dynamics simulations for 100 ps at physiological temperature to
relax and optimise the models. Average structures from the stable simula-
tion trajectory were used to analyse the interactions between the inhibitors
and aromatase. The interactions were found to be similar to those presented
earlier by Koymans [43]. Additionally, a 3D QSAR model was generated by
the comparative molecular field analysis method (CoMFA).
Auvray et al. [52] also used the alignment from Graham-Lorence et al [42].
The core region coordinates were taken from the template (CYP450BM−3)
and the loops were searched from a database. The crude models were en-
ergy minimised, after which the substrate ASD was placed inside the active
site and the complex was minimised. The effect of several mutations of aro-
matase was studied with the help of the model.
The first mammalian CYP450 enzyme structure was solved in 2000 [13]. This
was CYP2C5, rabbit 21-progesterone hydroxylase, which catalyses the hy-
droxylation of C21 of progesterone. Because both aromatase and CYP2C5
are membrane-bound mammalian CYP450 enzymes with a steroid as a sub-
strate, it was clear that the newly solved structure provided a better tem-
plate for homology modelling of human aromatase than the soluble bac-
18

3.3. Homology modelling of aromatase
terial CYP450 enzymes. The first homology model based on this template
was reported by Chen et al. [53], though neither the sequence alignment be-
tween CYP2C5 and aromatase nor the details of the modelling process were
published. Loge et al. [32] also built a model based on CYP2C5, but used
a crystal structure with a bound inhibitor (PDB entry 1N6B [54]). The se-
quence alignment was generated with ClustalW [55] and refined using the
PsiPred server [50, 51]. The actual aromatase model was generated with the
Nest program implemented in Jackal software [56, 57]. The crude model
was energy minimised gradually from the core side chains to the core main
chains, after which two inhibitors were docked into the active site of the
enzyme using GOLD [58]. The results from the docking studies were in
agreement with previously reported results [59, 60, 61, 53, 62].
The crystal structure of the first human cytochrome P450 enzyme, CYP2C9,
was solved in 2003 [63]. CYP2C9, a drug-metabolising CYP450 enzyme, was
subsequently used by Favia et al [64] as a template for aromatase homology
modelling. The sequence alignment was done with the LALIGN server [65],
and secondary structure elements were predicted with the PsiPred server
[50, 51]. Several models were generated using the MODELER software [66].
The top ranking model was validated with MDS (10 ns simulation time) us-
ing the AMBER8 software [67]. In addition to the aromatase model, the au-
thors used DFT calculations to develop parameters for the protoporphyrin
IX ring with bound iron and cysteine coordination.
A model based on CYP2C5 was developed by Murthy et al. [68] to study
the acidic residues located in the active site of aromatase. However, the se-
quence alignment was not published. The model was built with the MOD-
ELER software [66] and energy minimised for a starting structure for MDS.
The simulation was performed in water for 1 ns using AMBER6. The acid-
ity of certain active site residues was predicted with and without natural
substrates.
The model described in detail in publication I was built on CYP2C5, a mam-
19

Chapter 3. CYP450 aromatase
malian CYP450 enzyme that has a steroid as a substrate. The crystallised
human CYP2C9 was also available, but as it is not a steroid-metabolising
CYP450 enzyme, its use as a template was rejected.
3.4 Mutagenesis studies on aromatase
The aromatase enzyme has been a target for nearly 80 mutagenesis studies.
Most of these were performed to identify the residues contributing to the
active site and the catalytic mechanism, while some involved mutations to
residues outside the active site to clarify the effect on the overall tertiary fold
(and the function) of the enzyme. In view of the large number of studies per-
formed, only the results for the most important residues are discussed in the
following. Most mutagenesis investigations have been performed in whole-
cell assays, in which the kinetic constants KM (Michaelis-Menten constant;
the substrate concentration at which the enzymatic reaction velocity is half
of its maximal value) and Vmax (the maximal reaction velocity) may be af-
fected by intracellular actions. Although microsomal preparations in vitro
would, thus, be more reliable in determining kinetic constants, in vitro as-
says have the disadvantage of not representing living cells. Unless other-
wise indicated, the substrate in the assays discussed below is androstene-
dione (ASD). All the mutagenesis studies performed to date are listed in
Table 3.1.
Most of the mutated residues are located at SRS-1 and SRS-4. SRS-1 is the
B–C loop (Figure 3.3 on page 12) forming one wall of the active site and
including a B’-helix in some of the CYP450 enzymes.[28] There are two hy-
drophobic residues that are thought to interact directly with the substrate,
namely I133 and F134. The mutation of I133 to bulkier residues (I133W
and I133Y, [44]) indeed leads to a dramatically reduced Vmax and an in-
creased KM in microsomal assay, indicating that the volume of the active
site is diminished and, therefore, less favoured for the substrate. Amarneh
20

3.4. Mutagenesis studies on aromatase
et al. [69] found that mutant F134E, where a bulky hydrophobic residue is
changed to a negatively charged one, has similar KMbut higher Vmax value
than the wild-type enzyme. This indicates that the F134E mutation leads
to a more active enzyme, although the affinity for the substrate remains ap-
proximately the same. It was suggested that a negatively charged residue at
this position takes part in the catalytic mechanism. The group also designed
a double mutant F134E|E302A to find out if a negatively charged residue at
134 could replace the functionality of a negatively charged residue at 302.
However, the results of this study have not yet been published.
Table 3.1 – Mutagenesis studies reported to date for the aromataseenzyme.
Mutationa SRSb Ref. Mutationa SRSb Ref. Mutationa SRSb Ref.-10Nc – [69] L228E 2 [69] R365A – [70]-20Nd – [69, 70] K230A 3 [62] R365K – [70]T14A – [69] K230R 3 [62] V388E – [69]F116E – [69] F235L 3 [44] I395F – [44, 71]K119E 1 [52] F235N 3 [72] F406R – [73, 74]K119T 1 [52] C299A 4 [35] H457N – [52]K119V 1 [52] E302A 4 [52] S470N – [52]K119Y 1 [52] E302D 4 [34, 62, 75] I471M – [52]G121A 1 [72] E302Q 4 [34] I474F – [72]Q123E 1 [70] E302V 4 [34] I474M – [44]Q123H 1 [70] E302A 4 [34, 52] I474N – [44]C124Y 1 [52] E302L 4 [35] I474T – [52]I125M 1 [52] GAGVe 4 [34] I474W – [44]I125N 1 [72] A307G 4 [34] I474Y – [44, 71]H128A 1 [35] P308F 4 [73, 76, 74, 71] H475A – [52]H128Q 1 [35] P308V 4 [34] H475E – [52]K130N 1 [52] D309A 4 [35, 76, 74, 71, 52, 75] H475R – [52]I133M 1 [77] D309N 4 [35, 76, 74, 69] D476A – [52]I133W 1 [44] D309V 4 [69] D476E – [52]I133Y 1 [44, 71] T310A 4 [69] D476K – [52]F134E 1 [69] T310C 4 [70] D476L – [52]K216A 2 [62] T310S 4 [70, 69, 44] D476N – [52]K216R 2 [62] S312C 4 [35] S478A 6 [62]Q225A 2 [69] F320C – [52] S478T 6 [62, 75]Q225N 2 [69] Y361F – [73] H480K 6 [62]L228A 2 [69] Y361L – [73] H480Q 6 [62, 75]
aFor a list of amino acids and their abbreviations, see page 97bDefined for CYP2 family enzymes [27]cDeletion of the first 10 N-terminal residuesdDeletion of the first 20 N-terminal residueseI305G, A306A, A307G, P308V
21

Chapter 3. CYP450 aromatase
The residues located at SRS-4 (Figure 3.3 on page 12), that is, the centre of the
I-helix, form an important part of the active site and most likely participate
in the catalytic mechanism. Not surprisingly they have been the subject of
several mutagenesis studies. The mutation of the negatively charged E302 to
hydrophobic residues Ala, Leu or Val or to a polar residue Gln led to unsta-
ble or inactive enzymes.[34, 35, 52] Moreover, E302D exhibited dramatically
decreased activity compared with that of the wild-type enzyme, suggesting
that even an Asp cannot properly replace the functionality of a Glu at this
position.[34, 62] P308 is an interesting residue located at the centre of the
I-helix. Because it cannot form a a hydrogen bond from the backbone nitro-
gen to the adjacent carbonyl oxygen of L304, it creates a bend in the helical
structure. The P308F mutant decreased the Vmax for ASD and T suggest-
ing an altered active site.[73] KM was decreased significantly for ASD and
slightly for T, indicating that ASD binds more strongly to the mutant than
to the wild-type enzyme. In another study [76], however, the same muta-
tion P308F reportedly increased the KM value for ASD 4-fold rather than
reducing it. The mutant P308V, in turn, had a Vmax value for ASD half that
of the wild-type enzyme, and the KM was increased 4-fold.[34] If a valine
at this position does not cause a bend in the I-helix, as is suggested by the
secondary structure prediction programs, then a bend in the I-helix is nec-
essary for the optimal function of the enzyme. The necessity of the bend is
hard to prove, however, owing to the diverse results from different mutage-
nesis studies.
D309 has been the subject of several mutagenesis studies, aimed at revealing
the importance of a negatively charged residue at this position. The muta-
tion of D309 to a hydrophobic residue Ala or Val led to almost total inactivity
of the enzyme, as shown by the decrease in Vmax values.[35, 76, 74, 44, 52, 69]
However, widely ranging KM values for mutants D309A and D309V have
been obtained by different research groups. Vmax for the D309N mutant was
not as dramatically decreased as that for the D309A or D309V mutant. Also
the KM for D309N was lower than for the wild-type enzyme, suggesting that
22

3.5. Phytoestrogens as aromatase inhibitors
a polar residue can serve the function of a negatively charged residue at this
position, at least to some extent.[70] It should be mentioned that although
mutant D309E has not been constructed, a Glu is located at this position in
CYP450BM−3 and in human and bovine CYP45017α, showing that a negative
charge is important at this position. T310 is conserved in all CYP450 en-
zymes except CYP450eryF[78], being located in SRS-4 and immediately next
to the heme group. T310 is thought to take part in the catalytic mechanism
and/or to provide a hydrogen bond to the backbone carbonyl of A306, thus
stabilising the bend formed by P308.[70, 71] Mutants T310A and T310C re-
sulted in the decrease or total loss of the activity.[69, 70]. A conservative
mutant T310S showed decreased activity compared with that of the wild-
type enzyme, but it is still functional.[70, 69, 44]
Residues at SRS-6 are part of a hairpin turn of β-sheet 4 and in aromatase
include residues S478 and H480. The Vmax values for the mutants S478A,
S478T and H480Q were significantly reduced as compared with tha of the
wild-type enzyme in both in-cell and microsomal assays.[62, 75] However,
in microsomal assay, H480K had closely similar activity to that of the wild-
type enzyme, suggesting that a positively charged residue is needed at this
position.[62]
As described above, much research has been done to identify the residues
contributing to the aromatase active site in an important way. Some of the
results are conflicting, probably because the groups used different test con-
ditions. A great deal of valuable information about the active site of aro-
matasehas nevertheless been aqcuired. In time, an experimentally solved
aromatase structure will prove the theories right or wrong.
3.5 Phytoestrogens as aromatase inhibitors
Phytoestrogens are polyphenolic compounds widely present in nature. Many
plants included in the human diet, soy, flaxseed, berries, grapes etc., are
23

Chapter 3. CYP450 aromatase
good sources of phytoestrogens.[79, 80, 81, 82, 83] Their dietary intake has
been associated with reduced breast cancer risk.(reference [84] and refer-
ences therein). The two major classes of phytoestrogens are flavonoids (in-
cluding subclasses flavones, flavanones and isoflavonoids) and lignans (lig-
nanolactones and lignanodiols) (Figure 3.7). Phytoestrogens mimic endoge-
nous estrogens in shape, size and physico-chemical properties making it
possible for them to bind to the same receptors and enzymes as do the estro-
gens. The similarity between estradiol and 6,4’-dihydroxyflavone is shown
in Figure 3.8. An extensive of aromatase inhibition by phytoestrogenic com-
pounds and their use in drug discovery has been published by our research
group.[85]
OH
OH
lignanolactones lignanodiols
77
6655
88
4433
22O
O
4'4'3'3'
A
B
C
O
O
flavones isoflavones
8'8'
88
7'7'
77
1'1'
11
2'2'3'3'
4'4'
4433
22
99
O
9'9'
O
A
B
Figure 3.7 – The general structures of lignanolactones, lignanodi-ols, flavones and isoflavones with stereochemistry and atom num-bering shown.
24

3.5. Phytoestrogens as aromatase inhibitors
Figure 3.8 – The similarity of shapes and the oxygen atom loca-tions in E2 (left) and in 6,4’-dihydroxyflavone (right). The oxygenatoms are coloured red and the carbon skeleton is coloured grey.Hydrogens are omitted for clarity.
Figure 3.9 – Left: The optimal coordination angle and average dis-tance (see publication II) in a carbonyl coordination to the hemeiron. Right: The optimal tilting angle between the heme plane andthe carbonyl group plane. Carbons are coloured grey, oxygen iscoloured red and the heme iron is coloured magenta. Heme sidechains are omitted for clarity.
25

Chapter 3. CYP450 aromatase
Natural phytoestrogens have been widely studied for their aromatase in-
hibiting properties. As a rule, flavones are better inhibitors than isoflavones
and lignans. It has been suggested, on the basis of spectroscopic stud-
ies, that the flavonoids coordinate to the heme iron via the C4 carbonyl
oxygen.[86, 87, 71, 88] A theoretical optimal binding geometry is achieved
when the Fe–O=C angle is 120◦ and the tilting angle between the heme plane
and the carbonyl plane is 90◦. Additionally, a database search in the Pro-
tein Data Bank (PDB) yielded an experimental average distance of 0.19 nm
between the iron and the oxygen (see publication II). The optimal binding
geometry is shown in Figure 3.9. The dihedral angle N-Fe-O-C also plays a
role in the optimal binding geometry, in that the functional groups attached
to the carbonyl carbon should not lead to sterical clashes with the protopor-
phyrin ring.[89] The best natural flavonoid inhibitor is α-naphthoflavone
13 (ANF) (Figure 3.10), which has an IC50 value of 0.07 µM in human pla-
cental microsome-based assay.[86] Substitutions in the flavonoid skeleton
affect the binding strength in various ways. 7-Hydroxyflavone is a more
potent aromatase inhibitor than flavone, as can be seen from reported IC50
values 0.5 µM and 10 µM [90], and 0.21 µM and 48 µM [91], respectively.
Hydroxylation at C7 can overcome the unfavourable influence of other sub-
stitutions, as seen from the IC50 values of 4’-hydroxyflavone (180 µM) and
7,4’-dihydroxyflavone (2 µM) [90]. A hydroxy group at C5 or C3 forms a
hydrogen bond to the C4 carbonyl, weakening its ability to coordinate to
the heme iron. This can be seen by comparing the IC50 values of flavone
(10 µM), 3-hydroxyflavone (140 µM) and 5-hydroxyflavone (100 µM).[90]
Isoflavonoids have the phenyl ring attached to C3, instead of to C2 as in
flavones, and as a result the C4 carbonyl coordinating to the heme iron is
sterically hindered (Figure 3.7 on page 24 and publication II). The best isofla-
vonoid inhibitor is biochanin A with an IC50 value of 15.5 µM in a cell-based
assay.[71] For a complete list of the effects of the substitution on biological
activity, see reference [85] and publication II.
Lignans have been shown to be competitive, though weak inhibitors of
26

3.5. Phytoestrogens as aromatase inhibitors
secoisolariciresinol SI 17
OH
OHHO
OHO
O
matairesinol MAT 16
O
OHO
OHO
O
nordihydroguaiaretic acid NDGA 18
HO
OHO
O
enterodiol END 15
OH
OH
enterolactone ENL 14
O
O
HO
HO HO
HO
O
O
α-naphthoflavone ANF 13
O
O
OH
OHO
coumestrol 19
Figure 3.10 – The structures of the enterolignans ENL and ENDand their dietary precursors MAT 14 and SI, and the structures ofNDGA , ANF and coumestrol.
the aromatase enzyme in microsome and cell-based assays.[92, 93] The en-
terolignans enterolactone 15 (ENL) and enterodiol 16 (END) are produced
by the human gut microflora from their dietary precursors matairesinol 14
(MAT) and secoisolariciresinol 17 (SI), respectively (Figure 3.10) [94, 95, 96,
97], and these enterolignans and their precursors are responsible for the
aromatase inhibition in the human body. Although the binding modes of
these compounds have not yet been proposed, their inhibition has been
measured.[92, 93] The lignanolactones bear a sterically unhindered carbonyl
oxygen capable of coordinating to the heme iron. However, their relatively
large size and flexible structure compared to that of the flavonoids proba-
27

Chapter 3. CYP450 aromatase
bly distorts the binding geometry and results in weaker binding (see publi-
cation II). The lignanodiols, which lack the carbonyl group, probably bind
to the iron via a hydroxy group. Note that nordihydroguaiaretic acid 18
(NDGA, Figure 3.10), which lacks hydroxy groups at the same positions
where ENL and END have potentially coordinating oxygen atoms, is a rela-
tively strong aromatase inhibitor among the lignans.[92]
Coumestrol 19 is a tetracyclic polyphenol belonging to the class of coumes-
tan compounds (Figure 3.10). Coumestrol was first identified in alfalfa and
has later been found in plants, such as soya and cow pea, included in the
human diet.[98, 99] Coumestrol has been shown to inhibit aromatase activ-
ity with an IC50 value of 17 µM and a Ki value of 1.3 µM , being thus a weak
inhibitor.[93] Mutagenesis studies on aromatase made with coumestrol have
shown that mutants S478T and H480Q have reduced binding affinity for
coumestrol [75] (see Section 7.1 on page 61).
3.6 Commercial aromatase inhibitors
One approach to treating hormone-dependent breast cancer is to block the
biosynthesis of estrogens through the inhibition of aromatase or 17β-HSD1.
Inhibitors of the 17β-HSD1 enzyme have not yet reached the market, while
even though the 3D structure of aromatase has not yet been experimentally
solved, a few drug discovery projects have succesfully led to commercial
aromatase inhibitors (AIs) (Figure 3.11). Already, three AIs are on the mar-
ket to treat post-menopausal breast cancer by inhibiting the local estrogen
production in the tumour tissue.[100, 101] Exemestane 20 (Aromasin R© from
Pfizer) is a type I inhibitor, a steroid derivative functioning as a suicide in-
hibitor. It is recognised by the aromatase active site and the catalytic reaction
produces an intermediate that covalently binds to the enzyme, permanently
inactivating it. Letrozole 21 (Femara R© from Novartis) and anastrozole 22
(Arimidex R© from AstraZeneca) are type II inhibitors that are non-steroidal
28

3.6. Commercial aromatase inhibitors
and bind reversibly to the aromatase enzyme. The type II inhibitors have a
sterically unhindered triazolyl group, whose nitrogen coordinates through
its free electron pair to the heme iron. Both type I and type II AIs are being
used in post-menopausal breast cancer treatment.
O
O
NN
N
N N
NN
N
N
N
exemestane 20 letrozole 21 anastrozole 22
Figure 3.11 – The structures of the commercial aromatase in-hibitors.
29

Chapter 3. CYP450 aromatase
30

Chapter 4
17β-Hydroxysteroid
dehydrogenase type 1
17β-Hydroxysteroid dehydrogenases are a group of enzymes catalysing the
interconversion between the C17 functionality in 17β-hydroxysteroids and
17-ketosteroids.[102] 17β-Hydroxysteroids are the biologically active forms
of these hormones both in androgens and in estrogens.[103] The reductive
catalytic reaction requires cofactor nicotinamide adenine dinucleotide phos-
phate NADP(H) (Figure 3.2 on page 11) or its dephosphorylated form nicoti-
namide adenine dinucleotide NAD(H). There are 14 subtypes in the 17β-
hydroxysteroid dehydrogenase family, of which 12 are found in humans,
distinguished by substrate and cofactor specificity.[104]
The 17β-hydroxysteroid dehydrogenase type 1 enzyme (17β-HSD1), en-
coded by the gene HSD17B1, plays a crucial role in the female hormonal
regulation by catalysing the NADPH-dependent reduction of the less po-
tent estrone (E1) into the biologically active estradiol (E2) (Figure 2.3 on
page 7). Androgens are also converted, but to a minor extent.[102] 17β-
HSD1 has been crystallised as an apoenzyme and a holoenzyme and with
estrogens, androgens and synthetic inhibitors. [105, 106, 107, 108, 109, 110,
111, 112, 113] Human 17β-HSD1 enzyme is active as a soluble cytosolic
31

Chapter 4. 17β-Hydroxysteroid dehydrogenase type 1
homodimer and is mainly expressed in the ovaries and placenta and in
liver and breast tissue.[102] 17β-HSD1 is also expressed in malignant breast
tissue,[114] where it has been suggested to have an important role in in situ
E2 production.[115, 116, 117, 118]
4.1 Structure and catalytic mechanism
of 17β-HSD1
17β-HSD1 is a member of the short-chain alcohol dehydrogenase super-
family (SDR) and has the conserved and catalytically crucial Tyr-x-x-Ser-
Lys sequence in the active site (catalytic triad Y155, S142 and K159).[103]
Investigations with bacterial hydroxysteroid dehydrogenases suggest that
the near-by asparagine N114 should also be included among the catalytic
residues.[119, 120] One enzyme monomer contains 328 amino acids with a
molecular weight of ∼35 kDa. The tertiary fold of the enzyme contains the
substrate binding domain and a Rossmann fold — a wall of β-sheets sur-
rounded by α-helices, which is associated with cofactor binding.[121] The
catalytic residues, including Y155, S142 and K159 (and N114), are located
near the nicotinamide moiety of the cofactor NADPH.[122] The active site is
a narrow tunnel consisting of lipophilic residues and is complementary in
shape and volume to the steroid skeleton.[123] The substrate E1 binds to the
cavity by forming hydrogen bonds to residues Y155 and S142 from the C17
carbonyl and to H221, at the opposite end of the cavity from the C3 hydroxy
group.[107] An additional hydrogen bond may be formed from E282 to the
C3 hydroxy group. The 17β-HSD1 enzyme contains a loop near the active
site (residues 186–199) for which several conformations have been observed
in crystal structures. This loop has been associated with substrate entry and
cofactor stabilisation.[124, 109] The overall structure of the enzyme and the
active site with selected residues are displayed in Figure 4.1.
A catalytic mechanism has been proposed for the conversion of E1 to E2
32

4.1. Structure and catalytic mechanism of 17β-HSD1
Figure 4.1 – The tertiary structure and active site of 17β-HSD1,PDB entry 1FDT. The cofactor NADP+ is coloured blue and E2 ma-genta. For clarity, only selected active site residues are displayedand the secondary structures are displayed in transparency.
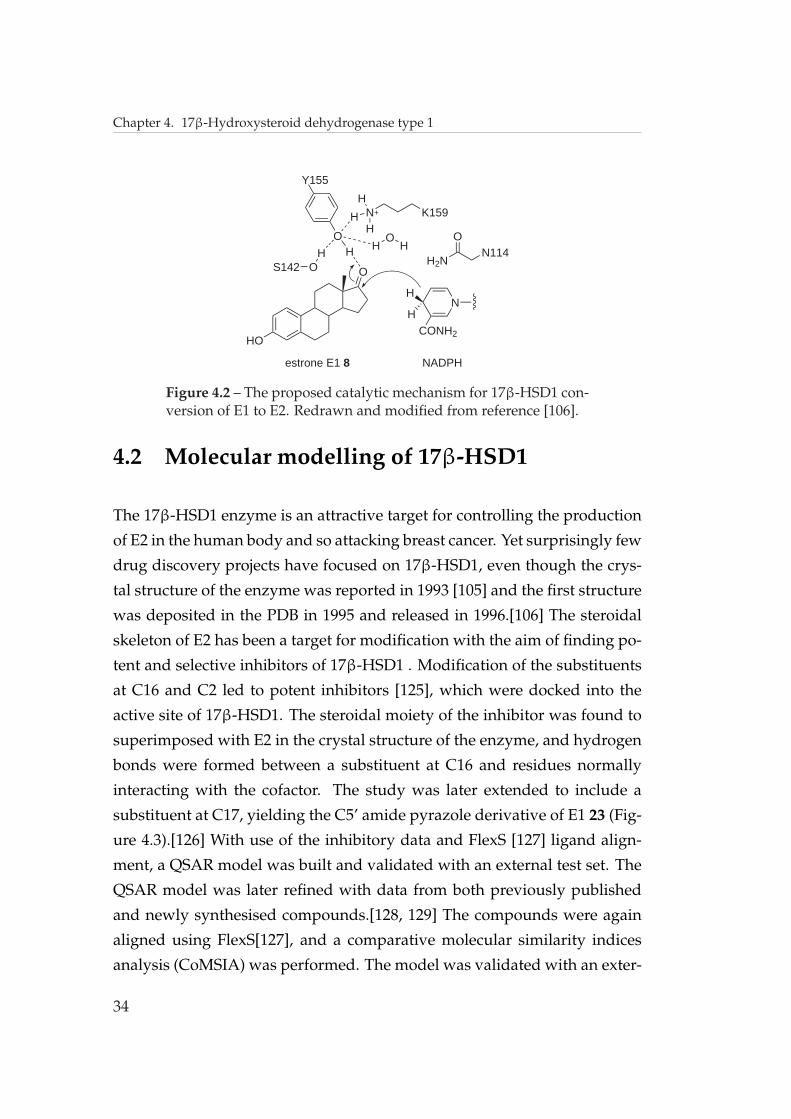
(Figure 4.2).[106] K159 lowers the pKa value of the Y155-OH group, facili-
tating the proton transfer from Y155-OH to the C17 carbonyl oxygen. The
electrophilic attack of the Y155 proton on the C17 carbonyl oxygen and the
hydride transfer from NADPH to C17 results in the formation of E2. S142
has been proposed to stabilise the oxyanion in Y155 [106] or to provide a hy-
drogen bond counterpart for the C17 carbonyl [102]. It should be noted that
K159 is too far from Y155 to interact with it in the crystal structures. How-
ever, a small repositioning would accomplish a suitable orientation.[106] A
network of solvent molecules is proposed to provide the missing proton.
33
Chapter 4. 17β-Hydroxysteroid dehydrogenase type 1
HO
O
NH
H
HO
Y155
N K159H
S142 OH
HO
H
estrone E1 8 NADPH
CONH2
H
H
H2NN114
O
Figure 4.2 – The proposed catalytic mechanism for 17β-HSD1 con-version of E1 to E2. Redrawn and modified from reference [106].
4.2 Molecular modelling of 17β-HSD1
The 17β-HSD1 enzyme is an attractive target for controlling the production
of E2 in the human body and so attacking breast cancer. Yet surprisingly few
drug discovery projects have focused on 17β-HSD1, even though the crys-
tal structure of the enzyme was reported in 1993 [105] and the first structure
was deposited in the PDB in 1995 and released in 1996.[106] The steroidal
skeleton of E2 has been a target for modification with the aim of finding po-
tent and selective inhibitors of 17β-HSD1 . Modification of the substituents
at C16 and C2 led to potent inhibitors [125], which were docked into the
active site of 17β-HSD1. The steroidal moiety of the inhibitor was found to
superimposed with E2 in the crystal structure of the enzyme, and hydrogen
bonds were formed between a substituent at C16 and residues normally
interacting with the cofactor. The study was later extended to include a
substituent at C17, yielding the C5’ amide pyrazole derivative of E1 23 (Fig-
ure 4.3).[126] With use of the inhibitory data and FlexS [127] ligand align-
ment, a QSAR model was built and validated with an external test set. The
QSAR model was later refined with data from both previously published
and newly synthesised compounds.[128, 129] The compounds were again
aligned using FlexS[127], and a comparative molecular similarity indices
analysis (CoMSIA) was performed. The model was validated with an exter-
34

4.2. Molecular modelling of 17β-HSD1
nal test set, which suggested favourable and unfavourable regions in regard
to hydrogen bond acceptors and donors, and regions favouring positive and
negative charge.
OH
O
O
HO
O
OH OH
N
NN
N
NH2
25
HO
24
F
FF
HO
23
NHNHN
O
SN
NO
O
OBr
O
HO
27O
OHN
O BrBr
NNH
O NH2
N
28
HO
26
O
Figure 4.3 – Selected inhibitors from molecular modelling studiesof 17β-HSD1.
In another study, a highly electronegative fluorine substituent at C17 of the
E2 skeleton was tested for 17β-HSD1 inhibitory activity.[130] With a fluorine
at C17, E2 is thought to mimic the transition state of the enzymatic catalysis.
Other, mostly hydrophobic substituents at C2, C8, C9, C13, C14, C15, and
C18 were included in the study. The synthesised compounds were tested
for inhibitory activity against human HSD subtypes 1, 2, 4, 5 and 7. Only
limited selectivity towards 17β-HSD1 was observed. The most potent 17β-
HSD1 inhibitor 24 (Figure 4.3) with three fluorine substituents at C7 and C17
was docked into the active site of the 17β-HSD1 enzyme crystal structure
35

Chapter 4. 17β-Hydroxysteroid dehydrogenase type 1
(PDB entry 1FDT). A binding mode was suggested, where the 17β-fluorine
accepts hydrogen bonds from S142 and Y155. As well, a hydrophobic pocket
for 7α-fluorine was identified.
The first effort to design a hybrid inhibitor, that is, a compound interact-
ing with the substrate and the cofactor binding sites, was reported in 2002
[113], and the idea was published in 2001.[131] With the substrate crystal
structure from the crystallised complex [108] and the cofactor modelled into
the apoenzyme structure [106], a part of the cofactor was deleted and con-
nected to the 16β-position of E2 with methylene linkers of different length.
The compounds were gradually minimised in the active site and in the ab-
sence of the enzyme structure. The energies of the minimisations for each
compound and for each degree of freedom were compared, and the optimal
spacer length was found to be 8 or 9 methylenes. Subsequent synthesis and
inhibitory assay showed that a linker length of 8 methylenes provides the
powerful and competitive inhibitor 25 (Figure 4.3). A crystal structure of
the enzyme with the newly created hybrid inhibitor was also solved and a
binding mode, making use of the substrate and the cofactor binding sites,
was proven (PDB entry 1I5R).[113] An extension to the previous study [113]
was conducted and several hybrid inhibitors, having a steroidal and an
adenosine moiety, were synthesised and tested for inhibitory activity.[132]
Later, new inhibitors based on 25 were synthesised and tested for inhibitory
activity.[133] The substrate E2 and a newly developed inhibitor 26 having
a benzylidene group at C16 (Figure 4.3), were docked into the active site
of the 17β-HSD1 crystal structure (PDB entry 1IOL). The result was that
the steroidal moiety of the inhibitor was shifted relative to E2 in the crys-
tal structure owing to the spatial requirements of the benzylidene group.
Because the new inhibitor was less potent than 25, it was speculated that
further modification of the benzylidene group would lead to a more potent
inhibitor.
The active sites of several crystal structures of the 17β-HSD1 enzyme have
been analysed with the SPROUT program.[134] The narrowness and hy-
36

4.2. Molecular modelling of 17β-HSD1
drophobicity of the active site tunnel were confirmed, and several starting
points for de novo inhibitor design were suggested.
A recent study concerning variously substituted pyrimidinones included
an analysis of the crystal structures of 17β-HSD1 and ideas for modification
of the lead compound derived from the analysis.[135] New inhibitors were
synthesised and tested and selective 17β-HSD1 inhibitors were identified.
The most potent of these was the pyrimidinone derivative 27 (Figure 4.3),
for which the binding mode was also suggested.
Fungal 17β-HSD from Cochliobolus lunatus (17β-HSDcl) has been suggested
as a useful model enzyme for human 17β-HSD1.[136] A QSAR study based
on flavonoids and cinnamic acid esters as 17β-HSDcl inhibitors was per-
formed with the use of quantum chemically calculated descriptors. Wide
differences between the experimental and predicted inhibitory activities were
found.
Pharmacophore modelling in connection with virtual screening is a rela-
tively new approach being pursued in drug discovery projects relative to
17β-HSD1. Schuster et al. [137] developed pharmacophore models based on
two crystal structure complexes: one with the steroidal ligand equilin and
one with the hybrid inhibitor 25. The authors used the automated pharma-
cophore generation program LigandScout [138, 139]. As a result of the phar-
macophore generation, database screening, synthesis and biological testing,
four inhibitors with IC50 values below 50 µM were identified, the most po-
tent being the hydrazinecarboxamide derivative 28 shown in Figure 4.3.
37

Chapter 4. 17β-Hydroxysteroid dehydrogenase type 1
38

Chapter 5
Methods used in molecular
modelling
This chapter introduces the molecular modelling methods used in my work.
Only molecular mechanistic methods were applied, since only they are suit-
able for large molecular systems to be treated as a whole. Quantum chemical
methods can only be applied to much smaller systems than whole proteins,
although a combination of quantum chemical and molecular mechanistic
methods has successfully been used in modelling enzymatic reactions.[140,
141, 142, 143]
5.1 Force fields
The atom nucleus and the surrounding electron cloud are treated separately
in quantum chemistry, making it possible to model chemical reactions, but
only with massive computational resources. Quantum chemistry can, there-
fore, only be applied to relatively small molecules, and definitely not to large
biomolecules in solvent environment. The study of large molecular systems
in silico requires that simplifications be made, e.g., treating atoms as rubber
39

Chapter 5. Methods used in molecular modelling
balls joined together with strings. The properties of these balls and their
interactions are dependent on the selected force field. A force field is a set
of parameters and mathematical equations used to describe the properties
of atoms and their bonded interactions (bonds, angles, dihedral angles) and
atoms and their non-bonded interactions (van der Waals and electrostatic
interactions). The bonded parameters include the definitions of the atomic
masses and charges for different atom types, bond lengths, bond angles,
and dihedral angles. Several types of force field have been developed for
different modelling targets, e.g., for small molecules, biopolymers and lipid
membranes. Together the definitions of the parameters and the equations
define the behaviour and potential energy of the system under study.
In molecular mechanics, a bond between two atoms is described as a har-
monic oscillator between two particles. The potential energy reaches a min-
imum at a certain distance depending on the atoms in question, and it in-
creases exponentially when the distance is either decreased or increased
(Figure 5.1). The harminic potential is defined so that the bond is not al-
lowed to break. A special case is the Morse potential [144], where the poten-
tial energy curve is not quadratic, and at large distances between the atoms
the bond is allowed to break (Figure 5.2). This feature can be useful in sim-
ulating metal coordination bonds, as was done in publications II and III.
Angles are also described as harmonic functions. Torsion angles, however,
owing to their periodic nature, are described as cosine functions (Figure 5.3).
Bonded interactions can be described in terms of the stretching of bonds,
bending of angles and the rotation of torsion angles. The equation usually
used in calculating the potential energy arising from bonded interactions is
described [145] as
Ebonded =∑
bonds
Kb(b− b0)2 +
∑
angles
Kθ(θ − θ0)2 +
∑
torsion
Kχ[1 + cos(nχ− σ)]
where b is the distance between atoms, b0 is the optimum bond length and
40

5.1. Force fields
Figure 5.1 – The quadratic form of the potential used in bondstretching and angle vibration.
Kb is the force constant of the bond; θ is the angle of three atoms, θ0 is the
optimum angle and Kθ is the force constant of the angle; and n is the mul-
tiplicity of the torsion angle (indicating the number of energy minima at a
full turn of 360◦), χ is the value of the torsion angle, σ is the phase angle
(an angle where the potential is at its minimum value) and Kχ is the pa-
rameter defining energy barriers during the turn. Usually in biomolecular
force fields a term for improper dihedral angles is added and described as
a quadratic function. The improper dihedral term ensures that planar rings
stay planar and that the stereochemistry of a molecule is not flipped to its
mirror image during the dynamics run.
Non-bonded interactions between two atoms i and j are calculated with the
equation
Enon−bonded =∑
pairsij
(εij[(Rmin,ij
rij
)12 − 2(Rmin,ij
rij
)6] +qiqj
rij
)
The first term inside the square brackets is the van der Waals term (or Lennard-
Jones term) and represents the attraction and repulsion of two atoms mov-
ing closer to each other. Rmin,ij is the distance where the potential energy
between the two atoms is at minimum, and rij is the interatomic distance.
41

Chapter 5. Methods used in molecular modelling
Figure 5.2 – The Morse potential.
Figure 5.3 – The cosine form of the torsion angle potential.
When the two atoms are far away from each other, the negative term dom-
inates and the interaction is attractive. As the atoms get closer, the positive
term begins to dominate and the interaction becomes repulsive. ε is a pa-
rameter that depends on the atoms in question and defines the deepness of
the potential energy minimum.
The second term describes the electrostatic interactions and is called the
Coulombic term. qi and qj describe the partial charges of the atoms i and
j. Thus, the total energy of the system can be calculated from the equation
42

5.2. Homology modelling
Etot = Ebonded + Enonbonded + Eother
where Eother includes terms that are specific for a certain force field.
Restraints can be added in the course of the simulations to secure the geom-
etry of a certain part of the system. These include position, angle, dihedral,
distance and orientation restraints. The use of distance restraints adds a
penalty to the potential energy function if a certain distance between atoms
is exceeded.[146]
5.2 Homology modelling
Homology modelling is a powerful tool for predicting the 3D structure of a
protein. In contrast to threading, (usually) only one template is used. In ho-
mology modelling, a known 3D structure of a macromolecule (the template)
is used to derive the structure of an unknown macromolecule (the target).
The steps in the modelling process include the identification of proteins with
known 3D structure that are related to each other with known 3D structure
and selection of one of these for the template, identification of structurally
conserved regions (SCR) and structurally variable regions (SVR), sequence
alignment, assignment of coordinates to SCRs and to SVRs, optional side-
chain modelling, relaxation and validation of the final structure.
Templates that are evolutionally related to the target are found with the help
of software or by searching the literature, preferably both. The identifica-
tion of SCRs and SVRs should be based on literature studies, with the as-
sistance of software for secondary structure predictions.[51, 147] The meth-
ods predicting secondary structures include statistical methods and neural
networks.[148] The accuracy of these methods has increased significantly
43
Chapter 5. Methods used in molecular modelling
in the recent years thanks to the increase in the number of solved protein
structures and the development of algorithms.
Sequence alignment is a technique, where the primary amino acid sequence
of the template is aligned with a sequence of the target in order to find struc-
turally or functionally conserved elements. The goal is to match the cor-
responding residues between the sequences, and thus obtain information,
among other things, on the constitution of the target active site structure. If
the sequence similarity is high, i.e., only a few residues differ between the
sequences, the alignment is easy to perform. Conserved mutations between
the sequences are usually not a problem because the physico-chemical prop-
erties and the size of the mutated residue resemble the properties and size
of the original (e.g., Ile to Leu). Problems may arise, however, when a small
residue is mutated to a large one (e.g., Gly to Trp) or the properties of the
new residue are opposite to those of the original (e.g., Asp to Arg). In these
situations the alignment should be carefully examined, and experimental
data should be applied to validate the alignment.
Automated sequence alignments are usually made with dynamic program-
ming, where each residue in each sequence are put on x and y axes of a
table.[149, 150] Each residue is then compared with all other residues in the
other sequence and a similarity score is entered in the table. Finally, all
similarity scores are compared and the highest scores are used to find the
optimal alignment.
Sequence alignment is the single most important part of the homology mod-
elling process. With proteins sharing low sequence identity, this is by no
means a trivial task. Gaps and insertions must be introduced to the target
sequence to make the important residues match each other in the alignment.
While automated methods are available for this task, results from the soft-
ware should always be verified manually and they must correspond to the
experimental data from mutagenesis and similar studies. Popular multiple
sequence search and aligment programmes are FUGUE [151], BLAST [152],
44
5.2. Homology modelling
ClustalW [153] and T-Coffee [154].
After the conserved parts of the structures have been identified and aligned,
the atomic coordinates from the template are assigned to the model. First,
the SCRs (with or without the side chains) are generated by assigning co-
ordinates from the template. SVRs (loops and random coil areas) can be
built de novo or searched from the PDB [155], which provides connective
structures found in protein crystal structures. To end up with a reasonable
protein structure, the modeller needs to take special care when assigning co-
ordinates to sequence areas with gaps and insertions and find suitable con-
necting loops and coils. Identical side chains between the template and the
model are assigned the original conformation from the template. In the case
of similar side chains, the original conformation is preserved where appli-
cable, as in the coordinate assignment protocol in the Homology module of
Insight II.[156] Problems arise when, for example, a glycine is to be replaced
with an arginine. Because an arginine side chain is much larger that that of
the glycine proton, a non-clashing conformation has to be found. Several
conformations for arginine are browsed and the one that best fits the sur-
roundings should be selected. When every residue in the sequence has been
assigned coordinates, the side-chain conformations can be optimised with
the SQWRL [157] or a comparable program.
After sequence-structure alignment, the model structure must be relaxed
due to the clashes and distortions originating from the different spatial re-
quirements of the aligned residues and newly generated coil and loop areas.
Energy minimisation of the model structure is performed, where atom posi-
tions, bond lengths, bond angles and torsion angles are optimised. If the raw
structure of the model includes clashes or distorted bond/dihedral angles,
the structure can be minimised step-by-step. First, the heavy atoms are kept
at their initial positions and only the hydrogens are allowed to move. Sec-
ond, backbone atoms are fixed to their positions and the side chains are free
to move and, finally, all atoms in the model are free to move. Another pos-
sibility is to restrict the movement of heavy atoms by tethering constants,
45

Chapter 5. Methods used in molecular modelling
which are gradually decreased during the minimisation process.[158] The
result is a relaxed protein model, which can (in some cases) be used in fur-
ther studies. However, the minimised model should first be validated, with
molecular dynamics simulations, for example.
5.3 Molecular dynamics simulations
A powerful method for the validation of a homology model, and for study-
ing the motion and conformational changes of macromolecules, is molecu-
lar dynamics simulation (MDS). We used the GROMACS software package
[146], which is widely used, versatile, rapid and available free of charge to
academic users. The procedure for simulating a generated homology model
is as follows: the energy minimised protein model is placed in a simulation
box, the box is filled with water (and ions) and the system is energy min-
imised to obtain a reasonable starting structure for the system for MDS. The
system is assigned a certain temperature and the initial velocities are calcu-
lated for each atom and updated after pre-defined intervals for a pre-defined
number of times. First the system is equilibrated with restrained backbone
atoms to allow the side chains and solvent molecules to adapt to their en-
vironment. Alternatively, all heavy atoms of the protein can be restrained.
After the equilibration, the system is allowed to move freely, and the be-
haviour of the system is monitored in terms of potential energy conserva-
tion and, for example, backbone movement. The result is a time-dependent
trajectory, that is, an ensemble of protein conformations including confor-
mations representing local energy minima.
The time scales used in MDS are on the order of femtoseconds (10−15 s) for
each step. By repeating these steps millions of times, the time span cov-
ered in typical MDS for a reasonable-sized protein is on the order of tens
or hundreds of nanoseconds. With parallel supercomputing, microseconds
and even milliseconds can be achieved. In reality, normal protein folding
46

5.3. Molecular dynamics simulations
requires milliseconds, and even rapid folding takes microseconds.[159] It is
understandable, therefore, that the conformational space of a protein cov-
ered in MDS is limited and the resulting structures are local rather than
global minima.
5.3.1 Periodic boundary conditions
When a real protein is solvated, there are millions of protein molecules sur-
rounded by an even larger number of water molecules. In simulation sys-
tems, however, usually one protein molecule surrounded by a thin sphere
of water molecules is simulated to keep computational costs under control.
This simplification leads to unwanted effects on the surface of the simula-
tion box, very near to the protein. These surface effects can be avoided by
introducing periodic boundary conditions, in which the simulation box is
surrounded by images of itself in all dimensions. If the protein moves out
of the simulation box during the dynamics run, it moves back inside the box
from the opposite side. Thus, the system contains no boundaries, and sur-
face effects do not disturb the actual simulation. Different box shapes are
used to simulate reality as well as possible. A sphere would be the shape
of choice, but there is no periodicity in it. Earlier, a cubic box was the most
common box type, but nowadays a rhombic dodecahedron or a truncated
octahedron is preferred. The latter two are smaller than a cubic box with the
same image distance and thus save computational time.
5.3.2 Long-range interactions
Non-bonded atoms of a real system interact with each other over a large
distance, but these pair interactions cannot all be taken into account in sim-
ulations because the computational cost increases as the number of particles
squared. Usually a cutoff distance of 10 A is imposed. Within the cutoff,
47

Chapter 5. Methods used in molecular modelling
neighbour lists including the closest neghbours for all atoms are stored (and
updated after a few steps) and the interactions between the neighbours are
calculated. However, truncation of the interactions beyond the cutoff does
not provide a realistic situation, and smoothing functions, such as Particle-
Mesh Ewald method (PME) [160], are used to create a more realistic simula-
tion. In PME, the calculation of the coulombic interaction is divided into a
short-range term within the cutoff and a long-range term beyond the cutoff.
The calculation of non-bonded interactions is computationally a highly de-
manding task owing to the large number of particles, and even larger num-
ber of interactions in the system. The computational cost can be decreased
by introducing bond constraints like LINCS [161], where certain (or all)
bonds are constrained to their equilibrium value. Constraining the bonds
means that the bond vibrations are neglected, and the time step can be in-
creased so that the computational cost is reduced.
5.3.3 Temperature and pressure monitoring
The above-mentioned cutoff schemes and rounding errors in the calcula-
tions may lead to elevated temperature and pressure during the simulation.
This problem is typically controlled by coupling the system to an external
thermal bath, which scales the velocities and maintains the simulation tem-
perature. The pressure of the system is controlled by scaling the atomic
coordinates and the size of the simulation box.[162, 163]
5.4 MDS trajectory analysis and protein
model validation
MDS produces a time-dependent ensemble of protein conformations, usu-
ally converged to a local energy minimum. The dynamic properties of the
48

5.4. MDS trajectory analysis and protein model validation
trajectory can be analysed to validate the simulation and/or the generated
protein model. The root mean square deviation (rmsd) is a measure of how
close a certain structure in the trajectory is to the initial (e.g. crystal) struc-
ture. In proteins, the backbone or Cα rmsd is usually calculated covering
all frames of the trajectory. The potential energy of the system is also moni-
tored. In a well-behaving simulation, these two curves should stabilise dur-
ing the simulation. Another analysis tool is the root mean square fluctuation
(rmsf). If calculated per residue, it shows how much a certain residue has
moved during the simulation. Residue movements are very useful in iden-
tifying stable (helices and sheets) as well as flexible (loops, coils) parts of the
protein.
In further studies (e.g., docking), a static structure is required. The question
is which one to choose from the trajectory? One way to obtain a representa-
tive structure is by clustering. The stable part of the trajectory is clustered on
the basis of backbone rmsd, for example, and the representative structure of
the biggest cluster is then extracted from the water environment, minimised
and used for further studies. Another approach is to calculate an average
structure on the basis of the stable part of the simulation. However, the av-
erage structure does not represent any ”real” conformation of the trajectory.
Static properties of the representative structure can be analysed by a pro-
gram such as PROCHECK.[164] PROCHECK produces several analyses of
the quality of the structure, including main chain bond angles and lengths,
chirality, hydrogen bonds and disulfide bridges. Perhaps the most useful
feature is an analysis of the backbone dihedral angles φ, ψ and ω (Fig-
ure 5.4), displayed as a Ramachandran plot (Figure 5.5). This plot shows
a graphical representation of the backbone angle combinations frequently
observed in secondary structure elements in experimental structures, and it
reveals backbone conformations that are illegal. Illegal angles are also fre-
quently found in crystal structures, which is one reason why they should be
relaxed before use in further studies. The ω angles should all be in trans-
configuration, although cis-peptides are not unknown among experimental
49

Chapter 5. Methods used in molecular modelling
protein structures.
HN
Cα peptide chain
O
O
R
phi φ psi ψ
omega ωpeptide chain
Figure 5.4 – The peptide bond and the main chain angles phi φ,psi ψ and omega ω.
50

5.4. MDS trajectory analysis and protein model validation
Figure 5.5 – A Ramachandran plot of CYP2C5 (PDB entry 1NR6).The red area in the upper left corner shows the backbone confor-mations that are found in β-sheets; the conformations found in α-helices are shown in the red area in the middle-left and left-handedα-helices in the small red area in the middle-right. Residuesmarked with red squares have a bad conformation, which usuallydisappears during minimisation and/or dynamics simulation.
51

Chapter 5. Methods used in molecular modelling
5.5 Ligand–protein docking
Biological macromolecules interact with other molecules, either other macro-
molecules or small molecules. Small molecules interact with proteins in
several ways. To mention a few, substrates are modified by a protein (an
enzyme), inhibitors block the function of an enzyme (either covalently or
non-covalently), and agonists and antagonists influence the activity of a
biomolecular receptor. Common to all these functions is that the small mol-
ecule (the ligand) must be recognised by the macromolecule and bind to it,
that is, there must exist favourable interactions that overrule the energetic
states of the separate binding counterparts. Ligand–protein docking predic-
tions form one important area of molecular recognition studies. Docking
can be used in several ways: for example, to study the mechanism of an
enzymatic reaction, to identify possible binding modes for a ligand, and to
screen a database.[165]
Over one hundred years ago, Emil Fischer proposed his lock-and-key mech-
anism for ligand binding. In this model, the active site and the ligand are
considered as rigid objects matching each other in shape and size. Later,
in 1958, Daniel E. Koshland, Jr. proposed a process of dynamic recognition
between a ligand and an active site. In this model, the ligand is matched to
the receptor after the binding, that is, the shape and size of the receptor are
modified during the binding, while a complex is formed between the ligand
and the active site. Modern docking software treats the ligand as flexible
(or a library of rigid conformations is used), whereas the protein active site
is treated as a rigid or a semi-rigid cavity. The flexibility of the active site
is difficult to take into account in docking software: a proper sampling of
active site conformations would require the use of molecular dynamics sim-
ulations, simulated annealing or Monte Carlo methods. Because all these
methods are time consuming, their applicability is limited. One attempt
to take the flexibility of the active site into account involves letting the po-
lar hydrogens move during the docking, as in GOLD [166], or rotating the
52

5.5. Ligand–protein docking
side chains of user-specified residues, as in FlexScreen [167] and the Flex-
ible Docking protocol in Discovery Studio 2.1 [168]. However, taking the
backbone movements or even conformational changes of the protein into
account is beyond reach for fast molecular docking or virtual screening. I
tested several docking software in my work, and usually GOLD produced
the best results. However, as described in publication III, Surflex-Dock pro-
duced a better alignment of the 17β-HSD1 inhibitors.
Search methods and scoring functions
Finding the bioactive conformation of a ligand requires that the conforma-
tional space be searched, preferably fast and accurately. Two main search
methods are used in present docking software: systematic and stochastic.
In a systematic search the rotating bonds of the ligand are turned in small
increments and the lowest energy conformations are saved. These confor-
mations are usually used to create a library of rigid ligand conformations,
as in FRED. [169] In a stochastic search, the ligand is treated as a whole or
as a group of small ligand fragments.
In the first case, new conformations of the whole ligand are generated and
compared with the previous one. If a better (lower in energy) solution is
found, this is stored and the search is continued until some termination cri-
terion defined by the modeller is met. These searches include simulated
annealing and Monte Carlo methods. One approach in whole ligand treat-
ment is the genetic algorithm (GA) used in GOLD [166]. First, random con-
formations of the ligand are generated. Favourable features of the random
conformations are then combined and new offspring are produced, and the
best solution is found after the evolution of the ligand conformations. In
the fragment-based methods, the molecule is cut into fragments, the frag-
ment(s) are docked, and the ligand is ”grown” back by selecting suitable
conformations of the remaining molecular fragments. These methods re-
semble the de novo ligand design approach, where novel inhibitors are gen-
53

Chapter 5. Methods used in molecular modelling
erated from scratch. Examples of the fragment-based methods are the Sur-
flex method [170], where the end fragments of a ligand are fitted to a nega-
tive image of the active site, the so-called protomol, and the FlexX method
[171], where the fragments of the ligand are added to a rigid base fragment.
The search methods can also be divided into local and global methods. In lo-
cal methods a local minimum of the starting structure is searched, whereas
in global methods a larger sampling in the conformational space is per-
formed, which usually provides better solutions.
The scoring function plays an important role during a docking run. It is
a mathematical way of directing the docking routine and ranking the ob-
tained solutions. The scoring functions can be divided into empirical, force
field-based and knowledge-based functions.[172] Empirical scoring func-
tions, such as Chemscore [173] and Surflex-Dock [174], take into account
experimental data on binding affinities, force field-based scoring functions
calculate the van der Waals and electrostatic interactions between the lig-
and and active site atoms, and knowledge-based scoring functions, such as,
PMF score [175], apply statistical data from solved complex crystal struc-
tures. Additionally, solvation terms may be taken into account. There are
no simple preferences of one method over another, but the available scor-
ing functions are usually tested and the best one (that is, matching with the
experimental data) is chosen for the given data set. A common procedure
is the rescoring of the solutions. After a docking run, some other scoring
function is applied to rank the found solutions. A consensus in the scoring
functions produces the most probable solution.
5.6 QSAR methods
Quantitative Structure–Activity Relationship (QSAR) is a method where the
differences in structure of compounds are correlated with differences in
their biological activity. The most common use of QSAR is to predict the
54

5.6. QSAR methods
activity of a ligand based on a mathematical model derived from known
ligands. Usually tens of compounds with known activity are needed to cre-
ate a predictive model. A QSAR study begins with identifying compounds
that are to be used in the model building (the training set). These should be
structurally variable, share the same binding mode and cover a wide range
of activities, from inactive to highly active compounds. After the collection
of the training set, the compounds must be properly aligned. The align-
ment can be done with or without the target protein. In the absence of the
target protein, the compounds are usually aligned to the most active com-
pound, which should be in its binding conformation. If the target protein
is available, docking the training set is the method of choice. Irrespective
of the method, the alignment should be carefully studied and the important
structural features of the ligands (hydrogen bond acceptors and donors, hy-
drophobic cores, aromatic rings etc.) should appear as superimposed. The
partial charges for the atoms in the molecules need to be assigned in or-
der to take into account the electrostatic interactions. Each ligand is rep-
resented via descriptors, which is a fingerprint of, for example, the sterical
and electrostatic and other interactions. The interaction energies are cal-
culated with, for example, the GRID program.[176] Each compound in the
training set is put into a grid, and the interaction energies between a probe
and the compound are calculated. Probes are atoms or functional groups
that represent some feature of the active site. The most straightforward
QSAR method, Comparative Molecular Field Analysis (CoMFA) [177], uses
an sp3-hybridized carbon with a charge of +1 to encompass sterical and elec-
trostatic features of the compounds in the training set. Hundreds of other
probes are available for more sophisticated descriptor generation.[178] For
example, in the Comparative Molecular Similarity Indices Analysis (CoM-
SIA) method [179], the interactions that are used, in addition to the steric
and electrostatic fields, are hydrogen bonds and hydrophobic interactions.
After the descriptors have been calculated, a partial least-squares analysis
(PLS) [180] is performed to link the structural differences in the training set
55

Chapter 5. Methods used in molecular modelling
compounds to their biological activities. Usually, internal cross-validation
methods are applied before the final model is constructed. The leave-one-
out method generates a model that leaves one compound at a time out from
the training set, and predicts the activity of the excluded compound on the
basis of the generated model. This procedure is done for all compounds in
the training set, and the correlation between the predicted and actual data is
calculated. The correlation coefficient for the leave-one-out cross-validation
q2LOO gives an estimate of how predictive the model is. A value of over 0.6
should be obtained. Possible outliers (compounds with inaccurate or wrong
biological data) are usually identified at this point, and excluded from the
training set. Other cross-validation methods are leave-five-out and leave
20% out. The cross-validation also produces the optimum number of com-
ponents that should be used. The number of components is the number of
dimensions in an N dimensional space that includes maximum explanatory
data without including any irrelevant data. After a satisfactory q2 value is
achieved, a non-validated PLS run is performed to produce the final QSAR
model. Before predicting the activity of a compound whose biological data
is unknown, an external validation should be performed. This validation
should include a set of compounds that were not used in the model build-
ing but for which the biological data is known. The final model can be
considered useful if the activities of the compounds in the test set are pre-
dicted with good accuracy. In predicting the activity of a compound with no
known biological data, the candidate compound must be properly aligned
and charges assigned.
One of the strengths of a QSAR model is the visualisation of the interaction
fields from the final model. The fields (steric and electrostatic in CoMFA)
are usually contoured to a certain energy level, and displayed together with
a compound or the target protein. Visualisation of the fields offers valuable
information about the favourable and unfavourable areas surrounding the
compounds and may suggest new ways to modify the compounds. If a
protein structure is available, superimposition of the model with the protein
56

5.7. Pharmacophore modelling and virtual screening
active site not only further validates the model but also helps in identifying
those residues that are most critical for the binding. A QSAR model can
provide valuable guidelines as to which theoretical compounds are worth
synthesising or which functional groups in existing compounds should be
modified.
5.7 Pharmacophore modelling and virtual
screening
A pharmacophore is a spatial arrangement of physico-chemical features cor-
responding to a drug’s biological activity. Typical features are hydrophobic,
aromatic, hydrogen bond donor and acceptor, cation or anion and, positive
or negative ionizable. These features are represented as spheres of user-
defined radius in space. Hydrogen bond features also have a direction.
Exclusion spheres can be added to represent areas where, for example, an
active site residue side chain is located. Pharmacophores can be generated
automatically or manually, for the target protein alone (without a bound lig-
and), for one or a group of compounds (without a protein) or for a protein–
ligand complex. When only the target protein structure is known, the al-
gorithm analyses the active site and shows pharmacophoric features origi-
nating from the active site residues, as in Discovery Studio [168]. If the tar-
get protein structure is not known, the pharmacophoric features can be de-
rived from the ligands. In the best case the structure of a complex is known
and the actual interactions between the ligand and the active site can be
analysed, as in the LigandScout program.[138, 139] This program also pro-
vides accurate spatial restrictions of the active site, when exclusion spheres
are included in the pharmacophore. LigandScout was used in publication
IV because it is capable of generating pharmacophores from ligand–protein
complexes. In the absence of a complex, the Catalyst pharmacophore tools
implemented in Discovery Studio were employed.
57

Chapter 5. Methods used in molecular modelling
The main strength of a pharmacophore is that it can be converted to a search
query and used in virtual screening. A database of 3D structures of com-
pounds is required, and the pharmacophoric features are matched with the
features of the compounds. The user can usually define how many of the
features are not taken into account, and a mapping score for each compound
is calculated ranking the resulting compounds.[168] This virtual screening
method is fast and allows the identification of possibly active compounds
with a completely different scaffold than the existing compounds, and it
is therefore a valuable tool in finding new drug candidates. Validation
of the pharmacophore used in a screening experiment usually requires a
test screening with a database of compounds to which some known actives
and/or inactives are added. A successful validation run finds the actives
and rejects the inactives. As in all modelling work, the results should be
inspected and validated visually before one proceeds further in the drug
discovery process.
58

Chapter 6
Aims of the study
Steroid hormone chemistry is one of the main research topics of the Phyto-
Syn group at the University of Helsinki. A few years ago, molecular mod-
elling was incorporated as part of the multidisciplinary projects with the
aim of providing a broader view of the field. A sophisticated three-di-
mensional homology model of the aromatase enzyme was built to assist
understanding of the final steps in estrogen production. Additionally, an
atomic level explanation was needed for the different inhibitory activities
of phytoestrogens against aromatase. Docking experiments and molecular
dynamics simulations were used to study the binding of a series of 17β-
HSD1 inhibitors, developed in our laboratory, to the 17β-HSD1 enzyme .
The results of inhibitory activity measurements and dockings of these in-
hibitors provided the necessary data to build a 3D QSAR model for further
inhibitor development. To deepen our knowledge of the interactions occur-
ring during inhibitor binding and to find novel scaffolds for the design of
new 17β-HSD1inhibitors, pharmacophore modelling and virtual screening
were included in the study. Specifically, the aims of my work were
? to build a homology model of the aromatase enzyme and study the
interactions between it and phytoestrogens (I and II)

Chapter 6. Aims of the study
? to study the binding of synthesised 17β-HSD1 inhibitors by molecular
dynamics simulations and to derive a QSAR model on the basis of
biological data for these inhibitors (III)
? to find novel scaffolds for inhibitor design using pharmacophore mod-
elling and virtual screening (IV)
60
Chapter 7
Results and discussion
7.1 The aromatase model and the binding
of phytoestrogens (I and II)
After a few quiet years, the homology modelling of aromatase was resumed
in 2000 when the crystal structure of the first crystallised mammalian CYP450
enzyme CYP2C5 was published.[13] Two further crystal structures of the
same enzyme but with co-crystallised ligands were published in 2003.[54,
181] These structures provided the starting point for our goal to build a so-
phisticated homology model of the aromatase enzyme.
The process was started with the submission of the aromatase sequence
downloaded from the Swiss-Prot database [182] to the FUGUE server [151].
The initial alignment of aromatase with CYP2C5 (PDB entry 1N6B)[54] ob-
tained from FUGUE was manually refined on the basis of the PsiPred [183]
secondary structure element predictions and several mutagenesis experi-
ments [34, 35, 70, 69, 72, 71, 62, 52, 77]. Various alignments were generated
by focusing on the substrate recognition sites defined for the CYP2 enzyme
family by Gotoh [27]. The final alignment is shown in Figure 7.1.
61
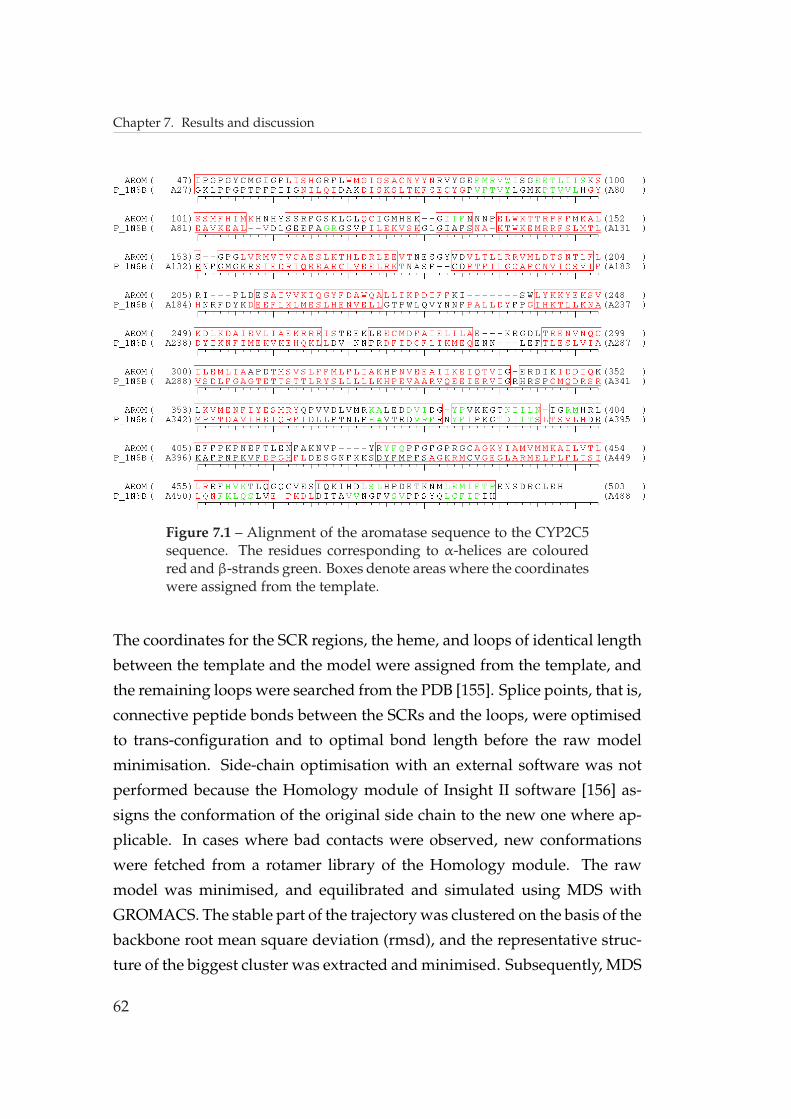
Chapter 7. Results and discussion
Figure 7.1 – Alignment of the aromatase sequence to the CYP2C5sequence. The residues corresponding to α-helices are colouredred and β-strands green. Boxes denote areas where the coordinateswere assigned from the template.
The coordinates for the SCR regions, the heme, and loops of identical length
between the template and the model were assigned from the template, and
the remaining loops were searched from the PDB [155]. Splice points, that is,
connective peptide bonds between the SCRs and the loops, were optimised
to trans-configuration and to optimal bond length before the raw model
minimisation. Side-chain optimisation with an external software was not
performed because the Homology module of Insight II software [156] as-
signs the conformation of the original side chain to the new one where ap-
plicable. In cases where bad contacts were observed, new conformations
were fetched from a rotamer library of the Homology module. The raw
model was minimised, and equilibrated and simulated using MDS with
GROMACS. The stable part of the trajectory was clustered on the basis of the
backbone root mean square deviation (rmsd), and the representative struc-
ture of the biggest cluster was extracted and minimised. Subsequently, MDS
62

7.1. The aromatase model and the binding of phytoestrogens (I and II)
study was made with the natural substrate androstenedione (ASD) to find a
plausible orientation of the substrate.
The MDSs performed on an empty-cavity model and for the complex re-
sulted in stabilisation of the backbone movements and the potential ener-
gies. The representative structure of the complex trajectory was subjected to
PROCHECK [164] to analyse the quality of the model. There were only two
residues in the disallowed region of the Ramachandran plot (Figure 7.2),
and as both are located in the β-sheet bundle they do not contribute to the
active site. The substrate ASD was properly oriented above the heme for the
oxidation of C19 of ASD (Figure 7.3). In summary, the model showed sta-
ble behaviour both with the substrate and with an empty active site cavity.
The majority of the mutagenesis results were explained on the basis of our
model.
Figure 7.2 – The Ramachadran plot of the generated aromatase ho-mology model. For explanations of the markings, see Figure 5.5.
63

Chapter 7. Results and discussion
Figure 7.3 – The overall structure of the generated aromatasemodel. α-Helices are coloured red, β-sheets yellow and the coilsand loops green. The heme and ASD are represented as blue sticksand the heme iron is represented as a magenta sphere.
As described earlier, phytoestrogens are moderate to weak inhibitors of the
aromatase enzyme. We wished to find atomic level explanations for the dif-
ferent binding affinities observed for lignans, flavonoids, isoflavonoids and
coumestrol but with emphasis on the lignans because their binding mode
to aromatase had not been reported earlier. Experimental inhibition data
was available for some lignans, including natural compounds and their the-
oretical and verified metabolites. In the case of flavonoids, isoflavonoids
and coumestrol, experimental data was available but an atomic level ex-
planation for the binding affinity, and especially for the Fe–O coordination
geometry, was desired. Molecular dynamics simulations (MDS) were per-
formed on the complexes formed by aromatase and one of the two natu-
ral inhibitors enterolactone 15 (ENL) and α-naphthoflavone 13 (ANF) (Fig-
ure 3.10 on page 27). ENL and ANF were placed in the active site cavity and
oriented so that the coordination between the oxygen and the iron could
64

7.1. The aromatase model and the binding of phytoestrogens (I and II)
take place. A Morse potential was used to define the interaction between
the iron and the coordinating oxygen. MDSs with GROMACS were per-
formed for both complexes. In the case of ENL the system stabilised after
12 ns (total simulation time was 15 ns), and with ANF the stabilisation took
17 ns (total simulation time 20 ns). The stable parts of the trajectories were
clustered and the representative structures of the largest clusters were ex-
tracted and minimised in vacuo. All-atom models of the protein were gen-
erated for the docking studies, which were done with the GOLD program
[166] because it was able to reproduce the binding conformations of ligands
in four complexes (PDB entries 1SUO, 1Z11, 1W0G and 1J0C). The modified
metal binding parameters [184] of GOLD were not included. As a result, the
coordination orientation and residues providing hydrogen bonding coun-
terparts and lipophilic areas affecting the binding of the compounds under
study were identified. Since the coordination is the single most important
contribution to the binding strength, the geometry of the coordination was
analysed with lignans and flavonoids. The dockings suggested that the tilt-
ing angle between the lignanolactone carbonyl plane and the heme plane
was 40◦, representing a 50◦ deviation from the optimal 90◦. The distance
from the heme iron to the oxygen was 0.24 nm, or 0.05 nm more than the
average 0.19 nm (based on the database search described in publication II).
The Fe–O=C angle was 129◦, showing a 9◦ deviation from the optimal 120◦.
These deviations from the optimal values, especially the tilting angle and
the distance, probably lead to weaker coordination and thereby, to weaker
binding.
When ring A of the lignan skeleton (Figure 2.1 on page 5) contains a C3
hydroxy group, a hydrogen bond is formed to the backbone carbonyl of
T310. When the hydroxy group is at C4, the hydrogen bonding counterpart
is the backbone carbonyl of P481. The hydrogen bonds from ring B have
their counterparts in E302 or I305. A hydrophobic area at SRS-5 (Figure 3.3
on page 12) accommodates the hydrophobic skeleton, especially in the case
of NDGA. In the case of lignanodiols, that is, lignans lacking the lactone
65
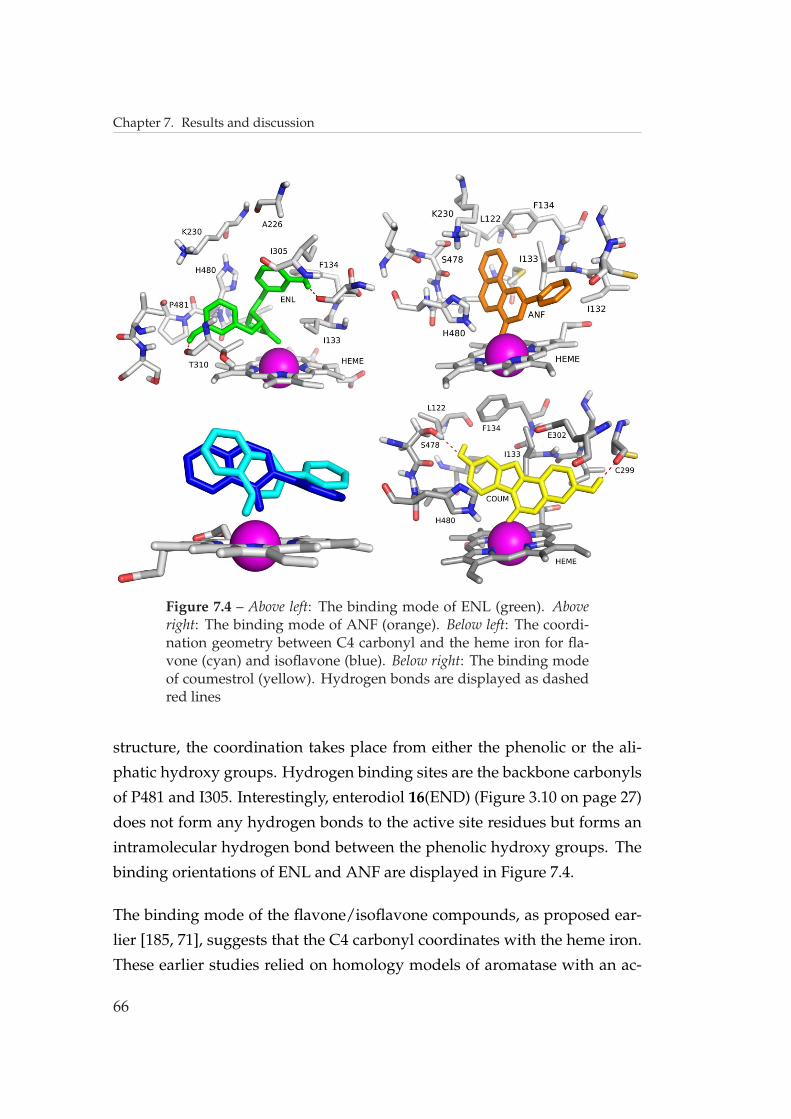
Chapter 7. Results and discussion
Figure 7.4 – Above left: The binding mode of ENL (green). Aboveright: The binding mode of ANF (orange). Below left: The coordi-nation geometry between C4 carbonyl and the heme iron for fla-vone (cyan) and isoflavone (blue). Below right: The binding modeof coumestrol (yellow). Hydrogen bonds are displayed as dashedred lines
structure, the coordination takes place from either the phenolic or the ali-
phatic hydroxy groups. Hydrogen binding sites are the backbone carbonyls
of P481 and I305. Interestingly, enterodiol 16(END) (Figure 3.10 on page 27)
does not form any hydrogen bonds to the active site residues but forms an
intramolecular hydrogen bond between the phenolic hydroxy groups. The
binding orientations of ENL and ANF are displayed in Figure 7.4.
The binding mode of the flavone/isoflavone compounds, as proposed ear-
lier [185, 71], suggests that the C4 carbonyl coordinates with the heme iron.
These earlier studies relied on homology models of aromatase with an ac-
66

7.1. The aromatase model and the binding of phytoestrogens (I and II)
tive site cavity not refined for the flavonoid skeleton. In this work, MDSs
were performed for an ANF–aromatase complex to find the optimal active
site conformation for the flavonoid/isoflavonoid binding, and these com-
pounds were then docked to the representative structure from the MDS
study. The dockings showed the distance from the C4 carbonyl oxygen to
the heme iron to be 2.0 A for flavone and 2.2 A for isoflavone. The angle Fe–
O=C was found to be 136◦ for flavone and 160◦ for isoflavone (the optimal
angle is 120◦), while the corresponding tilting angle between the carbonyl
plane and the heme plane were 73◦ for flavone and 70◦ for isoflavone. The
coordination geometries of flavone and isoflavone show that the coordina-
tion between flavone and heme is closer to the optimal values and, therefore,
leads to better binding (Figure 7.4).According to my model, the positive in-
fluence of a C7 hydroxy group in the flavone skeleton (see Section 3.5 on
page 23) originates from the hydrogen bond to S478. A hydroxy group at
C6 or C8 is slightly shifted compared to one at C7, and does not support a
hydrogen bond. The C4’ hydroxy substitution leads to the unfavourable in-
teraction between a polar hydroxy group and the hydrophobic environment
formed by residues I132, F148 and C299, and thereby, to decreased activity.
Wang et al. [93] found coumestrol 19 (Figure 3.10 on page 27) to be a better
inhibitor of aromatase than any of the lignans they measured in the same
study. My model suggests that the good inhibitory activity is the result of a
relatively good coordination geometry between the carbonyl group and the
heme iron, including a tilting angle of 67◦, a distance of 1.8 nm between the
iron and the oxygen, and an Fe–O=C angle of 139◦. Additionally, two hydro-
gen bonds between coumestrol and S478 and C299 (Figure 7.4), were found
to anchor coumestrol in place. Mutants S478T and H480Q decreased the
binding affinity for coumestrol.[75] Mutation of the serine at 478 to a thre-
onine probably alters the position and orientation of the hydrogen bonding
counterpart with coumestrol and leads to the loss of the hydrogen bond.
H480 is located near the aromatic skeleton of coumestrol, and the mutation
to a glutamine probably leads to the loss of π – π interactions and a decrease
67

Chapter 7. Results and discussion
of inhibition potency.
Figure 7.5 – Letrozole 21 docked into the active site of aromatase.Letrozole is coloured lemon, and the heme iron is represented asa magenta sphere. For clarity, only selected residues are displayedand hydrogens are omitted.
In further validation of the homology model, MDS was performed for a
letrozole–aromatase complex (unpublished results). Letrozole 21 (Figure 3.11
on page 29), was docked into the active site and MDS was performed. The
simulation showed stable behaviour in terms of potential energy and the
backbone rmsd. The representative structure of the MD trajectory was ex-
tracted and letrozole was docked into the active site. The resulting orienta-
tion is shown in Figure 7.5. Mutagenesis studies [44, 62] have shown that
mutants E302D, I133Y, S478T, S478A, H480Q and H480K are more resistant
to letrozole than the wild-type enzyme. According to my model, the conser-
vative mutation E302D leads to the loss of the hydrogen bond between E302
and Q298, probably affecting the active site shape or volume. I133Y prob-
ably results in decrease in the active site cavity volume, S478T and S478A
change the position of a possible hydrogen bonding counterpart, and H480K
68

7.2. Molecular modelling of 17β-HSD1 and its inhibitors (III and IV)
and H480Q result in the loss of aromatic interactions between letrozole and
H480. The mutant D309A showed highly increased resistance to the in-
hibitor. This is hard to explain with my model, as are the other results with
D309 mutants (see publication I). The position of D309 is well established: it
is located in the I-helix near the very important T310. In the model, letrozole
is not oriented correctly to form hydrogen bonds with D309, and probably
it cannot change the orientation to establish such interactions. Most likely,
then, the D309A mutation leads to conformational changes in the active site.
I474 lies further away from the active site than do S478 and H480 and mu-
tants I474Y, I474W, I474M and I474N showed increased affinity to letrozole
[44], suggesting that the active site is somehow modified by a mutation at
this position. It is difficult to draw further conclusions, however, without
studying the effect of the mutation by MDS or other comparable method.
7.2 Molecular modelling of 17β-HSD1
and its inhibitors (III and IV)
Another attractive target for blocking estrogen production, in addition to
aromatase, is the 17β-HSD1 enzyme function. A high-throughput screening
(HTS) study against the 17β-HSD1 enzyme led to the discovery of a lead
compound 29 (Figure 7.6) [186], and a set of inhibitors based on the tetra-
cyclic skeleton of this lead compound were synthesised in our laboratory
and tested for inhibitory activity.[187] To simulate the dynamic process of
ligand binding and find the structural factors affecting it, MDSs were per-
formed for two potent inhibitors. The crystal structure of 17β-HSD1 (PDB
entry 1FDT) [107] containing the reduced product E2 and the oxidised cofac-
tor NADP+ was first relaxed using minimisation and MDS. This structure
was because there is evidence that the active site of aldo-keto reductase en-
zymes adapts to the ligand during binding [188, 189] and that the cofactor
NADP+ binds before the substrate.[190]
69

Chapter 7. Results and discussion
the lead compound 29
S
O
OH
N
N
O
S
O
N
N
O
S
O
N
N
O
30
31
Figure 7.6 – Structures of the inhibitors 29 and 30 used in the 17β-HSD1 MDS studies, and the structure of the most potent inhibitor31.
First, the crystal structure was relaxed using MDS. During the simulation
of the crystal structure, the reduced product estradiol E2 was moved away
from the catalytic triad (Ser142, Tyr155 and Lys159) and from the cofactor
NADP+. This is probably due to the rejection of the product by the active
site and the relocation of Phe192, a residue located in a loop with two differ-
ent conformations in the crystal structure. Figure 7.7 shows the positions of
E2 in the crystal structure and after the relaxation.
As a means to finding the optimal interactions between the active site and
the inhibitors for MDS studies, the lead compound 29 and another potent
inhibitor 30 were docked into the active site of the relaxed enzyme using
GOLD [166]. Despite the similarity of the structures of the two inhibitors,
two different binding modes were observed (Figure 7.8). MDS studies of the
two inhibitor–enzyme complexes revealed that the orientation of the lead
compound 29 was more stable and it formed active site interactions that
were not observed in the original or relaxed crystal structure of 17β-HSD1.
70
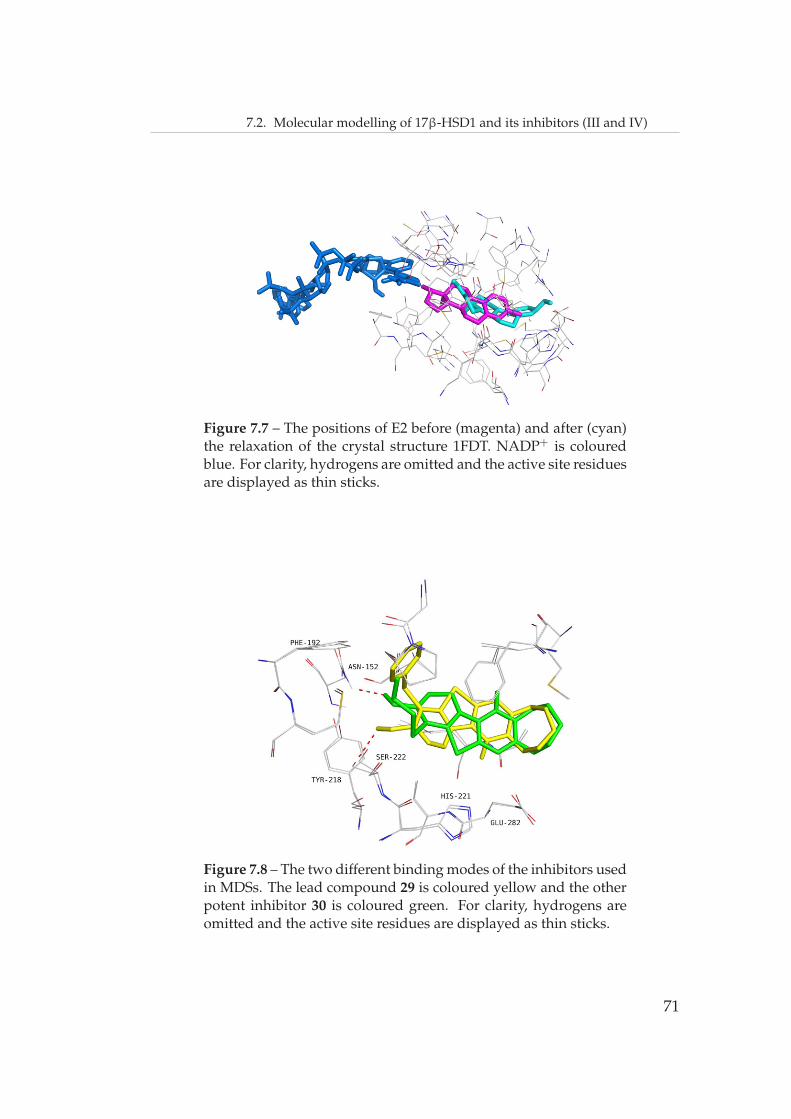
7.2. Molecular modelling of 17β-HSD1 and its inhibitors (III and IV)
Figure 7.7 – The positions of E2 before (magenta) and after (cyan)the relaxation of the crystal structure 1FDT. NADP+ is colouredblue. For clarity, hydrogens are omitted and the active site residuesare displayed as thin sticks.
Figure 7.8 – The two different binding modes of the inhibitors usedin MDSs. The lead compound 29 is coloured yellow and the otherpotent inhibitor 30 is coloured green. For clarity, hydrogens areomitted and the active site residues are displayed as thin sticks.
71

Chapter 7. Results and discussion
Figure 7.9 – The aligned 17β-HSD1 inhibitors after docking. Theprotein surface is displayed as a transparent surface and a part ofNADP+ is shown in blue. For clarity, hydrogens are omitted.
Figure 7.10 – The correlation between the predicted and LOGITtransformed pIC50 values of the 17β-HSD1 inhibitors. The trainingset is marked with blue squares and the test set with red circles.
72

7.2. Molecular modelling of 17β-HSD1 and its inhibitors (III and IV)
In a next step, a library of tetracyclic pyrimidinones synthesised in our lab-
oratory [187] was docked, using Surflex-Dock [170], into the enzyme struc-
ture obtained from MDS with the lead compound 29. The compounds were
found to be well aligned (Figure 7.9), and the ranking from the docking was
in accordance with the experimental inhibition data. This encouraged the
construction of a 3D-QSAR model to predict the activities of compounds not
yet tested for biological activity. Since no IC50 values had been determined
for the inhibitors, but only inhibition percentages at two inhibitor concentra-
tions (0.1 µM and 1 µM), LOGIT transformation [48] was used to obtain the
IC50 values. These values were then employed as dependant variables dur-
ing the CoMFA model building. The more complex CoMSIA method was
tested, too, but the resulting model had no predictive power. The CoMFA
model, on the other hand, had good predictive power, verified with an ex-
ternal test set (Figure 7.10).
The visualisation of the CoMFA fields reveals areas where a certain type
of interaction is either preferred or not preferred. The superimposition of
the CoMFA fields with the enzyme structure from the MDS with the most
potent compound 31 (Figures 7.6 and 7.11) revealed a hydrophobic pocket
(green area) formed by residues V143, G144, L149, F192, M193 and F259.
This pocket accommodates the bulky aromatic thioether side chain of in-
hibitor 31. Red areas located next to residues N152 and R258 suggest that a
negatively charged group at this position would serve as a hydrogen bond-
ing counterpart for these residues, and the blue area near Y218 suggests a
positively charged group at this position.
In summary, MDS with the lead compound 29, identification of the plau-
sible binding modes of the inhibitors and generation of the CoMFA model
helped in understanding the requirements for an active inhibitor. In partic-
ular, the CoMFA fields superimposed with the enzyme structure revealed
the hydrophobic pocket formed during the MDS, and the predictive power
of the model can help in the design of even more active inhibitors of 17β-
HSD1.
73

Chapter 7. Results and discussion
Figure 7.11 – The CoMFA fields superimposed with the enzymestructure obtained from MDS with the lead compound 29. Themost potent inhibitor 31 is coloured orange and NADP+ blue.
Pharmacophore modelling is a new method in 17β-HSD1 drug discovery
projects. Four pharmacophore models were developed in this work, based
on A) the relaxed crystal structure of 17β-HSD1 from the QSAR study (see
publication III), B) our thienopyrimidinone library [187], C) the 17β-HSD1
crystal structure complex with E2 (PDB entry 1FDT [107]), and D) the docked
complex of our most potent inhibitor 31 and 17β-HSD1(see publication III).
Where a complex was analysed, the LigandScout program [138, 139] was
used, and where ligands alone or the receptor alone were analysed, the Dis-
covery Studio 2.1 software (DS) [168] was employed. With the data noted
above, four pharmacophore hypotheses were generated, differing from each
other in number or the nature of the pharmacophoric features. Figure 7.12
shows the four generated pharmacophores.
The Interaction Generation protocol in DS, performed on the relaxed crys-
tal structure from III, followed by clustering of the pharmacophoric fea-
tures and manual adjustment, produced five pharmacophoric features (A
74

7.2. Molecular modelling of 17β-HSD1 and its inhibitors (III and IV)
Figure 7.12 – The four generated 17β-HSD1 pharmacophoresbased on A) the relaxed crystal structure, B) the thienopyrimidi-none library, C) the crystal structure 1FDT and D) the complex ofour most potent inhibitor 31 and 17β-HSD1. For clarity, hydro-gens are omitted and in pharmacophore D only selected exclusionspheres are displayed.
in Figure 7.12). Two hydrogen bond donors were pointed towards S222 and
E282 and one hydrogen bond acceptor was pointed towards S142. Addi-
tionally, two hydrophobic centres were located in the centre of the active
site. The Common Feature Pharmacophore Generation protocol of DS was
used to find the most important factors contributing to tight binding in our
thienopyrimidinone inhibitor library (B in Figure 7.12). Three hydrogen
bond donor features were identified, two located at the carbonyl groups
and one at the pyrimidinone nitrogen. However, the donor feature at the
nitrogen was manually changed to a hydrophobic feature after careful in-
spection of the active site residues showed that there are no residues in this
area capable of functioning as hydrogen bond donors. The interactions in
75

Chapter 7. Results and discussion
the complex crystal structure 1FDT [107] were identified with the Ligand-
Scout program. An automated pharmacophore generation identified two
hydrogen bond acceptors, one pointing from the C3 hydroxyl towards Y155
and one from the C17 hydroxyl towards H221, and two hydrophobic fea-
tures, one located at C18 and one at the aromatic ring A of E2 (C in Figure
7.12). LigandScout was also used for the pharmacophore generation of the
docked complex of our most potent inhibitor 31 (Figure 7.6) and 17β-HSD1
after MDS. The program generated a hydrogen bond from the thiophenyl
side chain hydroxyl towards the backbone carbonyl of G144, two hydrogen
bonds from the two carbonyls in the compound towards Y218 and R258,
and one hydrophobic feature around the thiophenyl substituent (D in Fig-
ure 7.12).
The Maybridge HitFinder database [191], consisting of 14,400 drug-like com-
pounds, was used in the database searches. To enlarge the conformational
space of the compounds in the database, the Diverse Conformation Gen-
eration protocol in DS was used to generate a maximum of 10 conformers
for each compound. The Ligand Pharmacophore Mapping protocol was
used to rank the conformers from the database on the basis of their fit to the
pharmacophores, and the best ranking conformer of each compound was
accepted or rejected on the basis of their scaled FitValues (from 0 to 1). Com-
pounds having a scaled FitValue of ≥ 0.5 were accepted. These compounds
were then docked to the 17β-HSD1 structure using GOLD Suite [166] and
the default scoring function Goldscore. Additionally, the docked solutions
were rescored with the Chemscore scoring function. The above-mentioned
methods (FitValue, Goldscore and Chemscore) were used to acquire a con-
sensus score for each of the compounds, and the compounds shown in
Figure 7.13 were identified. Additionally, the compounds identified for
pharmacophores originating from our inhibitors (pharmacophores B and D)
were evaluated with the developed QSAR model (see publication III). All
compounds were predicted to have inhibitory activity at sub-micromolar
levels. Note that the compounds in Figure 7.13 should be treated as poten-
76

7.2. Molecular modelling of 17β-HSD1 and its inhibitors (III and IV)
tial lead candidates because they possess functional groups that are usually
unfavoured in drug-like compounds.
In summary, four pharmacophores generated by different methods were
used to identify the contributions to the binding affinity to the 17β-HSD1
enzyme. The pharmacophores were used as 3D database search queries,
and novel scaffolds for potential 17β-HSD1 inhibitors were identified.
NS
N HNHN
O
F N
N
SHN
ONH
SO
O
F F
NS
N
NO NH2
O
ON
S
NN
NCl
Pharmacophore B
S
NS
NCF3
O
SO
O
HN
N N
CF3
Pharmacophore C
O
O
NH
O
NNS
F S
OCF3
CF3
S
NN
NF3C
Pharmacophore D
HON
NO2
O
CF3
ON
H2NN N
NHS
NO
CF3
Pharmacophore A
Figure 7.13 – Compounds identified from the MaybridgeHitFinder database using the generated pharmacophores and con-sensus ranking.
77

Chapter 7. Results and discussion
78

Chapter 8
Conclusions
In this study of the structure and interactions of the estrogen-producing en-
zymes CYP450 aromatase and 17β-HSD1, I have shown that, despite the low
sequence identity, a stable aromatase model that explains most of the results
from mutagenesis studies can be built, using a mammalian CYP450 crystal
structure as template. Further, this model explains the differences in the
binding affinity of phytoestrogenic compounds. State-of-the-art software
was used in the process, and molecular dynamics simulations in particular,
proved to be an excellent tool in model validation and study of the bind-
ing modes of ligands with aromatase . The same was shown for 17β-HSD1.
QSAR in combination with sophisticated docking procedures were used to
generate a predictive model for 17β-HSD1 inhibitors having a tetracyclic
thienopyrimidinone scaffold. Finally, 17β-HSD1 pharmacophore genera-
tion followed by virtual screening produced several candidates for future
drug design projects.
The results of this study can be utilised in designing new inhibitors for both
of the enzymes. The predicted structure of aromatase can be applied in
de novo design of aromatase inhibitors and study of their interactions with
the enzyme, and the QSAR model of 17β-HSD1 can be used to predict the
activities of newly designed inhibitor candidates prior to their synthesis.
79

Chapter 8. Conclusions
The pharmacophore models can be used in searching any 3D database for
lead candidates.
Altogether, this work shows the power of molecular modelling in modern
macromolecular, as well as small molecule, research projects. It comple-
ments traditional wet chemistry and contributes in a valuable way to multi-
disciplinary research projects.
The primary outcomes of this study concerning drug discovery are: A) a
letrozole-validated model of the aromatase enzyme and B) new pharma-
cophores for virtual screening of 17β-HSD1 inhibitors.
80

Bibliography
[1] American Cancer Society, Breast Cancer Fact and Figures 2007-2008, Atlanta: Amer-
ican Cancer Society, Inc.
[2] Russo J, Hasan Lareef M, Balogh G, Guo S, Russo IH. Estrogen and its metabolites
are carcinogenic agents in human breast epithelial cells. J. Steroid Biochem. Mol. Biol.
87, 1–25, 2003.
[3] Nelson LR, Bulun SE. Estrogen production and action. J. Am. Acad. Dermatol. 45,
S116–S124, 2001.
[4] Santen R. To block estrogen’s synthesis or action: That is the question. J. Clin. En-
docrinol. Metab. 87, 3007–3012, 2002.
[5] de Ziegler D, Mattenberger C, Luyet C, Romoscanu I, Irion NF, Bianchi-Demicheli F.
Clinical use of aromatase inhibitors (AI) in premenopausal women. J. Steroid Biochem.
Mol. Biol. 95, 121–127, 2005.
[6] Ackerman GE, Carr BR. Estrogens. Rev. Endocr. Metab. Disord. 3, 225–230, 2002.
[7] Nussey S, Whitehead S. Endocrinology: An Integrated Approach. Taylor & Francis,
Mortimer House, 37-41 Mortimer Street, London, W1T 3JH, UK, 2001.
[8] Fluck CE, Miller WL, Auchus RJ. The 17, 20-lyase activity of cytochrome P450c17
from human fetal testis favors the δ5 steroidogenic pathway. J. Clin. Endocrinol. Metab.
88, 3762–3766, 2003.
[9] Labrie F, Luu-The V, Lin SX, Simard J, Labrie C. Role of 17β-hydroxysteroid dehy-
drogenases in sex steroid formation in peripheral intracrine tissues. Trends Endocrinol.
Metab. 11, 421–427, 2000.
[10] Subramanian A, Salhab M, Mokbel K. Oestrogen producing enzymes and mammary
carcinogenesis: A review. Breast Cancer Res. Treat. 111, 191–202, 2008.
[11] Ghosh D. Human sulfatases: A structural perspective to catalysis. Cell. Mol. Life Sci.
64, 2013–2022, 2007.
81

Bibliography
[12] Fu XD, Simoncini T. Extra-nuclear signaling of estrogen receptors. IUBMB Life 60,
502–510, 2008.
[13] Williams PA, Cosme J, Sridhar V, Johnson EF, McRee DE. Mammalian microsomal
cytochrome P450 monooxygenase: Structural adaptations for membrane binding and
functional diversity. Mol. Cell 5, 121–131, 2000.
[14] Guengerich FP. Cytochrome P450: What have we learned and what are the future
issues? Drug Metab. Rev. 36, 159–197, 2004.
[15] Peterson JA, Graham SE. A close family resemblance: The importance of structure in
understanding cytochromes P450. Structure 6, 1079–1085, 1998.
[16] Auclair K, Moenne-Loccoz P, Ortiz de Montellano P. Roles of the proximal heme
thiolate ligand in cytochrome P450cam. J. Am. Chem. Soc. 123, 4877–4885, 2001.
[17] Meunier B, deVisser S, Shaik S. Mechanism of oxidation reactions catalyzed by cy-
tochrome P450 enzymes. Chem. Rev. 104, 3947–3980, 2004.
[18] Schlichting I, Berendzen J, Chu K, Stock AM, Maves SA, Benson DE, Sweet RM, Ringe
D, Petsko GA, Sligar SG. The catalytic pathway of cytochrome P450cam at atomic
resolution. Science 287, 1615–1622, 2000.
[19] Bulun SE, Lin Z, Imir G, Amin S, Demura M, Yilmaz B, Martin R, Utsunomiya H,
Thung S, Gurates B, Tamura M, Langoi D, Deb S. Regulation of aromatase expres-
sion in estrogen-responsive breast and uterine disease: From bench to treatment.
Pharmacol. Rev. 57, 359–383, 2005.
[20] Simpson E, Mahendroo M, Means G, Kilgore M, Hinshelwood M, Graham-Lorence
S, Amarneh B, Ito Y, Fisher C, Michael M. Aromatase cytochrome P450, the enzyme
responsible for estrogen biosynthesis. Endocr. Rev. 15, 342–355, 1994.
[21] Miller WR, Mullen P, Sourdaine P, Watson C, Dixon JM, Telford J. Regulation of
aromatase activity within the breast. J. Steroid Biochem. Mol. Biol. 61, 193–202, 1997.
[22] Kagawa N, Hori H, Waterman MR, Yoshioka S. Characterization of stable human
aromatase expressed in E. coli. Steroids 69, 235–243, 2004.
[23] Corbin CJ, Mapes SM, Lee YM, Conley AJ. Structural and functional differences
among purified recombinant mammalian aromatases: Glycosylation, N-terminal se-
quence and kinetic analysis of human, bovine and the porcine placental and gonadal
isozymes. Mol. Cell. Endocrinol. 206, 147–157, 2003.
[24] Zhang F, Zhou D, Kao YC, Ye J, Chen S. Expression and purification of a recombinant
form of human aromatase from Escherichia coli. Biochem. Pharmacol. 64, 1317–1324,
2002.
82

Bibliography
[25] Amarneh B, Simpson ER. Expression of a recombinant derivative of human aro-
matase P450 in insect cells utilizing the baculovirus vector system. Mol. Cell. En-
docrinol. 109, R1–R5, 1995.
[26] Sigle RO, Titus MA, Harada N, Nelson SD. Baculovirus mediated high level expres-
sion of human placental aromatase (CYP19A1). Biochem. Biophys. Res. Commun. 201,
694–700, 1994.
[27] Gotoh O. Substrate recognition sites in cytochrome P450 family 2 (CYP2) proteins
inferred from comparative analyses of amino acid and coding nucleotide sequences.
J. Biol. Chem. 267, 83–90, 1992.
[28] Johnson EF, Stout CD. Structural diversity of human xenobiotic-metabolizing cy-
tochrome P450 monooxygenases. Biochem. Biophys. Res. Commun. 338, 331–336, 2005.
[29] Kellis JT J, Vickery L. Purification and characterization of human placental aromatase
cytochrome P-450. J. Biol. Chem. 262, 4413–4420, 1987.
[30] Groves JT, Watanabe Y. Reactive iron porphyrin derivatives related to the catalytic
cycles of cytochrome P-450 and peroxidase. Studies of the mechanism of oxygen ac-
tivation. J. Am. Chem. Soc. 110, 8443–8452, 1988.
[31] Hackett J, Brueggemeier R, Hadad C. The final catalytic step of cytochrome P450
aromatase: A density functional theory study. J. Am. Chem. Soc. 127, 5224–5237, 2005.
[32] Loge C, Borgne ML, Marchand P, Robert JM, Baut GL, Palzer M, Hartmann RW.
Three-dimensional model of cytochrome P450 human aromatase. J. Enzym. Inhib.
Med. Chem. 20, 581–585, 2005.
[33] Poulos T, Finzel B, Gunsalus I, Wagner G, Kraut J. The 2.6 A crystal structure of
Pseudomonas putida cytochrome P-450. J. Biol. Chem. 260, 16122–16130, 1985.
[34] Graham-Lorence S, Khalil M, Lorence M, Mendelson C, Simpson E. Structure-
function relationships of human aromatase cytochrome P-450 using molecular mod-
eling and site-directed mutagenesis. J. Biol. Chem. 266, 11939–11946, 1991.
[35] Zhou D, Korzekwa K, Poulos T, Chen S. A site-directed mutagenesis study of human
placental aromatase. J. Biol. Chem. 267, 762–768, 1992.
[36] Laughton CA, Zvelebil MJ, Neidle S. A detailed molecular model for human aro-
matase. J. Steroid Biochem. Mol. Biol. 44, 399–407, 1993.
[37] Barton GJ, Sternberg MJE. A strategy for the rapid multiple alignment of protein
sequences : Confidence levels from tertiary structure comparisons. J. Mol. Biol. 198,
327–337, 1987.
83

Bibliography
[38] Zvelebil MJ, Barton GJ, Taylor WR, Sternberg MJE. Prediction of protein secondary
structure and active sites using the alignment of homologous sequences. J. Mol. Biol.
195, 957–961, 1987.
[39] QUANTA, Accelrys Inc., 10188 Telesis Court, Suite 100 San Diego, CA 92121, USA.
[40] Ravichandran K, Boddupalli S, Hasermann C, Peterson J, Deisenhofer J. Crystal
structure of hemoprotein domain of P450bm-3, a prototype for microsomal P450’s.
Science 261, 731–736, 1993.
[41] Hasemann CA, Ravichandran KG, Peterson JA, Deisenhofer J. Crystal structure and
refinement of cytochrome P450terp at 2.3 A resolution. J. Mol. Biol. 236, 1169–1185,
1994.
[42] Graham-Lorence S, Amarneh B, White RE, Peterson JA, Simpson ER. A three-
dimensional model of aromatase cytochrome P450. Protein Sci. 4, 1065–1080, 1995.
[43] Koymans MH L M, Vanden Bossche H. A molecular model for the interaction be-
tween vorozole and other non-steroidal inhibitors and human cytochrome P450 19
(P450 aromatase). J. Steroid Biochem. Mol. Biol. 53, 191–197, 1995.
[44] Kao YC, Cam LL, Laughton CA, Zhou D, Chen S. Binding characteristics of seven
inhibitors of human aromatase: A site-directed mutagenesis study. Cancer Res. 56,
3451–3460, 1996.
[45] Nelson DR. Cytochrome P450 nomenclature and alignment of selected sequences. In
Cytochrome P450: Structure, Mechanism and Biochemistry, P Ortiz de Montellano, ed.,
pp. 575–606. Plenum Press: New York, 2 edn., 1995.
[46] Laughton CA. Prediction of protein side-chain conformations from local three-
dimensional homology relationships. J. Mol. Biol. 235, 1088–1097, 1994.
[47] Lewis D, Lee-Robichaud P. Molecular modelling of steroidogenic cytochromes P450
from families CYP11, CYP17, CYP19 and CYP21 based on the CYP102 crystal struc-
ture. J. Steroid Biochem. Mol. Biol. 66, 217–233, 1998.
[48] Sybyl 7.3, Tripos Inc., 1699 South Hanley Rd., St. Louis, MO, USA.
[49] Cavalli A, Greco G, Novellino E, Recanatini M. Linking CoMFA and protein homol-
ogy models of enzyme-inhibitor interactions: An application to non-steroidal aro-
matase inhibitors. Bioorg. Med. Chem. 8, 2771–2780, 2000.
[50] Jones DT. Protein secondary structure prediction based on position-specific scoring
matrices. J. Mol. Biol. 292, 195–202, 1999.
[51] Bryson K, McGuffin LJ, Marsden RL, Ward JJ, Sodhi JS, Jones DT. Protein structure
prediction servers at University College London. Nucleic Acids Res. 33, W36–38, 2005.
84

Bibliography
[52] Auvray P, Nativelle C, Bureau R, Dallemagne P, Seralini GE, Sourdaine P. Study
of substrate specificity of human aromatase by site directed mutagenesis. Eur. J.
Biochem. 269, 1393–1405, 2002.
[53] Chen S, Zhang F, Sherman MA, Kijima I, Cho M, Yuan YC, Toma Y, Osawa Y, Zhou
D, Eng ET. Structure-function studies of aromatase and its inhibitors: A progress
report. J. Steroid Biochem. Mol. Biol. 86, 231–237, 2003.
[54] Wester M, Johnson E, Marques-Soares C, Dansette P, Mansuy D, Stout C. Structure
of a substrate complex of mammalian cytochrome P450 2C5 at 2.3 A resolution: Evi-
dence for multiple substrate binding modes. Biochemistry 42, 6370–6379, 2003.
[55] Thompson JD, Higgins DG, Gibson TJ. CLUSTAL W: Improving the sensitivity
of progressive multiple sequence alignment through sequence weighting, position-
specific gap penalties and weight matrix choice. Nucl. Acids Res. 22, 4673–4680, 1994.
[56] Petrey D, Xiang Z, Tang CL, Xie L, Gimpelev M, Mitros T, Soto CS, Goldsmith-
Fischman S, Kernytsky A, Schlessinger A, Koh IY, Alexov E, Honig B. Using multiple
structure alignments, fast model building, and energetic analysis in fold recognition
and homology modeling. Proteins 53, 430–435, 2003.
[57] Xiang Z, Honig B. Extending the accuracy limits of prediction for side-chain confor-
mations. J. Mol. Biol. 311, 421–430, 2001.
[58] Jones G, Willet P, Glen RC, Leach AR, Taylor R. Development and validation of a
genetic algorithm for flexible docking. J. Mol. Biol. 267, 727–748, 1997.
[59] Ahmed S. Review of the molecular modelling studies of the cytochrome P-450 estro-
gen synthetase enzyme, aromatase. Drug. Des. Discov. 15, 239–252, 1998.
[60] Furet P, Batzl C, Bhatnagar A, Francotte E, Rihs G, Lang M. Aromatase inhibitors:
Synthesis, biological activity, and binding mode of azole-type compounds. J. Med.
Chem. 36, 1393–1400, 1993.
[61] Kellis J JT, Childers W, Robinson C, Vickery L. Inhibition of aromatase cytochrome
P-450 by 10-oxirane and 10-thiirane substituted androgens. Implications for the struc-
ture of the active site. J. Biol. Chem. 262, 4421–4426, 1987.
[62] Kao YC, Korzekwa KR, Laughton CA, Chen S. Evaluation of the mechanism of aro-
matase cytochrome P450. A site-directed mutagenesis study. Eur. J. Biochem. 268,
243–251, 2001.
[63] Williams PA, Cosme J, Ward A, Angove HC, Matak Vinkovic D, Jhoti H. Crystal
structure of human cytochrome P450 2C9 with bound warfarin. Nature 424, 464–468,
2003.
85

Bibliography
[64] Favia AD, Cavalli A, Masetti M, Carotti A, Recanatini M. Three-dimensional model
of the human aromatase enzyme and density functional parameterization of the iron-
containing protoporphyrin IX for a molecular dynamics study of heme-cysteinato
cytochromes. Proteins 62, 1074–1087, 2006.
[65] Huang X, Miller W. A time-efficient, linear-space local similarity algorithm. Adv.
Appl. Math. 12, 337–357, 1991.
[66] Sali A, Blundell TL. Comparative protein modelling by satisfaction of spatial re-
straints. J. Mol. Biol. 234, 779–815, 1993.
[67] Case D, Darden T, Cheatham T III, Simmerling C, Wang J, Duke R, Luo R, Merz K,
Wang B, Pearlman D, Crowley M, Brozell S, Tsui V, Gohlke H, Mongan J, Hornak V,
Cui G, Beroza P, Schafmeister C, Caldwell J, Ross W, Kollman P. AMBER 8. University
of California, San Francisco, 2004.
[68] Murthy JN, Nagaraju M, Sastry GM, Rao AR, Sastry GN. Active site acidic residues
and structural analysis of modelled human aromatase: A potential drug target for
breast cancer. J. Comput.-Aided Mol. Des. 19, 857–870, 2005.
[69] Amarneh B, Corbin C, Peterson J, Simpson E, Graham-Lorence S. Functional do-
mains of human aromatase cytochrome P450 characterized by linear alignment and
site-directed mutagenesis. Mol. Endocrinol. 7, 1617–1624, 1993.
[70] Chen S, Zhou D. Functional domains of aromatase cytochrome P450 inferred from
comparative analyses of amino acid sequences and substantiated by site-directed
mutagenesis experiments [published erratum appears in J Biol Chem 1994 Jan
14;269(2):1564]. J. Biol. Chem. 267, 22587–22594, 1992.
[71] Kao YC, Zhou C, Sherman M, Laughton CA, Chen S. Molecular basis of the inhibition
of human aromatase (estrogen synthetase) by flavone and isoflavone phytoestrogens:
A site-directed mutagenesis study. Environ. Health Perspect. 106, 85–92, 1998.
[72] Zhou D, Cam L, Laughton C, Korzekwa K, Chen S. Mutagenesis study at a postulated
hydrophobic region near the active site of aromatase cytochrome P450. J. Biol. Chem.
269, 19501–19508, 1994.
[73] Zhou D, Pompon D, Chen S. Structure-function studies of human aromatase by site-
directed mutagenesis: Kinetic properties of mutants Pro-308 → Phe, Tyr-361 → Phe,
Try-361 → Leu, and Phe-406 → Arg. Proc. Natl. Acad. Sci. U. S. A. 88, 410–414, 1991.
[74] Kadohama N, Zhou D, Chen S, Osawa Y. Catalytic efficiency of expressed aromatase
following site-directed mutagenesis. Biochim. Biophys. Acta 1163, 195–200, 1993.
86

Bibliography
[75] Hong Y, Cho M, Yuan YC, Chen S. Molecular basis for the interaction of four different
classes of substrates and inhibitors with human aromatase. Biochem. Pharmacol. 75,
1161–1169, 2008.
[76] Kadohama N, Yarborough C, Zhou D, Chen S, Osawa Y. Kinetic properties of aro-
matase mutants Pro308Phe, Asp309Asn, and Asp309Ala and their interactions with
aromatase inhibitors. J. Steroid Biochem. Mol. Biol. 43, 693–701, 1992.
[77] Conley A, Mapes S, Corbin CJ, Greger D, Graham S. Structural determinants of
aromatase cytochrome P450 inhibition in substrate recognition site-1. Mol. Endocrinol.
16, 1456–1468, 2002.
[78] Cupp-Vickery JR, Poulos TL. Structure of cytochrome P450eryf involved in ery-
thromycin biosynthesis. Nat. Struct. Mol. Biol. 2, 144–153, 1995.
[79] Adlercreutz H. Phytoestrogens: Epidemiology and a possible role in cancer protec-
tion. Environ. Health Perspect. 103, 103–112, 1995.
[80] Mazur WM, Uehara M, Wahala K, Adlercreutz H. Phyto-oestrogen content of berries,
and plasma concentrations and urinary excretion of enterolactone after a single
strawberry-meal in human subjects. Br. J. Nutr. 83, 381–387, 2000.
[81] Milder I, Arts I, Venema D, Lasaroms J, Wahala K, Hollman P. Optimization of
a liquid chromatography-tandem mass spectrometry method for quantification of
the plant lignans secoisolariciresinol, matairesinol, lariciresinol, and pinoresinol in
foods. J. Agric. Food Chem. 52, 4643–4651, 2004.
[82] Milder IE, Feskens EJ, Arts IC, de Mesquita HB, Hollman PC, Kromhout D. Intake
of the plant lignans secoisolariciresinol, matairesinol, lariciresinol, and pinoresinol in
dutch men and women. J. Nutr. 135, 1202–1207, 2005.
[83] Kiely M, Faughnan M, Wahala K, Brants H, Mulligan A. Phyto-oestrogen levels in
foods: The design and construction of the VENUS database. Br. J. Nutr. 89, Suppl 1,
S19–23, 2003.
[84] Lof M, Weiderpass E. Epidemiologic evidence suggests that dietary phytoestrogen
intake is associated with reduced risk of breast, endometrial, and prostate cancers.
Nutr. Res. 26, 609–619, 2006.
[85] Karkola S, Lilienkampf A, Wahala K. Phytoestrogens in drug discovery for control-
ling steroid biosynthesis. In Recent Advances in Polyphenol Research, vol. 1, F Daayf,
V Lattanzio, eds., pp. 293–316. Blackwell Publishing, 2008.
[86] Kellis Jr JT, Vickery LE. Inhibition of human estrogen synthetase (aromatase) by
flavones. Science 225, 1032–1034, 1984.
87

Bibliography
[87] Kellis Jr JT, Nesnow S, Vickery LE. Inhibition of aromatase cytochrome P-450 (estro-
gen synthetase) by derivatives of α-naphthoflavone. Biochem. Pharmacol. 35, 2887–
2891, 1986.
[88] Sanderson JT, Hordijk J, Denison MS, Springsteel MF, Nantz MH, van den Berg M.
Induction and inhibition of aromatase (CYP19) activity by natural and synthetic fla-
vonoid compounds in H295R human adrenocortical carcinoma cells. Toxicol. Sci. 82,
70–79, 2004.
[89] Rupp B, Raub S, Marian C, Holtje HD. Molecular design of two sterol 14α-
demethylase homology models and their interactions with the azole antifungals ke-
toconazole and bifonazole. J. Comput.-Aided Mol. Des. 19, 149–163, 2005.
[90] Ibrahim AR, Abul-Hajj YJ. Aromatase inhibition by flavonoids. J. Steroid Biochem.
Mol. Biol. 37, 257–260, 1990.
[91] Le Bail J, Laroche T, Marre-Fournier F, Habrioux G. Aromatase and 17β-
hydroxysteroid dehydrogenase inhibition by flavonoids. Cancer Lett. 133, 101–106,
1998.
[92] Adlercreutz H, Bannwart C, Wahala K, Makela T, Brunow G, Hase T, Arosemena PJ,
Kellis Jr JT, Vickery LE. Inhibition of human aromatase by mammalian lignans and
isoflavonoid phytoestrogens. J. Steroid Biochem. Mol. Biol. 44, 147–153, 1993.
[93] Wang C, Makela T, Hase T, Adlercreutz H, Kurzer MS. Lignans and flavonoids inhibit
aromatase enzyme in human preadipocytes. J. Steroid Biochem. Mol. Biol. 50, 205–212,
1994.
[94] Borriello SP, Setchell KD, Axelson M, Lawson AM. Production and metabolism of
lignans by the human faecal flora. J. Appl. Bacteriol. 58, 37–43, 1995.
[95] Clavel T, Henderson G, Engst W, Dore J, Blaut M. Phylogeny of human intestinal bac-
teria that activate the dietary lignan secoisolariciresinol diglucoside. FEMS Microbiol.
Ecol. 55, 471–478, 2006.
[96] Wang LQ, Meselhy MR, Li Y, Qin GW, Hattori M. Human intestinal bacteria capable
of transforming secoisolariciresinol diglucoside to mammalian lignans, enterodiol
and enterolactone. Chem. Pharm. Bull. 48, 1606–1610, 2000.
[97] Raffaelli B, Leppala E, Chappuis C, Wahala K. New potential mammalian lignan
metabolites of environmental phytoestrogens. Environ. Chem. Lett. 4, 1–9, 2006.
[98] Bickoff EM, Booth AN, Lyman RL, Livingston AL, Thompson CR, Deeds F. Coume-
strol, a new estrogen isolated from forage crops. Science 126, 969–970, 1957.
88

Bibliography
[99] Price K, Fenwick G. Naturally occurring estrogens in foods. Food Addit. Contam. 2,
73–106, 1985.
[100] Miller WR, Bartlett J, Brodie AMH, Brueggemeier RW, di Salle E, Lonning PE, Llom-
bart A, Maass N, Maudelonde T, Sasano H, Goss PE. Aromatase inhibitors: Are
there differences between steroidal and nonsteroidal aromatase inhibitors and do
they matter? Oncologist 13, 829–837, 2008.
[101] American Cancer Society, Cancer Facts & Figures 2008, Atlanta: American Cancer
Society.
[102] Lukacik P, Kavanagh KL, Oppermann U. Structure and function of human 17β-
hydroxysteroid dehydrogenases. Mol. Cell. Endocrinol. 248, 61–71, 2006.
[103] Mindnich R, Mller G, Adamski J. The role of 17β-hydroxysteroid dehydrogenases.
Mol. Cell. Endocrinol. 218, 7–20, 2004.
[104] Moeller G, Adamski J. Integrated view on 17β-hydroxysteroid dehydrogenases. Mol.
Cell. Endocrinol. p. doi:10.1016/j.mce.2008.10.040, In press.
[105] Zhu DW, Lee X, Breton R, Ghosh D, Pangborn W, Duax WL, Lin SX. Crystallization
and preliminary X-ray diffraction analysis of the complex of human placental 17β-
hydroxysteroid dehydrogenase with NADP+. J. Mol. Biol. 234, 242–244, 1993.
[106] Ghosh D, Pletnev VZ, Zhu DW, Wawrzak Z, Duax WL, Pangborn W, Labrie F, Lin
SX. Structure of human estrogenic 17β-hydroxysteroid dehydrogenase at 2.20 A res-
olution. Structure 3, 503–513, 1995.
[107] Breton R, Housset D, Mazza C, Fontecilla-Camps JC. The structure of a complex
of human 17β-hydroxysteroid dehydrogenase with estradiol and NADP+ identifies
two principal targets for the design of inhibitors. Structure 4, 905–915, 1996.
[108] Azzi A, Rehse PH, Zhu DW, Campbell RL, Labrie F, Lin SX. Crystal structure of hu-
man estrogenic 17β-hydroxysteroid dehydrogenase complexed with 17β-estradiol.
Nat. Struct. Mol. Biol. 3, 665–668, 1996.
[109] Sawicki MW, Erman M, Puranen T, Vihko P, Ghosh D. Structure of the ternary
complex of human 17β-hydroxysteroid dehydrogenase type 1 with 3-hydroxyestra-
1,3,5,7-tetraen-17-one (equilin) and NADP+. Proc. Natl. Acad. Sci. 96, 840–845, 1999.
[110] Han Q, Campbell RL, Gangloff A, Huang YW, Lin SX. Dehydroepiandrosterone and
dihydrotestosterone recognition by human estrogenic 17β -hydroxysteroid dehydro-
genase. C-18/C-19 steroid discrimination and enzyme-induced strain. J. Biol. Chem.
275, 1105–1111, 2000.
89

Bibliography
[111] Gangloff A, Shi R, Nahoum V, Lin SX. Pseudo-symmetry of C19 steroids, alternative
binding orientations, and multispecificity in human estrogenic 17β-hydroxysteroid
dehydrogenase. FASEB J. 17, 274–276, 2003.
[112] Shi R, Lin SX. Cofactor hydrogen bonding onto the protein main chain is conserved
in the short chain dehydrogenase/reductase family and contributes to nicotinamide
orientation. J. Biol. Chem. 279, 16778–16785, 2004.
[113] Qiu W, Campbell RL, Gangloff A, Dupuis P, Boivin RP, Tremblay MR, Poirier D,
Lin SX. A concerted, rational design of type 1 17β-hydroxysteroid dehydrogenase
inhibitors: Estradiol-adenosine hybrids with high affinity. FASEB J. 2002.
[114] Gunnarson C, Ahnstrom M, Kirschner K, Olsson B, Nordenskjold B, Rutqvist LE,
Skoog L, Stal O. Amplification of HSD17B1 and ERBB2 in primary breast cancer.
Oncogene 22, 34–40, 2003.
[115] Poutanen M, Isomaa V, Lehto VP, Vihko R. Immunological analysis of 17β-
hydroxysteroid dehydrogenase in benign and malignant human breast tissue. Int.
J. Cancer 50, 386–390, 1992.
[116] Miettinen MM, Poutanen MH, Vihko RK. Characterization of estrogen-dependent
growth of cultured MCF-7 human breast-cancer cells expressing 17β-hydroxysteroid
dehydrogenase type 1. Int. J. Cancer 68, 600–604, 1996.
[117] Sasano H, Frost A, Saitoh R, Harada N, Poutanen M, Vihko R, Bulun S, Silverberg
S, Nagura H. Aromatase and 17β-hydroxysteroid dehydrogenase type 1 in human
breast carcinoma. J. Clin. Endocrinol. Metab. 81, 4042–4046, 1996.
[118] Suzuki T, Moriya T, Ariga N, Kaneko C, Kanazawa M, Sasano H. 17β-hydroxysteroid
dehydrogenase type 1 and type 2 in human breast carcinoma: A correlation to clini-
copathological parameters. Br. J. Cancer 82, 518–523, 2000.
[119] Filling C, Nordling E, Benach J, Berndt KD, Ladenstein R, Jornvall H, Oppermann
U. Structural role of conserved Asn179 in the short-chain dehydrogenase/reductase
scaffold. Biochem. Biophys. Res. Commun. 289, 712–717, 2001.
[120] Filling C, Berndt KD, Benach J, Knapp S, Prozorovski T, Nordling E, Ladenstein R,
Jornvall H, Oppermann U. Critical residues for structure and catalysis in short-chain
dehydrogenases/reductases. J. Biol. Chem. 277, 25677–25684, 2002.
[121] Rao ST, Rossmann MG. Comparison of super-secondary structures in proteins. J.
Mol. Biol. 76, 241–250, 1973.
[122] Joernvall H, Persson B, Krook M, Atrian S, Gonzalez-Duarte R, Jeffery J, Ghosh D.
Short-chain dehydrogenases/reductases (SDR). Biochemistry 34, 6003–6013, 1995.
90

Bibliography
[123] Alho-Richmond S, Lilienkampf A, Wahala K. Active site analysis of 17β-
hydroxysteroid dehydrogenase type 1 enzyme complexes with SPROUT. Mol. Cell.
Endocrinol. 248, 208–213, 2006.
[124] Mazza C, Breton R, Housset D, Fontecilla-Camps JC. Unusual charge stabilization of
NADP+ in 17β-hydroxysteroid dehydrogenase. J. Biol. Chem. 273, 8145–8152, 1998.
[125] Lawrence H, Vicker N, Allan G, Smith A, Mahon M, Tutill H, Purohit A, Reed M,
Potter B. Novel and potent 17β-hydroxysteroid dehydrogenase type 1 inhibitors. J.
Med. Chem. 48, 2759–2762, 2005.
[126] Fischer DS, Allan GM, Bubert C, Vicker N, Smith A, Tutill HJ, Purohit A, Wood L,
Packham G, Mahon MF, Reed MJ, Potter BVL. E-ring modified steroids as novel
potent inhibitors of 17β-hydroxysteroid dehydrogenase type 1. J. Med. Chem. 48,
5749–5770, 2005.
[127] Lemmen C, Lengauer T, Klebe G. FLEXS: A method for fast flexible ligand superpo-
sition. J. Med. Chem. 41, 4502–4520, 1998.
[128] Allan GM, Bubert C, Vicker N, Smith A, Tutill HJ, Purohit A, Reed MJ, Potter BVL.
Novel, potent inhibitors of 17β-hydroxysteroid dehydrogenase type 1. Mol. Cell. En-
docrinol. 248, 204–207, 2006.
[129] Allan GM, Lawrence HR, Cornet J, Bubert C, Fischer DS, Vicker N, Smith A, Tutill HJ,
Purohit A, Day JM, Mahon MF, Reed MJ, Potter BVL. Modification of estrone at the 6,
16, and 17 positions: Novel potent inhibitors of 17β-hydroxysteroid dehydrogenase
type 1. J. Med. Chem. 49, 1325–1345, 2006.
[130] Deluca D, Moeller G, Rosinus A, Elger W, Hillisch A, Adamski J. Inhibitory effects
of fluorine-substituted estrogens on the activity of 17β-hydroxysteroid dehydroge-
nases. Mol. Cell. Endocrinol. 248, 218–224, 2006.
[131] Tremblay MR, Lin SX, Poirier D. Chemical synthesis of 16β-propylaminoacyl deriva-
tives of estradiol and their inhibitory potency on type 1 17β-hydroxysteroid dehy-
drogenase and binding affinity on steroid receptors. Steroids 66, 821–831, 2001.
[132] Poirier D, Boivin RP, Tremblay MR, Berube M, Qiu W, Lin SX. Estradiol-adenosine
hybrid compounds designed to inhibit type 1 17β-hydroxysteroid dehydrogenase. J.
Med. Chem. 48, 8134–8147, 2005.
[133] Poirier D, Chang HJ, Azzi A, Boivin RP, Lin SX. Estrone and estradiol C-16 deriva-
tives as inhibitors of type 1 17β-hydroxysteroid dehydrogenase. Mol. Cell. Endocrinol.
248, 236–238, 2006.
[134] SPROUT 6.0, SimBioSys Inc., 135 Queen’s Plate Drive, Unit 520, Toronto, Ontario,
M9W 6V1, Canada.
91
Bibliography
[135] Messinger J, Hirvela L, Husen B, Kangas L, Koskimies P, Pentikainen O, Saarenketo
P, Thole H. New inhibitors of 17β-hydroxysteroid dehydrogenase type 1. Mol. Cell.
Endocrinol. 248, 192–198, 2006.
[136] Kristan K, Krajnc K, Konc J, Gobec S, Stojan J, Lanisnik Rizner T. Phytoestrogens as
inhibitors of fungal 17β-hydroxysteroid dehydrogenase. Steroids 70, 626–635, 2005.
[137] Schuster D, Nashev LG, Kirchmair J, Laggner C, Wolber G, Langer T, Odermatt
A. Discovery of nonsteroidal 17β-hydroxysteroid dehydrogenase 1 inhibitors by
pharmacophore-based screening of virtual compound libraries. J. Med. Chem. 51,
4188–4199, 2008.
[138] Wolber G, Langer T. LigandScout: 3D pharmacophores derived from protein-bound
ligands and their use as virtual screening filters. J. Chem. Inf. Model. 45, 160–169, 2005.
[139] Wolber G, Dornhofer AA, Langer T. Efficient overlay of small organic molecules
using 3D pharmacophores. J. Comput.-Aided Mol. Des. 20, 773–788, 2007.
[140] Hermann JC, Ridder L, Mulholland AJ, Hoeltje HD. Identification of Glu166 as the
general base in the acylation reaction of class A β-lactamases through QM/MM mod-
eling. J. Am. Chem. Soc. 125, 9590–9591, 2003.
[141] Hensen C, Hermann JC, Nam K, Ma S, Gao J, Hoeltje HD. A combined QM/MM
approach to protein-ligand interactions: Polarization effects of the HIV-1 protease on
selected high affinity inhibitors. J. Med. Chem. 47, 6673–6680, 2004.
[142] Hermann JC, Hensen C, Ridder L, Mulholland AJ, Hoeltje HD. Mechanisms of antibi-
otic resistance: QM/MM modeling of the acylation reaction of a class A β-lactamase
with benzylpenicillin. J. Am. Chem. Soc. 127, 4454–4465, 2005.
[143] Hermann JC, Ridder L, Hoeltje HD, Mulholland AJ. Molecular mechanisms of an-
tibiotic resistance: QM/MM modelling of deacylation in a class A β-lactamase. Org.
Biomol. Chem. 4, 206–210, 2006.
[144] Morse PM. Diatomic molecules according to the wave mechanics. II. Vibrational
levels. Phys. Rev. 34, 57–64, 1929.
[145] Guvench O, MacKerell Jr AD. Comparison of protein force fields for molecular dy-
namics simulations. In Molecular Modelling of Proteins, vol. 443 of Methods in Molecular
Biology, A Kukol, ed., pp. 63–88. Humana Press, 999 Riverview Drive, Suite 208, To-
towa, NJ 07512 USA, 2008.
[146] van der Spoel D, Lindahl E, Hess B, Groenhof G, Mark AE, Berendsen HJ. Gromacs:
Fast, flexible, and free. J. Comput. Chem. 26, 1701–1718, 2005.
92

Bibliography
[147] Rost B, Yachdav G, Liu J. The PredictProtein server. Nucleic Acids Res. 32, W321–326,
2004.
[148] Rost B. Review: Protein secondary structure prediction continues to rise. J. Struct.
Biol. 134, 204–218, 2001.
[149] Needleman SB, Wunsch CD. A general method applicable to the search for similari-
ties in the amino acid sequence of two proteins. J. Mol. Biol. 48, 443–453, 1970.
[150] Smith TF, Waterman MS. Identification of common molecular subsequences. J. Mol.
Biol. 147, 195–197, 1981.
[151] Shi J, Blundell TL, Mizuguchi K. FUGUE: Sequence-structure homology recognition
using environment-specific substitution tables and structure-dependent gap penal-
ties. J. Mol. Biol. 310, 243–257, 2001.
[152] Altschul SF, Gish W, Miller W, Myers EW, Lipman DJ. Basic local alignment search
tool. J. Mol. Biol. 215, 403–410, 1990.
[153] Chenna R, Sugawara H, Koike T, Lopez R, Gibson TJ, Higgins DG, Thompson JD.
Multiple sequence alignment with the Clustal series of programs. Nucleic Acids Res.
31, 3497–3500, 2003.
[154] Poirot O, O’Toole E, Notredame C. Tcoffee@igs: A web server for computing, evalu-
ating and combining multiple sequence alignments. Nucleic Acids Res. 31, 3503–3506,
2003.
[155] Berman HM, Westbrook J, Feng Z, Gilliland G, Bhat TN, Weissig H, Shindyalov IN,
Bourne PE. The Protein Data Bank. Nucleic Acids Res. 28, 235–242, 2000.
[156] Insight II version 2005, Accelrys Inc., 10188 Telesis Court, Suite 100 San Diego, CA
92121, USA.
[157] Canutescu AA, Shelenkov AA, Dunbrack RLJ. A graph-theory algorithm for rapid
protein side-chain prediction. Protein Sci. 12, 2001–2014, 2003.
[158] Holtje HD, Folkers G. Molecular modeling: Basic principles and applications, vol. 5 of
Methods and Principles in Medicinal Chemistry. VCH Verlagsgesellschaft mbH, Wein-
heim, Germany, 1997.
[159] Lindahl E. Molecular dynamics simulations. In Molecular modeling of proteins, vol. 443
of Methods in Molecular Biology, A Kukol, ed., pp. 3–23. Humana Press, 999 Riverview
Drive, Suite 208, Totowa, NJ 07512 USA, 2008.
[160] Essmann U, Perera L, Berkowitz ML, Darden T, Lee H, Pedersen LG. A smooth
particle mesh Ewald method. J. Chem. Phys. 103, 8577–8593, 1995.
93

Bibliography
[161] Hess B, Bekker H, Berendsen HJC, Fraaije JGEM. LINCS: A linear constraint solver
for molecular simulations. J. Comput. Chem. 18, 1463–1472, 1997.
[162] Berendsen HJC, Postma JPM, DiNola A, Haak JR. Molecular dynamics with coupling
to an external bath. J. Chem. Phys. 81, 3684–3690, 1984.
[163] van der Spoel D, Lindahl E, Hess B, van Buuren AR, Apol E, Meulenhoff PJ, Tieleman
DP, Sijbers AL, Feenstra KA, van Drunen R, Berendsen HJ. GROMACS user manual
version 3.3., 2005. http://www.gromacs.org.
[164] Laskowski RA, MacArthur MW, Moss DS, Thornton JM. PROCHECK: A program to
check the stereochemical quality of protein structures. J. Appl. Crystallogr. 26, 283–291,
1993.
[165] Morris GM, Lim-Wilby M. Molecular docking. In Molecular Modelling of Proteins, vol.
443 of Methods in Molecular Biology, A Kukol, ed., pp. 365–382. Humana Press, 999
Riverview Drive, Suite 208, Totowa, NJ 07512 USA, 2008.
[166] Verdonk ML, Cole JC, Hartshorn MJ, Murray CW, Taylor RD. Improved protein-
ligand docking using GOLD. Proteins 52, 609–623, 2003.
[167] Merlitz H, Burghardt B, Wenzel W. Application of the stochastic tunneling method
to high throughput database screening. Chem. Phys. Lett. 370, 68–73, 2003.
[168] Discovery Studio 2.1, Accelrys Inc., 10188 Telesis Court, Suite 100 San Diego, CA
92121, USA.
[169] McGann MR, Almond HR, Nicholls A, Grant JA, Brown FK. Gaussian docking func-
tions. Biopolymers 68, 76–90, 2003.
[170] Jain A. Surflex: Fully automatic flexible molecular docking using a molecular
similarity-based search engine. J. Med. Chem. 46, 499–511, 2003.
[171] Rarey M, Kramer B, Lengauer T, Klebe G. A fast flexible docking method using an
incremental construction algorithm. J. Mol. Biol. 261, 470–489, 1996.
[172] Taylor R, Jewsbury P, Essex J. A review of protein-small molecule docking methods.
J. Comput.-Aided Mol. Des. 16, 151–166, 2002.
[173] Eldridge MD, Murray CW, Auton TR, Paolini GV, Mee RP. Empirical scoring func-
tions: I. The development of a fast empirical scoring function to estimate the binding
affinity of ligands in receptor complexes. J. Comput.-Aided Mol. Des. 11, 425–445, 1997.
[174] Jain AN. Scoring noncovalent protein-ligand interactions: A continuous differen-
tiable function tuned to compute binding affinities. J. Comput.-Aided Mol. Des. 10,
427–440, 1996.
94

Bibliography
[175] Muegge I, Martin Y. A general and fast scoring function for protein-ligand interac-
tions: A simplified potential approach. J. Med. Chem. 42, 791–804, 1999.
[176] Goodford PJ. A computational procedure for determining energetically favorable
binding sites on biologically important macromolecules. J. Med. Chem. 28, 849–857,
1985.
[177] Cramer RD, Patterson DE, Bunce JD. Comparative molecular field analysis (CoMFA).
1. Effect of shape on binding of steroids to carrier proteins. J. Am. Chem. Soc. 110,
5959–5967, 1988.
[178] GRID Manual, 2004. Molecular Discovery, Via Stoppani 38, 06135 Ponte San Gio-
vanni, Perugia, Italy.
[179] Klebe G, Abraham U, Mietzner T. Molecular similarity indices in a comparative
analysis (CoMSIA) of drug molecules to correlate and predict their biological activity.
J. Med. Chem. 37, 4130–4146, 1994.
[180] Rannar S, Lindgren F, Geladi P, Wold S. A PLS kernel algorithm for data sets with
many variables and fewer objects. Part 1: Theory and algorithm. J. Chemom. 8, 111–
125, 1994.
[181] Wester M, Johnson E, Marques-Soares C, Dijols S, Dansette P, Mansuy D, Stout C.
Structure of mammalian cytochrome P450 2C5 complexed with diclofenac at 2.1 a
resolution: Evidence for an induced fit model of substrate binding. Biochemistry 42,
9335–9345, 2003.
[182] Bairoch A, Boeckmann B, Ferro S, Gasteiger E. Swiss-Prot: Juggling between evolu-
tion and stability. Brief. Bioinform. 5, 39–55, 2004.
[183] McGuffin LJ, Bryson K, Jones DT. The PSIPRED protein structure prediction server.
Bioinformatics 16, 404–405, 2000.
[184] Kirton SB, Murray CW, Verdonk ML, Taylor RD. Prediction of binding modes for
ligands in the cytochromes P450 and other heme-containing proteins. Proteins 58,
836–844, 2005.
[185] Chen S, Kao YC, Laughton CA. Binding characteristics of aromatase inhibitors and
phytoestrogens to human aromatase. J. Steroid Biochem. Mol. Biol. 61, 107–115, 1997.
[186] Vihko P, Isomaa V. Method for prognosticating the progress of breast cancer and
compounds useful for prevention or treatment thereof, U.S. Patent 2006057628 (A1),
2006.
95

Bibliography
[187] Lilienkampf A, Karkola S, Alho-Richmond S, Koskimies P, Johansson N, Huhtinen
K, Vihko K, Wahala K. Synthesis and biological activity of 17β-hydroxysteroid de-
hydrogenase type 1 inhibitors based on a thieno[2,3-d]-pyrimidin-4(3H)-one core. J.
Med. Chem. 2009, submitted.
[188] Couture JF, Pereira De Jesus-Tran K, Roy AM, Cantin L, Cote PL, Legrand P, Luu-
The V, Labrie F, Breton R. Comparison of crystal structures of human type 3 3α-
hydroxysteroid dehydrogenase reveals an ”induced-fit” mechanism and a conserved
basic motif involved in the binding of androgen. Protein Sci. 14, 1485–1497, 2005.
[189] Mazumdar M, Zhou M, Zhu DW, Azzi A, Lin SX. Crystallogenesis of steroid-
converting enzymes and their complexes: Enzyme–ligand interaction studies and
inhibitor design facilitated by complex structures. Cryst. Growth Des. 7, 2206–2212,
2007.
[190] Hara A, Nakayama T, Nakagawa M, Inoue Y, Tanabe H, Sawada H. Kinetic and
stereochemical studies on reaction mechanism of mouse liver 17β-hydroxysteroid
dehydrogenases. J. Biochem. 102, 1585–1592, 1987.
[191] The Maybridge HitFinder Collection database, http://www.maybridge.com.
96

Structures, names and codes of the essential amino acids
HONH2
COOH
Serine, Ser, S
COOHH2N
NH2
Asparagine, Asn, N
COOH
NH
Proline, Pro, P
COOH
NH2
Isoleucine, Ile, I
COOH
NH2
Lysine, Lys, K
ONH2
COOH
Alanine, Ala, A
NH2
COOH
Methionine, Met, M
COOHHO
NH2
O
Glutamic acid, Glu, E
COOHHS
NH2
Cysteine, Cys, C
COOH
NH2
Valine, Val, V
COOH
NH2
Phenylalanine, Phe, F
COOH
HN
NH2
Arginine, Arg, R
H2N
NHCOOHHO
NH2
Aspartic acid, Asp, D
O
COOHH2N
NH2
O
Glutamine, Gln, Q
COOHH
NH2
Glycine, Gly, G
NH2
COOH
Histidine, His, H
HN
N COOH
NH2
Leucine, Leu, L
OH
NH2
COOH
Threonine, Thr, T
NH2
COOH
Tryptophan, Trp, W
HN
COOH
NH2
Tyrosine, Tyr, Y
HO
S
H2N