
Molecular Modeling on Pyrimidine-Urea Inhibitors of TNF ...users.uoa.gr/~tmavrom/2012/Molecular...
13
Molecular Modeling on Pyrimidine-Urea Inhibitors of TNF-α Production: An Integrated Approach Using a Combination of Molecular Docking, Classification Techniques, and 3D-QSAR CoMSIA Varnavas D. Mouchlis, † Georgia Melagraki,* ,† Thomas Mavromoustakos, ‡ George Kollias, § and Antreas Afantitis* ,†,§ † Department of Chemoinformatics, NovaMechanics, Ltd., Nicosia, Cyprus ‡ Laboratory of Organic Chemistry, Department of Chemistry, University of Athens, Athens 15771, Greece § Institute of Immunology, Biomedical Sciences Research Center “Alexander Fleming”, Athens, Greece * S Supporting Information ABSTRACT: Molecular docking, classification techniques, and 3D-QSAR CoMSIA were combined in a multistep framework with the ultimate goal of identifying potent pyrimidine-urea inhibitors of TNF-α production. Using the crystal structure of p38α, all the compounds were docked into the enzyme active site. The docking pose of each compound was subsequently used in a receptor-based alignment for the generation of the CoMSIA fields. “Active” and “inactive” compounds were used to build a Random Tree classification model using the docking score and the CoMSIA fields as input parameters. Domain of applicability indicated the compounds for which activity estimations can be accepted with confidence. For the active compounds, a 3D-QSAR CoMSIA model was subsequently built to accurately estimate the IC 50 values. This novel multistep framework gives insight into the structural characteristics that affect the binding and the inhibitory activity of these analogues on p38α MAP kinase, and it can be extended to other classes of small-molecule inhibitors. In addition, the simplicity of the proposed approach provides expansion to its applicability such as in virtual screening procedures. ■ INTRODUCTION Rheumatoid arthritis (RA) is a chronic autoimmune inflam- matory disease that affects synovial joints by targeting the synovial membrane, articular cartilage, and bones. 1,2 High levels of proinflammatory cytokines such as tumor necrosis factor alpha (TNF-α) and interleukin-1b (IL-1b) are associated in a variety of inflammatory diseases, 3,4 such as RA, multiple sclerosis, inflammatory bowel disease, and Crohn’s disease (CD). 5-7 The important role of TNF-α in the pathogenesis of RA was demonstrated both in experimental animal models and in RA patients. 7-9 As a result, the blockade of TNF-α production may lead to the development of new anti-TNF-α therapies. 10,11 They have been reported three drugs in use for treatment that block the activity of TNF-α: Infliximab (chimeric monoclonal antibody to human TNF), Adalimumab (human monoclonal antibody to TNF), and Etanercept (soluble TNF receptor construct). The pharmacological profile of these new drugs is described in a review article. 12 However, there are some drawbacks in the therapy of RA by these drugs including their high cost, inadequate clinical response, need of intravenous administration and several side effects such as increased risk of tuberculosis. 12 One of the main signal transduction pathways implicated in RA involves p38 mitogen-activated protein (MAP) kinase. 13,14 There are four recognized p38 enzymes with 40-60% structural similarity which are referred as p38α (also known as p38), p38β, p38γ, and p38δ. 15-18 It was demonstrated that p38α regulates the expression of proinflammatory cytokines such as TNF-α and IL-1b, and thus plays a key role in RA. 19 Therefore, the inhibition of p38α MAP kinase is an attractive target for drug development, 20,21 because it would prevent the expression of these proinflammatory cytokines and contribute to the development of therapeutic agents to treat inflammatory diseases such as RA. Because of their potential therapeutic applications, several small-molecules that serve as p38 inhibitors have been developed. 22 It has been reported that potent p38 MAP kinase inhibitors reduce the expression of TNF-α in vitro and in vivo. The most representative p38 inhibitor is a 4-aryl-5-pyridyli- midazole-based inhibitor known as SB203580 (Scheme 1). 23 This compound displayed oral efficacy in several models of cytokine inhibition and inflammatory diseases. The interesting in vivo pharmacological profile of SB203580 renders this com- pound a prototypical standard of other p38 inhibitors. However, into clinical trials SB203580 was characterized by several toxicological effects. 24,25 Other structural classes reported to block cytokines activity include pyrroles, pyrimidines, pyridines, Received: December 6, 2011 Published: February 23, 2012 Article pubs.acs.org/jcim © 2012 American Chemical Society 711 dx.doi.org/10.1021/ci200579f | J. Chem. Inf. Model. 2012, 52, 711-723
Transcript of Molecular Modeling on Pyrimidine-Urea Inhibitors of TNF ...users.uoa.gr/~tmavrom/2012/Molecular...
Molecular Modeling on Pyrimidine-Urea Inhibitors of TNF-αProduction: An Integrated Approach Using a Combination ofMolecular Docking, Classification Techniques, and 3D-QSAR CoMSIAVarnavas D. Mouchlis,† Georgia Melagraki,*,† Thomas Mavromoustakos,‡ George Kollias,§
and Antreas Afantitis*,†,§
†Department of Chemoinformatics, NovaMechanics, Ltd., Nicosia, Cyprus‡Laboratory of Organic Chemistry, Department of Chemistry, University of Athens, Athens 15771, Greece§Institute of Immunology, Biomedical Sciences Research Center “Alexander Fleming”, Athens, Greece
*S Supporting Information
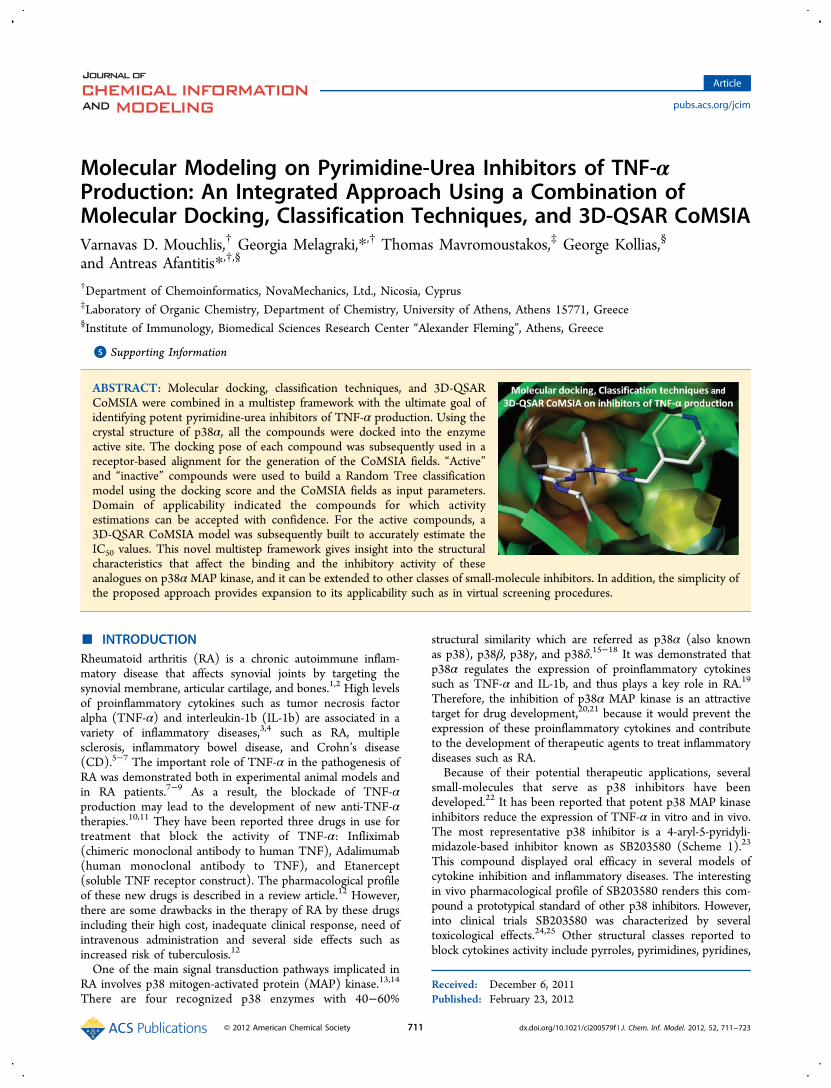
ABSTRACT: Molecular docking, classification techniques, and 3D-QSARCoMSIA were combined in a multistep framework with the ultimate goal ofidentifying potent pyrimidine-urea inhibitors of TNF-α production. Using thecrystal structure of p38α, all the compounds were docked into the enzymeactive site. The docking pose of each compound was subsequently used in areceptor-based alignment for the generation of the CoMSIA fields. “Active”and “inactive” compounds were used to build a Random Tree classificationmodel using the docking score and the CoMSIA fields as input parameters.Domain of applicability indicated the compounds for which activityestimations can be accepted with confidence. For the active compounds, a3D-QSAR CoMSIA model was subsequently built to accurately estimate theIC50 values. This novel multistep framework gives insight into the structuralcharacteristics that affect the binding and the inhibitory activity of theseanalogues on p38αMAP kinase, and it can be extended to other classes of small-molecule inhibitors. In addition, the simplicity ofthe proposed approach provides expansion to its applicability such as in virtual screening procedures.
■ INTRODUCTIONRheumatoid arthritis (RA) is a chronic autoimmune inflam-matory disease that affects synovial joints by targeting thesynovial membrane, articular cartilage, and bones.1,2 High levelsof proinflammatory cytokines such as tumor necrosis factoralpha (TNF-α) and interleukin-1b (IL-1b) are associated in avariety of inflammatory diseases,3,4 such as RA, multiplesclerosis, inflammatory bowel disease, and Crohn’s disease(CD).5−7 The important role of TNF-α in the pathogenesis ofRA was demonstrated both in experimental animal models andin RA patients.7−9 As a result, the blockade of TNF-αproduction may lead to the development of new anti-TNF-αtherapies.10,11 They have been reported three drugs in use fortreatment that block the activity of TNF-α: Infliximab(chimeric monoclonal antibody to human TNF), Adalimumab(human monoclonal antibody to TNF), and Etanercept(soluble TNF receptor construct). The pharmacological profileof these new drugs is described in a review article.12 However,there are some drawbacks in the therapy of RA by these drugsincluding their high cost, inadequate clinical response, need ofintravenous administration and several side effects such asincreased risk of tuberculosis.12
One of the main signal transduction pathways implicated inRA involves p38 mitogen-activated protein (MAP) kinase.13,14
There are four recognized p38 enzymes with 40−60%
structural similarity which are referred as p38α (also knownas p38), p38β, p38γ, and p38δ.15−18 It was demonstrated thatp38α regulates the expression of proinflammatory cytokinessuch as TNF-α and IL-1b, and thus plays a key role in RA.19
Therefore, the inhibition of p38α MAP kinase is an attractivetarget for drug development,20,21 because it would prevent theexpression of these proinflammatory cytokines and contributeto the development of therapeutic agents to treat inflammatorydiseases such as RA.Because of their potential therapeutic applications, several
small-molecules that serve as p38 inhibitors have beendeveloped.22 It has been reported that potent p38 MAP kinaseinhibitors reduce the expression of TNF-α in vitro and in vivo.The most representative p38 inhibitor is a 4-aryl-5-pyridyli-midazole-based inhibitor known as SB203580 (Scheme 1).23
This compound displayed oral efficacy in several models ofcytokine inhibition and inflammatory diseases. The interestingin vivo pharmacological profile of SB203580 renders this com-pound a prototypical standard of other p38 inhibitors. However,into clinical trials SB203580 was characterized by severaltoxicological effects.24,25 Other structural classes reported toblock cytokines activity include pyrroles, pyrimidines, pyridines,
Received: December 6, 2011Published: February 23, 2012
Article
pubs.acs.org/jcim
© 2012 American Chemical Society 711 dx.doi.org/10.1021/ci200579f | J. Chem. Inf. Model. 2012, 52, 711−723
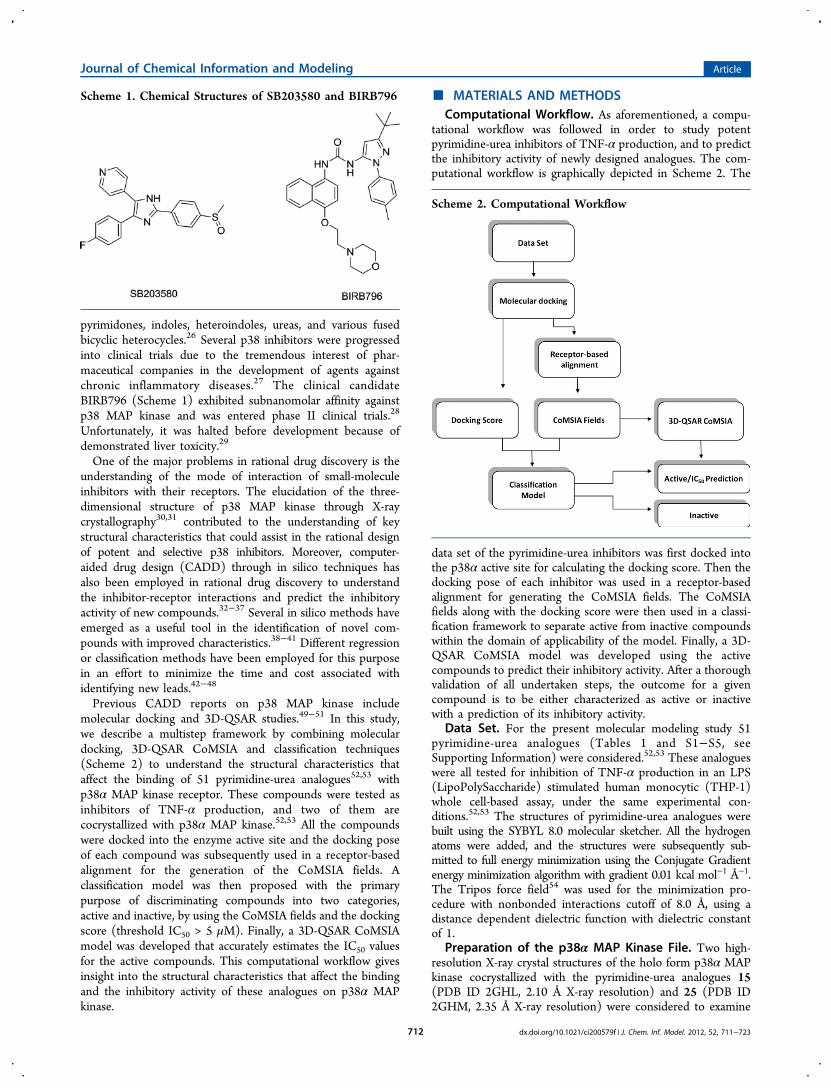
pyrimidones, indoles, heteroindoles, ureas, and various fusedbicyclic heterocycles.26 Several p38 inhibitors were progressedinto clinical trials due to the tremendous interest of phar-maceutical companies in the development of agents againstchronic inflammatory diseases.27 The clinical candidateBIRB796 (Scheme 1) exhibited subnanomolar affinity againstp38 MAP kinase and was entered phase II clinical trials.28
Unfortunately, it was halted before development because ofdemonstrated liver toxicity.29
One of the major problems in rational drug discovery is theunderstanding of the mode of interaction of small-moleculeinhibitors with their receptors. The elucidation of the three-dimensional structure of p38 MAP kinase through X-raycrystallography30,31 contributed to the understanding of keystructural characteristics that could assist in the rational designof potent and selective p38 inhibitors. Moreover, computer-aided drug design (CADD) through in silico techniques hasalso been employed in rational drug discovery to understandthe inhibitor-receptor interactions and predict the inhibitoryactivity of new compounds.32−37 Several in silico methods haveemerged as a useful tool in the identification of novel com-pounds with improved characteristics.38−41 Different regressionor classification methods have been employed for this purposein an effort to minimize the time and cost associated withidentifying new leads.42−48
Previous CADD reports on p38 MAP kinase includemolecular docking and 3D-QSAR studies.49−51 In this study,we describe a multistep framework by combining moleculardocking, 3D-QSAR CoMSIA and classification techniques(Scheme 2) to understand the structural characteristics thataffect the binding of 51 pyrimidine-urea analogues52,53 withp38α MAP kinase receptor. These compounds were tested asinhibitors of TNF-α production, and two of them arecocrystallized with p38α MAP kinase.52,53 All the compoundswere docked into the enzyme active site and the docking poseof each compound was subsequently used in a receptor-basedalignment for the generation of the CoMSIA fields. Aclassification model was then proposed with the primarypurpose of discriminating compounds into two categories,active and inactive, by using the CoMSIA fields and the dockingscore (threshold IC50 > 5 μM). Finally, a 3D-QSAR CoMSIAmodel was developed that accurately estimates the IC50 valuesfor the active compounds. This computational workflow givesinsight into the structural characteristics that affect the bindingand the inhibitory activity of these analogues on p38α MAPkinase.
■ MATERIALS AND METHODSComputational Workflow. As aforementioned, a compu-
tational workflow was followed in order to study potentpyrimidine-urea inhibitors of TNF-α production, and to predictthe inhibitory activity of newly designed analogues. The com-putational workflow is graphically depicted in Scheme 2. The
data set of the pyrimidine-urea inhibitors was first docked intothe p38α active site for calculating the docking score. Then thedocking pose of each inhibitor was used in a receptor-basedalignment for generating the CoMSIA fields. The CoMSIAfields along with the docking score were then used in a classi-fication framework to separate active from inactive compoundswithin the domain of applicability of the model. Finally, a 3D-QSAR CoMSIA model was developed using the activecompounds to predict their inhibitory activity. After a thoroughvalidation of all undertaken steps, the outcome for a givencompound is to be either characterized as active or inactivewith a prediction of its inhibitory activity.
Data Set. For the present molecular modeling study 51pyrimidine-urea analogues (Tables 1 and S1−S5, seeSupporting Information) were considered.52,53 These analogueswere all tested for inhibition of TNF-α production in an LPS(LipoPolySaccharide) stimulated human monocytic (THP-1)whole cell-based assay, under the same experimental con-ditions.52,53 The structures of pyrimidine-urea analogues werebuilt using the SYBYL 8.0 molecular sketcher. All the hydrogenatoms were added, and the structures were subsequently sub-mitted to full energy minimization using the Conjugate Gradientenergy minimization algorithm with gradient 0.01 kcal mol−1 Å−1.The Tripos force field54 was used for the minimization pro-cedure with nonbonded interactions cutoff of 8.0 Å, using adistance dependent dielectric function with dielectric constantof 1.
Preparation of the p38α MAP Kinase File. Two high-resolution X-ray crystal structures of the holo form p38α MAPkinase cocrystallized with the pyrimidine-urea analogues 15(PDB ID 2GHL, 2.10 Å X-ray resolution) and 25 (PDB ID2GHM, 2.35 Å X-ray resolution) were considered to examine
Scheme 1. Chemical Structures of SB203580 and BIRB796
Scheme 2. Computational Workflow
Journal of Chemical Information and Modeling Article
dx.doi.org/10.1021/ci200579f | J. Chem. Inf. Model. 2012, 52, 711−723712
which complex was suitable for the molecular dockingprocedure.52,53 It is well-known that proteins are flexible andcan occupy different conformations upon the binding of small-molecule inhibitors because of induced fit effects. However, nosignificant conformational differences were observed on thetwo crystal structures. The crystal structure with the higher
X-ray resolution (PDB ID 2GHL) was chosen for the docking,and was prepared using the Protein Preparation Wizardimplementation in Schrodinger suite 2009.55 The bond orderswere assigned, all the hydrogen atoms were added, the disulfidebonds were assigned and all the water molecules were deleted.The Epik 2.0 implementation was used to predict ionization
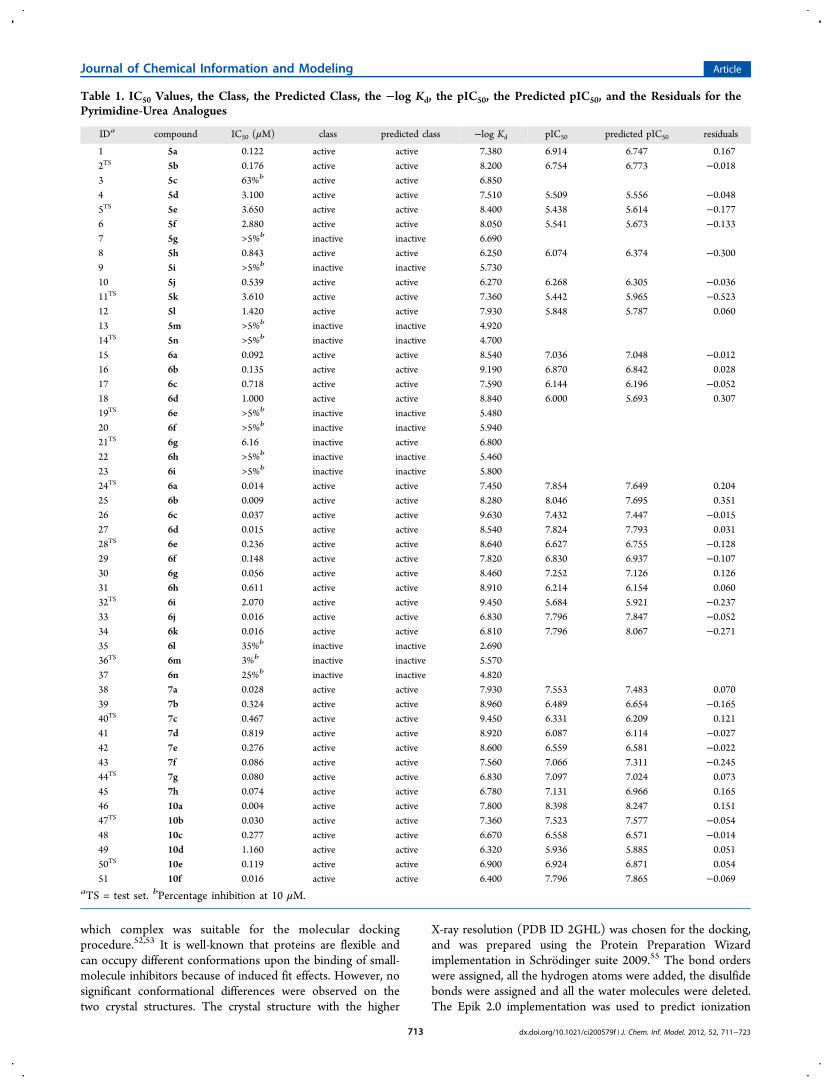
Table 1. IC50 Values, the Class, the Predicted Class, the −log Kd, the pIC50, the Predicted pIC50, and the Residuals for thePyrimidine-Urea Analogues
IDa compound IC50 (μM) class predicted class −log Kd pIC50 predicted pIC50 residuals
1 5a 0.122 active active 7.380 6.914 6.747 0.1672TS 5b 0.176 active active 8.200 6.754 6.773 −0.0183 5c 63%b active active 6.8504 5d 3.100 active active 7.510 5.509 5.556 −0.0485TS 5e 3.650 active active 8.400 5.438 5.614 −0.1776 5f 2.880 active active 8.050 5.541 5.673 −0.1337 5g >5%b inactive inactive 6.6908 5h 0.843 active active 6.250 6.074 6.374 −0.3009 5i >5%b inactive inactive 5.73010 5j 0.539 active active 6.270 6.268 6.305 −0.03611TS 5k 3.610 active active 7.360 5.442 5.965 −0.52312 5l 1.420 active active 7.930 5.848 5.787 0.06013 5m >5%b inactive inactive 4.92014TS 5n >5%b inactive inactive 4.70015 6a 0.092 active active 8.540 7.036 7.048 −0.01216 6b 0.135 active active 9.190 6.870 6.842 0.02817 6c 0.718 active active 7.590 6.144 6.196 −0.05218 6d 1.000 active active 8.840 6.000 5.693 0.30719TS 6e >5%b inactive inactive 5.48020 6f >5%b inactive inactive 5.94021TS 6g 6.16 inactive active 6.80022 6h >5%b inactive inactive 5.46023 6i >5%b inactive inactive 5.80024TS 6a 0.014 active active 7.450 7.854 7.649 0.20425 6b 0.009 active active 8.280 8.046 7.695 0.35126 6c 0.037 active active 9.630 7.432 7.447 −0.01527 6d 0.015 active active 8.540 7.824 7.793 0.03128TS 6e 0.236 active active 8.640 6.627 6.755 −0.12829 6f 0.148 active active 7.820 6.830 6.937 −0.10730 6g 0.056 active active 8.460 7.252 7.126 0.12631 6h 0.611 active active 8.910 6.214 6.154 0.06032TS 6i 2.070 active active 9.450 5.684 5.921 −0.23733 6j 0.016 active active 6.830 7.796 7.847 −0.05234 6k 0.016 active active 6.810 7.796 8.067 −0.27135 6l 35%b inactive inactive 2.69036TS 6m 3%b inactive inactive 5.57037 6n 25%b inactive inactive 4.82038 7a 0.028 active active 7.930 7.553 7.483 0.07039 7b 0.324 active active 8.960 6.489 6.654 −0.16540TS 7c 0.467 active active 9.450 6.331 6.209 0.12141 7d 0.819 active active 8.920 6.087 6.114 −0.02742 7e 0.276 active active 8.600 6.559 6.581 −0.02243 7f 0.086 active active 7.560 7.066 7.311 −0.24544TS 7g 0.080 active active 6.830 7.097 7.024 0.07345 7h 0.074 active active 6.780 7.131 6.966 0.16546 10a 0.004 active active 7.800 8.398 8.247 0.15147TS 10b 0.030 active active 7.360 7.523 7.577 −0.05448 10c 0.277 active active 6.670 6.558 6.571 −0.01449 10d 1.160 active active 6.320 5.936 5.885 0.05150TS 10e 0.119 active active 6.900 6.924 6.871 0.05451 10f 0.016 active active 6.400 7.796 7.865 −0.069
aTS = test set. bPercentage inhibition at 10 μM.
Journal of Chemical Information and Modeling Article
dx.doi.org/10.1021/ci200579f | J. Chem. Inf. Model. 2012, 52, 711−723713
and tautomeric states of the ligand het groups.56,57 Thehydrogen-bonding network was optimized by reorienting thehydroxyl groups, amide groups of Asn and Gln residues, and byselecting appropriate states and orientations of the imidazolering in His residues. Finally, using the “impref utility” andthe OPLS_2005 force field,58 the hydrogen atom positionswere optimized by keeping all the heavy atoms in place. Theprepared structure was saved in PDB format and was used inthe molecular docking. To avoid any inaccuracies depending onusing different force fields, for the preparation of the protein(OPLS_2005) and for the molecular docking (Tripos), theprepared PDB structure was also examined using theBiopolymer in SYBYL 8.0 molecular modeling package.59
The same combination of force fields was used successfully in aprevious work.60
Molecular Docking Procedure. The Surflex-Dock algo-rithm in SYBYL 8.0 molecular modeling package was used forthe molecular docking procedure.61 Surflex-Dock supports afully automated flexible docking procedure for the ligand andrelies on the rigid-receptor approximation to treat ligand−receptor binding.62 The algorithm utilizes an idealized activesite ligand called “protomol”, as a target to generate putativeposes of molecules. These putative poses are scored using theHammerhead scoring function. The scoring function containsthe dominant hydrophobic and polar contact terms as well as arepulsive, an entropic, and a solvation terms. In this study, theligand-based mode was adopted to generate the “protomol”,leaving the threshold and bloat parameters at their defaultvalues of 0.50 and 0 Å, respectively. The docking scores areexpressed in -logKd units to represent the calculated-bindingaffinities. The maximum number of poses per ligand was setto 20. No constraints were used for the molecular docking pro-cedure. The docking complex assumed to represent the ligand−receptor interactions was selected based on the following threecriteria: (i) the docking score of the pose possessed the highestdocking score; (ii) its orientation of the aromatic rings of theligand oriented into the active site in a similar with thecocrystallized ligands orientation; and (iii) the preservation offour key interactions, namely the two hydrogen bonds withMet109, the hydrogen bond with Lys53 as well as an intra-molecular hydrogen bond.CoMSIA Interaction Energy. CoMSIA was originally
developed by Gerhard Klebe to find the common features ina series of small-molecule inhibitors that are important inbinding to the biologically relevant receptor.63 In CoMSIA, fivedifferent similarity fields are calculated: steric, electrostatic,hydrophobic, hydrogen bond donor, and hydrogen bondacceptor. These fields cover the major contributions to ligandbinding64 and the similarity indices are calculated at regularlyspaced grid points (lattice) for the prealigned molecules using aprobe atom. The similarity fields (steric, electrostatic, hydro-phobic, hydrogen bond donor, and hydrogen bond acceptor)were calculated at each lattice intersection of a regularly spacedgrid of 2.0 Å. The similarity indices were calculated using the sp3
carbon as probe atom with radius 1 Å, charge +1, hydro-phobicity +1, hydrogen bond donating +1, hydrogen bondaccepting +1. The default value of 0.3 was set for attenuationfactor α.65
Classification Model. A classification model has beendeveloped in order to separate active from inactive compoundsand filter out the inactive ones. As input variables for thedevelopment of the classification model, the docking score andthe CoMSIA similarity fields, steric, electrostatic, hydrophobic,
H-bond donor and H-bond acceptor were used. Random tree(RT) classification technique implemented in WEKA66 pro-gram was used to discriminate between the different classes.Decision trees represent a supervised approach to classificationwith its simple structure consisting of root, nodes, branches andleaves. The first node is a root. A decision tree is usually drawnbeginning from the root downward. Nonterminal nodesrepresent tests on attributes and each node corresponds witha certain characteristic. From each node two or more branchesgrow connecting the nodes and each branch corresponds with arange of values that give a partition of the set of values of thegiven characteristic. The terminal nodes are called leaves andreflect decision outcomes. A Random tree is a tree drawn atrandom from a set of possible trees using different features ateach node. RT is a WEKA implementation of the randomdecision tree algorithm. It is a decision tree with no pruningand considering only log2(N) of descriptors in each node(where N is a total amount of available descriptors). Randomtrees can be generated efficiently and the combination of largesets of Random trees generally leads to accurate models.67
For the validation of the developed classification modelvarious statistical parameters were calculated. In particular, theproposed classification model was fully validated using thefollowing measurements:
=+
precisionTP
TP FP (1)
=+
sensitivityTP
TP FN (2)
=+
specificityTN
TN FP (3)
= ++ + +
accuracyTP TN
TP FP FN TN (4)
where TP = true positive, FP = false positive, TN = truenegative, and FN = false negativeThe confusion matrix is also given as shown below:
positive predicted negative predicted
positive observed (active) TP FN
negative observed(inactive)
FP TN
Applicability Domain. In order for an in silico model to beused for screening new compounds, its domain of applica-tion37,68,69 must be defined and predictions for only thosecompounds that fall into this domain may be consideredreliable. Similarity measurements were used to define the domainof applicability of the models based on the Euclidean distancesamong all the training set compounds.70 The distance of a test setcompound to its nearest neighbor in the training set wascompared to the predefined applicability domain (APD)threshold. The prediction was considered unreliable when thedistance was higher than APD. APD was calculated as follows:
= ⟨ ⟩+ σd ZAPD (5)
Calculation of ⟨d⟩ and σ was performed as follows: First, theaverage of Euclidean distances between all pairs of trainingcompounds was calculated. Next, the set of distances that werelower than the average was formulated. ⟨d⟩ and σ were finallycalculated as the average and standard deviation of all distances
Journal of Chemical Information and Modeling Article
dx.doi.org/10.1021/ci200579f | J. Chem. Inf. Model. 2012, 52, 711−723714
included in this set. Z was an empirical cutoff value and for thiswork, it was chosen equal to 0.5.70
3D-QSAR CoMSIA Model. The PLS analysis implementedin SYBYL 8.071,72 was employed to obtain correlation betweenthe CoMSIA similarity fields, which were used as independentexplanatory variables, and the pIC50 values which were used astarget dependent variables. PLS was performed in two stages.The first was the crossvalidation using the leave-one-outmethod (LOO) to determine the value of the crossvalidated q2,the crossvalidated standard error of predictions SPRESS and theoptimal number of components (ONC). In the leave-one-outmethod, one molecule is omitted from the data set and themodel is derived involving the rest of the molecules and usingthis model, the activity of the omitted molecule is predicted.73
The crossvalidated q2 is calculated by the following equation:
= −q 1PRESS
TSS2
(6)
where PRESS is the predictive error sum of squares and TSSis the total sum of squares. The second stage was without cross-validation and using the ONC, which were determined by thefirst crossvalidation stage, to establish a CoMSIA model represent-ing the data. The noncrossvalidated form is determinedthrough the noncrossvalidated (conventional) r2, the standarderror of estimate (SEE), the F value (F-ratio), and theprobability of r2. To speed up the PLS analysis and reduce thenoise, a column filtering value of 2.00 kcal mol−1 was used.To further assess the robustness and the statistical confidence
of the derived model, bootstrap analysis for 100 runs wasperformed.73 Bootstrap analysis relies on the generation ofmany new data sets from the original one which are obtained byrandomly choosing samples from the original data set withrepeated selection of the same sample being allowed. Thestatistical calculation is then performed on each of thesebootstrap data sets. The difference between the parameterscalculated from the original data set and the average of theparameters calculated from the many bootstrap data sets is ameasure of the bias of the original calculations.The CoMSIA model was assessed for its predictive ability
using the molecules of the test set not included in theconstruction of the model. External validation is the mostacceptable validation method for the predictive ability of aQSAR model, since the molecules of the test set are notincluded in the training set. The external rext
2 was calculatedusing the following equation:
= −∑ −
∑ −
=
=r
y y
y y1
( )
( )in
i i
in
iext
2 1test 2
1test
tr2
(7)
where ntest is the number of compounds that constitute thevalidation data set (test set), ytr is the averaged value for thedependent variable for the training set, yi, yi, i = 1, ..., ntest arethe experimental values and the 3D-QSAR model predictions ofthe dependent variable over the available validation set.Y-randomization test also ensures the robustness and the
statistical significance of a 3D-QSAR model.74 The dependentvariable vector (pIC50) is randomly shuffled and a new model isdeveloped using the original independent variable matrix.75−78
The derived models after several repetitions are expected tohave significant low q2 and r2 values than the ones of theoriginal model. This method is usually performed to eliminatethe possibility of chance correlation. If the opposite happens
then an acceptable 3D-QSAR model cannot be obtained for thespecific modeling method and data.79,80
■ RESULTS AND DISCUSSIONThe previous mentioned computational workflow (Scheme 2)was implemented in order to study the data set of the 51pyrimidine-urea inhibitors of TNF-α production. In thefollowing sections, the computational workflow is describedin detail.
Molecular Docking on Pyrimidine−Urea Inhibitors.Molecular docking was conducted on all the 51 pyrimidine-urea analogues using the molecular docking algorithmSurflex-Dock. The docking scores (−log Kd) are reportedin Table 1. No correlation was found between the dockingscore and the IC50 values. The molecular docking results aredescribed below.
Examination of p38α Active Site. Enzymes in MAPkinase family are characterized by two domains which areseparated by a conserved catalytic channel. The smallN-terminal domain consists mainly of β-sheets, while the largeC-terminal domain consists mostly of α-helices. The N-terminaldomain creates a deep binding pocket for the adenine ring ofATP. The C-terminal domain contains the phosphorylation lipwhich is located at the opening of the channel. The phosphategroups of ATP bind near the phosphorylation lip, and theγ-phosphate group interacts with the residues of the C-terminaldomain. Near the same area the substrate also binds to initiatethe kinase reaction.30,81
As aforementioned, two X-ray crystal structures are availablefor the analogues 15 (PDB ID 2GHL, 2.10 Å X-ray resolution)and 25 (PDB ID 2GHM, 2.35 Å X-ray resolution) with themutated p38α. The mutated p38α is a double mutant (S180A,Y182F) of murine p38α. The mutant enzyme cannot bephosphorylated and, therefore, it is not competent foractivation.52,53 However, those residues are not includedamong the active site residues (SF1a, see SupportingInformation) and, therefore, do not affect the moleculardocking calculation. Since crystallography is a strongexperimental evidence for the binding mode of those analogues,the cocrystallized with the studied analogues enzyme was usedfor the molecular docking. Proteins can exhibit induced fiteffects during the binding of a ligand, in which the proteinconformation changes significantly. The conformational differ-ences caused by this effect can be observed when more thanone cocrystallized complex is available. The two crystalstructures were aligned in order to examine if they differappreciably in conformation. For the alignment all the residueswere used and the rmsd value was 1.240 Å. The low rmsd valuedesignates that there are no significant conformationaldifferences on the two crystal structures. The side chains ofthe active site residues (Val30, Val38, Ala51, Lys53, Leu75,Ile84, Leu86, Leu104, Thr106, Leu108, Met109, Ala157, andLeu167) do not appreciably differ in conformation (SF1a, seeSupporting Information), and the two crystallographic ligandscan fit into both active sites without significant steric clashes(SF1b, Supporting Information). Thus, the crystal structurewith PDB ID 2GHL, which possesses the higher X-rayresolution, was chosen for the molecular docking.
Test of the Surflex-Dock Algorithm. According to thecrystal structure of pyrimidine-urea 15 with the mutated p38α(PDB ID 2GHL) the 2-aminopyrimidine functionality parti-cipates into two hydrogen bonds with the backbone of Met109residue of the ATP-binding pocket. The N-4-MeO-Phenyl
Journal of Chemical Information and Modeling Article
dx.doi.org/10.1021/ci200579f | J. Chem. Inf. Model. 2012, 52, 711−723715
group is accommodated in the well-defined hydrophobicpocket, which consists of residues, such as Leu75, Leu86,Leu104, and Thr106. The N′-2-chlorophenyl group is orientedtoward the solvent exposed residues of the pocket. It isnoteworthy that the conformation of the urea allows for the N′-urea to participate into an intramolecular hydrogen bondingwith the nitrogen atom at the three position of the pyrimidinering. This interaction creates a pseudobicyclic structure forthese compounds and gives them rigidity.52 The secondpyrimidine-urea 25 (PDB ID 2GHM) contains an N′-2-chlorobenzyl group instead of the N′-2-chlorophenyl group inthe analogue 15. The orientation and the interactions of theanalogue 25 are identical to the ones of 15, with the exceptionthat the carbonyl moiety of urea interacts with the amino groupof Lys53 unlike to the one of the analogue 15.53 The twocrystallographic analogues 15 and 25 were docked into theactive site of p38α in order to examine if Surflex-Dock is able toreproduce the crystallographic binding mode (interactions,conformation, and orientation). Surflex-Dock successfullyreproduces the crystallographic binding mode for bothanalogues (SF2 and SF3, for detailed discussion see SupportingInformation).Docking of the Pyrimidine-Urea Analogues. After
successful reproduction of the crystallographic binding modeby Surflex-Dock all the pyrimidine-urea analogues were dockedinto the active site of p38α. The aim was to examine if all theanalogues are docked into the active site of p38α in a similarwith the crystallographic binding mode. The attention has beenfocused on the most characteristic receptor−ligand interactionsof the most active analogue 46 (SF 4). The predicted bySurflex-Dock binding mode for the analogue 46 shows that theorientation and the conformation of this analogue is similar tothe one of the crystallographic analogues 15 and 25. The N-4-F-Phenyl group is accommodated in the hydrophobic pocketand interacts with the residues Leu75, Leu86, Leu104, andThr106. The N′-methylpyridine group is oriented toward thesolvent exposed area and interacts with the residues Tyr35 andAsp168. The 2-aminopyrimidine functionality participates intotwo hydrogen bonds with the backbone of Met109 residue ofthe ATP-binding pocket and the carbonyl moiety of ureainteracts with the amino group of Lys53. The intramolecularhydrogen bond of the N′-urea NH with the nitrogen atom atthe three position of the pyrimidine ring is also observed.Additionally, a hydrogen bond of the nitrogen atom of thepyridine ring with the backbone NH group of Ser32 isobserved. It seems that this hydrogen bond contributes to thetight binding of the 4-substituted analogue 46, because thecorresponding 2-substituted analogue 47, in which thishydrogen bond is not observed, is about 7-fold less activethan the analogue 46 (Tables 1 and S5). By comparing thebioactivity of the analogues 46 and 25 with the analogue 15indicates that a methylene group between the N′-NH and thepyridine or the 2-chlorophenyl group increases the inhibitoryactivity. This might be due to the extra flexibility that givesthe methylene group to the aromatic rings so they areaccommodated more favorably toward the solvent exposed areaof the binding pocket. All the pyrimidine-urea analogues weredocked into the active site of p38α with a similar orientationand conformation. In most of the cases the three hydrogenbonds with Met109 and Lys53 were also observed.Data Set Alignment and Atomic Charges. In the
CoMSIA analysis, bioactive conformation and alignment ruleselection are two important factors to construct a reliable
model. The docking pose of each analogue was used in areceptor-based alignment to calculate the CoMSIA fields. Themost important parameter in 3D-QSAR is the alignment of theindividual molecules since their fields are computed based on a3D lattice. Properly aligned molecules have a comparableconformation and a similar orientation in Cartesian space.Molecular docking into the active site of the p38α has theadvantage of reducing the uncertainty about the bioactiveconformation by adjusting the orientation and conformation ofthe molecules based on the interactions with the active site.The most active analogue 46 was used as a template moleculefor the alignment using 11 atoms (SF 5a) that are common inall analogues. A rigid-body atom-by-atom superimposition ofone molecule onto another was performed using the utility“Align database” available in SYBYL 8.0. The results of thealignment are depicted in SF 5b.Atomic charges for the aligned molecules were calculated
using the Gasteiger-Huckel method, which is a combination oftwo other charge computational methods: the Gasteiger-Marsili82 method to calculate the σ component of the atomiccharge and the Huckel83 method to calculate the π componentof the atomic charge. The total charge is the sum of the chargescalculated by the two methods. The aligned molecules werethen used for the calculation of the CoMSIA fields.
Classification Model. For the development of theclassification and 3D-QSAR CoMSIA models the availablesmall molecules (51 pyrimidine-urea analogues) were separatedinto two independent sets, “actives” and “inactives”. The cutoffvalue for the discrimination between “actives” and “inactives”was set to IC50 > 5 μM. The initial data set was split into atraining and test set. The separation of the data set into trainingand test set was performed randomly.84 The training set wasused for the development of the models reported in this study.The test set was used to get an unbiased estimation of thepredictive ability of the developed models (classification and3D-QSAR CoMSIA models). A commonly used ratio of trainingto test set (70:30) was adopted.85 The training set contains 37compounds (29 “actives” and 8 “inactives”) and the test set 14compounds (10 “actives” and 4 “inactives”) as shown in Table 1.After the classification model was trained, prediction on the
activity of test compounds was performed. The experimentalvalues and the predictions for both training and test examplesare presented in Table 1. The confusion matrix for thecrossvalidation method and model predictions on the externaltest set, are presented in Tables 2 and 3.86,87 The performance
of the model was evaluated based on validation measurementsdescribed in the Materials and Methods section. Thesignificance, accuracy and robustness of the model areillustrated by the corresponding statistics. In particular, the
Table 2. Confusion Matrix (Training Set, 10-Fold Cross-Validation) Random Trees
positive predicted negative predicted
positive observed (active) 29 0negative observed (inactive) 1 7
Table 3. Confusion Matrix (Test Set) Random Trees
positive predicted negative predicted
positive observed (active) 10 0negative observed (inactive) 1 3
Journal of Chemical Information and Modeling Article
dx.doi.org/10.1021/ci200579f | J. Chem. Inf. Model. 2012, 52, 711−723716
application of the 10-fold crossvalidation method produced thefollowing statistics: precision = 97%, sensitivity = 100%,specificity = 88%. By applying the model to the external testset, the following statistical results were obtained: precision =91%, sensitivity = 100%, and specificity = 75%. The statisticalresults are summarized in Table 4.
The applicability domain was defined for the compoundsthat constitute the test set as described in the previous section.Since all validation compounds fell inside the domain ofapplicability, all model predictions for the external test set canbe considered reliable (Table 5).
Moreover, the classification technique gives insight into themodel by visualizing the Random Tree. The visual inspection ofthe Random Tree helps in the analysis and interpretation of thedata structure, the existence of cluster and outliers, therelationship between samples and the influence of eachvariable. The graphical representation of the Random Treefor the data set is presented in Figure 1.
The first classification on whether the compound ischaracterized as active or inactive was achieved by the
classification model. The next step was the development ofthe 3D-QSAR CoMSIA model using the compounds that werecharacterized as “actives” by the classification model. The aimwas to establish a reliable CoMSIA model that could be usedfor predicting the inhibitory activity (IC50 values) of thecompounds.
3D-QSAR CoMSIA Model. As aforementioned, a receptor-based alignment was used for the generation of the CoMSIAmodel based on the compounds which were characterized as“actives” by the classification model. The molecules possessingpercentage inhibition of TNF-α production in the initialpublication were excluded from the CoMSIA model. Theseparation of the data set into training and test set wasperformed randomly as described in previous section. Thetraining set consists of 28 molecules and the test set consists of10 molecules (Table 1). The Partial Least Squares (PLS)analysis was used for deriving the relationships among theCoMSIA fields and the inhibitory activity (IC50 values).71,72
The 3D-QSAR CoMSIA model was derived using the standardimplementation in SYBYL 8.0 molecular modeling package.88
The IC50 values were converted to the pIC50 scale (−log IC50).CoMSIA Analysis. CoMSIA models were generated using
the combination of the following similarity fields: steric,electrostatic, hydrophobic, H-bond donor and H-bond accept-or.63 These fields illustrate the various properties into spatiallocations where they play important roles in determining theinhibitory activity. The best CoMSIA model was derived usingthe steric, electrostatic, and H-bond acceptor fields (Table 6).
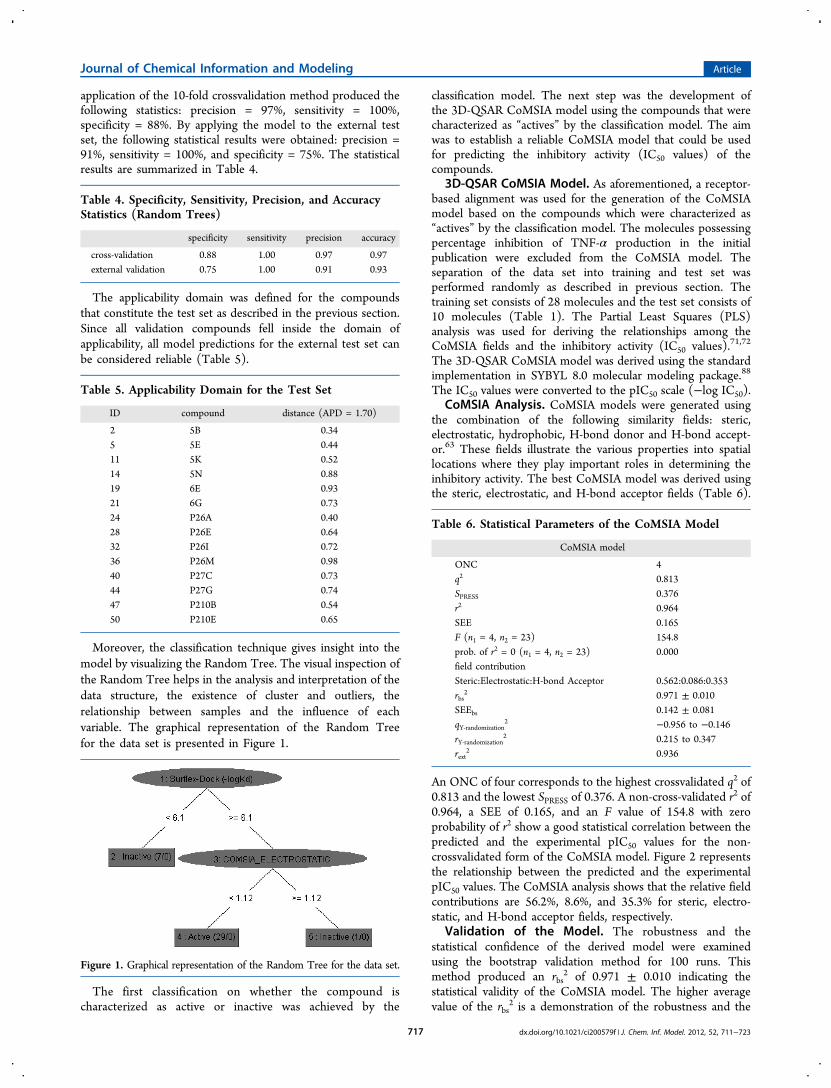
An ONC of four corresponds to the highest crossvalidated q2 of0.813 and the lowest SPRESS of 0.376. A non-cross-validated r2 of0.964, a SEE of 0.165, and an F value of 154.8 with zeroprobability of r2 show a good statistical correlation between thepredicted and the experimental pIC50 values for the non-crossvalidated form of the CoMSIA model. Figure 2 representsthe relationship between the predicted and the experimentalpIC50 values. The CoMSIA analysis shows that the relative fieldcontributions are 56.2%, 8.6%, and 35.3% for steric, electro-static, and H-bond acceptor fields, respectively.
Validation of the Model. The robustness and thestatistical confidence of the derived model were examinedusing the bootstrap validation method for 100 runs. Thismethod produced an rbs
2 of 0.971 ± 0.010 indicating thestatistical validity of the CoMSIA model. The higher averagevalue of the rbs
2 is a demonstration of the robustness and the
Table 4. Specificity, Sensitivity, Precision, and AccuracyStatistics (Random Trees)
specificity sensitivity precision accuracy
cross-validation 0.88 1.00 0.97 0.97external validation 0.75 1.00 0.91 0.93
Table 5. Applicability Domain for the Test Set
ID compound distance (APD = 1.70)
2 5B 0.345 5E 0.4411 5K 0.5214 5N 0.8819 6E 0.9321 6G 0.7324 P26A 0.4028 P26E 0.6432 P26I 0.7236 P26M 0.9840 P27C 0.7344 P27G 0.7447 P210B 0.5450 P210E 0.65
Figure 1. Graphical representation of the Random Tree for the data set.
Table 6. Statistical Parameters of the CoMSIA Model
CoMSIA model
ONC 4q2 0.813SPRESS 0.376r2 0.964SEE 0.165F (n1 = 4, n2 = 23) 154.8prob. of r2 = 0 (n1 = 4, n2 = 23) 0.000field contributionSteric:Electrostatic:H-bond Acceptor 0.562:0.086:0.353rbs
2 0.971 ± 0.010SEEbs 0.142 ± 0.081qY‑randomization
2 −0.956 to −0.146rY‑randomization
2 0.215 to 0.347rext
2 0.936
Journal of Chemical Information and Modeling Article
dx.doi.org/10.1021/ci200579f | J. Chem. Inf. Model. 2012, 52, 711−723717
internal predictive ability of the CoMSIA model. Y-random-ization is a method also for testing the robustness and thestatistical significance of a QSAR model. This method wasperformed to eliminate the possibility of chance correlation. Inparticular, 10 random shuffles of the Y vector (pIC50 values)gave q2 and r2 values in the ranges of −0.956 to −0.146 and0.215 to 0.347, respectively. The negative values of q2 and thelow values of r2 indicate that the results from the CoMSIAmodel were not due to chance correlation or structuraldependency of the training set.External validation was also performed to further assess the
stability and the predictive ability of the CoMSIA model. Thisvalidation was performed using 10 molecules not included inthe development of the model. The predicted pIC50 values arein correlation with the experimental ones within the tolerableerror range (Figure 2). The external rext
2 has a value of 0.936upholding the good correlation between predicted andexperimental pIC50 values. The high value of the external rext
2
of the COMSIA model derived from the receptor-basedalignment suggests that the receptor-based alignment caneffectively take into consideration the ligand−receptorinteractions and the CoMSIA model is reliable and could beused in the design of new inhibitors of TNF-α productionwithin this structural motif of molecules.
An additional validation test has been carried out in order tofurther assess the predictability and the applicability of themodel. The available data were randomly divided five times in aratio of 70:30 for training and test set, respectively. The resultsare presented in Table S6 (see Supporting Information).
CoMSIA Contour Maps. The results of a CoMSIA analysisis a set of contour maps visualizing which areas around themolecule interact favorably or unfavorably with the receptor.The contour maps express the relationship found betweenvariations in the magnitude of the similarity fields in a particularspatial position and variations in the inhibition of TNF-αproduction. The StDev*Coeff option was selected to controlthe type of CoMSIA fields to be viewed. It is based on theproduct of the “sigma” and “coefficients” fields and showswhere variability in the fields around the molecule explainsdifferences in the inhibitory activity. The default option“contribution” was selected to control the interpretation ofthe CoMSIA fields. The contour maps are essential becausethey represent 3D spatial position around a molecule wherestructural modifications correlate with changes in theinhibitory activity.The CoMSIA fields around the most active compound 46
are displayed in Figure 3. The steric interactions arerepresented by green and yellow contour maps (Figure 3a),
Figure 2. Plot of the predicted pIC50 values versus experimental ones for the CoMSIA model.
Figure 3. CoMSIA StDev*Coeff contour maps around the most active compound 46: (a) for steric field (green: bulky groups are favored, yellow:bulky groups are disfavored); (b) for electrostatic field (red: electronegative groups are favored, blue: electronegative groups are disfavored); and(c) for H-bond acceptor field (magenta: groups with H-bond acceptor atoms are favored, white: groups with H-bond acceptor atoms are disfavored).
Journal of Chemical Information and Modeling Article
dx.doi.org/10.1021/ci200579f | J. Chem. Inf. Model. 2012, 52, 711−723718
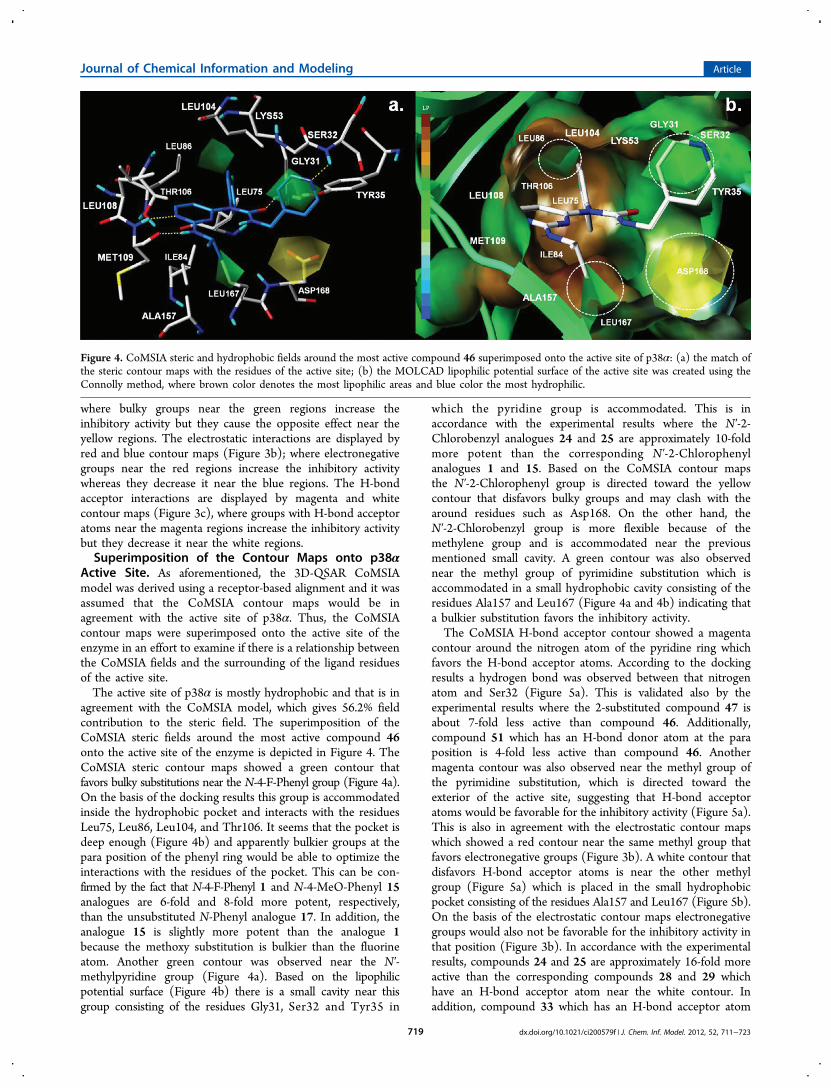
where bulky groups near the green regions increase theinhibitory activity but they cause the opposite effect near theyellow regions. The electrostatic interactions are displayed byred and blue contour maps (Figure 3b); where electronegativegroups near the red regions increase the inhibitory activitywhereas they decrease it near the blue regions. The H-bondacceptor interactions are displayed by magenta and whitecontour maps (Figure 3c), where groups with H-bond acceptoratoms near the magenta regions increase the inhibitory activitybut they decrease it near the white regions.Superimposition of the Contour Maps onto p38α
Active Site. As aforementioned, the 3D-QSAR CoMSIAmodel was derived using a receptor-based alignment and it wasassumed that the CoMSIA contour maps would be inagreement with the active site of p38α. Thus, the CoMSIAcontour maps were superimposed onto the active site of theenzyme in an effort to examine if there is a relationship betweenthe CoMSIA fields and the surrounding of the ligand residuesof the active site.The active site of p38α is mostly hydrophobic and that is in
agreement with the CoMSIA model, which gives 56.2% fieldcontribution to the steric field. The superimposition of theCoMSIA steric fields around the most active compound 46onto the active site of the enzyme is depicted in Figure 4. TheCoMSIA steric contour maps showed a green contour thatfavors bulky substitutions near the N-4-F-Phenyl group (Figure 4a).On the basis of the docking results this group is accommodatedinside the hydrophobic pocket and interacts with the residuesLeu75, Leu86, Leu104, and Thr106. It seems that the pocket isdeep enough (Figure 4b) and apparently bulkier groups at thepara position of the phenyl ring would be able to optimize theinteractions with the residues of the pocket. This can be con-firmed by the fact that N-4-F-Phenyl 1 and N-4-MeO-Phenyl 15analogues are 6-fold and 8-fold more potent, respectively,than the unsubstituted N-Phenyl analogue 17. In addition, theanalogue 15 is slightly more potent than the analogue 1because the methoxy substitution is bulkier than the fluorineatom. Another green contour was observed near the N′-methylpyridine group (Figure 4a). Based on the lipophilicpotential surface (Figure 4b) there is a small cavity near thisgroup consisting of the residues Gly31, Ser32 and Tyr35 in
which the pyridine group is accommodated. This is inaccordance with the experimental results where the N′-2-Chlorobenzyl analogues 24 and 25 are approximately 10-foldmore potent than the corresponding N′-2-Chlorophenylanalogues 1 and 15. Based on the CoMSIA contour mapsthe N′-2-Chlorophenyl group is directed toward the yellowcontour that disfavors bulky groups and may clash with thearound residues such as Asp168. On the other hand, theN′-2-Chlorobenzyl group is more flexible because of themethylene group and is accommodated near the previousmentioned small cavity. A green contour was also observednear the methyl group of pyrimidine substitution which isaccommodated in a small hydrophobic cavity consisting of theresidues Ala157 and Leu167 (Figure 4a and 4b) indicating thata bulkier substitution favors the inhibitory activity.The CoMSIA H-bond acceptor contour showed a magenta
contour around the nitrogen atom of the pyridine ring whichfavors the H-bond acceptor atoms. According to the dockingresults a hydrogen bond was observed between that nitrogenatom and Ser32 (Figure 5a). This is validated also by theexperimental results where the 2-substituted compound 47 isabout 7-fold less active than compound 46. Additionally,compound 51 which has an H-bond donor atom at the paraposition is 4-fold less active than compound 46. Anothermagenta contour was also observed near the methyl group ofthe pyrimidine substitution, which is directed toward theexterior of the active site, suggesting that H-bond acceptoratoms would be favorable for the inhibitory activity (Figure 5a).This is also in agreement with the electrostatic contour mapswhich showed a red contour near the same methyl group thatfavors electronegative groups (Figure 3b). A white contour thatdisfavors H-bond acceptor atoms is near the other methylgroup (Figure 5a) which is placed in the small hydrophobicpocket consisting of the residues Ala157 and Leu167 (Figure 5b).On the basis of the electrostatic contour maps electronegativegroups would also not be favorable for the inhibitory activity inthat position (Figure 3b). In accordance with the experimentalresults, compounds 24 and 25 are approximately 16-fold moreactive than the corresponding compounds 28 and 29 whichhave an H-bond acceptor atom near the white contour. Inaddition, compound 33 which has an H-bond acceptor atom
Figure 4. CoMSIA steric and hydrophobic fields around the most active compound 46 superimposed onto the active site of p38α: (a) the match ofthe steric contour maps with the residues of the active site; (b) the MOLCAD lipophilic potential surface of the active site was created using theConnolly method, where brown color denotes the most lipophilic areas and blue color the most hydrophilic.
Journal of Chemical Information and Modeling Article
dx.doi.org/10.1021/ci200579f | J. Chem. Inf. Model. 2012, 52, 711−723719
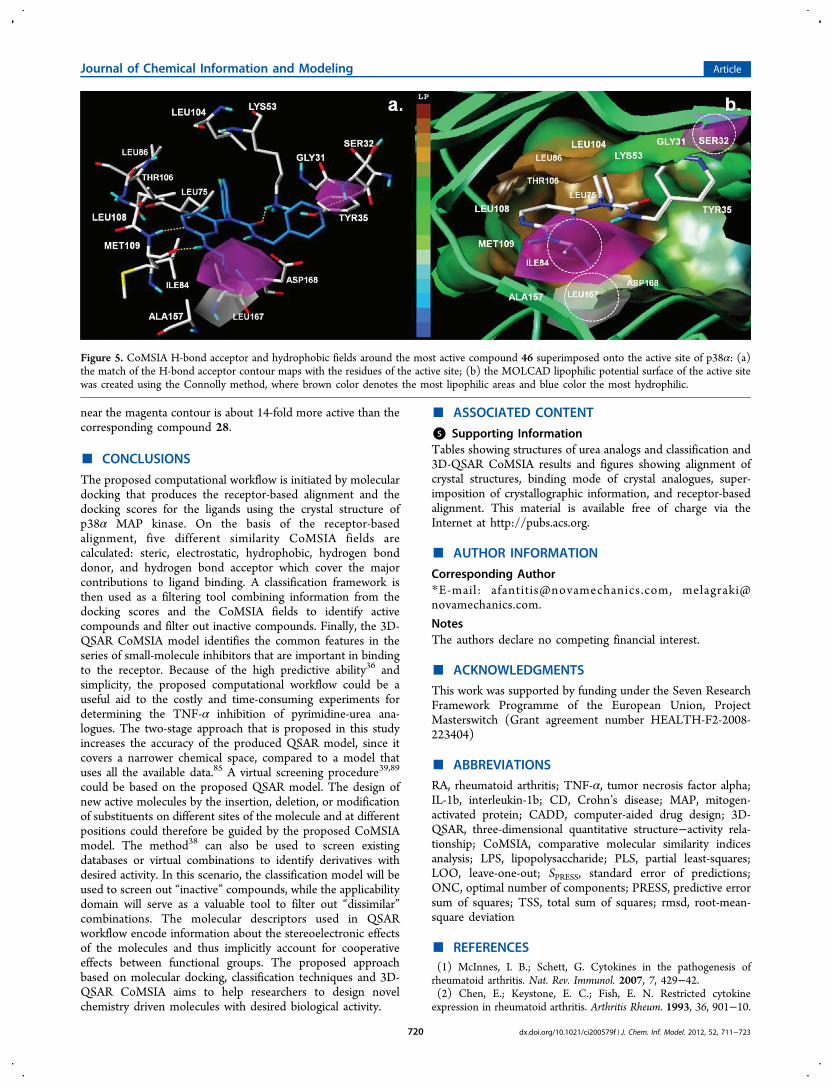
near the magenta contour is about 14-fold more active than thecorresponding compound 28.
■ CONCLUSIONS
The proposed computational workflow is initiated by moleculardocking that produces the receptor-based alignment and thedocking scores for the ligands using the crystal structure ofp38α MAP kinase. On the basis of the receptor-basedalignment, five different similarity CoMSIA fields arecalculated: steric, electrostatic, hydrophobic, hydrogen bonddonor, and hydrogen bond acceptor which cover the majorcontributions to ligand binding. A classification framework isthen used as a filtering tool combining information from thedocking scores and the CoMSIA fields to identify activecompounds and filter out inactive compounds. Finally, the 3D-QSAR CoMSIA model identifies the common features in theseries of small-molecule inhibitors that are important in bindingto the receptor. Because of the high predictive ability36 andsimplicity, the proposed computational workflow could be auseful aid to the costly and time-consuming experiments fordetermining the TNF-α inhibition of pyrimidine-urea ana-logues. The two-stage approach that is proposed in this studyincreases the accuracy of the produced QSAR model, since itcovers a narrower chemical space, compared to a model thatuses all the available data.85 A virtual screening procedure39,89
could be based on the proposed QSAR model. The design ofnew active molecules by the insertion, deletion, or modificationof substituents on different sites of the molecule and at differentpositions could therefore be guided by the proposed CoMSIAmodel. The method38 can also be used to screen existingdatabases or virtual combinations to identify derivatives withdesired activity. In this scenario, the classification model will beused to screen out “inactive” compounds, while the applicabilitydomain will serve as a valuable tool to filter out “dissimilar”combinations. The molecular descriptors used in QSARworkflow encode information about the stereoelectronic effectsof the molecules and thus implicitly account for cooperativeeffects between functional groups. The proposed approachbased on molecular docking, classification techniques and 3D-QSAR CoMSIA aims to help researchers to design novelchemistry driven molecules with desired biological activity.
■ ASSOCIATED CONTENT
*S Supporting InformationTables showing structures of urea analogs and classification and3D-QSAR CoMSIA results and figures showing alignment ofcrystal structures, binding mode of crystal analogues, super-imposition of crystallographic information, and receptor-basedalignment. This material is available free of charge via theInternet at http://pubs.acs.org.
■ AUTHOR INFORMATION
Corresponding Author*E-mail: [email protected], [email protected].
NotesThe authors declare no competing financial interest.
■ ACKNOWLEDGMENTS
This work was supported by funding under the Seven ResearchFramework Programme of the European Union, ProjectMasterswitch (Grant agreement number HEALTH-F2-2008-223404)
■ ABBREVIATIONS
RA, rheumatoid arthritis; TNF-α, tumor necrosis factor alpha;IL-1b, interleukin-1b; CD, Crohn’s disease; MAP, mitogen-activated protein; CADD, computer-aided drug design; 3D-QSAR, three-dimensional quantitative structure−activity rela-tionship; CoMSIA, comparative molecular similarity indicesanalysis; LPS, lipopolysaccharide; PLS, partial least-squares;LOO, leave-one-out; SPRESS, standard error of predictions;ONC, optimal number of components; PRESS, predictive errorsum of squares; TSS, total sum of squares; rmsd, root-mean-square deviation
■ REFERENCES(1) McInnes, I. B.; Schett, G. Cytokines in the pathogenesis ofrheumatoid arthritis. Nat. Rev. Immunol. 2007, 7, 429−42.(2) Chen, E.; Keystone, E. C.; Fish, E. N. Restricted cytokineexpression in rheumatoid arthritis. Arthritis Rheum. 1993, 36, 901−10.
Figure 5. CoMSIA H-bond acceptor and hydrophobic fields around the most active compound 46 superimposed onto the active site of p38α: (a)the match of the H-bond acceptor contour maps with the residues of the active site; (b) the MOLCAD lipophilic potential surface of the active sitewas created using the Connolly method, where brown color denotes the most lipophilic areas and blue color the most hydrophilic.
Journal of Chemical Information and Modeling Article
dx.doi.org/10.1021/ci200579f | J. Chem. Inf. Model. 2012, 52, 711−723720
(3) Dinarello, C. A. Inflammatory cytokines: Interleukin-1 and tumornecrosis factor as effector molecules in autoimmune diseases. Curr.Opin. Immunol. 1991, 3, 941−8.(4) Kontoyiannis, D.; Kotlyarov, A.; Carballo, E.; Alexopoulou, L.;Blackshear, P. J.; Gaestel, M.; Davis, R.; Flavell, R.; Kollias, G.Interleukin-10 targets p38 MAPK to modulate ARE-dependent TNFmRNA translation and limit intestinal pathology. EMBO J. 2001, 20,3760−70.(5) Andreakos, E. T.; Foxwell, B. M.; Brennan, F. M.; Maini, R. N.;Feldmann, M. Cytokines and anti-cytokine biologicals in auto-immunity: present and future. Cytokine Growth Factor Rev. 2002, 13,299−313.(6) Feldmann, M.; Brennan, F. M.; Maini, R. N. Role of cytokines inrheumatoid arthritis. Annu. Rev. Immunol. 1996, 14, 397−440.(7) Feldmann, M.; Maini, R. N. Anti-TNF alpha therapy ofrheumatoid arthritis: what have we learned? Annu. Rev. Immunol.2001, 19, 163−96.(8) Kollias, G.; Douni, E.; Kassiotis, G.; Kontoyiannis, D. On the roleof tumor necrosis factor and receptors in models of multiorgan failure,rheumatoid arthritis, multiple sclerosis and inflammatory boweldisease. Immunol. Rev. 1999, 169, 175−94.(9) Kollias, G.; Douni, E.; Kassiotis, G.; Kontoyiannis, D. Thefunction of tumour necrosis factor and receptors in models of multi-organ inflammation, rheumatoid arthritis, multiple sclerosis andinflammatory bowel disease. Ann. Rheum. Dis. 1999, 58 (Suppl 1),I32−9.(10) Kollias, G.; Kontoyiannis, D. Role of TNF/TNFR inautoimmunity: specific TNF receptor blockade may be advantageousto anti-TNF treatments. Cytokine Growth Factor Rev. 2002, 13, 315−21.(11) Kollias, G.; Kontoyiannis, D.; Douni, E.; Kassiotis, G. The roleof TNF/TNFR in organ-specific and systemic autoimmunity:implications for the design of optimized ’anti-TNF’ therapies. Curr.Dir. Autoimmun. 2002, 5, 30−50.(12) Olsen, N. J.; Stein, C. M. New drugs for rheumatoid arthritis.N. Engl. J. Med. 2004, 350, 2167−79.(13) Westra, J.; Limburg, P. C. p38 mitogen-activated protein kinase(MAPK) in rheumatoid arthritis. Mini Rev. Med. Chem. 2006, 6, 867−74.(14) Johnson, G. L.; Lapadat, R. Mitogen-activated protein kinasepathways mediated by ERK, JNK, and p38 protein kinases. Science2002, 298, 1911−2.(15) Lee, J. C.; Laydon, J. T.; McDonnell, P. C.; Gallagher, T. F.;Kumar, S.; Green, D.; McNulty, D.; Blumenthal, M. J.; Heys, J. R.;Landvatter, S. W.; et al. A protein kinase involved in the regulation ofinflammatory cytokine biosynthesis. Nature 1994, 372, 739−46.(16) Jiang, Y.; Chen, C.; Li, Z.; Guo, W.; Gegner, J. A.; Lin, S.; Han,J. Characterization of the structure and function of a new mitogen-activated protein kinase (p38β). J. Biol. Chem. 1996, 271, 17920−6.(17) Li, Z.; Jiang, Y.; Ulevitch, R. J.; Han, J. The primary structure ofp38 gamma: a new member of p38 group of MAP kinases. Biochem.Biophys. Res. Commun. 1996, 228, 334−40.(18) Jiang, Y.; Gram, H.; Zhao, M.; New, L.; Gu, J.; Feng, L.; DiPadova, F.; Ulevitch, R. J.; Han, J. Characterization of the structure andfunction of the fourth member of p38 group mitogen-activated proteinkinases, p38delta. J. Biol. Chem. 1997, 272, 30122−8.(19) Newton, R.; Holden, N. Inhibitors of p38 mitogen-activatedprotein kinase: Potential as anti-inflammatory agents in asthma?BioDrugs 2003, 17, 113−129.(20) Brennan, F. M.; Feldmann, M. Cytokines in autoimmunity. CurrOpin Immunol 1996, 8, 872−7.(21) Camussi, G.; Lupia, E. The future role of anti-tumour necrosisfactor (TNF) products in the treatment of rheumatoid arthritis. Drugs1998, 55, 613−20.(22) Lee, J. C.; Kassis, S.; Kumar, S.; Badger, A.; Adams, J. L. p38Mitogen-activated protein kinase inhibitorsMechanisms and ther-apeutic potentials. Pharmacol. Ther. 1999, 82, 389−97.(23) Badger, A. M.; Bradbeer, J. N.; Votta, B.; Lee, J. C.; Adams, J. L.;Griswold, D. E. Pharmacological profile of SB 203580, A selective
inhibitor of cytokine suppressive binding protein/p38 kinase, in animalmodels of arthritis, bone resorption, endotoxin shock and immunefunction. J. Pharmacol. Exp. Ther. 1996, 279, 1453−61.(24) Howard, M. O.; Schwartz, L. W.; Newton, J. F.; Qualls, C. W.Jr.; Yodis, L. A.; Ventre, J. R. Comparative biochemical andmorphometric changes associated with induction of the hepaticmixed function oxidase system in the rat. Toxicol. Pathol. 1991, 19,115−22.(25) Adams, J. L.; Boehm, J. C.; Kassis, S.; Gorycki, P. D.; Webb,E. F.; Hall, R.; Sorenson, M.; Lee, J. C.; Ayrton, A.; Griswold, D. E.;Gallagher, T. F. Pyrimidinylimidazole inhibitors of CSBP/p38 kinasedemonstrating decreased inhibition of hepatic cytochrome P450enzymes. Bioorg. Med. Chem. Lett. 1998, 8, 3111−6.(26) Bolos, J. Structure-activity relationships of p38 mitogen-activated protein kinase inhibitors. Mini-Rev. Med. Chem. 2005, 5,857−68.(27) Goldstein, D. M.; Gabriel, T. Pathway to the clinic: Inhibition ofP38 MAP kinase. A review of ten chemotypes selected fordevelopment. Curr. Top. Med. Chem. 2005, 5, 1017−29.(28) Regan, J.; Breitfelder, S.; Cirillo, P.; Gilmore, T.; Graham, A. G.;Hickey, E.; Klaus, B.; Madwed, J.; Moriak, M.; Moss, N.; Pargellis, C.;Pav, S.; Proto, A.; Swinamer, A.; Tong, L.; Torcellini, C. Pyrazole urea-based inhibitors of p38 MAP kinase: from lead compound to clinicalcandidate. J. Med. Chem. 2002, 45, 2994−3008.(29) Lee, M. R.; Dominguez, C. MAP kinase p38 inhibitors: Clinicalresults and an intimate look at their interactions with p38alpha protein.Curr. Med. Chem. 2005, 12, 2979−94.(30) Wilson, K. P.; Fitzgibbon, M. J.; Caron, P. R.; Griffith, J. P.;Chen, W.; McCaffrey, P. G.; Chambers, S. P.; Su, M. S. Crystalstructure of p38 mitogen-activated protein kinase. J. Biol. Chem. 1996,271, 27696−700.(31) Wang, Z.; Harkins, P. C.; Ulevitch, R. J.; Han, J.; Cobb, M. H.;Goldsmith, E. J. The structure of mitogen-activated protein kinase p38at 2.1-A resolution. Proc. Natl. Acad. Sci. U. S. A. 1997, 94, 2327−32.(32) Mouchlis, V. D.; Barbayianni, E.; Mavromoustakos, T. M.;Kokotos, G. The application of rational design on phospholipase A2inhibitors. Curr. Med. Chem. 2011, 18, 2566−82.(33) Mouchlis, V. D.; Magrioti, V.; Barbayianni, E.; Cermak, N.;Oslund, R. C.; Mavromoustakos, T. M.; Gelb, M. H.; Kokotos, G.Inhibition of secreted phospholipases A2 by 2-oxoamides based on α-amino acids: Synthesis, in vitro evaluation and molecular dockingcalculations. Bioorg. Med. Chem. 2011, 19, 735−43.(34) Mouchlis, V. D.; Mavromoustakos, T. M.; Kokotos, G.Molecular docking and 3D-QSAR CoMFA studies on indole inhibitorsof GIIA secreted phospholipase A2. J. Chem. Inf. Model. 2010, 50,1589−601.(35) Mouchlis, V. D.; Mavromoustakos, T. M.; Kokotos, G. Designof new secreted phospholipase A2 inhibitors based on dockingcalculations by modifying the pharmacophore segments of theFPL67047XX inhibitor. J. Comput.-Aided Mol. Des. 2010, 24, 107−15.(36) Afantitis, A.; Melagraki, G.; Koutentis, P. A.; Sarimveis, H.;Kollias, G. Ligand-based virtual screening procedure for the predictionand the identification of novel β-amyloid aggregation inhibitors usingKohonen maps and Counterpropagation Artificial Neural Networks.Eur. J. Med. Chem. 2011, 46, 497−508.(37) Melagraki, G.; Afantitis, A.; Sarimveis, H.; Igglessi-Markopoulou,O.; Koutentis, P. A.; Kollias, G. In silico exploration for identifyingstructure-activity relationship of MEK inhibition and oral bioavail-ability for isothiazole derivatives. Chem. Biol. Drug. Des. 2010, 76, 397−406.(38) Melagraki, G.; Afantitis, A. Ligand and structure-based virtualscreening strategies for hit-finding and optimization of hepatitis Cvirus (HCV) inhibitors. Curr. Med. Chem. 2011, 18, 2612−9.(39) Melagraki, G.; Afantitis, A.; Sarimveis, H.; Koutentis, P. A.;Kollias, G.; Igglessi-Markopoulou, O. Predictive QSAR workflow forthe in silico identification and screening of novel HDAC inhibitors.Mol. Diversity 2009, 13, 301−11.(40) Roy, K.; Mitra, I. On various metrics used for validation ofpredictive QSAR models with applications in virtual screening and
Journal of Chemical Information and Modeling Article
dx.doi.org/10.1021/ci200579f | J. Chem. Inf. Model. 2012, 52, 711−723721
focused library design. Comb. Chem. High Throughput Screen 2011, 14,450−74.(41) Barreca, M. L.; Iraci, N.; Manfroni, G.; Cecchetti, V. Allostericinhibition of the hepatitis C virus NS5B polymerase: in silico strategiesfor drug discovery and development. Future Med. Chem. 2011, 3,1027−55.(42) Toropova, A. P.; Toropov, A. A.; Benfenati, E.; Gini, G.;Leszczynska, D.; Leszczynski, J. CORAL: Quantitative structure-activity relationship models for estimating toxicity of organiccompounds in rats. J. Comput. Chem. 2011, 32, 2727−33.(43) Toropova, A. P.; Toropov, A. A.; Benfenati, E.; Gini, G.Simplified molecular input-line entry system and InternationalChemical Identifier in the QSAR analysis of styrylquinoline derivativesas HIV-1 integrase inhibitors. Chem. Biol. Drug Des. 2011, 77, 343−60.(44) Yan, A.; Chong, Y.; Wang, L.; Hu, X.; Wang, K. Prediction ofbiological activity of Aurora-A kinase inhibitors by multilinearregression analysis and support vector machine. Bioorg. Med. Chem.Lett. 2011, 21, 2238−43.(45) Wen, J. H.; Zhong, K. J.; Tang, L. J.; Jiang, J. H.; Wu, H. L.;Shen, G. L.; Yu, R. Q. Adaptive variable-weighted support vectormachine as optimized by particle swarm optimization algorithm withapplication of QSAR studies. Talanta 2011, 84, 13−8.(46) Fernandez, M.; Caballero, J.; Fernandez, L.; Sarai, A. Geneticalgorithm optimization in drug design QSAR: Bayesian-regularizedgenetic neural networks (BRGNN) and genetic algorithm-optimizedsupport vectors machines (GA-SVM). Mol. Divers. 2011, 15, 269−89.(47) Sinha, N.; Sen, S. Predicting hERG activities of compoundsfrom their 3D structures: Development and evaluation of a globaldescriptors based QSAR model. Eur. J. Med. Chem. 2011, 46, 618−30.(48) Nicolotti, O.; Giangreco, I.; Introcaso, A.; Leonetti, F.;Stefanachi, A.; Carotti, A. Strategies of multi-objective optimizationin drug discovery and development. Expert Opin. Drug Discovery 2011,6, 871−884.(49) Sperandio da Silva, G. M.; Sant’Anna, C. M.; Barreiro, E. J. Anovel 3D-QSAR comparative molecular field analysis (CoMFA) modelof imidazole and quinazolinone functionalized p38 MAP kinaseinhibitors. Bioorg. Med. Chem. 2004, 12, 3159−66.(50) Xiao, Z.; Varma, S.; Xiao, Y. D.; Tropsha, A. Modeling of p38mitogen-activated protein kinase inhibitors using the CatalystHypoGen and k-nearest neighbor QSAR methods. J. Mol. Graph.Model. 2004, 23, 129−38.(51) Ravindra, G. K.; Achaiah, G.; Sastry, G. N. Molecular modelingstudies of phenoxypyrimidinyl imidazoles as p38 kinase inhibitorsusing QSAR and docking. Eur. J. Med. Chem. 2008, 43, 830−8.(52) Brugel, T. A.; Maier, J. A.; Clark, M. P.; Sabat, M.; Golebiowski,A.; Bookland, R. G.; Laufersweiler, M. J.; Laughlin, S. K.; Vanrens,J. C.; De, B.; Hsieh, L. C.; Mekel, M. J.; Janusz, M. J. Development ofN-2,4-pyrimidine-N-phenyl-N′-phenyl ureas as inhibitors of tumornecrosis factor alpha (TNF-alpha) synthesis. Part 1. Bioorg. Med. Chem.Lett. 2006, 16, 3510−3.(53) Maier, J. A.; Brugel, T. A.; Clark, M. P.; Sabat, M.; Golebiowski,A.; Bookland, R. G.; Laufersweiler, M. J.; Laughlin, S. K.; Vanrens,J. C.; De, B.; Hsieh, L. C.; Brown, K. K.; Juergens, K.; Walter, R. L.;Janusz, M. J. Development of N-2,4-pyrimidine-N-phenyl-N′-alkylureas as orally active inhibitors of tumor necrosis factor alpha (TNF-alpha) synthesis. Part 2. Bioorg. Med. Chem. Lett. 2006, 16, 3514−8.(54) Clark, M.; Crammer, D. R. III; Van Opdenbosch, N. Validationof the general purpose Tripos 5.2 force field. J. Comput. Chem. 1989,10, 982−1012.(55) Schrodinger Suite 2009 Protein Preparation Wizard; Epikversion 2.0, Schrodinger, LLC, New York, NY, 2009; Impact version5.5, Schrodinger, LLC, New York, NY, 2009; Prime version 2.1,Schrodinger, LLC, New York, NY, 2009.(56) Epik, version 2.0, Schrodinger, LLC, New York, NY, 2009.(57) Shelley, J. C.; Cholleti, A.; Frye, L. L.; Greenwood, J. R.; Timlin,M. R.; Uchimaya, M. Epik: A software program for pK(a) predictionand protonation state generation for drug-like molecules. J. Comput.-Aided. Mol. Des. 2007, 21, 681−91.
(58) Kaminski, G. A.; Friesner, R. A.; Tirado-Rives, J.; Jorgensen,W. L. Evaluation and Reparametrization of the OPLS-AA Force Field forProteins via Comparison with Accurate Quantum Chemical Calculationson Peptides. J. Phys. Chem. B 2001, 105, 6474−6487.(59) SYBYL/Biopolymer, molecular modeling software packages,version 8.0, 2007, Tripos Inc., 1699 South Hanley Rd., St. Louis, MO63144-2917.(60) Mouchlis, V. D.; Michopoulou, V.; Constantinou-Kokotou, V.;Mavromoustakos, T.; Dennis, E. A.; Kokotos, G. Binding con-formation of 2-oxoamide inhibitors to group IVA cytosolicphospholipase A2 determined by molecular docking combined withmolecular dynamics. J. Chem. Inf. Model. 2011, 52, 243−54.(61) SYBYL/Surflex-Dock, molecular modeling software packages,version 8.0, 2007, Tripos Inc., 1699 South Hanley Rd., St. Louis, MO63144−2917.(62) Jain, A. N. Surflex: Fully automatic flexible molecular dockingusing a molecular similarity-based search engine. J. Med. Chem. 2003,46, 499−511.(63) Klebe, G.; Abraham, U.; Mietzner, T. Molecular similarityindices in a comparative analysis (CoMSIA) of drug molecules tocorrelate and predict their biological activity. J. Med. Chem. 1994, 37,4130−46.(64) Klebe, G.; Abraham, U. Comparative molecular similarity indexanalysis (CoMSIA) to study hydrogen-bonding properties and to scorecombinatorial libraries. J. Comput.-Aided Mol. Des. 1999, 13, 1−10.(65) Bohm, M.; St rzebecher, J.; Klebe, G. Three-dimensionalquantitative structure-activity relationship analyses using comparativemolecular field analysis and comparative molecular similarity indicesanalysis to elucidate selectivity differences of inhibitors binding totrypsin, thrombin, and factor Xa. J. Med. Chem. 1999, 42, 458−77.(66) Hall, M.; Frank, E.; Holmes, G.; Pfahringer, B.; Reutemann, P.;Witten, I. H. The WEKA data mining software: an update. SIGKDDExplor. Newsl. 2009, 11, 10−18.(67) Zhao, Y.; Zhang, Y. Comparison of decision tree methods forfinding active objects. Adv. Space Res. 2008, 41, 1955−1959.(68) Papa, E.; Kovarich, S.; Gramatica, P. Development, Validationand Inspection of the Applicability Domain of QSPR Models forPhysicochemical Properties of Polybrominated Diphenyl Ethers.QSAR Comb. Sci. 2009, 28, 790−796.(69) Liu, H.; Yao, X.; Gramatica, P. The applications of machinelearning algorithms in the modeling of estrogen-like chemicals. Comb.Chem. High Throughput Screen. 2009, 12, 490−6.(70) Zhang, S.; Golbraikh, A.; Oloff, S.; Kohn, H.; Tropsha, A. Anovel automated lazy learning QSAR (ALL-QSAR) approach: methoddevelopment, applications, and virtual screening of chemical databasesusing validated ALL-QSAR models. J. Chem. Inf. Model. 2006, 46,1984−95.(71) Frank, I.; Feikema, J.; Constantine, N.; Kowalski, B. Predictionof product quality from spectral data using the partial least-squaresmethod. J. Chem. Inf. Comput. Sci. 1984, 24, 20−24.(72) Rannar, S.; Lindgren, F.; Geladi, P.; Wold, S. A PLS kernelalgorithm for data sets with many variables and fewer objects. Part 1:Theory and algorithm. J. Chemometrics 1994, 8, 111−125.(73) Cramer, R. D. III; Bunce, J. D.; Patterson, D. E.; Frank, I. E.Crossvalidation, bootstrapping, and partial least squares comparedwith multiple regression in conventional QSAR studies. Quant.Struct.−Act. Relat. 1988, 7, 18−25.(74) Baumann, K. Cross-validation as the objective function forvariable-selection techniques. Trends Anal. Chem. 2003, 22, 395−406.(75) Afantitis, A.; Melagraki, G.; Sarimveis, H.; Koutentis, P. A.;Markopoulos, J.; Igglessi-Markopoulou, O. A novel QSAR model forpredicting induction of apoptosis by 4-aryl-4H-chromenes. Bioorg.Med. Chem. 2006, 14, 6686−94.(76) Nair, P. C.; Sobhia, M. E. Quantitative structure activityrelationship studies on thiourea analogues as influenza virusneuraminidase inhibitors. Eur. J. Med. Chem. 2008, 43, 293−9.(77) Jalali-Heravi, M.; Asadollahi-Baboli, M.; Shahbazikhah, P. QSARstudy of heparanase inhibitors activity using artificial neural networks
Journal of Chemical Information and Modeling Article
dx.doi.org/10.1021/ci200579f | J. Chem. Inf. Model. 2012, 52, 711−723722
and Levenberg−Marquardt algorithm. Eur. J. Med. Chem. 2008, 43,548−56.(78) Afantitis, A.; Melagraki, G.; Sarimveis, H.; Koutentis, P. A.;Markopoulos, J.; Igglessi-Markopoulou, O. A novel simple QSARmodel for the prediction of anti-HIV activity using multiple linearregression analysis. Mol. Diverersity 2006, 10, 405−14.(79) Afantitis, A.; Melagraki, G.; Sarimveis, H.; Koutentis, P. A.;Markopoulos, J.; Igglessi-Markopoulou, O. Development and evalua-tion of a QSPR model for the prediction of diamagnetic susceptibility.QSAR Comb. Sci. 2008, 27, 432−436.(80) Melagraki, G.; Afantitis, A.; Sarimveis, H.; Koutentis, P.;Markopoulos, J.; Igglessi-Markopoulou, O. A novel QSPR model forpredicting θ (lower critical solution temperature) in polymer solutionsusing molecular descriptors. J. Mol. Model. 2007, 13, 55−64.(81) Tong, L.; Pav, S.; White, D. M.; Rogers, S.; Crane, K. M.;Cywin, C. L.; Brown, M. L.; Pargellis, C. A. A highly specific inhibitorof human p38 MAP kinase binds in the ATP pocket. Nat. Struct. Biol.1997, 4, 311−6.(82) Gasteiger, J.; Marsili, M. Iterative partial equalization of orbitalelectronegativity-a rapid access to atomic charges. Tetrahedron 1980,36, 3219−3228.(83) Purcell, W. P.; Singer, J. A. A brief review and table ofsemiempirical parameters used in the Hueckel molecular orbitalmethod. J. Chem. Eng. Data 1967, 12, 235−246.(84) Novotarskyi, S.; Sushko, I.; Korner, R.; Pandey, A. K.; Tetko, I.V. A comparison of different QSAR approaches to modeling CYP4501A2 inhibition. J. Chem. Inf. Model. 2011, 51, 1271−80.(85) Afantitis, A.; Melagraki, G.; Sarimveis, H.; Koutentis, P. A.;Igglessi-Markopoulou, O.; Kollias, G. A combined LS-SVM & MLRQSAR workflow for predicting the inhibition of CXCR3 receptor byquinazolinone analogs. Mol. Diversity 2010, 14, 225−35.(86) Perez-Garrido, A.; Helguera, A. M.; Borges, F.; Cordeiro, M. N.;Rivero, V.; Escudero, A. G. Two new parameters based on distances ina receiver operating characteristic chart for the selection ofclassification models. J. Chem. Inf. Model. 2011, 51, 2746−59.(87) Du-Cuny, L.; Chen, L.; Zhang, S. A critical assessment ofcombined ligand- and structure-based approaches to HERG channelblocker modeling. J. Chem. Inf. Model. 2011, 51, 2948−60.(88) SYBYL/QSAR and COMFA, molecular modeling softwarepackages, version 8.0, 2007, Tripos Inc., 1699 South Hanley Rd.,St. Louis, MO 63144-2917.(89) Asadollahi, T.; Dadfarnia, S.; Shabani, A. M.; Ghasemi, J. B.;Sarkhosh, M. QSAR models for CXCR2 receptor antagonists based onthe genetic algorithm for data preprocessing prior to application of thePLS linear regression method and design of the new compounds usingin silico virtual screening. Molecules 2011, 16, 1928−55.
Journal of Chemical Information and Modeling Article
dx.doi.org/10.1021/ci200579f | J. Chem. Inf. Model. 2012, 52, 711−723723


![UNIVERSITY OF CAMBRIDGE INTERNATIONAL ... (0620)/0620...... Deduce the molecular formula of urea..... [1] (ii) Calculate the relative molecular mass of urea. You must show all your](https://static.fdocuments.net/doc/165x107/5ac0bbb47f8b9a213f8c516a/university-of-cambridge-international-06200620-deduce-the-molecular.jpg)


![Home | Molecular Cancer Therapeutics - Novel Pyrrolo[3,2-d ......Small Molecule Therapeutics Novel Pyrrolo[3,2-d]pyrimidine Compounds Target Mitochondrial and Cytosolic One-carbon](https://static.fdocuments.net/doc/165x107/60e23b39c532cf402226c780/home-molecular-cancer-therapeutics-novel-pyrrolo32-d-small-molecule.jpg)