
Molecular Initiating Events of Bisphenols on …Molecular Initiating Events of Bisphenols on...
37
Molecular Initiating Events of Bisphenols on Androgen Receptor- Mediated Pathways Provide Guidelines for in Silico Screening and Design of Substitute Compounds Qinchang Chen, † Xiaoxiang Wang, † Haoyue Tan, † Wei Shi,* ,† Xiaowei Zhang, † Si Wei, † John P. Giesy, †,‡,§,∥ and Hongxia Yu † † State Key Laboratory of Pollution Control and Resources Reuse, School of the Environment, Nanjing University, Nanjing, Jiangsu 210023, People’s Republic of China ‡ Department of Veterinary Biomedical Sciences and Toxicology Centre, University of Saskatchewan, Saskatoon, SK S7N 5B3, Canada § Department of Zoology and Center for Integrative Toxicology, Michigan State University, East Lansing, Michigan 48824, United States ∥ Department of Environmental Science, Baylor University, Waco, Texas 76798, United States * S Supporting Information ABSTRACT: Bisphenols (BPs) have the potential to interfere with the androgen receptor (AR). However, in silico screening and substitute design were difficult because little was known about the mechanisms by which BPs interfere with AR-mediated molecular initiating events (MIEs). Here, the AR disrupting effects and associated mechanisms of 15 BPs were evaluated by in vitro assays and molecular dynamics simulations. AR-mediated MIEs, including ligand−receptor interactions and coregulator recruitment, might determine active versus inactive and agonist versus antagonist activities of BPs, respectively. Bisphenol E (BPE), BPF, and BPS with no binding effects were inactive, while all other BPs were AR antagonists. On the basis of their coregulator recruitment patterns and repositioning of helix 12, BPBP, BPC, and BPPH were passive antagonists that blocked coregulator recruitment, and their anti-androgenic potencies were correlated with ligand− receptor interactions; others were active antagonists that recruited corepressors, and their anti-androgenic potencies were correlated with ligand−receptor−corepressor interactions. A new method was developed for MIE-based in silico qualitative and quantitative evaluations of the potential of BPs to disrupt AR-mediated pathways, by which safer BPA substitutes with smaller and less hydrophobic connecting groups could be designed. The MIE-based in silico methods can be used to screen a wider range of chemicals and to design better substitutes. ■ INTRODUCTION Bisphenol A (BPA) is one of the most well-known bisphenols (BPs) and one of the most produced chemicals in the world. BPA is widely used in manufacturing and is ubiquitous in the environment. 1 Because of the growing concern about the endocrine disrupting effects of BPA, 2,3 some other BPs, including BPAF, BPAP, BPF, and BPS, are now being used as substitutes for BPA. These widely used substitutes are detectable in various products, even in those labeled as a BPA- free product. 4−6 According to adverse outcome pathways (AOPs), 7 activa- tion of the androgen receptor (AR) (https://aopwiki.org/ aops/23) is an important molecular initiating event (MIE) that triggers the AOP and results in adverse outcomes (AOs). Some BPs have been reported to disrupt activation of the AR and cause anti-androgenic effects, while some BPs, such as BPAF and BPCH, are more potent disruptors than BPA. 8,9 However, AR disrupting potencies of most BPs were not tested, which makes the evaluation of AR disrupting potencies of BPs an urgent need to avoid their substitution with more potent BPs. Nevertheless, in vivo/vitro assays are expensive and time-consuming and when performed with humans have ethical limitations, and epidemiological assessments of associations are compromised by confounding factors, including exposures to other chemicals. Computer-based methods, being high-throughput for chemical evaluation, offer a robust and economical option for efficiently evaluating Received: February 15, 2019 Revised: March 11, 2019 Accepted: March 13, 2019 Published: March 13, 2019 Letter pubs.acs.org/journal/estlcu Cite This: Environ. Sci. Technol. Lett. 2019, 6, 205-210 © 2019 American Chemical Society 205 DOI: 10.1021/acs.estlett.9b00073 Environ. Sci. Technol. Lett. 2019, 6, 205−210 Downloaded by UNIV OF SASKATCHEWAN at 12:05:41:690 on June 04, 2019 from https://pubs.acs.org/doi/10.1021/acs.estlett.9b00073.
Transcript of Molecular Initiating Events of Bisphenols on …Molecular Initiating Events of Bisphenols on...

Molecular Initiating Events of Bisphenols on Androgen Receptor-Mediated Pathways Provide Guidelines for in Silico Screening andDesign of Substitute CompoundsQinchang Chen,† Xiaoxiang Wang,† Haoyue Tan,† Wei Shi,*,† Xiaowei Zhang,† Si Wei,†
John P. Giesy,†,‡,§,∥ and Hongxia Yu†
†State Key Laboratory of Pollution Control and Resources Reuse, School of the Environment, Nanjing University, Nanjing, Jiangsu210023, People’s Republic of China‡Department of Veterinary Biomedical Sciences and Toxicology Centre, University of Saskatchewan, Saskatoon, SK S7N 5B3,Canada§Department of Zoology and Center for Integrative Toxicology, Michigan State University, East Lansing, Michigan 48824, UnitedStates∥Department of Environmental Science, Baylor University, Waco, Texas 76798, United States
*S Supporting Information
ABSTRACT: Bisphenols (BPs) have the potential tointerfere with the androgen receptor (AR). However, in silicoscreening and substitute design were difficult because littlewas known about the mechanisms by which BPs interfere withAR-mediated molecular initiating events (MIEs). Here, theAR disrupting effects and associated mechanisms of 15 BPswere evaluated by in vitro assays and molecular dynamicssimulations. AR-mediated MIEs, including ligand−receptorinteractions and coregulator recruitment, might determineactive versus inactive and agonist versus antagonist activitiesof BPs, respectively. Bisphenol E (BPE), BPF, and BPS withno binding effects were inactive, while all other BPs were ARantagonists. On the basis of their coregulator recruitment patterns and repositioning of helix 12, BPBP, BPC, and BPPH werepassive antagonists that blocked coregulator recruitment, and their anti-androgenic potencies were correlated with ligand−receptor interactions; others were active antagonists that recruited corepressors, and their anti-androgenic potencies werecorrelated with ligand−receptor−corepressor interactions. A new method was developed for MIE-based in silico qualitative andquantitative evaluations of the potential of BPs to disrupt AR-mediated pathways, by which safer BPA substitutes with smallerand less hydrophobic connecting groups could be designed. The MIE-based in silico methods can be used to screen a widerrange of chemicals and to design better substitutes.
■ INTRODUCTION
Bisphenol A (BPA) is one of the most well-known bisphenols(BPs) and one of the most produced chemicals in the world.BPA is widely used in manufacturing and is ubiquitous in theenvironment.1 Because of the growing concern about theendocrine disrupting effects of BPA,2,3 some other BPs,including BPAF, BPAP, BPF, and BPS, are now being usedas substitutes for BPA. These widely used substitutes aredetectable in various products, even in those labeled as a BPA-free product.4−6
According to adverse outcome pathways (AOPs),7 activa-tion of the androgen receptor (AR) (https://aopwiki.org/aops/23) is an important molecular initiating event (MIE) thattriggers the AOP and results in adverse outcomes (AOs).Some BPs have been reported to disrupt activation of the ARand cause anti-androgenic effects, while some BPs, such as
BPAF and BPCH, are more potent disruptors than BPA.8,9
However, AR disrupting potencies of most BPs were nottested, which makes the evaluation of AR disrupting potenciesof BPs an urgent need to avoid their substitution with morepotent BPs. Nevertheless, in vivo/vitro assays are expensive andtime-consuming and when performed with humans haveethical limitations, and epidemiological assessments ofassociations are compromised by confounding factors,including exposures to other chemicals. Computer-basedmethods, being high-throughput for chemical evaluation,offer a robust and economical option for efficiently evaluating
Received: February 15, 2019Revised: March 11, 2019Accepted: March 13, 2019Published: March 13, 2019
Letter
pubs.acs.org/journal/estlcuCite This: Environ. Sci. Technol. Lett. 2019, 6, 205−210
© 2019 American Chemical Society 205 DOI: 10.1021/acs.estlett.9b00073Environ. Sci. Technol. Lett. 2019, 6, 205−210
Dow
nloa
ded
by U
NIV
OF
SASK
AT
CH
EW
AN
at 1
2:05
:41:
690
on J
une
04, 2
019
from
http
s://p
ubs.
acs.
org/
doi/1
0.10
21/a
cs.e
stle
tt.9b
0007
3.

chemicals.10 However, previous models recognized theimportance of only ligand−receptor interactions for theactivation of the AR, which failed to predict chemicals to beinactive, agonists or antagonists. Because the functioning ofchemicals is dependent on activation of an MIE,11 classificationof structurally different BPs according to mechanisms of actionof AR-mediated MIEs is necessary to screen their ARdisrupting potencies.Similar to the scarcity of data with regard to the abilities of
BPs to disrupt AR-mediated pathways, mechanisms by whichstructurally different BPs interfere with activation of the ARremained unknown, which limited the development of in silicoscreening and design of better substitutes in green chemistry.To the best of our knowledge, BPs have the potential toactivate AR-mediated MIEs by three biochemical processes:ligand binding/unbinding, conformational shifts, and coregu-lator recruitment (Figure S1).12,13 Molecular simulations haveshown their potential for use in investigating ligand−receptorinteractions, protein−protein interactions, and conformationalshifts in previous studies,14−16 which might aid in ourunderstanding of mechanisms of action of BPs interferingwith AR-mediated MIEs. The use of in silico methods intoxicology embraces ideas similar to those of greenchemistry.17 Molecular mechanisms derived from molecularsimulations are conducive to in silico screening of potentialandrogen disrupting chemicals, which can reduce the use of invivo assays,18 and molecular and atomic interactions derivedfrom molecular simulations assist with the design of safer BPAsubstitutes.19
In this study, results of androgen disruption, competitivebinding, and coregulator recruitment derived from in vitroassays and details of ligand−receptor and ligand−receptor−coregulator interactions derived from molecular simulationswere combined to provide insights into how 15 BPs bind toAR and activate the AR-mediated MIE. On the basis of thesedata, activating patterns and relevant AR disrupting potenciesof BPs were correlated. Furthermore, a computational methodfor MIE-based in silico screening was developed, and a methodfor designing BPA substitutes based on key interactionsbetween BPs and AR was developed.
■ MATERIALS AND METHODS
Materials. Structures and chemical information for alltested chemicals are presented in Figure S2 and Table S1. The15 BPs (>98% pure) were purchased from AccuStandard. TheAR agonist 5α-dihydrotestosterone (DHT; >99.5% pure) waspurchased from Dr. Ehrenstorfer-Schafers’s laboratory, and theAR antagonist flutamide (FT; >99% pure) from Sigma-Aldrich.All chemicals were dissolved in dimethyl sulfoxide (DMSO)and stored at −20 °C.Cell Culture and Reporter Gene Assays. The MDA-kb2
cell line20 was cultured in Leibowitz-15 (L15) mediumsupplemented with 10% fetal bovine serum (FBS) and usedcharcoal dextran-stripped FBS instead for experiments. De-tailed descriptions of the assays are provided in the SupportingInformation. Briefly, the cells were seeded in a 384-well plate,and the DMSO content was maintained at <0.1% (v/v) afterexposure. Cell viabilities were tested and chemicals werediluted according to their cytotoxicities (Figure S4A). MDA-kb2 cells were exposed to dilutions of chemicals with orwithout 1 × 10⁻⁹ M DHT (∼EC80 in the reporter gene assay)to assess anti-androgenic or androgenic potencies. Dose−
response curves for DHT and FT (Figure S4B) indicated thereliability of the reporter gene assays.
Competitive Binding Assays. AR competitive bindingassays were performed using a PolarScreen kit (ThermoFisher), following the protocol provided by the manufacturer.Three concentrations were tested for DHT, FT, and BPs, andthe DMSO content was maintained 1% (v/v).
TR-FRET Coregulator Assays. Coregulator recruitmentassays were performed using LanthaScreen TR-FRET kits(Thermo Fisher) following the protocol provided by themanufacturer. For coactivator inhibition assays, BPs with 5 ×10⁻⁸ M DHT (∼EC80 in the coactivator recruitment assay)were added individually to the assay system. Threeconcentrations were tested for each compound, and theDMSO content was maintained at 1% (v/v).
Molecular Dynamics (MD) Simulations. The prepara-tion of chemical structures and AR-LBD was performedaccording to previously described methods.15 MD and steeredMD (SMD) simulations were performed using GROMACSversion 5.12.21,22 MD simulations of ligand−receptor inter-actions, conformational shifts, and coregulator recruitmentwere performed as follows. (1) Ligand−receptor interactionswere investigated by ligand binding and unbinding processes,by using MD simulations, molecular mechanics Poisson−Boltzmann surface area (MM-PBSA) binding free energies,23
and SMD simulations. (2) Conformational shifts wereanalyzed on the basis of trajectories of MD simulations, andsnapshots of equilibrated conformations were extracted todetermine the modes of helix 12 (H12) repositioning. (3)Coregulator recruitment was evaluated by use of proteindocking,15 followed by MD simulations, binding free energycalculations, and SMD simulations of the ligand−receptor−coregulator complexes. Details of the structure preparation,molecular docking, MD simulations, MM-PBSA binding freeenergy calculations, SMD simulations, and protein docking aredescribed in the Supporting Information.
Data Analysis. Results of in vitro assays were analyzedusing GraphPad Prism 6.01 and are presented as the mean ±standard error (SE) of more than three independentexperiments. Multiple comparisons were calculated usingone-way analysis of variance plus Dunnett post-test correction,with p values ≤0.05 considered to be significant. All dose−response curves were derived by use of a model (eq 1).
Y BottomTop Bottom
1 10 x(log IC )Hill slopeMedian= +
−+ − (1)
where ICMedian is the concentration (molar) of the chemicalthat gives a response halfway between Bottom and Top andthe Hill slope is the steepness of the curve. Anti-androgenicpotencies were derived as RIC20 (the concentration showing20% inhibition of luciferase activity induced by 1 × 10⁻⁹ MDHT) of BPs and are presented as logarithm values. Principalcomponent analyses (PCAs) of the binding and unbindingresults were performed using KNIME version 3.3.2,24 and thefirst component was considered as a ligand−receptorinteraction score (LRIscore).
■ RESULTS AND DISCUSSION
Androgen Disruptions of BPs in the Reporter GeneAssays. On the basis of the results of reporter gene assays, 12of 15 BPs (Figure S5) exhibited measurable anti-androgenicpotencies, among which anti-androgenic effects of BPA, BPAF,
Environmental Science & Technology Letters Letter
DOI: 10.1021/acs.estlett.9b00073Environ. Sci. Technol. Lett. 2019, 6, 205−210
206

BPC, and BPZ were consistent with results of previousstudies.8,9,25,26 In contrast, none of the BPs showed androgeniceffects. Three BPs, including BPE, BPF, and BPS, were inactivein reporter gene assays, a result that is consistent with results ofprevious studies.8,25 Three-quarters of the tested BPs used inmanufacturing were more potent androgen disruptors thanBPA (log RIC20 = −5.70), among which BPZ (log RIC20 =−7.21) was the most potent, calling into question their use assubstitutes for BPA. To avoid more toxic BPs and to designsafer substitutes, how BPs interact with the AR at a molecularlevel must be understood to be able to develop in silicoscreening methods for evaluating the potential disruption ofBPA substitutes.Binding and Unbinding between BPs and AR: Key
Features for Androgen Disruption. Competitive bindingassays indicated that BPA, BPAF, BPZ, and the other nine BPs,as well as DHT and FT, were avid binders to the AR whereasBPE, BPF, and BPS were nonbinders (Table 1). These resultswere consistent with those of previous studies.8,27 Consideringonly AR binders induced anti-androgenic effects in the reportergene assays, it was apparent that disruptions of AR-mediatedpathways were a function of binding and unbinding processes.The strength of binding can be evaluated by the use of free
energies of binding [ΔGlig‑recep (Table 1)]. Greater freeenergies of binding demonstrate weaker binding potencies ofthe BP−AR complexes. The ΔGlig‑recep of BPA (−86.52 kJ/mol) indicated a relatively weak association with AR. BPF andBPS were the only two BPs with ΔGlig‑recep values greater thanthat of BPA. These weaker affinities of binding would result ininadequate interactions with AR but were not sufficient toexclude nonbinders (Table 1). Results of several studies ofnuclear receptors have demonstrated four major pathways ofunbinding (Figure S6A,B).28,29 Peaks of pulling forces (PFs),
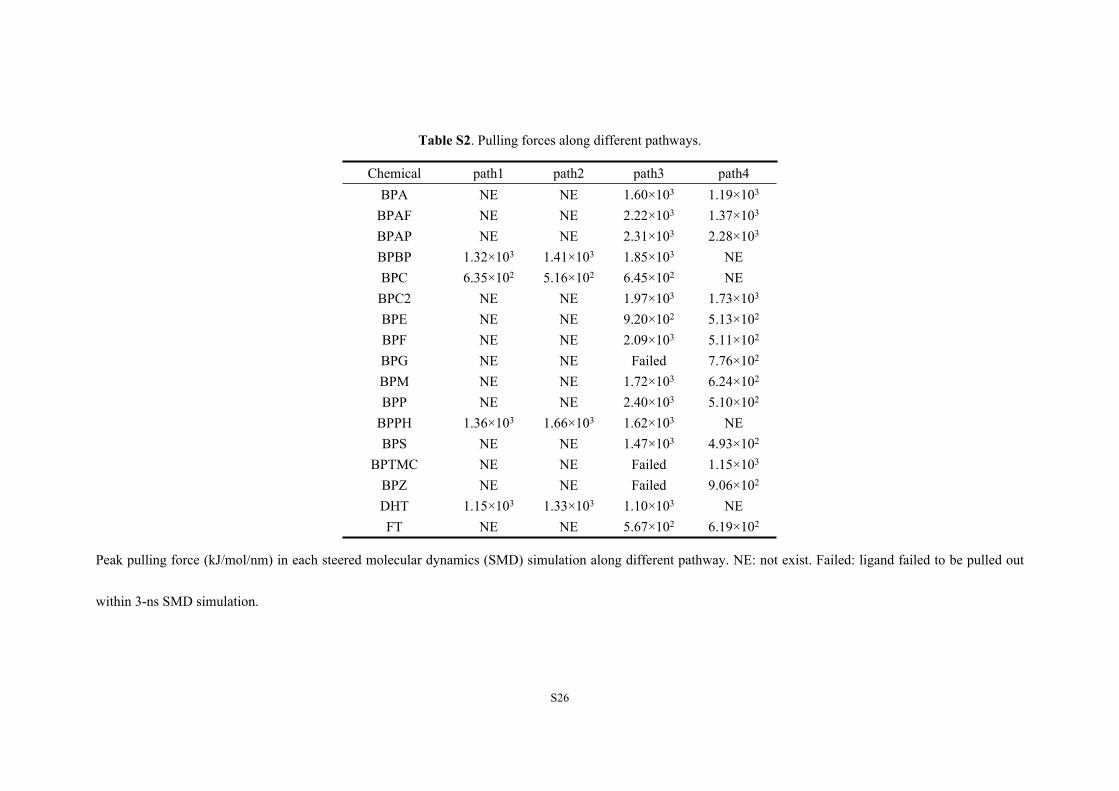
which are forces needed for ligands to break interactions withthe AR during SMD simulations29,30 (Figure S6C,D), indicatedthat 12 of 15 BPs were more likely to dissociate along pathway4 (Table 1 and Table S2). Ligand dissociation is the breakingof multiple short-range, noncovalent bonds included inligand−receptor interactions,31 which has been considered tobe an important feature for MD simulations of NRs.32,33
However, previous studies provided subjective comparisonsthat remain controversial when considering more than oneunbinding pathway.34 Pulling forces from SMD simulationsindicated the major unbinding pathway of BPs and madequantitative descriptions possible.Binding and unbinding processes were integrated [LRIscore
(Table 1)] to comprehensively score ligand−AR interactions,which revealed that results of MD simulations agreed withthose of in vitro assays. A greater LRIscore indicated morepotential for interacting with the AR. Via comparison of resultsof MD simulations with competitive binding assays,8,27 BPE,BPF, and BPS with the lowest LRIscore were the only chemicalsdetermined to be nonbinders (Figure S6E), which were alsoinactive in the reporter gene assays. It was indicated thatbinding and unbinding processes were key features of BP−ARinteractions, and evaluating the BP−AR interactions byexploring both binding and unbinding processes allowscharacterizations of inactive chemicals. These results werethen confirmed because nonbinders were also determined tobe inactive in transactivation reporter gene assays.
Coregulator Recruitment Influenced by BPs: Activat-ing Patterns of AR. Results of TR-FRET assays revealed thatpatterns of coregulator recruitment were influenced by BPs(Table 1). The agonist DHT caused recruitment of thecoactivator (CoA) but not the corepressor (CoR), whereasnine BPs, including BPA and BPAF, caused recruitment of
Table 1. Results of the in Vitro Assays and the Molecular Simulationsa
in vitro in silico
chemicallog
RIC20 bind CoA CoR CoAinh ΔGlig‑recep
unbindingpath PFmini LRIscore
helix 12mode activity category
predictedpotency
BPA −5.70 + + ++ − −86.52 path 4 1.19 × 10³ −0.53 S active antagonist −5.81BPAF −7.10 + ++ +++ − −107.44 path 4 1.37 × 10³ 0.46 S active antagonist −7.32BPAP −7.12 + +++ ++ − −110.98 path 4 2.28 × 10³ 1.83 S active antagonist −6.90BPBP −6.16 + − − ++ −109.81 path 1 1.32 × 10³ 0.46 B passive antagonist −6.08BPC −5.75 + − − + −107.86 path 2 5.16 × 10² −0.71 B passive antagonist −5.79BPC2 −6.37 ++ + + − −96.38 path 4 1.73 × 10³ 0.55 S active antagonist −5.99BPE NDb − −88.99 path 4 5.13 × 10² −1.38 inactiveBPF ND − −78.70 path 4 5.11 × 10² −1.75 inactiveBPG −6.77 + + + + −125.53 path 4 7.76 × 10² 0.27 S active antagonist −6.63BPM −6.40 + ++ +++ − −129.20 path 4 6.24 × 10² 0.19 S active antagonist −6.52BPP −5.80 + ++ + − −114.94 path 4 5.10 × 10² −0.47 S active antagonist −6.22BPPH −6.38 + − − + −146.93 path 1 1.36 × 10³ 1.83 B passive antagonist −6.42BPS ND − −79.08 path 4 4.93 × 10² −1.76 inactiveBPTMC −6.99 ++ ++ ++ + −122.26 path 4 1.15 × 10³ 0.67 S active antagonist −6.93BPZ −7.21 + ++ +++ − −113.21 path 4 9.06 × 10² 0.02 S active antagonist −7.14DHT +++ +++ − − −141.51 path 3 1.10 × 10³ 1.28 A agonistFT + + +++ + −98.80 path 3 5.67 × 10² −0.96 S active antagonist
aValues of log RIC20 are logarithms of the concentration (molar) showing 20% inhibition of luciferase activity induced by 1 × 10⁻⁹ M DHT. Bindindicates results from the competitive binding assays. CoA, CoR, and CoAinh are the results from coactivator recruitment, corepressor recruitment,and coactivator inhibition assays, respectively. Values of ΔGlig‑recep are binding free energies of ligands with AR (kilojoules per mole). Theunbinding path indicates the pathway that requires the least pulling force to unbind from AR. PFmini is the peak of the pulling force (kilojoules permole per nanometer) along the pathway with the least pulling force. LRIscore is the ligand−receptor interaction score. The number of plus signsrepresents the number of concentrations among the three tested concentrations (concentrations of the BPs and FT were 4 × 10⁻⁶, 2 × 10⁻⁵, and 1× 10⁻⁴ M, and concentrations of DHT were 4 × 10⁻⁸, 2 × 10⁻⁷, and 1 × 10⁻⁶ M) showing a significant difference. A minus sign means nosignificant difference was observed. bND = not detected.
Environmental Science & Technology Letters Letter
DOI: 10.1021/acs.estlett.9b00073Environ. Sci. Technol. Lett. 2019, 6, 205−210
207

both CoA and CoR, which is similar to the case of antagonistFT. These results agreed with those observed during a previousstudy that BPA and BPAF caused AR to recruit both CoA andCoR.35 The other three BPs, BPBP, BPC, and BPPH, inhibitedrecruitment of CoA during co-exposure with DHT. Therefore,the agonistic effect of DHT could result from exclusiverecruitment of CoA, and antagonistic effects of BPs couldresult from either recruitment of CoR or inhibition of CoArecruitment. The influence of repositioning of H12 andassociated coregulator recruitment confirmed this assumption.Results of MD simulations indicated modes A, B, and S of
H12 repositioning (Figure 1 and Table 1). H12 of mode Ablocks the CoR binding site and exposes the CoA binding site(Figure 1A,B). H12 of mode B blocks both CoA and CoRbinding sites (Figure 1A,C). H12 of mode S exposed bothbinding sites of CoA and CoR (Figure 1A,D).12 H12 of DHT-AR was classified as mode A, which agreed with coregulatorrecruitment patterns and was consistent with crystal structuresof DHT-AR (Figure S8).36,37 BPBP, BPC, and BPPH causedmode B repositioning (Figure 1 and Table 1), which resultedin blocking of both CoA and CoR. The other nine BPs inducedmode S, which resulted in recruitment of either CoA or CoR,and were indicated to bind CoR stronger than CoA usingprotein docking (Figure S9). Although the antagonistic form ofthe crystal structure of AR is not yet clear, the blockedconformations and the corepressor-bound conformationsderived from MD simulations are comparable with crystalstructures of other antagonist-bound steroid hormonereceptors.38−40 Therefore, results of conformational shift andcoregulator recruitment derived from MD simulations wereconsistent with results of coregulator recruitment assays and
their antagonistic effects. BPBP, BPC, and BPPH inducingmode B repositioning were classified as passive antagonists thatinhibited CoA to cause antagonism, whereas BPA, BPAF,BPAP, BPC2, BPG, BPM, BPP, BPTMC, and BPZ inducingmode S repositioning were active antagonists that recruitedCoR to result in antagonism (Table 1 and Figure S8).41
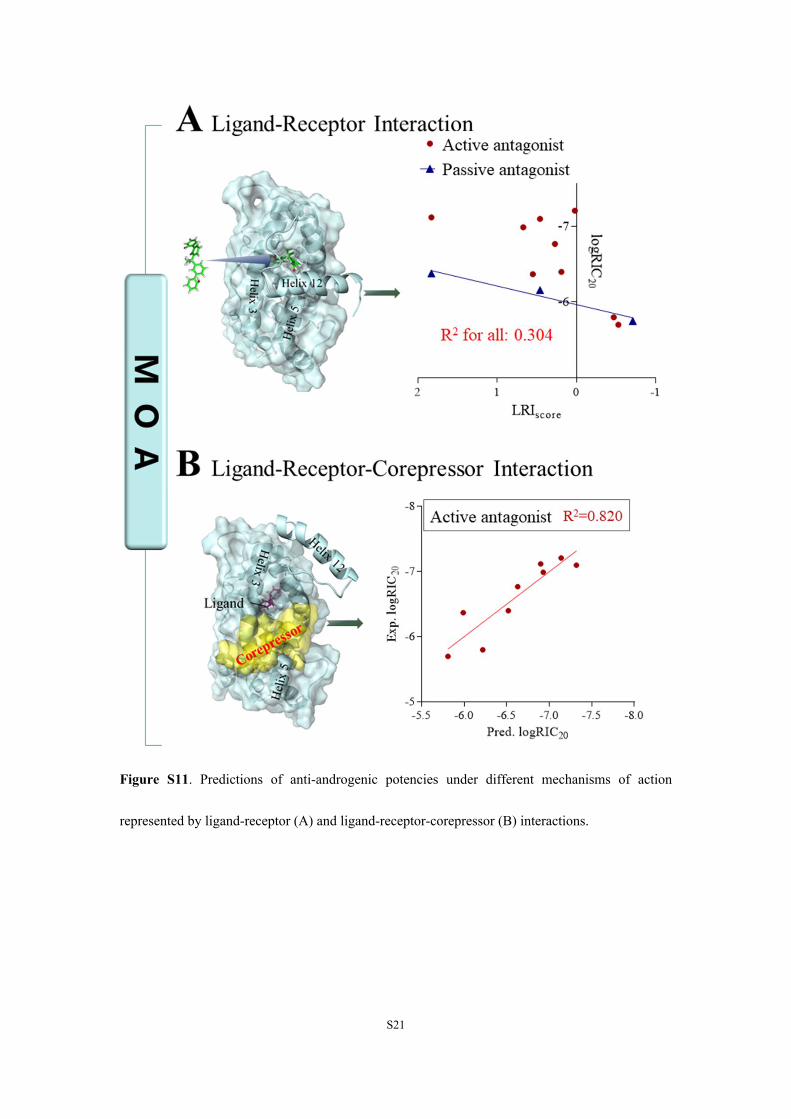
Potencies of BPs to disrupt AR-mediated pathways couldnot be correlated by simply using ligand−receptor interactions[ΔGlig‑recep, PF, or LRIscore, all R
2 ≤ 0.304 (Figures S10 andS11A)]. This phenomenon can be attributed to shifts in theconformation of AR and coregulator recruitment becausedifferent patterns of coregulator recruitment resulted indifferent patterns of AR activation, which are dependent onvarious interactions. Although there were only three passiveantagonists, because their mechanism of action was to keep theligand−AR complexes away from coregulators (Figure S11A),anti-androgenic potency correlated well with the ligand−receptor interaction score. In contrast, for active antagonists,because their mechanism of action was to recruit CoR andinteract with the ligand, receptor, and CoR, anti-androgenicpotencies were correlated with LRIscore and CoR binding freeenergies [R2 = 0.820 (Figure S11B and Table S3)]. Together,predicted anti-androgenic potencies for active and passiveantagonists had a coefficient of determination (R2) of 0.859(Figure S10C). Furthermore, recruitment of CoR might bemore important than ligand−receptor interactions in determin-ing anti-androgenic potencies of active antagonists. Thisimplies that the influence of CoR was indispensable inpredicting anti-androgenic potencies.
Potential Application of the AR-Mediated MIE:Computer-Aided Green Chemistry. Having characterized
Figure 1. Three modes of helix 12 repositioning. (A) Equilibrated helix 12 (H12) of BPC, DHT, and BPZ-bound androgen receptor (AR) thatrepresent modes B, A, and S of H12 repositions, respectively, which are colored hot pink, purple, and green, respectively. Helices 1−11 are coloredlight cyan. (B−D) Coregulator binding sites and their relationship with helix 12 repositioning of modes A, B, and S, respectively, which result inagonist, passive antagonist, and active antagonist, respectively. Coactivator and corepressor binding sites are depicted as the blue and red ellipses,respectively.
Environmental Science & Technology Letters Letter
DOI: 10.1021/acs.estlett.9b00073Environ. Sci. Technol. Lett. 2019, 6, 205−210
208
mechanisms by which BPs initiated AR-mediated MIE at bothfunctional and structural levels, using both in vitro and in silicomethods, we reasoned that molecular simulations could aid inthe interpretation of AR-mediated MIE and development ofMIE-based in silico screening of environmental pollutants. Aworkflow for MIE-based in silico screening was developed(Figure S12) to evaluate influences of chemicals on nuclearreceptors. Ligand−receptor interactions revealed by bindingand unbinding processes assist with screening of nonbindersthat are inactive. According to the repositioning of H12 andsubsequent coregulator recruitment, chemicals can bequalitatively categorized as agonists, passive antagonists, andactive antagonists. Quantitative prediction was furtherperformed on the basis of interactions among mechanisms ofaction. By using this workflow, the in silico screening procedureof endocrine disrupting chemicals mediated by nuclearreceptors, such as AR, ER, GR, and mineralocorticoid receptor(MR), could be developed. The application of such predictivemodels to evaluate a wider range of chemicals might curtail theuse of in vitro and in vivo tests.BPs are structurally similar compounds (Figure S2), which
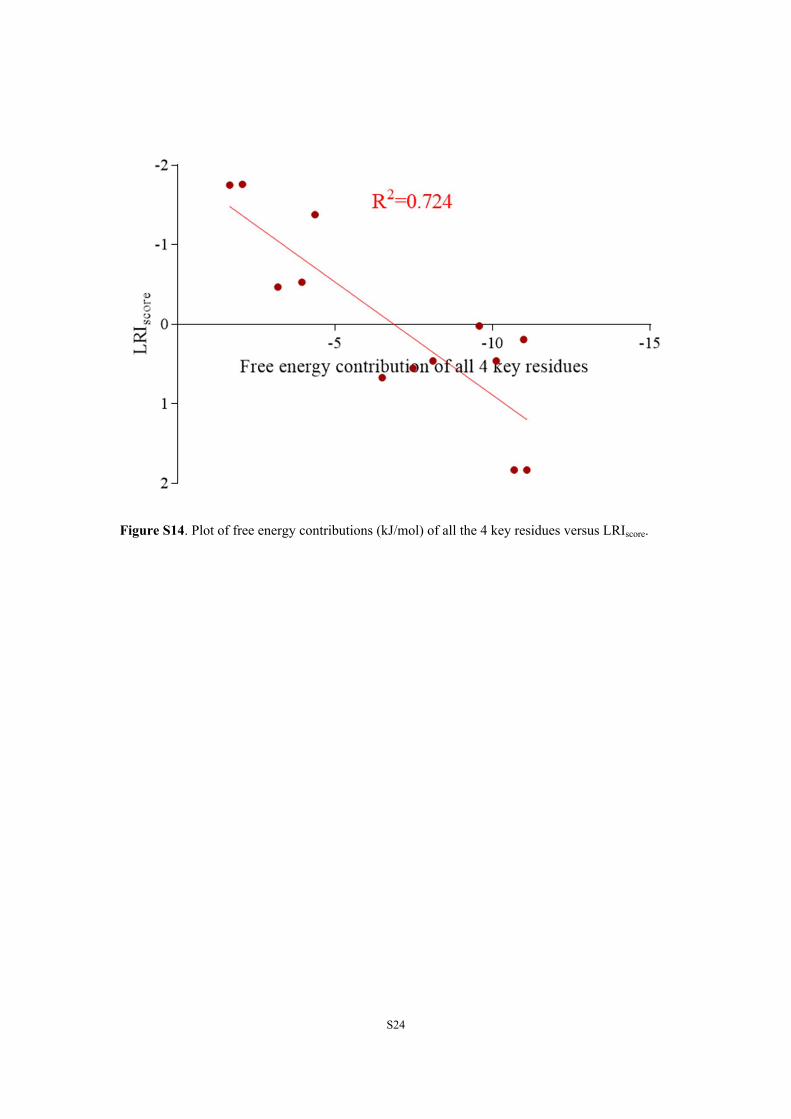
are mainly different in the connecting group (CG) (exceptBPC and BPG). BPs bound to AR in a similar binding mode(Figure S13), and CGs interacted mainly with residues on H8and H11. Lu et al. innovatively used fluorescence spectroscopyand MD simulation to provide perspective information aboutsafer bisphenol substitutes.16 In this study, by use of freeenergy decomposition, four residues (Met780, Met787,Phe876, and Leu880) on H8 and H11 were found to be thekey residues (Table S4).42,43 Ligand−receptor interactionswere found to correlate with free energy contributions of allfour key residues [R2 = 0.724 (Figure S14)], which indicatedthat interactions between CGs and these residues were keyinteractions for ligand−receptor interactions. Because Met780,Met787, Phe876, and Leu880 were hydrophobic residues, BPsof less hydrophobic and smaller CGs (Table S4) would resultin weaker ligand−AR interactions. Therefore, BPs with thesmallest and least hydrophobic CGs as possible would bepreferred as potential BPA substitutes to reduce the influenceon AR-mediated MIE. These rules could benefit the design ofBPA substitutes with weaker AR disrupting effects, and thisworkflow can be extended to other nuclear receptors or to thedesign of safer substitutes for other chemicals.
■ ASSOCIATED CONTENT
*S Supporting InformationThe Supporting Information is available free of charge on theACS Publications website at DOI: 10.1021/acs.es-tlett.9b00073.
Additional details about methods and discussions,Figures S1−S14, and Tables S1−S4 (PDF)
■ AUTHOR INFORMATION
Corresponding Author*E-mail: [email protected].
ORCIDQinchang Chen: 0000-0001-9793-8676Wei Shi: 0000-0001-9499-818XXiaowei Zhang: 0000-0001-8974-9963Si Wei: 0000-0002-5868-4332
NotesThe authors declare no competing financial interest.
■ ACKNOWLEDGMENTSThis work was supported by the National Key R&D Programof China (2018YFC1801604), the Natural Science Foundationof China (21577058), the Science Fund for Excellent YoungScholars of Jiangsu Province (BK20170077), and the NationalWater Pollution Control and Treatment Science andTechnology Major Project (2017ZX07202-001 and2017ZX07602-002). The computational calculations wereperformed in the High Performance Computing Center(HPCC) of Nanjing University and the National Super-computing Center in Shenzhen.
■ REFERENCES(1) Rubin, B. S. Bisphenol A: An Endocrine Disruptor withWidespread Exposure and Multiple Effects. J. Steroid Biochem. Mol.Biol. 2011, 127, 27−34.(2) Brown, J. S. Effects of Bisphenol-A and Other EndocrineDisruptors Compared with Abnormalities of Schizophrenia: AnEndocrine-Disruption Theory of Schizophrenia. Schizophr. Bull.2009, 35, 256−278.(3) Usman, A.; Ahmad, M. From BPA to Its Analogues: Is It a SafeJourney? Chemosphere 2016, 158, 131−142.(4) Rochester, J. R.; Bolden, A. L. Bisphenol S and F: A SystematicReview and Comparison of the Hormonal Activity of Bisphenol aSubstitutes. Environ. Health Perspect. 2015, 123, 643−650.(5) Liao, C.; Kannan, K. A Survey of Alkylphenols, Bisphenols, andTriclosan in Personal Care Products from China and the UnitedStates. Arch. Environ. Contam. Toxicol. 2014, 67, 50−59.(6) Cunha, S. C.; Cunha, C.; Ferreira, A. R.; Fernandes, J. O.Determination of Bisphenol A and Bisphenol B in Canned SeafoodCombining QuEChERS Extraction with Dispersive Liquid-LiquidMicroextraction Followed by Gas Chromatography-Mass Spectrom-etry. Anal. Bioanal. Chem. 2012, 404, 2453−2463.(7) Ankley, G. T.; Bennett, R. S.; Erickson, R. J.; Hoff, D. J.;Hornung, M. W.; Johnson, R. D.; Mount, D. R.; Nichols, J. W.;Russom, C. L.; Schmieder, P. K.; et al. Adverse Outcome Pathways: AConceptual Framework to Support Ecotoxicology Research and RiskAssessment. Environ. Toxicol. Chem. 2010, 29, 730−741.(8) U.S. Environmental Protection Agency. iCSS ToxCast Dash-board. https://actor.epa.gov/dashboard/.(9) Kitamura, S.; Suzuki, T.; Sanoh, S.; Kohta, R.; Jinno, N.;Sugihara, K.; Yoshihara, S.; Fujimoto, N.; Watanabe, H.; Ohta, S.Comparative Study of the Endocrine-Disrupting Activity of BisphenolA and 19 Related Compounds. Toxicol. Sci. 2005, 84, 249−259.(10) Raunio, H. In Silico Toxicology − Non-Testing Methods.Front. Pharmacol. 2011, 2, 00033.(11) Browne, P.; Noyes, P. D.; Casey, W. M.; Dix, D. J. Applicationof Adverse Outcome Pathways to U.S. EPA’s Endocrine DisruptorScreening Program. Environ. Health Perspect. 2017, 125, 096001.(12) Chen, Q.; Tan, H.; Yu, H.; Shi, W. Activation of SteroidHormone Receptors: Shed Light on the in Silico Evaluation ofEndocrine Disrupting Chemicals. Sci. Total Environ. 2018, 631−632,27−39.(13) Gronemeyer, H.; Gustafsson, J. Å.; Laudet, V. Principles forModulation of the Nuclear Receptor Superfamily. Nat. Rev. DrugDiscovery 2004, 3, 950−964.(14) Wang, X.; Yang, H.; Hu, X.; Zhang, X.; Zhang, Q.; Jiang, H.;Shi, W.; Yu, H. Effects of HO-/MeO-PBDEs on Androgen Receptor:In Vitro Investigation and Helix 12-Involved MD Simulation. Environ.Sci. Technol. 2013, 47, 11802−11809.(15) Chen, Q.; Wang, X.; Shi, W.; Yu, H.; Zhang, X.; Giesy, J. P.Identification of Thyroid Hormone Disruptors among HO-PBDEs: InVitro Investigations and Coregulator Involved Simulations. Environ.Sci. Technol. 2016, 50, 12429−12438.
Environmental Science & Technology Letters Letter
DOI: 10.1021/acs.estlett.9b00073Environ. Sci. Technol. Lett. 2019, 6, 205−210
209

(16) Lu, L.; Zhan, T.; Ma, M.; Xu, C.; Wang, J.; Zhang, C.; Liu, W.;Zhuang, S. Thyroid Disruption by Bisphenol S Analogues via ThyroidHormone Receptor Β: In Vitro, in Vivo, and Molecular DynamicsSimulation Study. Environ. Sci. Technol. 2018, 52, 6617−6625.(17) Maertens, A.; Anastas, N.; Spencer, P. J.; Stephens, M.;Goldberg, A.; Hartung, T. Green Toxicology. ALTEX 2014, 31, 243−249.(18) Gramatica, P.; Cassani, S.; Sangion, A. Aquatic Ecotoxicity ofPersonal Care Products: QSAR Models and Ranking for Prioritizationand Safer Alternatives’ Design. Green Chem. 2016, 18, 4393−4406.(19) Bharatham, N.; Finch, K. E.; Min, J.; Mayasundari, A.; Dyer, M.A.; Guy, R. K.; Bashford, D. Performance of a Docking/MolecularDynamics Protocol for Virtual Screening of Nutlin-Class Inhibitors ofMdmx. J. Mol. Graphics Modell. 2017, 74, 54−60.(20) Wilson, V. S.; Bobseine, K.; Lambright, C. R.; Gray, L. E. ANovel Cell Line, MDA-Kb2, That Stably Expresses an Androgen- andGlucocorticoid-Responsive Reporter for the Detection of HormoneReceptor Agonists and Antagonists. Toxicol. Sci. 2002, 66, 69−81.(21) Pronk, S.; Pall, S.; Schulz, R.; Larsson, P.; Bjelkmar, P.;Apostolov, R.; Shirts, M. R.; Smith, J. C.; Kasson, P. M.; van derSpoel, D.; et al. GROMACS 4.5: A High-Throughput and HighlyParallel Open Source Molecular Simulation Toolkit. Bioinformatics2013, 29, 845−854.(22) Abraham, M. J.; Murtola, T.; Schulz, R.; Pall, S.; Smith, J. C.;Hess, B.; Lindahl, E. Gromacs: High Performance MolecularSimulations through Multi-Level Parallelism from Laptops toSupercomputers. SoftwareX 2015, 1−2, 19−25.(23) Kumari, R.; Kumar, R.; Lynn, A. G-Mmpbsa: A GROMACSTool for High-Throughput MM-PBSA Calculations. J. Chem. Inf.Model. 2014, 54, 1951−1962.(24) Berthold, M. R.; Cebron, N.; Dill, F.; Gabriel, T. R.; Kotter, T.;Meinl, T.; Ohl, P.; Thiel, K.; Wiswedel, B. KNIME - the KonstanzInformation Miner. ACM SIGKDD Explor. Newsl. 2009, 11, 26.(25) Teng, C.; Goodwin, B.; Shockley, K.; Xia, M.; Huang, R.;Norris, J.; Merrick, B. A.; Jetten, A. M.; Austin, C. P.; Tice, R. R.Bisphenol A Affects Androgen Receptor Function via MultipleMechanisms. Chem.-Biol. Interact. 2013, 203, 556−564.(26) Rosenmai, A. K.; Dybdahl, M.; Pedersen, M.; Alice van Vugt-Lussenburg, B. M.; Wedebye, E. B.; Taxvig, C.; Vinggaard, A. M. AreStructural Analogues to Bisphenol a Safe Alternatives? Toxicol. Sci.2014, 139, 35−47.(27) Fang, H.; Tong, W.; Branham, W. S.; Moland, C. L.; Dial, S. L.;Hong, H.; Xie, Q.; Perkins, R.; Owens, W.; Sheehan, D. M. Study of202 Natural, Synthetic, and Environmental Chemicals for Binding tothe Androgen Receptor. Chem. Res. Toxicol. 2003, 16, 1338−1358.(28) Martínez, L.; Webb, P.; Polikarpov, I.; Skaf, M. S. MolecularDynamics Simulations of Ligand Dissociation from Thyroid HormoneReceptors: Evidence of the Likeliest Escape Pathway and ItsImplications for the Design of Novel Ligands. J. Med. Chem. 2006,49, 23−26.(29) Shen, J.; Li, W.; Liu, G.; Tang, Y.; Jiang, H. ComputationalInsights into the Mechanism of Ligand Unbinding and Selectivity ofEstrogen Receptors. J. Phys. Chem. B 2009, 113, 10436−10444.(30) Ludemann, S. K.; Lounnas, V.; Wade, R. C. How Do SubstratesEnter and Products Exit the Buried Active Site of CytochromeP450cam? 2. Steered Molecular Dynamics and Adiabatic Mapping ofSubstrate Pathways. J. Mol. Biol. 2000, 303, 813−830.(31) Danilowicz, C.; Greenfield, D.; Prentiss, M. Dissociation ofLigand-Receptor Complexes Using Magnetic Tweezers. Anal. Chem.2005, 77, 3023−3028.(32) Mackinnon, J. A. G.; Gallastegui, N.; Osguthorpe, D. J.; Hagler,A. T.; Estebanez-Perpina, E. Allosteric Mechanisms of NuclearReceptors: Insights from Computational Simulations. Mol. Cell.Endocrinol. 2014, 393, 75−82.(33) Wu, Y.; Doering, J. A.; Ma, Z.; Tang, S.; Liu, H.; Zhang, X.;Wang, X.; Yu, H. Identification of Androgen Receptor Antagonists: InVitro Investigation and Classification Methodology for Flavonoid.Chemosphere 2016, 158, 72−79.
(34) Renaud, J. P.; Rochel, N.; Ruff, M.; Vivat, V.; Chambon, P.;Gronemeyer, H.; Moras, D. Crystal Structure of the RAR-GammaLigand-Binding Domain Bound to All-Trans Retinoic Acid. Nature1995, 378, 681−689.(35) Perera, L.; Li, Y.; Coons, L. A.; Houtman, R.; van Beuningen,R.; Goodwin, B.; Auerbach, S. S.; Teng, C. T. Binding of Bisphenol A,Bisphenol AF, and Bisphenol S on the Androgen Receptor:Coregulator Recruitment and Stimulation of Potential InteractionSites. Toxicol. In Vitro 2017, 44, 287−302.(36) Nadal, M.; Prekovic, S.; Gallastegui, N.; Helsen, C.; Abella, M.;Zielinska, K.; Gay, M.; Vilaseca, M.; Taules, M.; Houtsmuller, A. B.;et al. Structure of the Homodimeric Androgen Receptor Ligand-Binding Domain. Nat. Commun. 2017, 8, 14388.(37) Zhou, X. E.; Suino-Powell, K. M.; Li, J.; He, Y.; MacKeigan, J.P.; Melcher, K.; Yong, E. L.; Xu, H. E. Identification of SRC3/AIB1 asa Preferred Coactivator for Hormone-Activated Androgen Receptor. J.Biol. Chem. 2010, 285, 9161−9171.(38) Schoch, G. A.; D’Arcy, B.; Stihle, M.; Burger, D.; Bar, D.; Benz,J.; Thoma, R.; Ruf, A. Molecular Switch in the GlucocorticoidReceptor: Active and Passive Antagonist Conformations. J. Mol. Biol.2010, 395, 568−577.(39) Shiau, A. K.; Barstad, D.; Loria, P. M.; Cheng, L.; Kushner, P.J.; Agard, D. A.; Greene, G. L. The Structural Basis of EstrogenReceptor/Coactivator Recognition and the Antagonism of ThisInteraction by Tamoxifen. Cell 1998, 95, 927−937.(40) Madauss, K. P.; Grygielko, E. T.; Deng, S.-J.; Sulpizio, A. C.;Stanley, T. B.; Wu, C.; Short, S. A.; Thompson, S. K.; Stewart, E. L.;Laping, N. J.; et al. A Structural and in Vitro Characterization ofAsoprisnil: A Selective Progesterone Receptor Modulator. Mol.Endocrinol. 2007, 21, 1066−1081.(41) Shiau, A. K.; Barstad, D.; Radek, J. T.; Meyers, M. J.; Nettles, K.W.; Katzenellenbogen, B. S.; Katzenellenbogen, J. A.; Agard, D. A.;Greene, G. L. Structural Characterization of a Subtype-SelectiveLigand Reveals a Novel Mode of Estrogen Receptor Antagonism. Nat.Struct. Biol. 2002, 9, 359−364.(42) Liu, H.; Han, R.; Li, J.; Liu, H.; Zheng, L. MolecularMechanism of R-Bicalutamide Switching from Androgen ReceptorAntagonist to Agonist Induced by Amino Acid Mutations UsingMolecular Dynamics Simulations and Free Energy Calculation. J.Comput.-Aided Mol. Des. 2016, 30, 1189−1200.(43) Bohl, C. E.; Wu, Z.; Miller, D. D.; Bell, C. E.; Dalton, J. T.Crystal Structure of the T877A Human Androgen Receptor Ligand-Binding Domain Complexed to Cyproterone Acetate Provides Insightfor Ligand-Induced Conformational Changes and Structure-BasedDrug Design. J. Biol. Chem. 2007, 282, 13648−13655.
Environmental Science & Technology Letters Letter
DOI: 10.1021/acs.estlett.9b00073Environ. Sci. Technol. Lett. 2019, 6, 205−210
210
S1
Supporting InformationMolecular Initiating Events of Bisphenols on AR-Mediated Pathways
Provide Guidelines for In Silico Screening and Design of Substitute
Compounds
Qinchang Chen†, Xiaoxiang Wang†, Haoyue Tan†, Wei Shi†, *, Xiaowei Zhang†, Si Wei†, John P.
Giesy†, ‡, §, ‖, Hongxia Yu†
† State Key Laboratory of Pollution Control and Resources Reuse, School of the Environment,
Nanjing University, Nanjing, Jiangsu 210023, People’s Republic of China
‡ Department of Veterinary Biomedical Sciences and Toxicology Centre, University of
Saskatchewan, Saskatoon, SK S7N 5B3, Canada.
§ Department of Zoology, and Center for Integrative Toxicology, Michigan State University, East
Lansing, MI 48824, USA
‖Department of Environmental Science, Baylor University, Waco, TX 76798, USA
*Corresponding Author:
Wei Shi: [email protected]

S2
Supporting Methods
Hypothesis about AR-mediated MIE
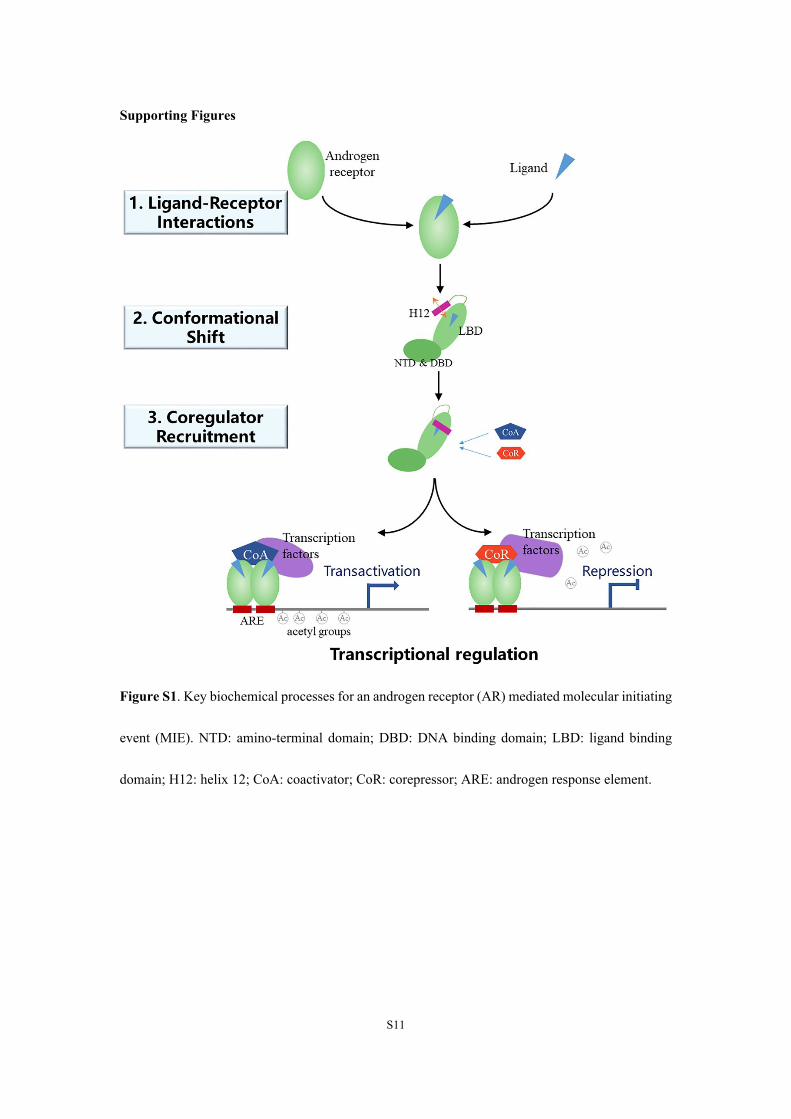
Results of previous studies have indicated activation of AR-mediated MIE includes three
important biochemical processes (Figure S1).1,2 Molecular dynamics (MD) simulation was used to
determine if activation by BPs follows this classical mode: 1) ligand binding to and interacts with
AR, which is considered to be the most important for the activation of AR-mediated MIE; 2)
Conformation of AR shifts as a result of interaction between the ligand and the AR, which results
in a significant repositioning of helix 12 (H12); and 3) coregulator recruitment is facilitated or
blocked by repositioning of H12, which results in activation or repression of transcription.
Recruitment of coactivator (CoA) facilitates binding of other transcription factors and acetylates the
DNA, which promotes transcription and induced agonistic effect. Conversely, the recruitment of
corepressor (CoR) results in the deacetylation of target DNA, which leads to repression of
transcription, which is called an “active antagonist” effect.3 If AR fails to recruit either a CoA or a
CoR, transcription will be interrupted, which results in a “passive antagonist” effect.3
Cell culture and reporter gene assays
The MDA-kb2 cell line, which is stably transfected with a luciferase reporter gene driven by
an androgen-response element-containing promoter,4 was cultured in Leibowitz-15 (L15) medium
(Gibco, Invitrogen Corporation, Carlsbad, CA, USA) and was supplemented with 10% fetal bovine
serum (FBS; Gibco) at 37 °C in a humidified atmosphere without additional CO2. L15 medium with
10% charcoal-dextran-stripped FBS (CDS-FBS; Gibco) was used instead of the standard culture
medium 24 hours before the cells were seeded to a 384-well white opaque plate (Corning Inc.,
Corning, NY, USA) at a density of 1 × 10⁵ cells/mL. After chemical exposure, the final volume of

S3
assay media was 80 μL/well, and DMSO content was maintained at less than 0.1% (v/v). Prior to
androgenic and anti-androgenic tests, one solution cell proliferation assays (MTS) were performed
to assess the viabilities of all chemicals using CellTiter 96® AQueous One Solution Cell
Proliferation Assay Kit (Promega, Madison, WI, USA), and chemicals were diluted according to
their cytotoxicities. Based on viabilities of cells exposed to various BPs (Figure S4A), to avoid
cytotoxicities, a maximum concentration of BPs, of 4 μM was employed in assays to determine
agonistic and antagonistic potencies. MDA-kb2 cells were exposed to dilutions of chemicals with
or without 1×10⁻⁹ M DHT to assess anti-androgenic or androgenic potencies. After 24 hours of
exposure, the medium was removed and 10 μL of 1 × lysis buffer (Promega) was pipetted into each
well. After 10 min of cell lysis, 25 μL of luciferase reagent (Promega) was pipetted into each well.
Luciferase activity was recorded immediately by use of a Synergy H4 microplate reader (BioTek,
Winooski, VT, USA). DHT and FT were used as positive controls for androgenic and anti-
androgenic effects, respectively.
Mechanism-based molecular simulations
MD simulations of ligand-receptor interactions, conformational shift and coregulator
recruitment were performed as follows: (1) Ligand-receptor interactions were investigated by ligand
binding and unbinding processes, by using MD simulations, molecular mechanics Poisson-
Boltzmann surface area (MM-PBSA) binding free energies5 and SMD simulations. One hundred
snapshots from the MD trajectories of each complex were extracted for calculations of binding free
energy using the g_mmpbsa package 5 that was developed from the GROMACS and APBS 6
programs. A velocity of 1 nm/ns was used during 3-ns SMD simulations, and the harmonic force
constant was set at 1000 . The details of the MD simulations, binding free energies kJ ∙ mol ―1nm ―2

S4
calculations and SMD simulations are described in the following.
(2) Conformational shift was analyzed based on trajectories of MD simulations. Root-mean-
square deviations (RMSD) of MD trajectories were calculated to evaluate the conformational
equilibration of complexes. Modes of H12 repositioning were determined based on snapshots of
equilibrated conformations.
(3) Coregulator recruitment was evaluated by use of protein docking following the previously
described method.7 Corepressor (PDB code: 2JFA) and coactivator (PDB code: 3L3X) motifs were
pre-positioned on the coregulator binding surface according to the previous publications. Hex
8.0.0,13 a protein docking program, was used to modify the positions of coregulators and give a
shape-based docking score Edock. Coregulators were then docked to the extracted complexes using
shape-based 3D fast Fourier transform (FFT) docking methods. The receptor and ligand range
angles were all set to 15 degrees to make sure the co-regulators did not rotate far away from the
reference positions. Ligand-receptor-coregulator complexes derived from protein docking were
used to perform MD simulations and binding free energy calculations, followed by SMD
simulations to investigate the ligand-receptor-coregulator interactions.
Structure preparation and molecular docking
Structures of the tested chemicals were built according to the NCBI PubChem Compound
(http://www.ncbi.nlm.nih.gov/pccompound).Structural energy minimization was then carried out to
optimize the geometries using Powell gradient algorithm and the Tripos force field8 by the Minimize
module interfaced with SYBYL7.3 (Tripos Inc., St. Louis, MO, USA). Gasteiger-Huckel charges
were also added to the structures.
Structure of androgen receptor (AR) ligand binding domain (LBD) was built by homology

S5
modeling using Swiss-Model9,10 online modeling system (http://swissmodel.expasy.org/). Crystal
structure of DHT-bound AR (PDB code: 3L3X) chosen from RCSB Protein Data Bank
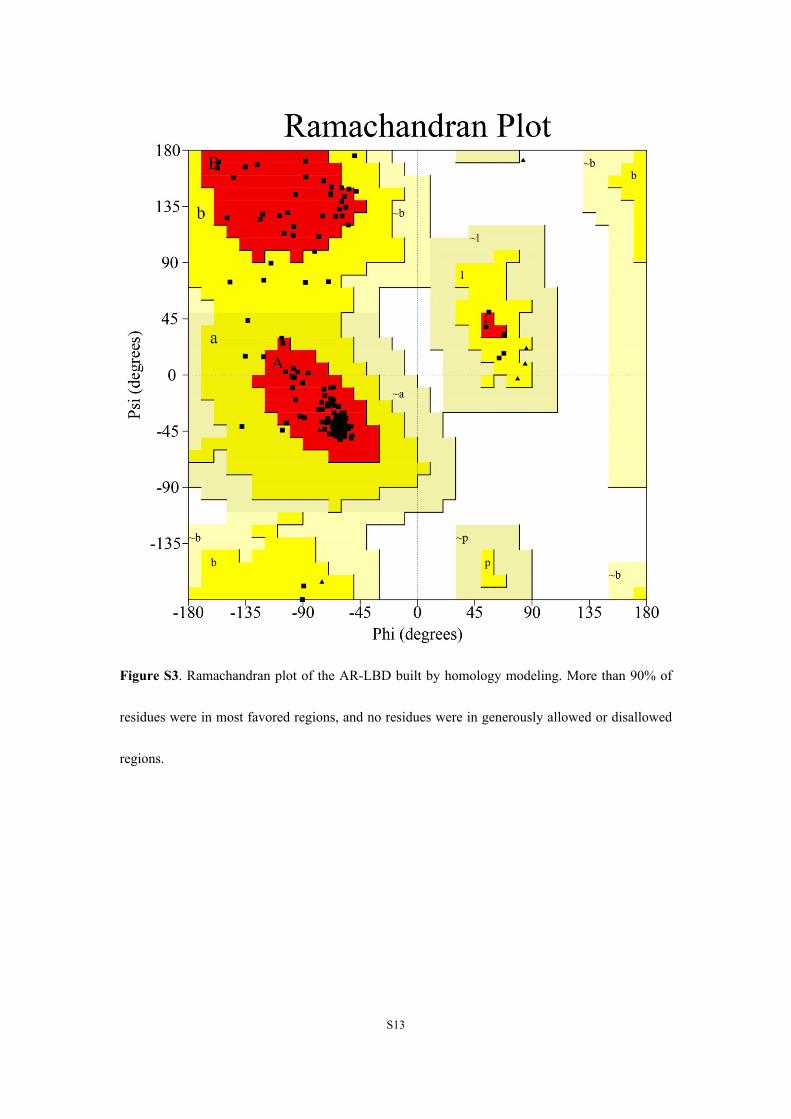
(http://www.rcsb.org/pdb/home/home.do) was used as template. Quality of the achieved AR-LBD
was evaluated with Ramachandran plot11 (Figure S3) generated by the Structure Analysis and
Verification Server (SAVES; http://services.mbi.ucla.edu/SAVES/).
Molecular docking was carried out by Surflex-Dock12 program interfaced with SYBYL 7.3.
Ligand binding cavity was found automatically in the AR-LBD. The optimized structures were then
docked into the cavity under default settings. Generated ligand-receptor complexes were then used
for molecular dynamics (MD) simulations.
Molecular dynamics simulations
MD simulations were performed using GROMACS 5.1.213,14 package on a Lenovo Flex
System Blade cluster. CHARMM 27 force field15 was employed to the proteins by GROMACS,
and to the ligands by SwissParam16 server (http://www.swissparam.ch/). The molecular system was
immersed in a box filling with TIP3P17 water molecules, and the distance between the complex and
the boundary was kept at least 1.4 nm. System was then energy-minimized by use of the steepest-
descent method, followed by 2 phases equilibration simulations under NVT (constant volume) and
NPT (constant pressure) ensembles, respectively. MD simulations were performed with NPT
ensemble under 1 bar pressure and 300 K for 16 ns or 10 ns. The Particle Mesh Ewald (PME)
method was utilized for calculation of long-range electrostatic interactions. All bonds (even heavy
atom-H bonds) were constrained using Linear Constraint Solver (LINCS).
Steered molecular dynamics simulations

S6
Equilibrated conformation of each MD simulation was extracted for steered molecular
dynamics (SMD) simulations. In SMD simulations, ligands were pulled out of the associating
receptors along the chosen routes. The pulling force was applied (Equation S1)
(S1)𝐹(𝑡) = 2𝑘(𝑣𝑡 ― 𝑥(𝑡))
where k is the harmonic force constant for pulling ( ) and v is velocity (nm/ns) of kJ ∙ mol ―1nm ―2
the pulling force, while t and x(t) are the simulation time (ns) and position of the ligand (nm) at time
t. And the work W was calculated (Equation S2)
(S2)𝑊(𝑥(𝑡)) = ∫𝑥(𝑡)0 𝐹(𝑡) 𝑑𝑥(𝑡)
SMD simulations were also performed using GROMACS 5.1.2 package on a Lenovo Flex
System Blade cluster. CHARMM 27 force field was employed to the proteins by GROMACS, and
to the ligands by SwissParam server. System was then energy-minimized by use of the steepest-
descent method, followed by equilibration simulations under NPT ensemble. Production MD
simulations were conducted with NPT ensemble under 1 bar pressure and 300 K for 3 ns. A velocity
of 1 nm/ns was used, and the harmonic force constant was set 1000 .kJ ∙ mol ―1nm ―2
MM-PBSA binding free energy
MM-PBSA method5 was used for binding free energy calculation after MD simulations.
Generally, binding free energy can be defined (Equation S3).∆Gbinding
(S3)∆Gbinding = Gcomplex ―(Greceptor + Gligand)
where , and are total free energies of the receptor-ligand complex, Gcomplex Greceptor Gligand
receptor, and ligand in solvent, respectively. The G value for each term ( ) can be calculated G𝑥
(Equation S4).
(S4)G𝑥 = EMM ―TS + Gsolvation

S7
where is the molecular mechanics energy; TS denotes the entropic contribution where T and EMM
S refer to the temperature and entropy, respectively; is the solvation free energy.Gsolvation
Molecular mechanics energy includes the energy of bonded ( ), electrostatic EMM Ebonded
( ) and van der Waals ( ) interactions (Equation S5).Eelectrostatic EvdW
(S5)EMM = Ebonded + Eelectrostatic + EvdW
Solvation free energy can be divided into two parts, electrostatic ( ) and Gsolvation Gpolar
nonelectrostatic ( ) solvation free energy (Equation S6).Gnonpolar
(S6)Gsolvation = Gpolar + Gnonpolar
was calculated based on the solvent accessible surface area (SASA) model. Gnonpolar
One hundred snapshots extracted from each MD trajectory were used for calculation of MM-
PBSA binding free energy. All calculations of binding free energies were performed by use of the
g_mmpbsa package5 developed form GROMACS and APBS programs.
Data analyses
RMSD of MD trajectories were calculated using GROMACS. The average binding free energy
was calculated using a bootstrap analysis by a Python script that was developed by Kumari et al 5.
The principal component analysis (PCA) of the binding and unbinding results were performed using
the KNIME Analytics Platform version 3.3.2,18 and the first component (LRIscore) was used to
describe the ligand-AR interactions. The free energy decomposition was calculated by another
Python script that was developed by Kumari et al 5. The multi-linear regression for active antagonists
was calculated using the KNIME Analytics Platform. Prior to regression, parameters were
normalized using the z-score normalization method. Molecular descriptors were calculated by
S8
RDKit packages on the KNIME Analytics Platform.
Supporting Discussions
Ligand unbinding
Several studies on nuclear receptors such as estrogen receptor (ER), glucocorticoid receptor
(GR) and thyroid hormone receptor (TR) have demonstrated four major unbinding pathways,19,20
which were depicted in Figure S6, A and B. Paths 1, 2 and 4 was strongly dependent on repositioning
of H12. Therefore, based on conformations of BPs-AR, potential unbinding pathways of BPBP,
BPC and BPPH were paths 1, 2 and 3, whereas those of other BPs were paths 3 and 4 (Table S2).
Peaks of pulling forces (PFs) was used to compare the unbinding processes among BPs (Table 1
and Table S2). BPAP required the greatest PF (2.28×10³ kJ/mol/nm) to dissociate from AR, whereas
BPS required the least PF (4.93×10² kJ/mol/nm), followed by BPP, BPF and BPE (Table 1). Ligand
dissociation has been considered to be an important feature for MD simulations of NRs.21,22 For
example, the “mousetrap” model, which imagines H12 as a lid for a supposed escaping pathway,
was used to evaluate the unbinding of a ligand.23 However, it provided a subjective comparison on
a single pathway and remains controversial when considering more than one unbinding pathways.
Pulling forces from SMD simulations indicated the major unbinding pathway of BPs and made the
quantitative description possible.
Helix 12 reposition resulted in the coregulator recruitment patterns
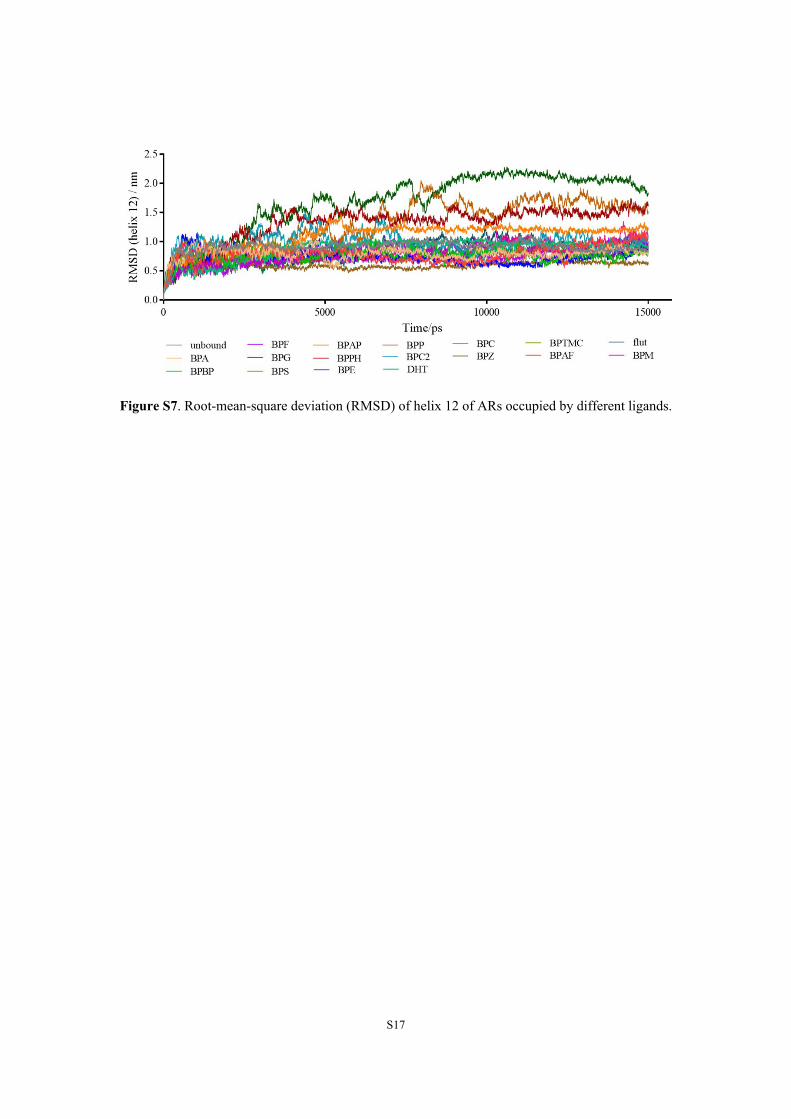
Conformations of BPs-AR, FT-AR and DHT-AR complexes experienced fluctuations in
different ranges during MD simulations, and the helix 12 (H12) experienced the most significant
repositioning among all helixes and then became stable after approximately 8 ns (Figure S7). Three

S9
modes, generally derived for all tested chemicals according to their repositioning of H12 were
named modes A, B and S (Figure 1 and Table 1). H12 of mode A is in the active position, which
blocks the CoR binding site and exposes the CoA binding site (Figure 1, A and B). H12 of mode B
blocks both the CoA and CoR binding sites (Figure 1, A and C). H12 of mode S exposed both
binding sites of CoA and CoR, which might lead to selective recruitment of CoA and CoR (Figure
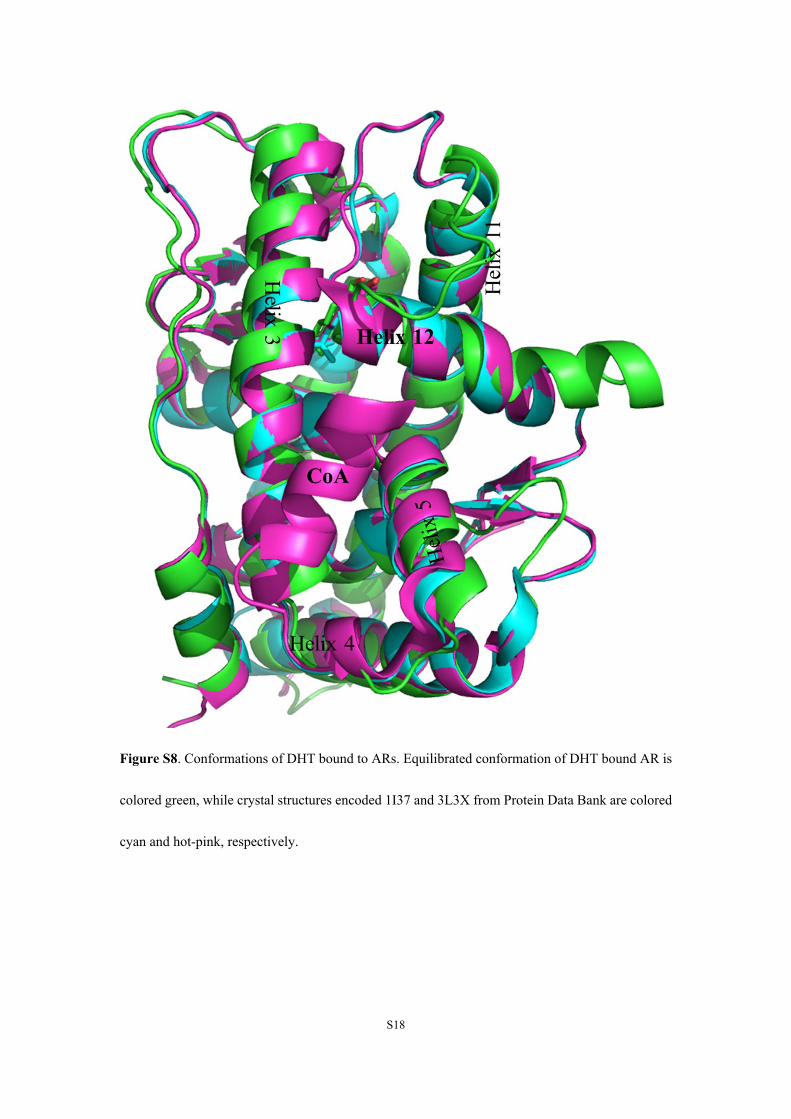
1, A and D) 1. As anticipated, H12 of DHT-AR equilibrated as mode A to inhibit CoR and recruit
CoA, which agreed with results of coregulator recruitment assays and was consistent with crystal
structures of DHT-ARs (Figure S8) and the agonistic effect of DHT.24,25 The results of DHT-AR
demonstrated the reliance of the MD simulations.
Workflow for MIE-based in silico screening
According to the mechanisms by which BPs initiated AR-mediated MIE at the functional and
structural levels, this study developed a workflow for MIE-base in silico screening of endocrine
disruptors. However, it should be noted that the MIE-based in silico screening should be considered
to be a flexible tool that will always provide useful information in assessments of hazard, even
though it will improve over time when new information on MIE and improved simulation methods
are implemented 7. Finally, as recommended by The Endocrine Society 26,27, more efforts should be
made that focus on enzymes involved in hormone synthesis and metabolism, other than nuclear
receptors, to provide more mechanistic insights into the screening of endocrine disrupting chemicals
in the future.
Designing safer BPA substitute
Structures of BPs directly influenced their interaction with AR, which could aid in designing
substitutes for BPA with no or lesser potential for disruption of AR-mediated pathways. BPs are

S10
structurally similar compounds (Figure S2), with two phenol groups (PG1 and PG2; Figure S13) at
their two ends, and a connecting group (CG; Figure S13) in the middle, which connects the two
phenol groups. Differences in structures of BPs is mainly with CGs (except BPC and BPG). The
BPs bound to AR in a similar binding mode (Figure S13). Generally, PG1s located in the seam
between H3 and H6, where the hydroxyl on PG1s might form hydrogen bonds with residues Gln711,
Met745 and Arg752. PG2s is bound to an area formed by H3, H6 and H11, which were more
scattered than PG1s. CGs interacted mainly with residues on H8 and H11. By use of free energy
decomposition, four residues (Met780, Met787, Phe876 and Leu880) on H8 and H11 were found to
be the key residues (Table S4), consistent with the studies that have come to the same conclusion
using point mutations 28,29. Ligand-receptor interactions were found to correlate with free energy
contributions of all four key residues (R2=0.724, Figure S14), which meant that reducing the
interactions between BPs and the residues would decrease the ligand-receptor interactions.
Therefore, CGs contributed the most to the interaction between BPs and the 4 key residues on H8
and H11. Because Met780, Met787, Phe876 and Leu880 were hydrophobic residues, BPs of less
hydrophobic and smaller CGs (Table S4) would result in weaker ligand-AR interactions. For
example, due to its smaller size and because methyl is less hydrophobic than cyclohexyl, the methyl-
CG BPF was less sufficient for interaction with the four residues than cyclohexyl-CG BPZ (Figure
S13), which resulted in fewer ligand-receptor interactions of BPF. These findings revealed key
interactions for ligand-receptor interactions and provided structural insights into BPA substitutes:
smaller and less hydrophobic CGs would reduce the effect on AR.
S11
Supporting Figures
Figure S1. Key biochemical processes for an androgen receptor (AR) mediated molecular initiating
event (MIE). NTD: amino-terminal domain; DBD: DNA binding domain; LBD: ligand binding
domain; H12: helix 12; CoA: coactivator; CoR: corepressor; ARE: androgen response element.

S12
HO OH
BPA
FF
F
HO
FF
F
OH
BPAF
OHHO
BPAP
OHHO
BPBP
Cl Cl
OHHO
BPC
HO OH
BPC2
HO OH
BPEBPF
HO OH
BPG
OHHO
BPM
HO
OH
BPP
HOOH
BPPH
O
SHO OH
O
BPSOHHO
BPTMC
OHHO
BPZ
HO OH
OHO H
HHH
DHT
O2N
NH
OF
FF
Flutamide
Figure S2. Molecular structures of bisphenols, DHT and flutamide used in the present study.
S13
Figure S3. Ramachandran plot of the AR-LBD built by homology modeling. More than 90% of
residues were in most favored regions, and no residues were in generously allowed or disallowed
regions.
S14
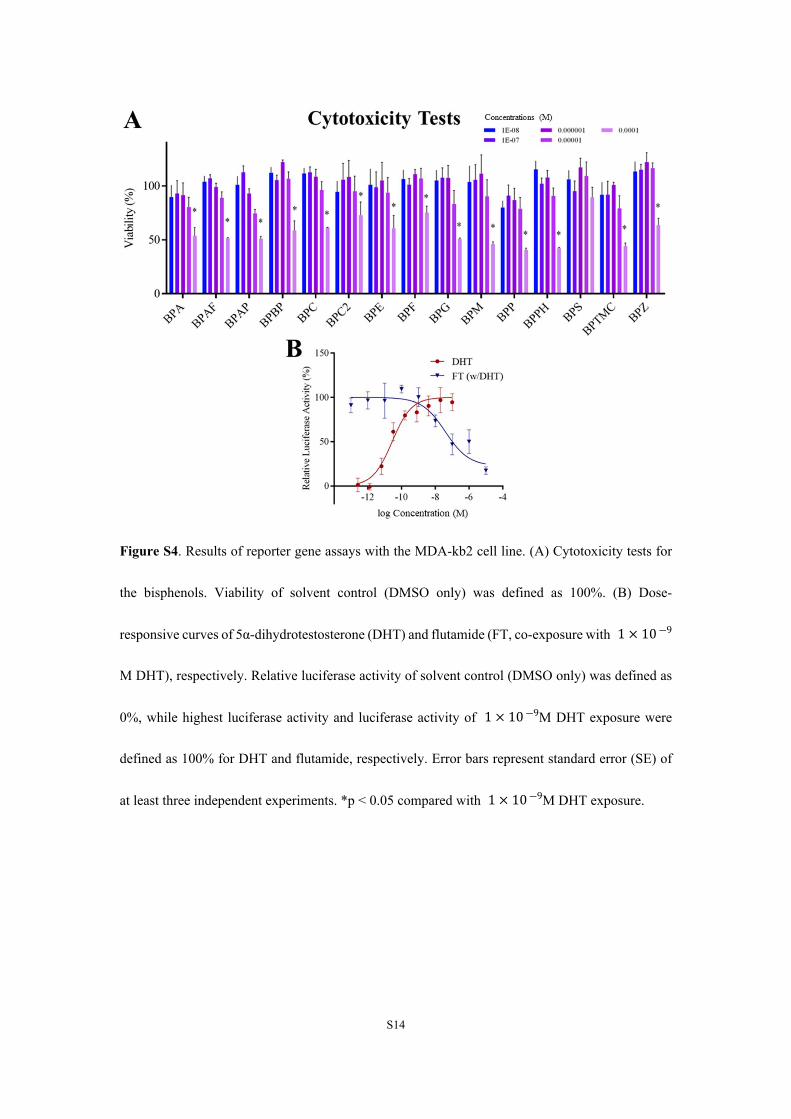
Figure S4. Results of reporter gene assays with the MDA-kb2 cell line. (A) Cytotoxicity tests for
the bisphenols. Viability of solvent control (DMSO only) was defined as 100%. (B) Dose-
responsive curves of 5α-dihydrotestosterone (DHT) and flutamide (FT, co-exposure with 1 × 10 ―9
M DHT), respectively. Relative luciferase activity of solvent control (DMSO only) was defined as
0%, while highest luciferase activity and luciferase activity of M DHT exposure were 1 × 10 ―9
defined as 100% for DHT and flutamide, respectively. Error bars represent standard error (SE) of
at least three independent experiments. *p < 0.05 compared with M DHT exposure. 1 × 10 ―9

S15
Figure S5. Results of the anti-androgenic effects of bisphenols. Cells were exposed to increasing
doses of bisphenols with M DHT. Relative luciferase activity of solvent control (DMSO 1 × 10 ―9
only) was defined as 0%, while M DHT exposure were defined as 100%. Error bars 1 × 10 ―9
represent the standard error (SE) of at least three independent experiments. *p < 0.05 compared with
M DHT exposure.1 × 10 ―9

S16
Figure S6. Unbinding of bisphenols from the androgen receptor (AR). (A, B) Unbinding pathways
are represented by BPPH and BPS-bound AR, respectively. (C, D) Pulling force on BPPH and BPS,
respectively, during the steered molecular dynamics simulations. The peaks of pulling forces (PFs,
kJ/mol/nm) along different pathways are labeled. (E) Competitive binding results along ligand-
receptor interaction score (LRIscore). Chemicals that have been reported as non-binders are colored
blue, those reported as binders are colored red, and others that were determined as binders in this
study are colored green.
S17
Figure S7. Root-mean-square deviation (RMSD) of helix 12 of ARs occupied by different ligands.
S18
Figure S8. Conformations of DHT bound to ARs. Equilibrated conformation of DHT bound AR is
colored green, while crystal structures encoded 1I37 and 3L3X from Protein Data Bank are colored
cyan and hot-pink, respectively.
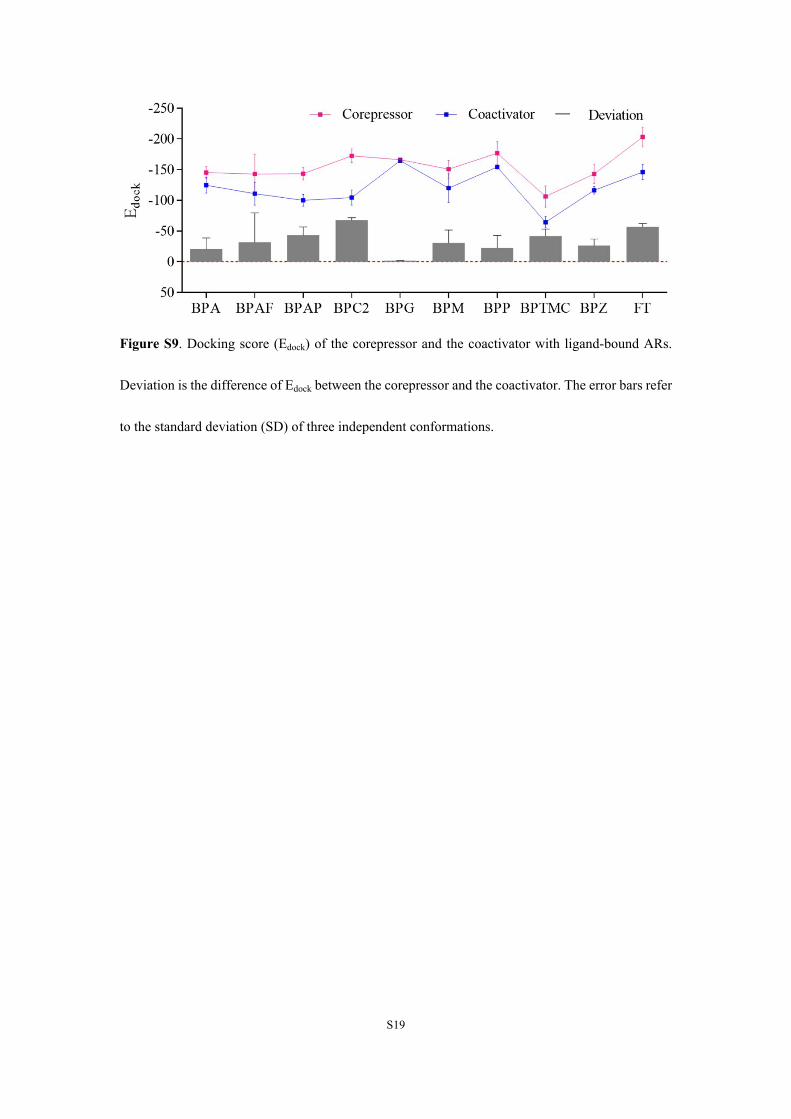
S19
Figure S9. Docking score (Edock) of the corepressor and the coactivator with ligand-bound ARs.
Deviation is the difference of Edock between the corepressor and the coactivator. The error bars refer
to the standard deviation (SD) of three independent conformations.

S20
Figure S10. Plots of pulling force (A), binding free energy (B) and the predicted anti-androgenic
potency (C) vs anti-androgenic potency from reporter gene assay.
S21
Figure S11. Predictions of anti-androgenic potencies under different mechanisms of action
represented by ligand-receptor (A) and ligand-receptor-corepressor (B) interactions.

S22
Figure S12. Workflow for molecular initiating event (MIE)-based in silico screening.

S23
Figure S13. Structural features of bisphenols (BPs) and their interactions with androgen receptors
(AR). (A) Connecting group (CG) and phenol groups (PG) and the general binding mode of BPs.
(B) Specific groups and their interactions with key residues; ligands and key residues are extracted
and shown on the right. Yellow and cyan represent BPZ-AR and BPF-AR complexes, respectively.
Helixes, key residues and ligands are shown as cartoons, sticks and lines, respectively.
S24
Figure S14. Plot of free energy contributions (kJ/mol) of all the 4 key residues versus LRIscore.

S25
Supporting Tables
Table S1. Information of chemicals used in this study.
Chemical name Abbreviation CAS Number Systematic nameBisphenol A BPA 80-05-7 2,2-Bis(4-hydroxyphenyl)propaneBisphenol AP BPAP 1571-75-1 1,1-Bis(4-hydroxyphenyl)-1-phenyl-ethaneBisphenol AF BPAF 1478-61-1 2,2-Bis(4-hydroxyphenyl)hexafluoropropaneBisphenol BP BPBP 1844-01-5 Bis-(4-hydroxyphenyl)diphenylmethaneBisphenol C BPC 79-97-0 2,2-Bis(3-methyl-4-hydroxyphenyl)propaneBisphenol C 2 BPC2 14868-03-2 Bis(4-hydroxyphenyl)-2,2-dichlorethyleneBisphenol E BPE 2081-08-5 1,1-Bis(4-hydroxyphenyl)ethaneBisphenol F BPF 87139-40-0 Bis(4-hydroxyphenyl)methaneBisphenol G BPG 127-54-8 2,2-Bis(4-hydroxy-3-isopropyl-phenyl)propaneBisphenol M BPM 13595-25-0 1,3-Bis(2-(4-hydroxyphenyl)-2-propyl)benzeneBisphenol S BPS 80-09-1 Bis(4-hydroxyphenyl)sulfoneBisphenol P BPP 2167-51-3 1,4-Bis(2-(4-hydroxyphenyl)-2-propyl)benzeneBisphenol PH BPPH 24038-68-4 5,5’ -(1-Methylethyliden)-bis[1,1’-(bisphenyl)-2-ol]propaneBisphenol TMC BPTMC 129188-99-4 1,1-Bis(4-hydroyphenyl)-3,3,5-trimethyl-cyclohexaneBisphenol Z BPZ 843-55-0 1,1-Bis(4-hydroxyphenyl)-cyclohexaneDihydrotestosterone DHT 521-18-6 5α-DihydrotestosteroneFlutamide FT 13311-84-7 4'-Nitro-3'-trifluoromethylisobutyranilide
S26
Table S2. Pulling forces along different pathways.
Chemical path1 path2 path3 path4BPA NE NE 1.60×10³ 1.19×10³
BPAF NE NE 2.22×10³ 1.37×10³
BPAP NE NE 2.31×10³ 2.28×10³
BPBP 1.32×10³ 1.41×10³ 1.85×10³ NEBPC 6.35×10² 5.16×10² 6.45×10² NEBPC2 NE NE 1.97×10³ 1.73×10³
BPE NE NE 9.20×10² 5.13×10²
BPF NE NE 2.09×10³ 5.11×10²
BPG NE NE Failed 7.76×10²
BPM NE NE 1.72×10³ 6.24×10²
BPP NE NE 2.40×10³ 5.10×10²
BPPH 1.36×10³ 1.66×10³ 1.62×10³ NEBPS NE NE 1.47×10³ 4.93×10²
BPTMC NE NE Failed 1.15×10³
BPZ NE NE Failed 9.06×10²
DHT 1.15×10³ 1.33×10³ 1.10×10³ NEFT NE NE 5.67×10² 6.19×10²
Peak pulling force (kJ/mol/nm) in each steered molecular dynamics (SMD) simulation along different pathway. NE: not exist. Failed: ligand failed to be pulled out
within 3-ns SMD simulation.

S27
Table S3. Results of molecular simulations of ligand-receptor-corepressor complexes and the prediction of anti-androgenic potencies.
Chemical ΔGlig-recep/cor ΔGcor-recep PFpath3 PFpath4 PFmini LRIscore logRIC20 PredictedBPA -82.16 -165.99 1.71×10³ 6.42×10² 6.42×10² -1.45 -5.70 -5.81 BPAF -112.09 -260.88 Failed 1.43×10³ 1.43×10³ 0.69 -7.10 -7.32 BPAP -109.24 -224.00 2.97×10³ 1.79×10³ 1.79×10³ 1.10 -7.12 -6.90 BPC2 -84.83 -165.80 1.61×10³ 1.55×10³ 1.55×10³ -0.10 -6.37 -5.99 BPG -126.54 -215.80 1.65×10³ 4.92×10² 4.92×10² -0.08 -6.77 -6.63 BPM -130.08 -201.51 1.11×10³ 7.82×10² 7.82×10² 0.44 -6.40 -6.52 BPP -118.40 -176.97 2.65×10³ 1.11×10³ 1.11×10³ 0.48 -5.80 -6.22 BPTMC -120.12 -226.92 Failed 1.46×10³ 1.46×10³ 1.03 -6.99 -6.93 BPZ -110.52 -254.71 1.77×10³ 9.62×10² 9.62×10² 0.00 -7.21 -7.14
ΔGlig-recep/cor: binding free energies of ligands with AR/CoR (kJ/mol). ΔGcor -recep: binding free energies of CoR with ligand-bound AR (kJ/mol). PFpathx: peak pulling
force (kJ/mol/nm) in each steered molecular dynamics (SMD) simulation, PFmini represents the minimum of different pulling paths. LRIscore: ligand-receptor interaction
score. Failed: ligand failed to be pulled out within 3 ns SMD simulation. LogRIC20: logarithm of the concentration (M) showing 20% inhibition of luciferase activity
induced by M DHT.1 × 10 ―9

S28
Table S4. Molecular descriptors and the free energy decomposition.
Free energy contribution (kJ/mol)Chemical MolWt Volume XLogP LRIscore
Met780 Met787 Phe876 Leu880 All 4 resBPA 228.12 223.25 4.52 -0.53 -1.33 -1.20 -0.69 -0.72 -3.94
BPAF 336.06 259.65 5.89 0.46 -2.86 -2.67 -1.52 -3.06 -10.11BPAP 290.13 278.56 5.76 1.83 -2.85 -2.24 -2.38 -3.21 -10.68BPBP 352.15 333.87 7.01 0.46 -3.14 -1.27 -1.86 -1.83 -8.10BPC2 280.01 233.73 4.68 0.55 -1.36 -0.83 -2.89 -2.40 -7.47BPE 212.08 203.31 4.01 -1.38 -1.45 -1.61 -0.61 -0.68 -4.36BPF 200.08 188.65 3.18 -1.75 -0.42 -0.60 -0.24 -0.39 -1.65BPM 346.19 347.74 7.83 0.19 -3.08 -2.65 -2.67 -2.58 -10.98BPP 346.19 347.74 7.83 -0.47 -1.54 -0.71 -0.58 -0.36 -3.18
BPPH 380.18 368.47 8.40 1.83 -2.85 -3.14 -3.10 -1.99 -11.08BPS 250.03 207.45 2.18 -1.76 -0.55 -0.67 -0.53 -0.30 -2.05
BPTMC 310.19 314.66 7.51 0.67 -2.52 -0.77 -2.21 -1.00 -6.49BPZ 268.15 262.78 5.89 0.02 -2.48 -1.94 -2.00 -3.15 -9.57
MolWt: molecular weight; Volume: VABC Volume Descriptor; XlogP: predicted octanol/water partition coefficient. LRIscore: ligand-receptor interaction score.

S29
References
(1) Chen, Q.; Tan, H.; Yu, H.; Shi, W. Activation of Steroid Hormone Receptors : Shed Light on the in Silico Evaluation of Endocrine Disrupting Chemicals. Sci. Total Environ. 2018, 631–632, 27–39.
(2) Gronemeyer, H.; Gustafsson, J. Å.; Laudet, V. Principles for Modulation of the Nuclear Receptor Superfamily. Nat. Rev. Drug Discov. 2004, 3, 950–964.
(3) Shiau, A. K.; Barstad, D.; Radek, J. T.; Meyers, M. J.; Nettles, K. W.; Katzenellenbogen, B. S.; Katzenellenbogen, J. A.; Agard, D. A.; Greene, G. L. Structural Characterization of a Subtype-Selective Ligand Reveals a Novel Mode of Estrogen Receptor Antagonism. Nat. Struct. Biol. 2002, 9, 359–364.
(4) Wilson, V. S.; Bobseine, K.; Lambright, C. R.; Gray, L. E. A Novel Cell Line, MDA-Kb2, That Stably Expresses an Androgen- and Glucocorticoid-Responsive Reporter for the Detection of Hormone Receptor Agonists and Antagonists. Toxicol. Sci. 2002, 66, 69–81.
(5) Kumari, R.; Kumar, R.; Lynn, A. G-Mmpbsa: A GROMACS Tool for High-Throughput MM-PBSA Calculations. J. Chem. Inf. Model. 2014, 54, 1951–1962.
(6) Baker, N. A.; Sept, D.; Joseph, S.; Holst, M. J.; McCammon, J. A. Electrostatics of Nanosystems: Application to Microtubules and the Ribosome. Proc. Natl. Acad. Sci. 2001, 98, 10037–10041.
(7) Chen, Q.; Wang, X.; Shi, W.; Yu, H.; Zhang, X.; Giesy, J. P. Identification of Thyroid Hormone Disruptors among HO-PBDEs: In Vitro Investigations and Coregulator Involved Simulations. Environ. Sci. Technol. 2016, 50, 12429–12438.
(8) Clark, M.; Cramer, R. D.; Van Opdenbosch, N. Validation of the General Purpose Tripos 5.2 Force Field. J. Comput. Chem. 1989, 10, 982–1012.
(9) Schwede, T.; Kopp, J.; Guex, N.; Peitsch, M. C. SWISS-MODEL: An Automated Protein Homology-Modeling Server. Nucleic Acids Res. 2003, 31, 3381–3385.
(10) Arnold, K.; Bordoli, L.; Kopp, J.; Schwede, T. The SWISS-MODEL Workspace: A Web-Based Environment for Protein Structure Homology Modelling. Bioinformatics 2006, 22, 195–201.
(11) Laskowski, R. A.; MacArthur, M. W.; Moss, D. S.; Thornton, J. M. PROCHECK: A Program to Check the Stereochemical Quality of Protein Structures. J. Appl. Crystallogr. 1993, 26, 283–291.
(12) Spitzer, R.; Jain, A. N. Surflex-Dock: Docking Benchmarks and Real-World Application. J. Comput. Aided. Mol. Des. 2012, 26, 687–699.

S30
(13) Abraham, M. J.; Murtola, T.; Schulz, R.; Páll, S.; Smith, J. C.; Hess, B.; Lindah, E. Gromacs: High Performance Molecular Simulations through Multi-Level Parallelism from Laptops to Supercomputers. SoftwareX 2015, 1–2, 19–25.
(14) Pronk, S.; Pall, S.; Schulz, R.; Larsson, P.; Bjelkmar, P.; Apostolov, R.; Shirts, M. R.; Smith, J. C.; Kasson, P. M.; van der Spoel, D.; et al. GROMACS 4.5: A High-Throughput and Highly Parallel Open Source Molecular Simulation Toolkit. Bioinformatics 2013, 29, 845–854.
(15) MacKerell, A. D.; Bashford, D.; Bellott, M.; Dunbrack, R. L.; Evanseck, J. D.; Field, M. J.; Fischer, S.; Gao, J.; Guo, H.; Ha, S.; et al. All-Atom Empirical Potential for Molecular Modeling and Dynamics Studies of Proteins. J. Phys. Chem. B 1998, 102, 3586–3616.
(16) Zoete, V.; Cuendet, M. A.; Grosdidier, A.; Michielin, O. SwissParam: A Fast Force Field Generation Tool for Small Organic Molecules. J. Comput. Chem. 2011, 32, 2359–2368.
(17) Jorgensen, W. L.; Chandrasekhar, J.; Madura, J. D.; Impey, R. W.; Klein, M. L. Comparison of Simple Potential Functions for Simulating Liquid Water. J. Chem. Phys. 1983, 79, 926–935.
(18) Berthold, M. R.; Cebron, N.; Dill, F.; Gabriel, T. R.; Kötter, T.; Meinl, T.; Ohl, P.; Thiel, K.; Wiswedel, B. KNIME - the Konstanz Information Miner. ACM SIGKDD Explor. Newsl. 2009, 11, 26.
(19) Martínez, L.; Webb, P.; Polikarpov, I.; Skaf, M. S. Molecular Dynamics Simulations of Ligand Dissociation from Thyroid Hormone Receptors: Evidence of the Likeliest Escape Pathway and Its Implications for the Design of Novel Ligands. J. Med. Chem. 2006, 49, 23–26.
(20) Shen, J.; Li, W.; Liu, G.; Tang, Y.; Jiang, H. Computational Insights into the Mechanism of Ligand Unbinding and Selectivity of Estrogen Receptors. J. Phys. Chem. B 2009, 113, 10436–10444.
(21) Mackinnon, J. A. G.; Gallastegui, N.; Osguthorpe, D. J.; Hagler, A. T.; Estébanez-Perpiñá, E. Allosteric Mechanisms of Nuclear Receptors: Insights from Computational Simulations. Mol. Cell. Endocrinol. 2014, 393, 75–82.
(22) Wu, Y.; Doering, J. A.; Ma, Z.; Tang, S.; Liu, H.; Zhang, X.; Wang, X.; Yu, H. Identification of Androgen Receptor Antagonists: In Vitro Investigation and Classification Methodology for Flavonoid. Chemosphere 2016, 158, 72–79.
(23) Renaud, J. P.; Rochel, N.; Ruff, M.; Vivat, V.; Chambon, P.; Gronemeyer, H.; Moras, D. Crystal Structure of the RAR-Gamma Ligand-Binding Domain Bound to All-Trans Retinoic Acid. Nature 1995, 378, 681–689.
(24) Nadal, M.; Prekovic, S.; Gallastegui, N.; Helsen, C.; Abella, M.; Zielinska, K.; Gay, M.; Vilaseca, M.; Taulès, M.; Houtsmuller, A. B.; et al. Structure of the Homodimeric Androgen Receptor
S31
Ligand-Binding Domain. Nat. Commun. 2017, 8, 14388.
(25) Zhou, X. E.; Suino-Powell, K. M.; Li, J.; He, Y.; MacKeigan, J. P.; Melcher, K.; Yong, E. L.; Xu, H. E. Identification of SRC3/AIB1 as a Preferred Coactivator for Hormone-Activated Androgen Receptor. J. Biol. Chem. 2010, 285, 9161–9171.
(26) Gore, A. C.; Chappell, V. A.; Fenton, S. E.; Flaws, J. A.; Nadal, A.; Prins, G. S.; Toppari, J.; Zoeller, R. T. EDC-2 : The Endocrine Society ’ s Second Scientific Statement on Endocrine-Disrupting Chemicals. Endocr. Rev. 2016, 36, 1–150.
(27) Gore, A. C.; Chappell, V. A.; Fenton, S. E.; Flaws, J. A.; Nadal, A.; Prins, G. S.; Toppari, J.; Zoeller, R. T. Executive Summary to EDC-2: The Endocrine Society’s Second Scientific Statement on Endocrine-Disrupting Chemicals. Endocr. Rev. 2015, 36, 593–602.
(28) Liu, H.; Han, R.; Li, J.; Liu, H.; Zheng, L. Molecular Mechanism of R-Bicalutamide Switching from Androgen Receptor Antagonist to Agonist Induced by Amino Acid Mutations Using Molecular Dynamics Simulations and Free Energy Calculation. J. Comput. Aided. Mol. Des. 2016, 30, 1189–1200.
(29) Bohl, C. E.; Wu, Z.; Miller, D. D.; Bell, C. E.; Dalton, J. T. Crystal Structure of the T877A Human Androgen Receptor Ligand-Binding Domain Complexed to Cyproterone Acetate Provides Insight for Ligand-Induced Conformational Changes and Structure-Based Drug Design. J. Biol. Chem. 2007, 282, 13648–13655.