Molecular Evidence for Microbially-Mediated Sulfur Cycling in the
48
Molecular Evidence for Microbially-Mediated Sulfur Cycling in the Deep Subsurface of the Witwatersrand Basin, South Africa Leah Morgan Senior Integrative Exercise March 10, 2004 Submitted in partial fulfillment of the requirements for a Bachelor of Arts degree from Carleton College, Northfield, Minnesota.
Transcript of Molecular Evidence for Microbially-Mediated Sulfur Cycling in the

Molecular Evidence for Microbially-Mediated Sulfur Cycling in theDeep Subsurface of the Witwatersrand Basin, South Africa
Leah MorganSenior Integrative Exercise
March 10, 2004
Submitted in partial fulfillment of the requirements for a Bachelor of Arts degreefrom Carleton College, Northfield, Minnesota.

Table of Contents
Introduction .........................................................................................................1Microbial Investigations .......................................................................... 1Biological Sulfate Reduction and Sulfur Oxidation ...................................3
Geological Setting................................................................................................6Methods .............................................................................................................10
Sampling ................................................................................................10DNA Extraction ......................................................................................11Polymerase Chain Reaction and Thermal Cycling ..................................11Gel Electrophoresis ................................................................................12Cloning...................................................................................................14M13 PCR................................................................................................16Restriction Digest ...................................................................................16Sequencing .............................................................................................17Phylogenetic Analysis.............................................................................17Geochemistry..........................................................................................20
Results ...............................................................................................................20Phylogeny...............................................................................................20Geochemistry..........................................................................................31
Discussion..........................................................................................................31Genetic signatures ..................................................................................31Geochemistry..........................................................................................36
Conclusion .........................................................................................................37
Acknowledgements ............................................................................................38
References Cited ................................................................................................38
Appendix 1 ........................................................................................................41

Molecular Evidence for Biologically-Mediated Sulfur Cycling in the DeepSubsurface of the Witwatersrand Basin, South Africa
Leah MorganCarleton College
Senior Integrative ExerciseMarch 10, 2004
Advisors:Professor Jennifer L. Macalady, Carleton College
Thomas M. Gihring, Pacific Northwest National Laboratory
Abstract
The continental deep subsurface harbors a heterogeneous community of microorganismsthat have yet to be well understood. The gold mines of the Witwatersrand Basin in SouthAfrica provide economically feasible access to this environment. Molecular evidence forbiologically-mediated sulfur cycling has been detected in fissure water in theMerriespruit mine and in groundwater from a dolomite aquifer in the Driefontein mine.PCR amplification, cloning, and sequencing of adenosine-5’-phosphosulfate reductase(APS) and 16S rRNA genes were used to assess the composition and diversity of sulfur-metabolizing microbial populations. Both APS reductase and 16S bacterial gene librariesfrom the Driefontein mine sample were dominated by sequences with high identity toDesulfomicrobium baculatum. The 16S archaeal library from Driefontein had a highpercentage of sequences closely related to Methanomicrobium mazei and the ANMEgroup of anaerobic methanotrophs. The 16S bacterial library from the Merriespruit minesample was dominated by Thiobacillus-related species known to oxidize sulfur. Thearchaeal library showed a strong affiliation with Methanobacterium curvum. Most APSsequences from Merriespruit were from an undefined lineage but showed closeassociation with clones from the mouse gastrointestinal tract; others were closely relatedto the sulfur-oxidizing bacterium Allochromatium vinosum. This study reports the firstsulfate-reducing d-Proteobacterial sequences from the South African gold mines andgreatly increases the known diversity of subsurface sulfur-metabolizing organisms.Geochemical data are consistent with molecular evidence for deep-subsurface sulfurcycling.
Keywords: biodiversity, biogeochemical cycles, geomicrobiology, subsurface,phylogeny, sulfur, Witwatersrand Supergroup, Transvaal Supergroup

1
Introduction
Microbial Investigations
As many as 5x10³ 0 bacterial and archaeal organisms are believed to be currently
living on Earth and contain as much carbon as all plant life combined. These
microorganisms play significant roles in the cycling of carbon, sulfur, hydrogen, and other
elements important to environmental and geological systems. Many microbes inhabit deep
oceanic and subsurface environments that scientists are just beginning to investigate
thoroughly (Madigan et al., 2003).
Until recently, standard microbial investigations have involved the culturing and
isolation of novel species from environmental samples. Using this method, researchers
subject a community of microbes to specific temperature, pH, redox, and nutrient conditions
in order to determine the ideal growth situation for a particular species under which no other
organisms can thrive. However, recent studies have shown that only 1% of all
microorganisms are culturable using current enrichment techniques, leaving 99% of
microbial diversity unexplored by these isolation methods (Hugenholtz, 2002).
New molecular techniques have bypassed these boundaries by allowing researchers
to work directly with DNA extracted from environmental samples. Extracted DNA is
subjected to a polymerase chain reaction (PCR), which creates many copies of a small
section of the genome that codes for a particular function (a gene). Most work in this area
has focused on the gene that codes for the 16S ribosomal RNA (rRNA) because it is highly
conserved across the three domains of life: Bacteria, Archaea, and Eukarya (Fig. 1). This
gene is therefore useful in determining the evolutionary history of organisms that are
present in an environmental sample (Lane et al., 1985; Pace, 1997).
However, the 16S rRNA gene does have limitations. Although one might infer that
closely related species are likely to have similar metabolic and physiological characteristics,
the 16S rRNA gene cannot be used to definitively identify the metabolic capabilities
involved in elemental cycling. To determine the occurrence and phylogeny of uncultivated

TM7 OP10
Deinococcus-Thermus
Chloroflexi Thermotogae
Thermodesulfobacteria
Aquificae
Cyanobacteria
Actinobacteria OP9
Firmicutes S
piro
chae
tes
Planctomycetes O
P3 Chl
amyd
iae
Ver
ruco
mic
robi
a
Defe
rriba
cteres
Synerg
istes
Fus
obac
teria
TM6 Termite group I
Acidobacteria
Fibrobacteres
Gemmimonas Nitrospira
Chlorobi Bacteroidetes
e Proteobacteria
d Proteobacteria
a, b, g Proteobacteria
Eucarya
FC
G2 K
orar
chae
ota
FC
G1
The
rmop
rotei
C2
YNPF
FA
C1
Sediment-1 Halobacteria pMC2 Methanobacteria
Methanococcales Archaeoglobi
Methanopyrus Thermococci
SAGMEG1 pMC1
Thermoplasmata Methanomicrobia
0.10 nucleotide changes per site
Bacteria
Archaea
Figure 1: The three domains of life, according to 16S rRNA gene phylogeny. Lineages containing sulfate reducers and sulfur oxidizers are marked with circles. Tree modified from Macalady and Banfield, 2003.
Lineage containing sulfate reducers
Lineage containing sulfur oxidizers
2

3
organisms responsible for particular geochemical transformations, one must look for genes
that code for proteins required for a particular metabolic pathway. Although specific
protein-coding genes may not be present in all organisms within a community, their study
gives insight into specific processes occurring in an environment.
Biological Sulfate Reduction and Sulfur Oxidation
Certain microbes harness energy for life processes by changing the redox state of
sulfur compounds. Anaerobic sulfate-reducing prokaryotes (SRP) pass electrons from H2
and organic acids to sulfate (SO42-), producing sulfide (H2S), elemental sulfur (S°), pyrite
(FeS2), and other reduced sulfur compounds (Fig. 2a). Culturable SRP are found in several
phyla across the Bacterial and Archaeal domains, including d-, e-, b-, and g-Proteobacteria,
Firmicutes, Thermodesulfobacteria, and Archaeoglobi (Fig. 1). Sulfur-oxidizing
prokaryotes (SOP) pass electrons from reduced sulfur compounds to electron acceptors
such as nitrate (NO3) or oxygen (O2) and produce sulfate as a byproduct (Fig. 2b)
(Madigan et al., 2003). SOP are found across an even wider range of Bacterial and
Archaeal lineages, including the d-, a-, e-, b-, and g-Proteobacteria, Chlorobi, Firmicutes,
Cyanobacteria, Aquificae, and Thermoprotei. (Fig. 1) (Friedrich, 1998; Hipp et al., 1997;
Madigan et al., 2003).
Sulfate reduction follows one of two pathways. The assimilative pathway results in
the formation and assimilation of organic sulfur-bearing compounds such as amino acids.
The dissimilative pathway results in the excretion of reduced, inorganic sulfur compounds
(Fig. 2a). Sulfur oxidation can also occur on two pathways. One pathway involves the
direct oxidation of sulfite to sulfate, while the other involves the creation of the intermediate
compound adenosine-5’-phosphosulfate and its subsequent oxidation to sulfite (Fig. 2b)
(Madigan et al., 2003). These biogenic pathways involved in the sulfur cycle may give
insight into Earth’s earliest life forms because they are believed to have developed prior to

SO42- APS
SO32-
H2S
ATPinorganicphosphate
2 e -
AMP
6 e -
REDUCTION
adenosine phosphosulfate(APS) reductase
Adenosine triphosphate (ATP) sulfurylase
dissimilatorysulfite reductase (dsr)
Figure 2a: The biochemical sulfate reduction pathway that includes APS reductase.Enzymes are shown in bubbles. Modified from Madigan, et al., 2003.
4

SO42- APS
SO32-
H2S
ADPinorganicphosphate
2 e -
AMP
6 e -
OXIDATION
adenosine phosphosulfate(APS) reductase
adenosine triphosphate (ATP) sulfurylase
electron transport chain
Figure 2b: The biochemical sulfur oxidation pathway that includes APS reductase. Enzymes are shown in bubbles. Modified from Madigan, et al., 2003.
5

6
both the development of photosynthesis and the divergence of the Archaeal and Bacterial
domains (Canfield et al., 2000; Friedrich, 2002; Hipp et al., 1997; Wagner et al., 1998).
Adenosine-5’-phosphosulfate reductase (APS) is an enzyme on both the
dissimilative sulfate reduction and the multi-step sulfur oxidation pathways and can catalyze
both oxidative and reductive reactions between sulfate and sulfite (Fig. 2). The APS gene
coding for this enzyme has been found in most cultured SRP (Friedrich, 2002) and several
cultured SOP, including Allochromatium vinosum and Thiobacillus denitrificans (Fig. 1)
(Hipp et al., 1997). Friedrich (2002) provides evidence for lateral gene transfer of the APS
reductase gene between gram-positive and thermophilic lineages of SRP and suggests that
APS gene phylogenies should be evaluated accordingly, as gene phylogenies may not
accurately reflect organismal phylogenies.
Previous molecular work by Baker et al. (2003) on 16S rRNA and dissimilatory
sulfite reductase (dsrAB) (Fig. 2a) genes has confirmed the presence of SRP closely related
to Desulfotomaculum (Firmicutes) in fissure water of the Witwatersrand Supergroup. This
study combines the use of the 16S rRNA and APS genes to investigate microbial diversity
and sulfur cycling in the deep subsurface of the Witwatersrand Basin in South Africa. This
thesis marks the first attempt to obtain and analyze APS gene sequences from deep
subsurface samples collected in the South African gold mines.
Geological Setting
The Witwatersrand Supergroup, a 7 km thick gold-bearing quartzite conglomerate
with interbedded carbon-rich layers, was deposited in the Witwatersrand Basin of South
Africa between 3000 and 2700 Ma (Fig. 3). This supergroup overlies a 3400 Ma granite-
greenstone basement complex. Sediments in the Witwatersrand are believed to be sourced
from the paleo-Murchison Greenstone Range east of the basin (Fig. 3a) (Viljoen and
Reimold, 2002). Subsequent greenschist to amphibolite facies metamorphism transformed
the Witwatersrand sediments into a quartzite conglomerate. A debate still exists as to

NAMIBIA
BOTSWANA
ZIMBABWE
MO
ZAM
BIQ
UE
BLOEMFONTEIN
JOHANNESBURG
INDIA
N OCEAN
ATLANTIC OCEAN
CAPE TOWN
DURBAN
0 100 200 300 400km
N
MERRIESPRUIT
DRIEFONTEIN
A'
A
PALEO
- MU
RC
HISO
N R
AN
GE
Figure 3a: Map of South Africa showing sampling locations and major cities. Line A - A' refers to cross section in figure 3b. Location of paleo-Witwatersrand Basin is shown with dashed lines. Modified from Viljoen and Reimold, 2002.
7

Figure 3b: Cross-section of Witwatersrand Basin showing sampling locations and geological formations. Dashed line represents isogeotherm for 120OC. Horizontal lines in Driefontein and Merriespruit mine shafts indicate sampling depths. Cross-section line A - A' is shown on figure 3a. Modified from Onstott, unpublished.
A A'
Karoo strata (K) (300 Ma)
Bushveld Complex (BC) (2.0 Ga)
Ventersdorp Supergroup (VS) (2.7 Ga)
Transvaal Supergroup (TS) (2.3 Ga)
Witwatersrand Supergroup (WS) (2.9 Ga)
Basement Complex (3.4 Ga)
Plutonic feeders forBushveld Complex
Vredefort Dome
North
Witwatersrand Basin
10 km
Driefontein and West Rand gold mines
Merriespruit and Welkom gold mines
KVS
WS
WS
VS
TSBC
0 25 50 75 100
km
8

9
whether gold, uraninite, pyrite, and hydrocarbons were derived from original sediments or
whether they migrated into the basin with hydrothermal fluids during metamorphism
(Drennan et al., 1999). The Witwatersrand Supergroup is overlain by the Ventersdorp lavas
in the south and the stromatolitic Malmani dolomite formation of the Transvaal Supergroup
(2600-2250 Ma) in the north. The Vredefort meterorite impact at 2020 Ma created the
Vredefort Dome structure (Fig. 3b) (Viljoen and Reimold, 2002). Dikes of the Pilansberg
Complex (1400 Ma) compartmentalize meteoric groundwater in the Malmani
aquifer and fissure water in the Witwatersrand Supergroup. Water in these formations has
residence times of 13 kyr and 1-123 Myr, respectively (Lippmann et al., 2003; Omar et al.,
2003; Onstott, 2004a).
The Witwatersrand Supergroup has been mined for gold since the 1880’s and has
produced nearly half of all gold ever mined in the world (Viljoen and Reimold, 2002). The
deep shafts and tunnels dug by the mining industry (Fig. 3b) have created an opportunity
for microbiologists and geochemists to easily sample fissure water from the deep
subsurface, where microorganisms are believed to live chemolithotrophically on the energy
from redox disequilibria (Onstott et al., 2003). The high temperatures and pressures of the
deep subsurface have been proposed as analogs for early terrestrial and extraterrestrial
conditions (Teske et al., 2003). The gold mines in South Africa are among the deepest in
the world and provide relatively easy access to the subsurface while avoiding many of the
high costs of drilling and reaching even deeper depths (>4km). Since 1997, a group led by
Tullis C. Onstott of Princeton University and funded by the Life in Extreme Environments
(LExEn) program of the National Science Foundation has been sampling and investigating
fissure water from the gold mines in South Africa (Baker et al., 2003; Lippmann et al.,
2003; Moser et al., 2003; Onstott et al., 2003; Takai et al., 2001). An extensive geochemical
and microbial database has been compiled, but many questions regarding microbial
metabolism, spatial distribution, and phylogeny remain unanswered.
10
Methods
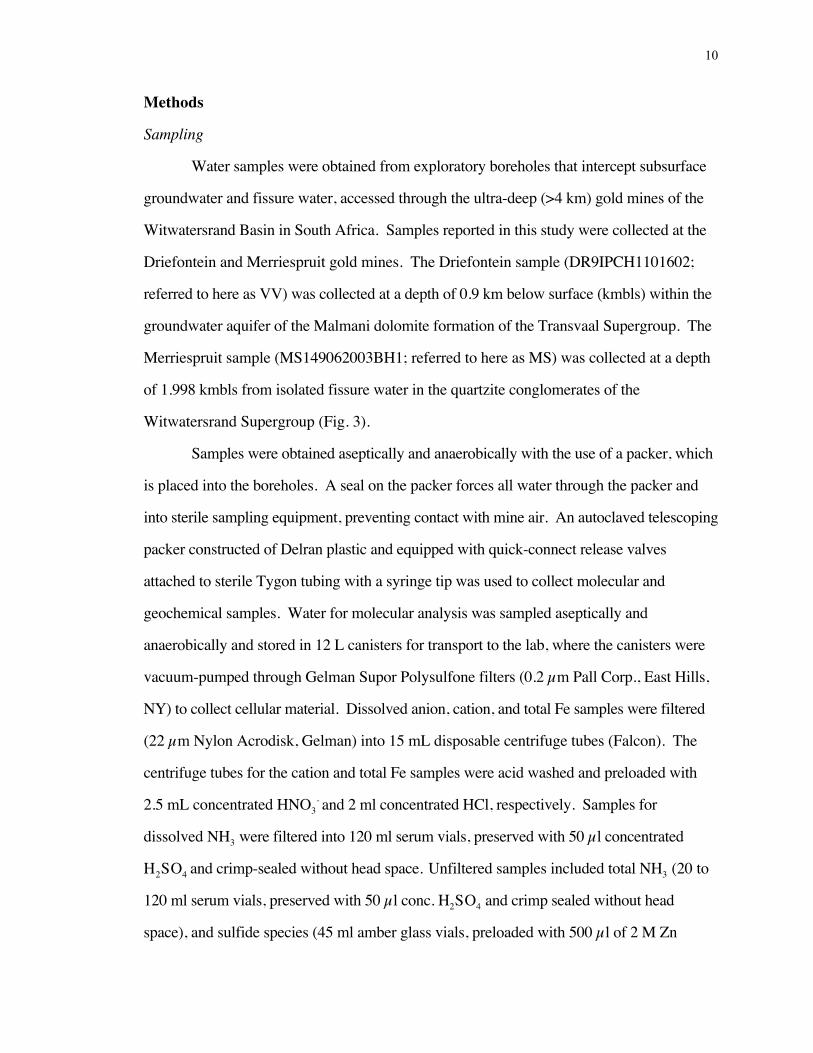
Sampling
Water samples were obtained from exploratory boreholes that intercept subsurface
groundwater and fissure water, accessed through the ultra-deep (>4 km) gold mines of the
Witwatersrand Basin in South Africa. Samples reported in this study were collected at the
Driefontein and Merriespruit gold mines. The Driefontein sample (DR9IPCH1101602;
referred to here as VV) was collected at a depth of 0.9 km below surface (kmbls) within the
groundwater aquifer of the Malmani dolomite formation of the Transvaal Supergroup. The
Merriespruit sample (MS149062003BH1; referred to here as MS) was collected at a depth
of 1.998 kmbls from isolated fissure water in the quartzite conglomerates of the
Witwatersrand Supergroup (Fig. 3).
Samples were obtained aseptically and anaerobically with the use of a packer, which
is placed into the boreholes. A seal on the packer forces all water through the packer and
into sterile sampling equipment, preventing contact with mine air. An autoclaved telescoping
packer constructed of Delran plastic and equipped with quick-connect release valves
attached to sterile Tygon tubing with a syringe tip was used to collect molecular and
geochemical samples. Water for molecular analysis was sampled aseptically and
anaerobically and stored in 12 L canisters for transport to the lab, where the canisters were
vacuum-pumped through Gelman Supor Polysulfone filters (0.2 µm Pall Corp., East Hills,
NY) to collect cellular material. Dissolved anion, cation, and total Fe samples were filtered
(22 µm Nylon Acrodisk, Gelman) into 15 mL disposable centrifuge tubes (Falcon). The
centrifuge tubes for the cation and total Fe samples were acid washed and preloaded with
2.5 mL concentrated HNO3- and 2 ml concentrated HCl, respectively. Samples for
dissolved NH3 were filtered into 120 ml serum vials, preserved with 50 µl concentrated
H2SO4 and crimp-sealed without head space. Unfiltered samples included total NH3 (20 to
120 ml serum vials, preserved with 50 µl conc. H2SO4 and crimp sealed without head
space), and sulfide species (45 ml amber glass vials, preloaded with 500 µl of 2 M Zn

11
acetate and crimp sealed without head space). The anion and phosphate sample bottles were
only partially filled, frozen immediately upon return to the field lab and kept frozen until
analysis. The sulfide species samples were split into two serum vials in an anaerobic glove
bag with 10%H2/90%N2 gas mixture, crimp sealed and frozen until analysis (Moser et al.,
2003).
Geochemical field measurements included pH, temperature, Eh (mV), conductivity
(mS), O2 (0.1-1,1-10 ppm), total Fe (1-10 ppm), sulfide (0.1-10 ppm), and NH3 (1-10 ppm),
using the pH, temperature, and conductivity probe and Eh probe HI98201 (Hanna
Instruments, Woonsocket, RI) and Chemet Kits K-7510, K-6010, K-9510, K-1501,
respectively (Chemetrics, Inc., Calverton, VA) (Moser et al., 2003).
DNA Extraction
DNA was extracted from the DNA filters using the MOBIO Ultraclean Soil DNA
Kit (MOBIO Labs, Inc., Solana Beach, Calif.). This process isolates DNA from cellular
material, as required for subsequent procedures. DNA extraction was performed at the
University of the Free State (Bloemfontein, South Africa), by members of the Research
Experiences for Undergraduates program (MS149062003BH1) and at Pacific Northwest
National Laboratory by Duane P. Moser (DR9IPCH1101602).
Polymerase Chain Reaction (PCR) and Thermal Cycling
PCR is a method for replicating and isolating a specific gene in a sample. It
involves subjecting a reaction mixture to a precise sequence of temperatures in the presence
of a DNA polymerase in order to imitate the events of DNA replication within a living cell.
Reagents in the mixture include extracted DNA template; Taq polymerase, an enzyme that
replicates DNA strands; primers, short DNA strands that match with conserved regions near
the ends of the desired gene; dNTPs, extra nucleotides (adenine, thymine, guanine, and
cytosine) to create new copies of the DNA template; and a buffer, which maintains a correct
12
pH and salt concentration for the reaction. This PCR mixture is then exposed to thermal
cycling, a specific series of temperatures under which the reagents operate to replicate DNA.
The precise thermal cycle varies depending on the desired gene, but the general cycle
involves an initial denaturing step to unbind the double-stranded DNA, followed by 35
cycles of denaturing, annealing (binding), and extension. Each cycle provides the
conditions required to duplicate every strand of DNA in the sample. A final extension
period rebinds the DNA, which is then stored at 4°C to prevent degradation.
PCR was performed using ExTaq polymerase and the provided buffer (Takara Bio,
Inc, Japan). Forward and reverse primers (Sigma Genosys) used for each amplified gene
are summarized in Table 1a. PCR reagents were combined with 1 mL template to a final
volume of 25 mL at the following final concentrations: 1X ExTaq buffer, 200 mM dNTPs,
0.2 mM forward primer, 0.2 mM reverse primer, and 1.5units/25 mL ExTaq. Positive and
negative amplification controls were run with every PCR reaction. Thermal cycling was
performed with a PTC-225 Peltier Thermal Cycler (MJ Research, Waltham, Mass.), as
shown in Table 1b.
Gel Electrophoresis
Products of the PCR reactions were run on agarose gels to determine the presence
or absence of the amplified gene. By subjecting negatively charged DNA to an electric
current, the amplified PCR product was forced through the gel towards the positive
electrode and separated according to length. Smaller fragments move more easily through
pores in the agarose and thus run father than longer fragments, creating bands at different
positions on the gel that represent DNA of different lengths. The DNA stain ethidium
bromide was added to the gel and allows bands to be viewed under ultraviolet light. PCR
products of 16S rRNA and APS reductase genes that showed amplification were then ready
for cloning.
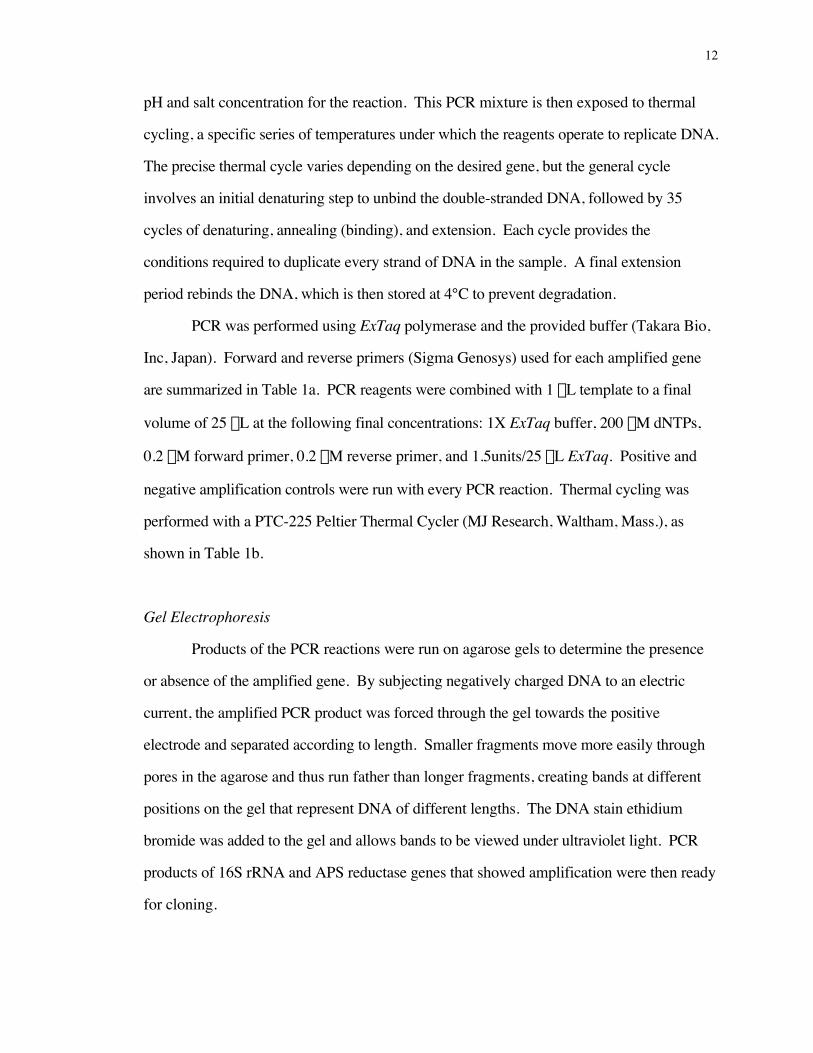
Table 1: (a) Primers used to amplify each gene in this study. * APS-FW was published incorrectly and should not include the final "G." (b) Thermal cycling for each primer set.
a.)
b.)
Desired Gene Primer Sequence CitationAPS APS-FW 5’-TGGCAGATMATGATYMACGGG–3’ * Deplancke 2000APS APS-RV 5’-GGGCCGTAACCGTCCTTGAA–3’ Deplancke 200016S archaea 21F 5’-TTCYGGTTGATCCYGCCRGA-3’ Moyer 199816S archaea 1492R 5’-GGTTACCTTGTTACGACTT-3’ Reysenbach 200016S nested archaea 21F 5’-TTCYGGTTGATCCYGCCRGA-3’ Moyer 199816S nested archaea 915R 5’-GTGCTCCCCCGCCAATTCCT-3’ Stahl 199116S bacteria 27F 5’-AGAGTTTGATCMTGGCTCAG-3’ Braker 200116S bacteria 1492R 5’-GGTTACCTTGTTACGACTT-3’ Reysenbach 2000Sequencing primer M13F 5’ -GTAAAACGACGGCCAG- 3’Sequencing primer M13R 5’ -CAGGAAACAGCTATGAC- 3’
Primer Initial Denaturing Denaturing (x35) Annealing (x35) Extension (x35) Final Extension StorageTime Temp Time Temp Time Temp Time Temp Time Temp Time(m:s) (deg C) (m:s) (deg C) (m:s) (deg C) (m:s) (deg C) (m:s) (deg C) (m:s)
APS 5:00 95 0:30 62 1:00 72 1:00 72 20:00 4 forever16S 5:00 95 0:30 50 1:00 72 1:30 72 20:00 4 foreverM13 5:00 95 0:30 50 1:00 72 1:30 72 20:00 4 forever
13

14
Cloning
Cloning consists of two steps, ligation and transformation, which are performed to
isolate variations of homologous genes from each other. This is required because PCR
amplification of a particular sample yields many copies of different versions of the desired
gene present in the environment. In order to obtain sequences, copies of the gene with
different sequences must be isolated from the others. Ligation is the insertion of the PCR-
amplified gene into a plasmid by binding together the ends of the insert with the ends of the
plasmid. A plasmid is a circular piece of double-stranded DNA that contains an insertion
site into which the desired gene is spliced. This plasmid is then subjected to a
transformation reaction, where it is inserted into a host cell for replication.
Cloning was completed with the Invitrogen TA Cloning Kit (Invitrogen, San Diego,
Calif). APS and 16S rRNA genes were inserted into the pCR2.1 plasmid vector
(Invitrogen) (Fig. 4). The resulting product was then transformed into chemically
competent TOP10 Escherichia coli cells (Invitrogen) using the manufacturer’s instructions,
forcing the cells to incorporate the plasmid. Clones were then plated onto Petri dishes with
LB agar and incubated at 37°C overnight, providing the proper nutrients
and temperature to stimulate cell replication. Growth was controlled in several ways. The
cloning vectors contain genes for antibiotic resistance and kanamycin was therefore used to
prevent the growth of both E. coli cells that were not transformed with an insert.
Additionally, the plates were treated with X-GAL for blue-white screening of colonies.
Clones without a plasmid insert are colored blue by this process. Clone libraries were
constructed by picking 48 white colonies from each sample from the plates and growing
them individually in microcentrifuge tubes with LB media and kanamycin.

AGT GAG TCG TAT TA C AAT TCA CTG GCC GTC GTT TTA C AA CGT CGT GAC TGG GAA AACTCA CTC AGC ATA AT G TTA AGT GAC CGG CAG CAA AAT G TT GC A GCA CTG ACC CTT TTG
T7 Promoter M13 Forward (-20) Primer
CCA TCA CAC TGG CGG CCG CTC GAG CAT GCA TCT AGA GGG CCC AAT TCG CCC TATGGT AGT GTG ACC GCC GGC GAG CTC GTA CGT AGA TCT CCC GGG TTA AGC GGG ATA
Not I Xho IPaeR7 I
Ava I
Nsi I Xba I Apa I
lacZ
F1ori
+1P
Ampicillin
pUC
ori
Kanamyc
in
pCRÆ2.13.9 kb
GTA ACG GCCCAT TGC CGG
GCC AGT GTG CTG GAA TTC GGC TCGG TCA CAC GAC CTT AAG CCG A
T A A GCC GAA TTC TGCA T T CGG CTT AAG ACGPCR Product
AGA TATTCT ATA
CAG GAA ACA GCT ATG AC C ATG ATT ACG CCA AGC TGTC CTT TGT CGA TAC TG G TAC TAA TGC GGT TCG A
M13 Reverse PrimerlacZα ATG
TG GTA CCG AGC TCG GAT CCA CTAAC CAT GGC TCG AGC CTA GGT GAT
K pn I S ac I S pe IBamH IHind III
E coR IE coR IB stX I
B stX IE coR V
Figure 4: Map of Invitrogen cloning plasmid vector pCR 2.1 used in ligation reactions.
15
16
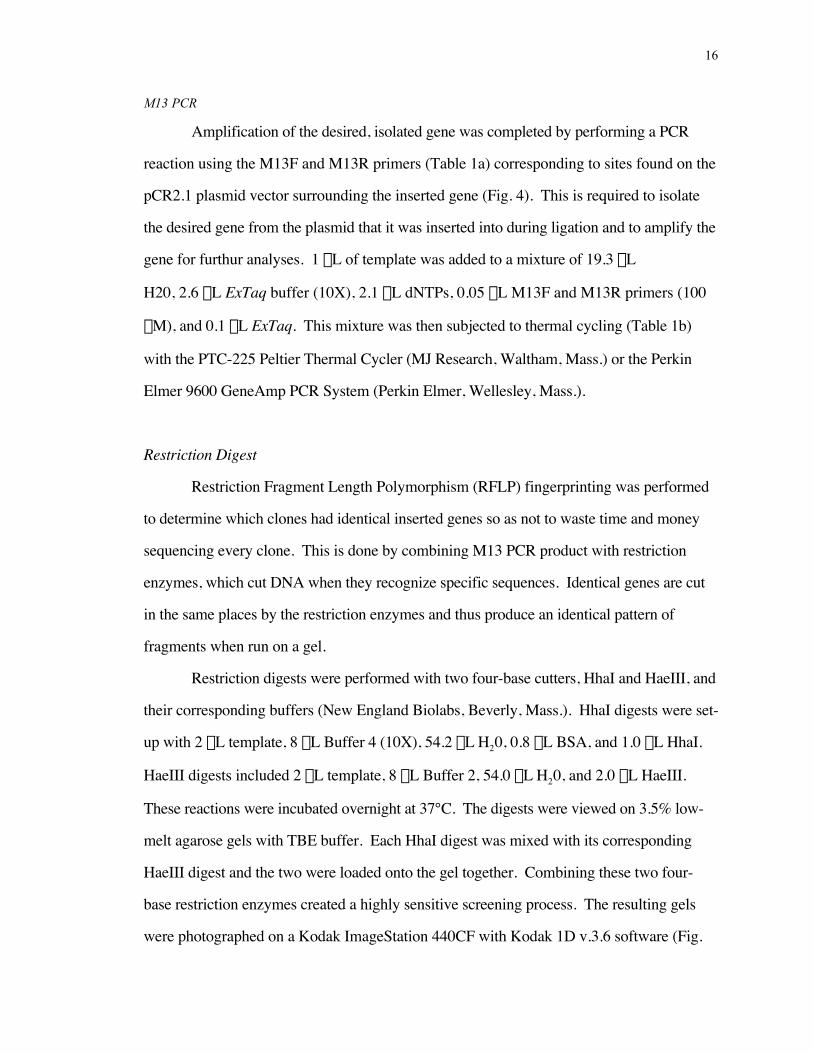
M13 PCR
Amplification of the desired, isolated gene was completed by performing a PCR
reaction using the M13F and M13R primers (Table 1a) corresponding to sites found on the
pCR2.1 plasmid vector surrounding the inserted gene (Fig. 4). This is required to isolate
the desired gene from the plasmid that it was inserted into during ligation and to amplify the
gene for furthur analyses. 1 mL of template was added to a mixture of 19.3 mL
H20, 2.6 mL ExTaq buffer (10X), 2.1 mL dNTPs, 0.05 mL M13F and M13R primers (100
mM), and 0.1 mL ExTaq. This mixture was then subjected to thermal cycling (Table 1b)
with the PTC-225 Peltier Thermal Cycler (MJ Research, Waltham, Mass.) or the Perkin
Elmer 9600 GeneAmp PCR System (Perkin Elmer, Wellesley, Mass.).
Restriction Digest
Restriction Fragment Length Polymorphism (RFLP) fingerprinting was performed
to determine which clones had identical inserted genes so as not to waste time and money
sequencing every clone. This is done by combining M13 PCR product with restriction
enzymes, which cut DNA when they recognize specific sequences. Identical genes are cut
in the same places by the restriction enzymes and thus produce an identical pattern of
fragments when run on a gel.
Restriction digests were performed with two four-base cutters, HhaI and HaeIII, and
their corresponding buffers (New England Biolabs, Beverly, Mass.). HhaI digests were set-
up with 2 mL template, 8 mL Buffer 4 (10X), 54.2 mL H20, 0.8 mL BSA, and 1.0 mL HhaI.
HaeIII digests included 2 mL template, 8 mL Buffer 2, 54.0 mL H20, and 2.0 mL HaeIII.
These reactions were incubated overnight at 37°C. The digests were viewed on 3.5% low-
melt agarose gels with TBE buffer. Each HhaI digest was mixed with its corresponding
HaeIII digest and the two were loaded onto the gel together. Combining these two four-
base restriction enzymes created a highly sensitive screening process. The resulting gels
were photographed on a Kodak ImageStation 440CF with Kodak 1D v.3.6 software (Fig.

17
5a). Identical patterns were identified as containing replicate sequences and grouped
together (Fig. 5b). One clone from each group was selected for sequencing and purified
with the MOBIO PCR Purification Kit (MOBIO Labs, Inc., Solana Beach, Calif.). The
laboratory work explained above (PCR, electrophoresis, cloning, M13PCR, and RFLP) was
performed by Leah Morgan and Thomas Gihring with the help of Cody Simonson at the
Pacific Northwest National Laboratory, Environmental Microbiology Group (Richland,
Washington).
Sequencing
DNA sequencing was performed using an Applied Biosystems 3100 genetic
analyzer with primers M13F and M13R (Table 1a) at the Florida State University
sequencing facility in Tallahassee, Florida. Sequence fragments were assembled to yield a
complete copy of each gene sequenced. Sequences were checked for errors in Sequencher
v3.1.1 (Gene Codes Corporation, Ann Arbor, Mich.) by Mike Dollhopf and David Balkwill
at Florida State University in Tallahassee.
Phylogenetic Analysis
Phylogenetic analysis and the creation of phylogenetic trees involves two major
steps. First, sequences for inclusion on a tree must be aligned to each other with the goal of
maximizing the number of identical regions. Second, the alignment is turned into a tree by
one of many algorithms used by phylogeneticists. Various algorithms incorporate different
evolutionary assumptions, and a robust phylogeny should produce similar results across
several different algorithms. Algorithms used in this study include maximum-likelihood,
neighbor-joining, and Bayesian analysis.
Gene sequences were searched for the primer sequences in Bioedit (Hall, 2001b)
and trimmed to exclude plasmid sequences. The National Center for Biotechnology
Information BLAST (Basic Local Alignment Search Tool) search algorithm (Altschul et al.,

Figure 5: (a) Photo of RFLP gel, sample APS-VV. (b) RFLP analysis of APS-VV clones. Gel photos were imported into Adobe Photoshop and manipulated to compare patterns. Clones with similar patterns were grouped, and one from each group was selected for sequencing. All unique clones were sequenced.
b)
a)
18

19
1997) was used to search for closely related sequences in public databases and to confirm
the presence of the desired gene. Closest BLAST matches were retrieved and included in
alignments. 16S rDNA sequences were aligned to a master database with the quick aligner
in ARB (v. 2.0) (Ludwig et al., 2002) and checked manually. APS sequences were aligned
in Clustal X (Thompson et al., 1997) using parameters suggested by Hall (Hall, 2001a).
16S rDNA sequences (900 to 1600 base pairs) were checked for chimeras using
Bellerophon (Huber et al., 2004) and the Ribosomal Database Project’s ChimeraCheck
(Cole et al., 2003). A chimera is an artifact of PCR that is formed of pieces of the desired
gene from different organisms, creating the appearance of highly divergent, novel
sequences. Additionally, each clone library was manually searched for chimeras in Bioedit
(Hall, 2001b). APS sequences (~450 base pairs) were too short for analysis in Bellerophon
and were checked manually. Several chimeras were identified in each clone library and were
excluded from analyses.
Alignments for Bacterial and Archaeal 16S rDNA genes were imported into
MrBayes (Huelsenbeck, 2000) for Bayesian analysis. MrBayes was run for 100,000
generations with a sample frequency of 100 and a gamma rate correction. The “burn in”
value was set to remove the first 350 trees from the phylogeny. Alignment for the APS
gene was imported into ARB (Ludwig et al., 2002) and used to create a neighbor-joining
tree.
To assess the quality of the alignments and consistency of phylogeny, multiple
treeing algorithms were used to check for congruence. ARB was used to create maximum-
likelihood trees for VV 16S rDNA bacterial and archaeal sequences. MS 16S rDNA trees
were created in neighbor-joining (archaea) and maximum-likelihood (bacteria). An APS
tree was constructed in MrBayes as described above for 16S rDNA tree. Additionally,
bootstrapping (likelihood for MrBayes trees) was performed to assess the reliability of
constructed trees. Bootstrapping is a statistical method that tests how well the tree reflects
the data; a higher percentage reflects a more reliable cluster of sequences.
20
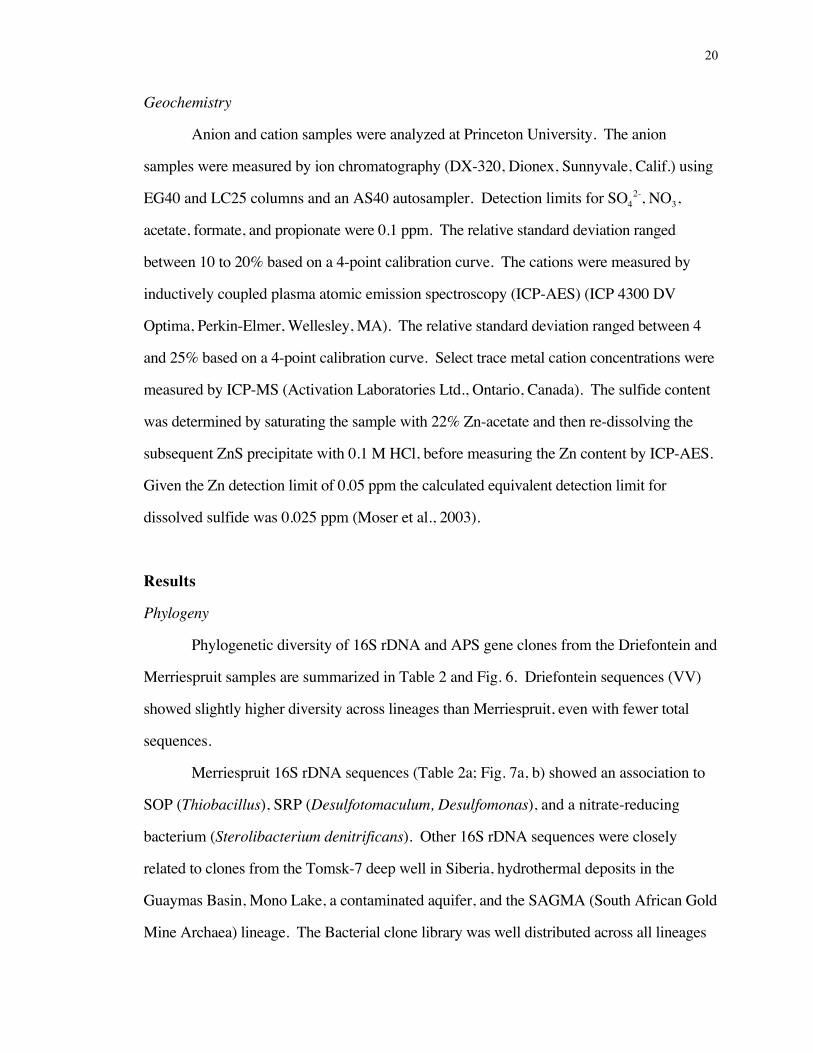
Geochemistry
Anion and cation samples were analyzed at Princeton University. The anion
samples were measured by ion chromatography (DX-320, Dionex, Sunnyvale, Calif.) using
EG40 and LC25 columns and an AS40 autosampler. Detection limits for SO42-, NO3,
acetate, formate, and propionate were 0.1 ppm. The relative standard deviation ranged
between 10 to 20% based on a 4-point calibration curve. The cations were measured by
inductively coupled plasma atomic emission spectroscopy (ICP-AES) (ICP 4300 DV
Optima, Perkin-Elmer, Wellesley, MA). The relative standard deviation ranged between 4
and 25% based on a 4-point calibration curve. Select trace metal cation concentrations were
measured by ICP-MS (Activation Laboratories Ltd., Ontario, Canada). The sulfide content
was determined by saturating the sample with 22% Zn-acetate and then re-dissolving the
subsequent ZnS precipitate with 0.1 M HCl, before measuring the Zn content by ICP-AES.
Given the Zn detection limit of 0.05 ppm the calculated equivalent detection limit for
dissolved sulfide was 0.025 ppm (Moser et al., 2003).
Results
Phylogeny
Phylogenetic diversity of 16S rDNA and APS gene clones from the Driefontein and
Merriespruit samples are summarized in Table 2 and Fig. 6. Driefontein sequences (VV)
showed slightly higher diversity across lineages than Merriespruit, even with fewer total
sequences.
Merriespruit 16S rDNA sequences (Table 2a; Fig. 7a, b) showed an association to
SOP (Thiobacillus), SRP (Desulfotomaculum, Desulfomonas), and a nitrate-reducing
bacterium (Sterolibacterium denitrificans). Other 16S rDNA sequences were closely
related to clones from the Tomsk-7 deep well in Siberia, hydrothermal deposits in the
Guaymas Basin, Mono Lake, a contaminated aquifer, and the SAGMA (South African Gold
Mine Archaea) lineage. The Bacterial clone library was well distributed across all lineages

Table 2a: Summary of Merriespruit (MS) 16S and APS clones and their inferred taxonomies.Clone Division (subdivision) Nearest taxon Nearest environmental clone % of library16S bacteriaMS2-13 Firmicutes Desulfotomaculum australicum Mono Lake clone, AY245489 11.1MS2-30 Firmicutes (low G+C) Anaerobranca bogoriae Mono Lake clone, AF507877 11.1MS2-38 Nitrospira Magnetobacterium bavaricum Wetland clone, AF534005 22.2MS2-2 Proteobacteria (beta or gamma) Thiobacillus baregensis Sulfur River Cave clone, AF047619 11.1MS2-5 Proteobacteria (beta or gamma) Thiobacillus baregensis Sulfur River Cave clone, AF047619 11.1MS3-17 Proteobacteria (beta) Sterolibacterium denitrificans P+ sludge clone, AF204243 11.1MS3-31 Proteobacteria (delta) Desulfomonas species Anaerobic clone, AF447133 11.1MS3-19 Proteobacteria (gamma) Thiobacillus species 11.1
16S archaeaMS2-46 Methanobacterium Methanobacterium curvum 31.3MS2-33 SAGMA SAGMA-F Siberian deep well clone, AJ583385 6.3MS2-3 Siberian deep well clone, AJ583382 6.3MS2-10 Guaymas Basin clone, AF419624 6.3MS2-11 SAGMA-S Mono Lake clone, AY2245466 6.3MS2-34 Contaminated aquifer clone, AY501682 43.8
APSMS2-36 Proteobacteria (gamma) Allochromatium vinosum 1.6MS3-10/MS3-7 Proteobacteria (gamma) Allochromatium vinosum 3.1MS3-24 Proteobacteria (gamma) Allochromatium vinosum 1.6MS3-14 Proteobacteria (gamma) Allochromatium vinosum 1.6MS2-14 Archaea Archaeoglobus fulgidus mouse gut clone, AF196341 1.6MS2-10 mouse gut clone, AF196334 3.1MS2-2 mouse gut clone, AF196334 39.1MS3-4 mouse gut clone, AF196334 9.4MS3-25 mouse gut clone, AF196334 1.6MS3-30 mouse gut clone, AF196334 1.6MS3-41 mouse gut clone, AF196334 1.6MS2-29 mouse gut clone, AF196334 1.6MS3-1 mouse gut clone, AF196334 15.6MS3-37 mouse gut clone, AF196334 1.6MS2-3 mouse gut clone, AF196334 7.8MS3-39 mouse gut clone, AF196334 1.6MS3-11 mouse gut clone, AF196334 1.6MS3-23 mouse gut clone, AF196334 1.6
21
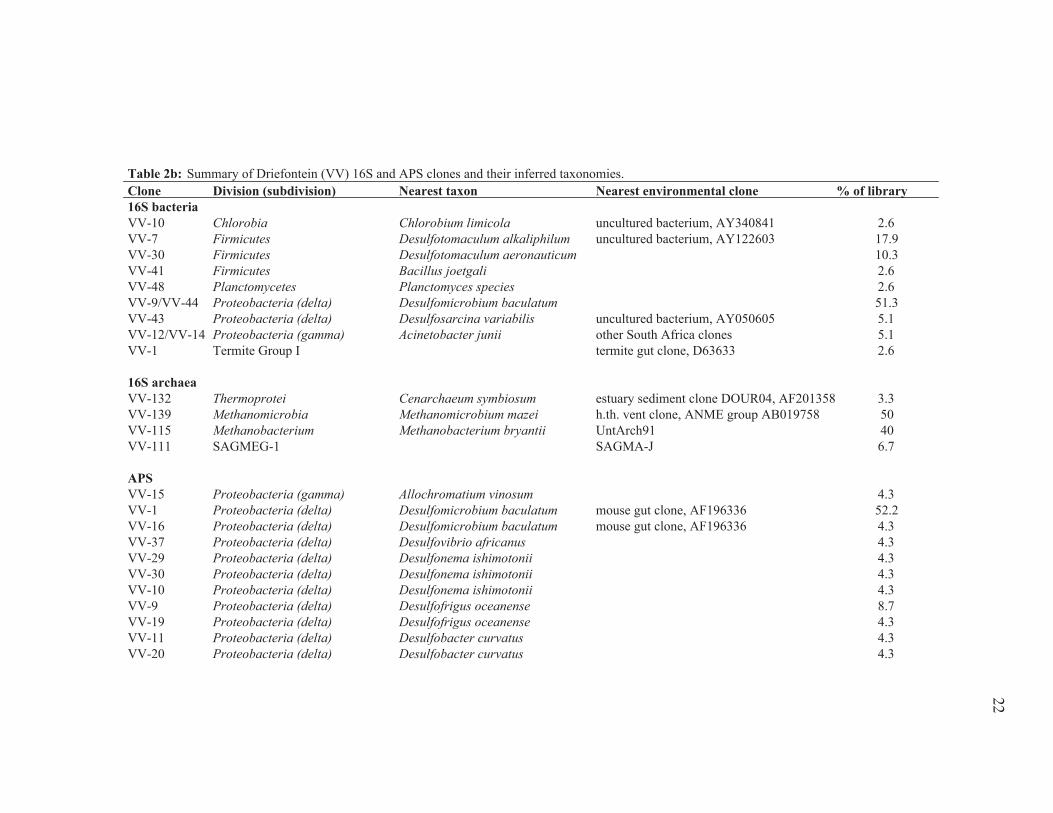
Table 2b: Summary of Driefontein (VV) 16S and APS clones and their inferred taxonomies.Clone Division (subdivision) Nearest taxon Nearest environmental clone % of library16S bacteriaVV-10 Chlorobia Chlorobium limicola uncultured bacterium, AY340841 2.6VV-7 Firmicutes Desulfotomaculum alkaliphilum uncultured bacterium, AY122603 17.9VV-30 Firmicutes Desulfotomaculum aeronauticum 10.3VV-41 Firmicutes Bacillus joetgali 2.6VV-48 Planctomycetes Planctomyces species 2.6VV-9/VV-44 Proteobacteria (delta) Desulfomicrobium baculatum 51.3VV-43 Proteobacteria (delta) Desulfosarcina variabilis uncultured bacterium, AY050605 5.1VV-12/VV-14 Proteobacteria (gamma) Acinetobacter junii other South Africa clones 5.1VV-1 Termite Group I termite gut clone, D63633 2.6
16S archaeaVV-132 Thermoprotei Cenarchaeum symbiosum estuary sediment clone DOUR04, AF201358 3.3VV-139 Methanomicrobia Methanomicrobium mazei h.th. vent clone, ANME group AB019758 50VV-115 Methanobacterium Methanobacterium bryantii UntArch91 40VV-111 SAGMEG-1 SAGMA-J 6.7
APSVV-15 Proteobacteria (gamma) Allochromatium vinosum 4.3VV-1 Proteobacteria (delta) Desulfomicrobium baculatum mouse gut clone, AF196336 52.2VV-16 Proteobacteria (delta) Desulfomicrobium baculatum mouse gut clone, AF196336 4.3VV-37 Proteobacteria (delta) Desulfovibrio africanus 4.3VV-29 Proteobacteria (delta) Desulfonema ishimotonii 4.3VV-30 Proteobacteria (delta) Desulfonema ishimotonii 4.3VV-10 Proteobacteria (delta) Desulfonema ishimotonii 4.3VV-9 Proteobacteria (delta) Desulfofrigus oceanense 8.7VV-19 Proteobacteria (delta) Desulfofrigus oceanense 4.3VV-11 Proteobacteria (delta) Desulfobacter curvatus 4.3VV-20 Proteobacteria (delta) Desulfobacter curvatus 4.3
22

TM7 OP10
Deinococcus-Thermus
Chloroflexi Thermotogae
Thermodesulfobacteria
Aquificae
Cyanobacteria
Actinobacteria OP9
Firmicutes S
piro
chae
tes
Planctomycetes O
P3 Chl
amyd
iae
Ver
ruco
mic
robi
a
Defe
rriba
cteres
Synerg
istes
Fus
obac
teria
TM6 Termite group I
Acidobacteria
Fibrobacteres
Gemmimonas Nitrospira
Chlorobi Bacteroidetes
e Proteobacteria
d Proteobacteria
a, b, g Proteobacteria
Eucarya
FC
G2 K
orar
chae
ota
FC
G1
The
rmop
rotei C
2
YNPF
FA
C1
Sediment-1 Halobacteria pMC2 Methanobacteria
Methanococcales Archaeoglobi
Methanopyrus Thermococci
SAGMEG1 pMC1
Thermoplasmata Methanomicrobia
0.10 nucleotide changes per site
Bacteria
Archaea16S Merriespruit (MS) clones
16S Driefontein (VV) clone
Figure 6a: Distribution of MS (Merriespruit) and VV (Driefontein) 16S rDNA clones within the three domains. Clones are shown as a dot on the tree. Numbers represent the number of sequences from each lineage. Modified from Macalady and Banfield, 2003.
212
5
2
4
1
2
1
1
22
1
1
2
15
12
2
3 UnknownArchaea
23
TM7 OP10
Deinococcus-Thermus
Chloroflexi Thermotogae
Thermodesulfobacteria
Aquificae
Cyanobacteria
Actinobacteria OP9
Firmicutes S
piro
chae
tes
Planctomycetes O
P3 Chl
amyd
iae
Ver
ruco
mic
robi
a
Defe
rriba
cteres
Synerg
istes
Fus
obac
teria
TM6 Termite group I
Acidobacteria
Fibrobacteres Gemmimonas Nitrospira
Chlorobi Bacteroidetes
e Proteobacteria
d Proteobacteria
a, b, g Proteobacteria
Eucarya
FC
G2 K
orar
chae
ota
FC
G1
The
rmop
rotei
C2
YNPF
FA
C1
Sediment-1 Halobacteria pMC2
Methanobacteria Methanococcales
Archaeoglobi Methanopyrus
Thermococci SAGMEG1
pMC1 Thermoplasmata
Methanomicrobia
0.10 nucleotide changes per site
Bacteria
Archaea APS Merriespruit (MS) clones
APS Driefontein (VV) clone
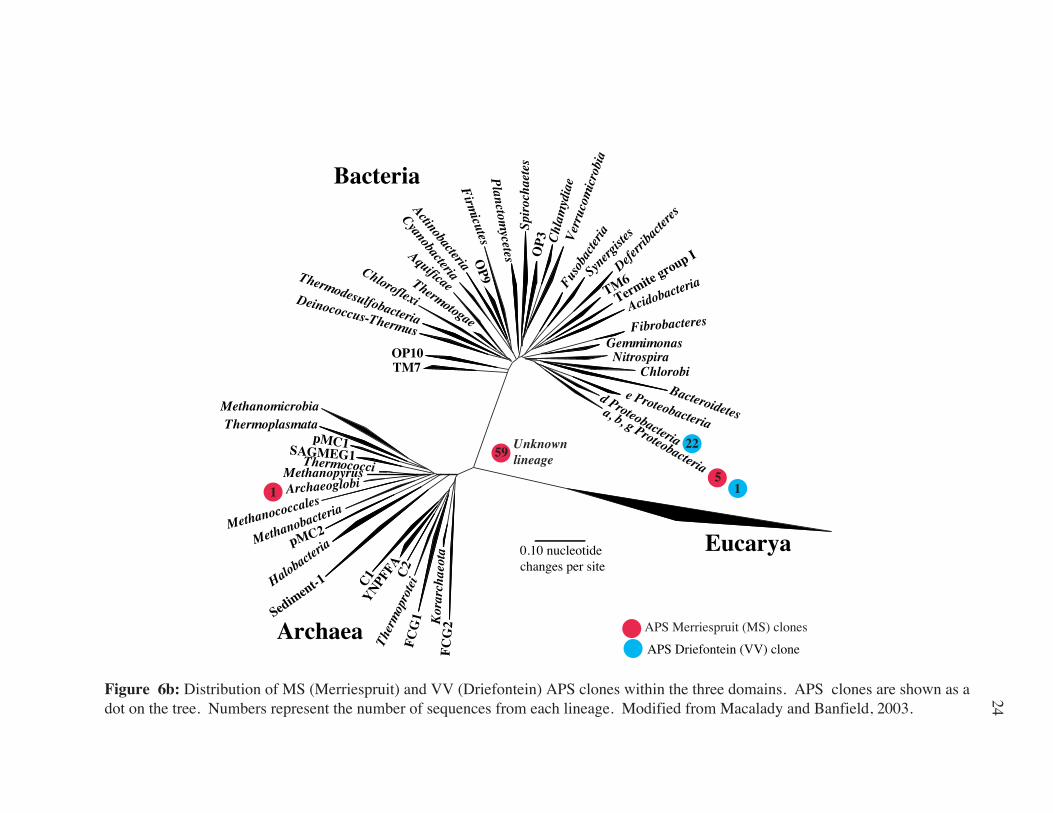
Figure 6b: Distribution of MS (Merriespruit) and VV (Driefontein) APS clones within the three domains. APS clones are shown as a dot on the tree. Numbers represent the number of sequences from each lineage. Modified from Macalady and Banfield, 2003.
51
59 Unknown lineage
1
22
24

Rhodocylus purpureus, M34132P+ sludge clone GC24, AF204243MS3-17
Sterolibacterium denitrificans, AJ306683Thiobacillus baregensis, Y09280Sulfur River Cave clone, AF047619
MS2-2MS2-5
Hydrocarbon seep clone, AF154088Chromatium okenii, Y12376
Thiobacillus sp. DSM612, M79401MS3-19
Acidithiobacillus ferrooxidans, AF460987Acidithiobacillus thiooxidans, Y11596
Geobacter metallireducens, L07834 Desulfomonas species, M80618
Anaerobic clone, AF447133MS3-31
Leptospirillum ferrooxidans strain L15, X86776Magnetobacterium bavaricum, X71838
Yellowstone Nitrospira clone, OPB67AMS2-38
Wetland clone, AF534005Thermodesulfovibrio hveragerdicum, X96725
Aquifex aeolicus, AE309733Lactobacillus fermentum, M58819Bacillus infernus U20384
Mycoplasma capricolum, U26046Clostridium thermolacticum, L09176Anaerobranca bogoriae, AF203703
Mono Lake clone, AF507889uncultured low G+C Gram-positive bacterium, AF507878Mono Lake clone, AF507877
MS2-30Peptococcus niger, X55797
Desulfotomaculum australicum, M6665hydrothermal vent clone VC2.1 Bac47, AF209779
MS2-13Mono Lake clone, AY245489
Methanobacterium thermoautotrophicum, X05482 XMethanobacterium curvum, AF27695850 changes
Figure 7a: Phylogenetic tree based on bacterial16S rDNA nucleotide sequences from Merriespruit (MS) gold mine in South Africa. The tree was constructed by Leah Morgan in MrBayes using an ARB alignment and viewed in PAUP. Tree is rooted with Methanobacteria as an outgroup. Likelihood values are indicated by filled circles (>90%) and open circles (<90%, >60%). No circles indicates <60% bootstrap value.
Archaea
β−proteobacteria
γ−proteobacteria
δ−proteobacteria
Nitrospira
Aquifex
Firmicutes
25

Methanobacterium thermoautotrophicum, X05482 XMethanobacterium curvum, AF276958
MS2-46deep sea sediment clone APA6-17cm, AF119139
MS2-34Contaminated aquifer clone, AY501682
Hydrothermal vent clone, pMC1A4, AB19745Marine sediment clone, BA2F4fin, AF134392
Marine sediment clone, BA1a2, AF134381uncultured archaeon, Guaymas Basin, AF419624MS2-10anoxic lake sediment clone H2-10, Y18077
Green Bay sediment clone, AF293017MS2-3Tomsk-7 Siberia deep well clone, AJ583382
hot spring clone SRI-298, AF255608SAGMA-S, AB050244MS2-11Mono Lake clone, AY245466
SAGMA-G, AB050211SAGMA-F, AB050210
MS2-33Tomsk-7 Siberia deep well clone, AJ583385
Thermodesulfovibrio hveragerdicum, X96725Aquifex aeolicus, AE309733
50 changes
Figure 7b: Phylogenetic tree based on archaeal 16S rDNA nucleotide sequences from Merriespruit (MS) gold mine in South Africa. The tree was constructed by Leah Morgan in MrBayes using an ARB alignment and viewed in PAUP. Tree is rooted with Thermodesulfovibrium and Aquifex as bacterial outgroups. Likelihood values are indicated by filled circles (>90%) and open circles (<90%, >60%). No circles indicates <60% bootstrap value. Likelihood values are as determined by MrBayes.
Methanobacteria
EuryarchaeotaANME group
SAGMEG-1
Bacteria
26

Desulfovibrio termitidis
Desulfovibrio desulfuricans
Desulfomonas pigra
mouse gut clone AF196337
Desulfovibrio berkinensis
aps VV-37
Desulfovibri africanus
Desulfonatronovibrio hydrogenovorans
Desulfom
icrobium baculatum
aps
VV
-D m
ouse
gut
clo
ne, A
F196
336
mou
se g
ut c
lone
, AF1
9633
9 D
esul
fofri
gus o
cean
ense
aps V
V-A
Des
ulfob
acter
postg
atei
Desulfonem
a ishimontonii
Desulfosarcina variabilis
Desulfococcus biatucus
aps VV-B aps VV-C
Thermodesulfovibrio islandicus Thermodesulfobacterium thermophilum
Thermodesulfobacterium hveragerdense
aps MS2-14
mouse gut clone, AF196341,
Archaeoglobus fulgidus
Desulfacinum infernum
Desulfotomaculum ruminis
Desulfotomaculum geothermicum
aps
MS3
-7
aps
MS3
-14
aps
MS-
A
Allo
chro
matiu
m vino
sum
aps V
V-15
aps MS2-36
aps MS-E
aps MS-D
mouse gut clone AF196334 aps MS-C aps MS-B
0.10
delta-proteobacteria
delta-proteobacteriadelta-proteobacteria
Thermodesulfobacteria
Archaea
Firmicutesgamma-proteobacteria
Figure 7c: Phylogenetic tree based on APS gene nucleotide sequences from Merriespruit (MS) and Driefontein (VV) gold mines in South Africa. This unrooted tree was constructed by Tom Gihring using the neighbor joining method in ARB and viewed in PAUP. Bootstrap values are indicated by filled circles (>90%) and open circles (<90%, >60%). No circles indicates <60% bootstrap value. Bootstrap values were calculated by 1000 replicates in neighbor joining.
APS Cluster APS ClonesMS_A MS3-10, MS3-22MS_B MS3-25, MS3-30, MS3-41MS_C MS2-10, MS2-2, MS2-1, MS3-4MS_D MS2-29, MS3-37, MS3-1MS_E MS2-3, MS3-39, MS3-11, MS3-23VV_A VV-11, VV-20VV_B VV-9, VV-19VV_C VV-10, VV-29, VV-30VV_D VV-1, VV-16
27
Burkholderia cepaciaAcinetobacter haemolyticusSouth Africa clone K37Acinetobacter juniiq27f037VV-12VV-14South Africa clone EE18
Acinetobacter calcoaceticusSphingomonas paucimobilisCampylobacter jejuni
Chlorobium limicolaChlorobium vibrioforme
uncultured bacterium, AY340841VV-10
Desulfosarcina variabilisuncultured bacterium, AF296213uncultured bacterium, AY050605
VV-43Geobacter sulfurreducensDesulfomicrobium baculatum, M37311 Desulfomicrobium baculatum, AF030438
VV-44VV-9
Desulfonatronovibrio hydrogenovoranstermite gut clone UN79, D63633
termite gut clone TG14, AB004576VV-1
rumen clone 4C0d3, AB034017Tomsk-7 clone, AJ583207
uncultured Termite group 1 bacterium, AY133074Thermodesulfobacterium hveragerdicum
Lactobacillus fermentumBacillus fastidiosus
Bacillus joetgaliVV-41uncultured Bacillus sp., AY082367Mycoplasma capricolum, U26046
Clostridium thermolacticumPeptococcus niger
Desulfotomaculum aeronauticumVV-30
Desulfotomaculum alkaliphilumuncultured bacterium, AF486685South Africa clone F91South Africa clone C59South Africa clone Z1South Africa clone Y1South Africa clone FF1uncultured bacterium, AY122603VV-7
Coprothermobacter platensisPlanctomyces limnophilus
Planctomyces marisPlanctomyces sp.
VV-48Methanobacterium thermoautotrophicum
Cenarchaeum symbiosum
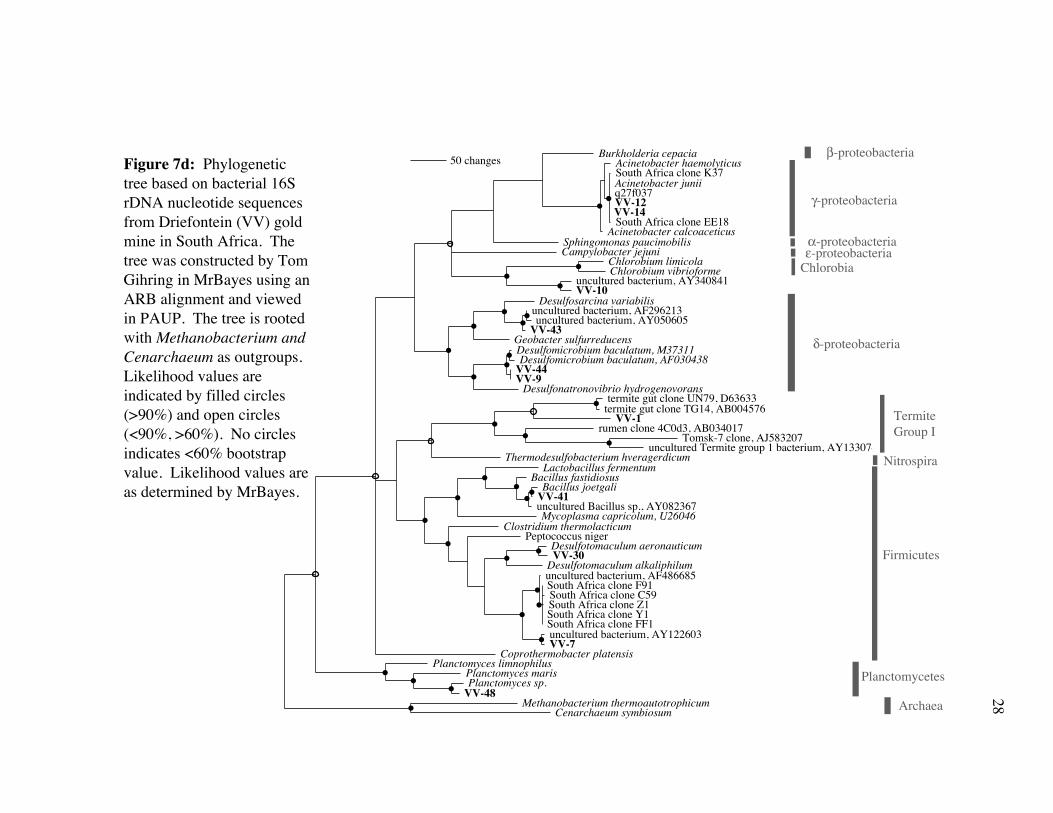
50 changesFigure 7d: Phylogenetic tree based on bacterial 16S rDNA nucleotide sequences from Driefontein (VV) gold mine in South Africa. The tree was constructed by Tom Gihring in MrBayes using an ARB alignment and viewed in PAUP. The tree is rooted with Methanobacterium and Cenarchaeum as outgroups. Likelihood values are indicated by filled circles (>90%) and open circles (<90%, >60%). No circles indicates <60% bootstrap value. Likelihood values are as determined by MrBayes.
β-proteobacteria
γ-proteobacteria
ε-proteobacteria
δ-proteobacteria
Chlorobia
Termite Group I
Nitrospira
Firmicutes
Planctomycetes
Archaea
α-proteobacteria
28

Plactomyces limnophilusCoprothermobacter platensis
Methanomicrobium mobileMethanosarcina mazei
hydrothermal vent clone, AB019758
VV-139uncultured archaeon, AF134392
anaerobic methane-oxidizing archaeon (ANME), AY324378uncultured archaeon, AF134381
Methanobacterium thermoautotrophicumMethanobacterium bryantii
SAGMA-K, AB050216VV-115SAGMA-Q
SAGMA-ISAGMA-J
VV-111"Cenarchaeum symbiosum"
estuary sediment clone DOUR04, AF201358uncultured crenarchaeum, UntCrena
VV-132SAGMA-8
SAGMA-A
50 changes
Figure 7e: Phylogenetic tree based on archaeal 16S rDNA nucleotide sequences from Driefontein (VV) gold mine in South Africa. The tree was constructed by Tom Gihring in MrBayes using an ARB alignment and viewed in PAUP. Likelihood values are indicated by filled circles (>90%) and open circles (<90%, >60%). No circles indicates <60% bootstrap value. Likelihood values are as determined by MrBayes.
anaerobic methane-oxidizing archaeon (ANME), AB019758
Methanomicrobia
Euryarchaeota
Crenarchaeota
Bacteria
29

30
represented. Over 40% of the Archaeal clone library consisted of clones identical to MS2-
34 and matched closely to a clone from a contaminated aquifer; an additional 31% were
most closely related to Methanobacterium curvum. Merriespruit APS gene sequences
(Table 2a; Fig. 7c) resembled those from SOP (Allochromatium vinosum), and one
Archaeal SRP (Archaeoglobus fulgidis). Fifty percent of APS gene clones from the
Merriespruit sample matched closely with a sequence isolated from the mouse
gastrointestinal tract and did not match closely with any known APS gene sequence from an
isolated organism (Fig. 7a).
Driefontein 16S rDNA clones (Table 2b; Fig. 7d,e) were closely related to SRP
(Desulfotomaculum, Desulfomicrobium, Desulfosarcina), a heterotroph (Bacillus joetgali),
methane producers (Methanomicrobium, Methanobacterium), an obligately anaerobic
photosynthesizer (Chlorobium limicola), a symbiont (Cenarchaeum symbiosum), and
Planctomycetes. Fifty percent of clones in the Archaeal library were closely related to a
methane-oxidizing Archaea (Methanomicrobium mazei) and are likely within the ANME
(ANaerobic MEthanotroph) clone group of anaerobic methane-oxidizing archaea which live
symbiotically with sulfate-reducing bacteria. One sequence fit within the Termite Group I
lineage. Driefontein APS sequences (Table 2b; Fig. 7c) were closely related to SRP
(Desulfomicrobium, Desulfovibrio, Desulfonema, Desulfofrigus, Desulfobacter) and one
SOP (Allochromatium vinosum). Over 50% of clones from both bacterial and APS
libraries (Table 2b; Fig. 7c,d) match closely with Desulfomicrobium baculatum.
The only environmental clones closely matching APS gene sequences from either
site were from SRP in the mouse gastrointestinal tract, sequenced by Deplancke, et al.
(2000), who designed the APS primers used in this study (Table 2; Fig. 7a).
Alternate treeing algorithms were used for each clone library to assess the reliability
of the alignments and trees. All trees showed relatively good congruence with different
algorithms and are shown in Fig. A1 (Appendix 1).

31
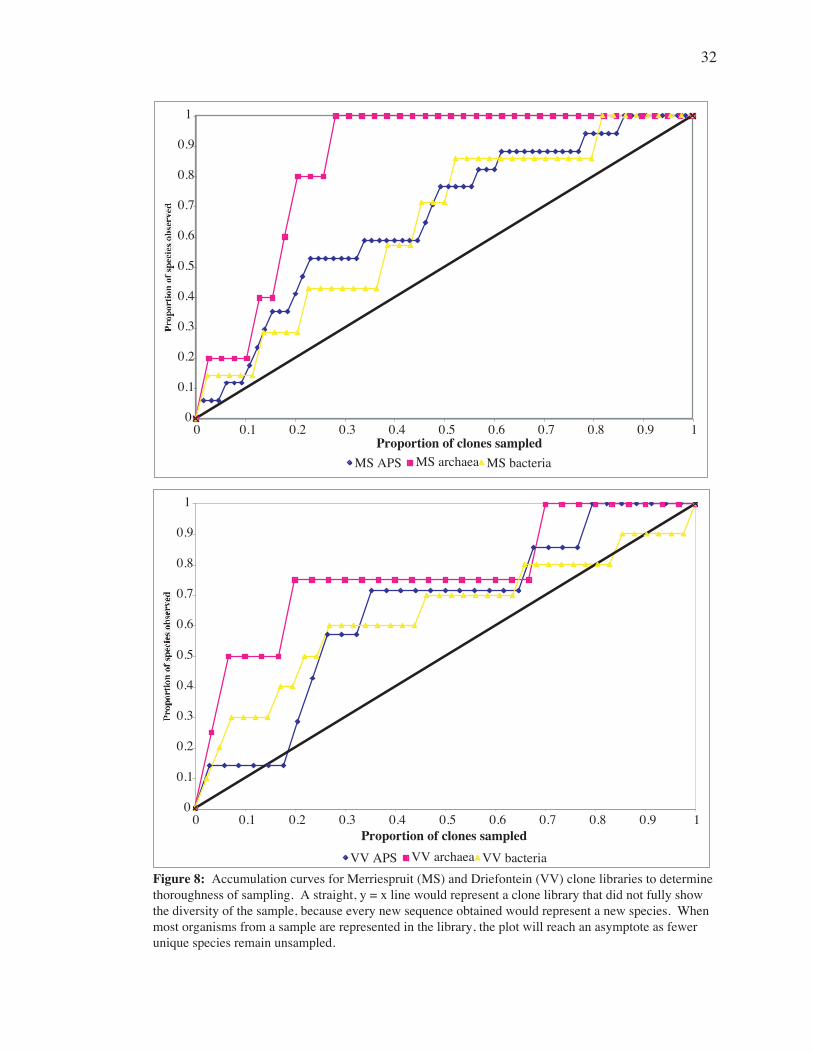
Accumulation curves (Fig. 8) for Merriespruit and Driefontein showed
thoroughness of sampling and how completely the sequences obtained in this study
represent the diversity of the microbial community. The proportion of species observed
generally increases faster than the proportion of clones sampled for all clone libraries but
only the archaeal libraries reach an asymptote.
Geochemistry
Geochemical data are summarized in Table 3. These data indicated the presence of
both sulfate and sulfide at Merriespruit and Driefontein, although at higher concentrations
in the Driefontein borehole. A low O2 concentration was found in the Merriespruit
borehole while O2 was not detected in the Driefontein borehole. Acetate (C2H3O2-) was
found at low levels in both boreholes. Nitrate (NO3) was also present in both samples, and
ammonia (NH3) was detected in Merriespruit. Merriespruit displayed higher values than
Driefontein for all aqueous ions except sulfide (HS-), sulfate (SO42-), nitrate (NO3),
ammonia (NH3), magnesium (Mg), and silica (Si). Gas chemistry for Driefontein indicated
the presence of hydrogen (H2), carbon dioxide (CO2), and methane (CH4) in fissure water.
Discussion
Genetic signatures
Phylogenetic analyses show two distinct genetic signatures in the Merriespruit (MS)
and Driefontein (VV) boreholes. Although 16S rDNA data (Table 2; Fig. 7a,b,d,e) suggest
that microorganisms with various metabolic pathways are present, this study focuses on
biological sulfur cycling and will not address other pathways in detail. Sequences from
both MS and VV samples that show close relation to SRP or SOP are likely from
organisms with the ability to reduce or oxidize sulfur compounds, respectively (Table 2;
Fig. 7). As mentioned previously, APS gene sequences are more reliable than 16S rDNA
sequences for identifying the presence of microorganisms with metabolic pathways of the
0
0.1
0.2
0.3
0.4
0.5
0.6
0.7
0.8
0.9
1
0 0.1 0.2 0.3 0.4 0.5 0.6 0.7 0.8 0.9 1
Proportion of species observed
0
0.1
0.2
0.3
0.4
0.5
0.6
0.7
0.8
0.9
1
0 0.1 0.2 0.3 0.4 0.5 0.6 0.7 0.8 0.9 1
Proportion of species observed
VV APS VV archaea VV bacteria
Proportion of clones sampled
MS APS MS archaea MS bacteriaProportion of clones sampled
Figure 8: Accumulation curves for Merriespruit (MS) and Driefontein (VV) clone libraries to determine thoroughness of sampling. A straight, y = x line would represent a clone library that did not fully show the diversity of the sample, because every new sequence obtained would represent a new species. When most organisms from a sample are represented in the library, the plot will reach an asymptote as fewer unique species remain unsampled.
32

Merriespruit Driefonteindepth (km) 1.998 0.896
lithology quartzite dolomiteToC 36.3 26pH 7.76 8
Eh (mV) -294 -176O2 1.5 --Cl 1433 35.19Br 9.3 0.31
SO4 6.13 35.41HS- 2.5 40.71
S 4.19 --S2O3
-- -- 0.005NO3 0.01 0.35NH3 0.35 --NO2 <d.l. --
acetate 0.14 0.09Al 0.027 --As 0.015 0.032Ba 0.52 0.054Ca 188 36.5Cu 0.014 0.011Fe 0.035 0.013K 21.7 1.21Li 0.99 0.021
Mg 2.32 5.73Mn 0.072 0.005Na 1340 26.2Si 7.8 10Sr 6.18 0.355U 0.022 0.012
Zn 0.183 --CH4 (g) -- 208.81CO2 (g) -- 277.33CO (g) -- 0.52H2 (g) -- 1.89
Detection limit (ppm)Na 0.10K 0.50Mg 0.05Ca 0.05Fe 0.05S 1.00Li 5.00Sr 0.05Ba 0.05Al 0.10Si 0.10Mn 0.05Cu 0.05Zn 0.05As 0.10U 0.10
a.)
b.)
Table 3: (a) Geochemical data from Merriespruit and Driefontein boreholes. Unless otherwise indicated, all aqueous values in ppm, gas values in uM. <d.l. = below detection limit. -- = no data. (b) Detection limits for geochemical species.
33

34
sulfur cycle. While potential SRP were detected in both borehole samples, only the
Merriespruit sample analyses suggested the presence of SOP. Driefontein APS gene clone
VV-15 is an exception, as it appears closely related to the SOP Allochromatium vinosum.
Regardless, 16S rDNA and APS sequences indicate that the Merriespruit borehole has a
greater diversity of SOP, while the Driefontein borehole has a greater diversity of SRB
(Table 2).
The nearest taxon to 16S rDNA clone VV-10 was the phototroph Chlorobium
limicola (Fig. 7e; Table 2b). However, these species may have very different physiologies
because no light is available for photosynthesis in the fissure and groundwater environment,
and the phylogenetic distance between VV-10 and Chlorobium (Fig. 7d) is rather high.
Several APS gene sequences from Merriespruit (MS clones 2-36, 3-7, 3-10, 3-14, 3-24)
were most closely related to the APS gene sequence from the sulfur-oxidizing phototroph
Allochromatium vinosum (Table 2a; Fig. 7c). However, the APS gene developed and
diverged into oxidative and reductive forms prior to the development of the photosynthetic
pathway (Hipp et al., 1997). The APS gene sequences detected in the Merriespruit sample
are therefore likely grouped with Allochromatium vinosum due to its capacity as a sulfur-
oxidizer rather than as a phototroph. The cluster of Merriespruit clones that show no close
relation to an APS sequence from a cultured organism (Table 2a; Fig. 7c) is closely related
to a sequence isolated from the mouse gastrointestinal tract (Deplancke et al., 2000). It is
unclear whether these gene sequences are from an oxidative or reductive pathway.
Driefontein Archaeal clone VV-139 is likely from the anaerobic methanotroph
ANME group (Fig. 7e). All known organisms in this group are believed to be anaerobic
methane-oxidizing Archaea that live symbiotically with SRP such as Desulfosarcina
variabilis (Orphan et al., 2001), which is also likely present in the Driefontein sample (Fig.
7d). These organisms perform a reaction which is energetically unfavorable in the absence
of H2-consuming symbionts. However, Orphan, et.al. (2001) have shown that
methanotrophs within the ANME group live in close proximity to SRP, which use H2 to

35
reduce SO4, allowing for continued anaerobic CH4 oxidation. Evidence for this symbiotic
relationship has been detected in seep sediments of the Eel River and Santa Barbara Basins
(Orphan et al., 2001). Current data presented in this thesis (Fig. 7d,e) suggest that these
processes may also be occurring in the subsurface of the Witwatersrand Basin.
Previous work by Baker et al. (2003) using dsr gene sequencing strongly suggests
the presence of SRP from the Firmicutes lineage in the South African deep subsurface
fissure water environment. These sequences were closely related to dsr sequences from
Desulfotomaculum species, which have the ability to form spores to protect them from
extreme or inhospitable conditions. To date, Desulfotomaculum is the most common SRP
found in the South African deep subsurface and is the only SRP present in many fissure
water samples (Gihring, 2004). Their ability to produce spores likely aided
Desulfotomaculum in becoming widespread in the deep subsurface. The Driefontein
sample used in this study, which was obtained from a dolomite aquifer with a residence time
of ~13 kyr rather than fissure water with a residence time of 1-123 My, shows much higher
diversity of SRP, including d-Proteobacteria along with the more common Firmicutes. The
relatively short residence time may explain why d-Proteobacteria and other non-spore
forming SRP could survive in the groundwater at Driefontein but could not reach the deeper
depths and longer residence times of fissure waters.
Accumulation plots (Fig. 8) indicate that the MS and VV Archaeal clone libraries are
well-sampled and likely represent a high percentage of Archaeal diversity in the boreholes.
Plots for bacterial and APS libraries do not reach an asymptote, indicating that these
libraries are not as comprehensive. These libraries thus contain only a portion of the total
diversity of the sample. Several caveats must be considered in the interpretation of genetic
data collected from environmental clone libraries. Under some conditions, PCR can amplify
some sequences more frequently than others (Poltz and Cavanaugh, 1998). Chimeras and
copying errors during PCR can modify sequences (Speksnijder et al., 2001). The error rate
for the ExTaq DNA polymerase used in this study is 1 error/4000 bases, which can create a

36
slight apparent increase in the diversity of closely related sequences but likely does not
affects data presented here. Sequences in this study were searched carefully for chimeras;
mutations introduced during PCR would be undetectable but create only minute changes.
Additionally, microorganisms may persist for long periods of time (potentially hundreds of
millions of years) in a dormant state, where metabolic and reproductive cycles slow nearly to
a halt. Therefore, the molecular evidence presented in this study can only confirm the
presence of APS genes in microbial communities of the subsurface. Further work using
reverse-transcriptase PCR could detect APS gene expression.
Geochemistry
The presence of sulfide (HS-) and sulfate (SO42-) in both samples (Table 3)
generally supports the possibility of modern sulfur cycling in the fissure water. The
presence of methane (CH4) and carbon dioxide (CO2) gases are consistent with the possible
occurrence of anaerobic methanotrophs in Driefontein. Oxygen (O2) in the Merriespruit
fissure water suggests contamination of the borehole by mine air.
In considering a gene such as APS that is used in both oxidative and reductive
pathways, a critical factor becomes the identification of potential electron donors and
acceptors. The oxidative sulfur pathway which is likely to be prevalent in the Merriespruit
sample requires the synchronous reduction of an electron acceptor. Oxygen was detected in
this environment and is likely functioning as an electron acceptor. Therefore, the sulfur-
oxidizing community is probably not native to the fissure water, but rather was introduced
by mining activities. This contamination is apparent in molecular evidence for SOP in
Merriespruit (Table 2a; Fig. 7b,c), which would likely not be present in an indigenous
anaerobic community (Onstott et al., 2003). An alternative electron acceptor involves the
reduction of NO3 to NH3 or other reduced nitrogen compounds coupled to the oxidation of
sulfide to sulfate.

37
An electron donor must be present in order for a sulfate reduction pathway to be
currently active in the Driefontein environment. Potential electron donors for sulfate
reduction include simple compounds such as organic acids, which are products of the
anaerobic degradation of organic compounds by fermentation (Madigan et al., 2003).
Hydrogen (H2) is also very likely to be used as an electron donor. Both H2 and acetate
(C2H3O2-) were present at both Merriespruit and Driefontein sites and are potential electron
sources for sulfur cycling. The geochemistry of Merriespruit and Driefontein samples is
consistent with and provides potential electron donors and acceptors for microbially-
mediated sulfur cycling in the subsurface.
Conclusion
DNA sequencing and phylogenetic analyses of APS and 16S rRNA genes from the
Witwatersrand Basin provide molecular evidence for microbial sulfur cycling in the deep
subsurface. This evidence is consistent with geochemical data and indicates that sulfur
cycling may be currently active in the deep subsurface. Evidence for indigenous sulfate
reduction was detected in both the Merriespruit fissure water and Driefontein groundwater
samples. Evidence for sulfur oxidation was found in the Merriespruit mine fissure water,
likely a result of mining contamination. Sequences closely related to ANME-group
methanotrophs were found in the Driefontein sample along with the potential ANME
symbiont Desulfosarcina variabilis, suggesting that anaerobic methane oxidation may be
occurring in the deepest regions of the dolomite aquifer. Evidence for sulfate-reducing
prokaryotes from the d-Proteobacterial lineage from the Driefontein dolomite aquifer
greatly increase the known diversity of subsurface sulfate-reducing prokaryotes.

38
Acknowledgements
This research was supported by grants from the National Science Foundation REU
program (0244130) to Dr. S.M. Pfiffner of the University of Tennessee and the LExEn
program (EAR-9714214) to Dr. T.C. Onstott of Princeton University. Further support was
provided by the Charles W. Potts Endowment Fund for student-faculty research in geology
at Carleton and the Environmental Microbiology Group at Pacific Northwest National
Laboratory in Richland, Washington. I gratefully acknowledge Gold Fields Ltd.'s Beatrix
Gold Mine, Harmony's Merrispruit Mine, Driefontein Consolidated Ltd.’s West
Driefontein Mine, and Anglo Gold's Tau Tona Mine for access to their gold mines and their
logistical support. I am grateful to Dr. Esta vanHeerden and others at the Department of
Microbial, Biochemical and Food Biotechnology of University of the Free State.
Special thanks go to Jenn Macalady and Tom Gihring for their endless advice and
encouragement; Elsabe Botes and Drs. Bethuel Nthangeni, Susan Pfiffner, T.C. Onstott and
Tom Kieft for their work during and after the REU; the South African and American
participants in the REU program for putting up with a geologist trying to do biology; Duane
Moser and Dave Cully for their help at PNL; Mike Dollhopf and David Balkwill for
sequencing my clones; Mark Davidson for his help with lineage plots; Dave Auerbach for
editing my drafts and listening to my crazy ideas; Ezra Lyon for his vast knowledge of all
things biological; and my friends and family for their support throughout this project.
References cited
Altschul, S. F., Madden, T. L., Schaffer, A. A., Zhang, J., Zhang, Z., Miller, W., and Lipman,D. J., 1997, Gapped BLAST and PSA-BLAST: a new generation of proteindatabase search program., Nucleic Acids Research, p. 3389-3402.
Baker, B. J., Moser, D. P., MacGregor, B. J., Fishbain, S., Wagner, M., Fry, N. K., Jackson,B., Speolstra, N., Loos, S., Takai, K., Lollar, B. S., Fredrickson, J., Balkwill, D.,Onstott, T. C., Wimpee, C. F., and Stahl, D. A., 2003, Related assemblages ofsulphate-reducing bacteria associated with ultradeep gold mines of South Africa anddeep basalt aquifers of Washington State: Environmental Microbiology, v. 5, no. 4,p. 267-277.
Braker, G., Ayala-del-Rio, H. L., Devol, A. H., Fesefeldt, A., and Tiedje, J. M., 2001,Community structure of denitrifiers, Bacteria, and Archaea along redox gradients inpacific northwest marine sediments by terminal restriction fragment length

39
polymorphism analysis of amplified nitrite reductase (nirS) and 16S rRNA genes:Applied and Environmental Microbiology, v. 67, no. 4, p. 1893-1901.
Canfield, D. E., Habicht, K. S., and Thamdrup, B., 2000, The Archean Sulfur Cycle and theEarly History of Atmospheric Oxygen: Science, v. 288, p. 658-661.
Cole, J., Chai, B., Marsh, T., Farris, R., Wang, Q., Kulam, S., Chandra, S., McGarrell, D.,Schmidt, T., Garrity, G., and Tiedje, J., 2003, The Ribosomal Database Project(RDP-II): previewing a new autoaligner that allows regular updates and the newprokaryotic taxonomy.: Nucleic Acids Research, v. 31, no. 1, p. 442-3.
Deplancke, B., Hristova, K. R., Oakley, H. A., McCracken, V. J., Aminov, R., Mackie, R. I.,and Gaskins, H. R., 2000, Molecular ecological analysis of the succession anddiversity of sulfate-reducing bacteria in the mouse gastrointestinal tract: Applied andEnvironmental Microbiology, v. 66, no. 5, p. 2166-2174.
Dhillon, A., Teske, A., Dillon, J., Stahl, D. A., and Sogin, M. L., 2003, Molecularcharacterization of sulfate-reducing bacteria in the Guaymas Basin: Applied andEnvironmental Microbiology, v. 69, no. 5, p. 2765-2772.
Drennan, G. R., Boiron, M. C., Cathelineau, M., and Robb, L. J., 1999, Characteristics ofpost-depositional fluids in the Witwatersrand Basin: Mineralogy and Petrology, v.66, p. 83-109.
Friedrich, C. G., 1998, Physiology and Genetics of Sulfur-oxidizing Bacteria, in Poole, R.K., ed., Advances in Microbial Physiology: San Diego, Academic Press.
Friedrich, M., 2002, Phylogenetic Analysis Reveals Multiple Lateral Transfers ofAdenosine-5'-Phosphosulfate Reductase Genes among Sulfate-ReducingMicroorganisms: Journal of Bacteriology, v. 184, no. 1, p. 278-289.
Gihring, T. M., 2004, personal communication.Hall, B. G., 2001a, Phylogenetic Trees Made Easy: A How-To Manual for Molecular
Biologists: Sunderland, MA, Sinauer Associates.Hall, T., 2001b, BioEdit: Raleigh, NC, Department of Microbiology, NCSU.Hipp, W. M., Pott, A. S., ThumSchmitz, N., Faath, I., Dahl, C., and Truper, H. G., 1997,
Towards the phylogeny of APS reductases and sirohaem sulfite reductases insulfate-reducing and sulfur-oxidizing prokaryotes: Microbiology-Uk, v. 143, p.2891-2902.
Huber, T., Faulkner, G., and Hugenholtz, P., 2004, Bellerophon; a program to detectchimeric sequences in multiple sequence alignments: Bioinformatics.
Huelsenbeck, J. P., 2000, MrBayes: Bayesian Inferences of Phylogeny: NY, University ofRochester.
Hugenholtz, P., 2002, Exploring prokaryotic diversity in the genomic era - Review: GenomeBiology, v. 3, no. 2.
Lane, D. J., 1991, 16S/23S rRNA Sequencing, in Stackebrandt, E., and Goodfellow, M.,eds., Nucleic Acid Techniques in Bacterial Systematics: Hoboken, NJ, John Wileyand Sons.
Lane, D. J., Pace, B., Olsen, G. J., Stahl, D. A., Sogin, M. L., and Pace, N. R., 1985, RapidDetermination of 16S Ribosomal RNA Sequences for Phylogenetic Analyses:Proceedings of the National Academy of Sciences of the United States of America,v. 82, no. 20, p. 6955-6959.
Lippmann, J., Stute, M., Torgersen, T., Moser, D. P., Hall, J. A., Lin, L., Borcsik, M.,Bellamy, R. E. S., and Onstott, T. C., 2003, Dating ultra-deep mine waters withnoble gases and Cl-36, Witwatersrand Basin, South Africa: Geochimica EtCosmochimica Acta, v. 67, no. 23, p. 4597-4619.
Ludwig, W., Strunk, O., Westram, R., Richter, L., Meier, H., Yadhukumar, Buchner, A., Lai,T., Steppi, S., Jobb, G., Förster, W., Brettske, I., Gerber, S., Ginhart, A. W., Gross,O., Grumann, S., Hermann, S., Jost, R., König, A., Liss, T., Lüßmann, R., May, M.,Nonhoff, B., Reichel, B., Strehlow, R., Stamatakis, A. P., Stuckmann, N., Vilbig, A.,Lenke, M., Ludwig, T., Bode, A., and Schleifer, K.-H., 2002, ARB: a softwareenvironment for sequence data, submitted to Nucleic Acids Research.

40
Macalady, J., and Banfield, J. F., 2003, Molecular geomicrobiology: genes and geochemicalcycling: Earth and Planetary Science Letters, v. 209, no. 2003, p. 1-17.
Madigan, M. T., Martinko, J. M., and Parker, J., 2003, Brock Biology of Microorganisms:Upper Saddle River, NJ, Prentice Hall.
Moser, D. P., Onstott, T. C., Fredrickson, J. K., Brockman, F. J., Balkwill, D. L., Drake, G.R., Pfiffner, S. M., and White, D. C., 2003, Temporal Shifts in the Geochemistryand Microbial Community Structure of an Ultradeep Mine Borehole FollowingIsolation: Geomicrobiology Journal, v. 20, p. 517-548.
Moyer, C. L., Tiedje, J. M., Dobbs, F. C., and Karl, D. M., 1998, Diversity of deep-seahydrothermal vent Archaea from Loihi Seamount, Hawaii: Deep Sea Research PartII: Topical Studies in Oceanography, v. 45, no. 1-3, p. 303-317.
Omar, G. I., Onstott, T. C., and Hoek, J., 2003, The origin of deep subsurface microbialcommunities in the Witwatersrand Basin, South Africa as deduced from apatitefission track analyses: Geofluids, v. 3, p. 69-80.
Onstott, T. C., 2004a, personal communication.-, 2004b, unpublished.Onstott, T. C., Moser, D. P., Pfiffner, S. M., Fredrickson, J. K., Brockman, F. J., Phelps, T.
J., White, D. C., Peacock, A., Balkwill, D., Hoover, R., Krumholtz, L. R., Borcsik,M., Kieft, T. L., and Wilson, R., 2003, Indigenous and contaminant microbes inultradeep mines: Environmental Microbiology, v. 5, no. 11, p. 1168-1191.
Orphan, V. J., Hinrichs, K.-U., Ussler III, W., Paull, C. K., Taylor, L. T., Sylva, S. P.,Hayes, J. M., and DeLong, E. F., 2001, Comparitive Analysis of Methane-OxidizingArchaea and Sulfate-Reducing Bacteria in Anoxic Marine Sediments: Applied andEnvironmental Microbiology, v. 67, no. 4, p. 1922-1934.
Pace, N. R., 1997, A molecular view of microbial diversity and the biosphere: Science, v.276, no. 5313, p. 734-740.
Poltz, M. F., and Cavanaugh, C. M., 1998, Bias in template-to-product ratios inmultitemplate PCR: Applied and Environmental Microbiology, v. 64, no. 10, p.3724-3730.
Reysenbach, A. L., Longnecker, K., and Kirshtein, J., 2000, Novel bacterial and archaeallineages from an in situ growth chamber deployed at a Mid-Atlantic Ridgehydrothermal vent: Applied and Environmental Microbiology, v. 66, no. 9, p. 3798-3806.
Speksnijder, A., Kowalchuk, G. A., De Jong, S., Kline, E., Stephen, J. R., and Laanbroek, H.J., 2001, Microvariation artifacts introduced by PCR and cloning of closely related16S rRNA gene sequences: Applied and Environmental Microbiology, v. 67, no. 1,p. 469-472.
Takai, K., Moser, D. P., DeFlaun, M., Onstott, T. C., and Fredrickson, J. K., 2001, Archaealdiversity in waters from deep South African gold mines: Applied and EnvironmentalMicrobiology, v. 67, no. 12, p. 5750-5760.
Teske, A., Dhillon, A., and Sogin, M. L., 2003, Genomic markers of ancient anaerobicmicrobial pathways: Sulfate reduction, methanogenesis, and methane oxidation: TheBiological Bulletin, v. 204, no. 2, p. 186.
Thompson, J. D., Gibson, T. J., Plewniak, F., Jeanmougin, F., and Higgins, D., 1997, TheClustalX-Windows interface: Flexible strategies for multiple alignment aided byquality analysis tools.: Nucleic Acids Research, v. 25, p. 4876-4882.
Viljoen, M. J., and Reimold, W. U., 2002, An Introduction to South Africa's Geological andMining Heritage: Randburg, South Africa, MINTEK, in association with theGeological Society of South Africa.
Wagner, M., Roger, A. J., Flax, J. L., Brusseau, G. A., and Stahl, D. A., 1998, Phylogeny ofdissimilatory sulfite reductases supports an early origin of sulfate respiration:Journal of Bacteriology, v. 180, no. 11, p. 2975.

Rhodocylus purpureus, M34132 P+ sludge clone GC24, AF204243MS3-17
Sterolibacterium denitrificans, AJ306683Thiobacillus baregensis, Y09280
Sulfur River Cave Clone, AF047619MS2-2MS2-5Hydrocarbon seep clone, AF154088
Chromatium okensis, Y12376Thiobacillus sp. DSM612, M79401MS3-19Acidithiobacillus thiooxidans, Y11596Acidithiobacillus ferrooxidans, AF460987
Geobacter metallireducens, L07834Desulfomonos species, M80618
MS3-31anaerobic clone, AF447133
Lactobacillus fermentum, M58819Bacillus infernus, U20384
Mycoplasma capricolum, U26046Clostridium thermolacticum, L09176
Mono Lake clone, AF507889uncultured low G+C bacterium, AF507878Mono Lake clone, AF507877
MS2-30Anaerobranca bogoriae, AF203703
Desulfotomaculum australicumPetrococcus nigerhydroth. vent clone VC2.1, AF209779MS2-13
Mono Lake ANME clone, AY245489Leptospirillum ferrooxidans L15, X86776
Magnetobacterium bavaricum, X71838Yellowstone Nitrospira clone, OPB67A
MS2-38Wetland clone, AF524005
Thermodesulfovibrio hveragerdicum, X96725Aquifex aeolicus, AE309733
Methanobacterium thermoautotrophicum, X05482Methanobacterium curvum, AF276958
0.05 substitutions/site
Figure A1a: Phylogenetic tree based on bacterial 16S nucleotide sequences from Merriespruit (MS) gold mine in South Africa. The tree was constructed by Leah Morgan in PAUP using neighbor joining and rooted with Methanobacteria as an outgroup.
Appendix 1
41

Methanobacterium thermoauthotrophicum, X05482Methanobacterium curvum, AF276958
MS2-46marine sediment clone BA2F4fin, AF134392
marine sediment clone BA1a2, AF134381uncultured archaeon, Guaymas Basin, AF419624
MS2-10anoxic lake sediments clone H210, Y18077
Green Bay sediment clone, AF293017MS2-3Tomsk-7 Siberian deep well clone, AJ583382
hot spring clone SRIa298, AF255608SAGMA-S
MS2-11Mono lake clone, AY245466
SAGMA-GSAGMA-F
MS2-33Tomsk-7 Siberian deep well clone, AJ583385
deep sea sediment clone APA6a17cm, AF119139Hydrothermal vent clone pMC1A4, AB19745
MS2-34contaminated aquifer clone, AY501682
Thermodesulfovibrio hveragerdicum, X96725Aquifex aeolicus, AE309733
50 changes
Figure A1b: Phylogenetic tree based on archaeal 16S nucleotide sequences from Merriespruit (MS) gold mine in South Africa. The tree was constructed by Tom Gihring in ARB using maximum likelihood and rooted with Thermodesulfovibrio and Aquifex as bacterial outgroups.
42
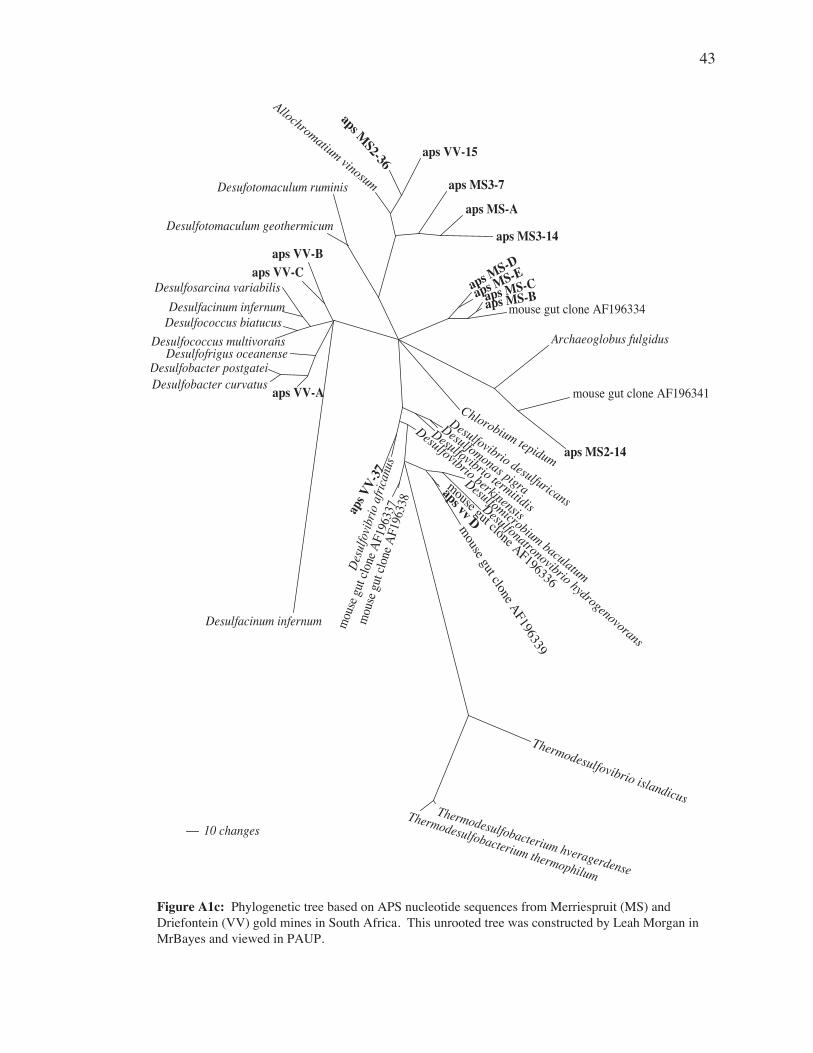
Desulfovibrio desulfuricans
Desulfomonas pigra
Desulfovibrio termitidis
Desulfovibrio berkinensis
Desulfomicrobium baculatum
Desulfonatronovibrio hydrogenovorans
aps vv D
mouse gut clone AF196336
mouse gut clone AF196339
Thermodesulfovibrio islandicusThermodesulfobacterium hveragerdense
Thermodesulfobacterium thermophilum
mou
se gu
t clo
ne A
F196
338
mou
se gu
t clo
ne A
F196
337
Desu
lfovib
rio a
frica
nus
aps V
V-37
Desulfacinum infernum
aps VV-ADesulfobacter curvatusDesulfobacter postgatei
Desulfofrigus oceanenseDesulfococcus multivorans
Desulfococcus biatucusDesulfacinum infernum
Desulfosarcina variabilisaps VV-C
aps VV-B
Desulfotomaculum geothermicum
Desufotomaculum ruminis
Allochromatium vinosum
aps MS2-36
aps VV-15
aps MS3-7
aps MS-A
aps MS3-14
aps MS-D
aps MS-Eaps MS-Caps MS-B
mouse gut clone AF196334
Archaeoglobus fulgidus
mouse gut clone AF196341
aps MS2-14
Chlorobium tepidum
10 changes
Figure A1c: Phylogenetic tree based on APS nucleotide sequences from Merriespruit (MS) and Driefontein (VV) gold mines in South Africa. This unrooted tree was constructed by Leah Morgan in MrBayes and viewed in PAUP.
43

South Africa clone FFISouth Africa clone Y1South Africa clone F91South Africa clone C59South Africa clone Z1uncultured bacterium, AF486685 VV-7 uncultured bacterium, AY122603
VV-30 Desulfotomaculum aeronauticum, X98407Desulfotomaculum alkaliphilum, AF097024Peptococcus niger, X55797
Clostridium thermolacticum, L09176VV-41Bacillus jeotgali, AF221062
uncultured Bacillus sp., AY082367Bacillus fastidiosus, X60615
Lactobacillus fermentum , M58819 Mycoplasma capricolum , U26046
Termite group 1 bacterium, AY133074 uncultured bacterium, AJ583207
rumen clone 4C0d-3, AB034017 termite gut clone TG14, AB004576
termite gut clone UN79, D63633 VV-1
Coprothermobacter platensis, Y08935 Synergistes jonesii, L08066
Deinococcus radiodurans, Y11332 Thermodesulfobacterium hveragerdicum, X96725
South Africa clone EE18VV-12 q27f037VV-14 South Africa clone K37Acinetobacter junii, AF417863 Acinetobacter haemolyticus, X81662
Acinetobacter calcoaceticus, M34139 Burkholderia cepacia, M22518
Sphingomonas paucimobilis, D16144VV-10
uncultured bacterium, AY340841Chlorobium vibrioforme, M27804
Chlorobium limicola, M31769 Campylobacter jejuni, L04315
uncultured bacterium SY6-81, AF296213 uncultured bacterium, AY050605VV-43
Desulfosarcina variabilis , M34407 Geobacter sulfurreducens, U13928VV-9VV-44Desulfomicrobium baculatum, AF030438 Desulfomicrobium baculatum, M37311
Desulfonatronovibrio hydrogenovorans, X99234VV-48 Planctomyces sp., AB015527 Planctomyces maris, AJ231184
Planctomyces limnophilus, S39795 Methanobacterium bryantii, M59124 Methanobacterium thermoautotrophicum, X05482
0.10
Figure A1d: Phylogenetic tree based on bacterial 16S nucleotide sequences from Driefontein (VV) gold mine in South Africa. The tree was constructed by Tom Gihring in PAUP using maximum likelihood. The tree is rooted with Methanobacterium as an outgroup.
44
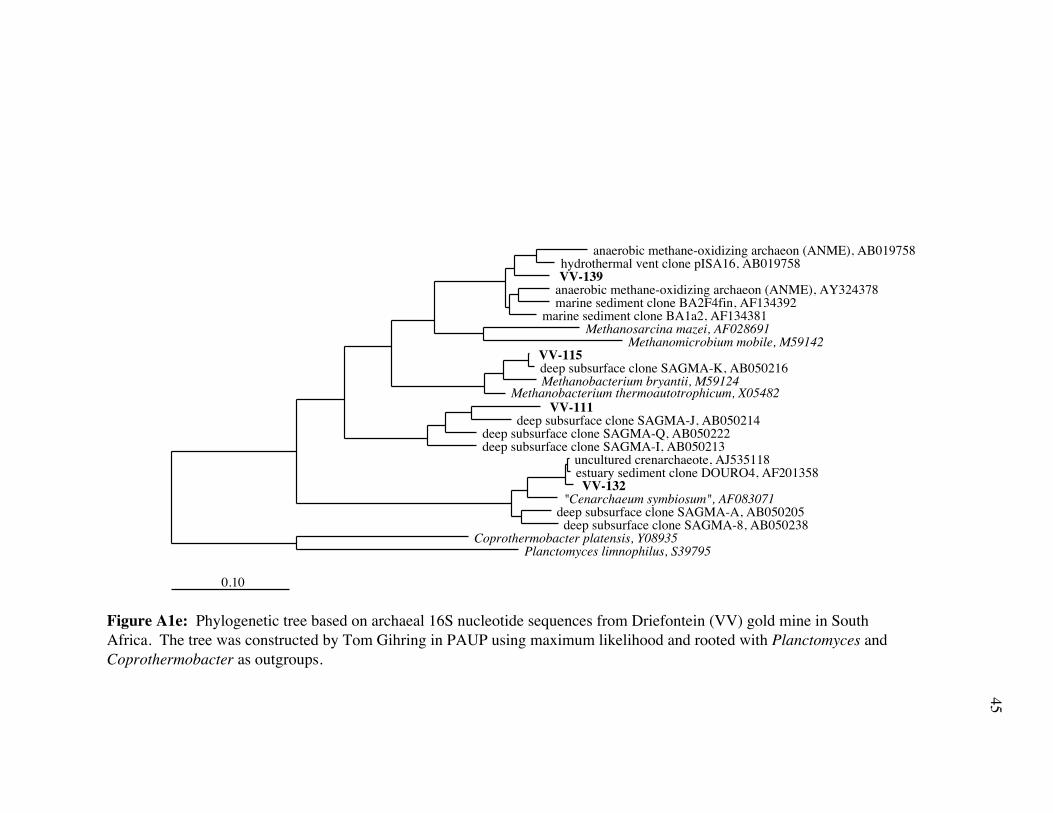
anaerobic methane-oxidizing archaeon (ANME), AB019758hydrothermal vent clone pISA16, AB019758
VV-139anaerobic methane-oxidizing archaeon (ANME), AY324378marine sediment clone BA2F4fin, AF134392
marine sediment clone BA1a2, AF134381Methanosarcina mazei, AF028691
Methanomicrobium mobile, M59142 VV-115deep subsurface clone SAGMA-K, AB050216Methanobacterium bryantii, M59124
Methanobacterium thermoautotrophicum, X05482 VV-111
deep subsurface clone SAGMA-J, AB050214deep subsurface clone SAGMA-Q, AB050222deep subsurface clone SAGMA-I, AB050213
uncultured crenarchaeote, AJ535118estuary sediment clone DOURO4, AF201358 VV-132
"Cenarchaeum symbiosum", AF083071deep subsurface clone SAGMA-A, AB050205
deep subsurface clone SAGMA-8, AB050238Coprothermobacter platensis, Y08935
Planctomyces limnophilus, S39795
0.10
Figure A1e: Phylogenetic tree based on archaeal 16S nucleotide sequences from Driefontein (VV) gold mine in South Africa. The tree was constructed by Tom Gihring in PAUP using maximum likelihood and rooted with Planctomyces and Coprothermobacter as outgroups.
45


