Computer Simulations, Nucleation Rate Predictions and Scaling
Molecular-dynamics simulations of urea nucleationfrom aqueous solutionMatteo Salvalaglioa,b, Claudio Peregob,c, Federico Gibertib,c, Marco Mazzottia, and Michele Parrinellob,c,1
aInstitute of Process Engineering, Eidgenössische Technische Hochschule Zurich, CH-8092 Zurich, Switzerland; bFacoltà di informatica, Istituto di ScienzeComputazionali, Università della Svizzera Italiana, CH-6900 Lugano, Switzerland; and cDepartment of Chemistry and Applied Biosciences, EidgenössicheTechnische Hochschule Zurich, CH-8092 Zurich, Switzerland
Contributed by Michele Parrinello, November 6, 2014 (sent for review October 22, 2014; reviewed by Daan Frenkel and Bernhardt L. Trout)
Despite its ubiquitous character and relevance in many branches ofscience and engineering, nucleation from solution remains elusive.In this framework, molecular simulations represent a powerfultool to provide insight into nucleation at the molecular scale. Inthis work, we combine theory and molecular simulations todescribe urea nucleation from aqueous solution. Taking advan-tage of well-tempered metadynamics, we compute the free-energy change associated to the phase transition. We find thatsuch a free-energy profile is characterized by significant finite-sizeeffects that can, however, be accounted for. The description ofthe nucleation process emerging from our analysis differs fromclassical nucleation theory. Nucleation of crystal-like clusters is infact preceded by large concentration fluctuations, indicating apredominant two-step process, whereby embryonic crystal nucleiemerge from dense, disordered urea clusters. Furthermore, in theearly stages of nucleation, two different polymorphs are seento compete.
nucleation | solution | molecular dynamics | enhanced sampling |well-tempered metadynamics
The nucleation of crystals from solution plays an importantrole in a variety of chemical and engineering processes.
However, the very small scale that characterizes the early stagesof nucleation makes its experimental study rather challenging. Inthis regard, molecular simulations play an important role andmuch work has been devoted to the study of homogeneous nu-cleation in simple model systems like Lennard–Jones particles orhard spheres (1–3). More recently, growing attention has beenpaid to the computer simulation of nucleation from solution oforganic and inorganic materials (4–11).However, these simulations have to face an important chal-
lenge. Nucleation is a typical example of a rare event occurringon a timescale that is much longer than what atomistic simu-lations can typically afford. The problem is most easily un-derstood if we focus on molecular dynamics (MD), which is thesampling method used here but it plagues other methods as well.In MD, the shortest timescale to be used for a correct integrationof the equation of motion is dictated by the fastest atomicmotions such as vibrations or rotations. Due to this constraint inthe integration step, present MD simulations can reach time-scales up to microseconds unless specific hardware, accessibleonly to few, is used. Even in this case the scale of the accessibletimes can be stretched only to the milliseconds range, a far cry fromthe much longer scale of nucleation phenomena.These timescale limitations affect molecular simulations in
several other research fields, such as ligand protein binding,protein folding, or slow chemical reactions, to name just a few.To overcome this limit, many enhanced sampling methods havebeen proposed (12–21). Several of them are based on the ap-plication of a suitable external bias potential (12–14) that speedsup configurational sampling and permits free energies to beevaluated and transition rates to be computed (22–24). Here, weshall use well-tempered (WT) metadynamics to enhance thenucleation of urea crystals from aqueous solutions and compute
free-energy profile associated to this event (25). To this aim, webuild on our recent study of homogeneous nucleation in pureurea where we have identified collective variables that well de-scribe the process of nucleation (9). Our simulations allow a deepinsight into the complex nucleation process, which involves thecompetition between two crystalline phases, the experimental oneand a metastable polymorph previously identified in ref. 9. Tointerpret the free-energy profiles calculated from WT metady-namics, we describe in detail how classical nucleation theory canbe extended to account for the coupling between the size of thenucleus and the chemical potential of the mother phase.
Reversible Work of Crystal Nucleation in a Simulation BoxTypical MD simulations are carried out in isothermal-isobaric(NPT) ensembles, defined by fixed number of atoms, tempera-ture, and pressure. Let us now consider an isothermal-isobaricsimulation box in which two phases, a crystal and a solution,coexist. Although the exchange of molecules between the twophases is allowed, the total number of molecules is fixed byconstruction. Such a constraint can be mathematically expressedthrough the material balance on the solute molecules, that readsas follows:
Ntot −Nℓ −Nc = 0; [1]
where Ntot is the total number of solute molecules in the wholesimulation box, Nℓ is the number of solute molecules in the liquidphase, and Nc is the number of solute molecules in the crystalphase. For the sake of simplicity, let us assume that only solutemolecules are exchanged between the two phases, whereas thesolvent remains in the liquid phase, the concepts exposed in thefollowing paragraph are, however, easily transferable to morecomplex phase equilibria. Let us now derive an expression forthe free energy associated to the formation of a crystal nucleus
Significance
Nucleation from solution is a ubiquitous process that playsimportant roles in physics, chemistry, engineering, and mate-rial science. Despite its importance, nucleation is far from beingcompletely understood. In this work, we combine advancedmolecular-dynamics simulation techniques and theory to pro-vide a description of urea nucleation from aqueous solution.In particular, our analysis shows that a two-step nucleationmechanism is favorable and that two polymorphs are seen tocompete in the early stages of the nucleation process. In ouranalysis, we have derived and validated a theoretical correc-tion to finite-size effects to compute free-energy profiles in thelimit of a macroscopic system at constant supersaturation.
Author contributions: M.S., C.P., F.G., M.M., and M.P. designed research, performed re-search, contributed new reagents/analytic tools, analyzed data, and wrote the paper.
Reviewers: D.F., University of Cambridge; and B.L.T., Massachusetts Institute ofTechnology.
The authors declare no conflict of interest.1To whom correspondence should be addressed. Email: [email protected].
E6–E14 | PNAS | Published online December 9, 2014 www.pnas.org/cgi/doi/10.1073/pnas.1421192111
composed of Nc molecules under the constraint of Eq. 1. In thisderivation, we proceed following an approach similar to thatused to derive a free-energy profile associated with crystalgrowth from solution in a confined system reported in the sup-plementary material of ref. 26. Our final expression is in agree-ment with those derived by Veesler and coworker (27) for thenucleation of proteins in a droplet as well as with other theoret-ical results obtained for the description of first-order phase tran-sitions in confined volumes (28–30). Consider the free energy ofa system composed of Nc solute molecules in the crystal state, Nℓsolute molecules in solution, and Ns solvent molecules. The freeenergy of the whole system, G, can be written as follows:
G=Ncμc;bulk + σA+Nℓμℓ +Nsμs: [2]
The chemical potential of both solute μℓ and solvent μsin the liquid phase can be written as μℓ = μ0 + kT ln γx andμs = μ0 + kT ln γsð1− xÞ, respectively. In these expressions, x is themolar fraction of the solute in the liquid phase and 1− x is themolar fraction of the solvent; hence:
x=Ntot −Nc
Ntot −Nc +Ns: [3]
The terms Ncμc;bulk + σA represent the free energy of thecrystal particle in suspension, where Nc is the total number ofsolute molecules in the crystal phase, μc;bulk is the chemical po-tential of a molecule in the crystal bulk, σ is the surface tension,and A is the total surface area of the crystal. Nℓμℓ +Nsμs repre-sents instead the free-energy contributions of the liquid phase.Exploiting the definition of thermodynamic equilibrium, we canwrite the chemical potential of the crystalline solid bulk as thechemical potential of a solution in thermodynamic equilibriumwith the solid as follows:
μbulk = μ0 + kTlnγpxp; [4]
where μ0 is the chemical potential of a reference state, xp is thesolubility of the solute in the solvent considered, and γp its ac-tivity coefficient at equilibrium conditions.Substituting the expressions for the chemical potentials into
Eq. 2 yields the following:
G=Nc�μ0 + kT ln γpxp
�+ σA+Nℓ
�μ0 + kT ln γx
�+Ns
�μ0 + kT ln γsð1− xÞ�: [5]
In typical formulations of the free energy associated to nu-cleation, a spherical shape is assumed for the nucleus and thesurface term σA is expressed as a function of the radius r. Cor-rections to this simple assumption have been found to be nec-essary to capture the actual shape of crystal clusters (3). As weaim at defining a shape-independent expression, we choose towrite both the bulk and the surface terms as function of thenumber of atoms in the crystal. The free-energy cost associatedto the formation of an interface between a crystalline particleand the solution is proportional to the surface area per unitvolume of the particle. The surface term can thus be written asproportional to N2=3
c as commonly done in physics. This scalingis valid in the case of several geometries such as spherical, el-lipsoidal, or cubic and allow us to express surface penalty termas follows:
σA= σ′N23c; [6]
where the constant σ′ lumps together the surface tension anda geometric factor defining the shape of the nucleus.
The reversible work associated to the formation of a clusterconstituted of Nc molecules can thus be expressed as a functionof Nc by computing the difference from a reference state whereno crystal is present (namely, Nc = 0) (28), and introducing Eq. 6to account for the surface contribution:
ΔGℓ→c =GðNcÞ−Gð0Þ=−Nc kbT ln�γ xγpxp
�+ σ′N
23c
+NtotkbT ln�γ xγ0x0
�+NskbT ln
γsð1− xÞγs;0ð1− x0Þ
!:
[7]
In macroscopic systems, namely where Nc � Ntot, the com-position of the solution can be considered decoupled from thesize of the crystal xðNcÞ≅ x0, where x0 is the molar fraction ofsolute molecules in the liquid phase in the absence of a crystalphase ½x0 =Ntot=ðNtot +NsÞ�. In these conditions, Eq. 7 reduces tothe expression for the free-energy profile also used in the contextof classical nucleation theory (CNT):
ΔGCNTðNcÞ=−NckbT ln�γ0x0γpxp
�+ σ′N
23c: [8]
The difference between ΔGℓ→c and ΔGCNT tends to zero forNc → 0 and is maximum for Nc →Ntot, regardless of the size orinitial composition of the system. In analogy with the approachproposed in ref. 29 for the nucleation of a liquid droplet, pro-vided Eqs. 8 and 7, it is possible to define a correction free-energyterm ΔGcorr, which needs to be added to the free energy obtainedfrom a confined, finite-sized, simulation to backcalculate theequivalent free-energy profile in a macroscopic system:
ΔGcorrðNcÞ=ΔGCNT −ΔGℓ→c
=−ðNtot −NcÞkbT ln�
γxγ0x0
�−NskbT ln
γsð1− xÞγs;0ð1− x0Þ
!:
[9]
As expected, the value of ΔGcorr tends to zero when Nc � Ntot,or in other terms, when x≅ x0.In Fig. 1, we report a prototypical free-energy curve described
by Eq. 7 as a function of Nc, together with the two termsΔGbulk =ΔGℓ→c − σA and σA. As shown in Fig. 1, ΔGbulk has a
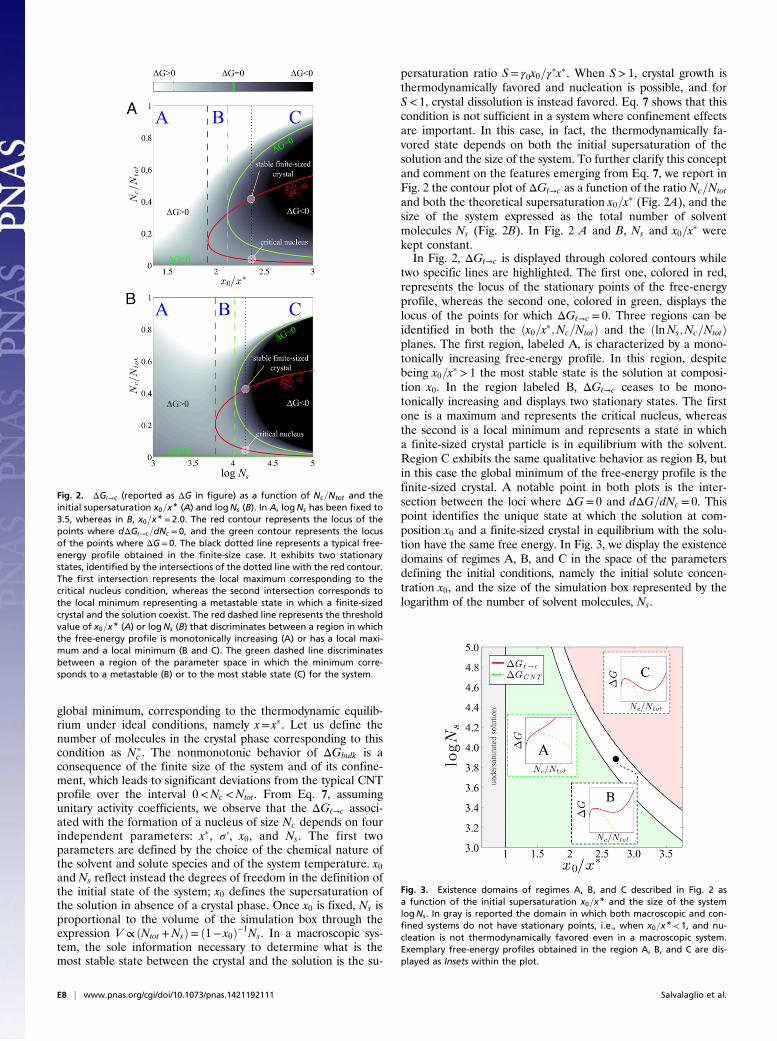
Fig. 1. Total free energy ðΔGℓ→cÞ, bulk contribution ðΔGbulk =ΔGℓ→c − σAÞ,surface contribution ðσAÞ obtained from Eq. 7 for the formation of clustersof up to 200 solute molecules for a system consisting of 600 total solutemolecules in 104 solvent molecules, with a thermodynamic solubilityx* = 0:0425 at T = 273 K. The surface term σA has been modeled as σ′N2=3
with σ′= 2:5. The free-energy profile is compared with ΔGCNT at constantcomposition x = x0.
Salvalaglio et al. PNAS | Published online December 9, 2014 | E7
CHEM
ISTR
YPN
ASPL
US
global minimum, corresponding to the thermodynamic equilib-rium under ideal conditions, namely x= xp. Let us define thenumber of molecules in the crystal phase corresponding to thiscondition as Np
c . The nonmonotonic behavior of ΔGbulk is aconsequence of the finite size of the system and of its confine-ment, which leads to significant deviations from the typical CNTprofile over the interval 0<Nc <Ntot. From Eq. 7, assumingunitary activity coefficients, we observe that the ΔGℓ→c associ-ated with the formation of a nucleus of size Nc depends on fourindependent parameters: xp, σ′, x0, and Ns. The first twoparameters are defined by the choice of the chemical nature ofthe solvent and solute species and of the system temperature. x0and Ns reflect instead the degrees of freedom in the definition ofthe initial state of the system; x0 defines the supersaturation ofthe solution in absence of a crystal phase. Once x0 is fixed, Ns isproportional to the volume of the simulation box through theexpression V ∝ ðNtot +NsÞ= ð1− x0Þ−1Ns. In a macroscopic sys-tem, the sole information necessary to determine what is themost stable state between the crystal and the solution is the su-
persaturation ratio S= γ0x0=γpxp. When S> 1, crystal growth is
thermodynamically favored and nucleation is possible, and forS< 1, crystal dissolution is instead favored. Eq. 7 shows that thiscondition is not sufficient in a system where confinement effectsare important. In this case, in fact, the thermodynamically fa-vored state depends on both the initial supersaturation of thesolution and the size of the system. To further clarify this conceptand comment on the features emerging from Eq. 7, we report inFig. 2 the contour plot of ΔGℓ→c as a function of the ratio Nc=Ntot
and both the theoretical supersaturation x0=xp (Fig. 2A), and thesize of the system expressed as the total number of solventmolecules Ns (Fig. 2B). In Fig. 2 A and B, Ns and x0=xp werekept constant.In Fig. 2, ΔGℓ→c is displayed through colored contours while
two specific lines are highlighted. The first one, colored in red,represents the locus of the stationary points of the free-energyprofile, whereas the second one, colored in green, displays thelocus of the points for which ΔGℓ→c = 0. Three regions can beidentified in both the ðx0=xp;Nc=NtotÞ and the ðlnNs;Nc=NtotÞplanes. The first region, labeled A, is characterized by a mono-tonically increasing free-energy profile. In this region, despitebeing x0=xp > 1 the most stable state is the solution at composi-tion x0. In the region labeled B, ΔGℓ→c ceases to be mono-tonically increasing and displays two stationary states. The firstone is a maximum and represents the critical nucleus, whereasthe second is a local minimum and represents a state in whicha finite-sized crystal particle is in equilibrium with the solvent.Region C exhibits the same qualitative behavior as region B, butin this case the global minimum of the free-energy profile is thefinite-sized crystal. A notable point in both plots is the inter-section between the loci where ΔG= 0 and dΔG=dNc = 0. Thispoint identifies the unique state at which the solution at com-position x0 and a finite-sized crystal in equilibrium with the solu-tion have the same free energy. In Fig. 3, we display the existencedomains of regimes A, B, and C in the space of the parametersdefining the initial conditions, namely the initial solute concen-tration x0, and the size of the simulation box represented by thelogarithm of the number of solvent molecules, Ns.
Fig. 2. ΔGℓ→c (reported as ΔG in figure) as a function of Nc=Ntot and theinitial supersaturation x0=x* (A) and logNs (B). In A, logNs has been fixed to3.5, whereas in B, x0=x* = 2:0. The red contour represents the locus of thepoints where dΔGℓ→c=dNc = 0, and the green contour represents the locusof the points where ΔG= 0. The black dotted line represents a typical free-energy profile obtained in the finite-size case. It exhibits two stationarystates, identified by the intersections of the dotted line with the red contour.The first intersection represents the local maximum corresponding to thecritical nucleus condition, whereas the second intersection corresponds tothe local minimum representing a metastable state in which a finite-sizedcrystal and the solution coexist. The red dashed line represents the thresholdvalue of x0=x* (A) or logNs (B) that discriminates between a region in whichthe free-energy profile is monotonically increasing (A) or has a local maxi-mum and a local minimum (B and C). The green dashed line discriminatesbetween a region of the parameter space in which the minimum corre-sponds to a metastable (B) or to the most stable state (C) for the system.
Fig. 3. Existence domains of regimes A, B, and C described in Fig. 2 asa function of the initial supersaturation x0=x* and the size of the systemlogNs. In gray is reported the domain in which both macroscopic and con-fined systems do not have stationary points, i.e., when x0=x* < 1, and nu-cleation is not thermodynamically favored even in a macroscopic system.Exemplary free-energy profiles obtained in the region A, B, and C are dis-played as Insets within the plot.
E8 | www.pnas.org/cgi/doi/10.1073/pnas.1421192111 Salvalaglio et al.
ResultsThe analytical expression for the free energy associated to theformation of a nucleus of size Nc given by Eq. 7 allows to accountfor the depletion of the solution in computing the reversiblework associated with crystal nucleation from solution. Its for-mulation is based on the assumptions that (i) a single nucleus isformed, (ii) the concept of surface tension can be extrapolated tovery small crystal sizes, and (iii) the crystal nucleus has a well-defined internal structure. These assumptions, necessary to for-mulate an analytical equation, do not intrinsically describe themechanism of the molecular process at play in molecular simu-lations, where the system is allowed to sample a wide variety ofstates characterized by a diverse range of aggregates number,sizes, and structures. The internal structure of the nucleus, itsshape, its mechanism of formation, and the structure of the so-lution where the whole nucleation process takes place are in factproducts of the molecular simulation rather than being a prioriimposed. As we shall demonstrate in the following paragraphs,the analytical expression reported in Eq. 7 does indeed capturethe features of the nucleation free energy in the molecularsimulation box and allows to correct the free-energy estimates bycorrecting for finite-size effects.
Free Energy of Nucleation of a Crystal-Like Particle fromMetadynamicsSimulations. The aim of this section is to validate the analyticalexpression of the nucleation free energy, by demonstrating thatEq. 7 correctly describes the depletion of the solution and that,by applying the correction reported in Eq. 9, one can recover thefree-energy profile of a macroscopic system (e.g., at constantsupersaturation). We observe that, in WT metadynamics simu-lations, the bias deposition makes the molecular models explorethe nucleation of a crystal phase through states characterized bya population of multiple clusters. Nevertheless, using a reweigh-ing strategy (25), it possible to extract the free-energy profileassociated with the formation of a single crystal nucleus withinthe simulation box, hereafter named FðNcÞjNcluster=1. We performthree metadynamics simulations, S1, S2, and S3, described indetail in Methods and summarized in Table 1.This free-energy profile is related to the equilibrium proba-
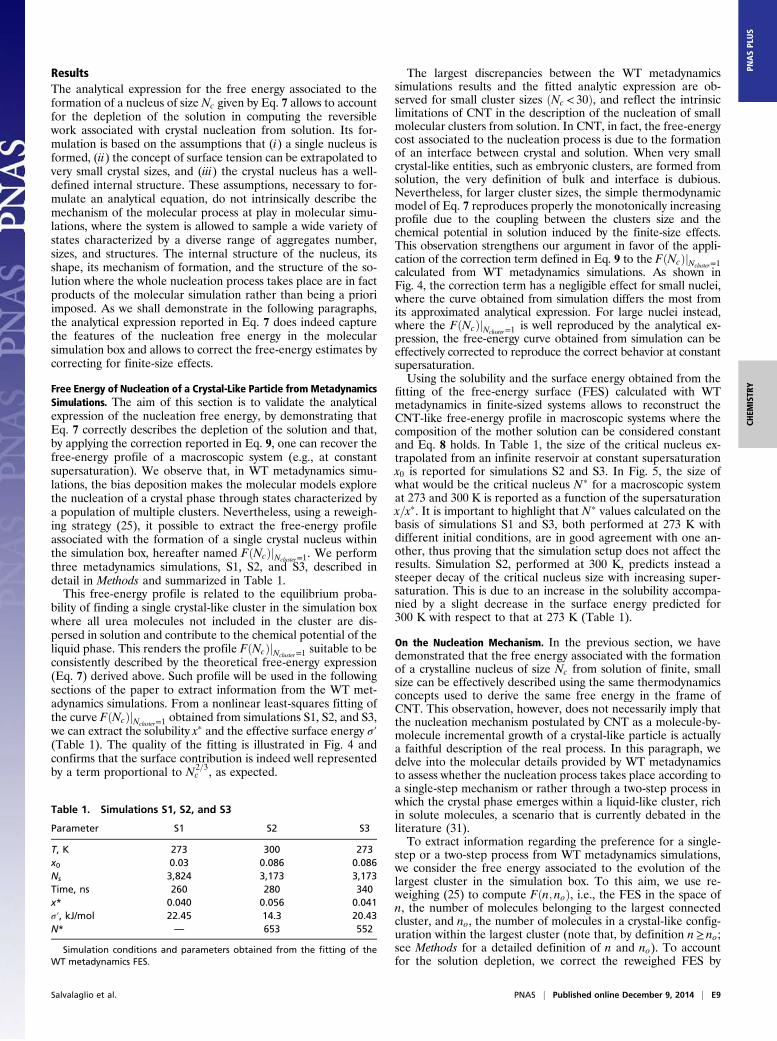
bility of finding a single crystal-like cluster in the simulation boxwhere all urea molecules not included in the cluster are dis-persed in solution and contribute to the chemical potential of theliquid phase. This renders the profile FðNcÞjNcluster=1 suitable to beconsistently described by the theoretical free-energy expression(Eq. 7) derived above. Such profile will be used in the followingsections of the paper to extract information from the WT met-adynamics simulations. From a nonlinear least-squares fitting ofthe curve FðNcÞjNcluster=1 obtained from simulations S1, S2, and S3,we can extract the solubility xp and the effective surface energy σ′(Table 1). The quality of the fitting is illustrated in Fig. 4 andconfirms that the surface contribution is indeed well representedby a term proportional to N2=3
c , as expected.
The largest discrepancies between the WT metadynamicssimulations results and the fitted analytic expression are ob-served for small cluster sizes ðNc < 30Þ, and reflect the intrinsiclimitations of CNT in the description of the nucleation of smallmolecular clusters from solution. In CNT, in fact, the free-energycost associated to the nucleation process is due to the formationof an interface between crystal and solution. When very smallcrystal-like entities, such as embryonic clusters, are formed fromsolution, the very definition of bulk and interface is dubious.Nevertheless, for larger cluster sizes, the simple thermodynamicmodel of Eq. 7 reproduces properly the monotonically increasingprofile due to the coupling between the clusters size and thechemical potential in solution induced by the finite-size effects.This observation strengthens our argument in favor of the appli-cation of the correction term defined in Eq. 9 to the FðNcÞjNcluster=1calculated from WT metadynamics simulations. As shown inFig. 4, the correction term has a negligible effect for small nuclei,where the curve obtained from simulation differs the most fromits approximated analytical expression. For large nuclei instead,where the FðNcÞjNcluster=1 is well reproduced by the analytical ex-pression, the free-energy curve obtained from simulation can beeffectively corrected to reproduce the correct behavior at constantsupersaturation.Using the solubility and the surface energy obtained from the
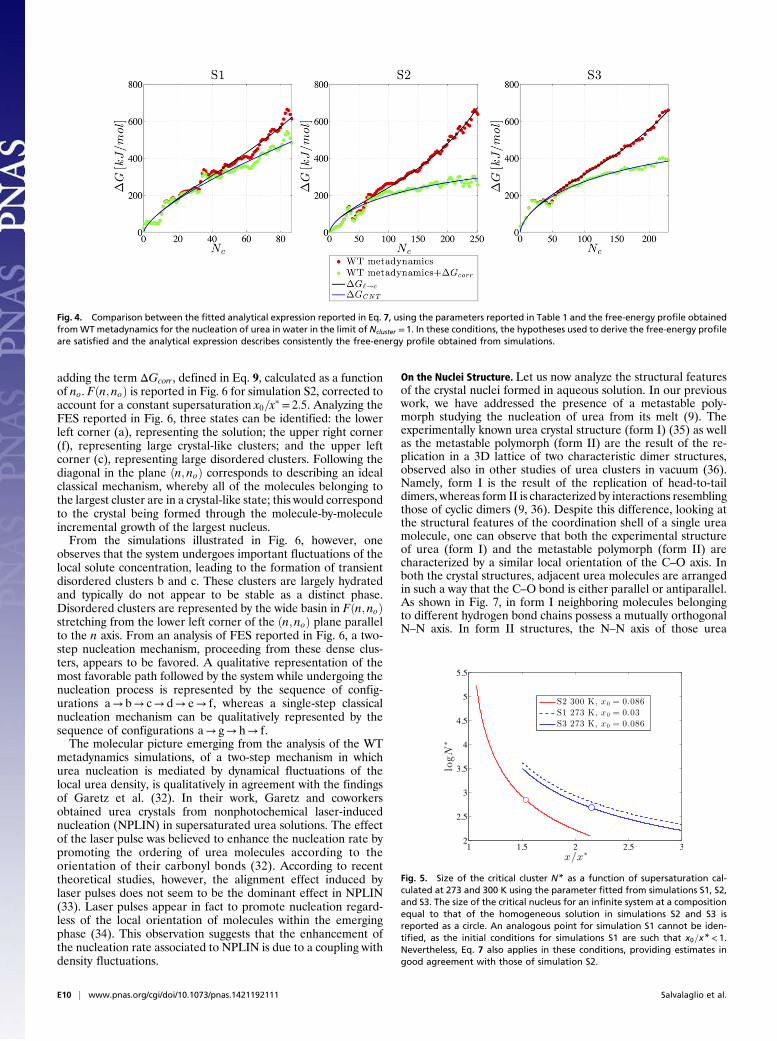
fitting of the free-energy surface (FES) calculated with WTmetadynamics in finite-sized systems allows to reconstruct theCNT-like free-energy profile in macroscopic systems where thecomposition of the mother solution can be considered constantand Eq. 8 holds. In Table 1, the size of the critical nucleus ex-trapolated from an infinite reservoir at constant supersaturationx0 is reported for simulations S2 and S3. In Fig. 5, the size ofwhat would be the critical nucleus Np for a macroscopic systemat 273 and 300 K is reported as a function of the supersaturationx=xp. It is important to highlight that Np values calculated on thebasis of simulations S1 and S3, both performed at 273 K withdifferent initial conditions, are in good agreement with one an-other, thus proving that the simulation setup does not affect theresults. Simulation S2, performed at 300 K, predicts instead asteeper decay of the critical nucleus size with increasing super-saturation. This is due to an increase in the solubility accompa-nied by a slight decrease in the surface energy predicted for300 K with respect to that at 273 K (Table 1).
On the Nucleation Mechanism. In the previous section, we havedemonstrated that the free energy associated with the formationof a crystalline nucleus of size Nc from solution of finite, smallsize can be effectively described using the same thermodynamicsconcepts used to derive the same free energy in the frame ofCNT. This observation, however, does not necessarily imply thatthe nucleation mechanism postulated by CNT as a molecule-by-molecule incremental growth of a crystal-like particle is actuallya faithful description of the real process. In this paragraph, wedelve into the molecular details provided by WT metadynamicsto assess whether the nucleation process takes place according toa single-step mechanism or rather through a two-step process inwhich the crystal phase emerges within a liquid-like cluster, richin solute molecules, a scenario that is currently debated in theliterature (31).To extract information regarding the preference for a single-
step or a two-step process from WT metadynamics simulations,we consider the free energy associated to the evolution of thelargest cluster in the simulation box. To this aim, we use re-weighing (25) to compute Fðn; noÞ, i.e., the FES in the space ofn, the number of molecules belonging to the largest connectedcluster, and no, the number of molecules in a crystal-like config-uration within the largest cluster (note that, by definition n≥ no;see Methods for a detailed definition of n and no). To accountfor the solution depletion, we correct the reweighed FES by
Table 1. Simulations S1, S2, and S3
Parameter S1 S2 S3
T, K 273 300 273x0 0.03 0.086 0.086Ns 3,824 3,173 3,173Time, ns 260 280 340x* 0.040 0.056 0.041σ′, kJ/mol 22.45 14.3 20.43N* — 653 552
Simulation conditions and parameters obtained from the fitting of theWT metadynamics FES.
Salvalaglio et al. PNAS | Published online December 9, 2014 | E9
CHEM
ISTR
YPN
ASPL
US
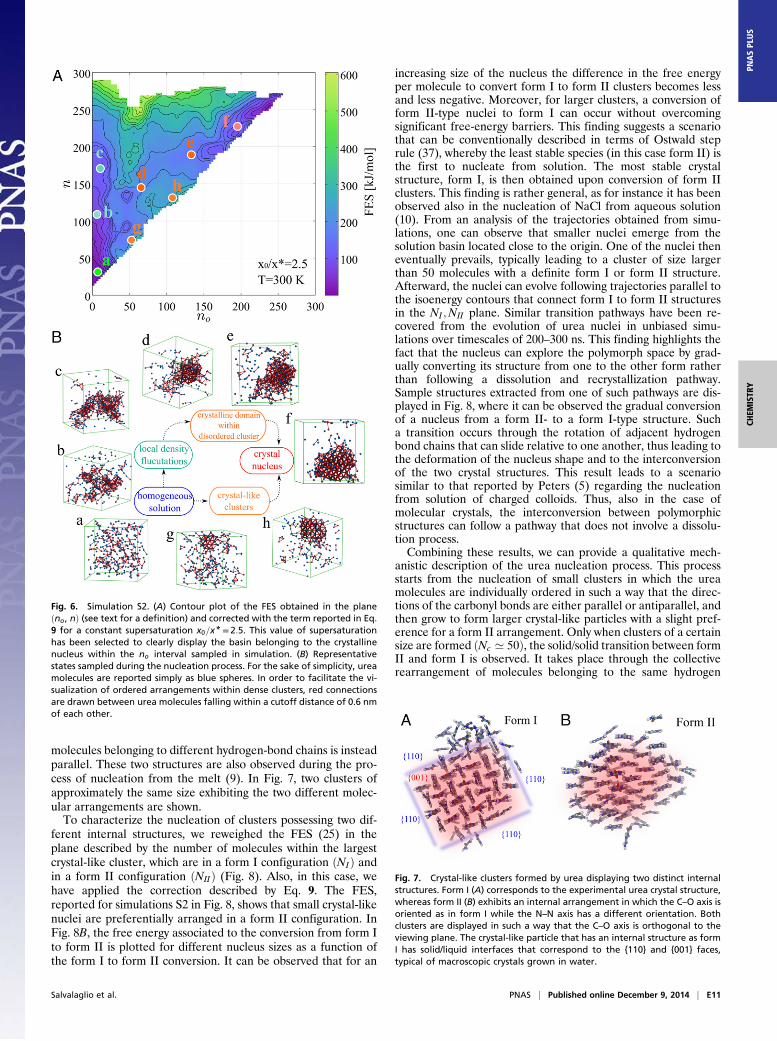
adding the term ΔGcorr , defined in Eq. 9, calculated as a functionof no. Fðn; noÞ is reported in Fig. 6 for simulation S2, corrected toaccount for a constant supersaturation x0=xp = 2:5. Analyzing theFES reported in Fig. 6, three states can be identified: the lowerleft corner (a), representing the solution; the upper right corner(f), representing large crystal-like clusters; and the upper leftcorner (c), representing large disordered clusters. Following thediagonal in the plane ðn; noÞ corresponds to describing an idealclassical mechanism, whereby all of the molecules belonging tothe largest cluster are in a crystal-like state; this would correspondto the crystal being formed through the molecule-by-moleculeincremental growth of the largest nucleus.From the simulations illustrated in Fig. 6, however, one
observes that the system undergoes important fluctuations of thelocal solute concentration, leading to the formation of transientdisordered clusters b and c. These clusters are largely hydratedand typically do not appear to be stable as a distinct phase.Disordered clusters are represented by the wide basin in Fðn; noÞstretching from the lower left corner of the ðn; noÞ plane parallelto the n axis. From an analysis of FES reported in Fig. 6, a two-step nucleation mechanism, proceeding from these dense clus-ters, appears to be favored. A qualitative representation of themost favorable path followed by the system while undergoing thenucleation process is represented by the sequence of config-urations a→ b→ c→ d→ e→ f, whereas a single-step classicalnucleation mechanism can be qualitatively represented by thesequence of configurations a→ g→ h→ f.The molecular picture emerging from the analysis of the WT
metadynamics simulations, of a two-step mechanism in whichurea nucleation is mediated by dynamical fluctuations of thelocal urea density, is qualitatively in agreement with the findingsof Garetz et al. (32). In their work, Garetz and coworkersobtained urea crystals from nonphotochemical laser-inducednucleation (NPLIN) in supersaturated urea solutions. The effectof the laser pulse was believed to enhance the nucleation rate bypromoting the ordering of urea molecules according to theorientation of their carbonyl bonds (32). According to recenttheoretical studies, however, the alignment effect induced bylaser pulses does not seem to be the dominant effect in NPLIN(33). Laser pulses appear in fact to promote nucleation regard-less of the local orientation of molecules within the emergingphase (34). This observation suggests that the enhancement ofthe nucleation rate associated to NPLIN is due to a coupling withdensity fluctuations.
On the Nuclei Structure. Let us now analyze the structural featuresof the crystal nuclei formed in aqueous solution. In our previouswork, we have addressed the presence of a metastable poly-morph studying the nucleation of urea from its melt (9). Theexperimentally known urea crystal structure (form I) (35) as wellas the metastable polymorph (form II) are the result of the re-plication in a 3D lattice of two characteristic dimer structures,observed also in other studies of urea clusters in vacuum (36).Namely, form I is the result of the replication of head-to-taildimers, whereas form II is characterized by interactions resemblingthose of cyclic dimers (9, 36). Despite this difference, looking atthe structural features of the coordination shell of a single ureamolecule, one can observe that both the experimental structureof urea (form I) and the metastable polymorph (form II) arecharacterized by a similar local orientation of the C–O axis. Inboth the crystal structures, adjacent urea molecules are arrangedin such a way that the C–O bond is either parallel or antiparallel.As shown in Fig. 7, in form I neighboring molecules belongingto different hydrogen bond chains possess a mutually orthogonalN–N axis. In form II structures, the N–N axis of those urea
Fig. 4. Comparison between the fitted analytical expression reported in Eq. 7, using the parameters reported in Table 1 and the free-energy profile obtainedfromWTmetadynamics for the nucleation of urea in water in the limit of Ncluster = 1. In these conditions, the hypotheses used to derive the free-energy profileare satisfied and the analytical expression describes consistently the free-energy profile obtained from simulations.
Fig. 5. Size of the critical cluster N* as a function of supersaturation cal-culated at 273 and 300 K using the parameter fitted from simulations S1, S2,and S3. The size of the critical nucleus for an infinite system at a compositionequal to that of the homogeneous solution in simulations S2 and S3 isreported as a circle. An analogous point for simulation S1 cannot be iden-tified, as the initial conditions for simulations S1 are such that x0=x* < 1.Nevertheless, Eq. 7 also applies in these conditions, providing estimates ingood agreement with those of simulation S2.
E10 | www.pnas.org/cgi/doi/10.1073/pnas.1421192111 Salvalaglio et al.
molecules belonging to different hydrogen-bond chains is insteadparallel. These two structures are also observed during the pro-cess of nucleation from the melt (9). In Fig. 7, two clusters ofapproximately the same size exhibiting the two different molec-ular arrangements are shown.To characterize the nucleation of clusters possessing two dif-
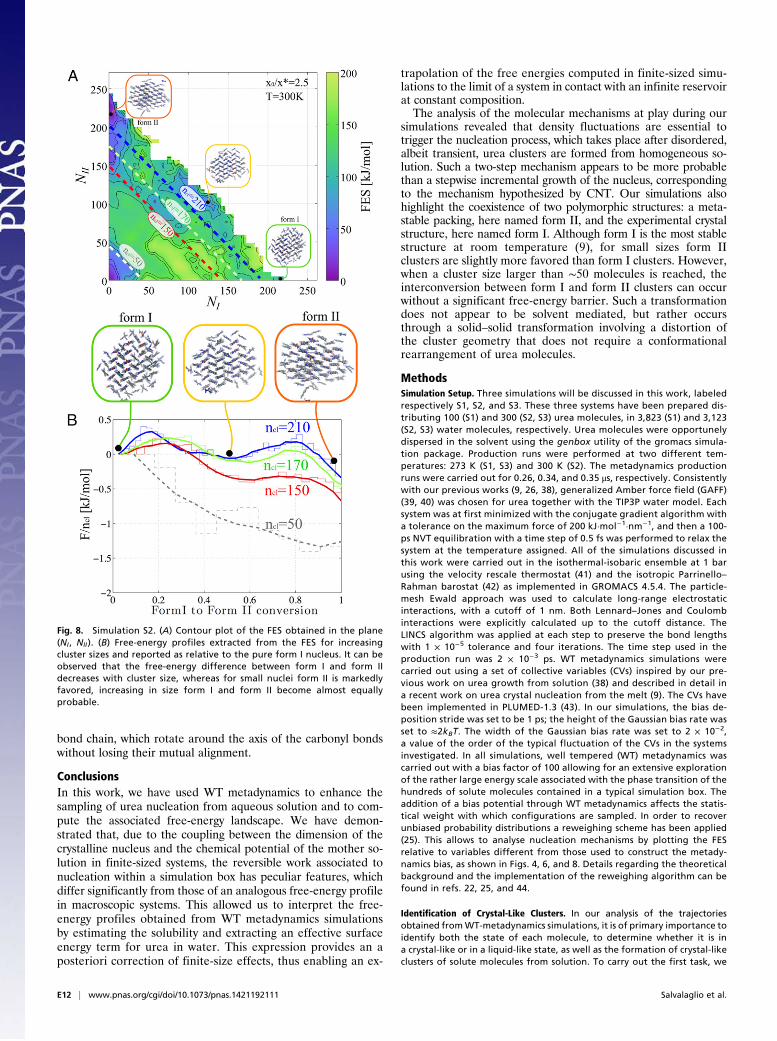
ferent internal structures, we reweighed the FES (25) in theplane described by the number of molecules within the largestcrystal-like cluster, which are in a form I configuration ðNIÞ andin a form II configuration ðNIIÞ (Fig. 8). Also, in this case, wehave applied the correction described by Eq. 9. The FES,reported for simulations S2 in Fig. 8, shows that small crystal-likenuclei are preferentially arranged in a form II configuration. InFig. 8B, the free energy associated to the conversion from form Ito form II is plotted for different nucleus sizes as a function ofthe form I to form II conversion. It can be observed that for an
increasing size of the nucleus the difference in the free energyper molecule to convert form I to form II clusters becomes lessand less negative. Moreover, for larger clusters, a conversion ofform II-type nuclei to form I can occur without overcomingsignificant free-energy barriers. This finding suggests a scenariothat can be conventionally described in terms of Ostwald steprule (37), whereby the least stable species (in this case form II) isthe first to nucleate from solution. The most stable crystalstructure, form I, is then obtained upon conversion of form IIclusters. This finding is rather general, as for instance it has beenobserved also in the nucleation of NaCl from aqueous solution(10). From an analysis of the trajectories obtained from simu-lations, one can observe that smaller nuclei emerge from thesolution basin located close to the origin. One of the nuclei theneventually prevails, typically leading to a cluster of size largerthan 50 molecules with a definite form I or form II structure.Afterward, the nuclei can evolve following trajectories parallel tothe isoenergy contours that connect form I to form II structuresin the NI ;NII plane. Similar transition pathways have been re-covered from the evolution of urea nuclei in unbiased simu-lations over timescales of 200–300 ns. This finding highlights thefact that the nucleus can explore the polymorph space by grad-ually converting its structure from one to the other form ratherthan following a dissolution and recrystallization pathway.Sample structures extracted from one of such pathways are dis-played in Fig. 8, where it can be observed the gradual conversionof a nucleus from a form II- to a form I-type structure. Sucha transition occurs through the rotation of adjacent hydrogenbond chains that can slide relative to one another, thus leading tothe deformation of the nucleus shape and to the interconversionof the two crystal structures. This result leads to a scenariosimilar to that reported by Peters (5) regarding the nucleationfrom solution of charged colloids. Thus, also in the case ofmolecular crystals, the interconversion between polymorphicstructures can follow a pathway that does not involve a dissolu-tion process.Combining these results, we can provide a qualitative mech-
anistic description of the urea nucleation process. This processstarts from the nucleation of small clusters in which the ureamolecules are individually ordered in such a way that the direc-tions of the carbonyl bonds are either parallel or antiparallel, andthen grow to form larger crystal-like particles with a slight pref-erence for a form II arrangement. Only when clusters of a certainsize are formed ðNc ’ 50Þ, the solid/solid transition between formII and form I is observed. It takes place through the collectiverearrangement of molecules belonging to the same hydrogen
Fig. 6. Simulation S2. (A) Contour plot of the FES obtained in the planeðno, nÞ (see text for a definition) and corrected with the term reported in Eq.9 for a constant supersaturation x0=x* = 2:5. This value of supersaturationhas been selected to clearly display the basin belonging to the crystallinenucleus within the no interval sampled in simulation. (B) Representativestates sampled during the nucleation process. For the sake of simplicity, ureamolecules are reported simply as blue spheres. In order to facilitate the vi-sualization of ordered arrangements within dense clusters, red connectionsare drawn between urea molecules falling within a cutoff distance of 0.6 nmof each other.
Fig. 7. Crystal-like clusters formed by urea displaying two distinct internalstructures. Form I (A) corresponds to the experimental urea crystal structure,whereas form II (B) exhibits an internal arrangement in which the C–O axis isoriented as in form I while the N–N axis has a different orientation. Bothclusters are displayed in such a way that the C–O axis is orthogonal to theviewing plane. The crystal-like particle that has an internal structure as formI has solid/liquid interfaces that correspond to the {110} and {001} faces,typical of macroscopic crystals grown in water.
Salvalaglio et al. PNAS | Published online December 9, 2014 | E11
CHEM
ISTR
YPN
ASPL
US
bond chain, which rotate around the axis of the carbonyl bondswithout losing their mutual alignment.
ConclusionsIn this work, we have used WT metadynamics to enhance thesampling of urea nucleation from aqueous solution and to com-pute the associated free-energy landscape. We have demon-strated that, due to the coupling between the dimension of thecrystalline nucleus and the chemical potential of the mother so-lution in finite-sized systems, the reversible work associated tonucleation within a simulation box has peculiar features, whichdiffer significantly from those of an analogous free-energy profilein macroscopic systems. This allowed us to interpret the free-energy profiles obtained from WT metadynamics simulationsby estimating the solubility and extracting an effective surfaceenergy term for urea in water. This expression provides an aposteriori correction of finite-size effects, thus enabling an ex-
trapolation of the free energies computed in finite-sized simu-lations to the limit of a system in contact with an infinite reservoirat constant composition.The analysis of the molecular mechanisms at play during our
simulations revealed that density fluctuations are essential totrigger the nucleation process, which takes place after disordered,albeit transient, urea clusters are formed from homogeneous so-lution. Such a two-step mechanism appears to be more probablethan a stepwise incremental growth of the nucleus, correspondingto the mechanism hypothesized by CNT. Our simulations alsohighlight the coexistence of two polymorphic structures: a meta-stable packing, here named form II, and the experimental crystalstructure, here named form I. Although form I is the most stablestructure at room temperature (9), for small sizes form IIclusters are slightly more favored than form I clusters. However,when a cluster size larger than ∼50 molecules is reached, theinterconversion between form I and form II clusters can occurwithout a significant free-energy barrier. Such a transformationdoes not appear to be solvent mediated, but rather occursthrough a solid–solid transformation involving a distortion ofthe cluster geometry that does not require a conformationalrearrangement of urea molecules.
MethodsSimulation Setup. Three simulations will be discussed in this work, labeledrespectively S1, S2, and S3. These three systems have been prepared dis-tributing 100 (S1) and 300 (S2, S3) urea molecules, in 3,823 (S1) and 3,123(S2, S3) water molecules, respectively. Urea molecules were opportunelydispersed in the solvent using the genbox utility of the gromacs simula-tion package. Production runs were performed at two different tem-peratures: 273 K (S1, S3) and 300 K (S2). The metadynamics productionruns were carried out for 0.26, 0.34, and 0.35 μs, respectively. Consistentlywith our previous works (9, 26, 38), generalized Amber force field (GAFF)(39, 40) was chosen for urea together with the TIP3P water model. Eachsystem was at first minimized with the conjugate gradient algorithm witha tolerance on the maximum force of 200 kJ·mol−1·nm−1, and then a 100-ps NVT equilibration with a time step of 0.5 fs was performed to relax thesystem at the temperature assigned. All of the simulations discussed inthis work were carried out in the isothermal-isobaric ensemble at 1 barusing the velocity rescale thermostat (41) and the isotropic Parrinello–Rahman barostat (42) as implemented in GROMACS 4.5.4. The particle-mesh Ewald approach was used to calculate long-range electrostaticinteractions, with a cutoff of 1 nm. Both Lennard–Jones and Coulombinteractions were explicitly calculated up to the cutoff distance. TheLINCS algorithm was applied at each step to preserve the bond lengthswith 1 × 10⁻⁵ tolerance and four iterations. The time step used in theproduction run was 2 × 10⁻³ ps. WT metadynamics simulations werecarried out using a set of collective variables (CVs) inspired by our pre-vious work on urea growth from solution (38) and described in detail ina recent work on urea crystal nucleation from the melt (9). The CVs havebeen implemented in PLUMED-1.3 (43). In our simulations, the bias de-position stride was set to be 1 ps; the height of the Gaussian bias rate wasset to ≈2kBT. The width of the Gaussian bias rate was set to 2 × 10⁻²,a value of the order of the typical fluctuation of the CVs in the systemsinvestigated. In all simulations, well tempered (WT) metadynamics wascarried out with a bias factor of 100 allowing for an extensive explorationof the rather large energy scale associated with the phase transition of thehundreds of solute molecules contained in a typical simulation box. Theaddition of a bias potential through WT metadynamics affects the statis-tical weight with which configurations are sampled. In order to recoverunbiased probability distributions a reweighing scheme has been applied(25). This allows to analyse nucleation mechanisms by plotting the FESrelative to variables different from those used to construct the metady-namics bias, as shown in Figs. 4, 6, and 8. Details regarding the theoreticalbackground and the implementation of the reweighing algorithm can befound in refs. 22, 25, and 44.
Identification of Crystal-Like Clusters. In our analysis of the trajectoriesobtained fromWT-metadynamics simulations, it is of primary importance toidentify both the state of each molecule, to determine whether it is ina crystal-like or in a liquid-like state, as well as the formation of crystal-likeclusters of solute molecules from solution. To carry out the first task, we
Fig. 8. Simulation S2. (A) Contour plot of the FES obtained in the plane(NI , NII). (B) Free-energy profiles extracted from the FES for increasingcluster sizes and reported as relative to the pure form I nucleus. It can beobserved that the free-energy difference between form I and form IIdecreases with cluster size, whereas for small nuclei form II is markedlyfavored, increasing in size form I and form II become almost equallyprobable.
E12 | www.pnas.org/cgi/doi/10.1073/pnas.1421192111 Salvalaglio et al.
take advantage of the definition of the CVs used to bias the dynamics (9).Such CVs can be decomposed in single-molecule contributions that accountfor the density of the local molecular environment surrounding each sol-ute molecule, as well as the degree of orientation order of the moleculesbelonging to the coordination sphere of that solute molecule. The orien-tation order is defined with respect to an intramolecular vector (26, 38,45). In the following, we shall define ΓCO, the molecular degree of orderassociated to the relative orientation of urea molecules with respect to theCO axis, and ΓNN , the degree of order associated to the relative orientationwith respect to the NN axis. ΓCO and ΓNN were computed for the ith mol-ecule as follows:
ΓCOðiÞ= ρini
XNj=1
fij
e−
ðϑij − θ1Þ22 δ2 + e−
ðϑij − θ2Þ22 δ2
![10]
ΓNNðiÞ= ρini
XNj=1
fij
e−
ðϑij − θ1Þ22 δ2 + e−
ðϑij − θ2Þ22 δ2
![11]
where ni is the coordination number of molecule i, ρi is a switching functiondefined in the space of the coordination number that smoothly decreasesfrom 1 to zero when the number of neighbors of the ith urea molecule is lessthan a predefined threshold value, N is the total number of solute moleculesin the system, ϑij is the angle between the CO or the NN axis of the i and jurea molecules, and fij is a switching function that weights the contributionof the relative orientation of neighboring urea molecules with their Carte-sian distance. In Eq. 10 θ1 = 0°, θ2 = 180°, δ = 27.5°, while in Eq. 11 θ1 = 90°,θ2 = 270°, δ = 27.5°. A detailed description of all the terms appearing inEqs. 10 and 11 can be found in ref. 9.
To identify clusters of crystal-like molecules, we have used an approachbased on graph theory. We have built a graph based on the connectivitymatrix of urea molecules in the Cartesian space and their degreeof crystallinity. A depth-first search algorithm was then applied toidentify clusters as connected components of the graph, similarly to the
algorithm used in ref. 46 for the identification of crystal nuclei obtainedfrom undercooled liquid GeTe. This clustering technique is used tocompute variables n, no, NI , and NII used to represent FESs reported inFigs. 6 and 8.
These variables are defined as follows:
n: number of urea molecules coordinated by with four or more other ureamolecules, forming the largest connected cluster regardless of their re-spective orientation; molecules are considered connected when theyare within a coordination sphere of radius 0.6 nm;
no: number of urea molecules forming the largest connected cluster pos-sessing a crystal-like configuration; urea molecules are considered to becrystal-like when the order parameter ΓCO > 0:5. ΓCO has been computedas defined in ref. 9, considering the urea carbonyl bond as vector de-fining the mutual orientation of urea molecules;
NI: number of crystal-like ordered molecules in the largest cluster, charac-terized by a form I configuration;
NII: number of crystal-like ordered molecules in the largest cluster, charac-terized by a form II configuration.
To distinguish between form I and form II molecules, both molecular orderparameters ΓCO and ΓNN were considered. Molecules were assigned to aform I configuration if ΓCO > 0:5 and ΓNN > 0:3, and to a form II configurationif ΓCO > 0:5 and ΓNN ≤ 0:3 These criteria reflect the position of basins identi-fying form I and form II in the FES obtained for urea nucleation from its meltreported in figure 3 of ref. 9.
ACKNOWLEDGMENTS. M.S. thanks Baron Peters, Gabriele Cesare Sosso, andStefano Corni for insightful discussions and precious advice. We acknowl-edge the computational resources provided by the Swiss Center forScientific Computing and the Brutus Cluster at Eidgenössiche TechnischeHochschule Zurich. M.P. acknowledges European Union Grant ERC-2009-AdG-247075 and the National Centres of Competence in Research “Mate-rials’ Revolution: Computational Design and Discovery of Novel Materials”project for funding.
1. ten Wolde PR, Frenkel D (1997) Enhancement of protein crystal nucleation by critical
density fluctuations. Science 277(5334):1975–1978.2. Auer S, Frenkel D (2001) Prediction of absolute crystal-nucleation rate in hard-sphere
colloids. Nature 409(6823):1020–1023.3. Trudu F, Donadio D, Parrinello M (2006) Freezing of a Lennard-Jones fluid: From
nucleation to spinodal regime. Phys Rev Lett 97(10):105701.4. Santiso EE, Trout BL (2011) A general set of order parameters for molecular crystals.
J Chem Phys 134(6):064109.5. Peters B (2009) Competing nucleation pathways in a mixture of oppositely charged
colloids: Out-of-equilibrium nucleation revisited. J Chem Phys 131(24):244103.6. Anwar J, Zahn D (2011) Uncovering molecular processes in crystal nucleation and
growth by using molecular simulation. Angew Chem Int Ed Engl 50(9):1996–2013.7. Tribello GA, Bruneval F, Liew C, Parrinello M (2009) A molecular dynamics study of the
early stages of calcium carbonate growth. J Phys Chem B 113(34):11680–11687.8. Zahn D (2004) Atomistic mechanism of NaCl nucleation from an aqueous solution.
Phys Rev Lett 92(4):040801.9. Giberti F, Salvalaglio M, Mazzotti M, Parrinello M (2014) Insight into the nucleation
of urea crystals. Chem Eng Sci 121:51–59.10. Giberti F, Tribello G, Parrinello M (2013) Transient polymorphism in NaCl. J Chem
Theory Comput 9(6):2526–2530.11. Knott B, Molinero V, Doherty M, Peters B (2012) Homogeneous nucleation of methane
hydrates: Unrealistic under realistic conditions. J Am Chem Soc 134(48):19544–19547.12. Laio A, Parrinello M (2002) Escaping free-energy minima. Proc Natl Acad Sci USA
99(20):12562–12566.13. Wang F, Landau DP (2001) Efficient, multiple-range random walk algorithm to cal-
culate the density of states. Phys Rev Lett 86(10):2050–2053.14. Barducci A, Bussi G, Parrinello M (2008) Well-tempered metadynamics: A smoothly
converging and tunable free-energy method. Phys Rev Lett 100(2):020603.15. Bolhuis PG, Dellago C, Chandler D (2000) Reaction coordinates of biomolecular
isomerization. Proc Natl Acad Sci USA 97(11):5877–5882.16. Voter AF (1997) A method for accelerating the molecular dynamics simulation of
infrequent events. J Chem Phys 106(11):4665–4677.17. Grubmüller H (1995) Predicting slow structural transitions in macromolecular systems:
Conformational flooding. Phys Rev E Stat Phys Plasmas Fluids Relat Interdiscip Topics
52(3):2893–2906.18. Huber T, Torda AE, van Gunsteren WF (1994) Local elevation: A method for improving
the searching properties of molecular dynamics simulation. J Comput Aided Mol Des
8(6):695–708.19. Allen RJ, Valeriani C, Rein Ten Wolde P (2009) Forward flux sampling for rare event
simulations. J Phys Condens Matter 21(46):463102.20. Snow CD, Nguyen H, Pande VS, Gruebele M (2002) Absolute comparison of simulated
and experimental protein-folding dynamics. Nature 420(6911):102–106.
21. Hamelberg D, de Oliveira CAF, McCammon JA (2007) Sampling of slow diffusive con-formational transitions with accelerated molecular dynamics. J Chem Phys 127(15):155102.
22. Dama JF, Parrinello M, Voth GA (2014) Well-tempered metadynamics convergesasymptotically. Phys Rev Lett 112(24):240602.
23. Salvalaglio M, Tiwary P, Parrinello M (2014) Assessing the reliability of dynamics re-constructed from metadynamics. J Chem Theory Comput 10(4):1420–1425.
24. Tiwary P, Parrinello M (2013) From metadynamics to dynamics. Phys Rev Lett 111(23):230602.
25. Bonomi M, Barducci A, Parrinello M (2009) Reconstructing the equilibrium Boltzmanndistribution from well-tempered metadynamics. J Comput Chem 30(11):1615–1621.
26. Salvalaglio M, Vetter T, Mazzotti M, Parrinello M (2013) Controlling and predictingcrystal shapes: The case of urea. Angew Chem Int Ed Engl 52(50):13369–13372.
27. Grossier R, Veesler S (2009) Reaching one single and stable critical cluster throughfinite-sized systems. Cryst Growth Des 9(4):1917–1922.
28. Reguera D, Bowles RK, Djikaev Y, Reiss H (2003) Phase transitions in systems smallenough to be clusters. J Chem Phys 118:340–353.
29. Wedekind J, Reguera D, Strey R (2006) Finite-size effects in simulations of nucleation.J Chem Phys 125(21):214505.
30. Schmelzer JWP, Abyzov AS (2014) Comments on the thermodynamic analysis of nu-cleation in confined space. J Non-Cryst Solids 384:2–7.
31. Davey RJ, Schroeder SLM, ter Horst JH (2013) Nucleation of organic crystals—a mo-lecular perspective. Angew Chem Int Ed Engl 52(8):2166–2179.
32. Garetz BA, Aber JE, Goddard NL, Young RG, Myerson AS (1996) Nonphotochemical,polarization-dependent, laser-induced nucleation in supersaturated aqueous ureasolutions. Phys Rev Lett 77(16):3475–3476.
33. Knott B, Doherty M, Peters B (2011) A simulation test of the optical Kerr mechanismfor laser-induced nucleation. J Chem Phys 134(15):154501.
34. Knott BC, LaRue JL, Wodtke AM, Doherty MF, Peters B (2011) Communication: Bub-bles, crystals, and laser-induced nucleation. J Chem Phys 134(17):171102.
35. Swaminathan S, Craven BM (1984) The crystal structure and molecular thermal motionof urea at 12, 60 and 123 k from neutron diffraction. Acta Crystallogr B 40:300–306.
36. Ozpinar GA, Peukert W, Clark T (2010) An improved generalized AMBER force field(GAFF) for urea. J Mol Model 16(9):1427–1440.
37. Van Santen RA (1984) The Ostwald step rule. J Phys Chem 88:5768–5769.38. Salvalaglio M, Vetter T, Giberti F, Mazzotti M, Parrinello M (2012) Uncovering mo-
lecular details of urea crystal growth in the presence of additives. J Am Chem Soc134(41):17221–17233.
39. Cornell W, et al. (1995) A 2nd generation force field for the simulation of proteins,nucleic-acids, and organic molecules. J Am Chem Soc 117(19):5179–5197.
40. Wang J, Wolf RM, Caldwell JW, Kollman PA, Case DA (2004) Development and testingof a general amber force field. J Comput Chem 25(9):1157–1174.
41. Bussi G, Donadio D, Parrinello M (2007) Canonical sampling through velocity rescal-ing. J Chem Phys 126:014101.
Salvalaglio et al. PNAS | Published online December 9, 2014 | E13
CHEM
ISTR
YPN
ASPL
US

42. Parrinello M, Rahman A (1981) Polymorphic transitions in single crystals—a newmolecular-dynamics method. J Appl Phys 52:7182–7190.
43. Bonomi M, et al. (2009) PLUMED: A portable plugin for free-energy calculations withmolecular dynamics. Comput Phys Commun 180(10):1961–1972.
44. Tiwary P, Parrinello M (2014) A time-independent free energy estimator for meta-dynamics. J Phys Chem B, 10.1021/jp504920s.
45. Salvalaglio M, Giberti F, Parrinello M (2014) 1,3,5-Tris(4-bromophenyl)benzene pre-nucleation clusters from metadynamics. Acta Crystallogr C Struct Chem 70(Pt 2):132–136.
46. Sosso GC, Miceli G, Caravati S, Giberti F, Behler J, Bernasconi M (2013) Fast crystalli-zation of the phase change compound gete by large-scale molecular dynamics sim-ulations. J Phys Chem Lett 4(46):4241–4246.
E14 | www.pnas.org/cgi/doi/10.1073/pnas.1421192111 Salvalaglio et al.