Molecular dynamic simulation of thermodynamic and mechanical properties and behavior of materials...
18
Molecular dynamic simulation of thermodynamic and mechanical properties and behavior of materials when dynamic loading V.V. Dremov, A.V. Karavaev, F.A. Sapozhnikov, M.A. Vorobyova, RFNC-VNIITF, RUSSIA, E-mail: [email protected] L. Soulard CEA/DAM, France, [email protected]
-
Upload
ethel-anissa-alexander -
Category
Documents
-
view
221 -
download
2
Transcript of Molecular dynamic simulation of thermodynamic and mechanical properties and behavior of materials...
Molecular dynamic simulation of thermodynamic and mechanical properties and behavior of
materials when dynamic loading
V.V. Dremov, A.V. Karavaev, F.A. Sapozhnikov, M.A. Vorobyova,
RFNC-VNIITF, RUSSIA, E-mail: [email protected]
L. SoulardCEA/DAM, France, [email protected]
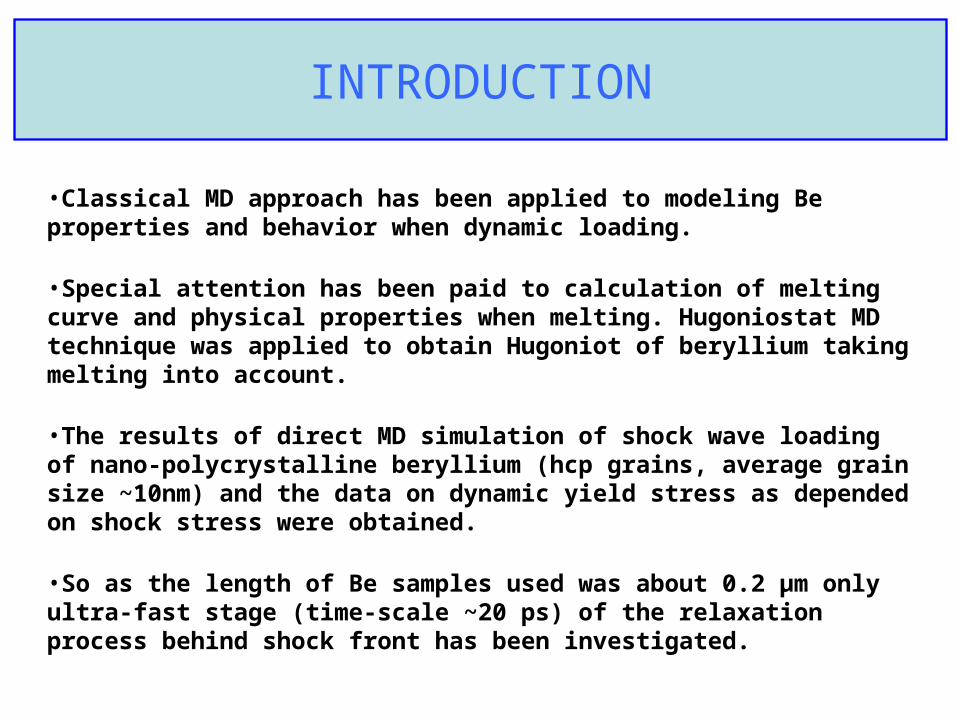
INTRODUCTION
•Classical MD approach has been applied to modeling Be properties and behavior when dynamic loading.
•Special attention has been paid to calculation of melting curve and physical properties when melting. Hugoniostat MD technique was applied to obtain Hugoniot of beryllium taking melting into account.
•The results of direct MD simulation of shock wave loading of nano-polycrystalline beryllium (hcp grains, average grain size ~10nm) and the data on dynamic yield stress as depended on shock stress were obtained.
•So as the length of Be samples used was about 0.2 μm only ultra-fast stage (time-scale ~20 ps) of the relaxation process behind shock front has been investigated.
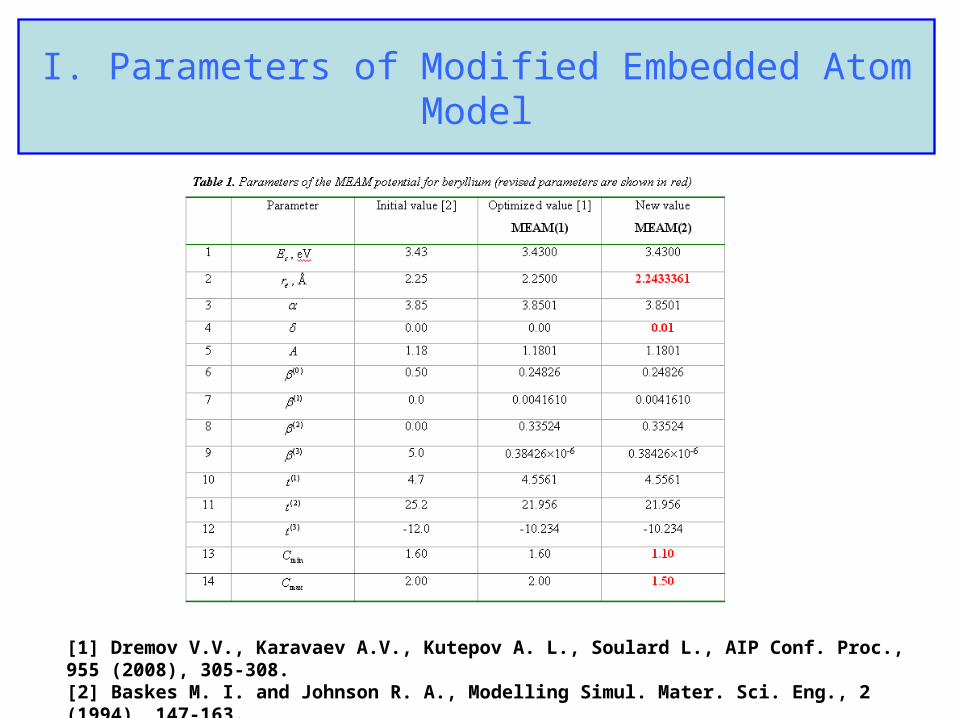
I. Parameters of Modified Embedded Atom Model
[1] Dremov V.V., Karavaev A.V., Kutepov A. L., Soulard L., AIP Conf. Proc., 955 (2008), 305-308.[2] Baskes M. I. and Johnson R. A., Modelling Simul. Mater. Sci. Eng., 2 (1994), 147-163.
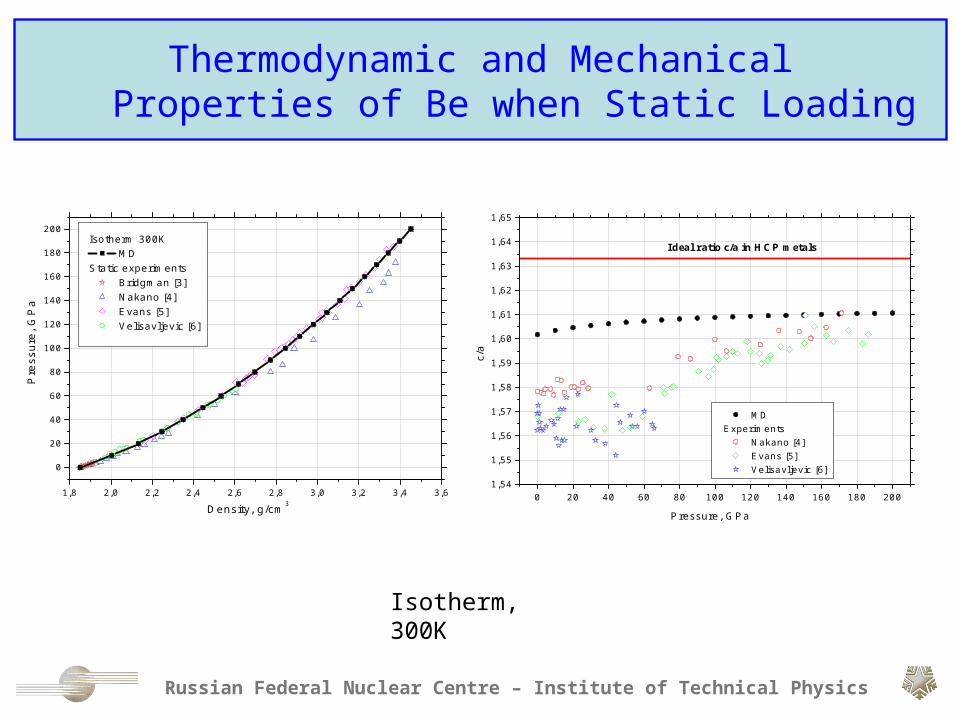
Thermodynamic and Mechanical Properties of Be when Static Loading
Russian Federal Nuclear Centre – Institute of Technical Physics
1,8 2,0 2,2 2,4 2,6 2,8 3,0 3,2 3,4 3,6
0
20
40
60
80
100
120
140
160
180
200
Pre
ssur
e, G
Pa
Density, g/cm3
Isotherm 300K MD
Static experiments Bridgman [3] Nakano [4] Evans [5] Velisavljevic [6]
Isotherm, 300K
0 20 40 60 80 100 120 140 160 180 2001,54
1,55
1,56
1,57
1,58
1,59
1,60
1,61
1,62
1,63
1,64
1,65
c/a
Pressure, GPa
MDExperiments
Nakano [4] Evans [5] Velisavljevic [6]
Ideal ratio c/a in HCP metals

Russian Federal Nuclear Centre – Institute of Technical Physics
Thermodynamic and Mechanical Properties of Be when Static Loading
0,0 0,1 0,2 0,3 0,4 0,5 0,6 0,7 0,8 0,9 1,0 1,1 1,2 1,3 1,4 1,51,72
1,74
1,76
1,78
1,80
1,82
1,84
1,86
1,88
Den
sity
, g/
cm3
Temperature, 103 K
MD Exp. [23]
Isobar, P=0
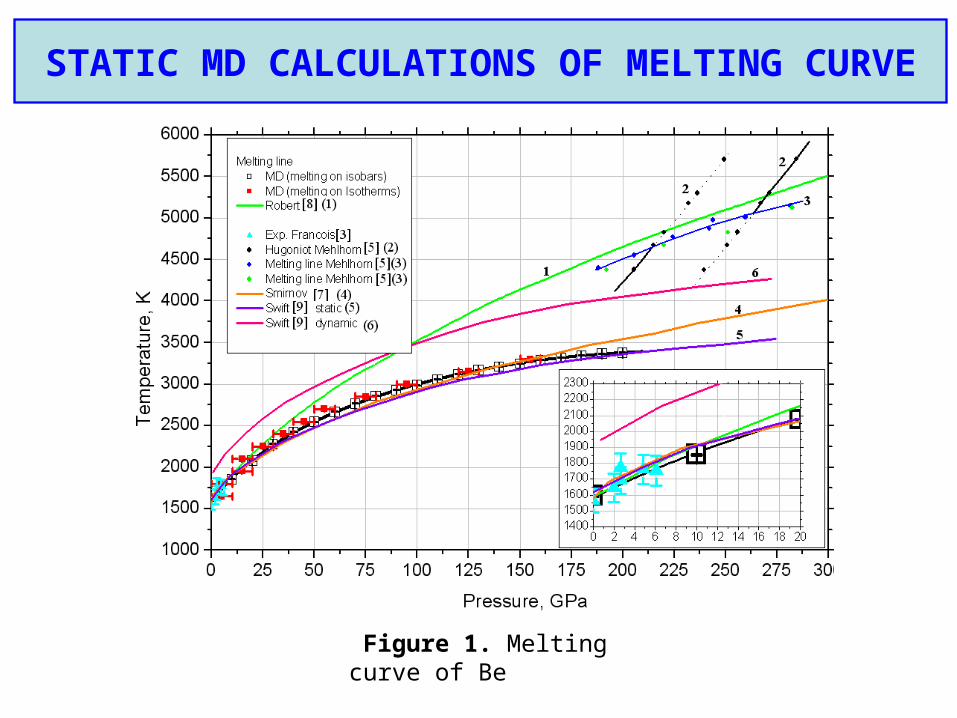
STATIC MD CALCULATIONS OF MELTING CURVE
Figure 1. Melting curve of Be
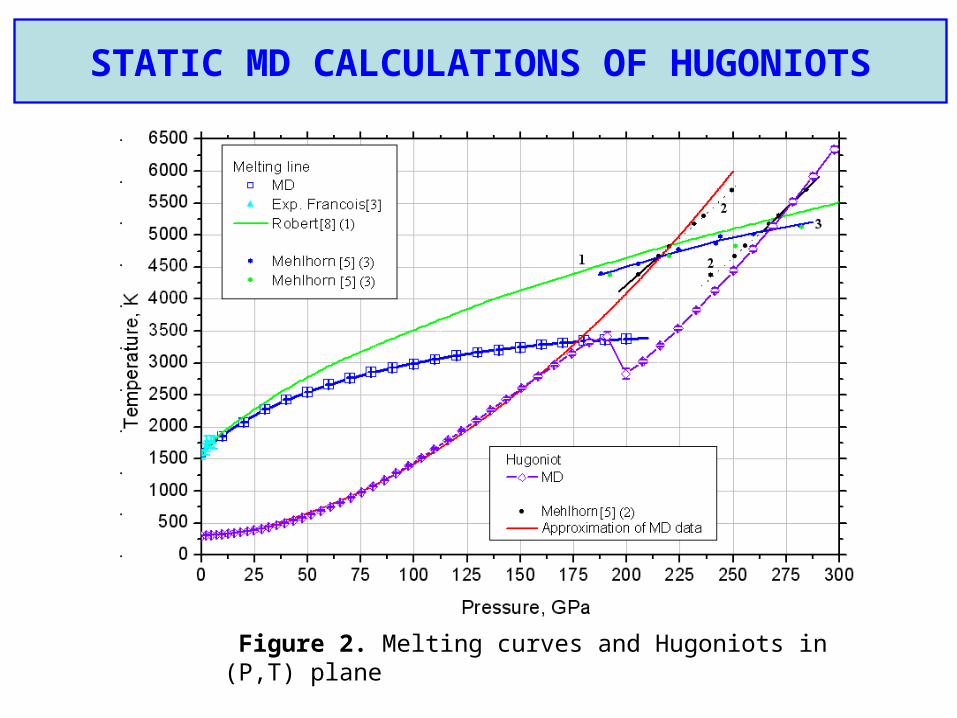
STATIC MD CALCULATIONS OF HUGONIOTS
Figure 2. Melting curves and Hugoniots in (P,T) plane
Russian Federal Nuclear Centre – Institute of Technical Physics
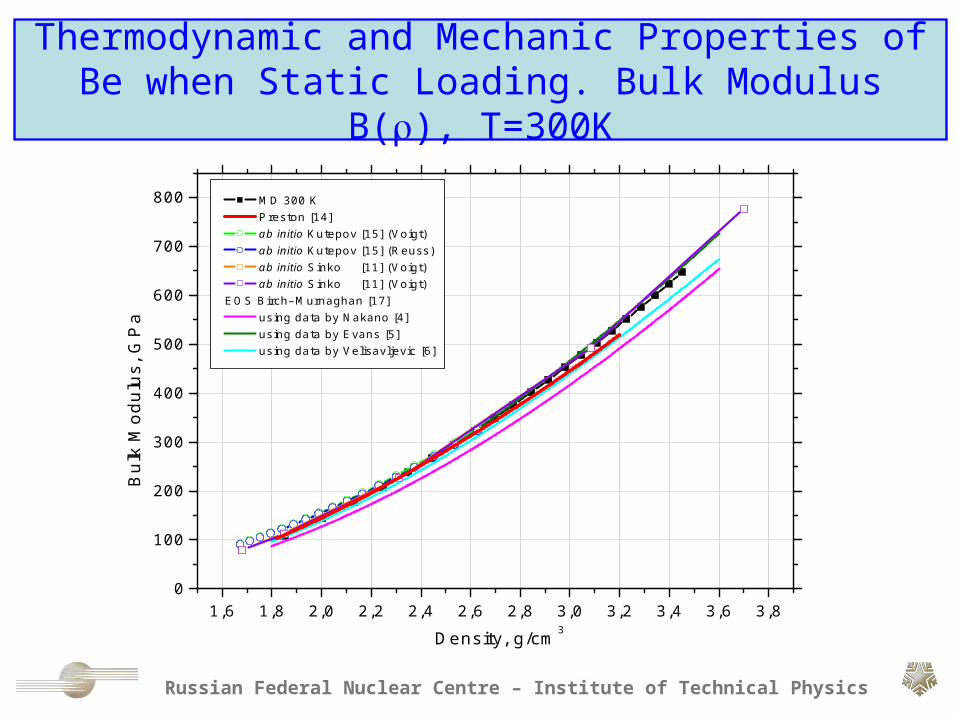
Thermodynamic and Mechanic Properties of Be when Static Loading. Bulk Modulus B(), T=300K
1,6 1,8 2,0 2,2 2,4 2,6 2,8 3,0 3,2 3,4 3,6 3,80
100
200
300
400
500
600
700
800 MD 300 K Preston [14] ab initio Kutepov [15] (Voigt) ab initio Kutepov [15] (Reuss) ab initio Sinko [11] (Voigt) ab initio Sinko [11] (Voigt)
EOS Birch–Murnaghan [17] using data by Nakano [4] using data by Evans [5] using data by Velisavljevic [6]
B
ulk
Mod
ulus
, GP
a
Density, g/cm3
Russian Federal Nuclear Centre – Institute of Technical Physics
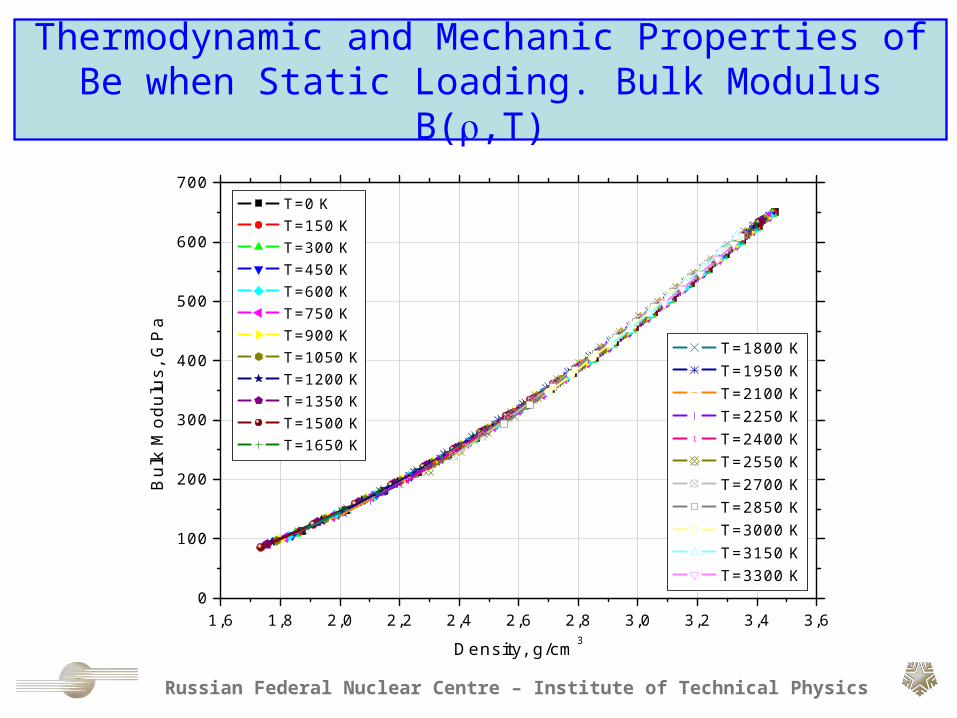
Thermodynamic and Mechanic Properties of Be when Static Loading. Bulk Modulus B(,T)
1,6 1,8 2,0 2,2 2,4 2,6 2,8 3,0 3,2 3,4 3,60
100
200
300
400
500
600
700
1
2
3
4
5
6
7
8
9
10
11
12
13
14
15
1617
T=1800 K T=1950 K T=2100 K T=2250 K
1 T=2400 K T=2550 K T=2700 K T=2850 K T=3000 K T=3150 K T=3300 K
T=0 K T=150 K T=300 K T=450 K T=600 K T=750 K T=900 K T=1050 K T=1200 K T=1350 K T=1500 K T=1650 K
B
ulk
Mod
ulus
, GP
a
Density, g/cm3
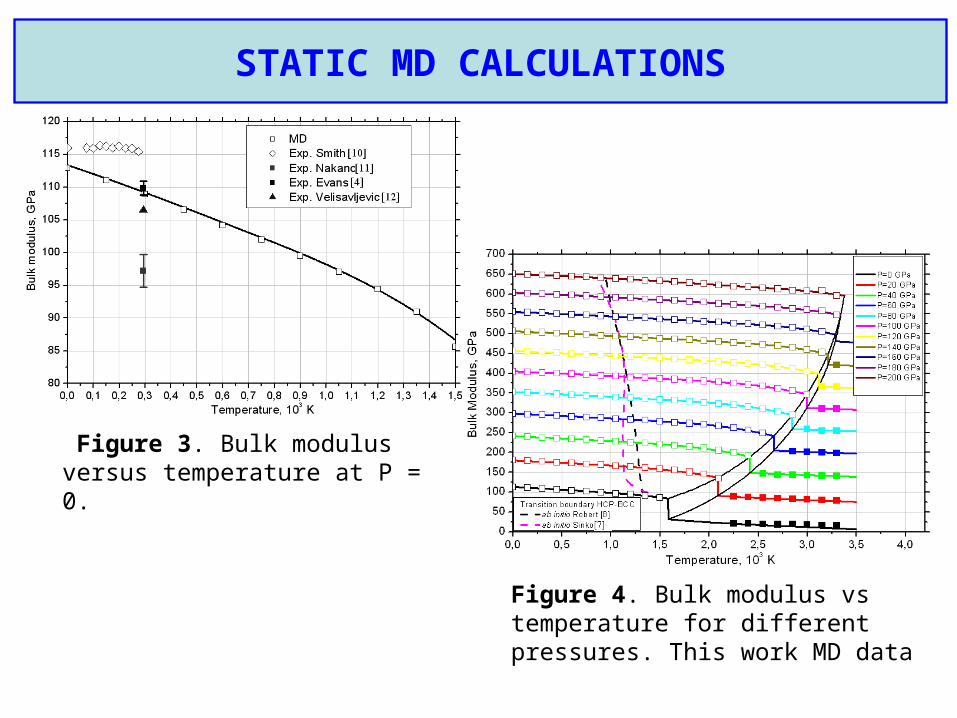
STATIC MD CALCULATIONS
Figure 3. Bulk modulus versus temperature at P = 0.
Figure 4. Bulk modulus vs temperature for different pressures. This work MD data
Russian Federal Nuclear Centre – Institute of Technical Physics
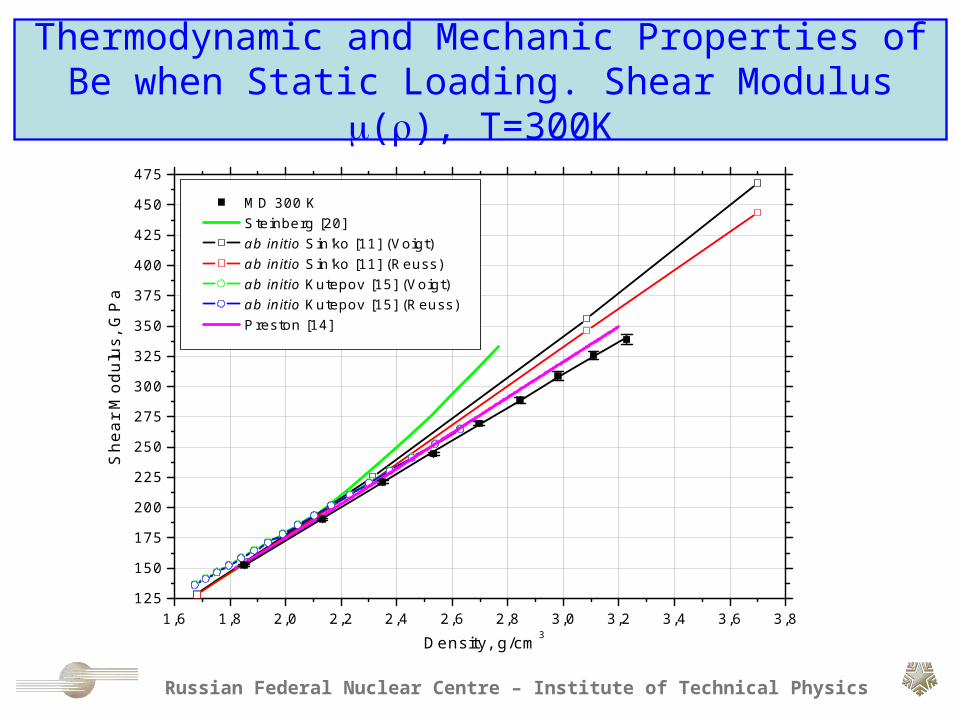
Thermodynamic and Mechanic Properties of Be when Static Loading. Shear Modulus (), T=300K
1,6 1,8 2,0 2,2 2,4 2,6 2,8 3,0 3,2 3,4 3,6 3,8125
150
175
200
225
250
275
300
325
350
375
400
425
450
475
MD 300 K Steinberg [20] ab initio Sin'ko [11] (Voigt) ab initio Sin'ko [11] (Reuss) ab initio Kutepov [15] (Voigt) ab initio Kutepov [15] (Reuss) Preston [14]
She
ar M
odul
us,
GP
a
Density, g/cm3
Russian Federal Nuclear Centre – Institute of Technical Physics
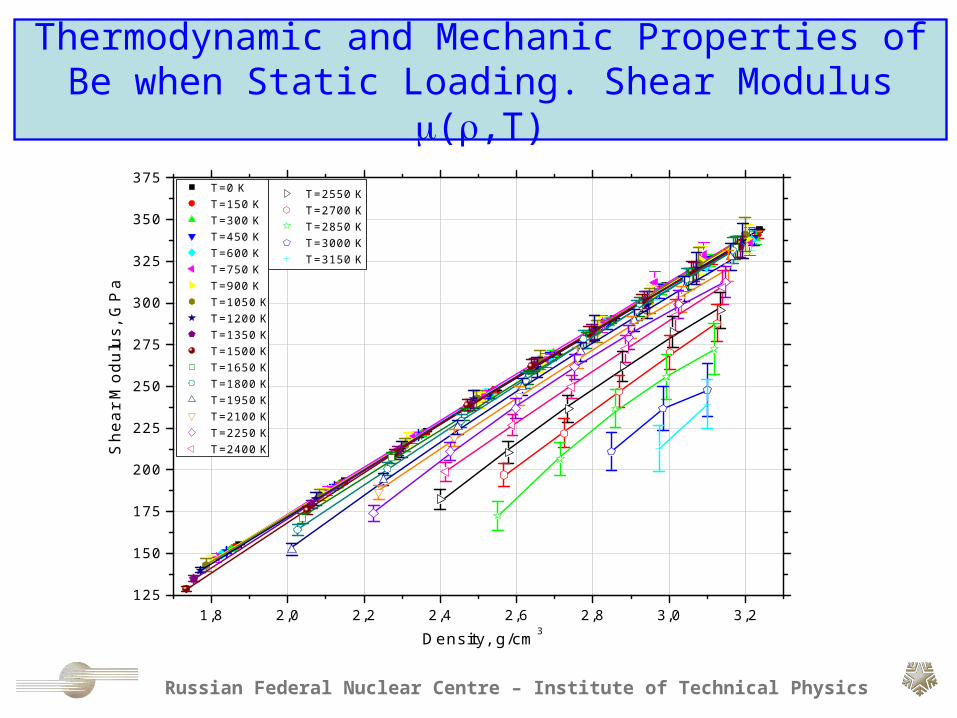
Thermodynamic and Mechanic Properties of Be when Static Loading. Shear Modulus (,T)
1,8 2,0 2,2 2,4 2,6 2,8 3,0 3,2125
150
175
200
225
250
275
300
325
350
375
T=2550 K T=2700 K T=2850 K T=3000 K T=3150 K
Sh
ea
r M
od
ulu
s, G
Pa
Density, g/cm3
T=0 K T=150 K T=300 K T=450 K T=600 K T=750 K T=900 K T=1050 K T=1200 K T=1350 K T=1500 K T=1650 K T=1800 K T=1950 K T=2100 K T=2250 K T=2400 K
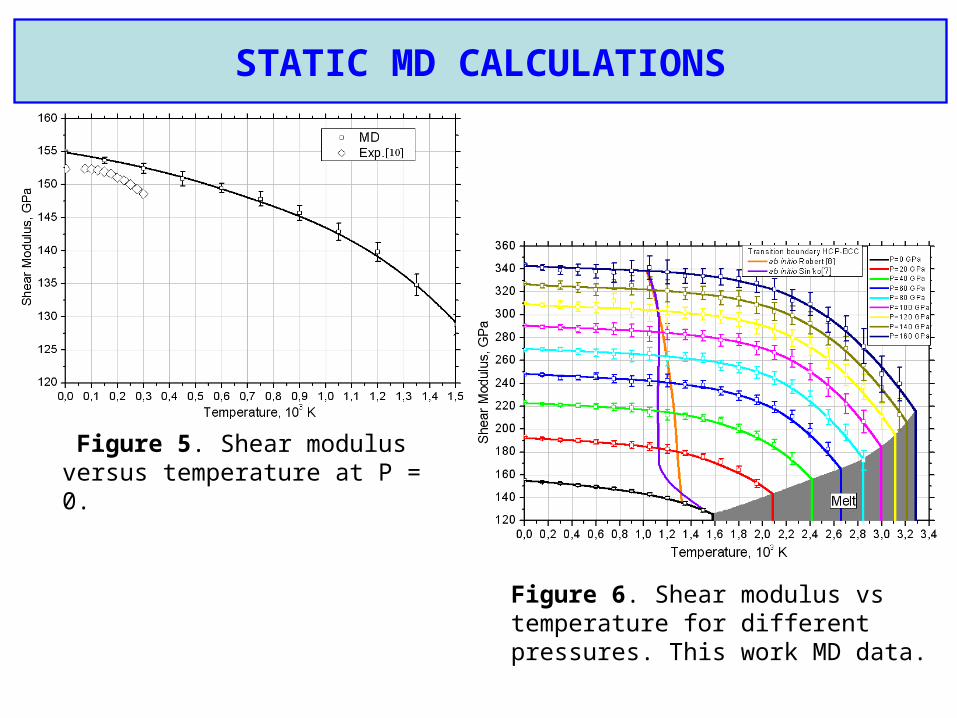
STATIC MD CALCULATIONS
Figure 5. Shear modulus versus temperature at P = 0.
Figure 6. Shear modulus vs temperature for different pressures. This work MD data.
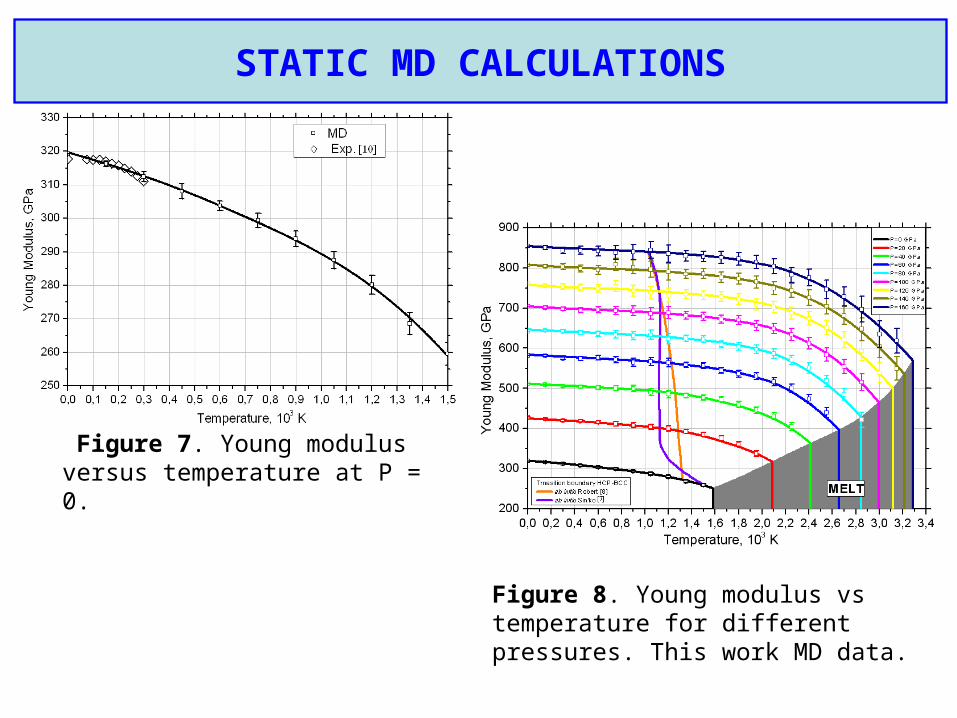
STATIC MD CALCULATIONS
Figure 7. Young modulus versus temperature at P = 0.
Figure 8. Young modulus vs temperature for different pressures. This work MD data.
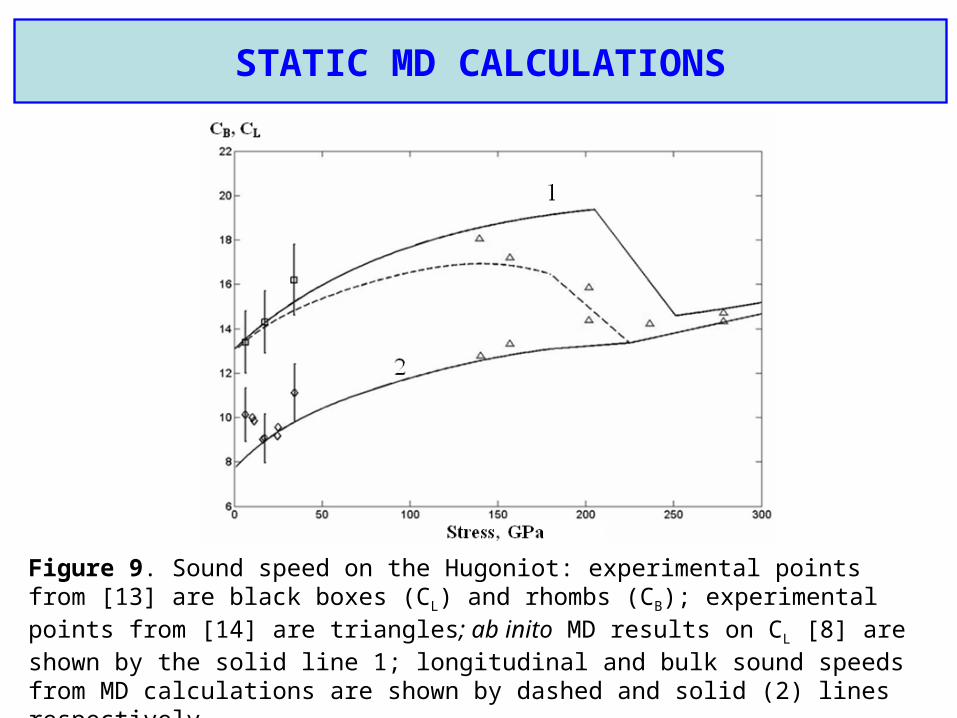
STATIC MD CALCULATIONS
Figure 9. Sound speed on the Hugoniot: experimental points from [13] are black boxes (CL) and rhombs (CB); experimental points from [14] are triangles; ab inito MD results on CL [8] are shown by the solid line 1; longitudinal and bulk sound speeds from MD calculations are shown by dashed and solid (2) lines respectively.
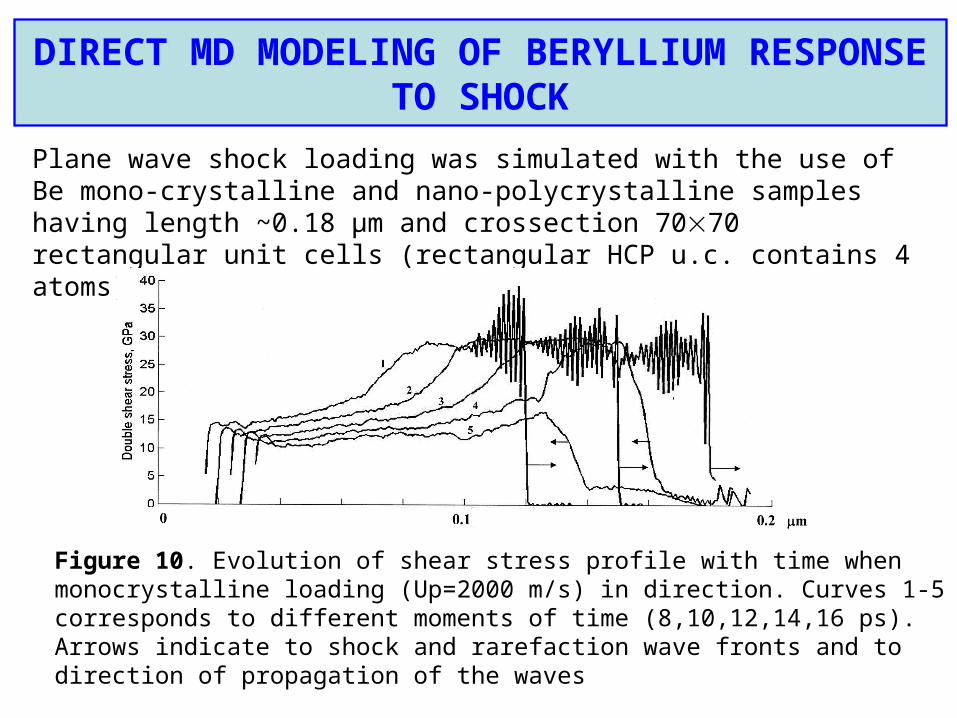
DIRECT MD MODELING OF BERYLLIUM RESPONSE TO SHOCK
Plane wave shock loading was simulated with the use of Be mono-crystalline and nano-polycrystalline samples having length ~0.18 μm and crossection 7070 rectangular unit cells (rectangular HCP u.c. contains 4 atoms).
Figure 10. Evolution of shear stress profile with time when monocrystalline loading (Up=2000 m/s) in direction. Curves 1-5 corresponds to different moments of time (8,10,12,14,16 ps). Arrows indicate to shock and rarefaction wave fronts and to direction of propagation of the waves
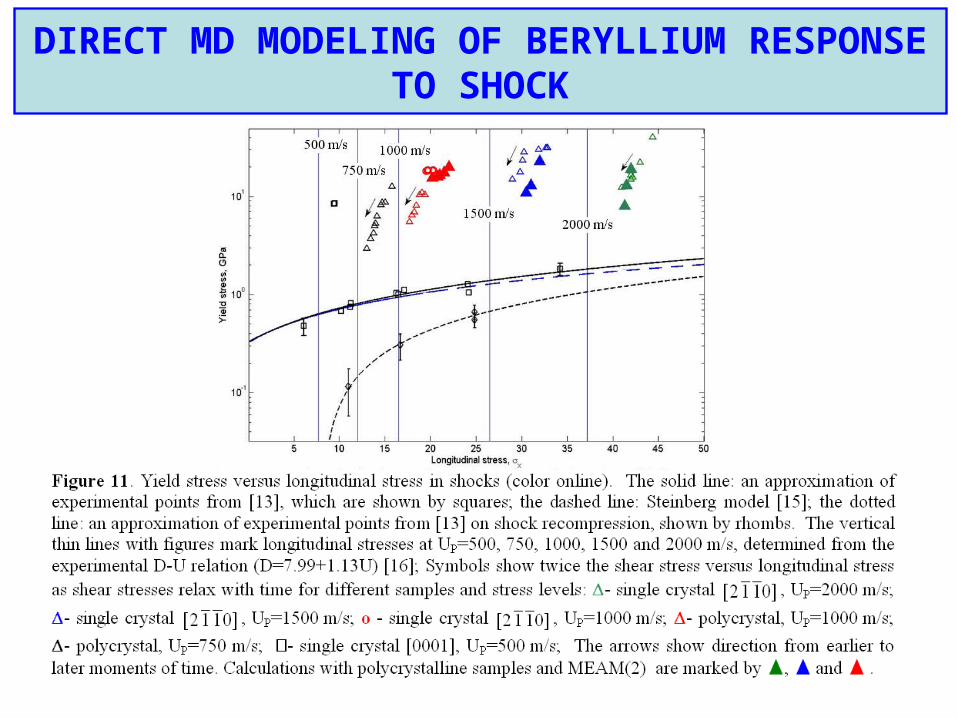
DIRECT MD MODELING OF BERYLLIUM RESPONSE TO SHOCK
CONCLUSION
Obtained results suggest that
•the new potential gives a temperature of melting at P=0, which is close to the experimental 1550K;
•the temperature of melting commencement on the Hugoniot is about 1500K lower than that from quantum MD (possible effect of the system size?);
•all Hugoniot data agree well with each other in P-T coordinates;
•bulk and longitudinal sound speeds along the Hugoniot were obtained in a wide pressure range with the use of (P-T) tabulated elastic moduli and the Hugoniot. The data agree well with the available experimental data;
•MD investigation into the elastic-plastic properties of Be suggests that at times typical for the MD simulation and the level of loading about 10-40 GPa, the yield stress for both monocrystalline and polycrystalline samples is much higher than in experiments. More properly, we should say about the effective yield stress whose value is defined by relatively slow kinetics of elastic-plastic deformation.