Molecular diversity and phylogeny in geographical collection of chickpea (Cicer sp.) accessions
7
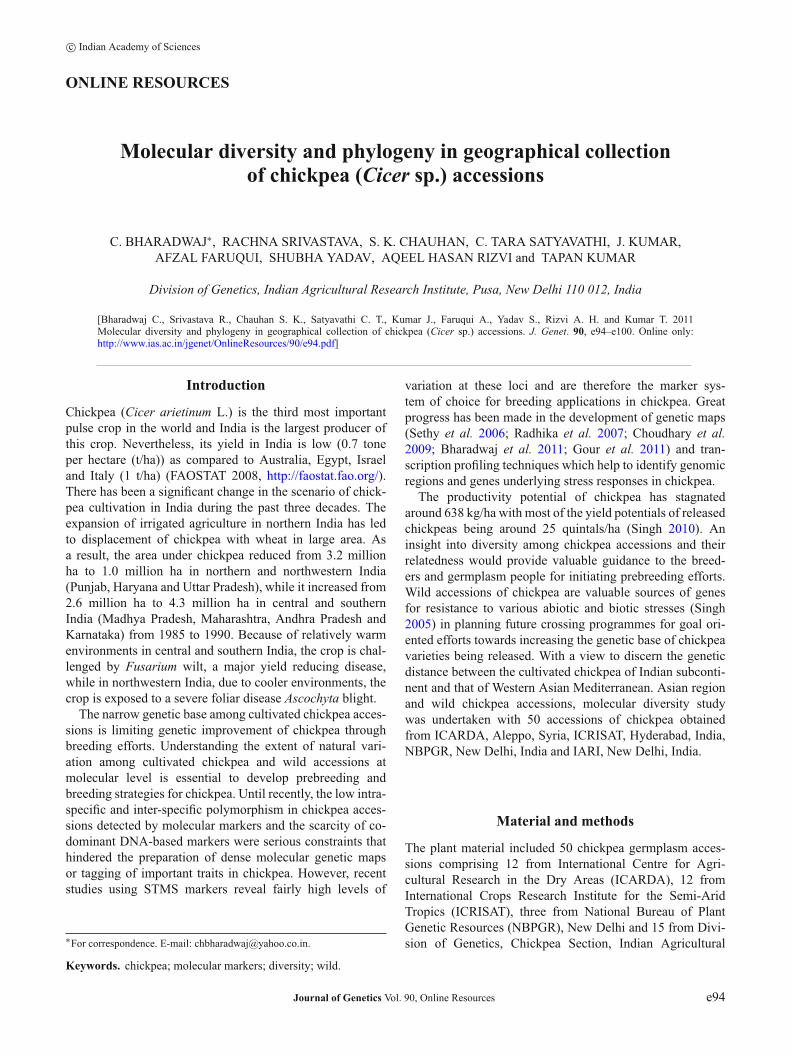
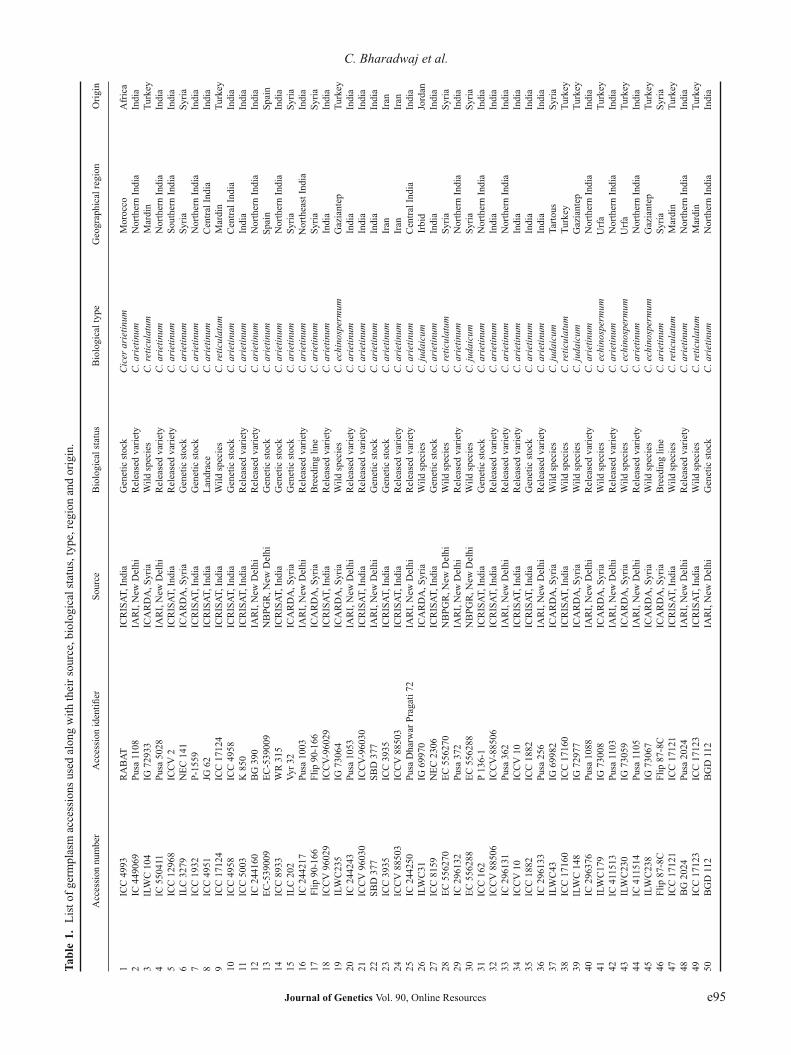
c Indian Academy of Sciences ONLINE RESOURCES Molecular diversity and phylogeny in geographical collection of chickpea (Cicer sp.) accessions C. BHARADWAJ ∗ , RACHNA SRIVASTAVA, S.K. CHAUHAN, C. TARA SATYAVATHI, J.KUMAR, AFZALFARUQUI, SHUBHA YADAV, AQEELHASAN RIZVI and TAPAN KUMAR Division of Genetics, Indian Agricultural Research Institute, Pusa, New Delhi 110 012, India [Bharadwaj C., Srivastava R., Chauhan S. K., Satyavathi C. T., Kumar J., Faruqui A., Yadav S., Rizvi A. H. and Kumar T. 2011 Molecular diversity and phylogeny in geographical collection of chickpea (Cicer sp.) accessions. J. Genet. 90, e94–e100. Online only: http://www.ias.ac.in/jgenet/OnlineResources/90/e94.pdf] Introduction Chickpea (Cicer arietinum L.) is the third most important pulse crop in the world and India is the largest producer of this crop. Nevertheless, its yield in India is low (0.7 tone per hectare (t/ha)) as compared to Australia, Egypt, Israel and Italy (1 t/ha) (FAOSTAT 2008, http://faostat.fao.org/). There has been a significant change in the scenario of chick- pea cultivation in India during the past three decades. The expansion of irrigated agriculture in northern India has led to displacement of chickpea with wheat in large area. As a result, the area under chickpea reduced from 3.2 million ha to 1.0 million ha in northern and northwestern India (Punjab, Haryana and Uttar Pradesh), while it increased from 2.6 million ha to 4.3 million ha in central and southern India (Madhya Pradesh, Maharashtra, Andhra Pradesh and Karnataka) from 1985 to 1990. Because of relatively warm environments in central and southern India, the crop is chal- lenged by Fusarium wilt, a major yield reducing disease, while in northwestern India, due to cooler environments, the crop is exposed to a severe foliar disease Ascochyta blight. The narrow genetic base among cultivated chickpea acces- sions is limiting genetic improvement of chickpea through breeding efforts. Understanding the extent of natural vari- ation among cultivated chickpea and wild accessions at molecular level is essential to develop prebreeding and breeding strategies for chickpea. Until recently, the low intra- specific and inter-specific polymorphism in chickpea acces- sions detected by molecular markers and the scarcity of co- dominant DNA-based markers were serious constraints that hindered the preparation of dense molecular genetic maps or tagging of important traits in chickpea. However, recent studies using STMS markers reveal fairly high levels of ∗ For correspondence. E-mail: [email protected]. variation at these loci and are therefore the marker sys- tem of choice for breeding applications in chickpea. Great progress has been made in the development of genetic maps (Sethy et al. 2006; Radhika et al. 2007; Choudhary et al. 2009; Bharadwaj et al. 2011; Gour et al. 2011) and tran- scription profiling techniques which help to identify genomic regions and genes underlying stress responses in chickpea. The productivity potential of chickpea has stagnated around 638 kg/ha with most of the yield potentials of released chickpeas being around 25 quintals/ha (Singh 2010). An insight into diversity among chickpea accessions and their relatedness would provide valuable guidance to the breed- ers and germplasm people for initiating prebreeding efforts. Wild accessions of chickpea are valuable sources of genes for resistance to various abiotic and biotic stresses (Singh 2005) in planning future crossing programmes for goal ori- ented efforts towards increasing the genetic base of chickpea varieties being released. With a view to discern the genetic distance between the cultivated chickpea of Indian subconti- nent and that of Western Asian Mediterranean. Asian region and wild chickpea accessions, molecular diversity study was undertaken with 50 accessions of chickpea obtained from ICARDA, Aleppo, Syria, ICRISAT, Hyderabad, India, NBPGR, New Delhi, India and IARI, New Delhi, India. Material and methods The plant material included 50 chickpea germplasm acces- sions comprising 12 from International Centre for Agri- cultural Research in the Dry Areas (ICARDA), 12 from International Crops Research Institute for the Semi-Arid Tropics (ICRISAT), three from National Bureau of Plant Genetic Resources (NBPGR), New Delhi and 15 from Divi- sion of Genetics, Chickpea Section, Indian Agricultural Keywords. chickpea; molecular markers; diversity; wild. Journal of Genetics Vol. 90, Online Resources e94
Transcript of Molecular diversity and phylogeny in geographical collection of chickpea (Cicer sp.) accessions
c© Indian Academy of Sciences
ONLINE RESOURCES
Molecular diversity and phylogeny in geographical collectionof chickpea (Cicer sp.) accessions
C. BHARADWAJ∗, RACHNA SRIVASTAVA, S. K. CHAUHAN, C. TARA SATYAVATHI, J. KUMAR,AFZAL FARUQUI, SHUBHA YADAV, AQEEL HASAN RIZVI and TAPAN KUMAR
Division of Genetics, Indian Agricultural Research Institute, Pusa, New Delhi 110 012, India
[Bharadwaj C., Srivastava R., Chauhan S. K., Satyavathi C. T., Kumar J., Faruqui A., Yadav S., Rizvi A. H. and Kumar T. 2011Molecular diversity and phylogeny in geographical collection of chickpea (Cicer sp.) accessions. J. Genet. 90, e94–e100. Online only:http://www.ias.ac.in/jgenet/OnlineResources/90/e94.pdf]
Introduction
Chickpea (Cicer arietinum L.) is the third most importantpulse crop in the world and India is the largest producer ofthis crop. Nevertheless, its yield in India is low (0.7 toneper hectare (t/ha)) as compared to Australia, Egypt, Israeland Italy (1 t/ha) (FAOSTAT 2008, http://faostat.fao.org/).There has been a significant change in the scenario of chick-pea cultivation in India during the past three decades. Theexpansion of irrigated agriculture in northern India has ledto displacement of chickpea with wheat in large area. Asa result, the area under chickpea reduced from 3.2 millionha to 1.0 million ha in northern and northwestern India(Punjab, Haryana and Uttar Pradesh), while it increased from2.6 million ha to 4.3 million ha in central and southernIndia (Madhya Pradesh, Maharashtra, Andhra Pradesh andKarnataka) from 1985 to 1990. Because of relatively warmenvironments in central and southern India, the crop is chal-lenged by Fusarium wilt, a major yield reducing disease,while in northwestern India, due to cooler environments, thecrop is exposed to a severe foliar disease Ascochyta blight.
The narrow genetic base among cultivated chickpea acces-sions is limiting genetic improvement of chickpea throughbreeding efforts. Understanding the extent of natural vari-ation among cultivated chickpea and wild accessions atmolecular level is essential to develop prebreeding andbreeding strategies for chickpea. Until recently, the low intra-specific and inter-specific polymorphism in chickpea acces-sions detected by molecular markers and the scarcity of co-dominant DNA-based markers were serious constraints thathindered the preparation of dense molecular genetic mapsor tagging of important traits in chickpea. However, recentstudies using STMS markers reveal fairly high levels of
∗For correspondence. E-mail: [email protected].
variation at these loci and are therefore the marker sys-tem of choice for breeding applications in chickpea. Greatprogress has been made in the development of genetic maps(Sethy et al. 2006; Radhika et al. 2007; Choudhary et al.2009; Bharadwaj et al. 2011; Gour et al. 2011) and tran-scription profiling techniques which help to identify genomicregions and genes underlying stress responses in chickpea.
The productivity potential of chickpea has stagnatedaround 638 kg/ha with most of the yield potentials of releasedchickpeas being around 25 quintals/ha (Singh 2010). Aninsight into diversity among chickpea accessions and theirrelatedness would provide valuable guidance to the breed-ers and germplasm people for initiating prebreeding efforts.Wild accessions of chickpea are valuable sources of genesfor resistance to various abiotic and biotic stresses (Singh2005) in planning future crossing programmes for goal ori-ented efforts towards increasing the genetic base of chickpeavarieties being released. With a view to discern the geneticdistance between the cultivated chickpea of Indian subconti-nent and that of Western Asian Mediterranean. Asian regionand wild chickpea accessions, molecular diversity studywas undertaken with 50 accessions of chickpea obtainedfrom ICARDA, Aleppo, Syria, ICRISAT, Hyderabad, India,NBPGR, New Delhi, India and IARI, New Delhi, India.
Material and methods
The plant material included 50 chickpea germplasm acces-sions comprising 12 from International Centre for Agri-cultural Research in the Dry Areas (ICARDA), 12 fromInternational Crops Research Institute for the Semi-AridTropics (ICRISAT), three from National Bureau of PlantGenetic Resources (NBPGR), New Delhi and 15 from Divi-sion of Genetics, Chickpea Section, Indian Agricultural
Keywords. chickpea; molecular markers; diversity; wild.
Journal of Genetics Vol. 90, Online Resources e94
C. Bharadwaj et al.Ta
ble
1.Li
stof
germ
plas
mac
cess
ions
used
alon
gw
ithth
eirs
ourc
e,bi
olog
ical
stat
us,t
ype,
regi
onan
dor
igin
.
Acc
essi
onnu
mbe
rA
cces
sion
iden
tifier
Sour
ceB
iolo
gica
lsta
tus
Bio
logi
calt
ype
Geo
grap
hica
lreg
ion
Orig
in
1IC
C49
93R
AB
ATIC
RIS
AT,I
ndia
Gen
etic
stoc
kC
icer
arie
tinum
Mor
occo
Afr
ica
2IC
4490
69Pu
sa11
08IA
RI,
New
Del
hiR
elea
sed
varie
tyC
.ari
etin
umN
orth
ern
Indi
aIn
dia
3IL
WC
104
IG72
933
ICA
RD
A,S
yria
Wild
spec
ies
C.r
etic
ulat
umM
ardi
nTu
rkey
4IC
5504
11Pu
sa50
28IA
RI,
New
Del
hiR
elea
sed
varie
tyC
.ari
etin
umN
orth
ern
Indi
aIn
dia
5IC
C12
968
ICC
V2
ICR
ISAT
,Ind
iaR
elea
sed
varie
tyC
.ari
etin
umSo
uthe
rnIn
dia
Indi
a6
ILC
3279
NEC
141
ICA
RD
A,S
yria
Gen
etic
stoc
kC
.ari
etin
umSy
riaSy
ria7
ICC
1932
P-15
59IC
RIS
AT,I
ndia
Gen
etic
stoc
kC
.ari
etin
umN
orth
ern
Indi
aIn
dia
8IC
C49
51JG
62IC
RIS
AT,I
ndia
Land
race
C.a
riet
inum
Cen
tralI
ndia
Indi
a9
ICC
1712
4IC
C17
124
ICR
ISAT
,Ind
iaW
ildsp
ecie
sC
.ret
icul
atum
Mar
din
Turk
ey10
ICC
4958
ICC
4958
ICR
ISAT
,Ind
iaG
enet
icst
ock
C.a
riet
inum
Cen
tralI
ndia
Indi
a11
ICC
5003
K85
0IC
RIS
AT,I
ndia
Rel
ease
dva
riety
C.a
riet
inum
Indi
aIn
dia
12IC
2441
60B
G39
0IA
RI,
New
Del
hiR
elea
sed
varie
tyC
.ari
etin
umN
orth
ern
Indi
aIn
dia
13EC
-539
009
EC-5
3900
9N
BPG
R,N
ewD
elhi
Gen
etic
stoc
kC
.ari
etin
umSp
ain
Spai
n14
ICC
8933
WR
315
ICR
ISAT
,Ind
iaG
enet
icst
ock
C.a
riet
inum
Nor
ther
nIn
dia
Indi
a15
ILC
202
Vyr3
2IC
AR
DA
,Syr
iaG
enet
icst
ock
C.a
riet
inum
Syria
Syria
16IC
2442
17Pu
sa10
03IA
RI,
New
Del
hiR
elea
sed
varie
tyC
.ari
etin
umN
orth
east
Indi
aIn
dia
17Fl
ip90
-166
Flip
90-1
66IC
AR
DA
,Syr
iaB
reed
ing
line
C.a
riet
inum
Syria
Syria
18IC
CV
9602
9IC
CV-
9602
9IC
RIS
AT,I
ndia
Rel
ease
dva
riety
C.a
riet
inum
Indi
aIn
dia
19IL
WC
235
IG73
064
ICA
RD
A,S
yria
Wild
spec
ies
C.e
chin
ospe
rmum
Gaz
iant
epTu
rkey
20IC
2442
43Pu
sa10
53IA
RI,
New
Del
hiR
elea
sed
varie
tyC
.ari
etin
umIn
dia
Indi
a21
ICC
V96
030
ICC
V-96
030
ICR
ISAT
,Ind
iaR
elea
sed
varie
tyC
.ari
etin
umIn
dia
Indi
a22
SBD
377
SBD
377
IAR
I,N
ewD
elhi
Gen
etic
stoc
kC
.ari
etin
umIn
dia
Indi
a23
ICC
3935
ICC
3935
ICR
ISAT
,Ind
iaG
enet
icst
ock
C.a
riet
inum
Iran
Iran
24IC
CV
8850
3IC
CV
8850
3IC
RIS
AT,I
ndia
Rel
ease
dva
riety
C.a
riet
inum
Iran
Iran
25IC
2442
50Pu
saD
harw
arPr
agat
i72
IAR
I,N
ewD
elhi
Rel
ease
dva
riety
C.a
riet
inum
Cen
tralI
ndia
Indi
a26
ILW
C31
IG69
970
ICA
RD
A,S
yria
Wild
spec
ies
C.j
udai
cum
Irbi
dJo
rdan
27IC
C81
59N
EC23
06IC
RIS
AT,I
ndia
Gen
etic
stoc
kC
.ari
etin
umIn
dia
Indi
a28
EC55
6270
EC55
6270
NB
PGR
,New
Del
hiW
ildsp
ecie
sC
.ret
icul
atum
Syria
Syria
29IC
2961
32Pu
sa37
2IA
RI,
New
Del
hiR
elea
sed
varie
tyC
.ari
etin
umN
orth
ern
Indi
aIn
dia
30EC
5562
88EC
5562
88N
BPG
R,N
ewD
elhi
Wild
spec
ies
C.j
udai
cum
Syria
Syria
31IC
C16
2P
136-
1IC
RIS
AT,I
ndia
Gen
etic
stoc
kC
.ari
etin
umN
orth
ern
Indi
aIn
dia
32IC
CV
8850
6IC
CV-
8850
6IC
RIS
AT,I
ndia
Rel
ease
dva
riety
C.a
riet
inum
Indi
aIn
dia
33IC
2961
31Pu
sa36
2IA
RI,
New
Del
hiR
elea
sed
varie
tyC
.ari
etin
umN
orth
ern
Indi
aIn
dia
34IC
CV
10IC
CV
10IC
RIS
AT,I
ndia
Rel
ease
dva
riety
C.a
riet
inum
Indi
aIn
dia
35IC
C18
82IC
C18
82IC
RIS
AT,I
ndia
Gen
etic
stoc
kC
.ari
etin
umIn
dia
Indi
a36
IC29
6133
Pusa
256
IAR
I,N
ewD
elhi
Rel
ease
dva
riety
C.a
riet
inum
Indi
aIn
dia
37IL
WC
43IG
6998
2IC
AR
DA
,Syr
iaW
ildsp
ecie
sC
.jud
aicu
mTa
rtous
Syria
38IC
C17
160
ICC
1716
0IC
RIS
AT,I
ndia
Wild
spec
ies
C.r
etic
ulat
umTu
rkey
Turk
ey39
ILW
C14
8IG
7297
7IC
AR
DA
,Syr
iaW
ildsp
ecie
sC
.jud
aicu
mG
azia
ntep
Turk
ey40
IC29
6376
Pusa
1088
IAR
I,N
ewD
elhi
Rel
ease
dva
riety
C.a
riet
inum
Nor
ther
nIn
dia
Indi
a41
ILW
C17
9IG
7300
8IC
AR
DA
,Syr
iaW
ildsp
ecie
sC
.ech
inos
perm
umU
rfa
Turk
ey42
IC41
1513
Pusa
1103
IAR
I,N
ewD
elhi
Rel
ease
dva
riety
C.a
riet
inum
Nor
ther
nIn
dia
Indi
a43
ILW
C23
0IG
7305
9IC
AR
DA
,Syr
iaW
ildsp
ecie
sC
.ech
inos
perm
umU
rfa
Turk
ey44
IC41
1514
Pusa
1105
IAR
I,N
ewD
elhi
Rel
ease
dva
riety
C.a
riet
inum
Nor
ther
nIn
dia
Indi
a45
ILW
C23
8IG
7306
7IC
AR
DA
,Syr
iaW
ildsp
ecie
sC
.ech
inos
perm
umG
azia
ntep
Turk
ey46
Flip
87-8
CFl
ip87
-8C
ICA
RD
A,S
yria
Bre
edin
glin
eC
.ari
etin
umSy
riaSy
ria47
ICC
1712
1IC
C17
121
ICR
ISAT
,Ind
iaW
ildsp
ecie
sC
.ret
icul
atum
Mar
din
Turk
ey48
BG
2024
Pusa
2024
IAR
I,N
ewD
elhi
Rel
ease
dva
riety
C.a
riet
inum
Nor
ther
nIn
dia
Indi
a49
ICC
1712
3IC
C17
123
ICR
ISAT
,Ind
iaW
ildsp
ecie
sC
.ret
icul
atum
Mar
din
Turk
ey50
BG
D11
2B
GD
112
IAR
I,N
ewD
elhi
Gen
etic
stoc
kC
.ari
etin
umN
orth
ern
Indi
aIn
dia
Journal of Genetics Vol. 90, Online Resources e95

Molecular diversity in chickpea
Research Institute (IARI), New Delhi (table 1). The acces-sions had 13 wildtypes and 37 annual cultivated lines. LeafDNA of about 100 mg of fresh young leaf tissue was col-lected during December 2009–2010, immediately frozen inliquid nitrogen and stored at −80◦C. Isolation of DNA wascarried out in 2010 using modifications to the CTAB methodof Doyle and Doyle (1987). A total of 100 sequence taggedmicrosatellite site (STMS) loci were screened in the acces-sions of which only 71 were polymorphic (table 2). TheSTMS markers were synthesized as per the sequences ofWinter et al. (2000) from Bioneer, Daejeon, South Korea.BioRad MyCycler thermal cycler, Richmond, USA was usedto carry out amplifications in 10 μL volume reaction mixture.This mixture contained 1 μL of 20 ng plant genomic DNA,1.6 μL of 10× Tris buffer (15 mM MgCl2 and gelatine), 1 μLof 10 mM dNTP mix, 1.0 μL each of forward and reverseprimer and 0.3 μL of 3 U μL−1 Taq polymerase. PCR was
performed with following conditions 150 s at 90◦C followedby 18 cycles of denaturation at 94◦C for 20 s, annealing for50 s at 50◦C (touch down of 0.5◦C for every repeat cycle) and1 min elongation at 72◦C for 50 s. Further 20 cycles of denat-uration at 94◦C for 20 s, annealing for 50 s at 55◦C and 50 selongation at 72◦C were given and final extension at 72◦C for7 min were performed. The resolution of PCR products wasdone on six per cent polyacrylamide gels. Band patterns foreach of the microsatellites markers were recorded for eachgenotype by assigning a letter to each band. Alleles werenumbered as ‘a1’, ‘a2’ etc., sequentially from the largest tothe smallest sized band. No distinction was made betweenamplified products of varied intensity, when the amplifiedproducts were within the expected size range. Reconfirma-tion of null allele was done and the bands which wereappearing as artifact or bands which were either diffused orhighly faint and null alleles even after reconfirmation were
Table 2. STMS primers used for polymorphism and genetic diversity studies.
Primer Total no. of Linkage PIC Primer Total no. of Linkage PICname alleles produced group value name alleles produced group value
TA 179 3 5a 0.558 CaSTMS21 2 – 0.460TA 47 3 2b 0.563 GA 16 5 2a 0.765TA71 4 5a 0.650 TA 110 5 2a 0.775TA103 3 2b 0.409 TA 194 4 2a 0.650TA 117 3 – 0.562 TR 58 3 2a 0.359TA 113 3 1a 0.613 TA 144 6 – 0.726TR 24 2 6b 0.463 TA 186 5 – 0.653TA140 2 5a 0.461 GA 20 3 – 0.646TA180 2 7a 0.537 TA 80 3 6a 0.577TA 200 5 – 0.770 TA 114 3 – 0.458TA 3 4 9a 0.642 TA 203 4 1a 0.582TR 31 4 3a 0.541 TR 56 4 3a 0.509TS 43 3 5a 0.644 TA 176 4 6a 0.439GAA 40 2 1a 0.409 TA 53 4 2b 0.481GAA 50 2 – 0.446 TS 46 5 – 0.689CaSTMS 4 2 6d 0.695 TA 2 5 4a 0.702CaSTMS 10 1 3a 0.588 TA 8 5 1a 0.726CaSTMS 14 2 3a 0.713 TA 13 2 4a 0.771CaSTMS 15 3 6a 0.852 TA 18 3 7a 0.487CaSTMS16 4 – 0.858 TA 21 6 7a 0.573CaSTMS 19 4 5a 0.714 TA 27 2 2a 0.564CaSTMS 22 5 5a 0.698 TA 28 2 6d 0.498CaSTMS 25 4 15a 0.661 TA 34 3 3a 0.661CaSTMS 28 3 3a 0.652 TA 37 4 2a 0.660TA 45 5 7d 0.715 TA 43 3 8d 0.698TA 59 3 3d 0.708 TA 125 5 5c 0.493TA 64 5 3a 0.689 TR 7 1 6a 0.841TA 72 2 4c 0.634 TR 20 2 4a 0.762TA 93 2 – 0.733 TR 26 2 3a 0.723TA 96 3 8d 0.711 TR 29 2 5c 0.691TA 106 2 6a 0.687 TR 59 2 5a 0.812TA 110 1 3d 0.581 TS 12 3 7d 0.641TS 53 3 5c 0.531 TS 29 2 – 0.722TS 72 2 4c 0.651 TS 45 3 8a 0.689TAA 58 4 7a 0.810 TAA 137 2 – 0.573
CS 27 4 2a 0.812
– Unknown; aWinter et al. (2000); bTekeoglu et al. (2002); cNayak et al. (2010); dBharadwaj et al. (2011).
Journal of Genetics Vol. 90, Online Resources e96
C. Bharadwaj et al.
not considered for analysis. Tree construction followingunrooted NJ tree using similarity matrix was carried throughDARwin 5.0.128 (Perrier et al. 2003) analysis. Bootstrapanalysis using 1000 bootstrap values was performed for thenode construction.
Results and discussions
In the present study, a total of 100 STMS loci were analysed,covering various bin locations on different linkage group.Seventy-one STMS loci, in the genetic material under studywere found to be highly polymorphic (table 2). Only datafrom these polymorphic STMS loci were utilized for furtherstatistical analysis. The 71 STMS loci analysed produced224 alleles with an average of 3.210 alleles per marker. Thenumber of alleles ranged from 1 to 6. Based on the allele fre-quencies, the PIC (polymorphism information content) val-ues were estimated for different STMS loci analysed. ThePIC values ranged from 0.409 to 0.858 with an average
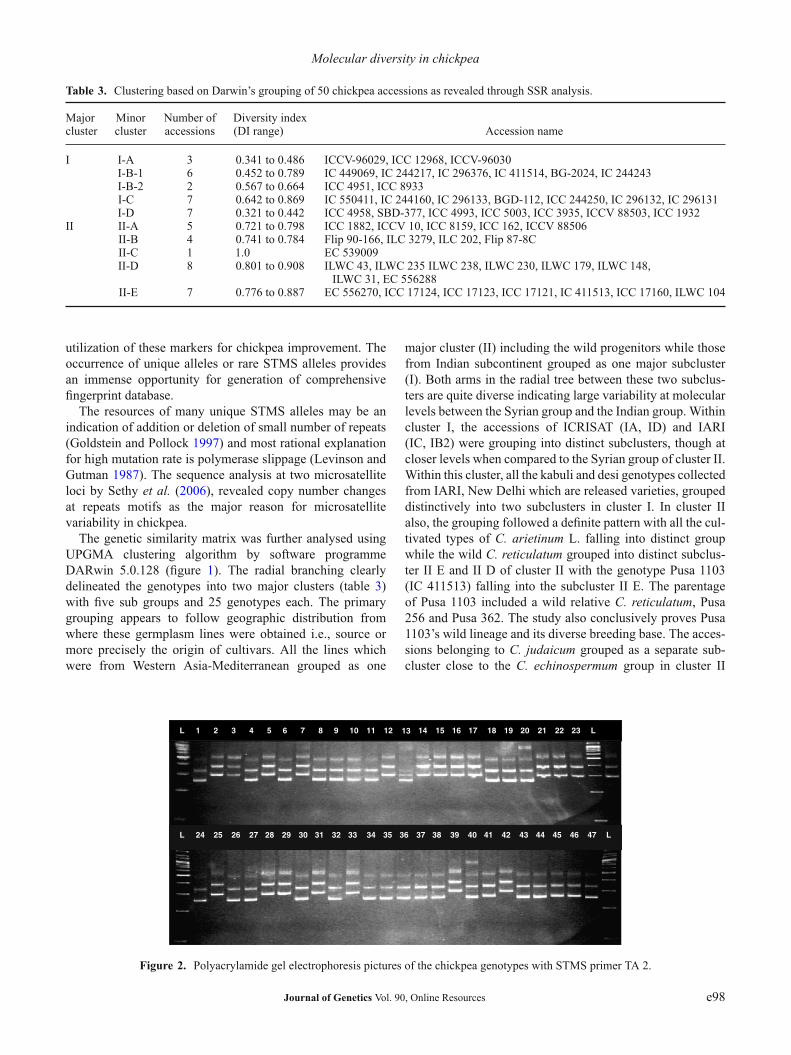
PIC of 0.633. A high PIC value in chickpea microsatel-lite analysis was also reported by Udupa et al. (1999) andUpadhyaya et al. (2008), who attributed this to polymor-phism of TAA motif in chickpea. Diversity index (DI) valuesranged from 0.321 to 0.908 with TA 110 showing maximumDI and PIC values. The range of DI was very high in clus-ter 2 comprising the chickpea collections from central Asianregion and ranged from 0.721 to 0.908 while it was narrow incluster I-D with the values ranging from 0.321 to 0.442. Wildspecies showed a DI range of 0.801 to 0.908. Jomová et al.(2009) also reported high DI and PIC values while analysing49 chickpea germplasm accessions. The high DI values indi-cate the lack of close genetic relatedness in the accessionsanalysed and the greater PIC values indicate the suitabilityof the microsatellites used for diversity analysis (figure 2).Results from the present study support the observations ofseveral workers on the potential utility of molecular markersin characterization (Satyavathi et al. 2006; Sethy et al. 2006;Bharadwaj et al. 2010). There was reasonably a high rateof polymorphism which points towards the scope for further
18
I- A
I- B
I-C
I-B-1
I-B-2
I-D
II-E
II-D
II-C
II-B
II-A
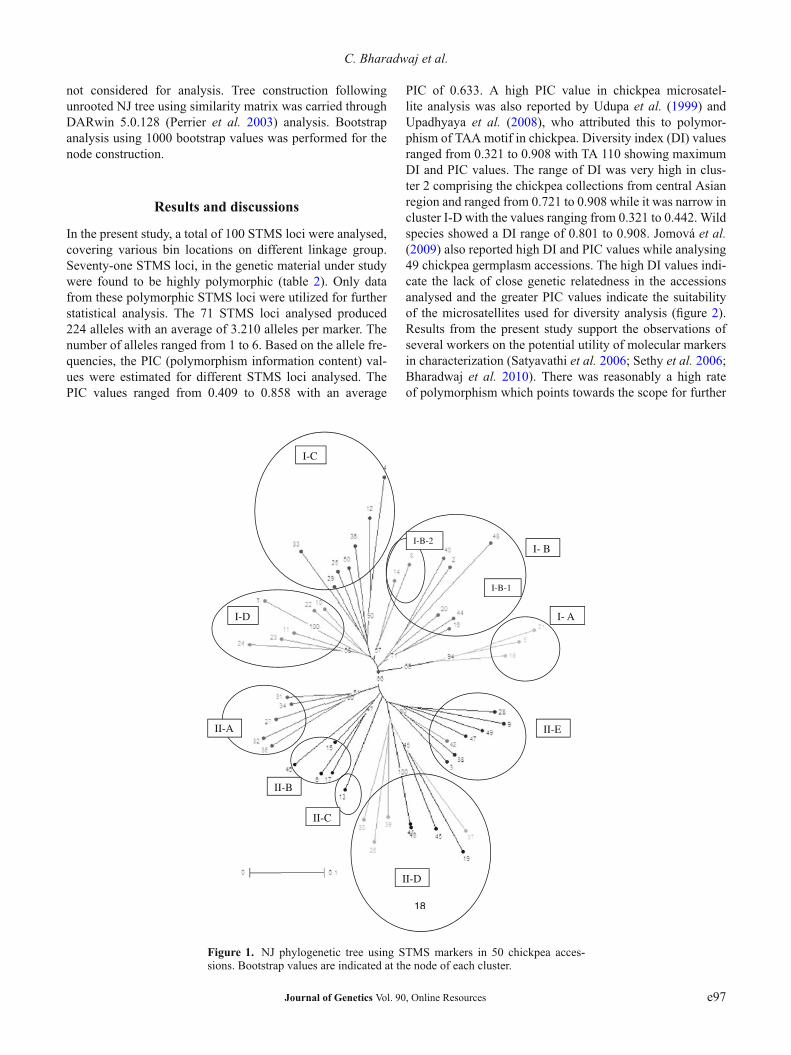
Figure 1. NJ phylogenetic tree using STMS markers in 50 chickpea acces-sions. Bootstrap values are indicated at the node of each cluster.
Journal of Genetics Vol. 90, Online Resources e97
Molecular diversity in chickpea
Table 3. Clustering based on Darwin’s grouping of 50 chickpea accessions as revealed through SSR analysis.
Major Minor Number of Diversity indexcluster cluster accessions (DI range) Accession name
I I-A 3 0.341 to 0.486 ICCV-96029, ICC 12968, ICCV-96030I-B-1 6 0.452 to 0.789 IC 449069, IC 244217, IC 296376, IC 411514, BG-2024, IC 244243I-B-2 2 0.567 to 0.664 ICC 4951, ICC 8933I-C 7 0.642 to 0.869 IC 550411, IC 244160, IC 296133, BGD-112, ICC 244250, IC 296132, IC 296131I-D 7 0.321 to 0.442 ICC 4958, SBD-377, ICC 4993, ICC 5003, ICC 3935, ICCV 88503, ICC 1932
II II-A 5 0.721 to 0.798 ICC 1882, ICCV 10, ICC 8159, ICC 162, ICCV 88506II-B 4 0.741 to 0.784 Flip 90-166, ILC 3279, ILC 202, Flip 87-8CII-C 1 1.0 EC 539009II-D 8 0.801 to 0.908 ILWC 43, ILWC 235 ILWC 238, ILWC 230, ILWC 179, ILWC 148,
ILWC 31, EC 556288II-E 7 0.776 to 0.887 EC 556270, ICC 17124, ICC 17123, ICC 17121, IC 411513, ICC 17160, ILWC 104
utilization of these markers for chickpea improvement. Theoccurrence of unique alleles or rare STMS alleles providesan immense opportunity for generation of comprehensivefingerprint database.
The resources of many unique STMS alleles may be anindication of addition or deletion of small number of repeats(Goldstein and Pollock 1997) and most rational explanationfor high mutation rate is polymerase slippage (Levinson andGutman 1987). The sequence analysis at two microsatelliteloci by Sethy et al. (2006), revealed copy number changesat repeats motifs as the major reason for microsatellitevariability in chickpea.
The genetic similarity matrix was further analysed usingUPGMA clustering algorithm by software programmeDARwin 5.0.128 (figure 1). The radial branching clearlydelineated the genotypes into two major clusters (table 3)with five sub groups and 25 genotypes each. The primarygrouping appears to follow geographic distribution fromwhere these germplasm lines were obtained i.e., source ormore precisely the origin of cultivars. All the lines whichwere from Western Asia-Mediterranean grouped as one
major cluster (II) including the wild progenitors while thosefrom Indian subcontinent grouped as one major subcluster(I). Both arms in the radial tree between these two subclus-ters are quite diverse indicating large variability at molecularlevels between the Syrian group and the Indian group. Withincluster I, the accessions of ICRISAT (IA, ID) and IARI(IC, IB2) were grouping into distinct subclusters, though atcloser levels when compared to the Syrian group of cluster II.Within this cluster, all the kabuli and desi genotypes collectedfrom IARI, New Delhi which are released varieties, groupeddistinctively into two subclusters in cluster I. In cluster IIalso, the grouping followed a definite pattern with all the cul-tivated types of C. arietinum L. falling into distinct groupwhile the wild C. reticulatum grouped into distinct subclus-ter II E and II D of cluster II with the genotype Pusa 1103(IC 411513) falling into the subcluster II E. The parentageof Pusa 1103 included a wild relative C. reticulatum, Pusa256 and Pusa 362. The study also conclusively proves Pusa1103’s wild lineage and its diverse breeding base. The acces-sions belonging to C. judaicum grouped as a separate sub-cluster close to the C. echinospermum group in cluster II
L 1 2 3 4 5 6 7 8 9 10 11 12 13 14 15 16 17 18 19 20 21 22 23 L
L 24 25 26 27 28 29 30 31 32 33 34 35 36 37 38 39 40 41 42 43 44 45 46 47 LL
Figure 2. Polyacrylamide gel electrophoresis pictures of the chickpea genotypes with STMS primer TA 2.
Journal of Genetics Vol. 90, Online Resources e98

C. Bharadwaj et al.
(II D) indicating their relatedness in this group and thesefall into secondary gene pool as per Singh (2005). They arefarther away from the primary cultivated chickpea gene poolspecies of C. arietinum (II E). Comparing a geographicallydiverse chickpea collection of 36 lines using 25 SSR mark-ers, Sethy et al. (2006), could discern the genetic distinct-ness among these collections. However, they could not estab-lish the genetic relatedness as they reported noncongruenceof genetic diversity with geographic diversity. Though thisis true in many crops where cultivated or advanced breedinglines are used, when we use land races and genetic stocks asdone in this study along with a large number of wild specieswhich have not been subjected to breeding procedures ofselection, then genetic diversity is in concomitance to geo-graphic diversity as found in this investigation. This group-ing could also clearly establish the distinctness of westernAsia which happens to be the centre of origin of chickpea tothose that have been developed from Indian subcontinent inconcomitance with the present findings.
All the ICARDA lines of Syrian, Turkey and those fromSpain origin were falling in near vicinity in subcluster IIB.This clearly brings out the distinctiveness of the Mediter-ranean group of lines from Syria and vicinity to be distinctfrom the Indian subcontinent lines. It is obvious as suchbecause the ICRISAT germplasm has more than 60% acces-sions from Indian subcontinent and use of these accessionsin developing advanced breeding lines and varieties by thebreeders of Indian subcontinent repeatedly in their breed-ing programmes would have narrowed the genetic base ofthe varieties released at this centre. Further, adaptive selec-tion from these lines by breeders in India while developingvarieties suitable for Indian subcontinent would have led todevelopment of Indian chickpea breeding materials with rel-atively narrower genetic base. The grouping of lines fromSyria and wild species into a separate cluster indicates thatthey are diverse to the Indian subcontinent type and can serveas good sources for genetic base broadening in chickpea.
The occurrence of distinct groups of chickpea linesrevealed through STMS analysis could possibly draw theattention of the chickpea breeders for effective prebreedingfor breaking yield barriers. The initial gains obtained throughuse of germplasm from ICRISAT though has paid off, widergains and introgression of alleles for more useful traits canoccur if the prebreeding involves ICARDA germplasm orwild relatives. Importance of wild relatives of chickpea as asource of genes having resistance to biotic and abiotic traitshas been documented by many chickpea workers (Singh2005; Kaur et al. 2010).
Breeders can broaden the chickpea genetic base by resort-ing to prebreeding using wild relatives like C. reticulatumwhich is easily crossable with C. arietinum. The divergenceof C. arietinum lines from Mediterranean region from thoseof the Indian subcontinent also indicates that greater geneticgains can be obtained by using these lines in breeding pro-grammes. Further this study also conclusively proves theability of STMS markers in discerning diversity.
Acknowledgements
We acknowledge the participation of Indian Council of Agricul-tural Research, Indian Agricultural Research Institute, Departmentof Agricultural Co-operation (DAC), Government of India, and allthe partners in the DAC funded project ‘Pre-breeding and geneticenhancement in breaking yield barriers in kabuli chickpea and lentilthrough ICAR – ICARDA collaboration’.
References
Bharadwaj C., Chauhan S. K., Rajguru G., Srivastava R., SatyavathiT. C. and Yadav S. 2010 Diversity analysis of chickpea (Cicerarietinum L.) using STMS markers. Indian J. Agric. Sci. 80, 947–951.
Bharadwaj C., Chauhan S. K., Yadav S., Satyavathi T. C., SinghR., Kumar J. et al. 2011 Molecular marker based linkage mapof chickpea (Cicer arietinum L.) developed from desi × kabulicross. Indian J. Agric. Sci. 81, 116–118.
Choudhary S., Sethy N. K., Shokeen B. and Bhatia S. 2009 Devel-opment of chickpea EST-SSR markers and analysis of allelicvariation across related species. Theor. Appl. Genet. 118, 591–608.
Doyle J. J. and Doyle J. L. 1987 A rapid DNA isolation proce-dure for small quantities of fresh leaf tissue. Phytochem. Bull. 19,11–15.
Goldstein D. B. and Pollock D. D. 1997 Launching microsatel-lites: a review of mutation process and methods of phylogeneticinheritance. J. Hered. 88, 335–342.
Gour R., Sethy N. K., Choudhary S., Shokeen B., Gupta V. andBhatia S. 2011 Advancing the STMS genomic resources fordefining new locations on the intraspecific genetic linkage mapof chickpea (Cicer arietinum L.). BMC Genomics 12, 117.
Jomová K., Benková M. and Kraic J. 2009 Enrichment of chickpeagenetic resources collection monitored by microsatellites. CzechJ. Genet. Plant Breed. 45, 11–17.
Kaur A., Sandhu J. S., Gupta S. K., Bhardwaj R., Bansal U. K.and Sainin R. G. 2010 Genetic relationships among annual wildCicer species using RAPD analysis. Indian J. Agric. Sci. 80,116–118.
Levinson G. and Gutman G. A. 1987 Slippped strand mispairing; amajor mechanism for DNA sequence evolution. Mol. Biol. Evol.4, 203–221.
Nayak S. N., Zhu H., Varghese N., Datta S. and Choi H.-K. 2010Integration of novel SSR and gene-based SNP marker loci in thechickpea genetic map and establishment of new anchor pointswith Medicago truncatula genome. Theor. Appl. Genet. 120,1415–1441.
Perrier X., Flori A. and Bonnot F. 2003 Data analysis methods.In Genetic diversity of cultivated tropical plants (ed. P. Hamon,M. Seguin, X. Perrier and J. C. Glaszmann), pp. 43–76. SciencePublishers. Montpellier, USA.
Radhika P., Gowda S., Kadoo N., Mhase L., Jamadagni B., SainaniM. et al. 2007 Development of an integrated intraspecific mapof chickpea (C. arietinum L.) using two recombinant inbred linepopulations. Theor. Appl. Genet. 115, 209–216.
Satyavathi T. C., Bhat K. V., Bharadwaj C., Tiwari S. P. andChaudhary V. 2006 AFLP based DNA profiling and geneticdiversity assessment of Indian soybean (Glycine max (L.)Merrill) varieties. Genet. Resour. Crop Evol. 53, 1069–1079.
Sethy N. K., Shokeen B., Edwards K. J. and Bhatia S. 2006 Devel-opment of microsatellite markers and analysis of intra specificgenetic variability in chickpea (Cicer arietinum L.). Theor. Appl.Genet. 112, 1416–1428.
Journal of Genetics Vol. 90, Online Resources e99
Molecular diversity in chickpea
Singh N. P. 2010 Project coordinator’s report 2009–10. All Indiacoordinated research project on chickpea. Indian Institute ofPulses Research, Kanpur, India.
Singh R. J. 2005 Landmark research in grain legumes. In Geneticresources, chromosome engineering and crop improvement:grain legumes, volume 1 (ed. R. J. Singh and P. P. Jauhar),pp. 1–9. Taylor and Francis Group, New York, USA.
Tekeoglu M., Rajesh P. N. and Muehlbauer F. J. 2002 Integrationof sequence tagged microsatellite sites to the genetic map. Theor.App. Genet. 105, 847–854.
Udupa S. M., Robertson L. D., Weigand F., Baum M. and Kahl G.1999 Allelic variation at (TAA)n microsatellite loci in a world
collection of chickpea (Cicer arietinum L.) germplasm. Theor.Appl. Genet. 97, 299–307.
Upadhyaya H. D., Dwivedi S. L., Baum M., Varshney R. K., UdupaS. M., Gowda C. L. L. et al. 2008 Genetic structure, diversity,and allelic richness in composite collection and reference set inchickpea (Cicer arietinum L.). BMC Plant Biol. 8, 106.
Winter P., Benko-Iseppon A. M., Huttel B., Ratnaparkhe M., TulluG., Sonnante G. et al. 2000 A linkage map of the chickpea (Cicerarietinum L) genome based on recombinant inbred lines froma C. arietinum × C. reticulatum cross: localization of resistantgenes for fusarium wilt races 4 and 5. Theor. Appl. Genet. 101,1155–1163.
Received 19 February 2011, in revised form 5 August 2011; accepted 22 August 2011Published on the Web: 7 December 2011
Journal of Genetics Vol. 90, Online Resources e100