Molecular Descriptors Family on Structure Activity...
24
Leonardo Electronic Journal of Practices and Technologies ISSN 1583-1078 Issue 6, January-June 2005 p. 76-98 Molecular Descriptors Family on Structure Activity Relationships 1. Review of the Methodology Lorentz JÄNTSCHI Technical University of Cluj-Napoca, Romania, http://lori.academicdirect.org Abstract This review cumulates the knowledge about the use of Molecular Descriptors Family usage on Structure Activity Relationships. The methodology is augmented through the general Structure Activity Relationships methodology. The obtained models in a series of five papers are quantitatively analyzed by comparing with previous reported results by using of the correlated correlations tests. The scores for a series of 13 data sets unpublished yet results are presented. Two unrestricted online access portals to the Molecular Descriptors Family Structure Activity Relationship models results are given. Keywords Structure Activity Relationship Methodology, Online Structure Activity Relationships Introduction Modeling, testing and identification of new biological active compounds have impact into agriculture, health and industry, being the main instrument of the economical progress and quality of life improvement. The identification or developing of new biocombustibles, biomaterials and biologically active chemical compounds are the way to the more economical efficiency and decreasing of environment pollution. Are unanimous recognized now that the objectives of economic efficiency increasing 76 http://lejpt.academicdirect.org
-
Upload
vuongkhuong -
Category
Documents
-
view
217 -
download
0
Transcript of Molecular Descriptors Family on Structure Activity...
Leonardo Electronic Journal of Practices and Technologies
ISSN 1583-1078
Issue 6, January-June 2005
p. 76-98
Molecular Descriptors Family on Structure Activity Relationships
1. Review of the Methodology
Lorentz JÄNTSCHI
Technical University of Cluj-Napoca, Romania, http://lori.academicdirect.org
Abstract
This review cumulates the knowledge about the use of Molecular Descriptors
Family usage on Structure Activity Relationships. The methodology is
augmented through the general Structure Activity Relationships methodology.
The obtained models in a series of five papers are quantitatively analyzed by
comparing with previous reported results by using of the correlated
correlations tests. The scores for a series of 13 data sets unpublished yet
results are presented. Two unrestricted online access portals to the Molecular
Descriptors Family Structure Activity Relationship models results are given.
Keywords
Structure Activity Relationship Methodology, Online Structure Activity
Relationships
Introduction
Modeling, testing and identification of new biological active compounds have impact
into agriculture, health and industry, being the main instrument of the economical progress
and quality of life improvement. The identification or developing of new biocombustibles,
biomaterials and biologically active chemical compounds are the way to the more economical
efficiency and decreasing of environment pollution.
Are unanimous recognized now that the objectives of economic efficiency increasing
76 http://lejpt.academicdirect.org

Molecular Descriptors Family on Structure Activity Relationships 1. Review of the Methodology
Lorentz JÄNTSCHI
and environment pollution reducing through new uses for known strains and biocatalysts,
optimizing of biotechnological processes, identification and characterization of new enzymes
and microorganisms, microbial genomics and bioinformatics, metabolic engineering and
modeling, superior proteins and nanocompozite place the research and develop activities
through Molecular Descriptors Family (MDF) methodology in the interdisciplinary research
field of chemistry-biology-informatics.
SAR Methodology
In the last period, the structural indices used on biological active compounds modeling
by use of structure-activity integrated studies (SAR – structure-activity relationships) are
more frequent computed from steric (geometrical) and/or electrostatic (partial charges)
parameters [1] opposing to pure topological parameters [2]. Are preferred semi-empirical and
quantum computations with software such as Hondo95, Gaussian94, Gamess, Icon08, Tx90,
Polyrate, Unichem/Dgauss, Allinger`s MM3, Mopac93, Mozyme and HyperChem [3].
Regression analysis structure-activity uses classical methods such as linear, multiple
linear and un-linear regressions, and also expert systems and neural networks for large
databases [4].
The elaboration, implementation and use of molecular models for obtaining of new
biological active compounds are referred frequently in the information flux. Here is a review
of these preoccupations.
As preliminary analysis method, some authors align the set of molecules. More,
CoMFA method introduces a six step algorithm for structure-activity analysis [5]:
1. construct the training set of molecules with known biological activity and generate the 3D
structure of the molecules (by use of software such as Mopac, Sybyl [6-7], HyperChem
[8-9], Alchemy2000 [6], MolConn [10]);
2. chouse a overlapping method (which can be the overlapping of choused fragments from
molecules [5,11,12] or pharmacologically groups [13] and overlap virtually the spatial
coordinates;
3. construct a grid which surround the overlapped molecules on step (2) using a standard or
modified form [14] and chouse a probe atom for the interaction with the grid points [15];
77

L
Leonardo Electronic Journal of Practices and Technologies
ISSN 1583-1078
Issue 6, January-June 2005
p. 76-98
4. use a empirical method (Hint [17]), a specific model (pharmacologically overlapping
[18]), classical potential energy (Lennard-Jones, Coulomb), hydrogen bonds energy [19],
molecular orbital generated field [20,21] or any other user defined model [15] and
calculate the interactions values on grid from step (3) of choused interaction field with
probe atom from step (3);
5. use the computed values of interaction from step (4) between grid points and probe atom
to make estimation of known activity by constructing a structure activity relationship;
6. use structure activity relationship obtained at step (5) to make prediction of activity for
molecules with same overlapping with training set from step (1).
The CoMFA method are a good tool for predicting varied types of biological activities
such as cytotoxicity [22], inhibition [21], or forming properties [23, 24]. More, the method
serves in modeling of compounds with pharmaceutical effects [13, 25] and HIV inhibitors
[26].
Watching on structural investigations on biological active compounds, a main task is
searching of biological active substructures from biological active compounds which produce
most of measured biological response [17].
One of the variants to realize the searching of biological active substructures is the
identification of the molecular invariants. In this sense, the HWIM method (Weighted Holistic
Invariant Molecular) compute a set of statistical indicators derived from steric and
electrostatic properties of the molecules [28-30]. A variant of this method, MS-WHIM (from
Molecular Surface) serves to molecular surface analysis [31]. MS-WHIM is a collection of 36
statistical indicators derived from steric and electrostatic properties and are oriented to
parameterize the molecular surface [32].
The quantitative structure-activity relationships QSAR (Q – quantitative) refer a
measurable biological activity and the technique which use QSAR are a modern technique
used today in many priority domains, including pharmacology, environment, biotechnology
and microbiology. The literature of specialty contains today a great number of structure-
activity relationships which evaluate the impact of chemicals to the environment [33-37].
The mathematical model used for structure-activity relationships obtaining are most
frequently based on linear regression [38] and artificial neural networks [39-41].
78

Molecular Descriptors Family on Structure Activity Relationships 1. Review of the Methodology
Lorentz JÄNTSCHI
MDF SAR Methodology
As are demonstrated above, the methodology of structural investigations for biological
active compounds recommend:
1. Constructing of molecular model using a molecular modeling software;
2. Validation or applying of the molecular model through Prediction (the quantitative
evaluation of the link between the topological and topographical structure proposed by the
model and measured activity or property, if these are available from experimental data
after the synthesizing of the compound) or Estimation (computing of the most probable
value of the property or activity and quantitative evaluation of the link between obtained
or known topological and topographical structure and estimated activity or property, for
the case when experimental data are not available or the compounds was not yet
synthesized);
3. Establish or chouse of the ways of synthesizing (of mechanisms) for the compounds
which prove a good biological activity;
4. Synthesizing of chemical compounds for which the molecular model recommend good
estimated values of desired biological activity;
5. The Evaluation of biological activities and properties for the new synthesized compounds.
Proposed methodology for the research implements the recommended methodology
and use for estimating and prediction the MDF model (Molecular Descriptors Family) of
original design.
The methodology of each biological activity includes:
1. identification and chousing of structural class which present the best biological activity
selected;
2. data collecting about synthesized compounds which belong to the class;
3. making of the experiments in order to obtain the values of biological activity for the
compounds which are synthesized and are on market available and for which does not
exists reported in the literature the values of the selected biological activity;
4. molecular modeling of the every compound from the class and elaboration of molecular
model;
5. database generation with structural descriptors for class members;
79

L
Leonardo Electronic Journal of Practices and Technologies
ISSN 1583-1078
Issue 6, January-June 2005
p. 76-98
6. use of the database for identification of the best SAR and of the representative structural
descriptors for the biological activity and structural class;
7. design of new biological active chemical compounds belonging to the class by applying of
obtained SAR for prediction of biological activity;
8. synthesizing of new compounds and validation of the predictions.
A set of MDF methodology characteristics must be underlined:
• Computing and integration into the database of structural descriptor values of formulas for
descriptors with proved validity in the international flux of information, and of other
completely new in a unitary form, formalized and parameterized, called MDF (molecular
descriptors family) of original design;
• Applying of linearizing operators to make passing from the structure (microscopic
properties) to the biological activity (macroscopic properties) and bias of obtained
descriptors (in number of 787968) to a number of about 100000 descriptors using a
original bias algorithm;
• System of representative subset selecting of molecular descriptors based on recursive,
iterative and heuristic algorithms which identifies the best the structure-activity
relationship projected and implemented by the project team;
• System of external validation using successive splits in training and test sets using again a
original algorithm;
The software system process is based on knowledge, learning and cognitive system.
The applicative importance of integrated structural investigations on classes of biologically
active compounds is revealed because the investigation and identification of relation between
structure and activity of biological active compounds are the tool of new biologically active
chemical compounds identification with better properties which use accumulated knowledge
through learning of behavior on training sets and apply the cognitive system for structure
design before synthesizing.
MDF SAR History
First steps begins with publishing of [42] which threat the modern investigations from
topology point of view of molecular structure and in chapter 9 are enounced the scientific
80

Molecular Descriptors Family on Structure Activity Relationships 1. Review of the Methodology
Lorentz JÄNTSCHI
premises of molecular descriptors family. The advantages of use of an integrated system of
molecular descriptors, as are MDF, was recognized and published in [43]. The using of the
MDF prototype was reported in international flux of information. Here are the results:
• Biological activity of Mutagenicity and Toxicity for a set of 15 quinolines using the MDF
prototype was modeled and the results are superior to the reported results in a similarly
study: R2(mutagenicity, subset MDF) = 0.98, R2(cytotoxicity, subset MDF) = 0.96, <subset
MDF> = 2, relative to 0.87 and respectively 0.80 reported [44]; the result was the subject
of an online international conference [45];
• The better results through MDF methodology use was proved through ability of
chromatographic retention index estimation on a set of 10 organophosphoric herbicides;
results using MDF prototype was reported in [46] and comparatively with the traditionally
method of topological descriptors, the following results was: r2(ICHR+, subset MDF) =
0.999 relative to 0.900 using the traditional method of topological descriptors [47];
• The applications of MDF on environment protection and depollution technologies are
shows in [48], where the previous results obtained [49] was surpassed by the MDF
prototype MDF in an obvious way: 0.997 relative to 0.658!
• A more remarkable result through the prism of capabilities which MDF prove to have, are
obtained on the complete set of 209 polyclorinated biphenyls [50], where prediction ability
of relative response factor was remarkable r = 0.858.
MDF SAR Model
Starting with our approach, the topological structure of the molecule enters into a
fragmentation routine.
Four fragmentation criterions are applied for a given structure. The fragmentation
criterions generate fragments of molecule (connected atoms substructures) for all pairs of
atoms (carbon and heteroatom atoms type). Minimal fragments criterion applied to a pair (a,b)
of atoms produces always a fragment with one atom: {a} (the `a` atom). Maximal fragments
criterion on (a,b) pair produce the largest subset of connected atoms from structure which not
contain the `b` atom. Szeged fragments criterion for (a,b) pair produces the fragment from
molecule of which atoms are closed to `a` then `b` atom. Cluj fragments criterion applies the
81

L
Leonardo Electronic Journal of Practices and Technologies
ISSN 1583-1078
Issue 6, January-June 2005
p. 76-98
Szeged fragments criterion to a substructure of molecule which is obtained by excluding a
minimal distance path from molecule. Note that the Cluj fragments criterion differ significant
from the previous criterions, and can produce as result a more than one fragment for a given
pair (a,b) of atoms. The number of fragments are equal to number of distinct minimal distance
paths from `a` to `b`.
The fragmentation procedure produces a list of fragments from molecule (not
necessary distinct ones). For a fragmentation criteria and (a,b) pair it result always at least one
fragment with at least one atom. In figure 1 are depicted a fictive example of a fragment of
(a,b) pair of atoms.
A fragment of (a,b) `a` • `b`
Figure 1. A fragment example
For a molecule fragment the calculations use one of two distance metrics (topological
and topographical) and one of six atomic properties (cardinality – it has always value 1,
number of directly bonded hydrogen’s, atomic relative mass, atomic electronegativity, group
electronegativity [51], and atomic partial charge – such as from semi-empirical Extended
Hückel model, Single Point approach), when result 12 distinct possibilities.
More, both distance metric and atomic property are used by interaction descriptor. The
interaction descriptor formula is one of D (for ID = d), d (for ID = 1/d), O (for ID = p1), o (for
ID = 1/p1), P (for ID = p1·p2), p (for ID = 1/p1/p2), Q (for ID = √p1·√p2), q (for 1/√p1/√p2), J (for
ID = p1·d), j (for ID = 1/p1/d), K (for ID = p1·p2·d), k (for ID = 1/p1/p2/d, L (for ID = √p1·√p2·d),
l (for ID = 1/√p1/√p2/d), V (for ID = p1/d), E (for ID = p1/d/d), W (for ID = p1·p1/d), w (for ID =
p1·p2/d), F (for ID = p1·p1/d/d), f (for ID = p1·p2/d/d), S (for ID = p1·p1/d/d/d, s (for ID =
p1·p2/d/d/d), T (for ID = p1·p1/d/d/d/d), t (for ID = p1·p2/d/d/d/d), and result a number of 288
possibilities.
The overlapping interaction models threats the interaction between atomic descriptors.
The R and r models consider that the distance is far enough to treat all interaction descriptors
as scalars. The R model computes the resultant of the fragment’s atoms descriptors at position
82

Molecular Descriptors Family on Structure Activity Relationships 1. Review of the Methodology
Lorentz JÄNTSCHI
of atom j. The r model computes the resultant at conventional origin. The M and m models
consider all fragmental property cumulated into the property center of the fragment. The
property center coordinates are calculated by a formula similarly with well-known mass
center coordinates formula. The fragmental descriptor is calculated using property center
coordinates and sum of fragmental property as fragmental property. Similarly, the M model
reefer the atom j and m model refer the origin. The D and d models threat the descriptors as
vectors with direction identical to distance vector. The axial projections are summed to obtain
the projections of fragmental descriptor. The value of fragmental descriptor is calculated from
his projections. The D model reefer the j atom and d model refer the origin. Using any of
overlapping interaction models, it result a number of 1728 possibilities.
Molecular descriptor value is constructed from fragments descriptors values. A
number of nineteen selectors are available and the functions can be grouped as follows.
Conditional group contains four functions: m (smallest fragmental descriptor value from the
array), M (highest value), n (smallest absolute value), and N (highest absolute value). Average
group contains five functions: S (sum of descriptor values), A (average mean for valid
fragments), a (average mean for all fragments), B (average mean by atom), b (average mean
by bond). Geometric group contains five descriptors: P (multiplication of descriptor values),
G (geometric mean for valid fragments), g (geometric mean for all fragments), F (geometric
mean by atom), f (geometric mean by bond). Harmonic group contains five functions: s
(harmonic sum of values), H (harmonic mean for valid fragments), h (harmonic mean for all
fragments), I (harmonic mean by atom), i (harmonic mean by bond). The total number of
possibilities is now 32832. Considering now the number of fragmentation criterions (four),
the total number becomes 131328 possibilities.
Resulted molecular descriptors are almost prepared. Because the structure
activity/property model finding is of multiple linear regression type, and measured property
usually endure a mathematical transformation such as natural logarithm, a set of six
linearization functions are applied also to the resulted molecular descriptors and finally result
the complete set of molecular structure descriptors, in number of 787968.
Note that the `sn_tmpx` table produced by our software stores the un-linearized
molecular structure descriptors (in number of 131328).
Every MDF member has a name. The name tells about how the descriptor was
computed. An example of descriptor name is lmmRDCg. The 7-th letter (g in our example)
83

L
Leonardo Electronic Journal of Practices and Technologies
ISSN 1583-1078
Issue 6, January-June 2005
p. 76-98
tells about the distance metric used, and can be g (geometrical i.e. topographical) or t
(topological). The 6-th letter (C in our example) is for atomic property. It can be one of C
(Cardinality), H (number of directly bonded hydrogen’s), M (atomic relative mass), E (atomic
electronegativity), G (group electronegativity), Q (the partial charge). The 5-th letter (D in our
example) tells about the atomic interaction descriptor (ID) used and are explained above. The
4-th letter (R in our example) is for overlapping interaction model, also explained above. The
3-rd letter (m in our example) denotes the fragmentation criterion. The m letter is for minimal
fragments, the M letter is for maximal fragments, the D letter is for Szeged fragments
criterion, and the P letter is for Cluj fragments criterion. The second letter (m in our example)
is for the molecular selector (one of the nineteen selectors explained above). Finally, the first
letter (l in our example) is for linearization function and is one of: I (identity, f(x)=x), i
(inverse, f(x)=1/x), A (absolute, f(x)=|x|), a (inverse of absolute, f(x)=1/|x|, L (natural
logarithm of absolute value, f(x)=loge(|x|), l (simple natural logarithm, f(x)=loge(x)).
Once that the MDF set is generated, a bias method it reduce the number of descriptors
using a significance level of 10-9. The number of resulted biased descriptors depends on the
choused molecules set and measured property, and contain about 100000 descriptors.
Simultaneously with the bias algorithm, the mono-varied correlation between
descriptors and measured property are dons and the descriptors are sorted by accordingly.
Bi-varied correlations are applied in order to find the best bi-varied MDF SAR models
by use of all possible combinations between pairs of descriptors. Upper than bi-varied (tri-,
four-, … varied) correlations are possible and made only by use of a set of heuristic
algorithm, that reduces the finding time to a real time. As result, the best found MDF SARs
are collected.
On all MDF SAR found models a set of prediction capability tests are applied. First
test is for leave one out prediction capability and it shows the best models for every variation
rank. By combining the results of estimation capability with the prediction capability, only a
reduced set of MDF SAR models are selected, as a rule no more than one for every variation
rank. Finally, a random routine stripes out a arbitrary number of molecules from the whole set
and rebuild the model using the remaining set (which act as training set). By use of the
stripped out molecules (test set) the models are validated.
84

Molecular Descriptors Family on Structure Activity Relationships 1. Review of the Methodology
Lorentz JÄNTSCHI
MDF SAR Software
The MDF SAR software uses a database on the entire process of SAR findings.
A first molecules set table is created and named using the set name and _tmpx suffix
(as example, `sn_tmpx`). The table has as columns the molecules names (from molecules files
names) and as rows the molecular descriptors. The table always contains 131328 records
(each record for a descriptor). First of our programs (mdf_prepare.php) create the table. The
second of our programs (mdf_generate.php) for every file from HIN folder read the molecule
from the file, generate the molecular descriptors for the molecule and fill the corresponding
column in the molecules set table (`sn_tmpx` table).
The current implementation of our original software requires that the molecules from
set to be saved in separate files in HyperChem HIN format. A label is required here: set name.
The set name is a given name for the molecules set; this name will be used further for set
folder name and set tables naming. The set preparation procedure requires construction of a
new folder: the set folder. The sn is our exemplification set name. The molecules structures
(as HIN files) are stored (temporarily) in a subfolder (of sn folder) called for convenience
HIN. The measured activity or property is stored (temporarily) in a subfolder (of sn folder)
called for convenience DATA as text file. Is essentially for the programs to run correctly that
the measured values (of activity or property) to be putted in the file in separate rows in
alphabetical order of molecules files names.
Many quantum mechanics models are available for molecules models constructing by
use of software (such as HyperChem). Than Molecular Descriptors Family (MDF) to be
generated is essentially to chouse a model that compute also the partial charges on atoms.
Once the quantum mechanics model was choused, all molecules from set must be constructed
according with the selected model.
At the end of MDF generating, the `sn_tmpx` table are fully prepared. The third of our
programs (mdf_linearize.php) generate the rest of tables set, as follows:
• Read the activity/property file from DATA subfolder of set folder and create the `sn_data`
table with measured values on separate rows. It has only one column;
• Copy the structure of `sn_tmpx` table (with molecules names as columns) into a new table
called `sn_xval` wich will contain the linearized values of molecular descriptors. In order
to increase the speed of further data processing’s, another table, `sn_yval` are created also.
85

L
Leonardo Electronic Journal of Practices and Technologies
ISSN 1583-1078
Issue 6, January-June 2005
p. 76-98
The `sn_yval` table is created for storing supplemental information relative to every
descriptor from `sn_xval` table. It has columns for molecular descriptor family member
name, squared correlation coefficient (of his values for all molecules with measured
values of activity/property for all molecules), average of descriptor values (all molecules
from set), average of squared values, and covariance with measured values;
• Using every one of the linearization methods, a record from `sn_tmpx` table will produce
six records in `sn_xval` table (and another six corresponding records in `sn_yval` table).
Both tables are simultaneously filled by mdf_bias.php program;
• Is possible that the descriptor value construction to have, in one point, an undetermined
operation to do, and the final value is stored then as infinite (INF). If a descriptor has INF
values, it can be used in correlations and is deleted;
• Almost always not all (of remaining from 787968) descriptors are distinct. More, even if it
exist a small difference, may be not enough that to consider the descriptors significantly
different. Sorting the descriptors by squared correlation coefficient allow to apply a
significantly different criteria. Our program considers two descriptors significantly
different if squared correlation coefficient differs with more than 10-9. All not significantly
different descriptors are deleted now; this is the last task of mdf_bias.php program;
• In order to help the multiple linear regression structure activity/property relationship
findings, the mdf_order.php program rearrange records in `sn_xval` and `sn_yval` tables
by squared correlation coefficient score;
Molecules set tables set preparation is now completed. A database server store and
manage the `MDF` database (figure 2). The `MDF` database contain two management tables
(`sar` and `ready`) and more set tables.
Figure 2. Model of MDF set tables management
`MDF` database
Management tables
`sar`
Set tables
`sn_xval`
`sn_tmpx`
`sn_data`
`sn_yval`
`ready`
Stat
istic
al a
naly
sis o
f SA
Rs
clie
nt-s
erve
r app
licat
ion
Mul
tiple
line
ar re
gres
sion
cl
ient
-ser
ver a
pplic
atio
ns
86
Molecular Descriptors Family on Structure Activity Relationships 1. Review of the Methodology
Lorentz JÄNTSCHI
Now a client program can connect to the `MDF` database, query the `ready` table to
obtain the set name which are currently set for structure activity/property relationship
findings, fetch the measured data from `sn_data` table, MDF members values from `sn_xval`
table and pre-prepared statistical parameters from `sn_yval` table and proceed to QSAR
findings. Because the findings are very consuming of time (about 5·109 pairs of MDF
members in bi-varied MLR model) the client programs use statically memory allocation
management and for multi-varied models (more than two) use heuristic algorithms for QSAR
findings. Until now, we develop seventeen heuristic programs to serves us to find QSAR
models with more than two linearized descriptors. Every new better QSAR model (greater
squared correlation coefficient score) are inserted into `sar` table. Client-server applications
communicates together through `sar` table and a new record is putted into `sar` table if does
not exists a better one already.
Any time, and especially at the end of structure activity relationships findings, the
mdf_query.php running produces a report with complete statistical analysis of the best QSAR
models from `MDF` database. The program use as entry data the original values of molecular
structure descriptors from all `sn_tmpx` sets tables which have records into `sar` table and
select from `sar` table only the best found models on every set and number of molecular
structure descriptors from structure activity relationship.
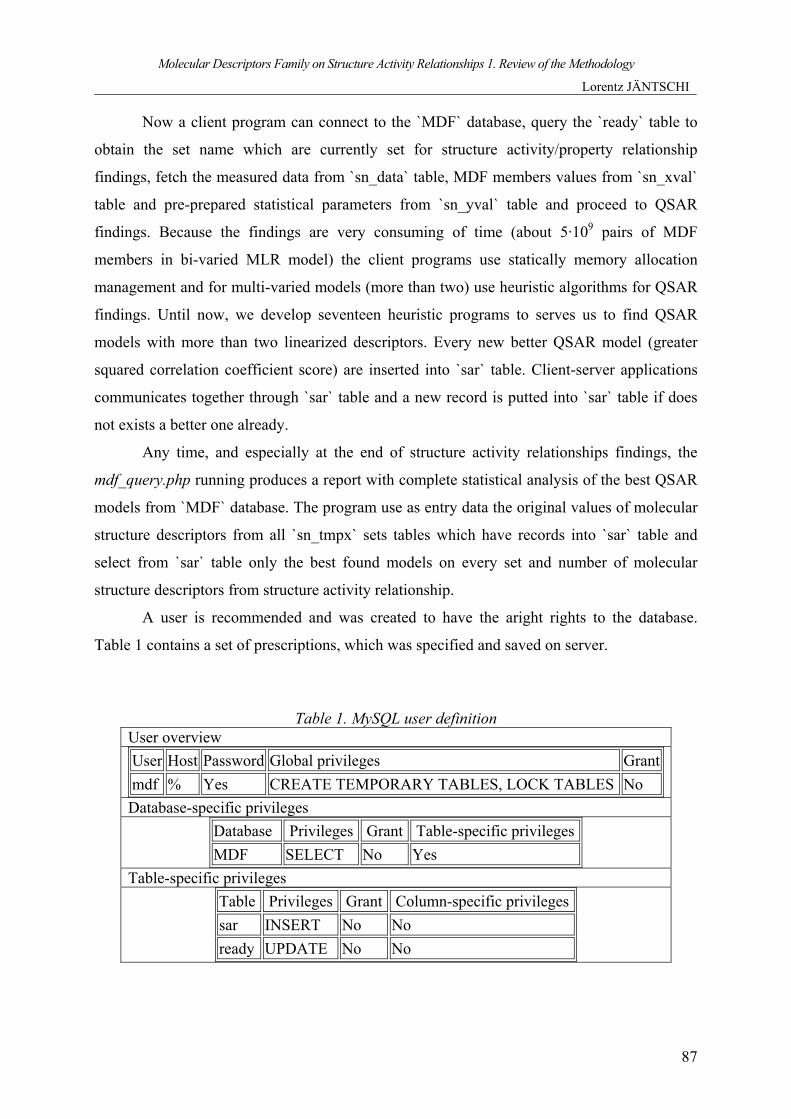
A user is recommended and was created to have the aright rights to the database.
Table 1 contains a set of prescriptions, which was specified and saved on server.
Table 1. MySQL user definition User overview User Host Password Global privileges Grantmdf % Yes CREATE TEMPORARY TABLES, LOCK TABLES No Database-specific privileges
Database Privileges Grant Table-specific privileges MDF SELECT No Yes
Table-specific privileges Table Privileges Grant Column-specific privileges sar INSERT No No ready UPDATE No No
87

L
Leonardo Electronic Journal of Practices and Technologies
ISSN 1583-1078
Issue 6, January-June 2005
p. 76-98
A client program, which uses the mdf user to identify itself, will get SELECT privilege
on all tables from `MDF` database (including sets tables). On `sar` table will get a specific
privilege to INSERT and on `ready` table will get a specific privilege to UPDATE.
The original program which was developed, called MDF2, connect to the database
server using the IP address, user name and password. First, query the `ready` table to know
which table set are prepared for structure – activity/property findings are prepared. The
program looks for ‘2’ value in `v` field (make bi-varied regressions) and get the
corresponding `set` and `r2` values.
The second step is to fetch data from set tables for the ready set. Once the data are
completely fetched, the routine for quantitative relationships starts. When a multiple linear
regression equation which correlates with a squared correlation coefficient bigger than the
current value of `r2` are found, the equation are saved into `sar` table and the `r2` value from
`ready` table are updated correspondingly. Thus, any time the program can be stopped and
restarted without waste time to find something that is already into the `sar` table. More, many
client programs can run in same time on same molecules set, including here the multi-varied
ones (MDF3, MDF4, and so on).
The temporarily results of the MDF SAR findings are a subject of an unrestricted
online access. The portal to the access of this results produced by the i_mdf_query.php
program is http://vl.academicdirect.org/molecular_topology/mdf_findings/.
The evaluation software, which splits randomly the whole set into the training and
test sets are also of an unrestricted online access and the portal of the finally MDF SAR
models are: http://vl.academicdirect.org/molecular_topology/qsar_qspr_s/.
MDF SAR Results
The MDF methodology was applied on the activities of molecules which was previous
discuss by other scientists as well as on the activities of molecules which never were the
subject of any related researches.
The following table (table 2) contains the obtained MDF SAR scored compared with
the previous obtained results where Set name column is the given name of the set used by our
software Previous reported SAR columns are for the reference of the reported results (where
88

Molecular Descriptors Family on Structure Activity Relationships 1. Review of the Methodology
Lorentz JÄNTSCHI
r2 is the r-squared coefficient, n is the number of molecules, v is the number of variables
included in the previous reported model, and Ref is the reference to the paper where the model
was published). The MDF SAR columns contain the obtained scores by use of the MDF
methodology (r2 is the r2 estimation score, r2cv is the r2 prediction score, n is the number of
molecules included in the model, v is number of variables in the model, and Ref the reference
to the paper).
Table 2. MDF SAR Results Previous reported SAR MDF SAR No
Set name r2 n v Ref r2 r2cv n v Ref
1 IChr10 0.9 10 2 [47] 0.999 0.999 10 2 [46]
2 PCB_rrf - - - [52] 0.6280.6930.737
0.6190.6820.717
209 1 2 4
[50]
3 36638 0.967 16 ? [49] 0.994 0.991 16 3 [48]
4 23159
0.388 0.839
18 18
1 3
0.7550.982
0.6840.974
18 18
1 2
5 23159e - - - [53] 0.899
0.9680.7580.898
8 8
1 2
[54]
6 Ta395 0.87 13 2 0.977 0.961 15 2 7 Tox395 0.8 13 2 [44] 0.957 0.934 14 2 [45]
8 41521 0.913 0.985
8 8
3 5 [55] 0.999 0.998 8 2 [56]
9 23151 0.741 0.985
16 13
4 4 [57] 0.997 0.995 16 3 -
10 26449 0.9911 0.9982 0.9929
251 2 4
[58] 0.9610.99 0.998
0.9540.9880.997
25 1 2 4
-
11 Triazines 0.97 30 3 [59]
0.9510.9750.9830.989
0.9460.9710.9760.985
30
1 2 3 4
-
12 23167 0.366 0.861 0.93
31 31 27
1 4 3
[60] 0.7240.8620.939
0.6970.8420.924
31 1 2 3
-
13 40846_1
0.700 0.753 0.909 0.917
36 40 20 20
5 6 5 7
0.6280.8060.918
0.6060.7890.891
40 1 2 4
-
14 40846_2 0.719 0.876 0.902
40 36 20
7 7 6
0.5510.7850.904
0.5160.7560.88
40 1 2 4
-
15 40846_4
0.632 0.760 0.769 0.822
40 20 36 20
4 3 5 4
[61]
0.5560.7520.92
0.5230.7280.903
40 1 2 4
-
89

L
Leonardo Electronic Journal of Practices and Technologies
ISSN 1583-1078
Issue 6, January-June 2005
p. 76-98
16 23158 0.8 40 5 [62] 0.951 0.945 40 2 -
17 22583 0.883 0.885 0.888
57 20 37
5 5 5
[63]
0.7830.8350.9
0.918
0.7660.8090.8840.9
57
2 3 4 5
-
18 Dipeptides 0.782 58 2 [64]
0.85 0.8790.9040.925
0.8360.8670.8830.910
58
2 3 4 5
-
19 23110 0.898 0.900 0.918
44 69 25
5 [65]
0.6830.8710.9040.9230.936
0.6660.8590.8900.9130.928
69
1 2 3 4 5
-
20 PCB_lkow - - - 0.8730.8900.917
0.8700.8850.909
206 1 2 4
-
21 PCB_rrt - - -
[52] 0.9840.997
0.9840.997 209 1
2 -
A very important characteristic of MDF SAR is that allow making of important
remarks about the structural causality of the measured activity. For the published results of
MDF SAR models, more details available in papers [45, 46, 48, 50, 54, 56].
Discussions
Most of the previous reported SAR models were investigate the activities of molecules
starting from the whole set of compounds but frequently the best results were obtained after
the exclusion from the SAR models of one or more than one compounds. The MDF SAR
original methodology have been applied on whole sets of compounds and had been obtained
better results comparing with the previous reported models most of the time using a number
of variables lower than previous reported models (see table 2).
The Hotelling's t test [66] and the Steiger’s Z-test [67] were applied in order to
determine whether there were significant differences between the coefficient of correlation
from the previous reported models with the MDF SAR models (see table 3).
The Hotelling's t test was proposed by Harald Hotelling in 1940 and Steiger’s Z-test
was proposed by James H. Steiger in 1980. The differences between p scores obtained
through Hotelling’s t and Steiger’s Z and is why the traditional Hotelling's t test for
90

Molecular Descriptors Family on Structure Activity Relationships 1. Review of the Methodology
Lorentz JÄNTSCHI
comparing correlations is generally not appropriate in practice can be found in [68] and [69].
Detailed several aspects of the correlated correlations can be found in [70-72].
The measured activities of the set of molecules, the estimated activities previous
reported and the estimated activities obtained after applying the MDF SAR methodology were
used to obtain the correlation coefficients (ry1, ry2, r12). The results are in table 3. The
statistical tests were applied just for the MDF SAR published sets of molecules, by using of
the formulas:
y1 y2 12
2 212 y1 y2 12 y1 y2
(r r ) 1 rn 3t2 1 2r r r r r r
− +−=+ − − − 2
2 2y1 y2 12 y1 y2
2 2y1 y2y1 y2 12
(2 r r ) / 1 r (1 r )(1 r )n 3Z ln2 (4 (r r )(3 r )
− − − + −−=− +− + − 1 r )(1 r )
Table 3. Comparison of MDF SAR models vs. other methods scores Set n ry1 ry2 r12 t Z pt (%) pZ (%)
Ta395 15 0.9882 0.8368 0.8451 6.159 4.380 4.87792E-03 5.95150E-04 Tox395 14 0.9782 0.7738 0.7602 4.837 3.630 5.21148E-02 1.41641E-02 23159 18 0.9908 0.5422 0.5396 13.401 6.554 9.42167E-08 2.80620E-09 36638 16 0.9972 0.8157 0.8163 14.521 7.087 2.05978E-07 6.91447E-11 IChr10 10 0.9996 0.8249 0.8256 27.680 7.511 2.06208E-06 2.95319E-12 41521 8 0.9996 0.9556 0.9591 12.467 5.098 5.88865E-03 1.71629E-05
Legend: ry1 is the r score obtained by MDF; ry2 is the r score obtained by other method previously reported r12 is the r score between calculated MDF values and previously reported method values; t is the Hotelling's t-test value for "correlated correlations" within a population; Z is the Steiger’s Z-test value for "correlated correlations" within a population; df is degree of freedom for the t and Z values, df = n-3; pt is the two tailed probability associated with the t value; pZ is the one tailed probability associated with Z normal distribution value.
The Hotelling's t test and the Steiger’s Z-test have been applied on whole set of
molecules not just for the molecules included into the previous reported models; these is the
reason for that exists differences between r2 from table 2 and r squared values from table 3.
The values of t, pt(%), Z, and pZ(%) sustain that the MDF SAR models allows
significantly better prediction of compounds activities compared with other published models.
The p values from both t and Z tests give us for all cases from the table 3 an up to
99.999% probability that the MDF model is significantly better than the previous reported
models.
91

L
Leonardo Electronic Journal of Practices and Technologies
ISSN 1583-1078
Issue 6, January-June 2005
p. 76-98
References
[1] De Rienzo F., Gabdoulline R. R., Wade R. C., Sola M., Menziani M. C., Computational
approaches to structural and functional analysis of plastocyanin and other blue copper
proteins, Cellular and Molecular Life Sciences, Springer-Verlag, 2004, 61(10), p. 1123-
1142.
[2] Wikler D. A., Burden F. R., Watkins A. J. R., Atomistic Topological Indices Applied to
Benzodiazepines using Various Regression Methods, Quantitative Structure Activity
Relationships, Elsevier, 1998, 17(1), p. 14-19.
[3] Chen I-J., MacKerell A. D., Computation of the influence of chemical substitution on the
pKa of pyridine using semiempirical and ab initio methods, Theoretical Chemistry
Accounts: Theory, Computation, and Modeling (Theoretica Chimica Acta), Springer-
Verlag, 2000, 103 (6), p. 483-494.
[4] Chen Z., Huang G.H., Chan C.W., Geng L.Q., Xia J., Development of an Expert System
for the Remediation of Petroleum-Contaminated Sites, Environmental Modeling and
Assessment, Springer Science, Business Media B.V., 2003, 8(4), p. 323-334.
[5] Cunningham S. L., Cunningham A. R., Day B. W. CoMFA, HQSAR and molecular
docking studies of butitaxel analogues with b-tubulin, Journal of Molecular Modeling, 2005,
11(1), p. 48-54.
[6] ***, Unity Program for SIMCA (Soft Independent Modeling Class Analogy), Tripos
Associates, St. Louis, MO.
[7] Merz A., Rognan D., Folkers G., 3D QSAR Study of N2-phenylguanines as Inhibitors of
Herpes Simplex Virus Thymide Kinase, Antiviral and Antitumor Research,
http://www.pharma.ethz.ch/text/research/tk/qsar.html.
[8] Gurba P. E., Parham M. E., Voltano J. R., Comparison of QSAR Models Developed for
Acute Oral Toxicity (LD50) by Regression and Neural Network Techniques, Conference on
Computational Methods in Toxicology – April, 1998, Holiday Inn/I-675, Dayton, Ohio,
USA, Abstract available at: http://www.ccl.net/ccl/toxicology/abstracts/abs9.html.
92

Molecular Descriptors Family on Structure Activity Relationships 1. Review of the Methodology
Lorentz JÄNTSCHI
[9] ***, HyperChem, Molecular Modelling System; Hypercube Inc., Available at:
http://hyper.com/products/Professional/.
[10] ***, Molconn-Z, http://www.eslc.vabiotech.com/molconn.
[11] Waller C. L., Wyrick S. D., Park H. M., Kemp W. E., Smith F. T., Conformational
Analysis, Molecular Modeling, and Quantitative Structure-Activity Relationship Studies of
Agents for the Inhibition of Astrocytic Chloride Transport, Pharm. Res., 1994, 11(1), p. 47-
53.
[12] Horwitz J. P., Massova I., Wiese T., Wozniak J., Corbett T. H., Sebolt-Leopold J. S.,
Capps D. B., Leopold W. R., Comparative Molecular Field Analysis of in Vitro Growth
Inhibition of L1210 and HCT-8 Cells by Some Pyrazoloacridines, J. Med. Chem., 1993,
36(23), p. 3511-3516.
[13] McGaughey G. B., MewShaw R. E., Molecular Modeling and the Design of Dopamine
D2 Partial Agonists, presented at the Charleston Conference, March; 1998, and submitted in
May 1998, Network Science, http://netsci.org/Science/Compchem/feature20.html.
[14] Chuman H., Karasawa M., Fujita T., A Novel Three-Dimensional QSAR Procedure:
Voronoi Field Analysis, QSAR, 1998, 17(4), p. 313-326.
[15] Walter C. L., Kellogg G. E., Adding Chemical Information of CoMFA Models with
Alternative 3D QSAR Fields, Network Science,
http://netsci.org/Science/Compchem/feature10.html.
[16] Medvedev A. E., Veselovsky A.V., Shvedov V.I., Tikhonova O.V., Moskvitina T.A.,
Fedotova O.A., Axenova L.N., Kamyshanskaya N.S., Kirkel A.Z., Ivanov A.S., Inhibition
of monoamine oxidase by pirlindole analogues: 3D-QSAR and CoMFA analysis, J. Chem.
Inf. Comput. Sci., 1998, 38(6), p. 1137-1144.
[17] Kellogg G. E., Semus S. F., Abraham D. J., HINT: a new method of empirical
hydrophobic field calculation for CoMFA, J. Comput.-Aided Mol. Des., 1991, 5(6), p. 545-
552.
[18] Myers A. M., Charifson P. S., Owens C. E., Kula N. S., McPhail A. T., Baldessarini R.
J., Booth R. G., Wyrick S. D., Conformational Analysis, Pharmacophore Identification, and
Comparative Molecular Field Analysis of Ligands for the Neuromodulatory sigma3
Receptor, J. Med. Chem., 1994, 37(24), p. 4109-4117.
93

L
Leonardo Electronic Journal of Practices and Technologies
ISSN 1583-1078
Issue 6, January-June 2005
p. 76-98
[19] Kim K. H., in Wermuth C. G. (ed.), Use of the hydrogen-bond potential function on
comparative molecular field analysis (CoMFA): An extension of CoMFA, Trends in QSAR
and Molecular Modelling 92, Proceedings of the 9th European Symposium on Structure-
Activity Relationships: QSAR and Molecular Modelling, September 7–11 1992, Strasbourg,
France, ESCOM, Leiden, 1993, pp. 245–251.
[20] Durst G. L., Comparative Molecular Field Analysis (CoMFA) of Herbicidal
Protoporphyrinogen Oxidase Inhibitors using Standard Steric and Electrostatic Fields and
an Alternative LUMO Field. Quant. Struct.-Act. Relat., 1998, 17, p. 419-426.
[21] Waller C.L., Marshall G. R., Three-Dimensional Quantitative Structure-Activity
Relationship of Angiotensin-Converting Enzyme and Thermolysin Inhibitors. II. A
Comparision of CoMFA Models Incorporating Molecular Orbital Fields and Desolvation
Free Energy Based on Active-Analog and Complementary-Receptor-Field Alignment Rules,
J. Med. Chem., 1993, 36, p. 2390-2403.
[22] Wiese M., Pajeva I. L., A Comparative Molecular Field Analysis of Propafenone-type
Modulators of Cancer Multidrug Resistance, Quant. Struct.-Act. Relat., 1998, 17(4), p. 301-
312.
[23] Klebe G., Abraham U., On the Prediction of Binding Properties of Drug Molecules by
Comparative Molecular Field Analysis, J. Med. Chem., 1993, 36(1), p. 70-80.
[24] Czaplinski K.H.A., Grunewald G. L., A Comparative Molecular Field Analysis Derived
Model of Binding of Taxol Analogs to Microtubes, Bioorg. Med. Chem. Lett., 1994, 4(18),
p. 2211-2216.
[25] Akagi T., Exhaustive Conformational Searches for Superimposition and Three-
Dimensional Drug Design of Pyrethroids, QSAR, 1998, 17(6), p. 565-570.
[26] Waller C.L., Oprea T.I., Giolitti A., Marshall G.R., Three-Dimensional QSAR of Human
Immunodeficiency Virus. (I) Protease Inhibitors. 1. A determined Alignment Rules, J. Med.
Chem., 1993, 36(26), p. 4152-4160.
[27] Thompson E., The Use of Substructure Search and Relational Databases for Examining
the Carcinogenic Potential of Chemicals; Conference on Computational Methods in
Toxicology – April, 1998, Holiday Inn/I-675, Dayton, Ohio, USA; Abstract available at:
http://www.ccl.net/ccl/toxicology/abstracts/tabs6.html.
94

Molecular Descriptors Family on Structure Activity Relationships 1. Review of the Methodology
Lorentz JÄNTSCHI
[28] Todeschini R., Lasagni M., Marengo E., New Molecular Descriptors for 2D and 3D
Structures, Theory J. Chemometrics, 1994, 8, p. 263-272.
[29] Todeschini R., Gramatica P., Provenzani R., Marengo E., Weighted Holistic Invariant
Molecular (WHIM) descriptors. Part 2. There Development and Application on Modeling
Physico-chemical Properties of Polyaromatic Hydrocarbons, Chemometrics and Intelligent
Laboratory Systems, 1995, 27, p. 221-229.
[30] Todeschini R., Vighi M., Provenzani R., Finizio A., Gramatica P., Modeling and
Prediction by Using WHIM Descriptors in QSAR Studies: Toxicity of Heterogeneous
Chemicals on Daphnia Magna, Chemosphere, 1996, 8, p. 1527.
[31] Zaliani A., Gancia E., MS-WHIM Scores for Amino Acids: A New 3D-Description for
Peptide QSAR and QSPR Studies, J. Chem. Inf. Comput. Sci., 1999, 39(3), p. 525-533.
[32] Bravi G., Gancia E., Mascagni P., Pegna M., Todeschini R., Zaliani A., MS-WHIM New
3D Theoretical Descriptors Derived from Molecular Surface Properties: A Comparative 3D
QSAR Study in a Series of Steroids, J. Comput.-Aided Mol. Des., 1997, 11, p. 79-92.
[33] Niemelä J.R., Validation of the BIODEG Probability Program, TemaNord Repost, 1994,
589, p. 153-156.
[34] Damborsky J., A mechanistic approach to deriving quantitative structure-activity
relationship models for microbial degradation of organic compounds, Proceedings of the
Satellite Workshop on Biodegradation accompanying the 6th International Workshop on
QSAR in Environmental Sciences, Italy, September 12, 1994, and SAR QSAR Environ
Res., 1996, 5(1), p. 27-36.
[35] Blok J., Classification of biodegradability by growth kinetic parameters, Ecotoxicology
and Environmental Safety, 1994, 27, p. 294-305.
[36] Warne M. A., Ebbels T. M. D., Lindon J. C., Nicholson J. K., Semiempirical Molecular-
Orbital Properties of Some Polycyclic Aromatic Hydrocarbons and Correlation with
Environmental Toxic Equivalency Factors, Polycyclic Aromatic Compounds, 2003, 23, 23-
47.
[37] Schultz T. W., Cronin M. T. D., Walker J. D., Aptula A. O., Quantitative structure-
activity relationships (QSARs) in toxicology: a historical perspective, Journal of Molecular
Structure: THEOCHEM, 2003, 622(1), p. 1-22.
95

L
Leonardo Electronic Journal of Practices and Technologies
ISSN 1583-1078
Issue 6, January-June 2005
p. 76-98
[38] Schultz T. W., Cronin M. T. D., Netzeva T. I., The present status of QSAR in toxicology,
Journal of Molecular Structure: THEOCHEM, 2003, 622, p. 23-38.
[39] Sparks T. C., Crouse G. D., Durst G., Natural products as insecticides: the biology,
biochemistry and quantitative structure–activity relationships of spinosyns and spinosoids,
Pest Management Science, 2001, 10, p. 896-905.
[40] Kompare B. Estimating environmental pollution by xenobiotic chemicals using QSAR
(QSBR) models based on artificial intelligence, Water Science and Technology, 1998,
37(8), p. 9-18.
[41] Vracko M., Kohonen Artificial Neural Network and Counter Propagation Neural
Network in Molecular Structure-Toxicity Studies, Current Computer - Aided Drug Design,
2005, 1(1), p. 73-78.
[42] Diudea M., Gutman I., Jäntschi L., Molecular Topology, Nova Science, Huntington, New
York, 2001, 332 p.
[43] Jäntschi L., Katona G., Diudea M., Modeling Molecular Properties by Cluj Indices,
Commun. Math. Comput. Chem. (MATCH), Bayreuth, Germany, 2000, 41, p.151-188.
[44] Smith J.C., Hansch C., Morton J.M., QSAR treatment of multiple toxicities: the
mutagenicity and cytotoxicity of quinolines, Mutation Research, 1997, 379, p. 167-175.
[45] Jäntschi L., Bolboacă S., Molecular Descriptors Family on QSAR Modeling of
Quinoline-based Compounds Biological Activities, The 10th Electronic Computational
Chemistry Conference, April 2005, http://eccc.monmouth.edu.
[46] Jäntschi L., MDF - A New QSAR/QSPR Molecular Descriptors Family, Leonardo
Journal of Sciences, AcademicDirect, 2004, Issue 4, p. 67-84.
[47] Jäntschi L., Muresan S., Diudea M., Modeling Molecular Refraction and
Chromatographic Retention by Szeged Indices, Studia Universitatis Babes-Bolyai, Chemia,
2000, XLV(1-2), p. 313-318.
[48] Jäntschi L., Water Activated Carbon Organics Adsorption Structure - Property
Relationships, Leonardo Journal of Sciences, AcademicDirect, 2004, Issue 5, p. 63-73.
[49] Brasquet C., Le Cloirec P., QSAR for Organics Adsorption onto Activated Carbon in
Water: What about the use of Neural Networks?, Wat. Res., 1999, 33(17), p. 3603-8.
96

Molecular Descriptors Family on Structure Activity Relationships 1. Review of the Methodology
Lorentz JÄNTSCHI
[50] Jäntschi L., QSPR on Estimating of Polychlorinated Biphenyls Relative Response Factor
using Molecular Descriptors Family, Leonardo Electronic Journal of Practices and
Technologies, AcademicDirect, 2004, Issue 5, p. 67-84.
[51] Diudea M., Kacso I., Topan M., Molecular Topology. 18. A QSPR/QSAR Study by using
new valence group carbon-related electronegativities, Rev. Roumaine Chim., 1996, 41(1-
2), p. 141-157, and J. Chem. Comput. Sci., 1994, 34, p. 1072-1078.
[52] Eisler R., Belisle A. A., Planar PCB Hazards to Fish, Wildlife, and Invertebrates: A
Synoptic Review, Biological Report 31 and Contaminant Hazard Reviews Report 31, 1996,
IV, p.75, http://www.pwrc.usgs.gov/infobase/eisler/CHR_31_Planar_PCBs.pdf.
[53] Baker J.R., Mihelcic J. R., Sabljic A., Reliable QSAR for estimating KOC for persistent
organic pollutants: correlation with molecular connectivity indices, Chemosphere, 2001,
45, p. 213-221.
[54] Jäntschi L., Delphi Client - Server Implementation of Multiple Linear Regression
Findings: a QSAR/QSPR Application, Applied Medical Informatics, Cluj-Napoca, 2004,
Issue 15, p. 48-55.
[55] Hasegawa K., Arakawa M., Funatsu K., 3D-QSAR study of insecticidal neonicotinoid
compounds based on 3-way partial least squares model, Chemometrics and Intelligent
Laboratory Systems, 1999, 47, p. 33-40.
[56] Bolboacă S., Jäntschi L., Molecular Descriptors Family on Structure Activity
Relationships 2. Insecticidal Activity of Neonicotinoid Compounds, Leonardo Journal of
Sciences, AcademicDirect, 2005, Issue 6, p. 78-85.
[57] Agrawal V. K., Srivastavaa R., Khadikarb P. V., QSAR Studies on Some Antimalarial
Sulfonamides, Bioorganic & Medicinal Chemistry, 2001, 9, p. 3287-3293.
[58] Ungwitayatorn J., Pickert M., Frahm A.W., Quantitative structure-activity relationship
(QSAR) study of polyhydroxyxanthones, Pharmaceutica Acta Helvetiae, 1997, 72, p. 23-29.
[59] Diudea M., Jäntschi L., Pejov L., Topological Substituent Descriptors, Leonardo
Electronic Journal of Practices and Technologies, AcademicDirect, 2002, 1, p. 1-18.
97

L
Leonardo Electronic Journal of Practices and Technologies
ISSN 1583-1078
Issue 6, January-June 2005
p. 76-98
[60] Wei D., Zhang A., Wu C., Han S., Wang L., Progressive study and robustness test of
QSAR model based on quantum chemical parameters for predicting BCF of selected
polychlorinated organic compounds (PCOCs), Chemosphere, 2001, 44, p. 1421-1428.
[61] Supuran C. T., Clare B. W., Carbonic anhydrase inhibitors – Part 57: Quantum
chemical QSAR of a group of 1,3,4-thiadiazole- and 1,3,4-thiadiazoline disulfonamides with
carbonic anhydrase inhibitory properties, Eur. J. Med. Chem, 1999, 34, p. 41-50.
[62] Agrawala V.K., Khadikarb P.V., QSAR Prediction of Toxicity of Nitrobenzenes,
Bioorganic & Medicinal Chemistry, 2001, 9, p. 3035–3040.
[63] Toropov A. A., Toropova A. P., Nesterov I. V., Nabiev O. M., Comparison of QSAR
models of anti-HIV-1 potencies based on labeled hydrogen filled graph and graph of atomic
orbitals, Journal of Molecular Structure (Theochem), 2003, xx, p. xxx–xxx then Castro E.
A., Torrens F., Toropov A. A., Nesterov I. V., Nabiev O. M., QSAR Modeling ANTI-HIV-1
Activities by Optimization of Correlation Weights of Local Graph Invariants, Molecular
Simulation, Taylor & Francis, 2004, 30(10), p. 691-696.
[64] Diudea M., Gutman I., Jäntschi L., Molecular Topology, 2nd Edition, Nova Science,
Huntington, New York, 2002, 332 p. & Opris D., Diudea M. V., Peptide Property Modeling
by Cluj Indices, SAR/QSAR Environ. Res., 2001, 12, 159-179.
[65] Toporov A. A., Toporova A. P., QSAR modeling of toxicity on optimization of
correlation weights of Morgan extended connectivity, Journal of Molecular Structure
(Theochem), 2002, 578, p. 129-134.
[66] Hotelling H., The Selection of Variates for Use in Prediction with Some Comments on
the General Problem of Nuisance Parameters, The Annals of Mathematical Statistics, Vol.
11, No. 3, 1940, p. 271-283.
[67] Steiger J. H., Tests for comparing elements of a correlation matrix, Psychological
Bulletin, 1980, 87, p. 245-251.
[68] Meng X., Rosenthal R., Rubin, D.R., Comparing correlated correlation coefficients,
Psychological Bulletin, 1992, 111, p. 172-175.
[69] T. E. Raghunathan, R. Rosenthal, and D. B. Rubin, Comparing correlated but
nonoverlapping correlations, Psychological Methods, 1996, 1, p. 178-183.
[70] Hittner J. B., May K., Silver N. C., A monte carlo evaluation of tests for comparing
dependent correlations, Journal of General Psychology, 2003, 130(2), p. 149-168.
98

Molecular Descriptors Family on Structure Activity Relationships 1. Review of the Methodology
Lorentz JÄNTSCHI
[71] Raghunathan T., An Approximate Test for Homogeneity of Correlated Correlation
Coefficients, Quality and Quantity, Volume 37(12), Number 1, 2003, p. 99-110.
[72] Steiger J.H., Beyond the F-Test: Effect Size Confidence Intervals and Tests of Close Fit
in the Analysis of Variance and Contrast Analysis, Psychological Methods, 2004, 9, p. 164-
182.
99