Morphological, molecular and pathogenic characterization ...

1
Major MSc Thesis in Plant Breeding (PBR-80436)
Molecular and morphological characterization of
leaf heading in Chinese cabbage (Brassica rapa)
Roos Goessen
Supervisors: Dr. Ir. Guusje Bonnema and Xiaoxue Sun
Examiners: Dr. Ir. Guusje Bonnema and Dr. Ir. Christian Bachem
Wageningen University
Department of Plant Breeding
16-12-2016

2
Abstract
Chinese cabbage (Brassica rapa) is characterized by its leafy head, consisting out of extremely inwards
curving leaves. This thesis aimed to characterize leaf heading in Chinese cabbage (CC) in a morphological
and molecular approach. The close related non-heading pak choi (PC) was used as a control.
First the morphology of apical meristems of CC and PC were assessed during all vegetative growth stages,
until folding stage. Leaf numbers and function were counted, in order to deduce at which time-point leaves
with a particular function (rosette, folding or heading) were initialized.
Hereafter qRT-PCRs were performed on several heading candidate genes in CC and PC. In the candidate
genes Br-ARF3.1 and Br-ARF4.1 a slight increase in fold expression was found in CC in comparison to PC,
at the time heading leaves were formed in CC. However at this time-point PC was bolting, making it
difficult to conclude whether the difference is possibly related to bolting or heading. In all other assessed
candidate genes no obvious differences were observed.
In situ hybridizations were performed in order to assess the spatial and temporal expression of Br-ARF3.1.
None of the experiments resulted in hybridization signals as expected, which could be due to various
reasons, e.g. choice of reference gene, RNA integrity or conditions during the experiment.
Lastly EMS lines which were identified either for a mutation in Br-ARF3.1 or for non-heading phenotype in
sibling plants in China, were grown for phenotyping. Interesting plants were also genotyped. No non-
heading was observed, most probably due to different growth conditions than in China. An overexpression
study performed by Xiaoxue Sun (results obtained at the end of this thesis), indicated that Br-ARF3.1 in CC
is a non-functional mutant. This explains why plants identified for an Br-ARF3.1 mutation did now show an
abberant phenotype and why no mutations were found in the genotyped plants.

3
Acknowledgements
I want to thank my supervisor Dr. Ir. Guusje Bonnema for giving me the opportunity to work on this project,
valuable work discussions and her support during my thesis. Her commitment and passion in research are
really inspiring. Her feedback and advice on my report were really helpfull in finishing my thesis, and are
greatly appreciated.
Furthermore, I want to thank my supervisor Xiaoxue Sun. She learned me a lot of scientific skills, and was
always there to answer questions or discuss the next steps in my thesis. I value her patience, creativity and
persistence. I’m thankfull and happy to have worked with her.
I also want to thank Johan Bucher, for always being there to answer questions and often giving helpfull
suggestions for the lab work. I admire his positive attitude and knowledge.
Mostly, I want to give gratitude to my family for always supporting me during my studies. I feel lucky and
really value that they are always there for me and trust me.

4
Table of Contents
Abstract ............................................................................................................................................................. 2
Acknowledgements .......................................................................................................................................... 3
Introduction ...................................................................................................................................................... 6
Aim thesis .......................................................................................................................................................... 9
Material and methods .................................................................................................................................... 10
Plant material and growth conditions ............................................................................................................ 10
In situ hybridization ...................................................................................................................................... 10
Fixation and embedding ................................................................................................................................ 11
Probe design .................................................................................................................................................. 12
Hybridization ................................................................................................................................................ 13
RNA quality .................................................................................................................................................. 13
Dot blot ......................................................................................................................................................... 13
Meristem morphology observation ............................................................................................................... 13
Leaf number counting ................................................................................................................................... 13
EMS genotyping and phenotyping ................................................................................................................ 14
qRT-PCR and preparations ........................................................................................................................... 16
Results ............................................................................................................................................................. 18
Fixation, embedding and cutting of meristems ............................................................................................. 18
General observation of shoot apical meristems ............................................................................................ 18
Leaf counting ................................................................................................................................................ 21
qRT-PCR ....................................................................................................................................................... 23
In situ hybridization: Probe design ............................................................................................................... 25
First in situ hybridization .............................................................................................................................. 26
Second in situ hybridization .......................................................................................................................... 28
RNA presence validation .............................................................................................................................. 29
Third in situ hybridization ............................................................................................................................. 30
EMS phenotyping ......................................................................................................................................... 33
EMS genotyping ........................................................................................................................................... 40
Discussion........................................................................................................................................................ 41
Fixation, embedding and cutting of meristems ............................................................................................. 41
Meristem morphology observation ............................................................................................................... 41
Leaf number and function ............................................................................................................................. 42
qRT-PCR ....................................................................................................................................................... 42
Probes for in situ hybridization ..................................................................................................................... 43

5
Crucial steps for in situ hybridizations ......................................................................................................... 43
In situ hybridizations ..................................................................................................................................... 44
RNA presence ............................................................................................................................................... 46
EMS phenotyping and genotyping ................................................................................................................ 46
Conclusions ..................................................................................................................................................... 48
Recommendations .......................................................................................................................................... 49
References ....................................................................................................................................................... 50
Appendix ......................................................................................................................................................... 53

6
Introduction
The Brassica genus consists of several economically important crops, which all show great diversity in
morphology. This gives rise to a wide range of applications, e.g. as vegetable, fodder or oil crop. Vegetable
crops of the Brassica genus are considered very healthy due to their high values in fibre, vitamins and
potassium. Oil types can be used for human consumption or more industrial applications such as use as
Biodiesel. The wide morphological variation makes this genus an interesting subject for research, in order to
study the underlying genetics of this variation (Wang et al., 2011).
The Brassica genus encompasses three elementary diploid species B. rapa (2n=20, AA genome), B. nigra
(2n=16, BB genome) and B. oleracea (2n=18, CC genome) and through hybridization also formed the three
amphidiploid species B. juncea (2n=36, AABB genome), B. napus (2n=38, AACC genome) and B. carinata
(2n=34, BBCC genome). The relationship between the different species and genomes is known as the
triangle of U (U, 1935). An advantage in studying the Brassica genus is the close relationship to the well-
studied model Arabidopsis thaliana. The mesohexaploid Brassica genus arose after a whole genome
triplication event and numerous chromosome rearrangements from a common ancestor with Arabidopsis,
around 16 million years ago (Wang et al., 2011, Schranz et al., 2005). However, since the triplication a lot of
gene loss has occurred. Assuming the newly formed hexaploid would have 90,000 genes, the triple amount
of genes present in Arabidopsis, only 41,174 genes are identified in B. rapa (Wang et al., 2011). This gene
loss is not random, usually genes encoding products interacting with other products or networks retain more
than genes encoding products without such interaction, as described by the gene dosage effect (Birchler and
Veitia, 2007). The triplication could be a driver behind the great morphological diversity seen within the
Brassica genus (Wang et al., 2011).
One of the most important species of this genus is Brassica rapa (B. rapa), which provides many leafy
vegetable crops such as Chinese cabbage and Pak choi, as well as root vegetables, e.g. turnips and oil type
crops, e.g. sarsons and winteroils. B. rapa was the first domesticated species of the Brassica genus, and
since several millennia has been cultivated in regions between the western Mediterranean and central Asia
where it first occurred naturally (Gomez-Campo and Prakash, 1999). Several studies indicate that B. rapa is
domesticated in two independent centres of origin, wherein leafy types originate from east Asia while turnip
and oil types would originate from Europe (Gomez-Campo and Prakash, 1999). Within the leafy group, Pak
choi (ssp. Chinensis) is most probably the oldest species, and is characterized by green-white fleshy petioles.
Chinese cabbage (ssp. Pekinensis) originates from China, and is thought to be formed during introduction of
Pak choi from southern to northern China (Tan, 1979). The high yield and great storability of Chinese
cabbage makes it one of the most consumed leafy B. rapa vegetables worldwide.
An essential characteristic of Chinese cabbage is its firm leafy head, build out of yellow-green crinkly leaves
(Mao et al., 2014). Head appearance often represents the quality of the crop and thus also the economic
value. Different head shapes can be distinguished, depending on the cultivar. The most seen shapes are
round and cylindrical, however heads can also be oblong or cone shaped (Mao et al., 2014). The total shape
can differ depending on leaf size, shape and curvature. In order to form a leafy head, a Chinese cabbage has
to go through a long vegetative growth period. In addition to the vegetative stages of Arabidopsis, i.e.
seedling and rosette stage, Chinese cabbage goes through two more stages, the folding and heading stage
(Wang et al., 2014). During seedling stage the primary leaves develop, these are small, round, blue-green
coloured and have long petioles. Subsequently the rosette leaves are formed in order to facilitate head leaves
with photosynthetates (Wang et al., 2014). These leaves are light green, round and large, and are organized
at similar height around the stem. In the folding stage the folding leaves grow curved inwards to form a pre-
7
model for head formation, and are green-yellow coloured. The heading leaves, which are placed around the
shoot apexes, curve inwards extremely to form a compact head and in this way become a nutrient storage
organ (Wang et al., 2014). These leaves are big and green, have lobes and bulges, as well as white short
wide petioles. Chinese cabbage varieties can differ in heading time, i.e. later or earlier types. This trait can
affect the yield and quality of the crop. Chinese cabbage is a biennial plant, and requires vernalisation during
winter for flowering in the next year. However, many plants undergo vernalisation too early, resulting in
bolting before head maturity, causing yield and quality loss (Wang et al., 2014).
Morphological differences in leaves are to a certain degree influenced by external factors, however still the
main differences can be traced back to the underlying genetics and molecular mechanisms. Understanding
the genetics behind leafy head traits in Chinese cabbage gives breeders the opportunity to improve yield and
appearance more efficiently. The genome of B. rapa has been sequenced recently, which provides
opportunities to genetically understand and improve this species (Wang et al., 2011). Furthermore a recent
bioinformatics study on resequencing data compared a big collection of accessions of Chinese cabbage, Pak
choi and other closely related species of B. rapa, which have great variation in leaf heading morphology
(Cheng et al., 2016). Comparison of resequencing data of heading chinese cabbages to the other types,
revealed genomic regions or selective sweeps that were selected for in this group. In these regions, or
genetic loci, several candidate genes for the heading trait were identified, of which especially the auxin
response factors Br-ARF3.1 and Br-ARF4.1, and the Kanadi transcription factors Br-KAN2.1 and Br-KAN2.2
seem promising. A selection signal validation on Br-ARF3.1 and Br-AXR1 genes showed that more than
90% of Chinese cabbages carry the ‘heading’ alleles, while only between 25 and 50% non-heading plants
carry these alleles. This indicates that leaf heading is a quantitative trait, as Pak choi carrying heading alleles
still form no head, probably due to carrying other genes with a non-heading allele. AXR1 encodes a a subunit
of the RUB1 activating enzyme that regulates the protein degradation activity of Skp1-Cullin-Fbox
complexes affecting auxin responses (Del Pozo et al., 1998). A short overview will be given of major steps
of leaf development in Arabidopsis, with emphasis on orthologs of interesting candidate genes in B. rapa.
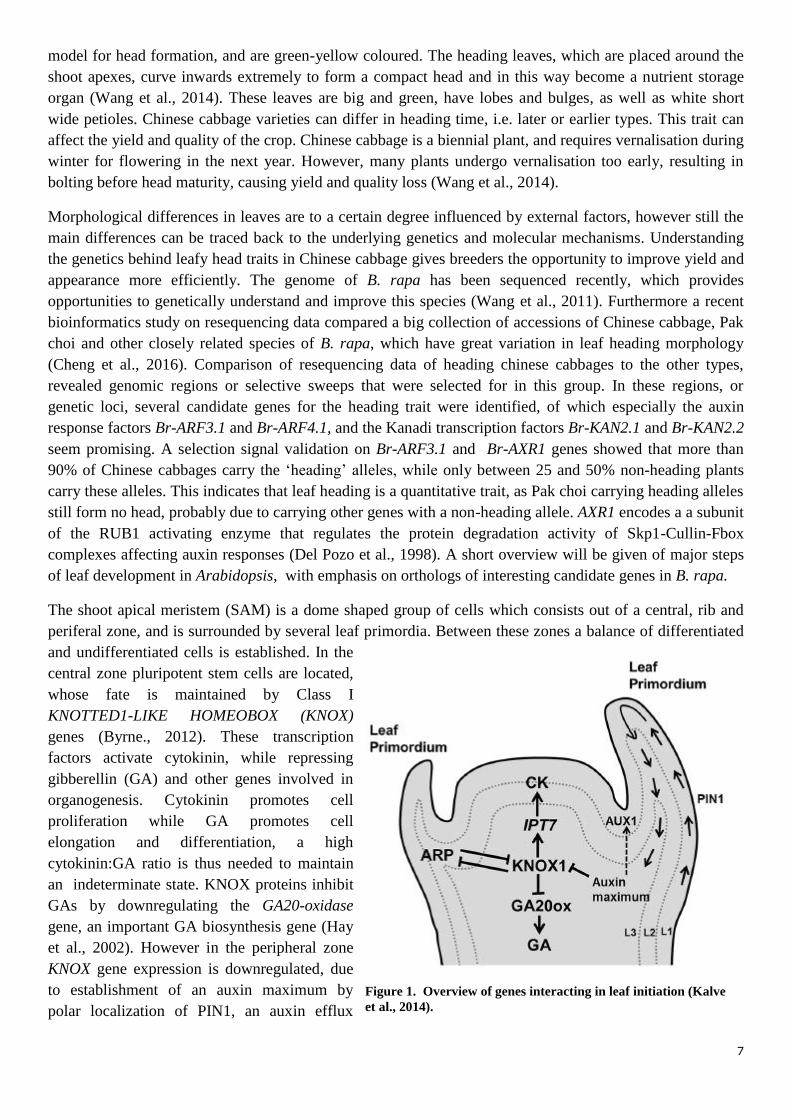
The shoot apical meristem (SAM) is a dome shaped group of cells which consists out of a central, rib and
periferal zone, and is surrounded by several leaf primordia. Between these zones a balance of differentiated
and undifferentiated cells is established. In the
central zone pluripotent stem cells are located,
whose fate is maintained by Class I
KNOTTED1-LIKE HOMEOBOX (KNOX)
genes (Byrne., 2012). These transcription
factors activate cytokinin, while repressing
gibberellin (GA) and other genes involved in
organogenesis. Cytokinin promotes cell
proliferation while GA promotes cell
elongation and differentiation, a high
cytokinin:GA ratio is thus needed to maintain
an indeterminate state. KNOX proteins inhibit
GAs by downregulating the GA20-oxidase
gene, an important GA biosynthesis gene (Hay
et al., 2002). However in the peripheral zone
KNOX gene expression is downregulated, due
to establishment of an auxin maximum by
polar localization of PIN1, an auxin efflux
Figure 1. Overview of genes interacting in leaf initiation (Kalve
et al., 2014).

8
carrier. This downregulation results in relief of GA repression and cytokinin activation, which stimulates
cells to transit to a determinate state. State shift is required for leaf initiation (Moon and Hake, 2011).
After leaf initiation, the leaf establishes several axes; proximal-distal, medial-lateral and adaxial-abaxial
(Moon and Hake, 2011). Polarization of these axes results in asymmetrical distribution of different cell
types, which is a requisite for the physiology of the plant, e.g. often the adaxial leaf side contains more
chloroplasts for photosynthesis while the abaxial side is more important for gas exchange and therefore
contains more stomata. Adaxial fate is determined by class III HD-ZIP transcription factors, i.e.
phavoluta(phv), revoluta (rev) and phabulosa (phb). Also trans-acting small RNAs (tasiRNAs), derived
from TAS3, are important regulators of adaxial fate. These tasiRNAs act by post-transcriptionally silencing
the adaxial expression of ARF3 and ARF4 resulting in a gradient of ARF decreasing from abaxial to adaxial
side (Williams et al., 2005). Abaxial fate is determined by expression of ARF3, ARF4, KANADI (KAN)
transcription factors, the YABBY gene family and miR165/166 microRNAs (Kalve et al., 2014). The latter
represses abaxial HD-ZIPIII expression. YABBY3 upregulates both KAN1 and ARF4, while KANADIs, ARF3
and ARF4 upregulate YABBYs, resulting in a positive feedback loop (bonaccorso et al., 2012). The KAN
gene group encodes for GARP family transcription factors, which are transcribed abaxially in Arabidopsis
(Fukushima and Hasebe, 2014). This gene group acts antagonistically to AS1/2 and HD-ZIP III transcription
factors resulting in maintenance of the abaxial leaf side (Fukushima and Hasebe, 2014). This makes the KAN
gene group one of the primary determinants of abaxial fate. Double mutants kan1kan2 in Arabidopsis show
morphological aberrations such as narrow curved upwards leaves and abaxial outgrowths (Pekker et al.,
2005). The arf3arf4 double mutants show a similar phenotype as kan1kan2 double mutants (Pekker et al.,
2005).
The auxin response factors ARF3 and ARF4 are sister pairs, and their products both localize to the abaxial
side of the leaf. ARFs are DNA-binding
transcription factors controlling transcription of
many auxin-dependent genes, in this way controlling
growth and development (Guilfoyle and Hagen,
2007). In Arabidopsis 23 members of the ARF
family have been identified, all expressed spatially
and temporally different during development. These
differences are mainly due to variations in protein
sequence. ARFs consist out of several domains
Figure 3. Representation of ARF3 (upper) and ARF4
(down) gene structure. In which orange: N-terminal DNA
Binding domain, red: middle region, green: domain III, purple;
domain IV, latter two together represent the C-terminal
dimerization domain
Figure 2. Overview establishment of leaf polarity

9
which have been conserved during evolution. Most ARFs contain an N-terminal DNA binding domain
(DBD) which encompasses a B3 domain and ARF domain, the latter makes homo-dimerization between
ARFs possible (Boer et al., 2014). The DBD is followed by a middle region containing either a repression or
activation domain and lastly ends with a C-terminal dimerization domain (domain III/IV), which is involved
in homo and hetero-dimerization with Aux/IAA repressors as well as interaction with other ARFs (Boer et
al., 2014). In presence of auxin, the Aux/IAA repressor acting on the ARF gene will be degraded by the
Skp1-Cullin-Fbox complex, resulting in activation of the gene (Tiwari et al., 2003). Unlike most ARFs, the
C-terminal dimerization of ARF3 domain has been truncated (Finet et al., 2013). Target sites for tasiRNAs
are present in the middle domain of ARF3/4 (Williams et al., 2005).
Interesting to note is that due to the triplication and subsequent gene loss, both ARF3/4 have two copies in B.
rapa, however only Br-ARF3.1 and Br-ARF4.1 seem to be associated with leaf heading traits according to a
previously performed bioinformatics analysis of re-sequenced data. A study on Br-ARF4.2 expression in B.
rapa found that the ortholog present in one of the more fractioned subgenomes (MFII) was not expressed in
any of the evaluated tissues, suggesting this gene copy has been pseudogenized (Huang et al., 2015).
However the Br-ARF3.2 copy is shown to be expressed, but less functional than Br-ARF3.1 (Mun et al.,
2012).
Aim thesis
This thesis aims to molecularly and morphologically characterize leaf heading in Chinese cabbage.
Molecular analysis of leaf heading focussed on the expression of several candidate genes, by performing in
situ hybridization (ISH) and qRT-PCR on meristem tissue during development in Chinese cabbages and
non-heading Pak choi. Morphology of the leaf heading trait was analysed by leaf number and type counting,
meristem observation and phenotyping of EMS mutants that were selected for their heading phenotype
(being non-heading in China field conditions).
ISHs were performed to visualize the spatial and temporal expression of Br-ARF3.1 during all stages of leaf
development in the heading Chinese cabbage, Chiifu and non-heading Pak choi, PC024. In this way
comparisons can be made on the effect of Br-ARF3.1 on leaf development between the different
morphotypes, and seen in which developmental stages the genes are expressed. During this experiment also
leaf primordia were counted and later compared to the leaves in heading stage, in order to deduce how
leaves are positioned from seedling to heading stage and which function they will gain, e.g. become heading
or rosette leaf.
Furthermore, various EMS lines had been selected in China based on their non-heading phenotype (seven
lines) or based on a mutation in the Br-ARF3.1 heading allele (three lines). These ten EMS lines were
phenotyped during their development. Hereafter interesting mutants, e.g. non heading phenotypes, were
genotyped for their Br-ARF3.1 alleles in order to see if a mutation in the Br-ARF3.1 gene is present, as this
mutation could influence the heading phenotype.
In addition, by quantitative real time PCRs the transcription of several candidate genes related to leaf
heading will be quantified. This will be performed on Chiifu and PC024 on a weekly basis on young leaves
surrounding the SAM, in order to see if expression patterns differ between the different morphotypes. This
can provide an indication about the role of the candidate genes in leaf heading.

10
Material and methods
Plant material and growth conditions Plant material was chosen based on differences in earliness of heading and heading type. For the in situ
hybridization two double haploid (DH) Chinese cabbage genotypes, i.e. Z16 and Chiifu, and one DH Pak
choi genotype, PC024, were used. Z16 is known to be early in heading, while Chiifu has a later phenotype.
Chiifu is the Chinese cabbage reference genotype, as this genotype was sequenced first and therefore used in
a lot of research. Chiifu and Z16 both have a quite compact head. PC024 was chosen because this accession
carries non-heading alleles for both Br-ARF3.1 and Br-ARF4.1. Unfortunately during the experiment the
Z16 genotype appeared not to be uniform, this could be due to not being double haploid or, more probably,
seed mixture. Therefore the Z16 genotype was further excluded in this experiment. For the EMS experiment
9 M2 lines and one M4 line were sown. These lines were created by TILLING on the A003 line and
subsequently been selfed two (M2) or four ( M4) times. The number of seeds sown of each M2 line and the
wt A003 can be seen in table 1.
Table 1: Number of seeds sown for each line for the EMS phenotyping/genotyping experiment. The selfing round is
indicated behind the line name.
Line Seeds sown Line Seeds sown
EMS1 M2 8 EMS7 M2 15
EMS2 M2 9 EMS8 M2 10
EMS3 M2 14 EMS9 M2 7
EMS4 M2 8 EMS10 M4 7
EMS5 M2 8 A003 WT 10
EMS6 M2 15 Total 111
At the start ± 600 plants were sown in trays, of which 480 for the ISH experiment and 111 for the EMS
experiment. During the ISH experiment every 3 days 6-10 meristems of each genotype were harvested,
which will destroy the plant in the process. This harvesting continued for 8 weeks, therefore it was needed to
sow around 160 seeds per genotype. After the first week around 450 plants will remain to be transferred to
bigger pots of 17 cm in diameter, as other plants will already be harvested in the first week or will be
destroyed in the process of transfer.
Plants were grown in uniform conditions (temp 18 degrees). The optimal day light time for head formation
is around 12 hours, if longer it is possible heads will not form as early flowering is induced. However in this
experiment we will use a daylight time of 8 hours, due to restriction in possibilities in green house.
Temperature should not be too high, as then also head formation could be aberrant. For the experimental
design of the ISH experiment each genotype was placed in one row. In addition, one row with both PC024
and Chiifu was left for flowering. The EMS plants were also placed in rows, with plants per line clustered
together. However in between lines an in the middle of each line a wild type A003 was placed as a control.
In situ hybridization By ISH temporal and spatial mRNA expression can be detected. ISH was initially performed on Br-ARF3.1
mRNA in the shoot apical meristem during several stages of development. From start of germination,
PC024, Z16 (later excluded) and Chiifu were harvested each 3-4 days, on similar times to exclude circadian
influences on gene expression. After rosette stage meristems were harvested only once a week. Both
Chinese cabbage and Pak choi were assessed, in order to characterize expression differences between the
morphotypes. During each harvest 6 to 10 plants per genotype were taken, in order to have enough

11
meristems for the in situ hybridization, but also general observation and back-ups. For ISH numerous
protocols are known, however it depends on the experiment and available resources which fits best, e.g.
usage of different probes or different embedding methods etc. In this experiment a protocol was used which
is based on the Jeff Long in situ protocol, but is adapted by Shunsuke Saiga (Saiga et al., 2008). During all
steps gloves were worn to prevent contamination with RNAses, also steps after meristems harvest were
performed in a flow-cabinet.
Fixation and embedding For fixation of tissues 4% PFA was prepared. Meristems were cut using a sterile knife, cleaned between
cuttings with ethanol. The tissues were cut between 0.4 and 1 cm in size, keeping also some leaves
surrounding the meristem. The meristems were collected per 3-5 in one tube containing 20 ml of fixative,
kept on ice. Of each genotype two tubes per time point were collected. After harvest, the tubes were placed
in vacuum while still on ice, this for 45 minutes to 2.5 hours. Time was dependent on whether the tissue had
sunk to the bottom, as this is an indication that the fixation solution has reached the whole tissue. The
meristems were kept overnight in fixation solution at 4 °C. Some samples were kept in fixation solution for
4 days, and other for only 1 night, this because it was chosen to perform the follow up steps only once a
week in order to save time.
Initially washing steps were performed according exactly to the mentioned protocol (Saiga et al., 2008). In
short the tissues were washed to 70% EtOH, at this step the tissues could be stored for several months at 4
°C. Continuation steps cannot be interrupted till the end of the embedding process. Hereafter the tissues
were washed to 100% EtOH. One alteration was the addition of eosin (20ug/ml) to the 100% EtOH steps,
which gives the tissue a pink colour making it easier to see the tissue once embedded. Hereafter the tissue
were washed with xylene and replaced by paraffin. The tissues were placed in a Petri dish filled with
paraffin and positioned as desired, after which the tissues were left for cool down at room temperature. After
full setting the blocks were stored at 4 °C till use.
After the first embedding round it was discovered the embedding was not good, the tissues were not fully
penetrated with paraffin and had therefore a different density than the rest of the block, making it difficult to
make slices and even impossible when coming deeper in the tissue, as it was still soft. Therefore it was
chosen to replace the water bath initially used for the heating steps with an incubator, as there was suspicion
water drops could get into the tubes, which is disastrous for paraffin. Also the embedding steps of the
protocol were altered to a protocol previously used by PhD Xiaoxue Sun. In this protocol longer ethanol,
xylene and paraffin steps are used. This because the meristem is a very dense tissue with small compact
cells, and therefore could take longer to fully uptake these fluids/compounds. After altering these steps the
embedding was well for meristem tissues. The new protocol was as followed:
1x PBS 30 minutes 4 °C
1x PBS 30 minutes 4 °C
30% EtOH 2 hours 4 °C
50% EtOH 2 hours 4 °C
70% EtOH 2 hours 4 °C
85% EtOH 2 hours 4 °C
95% EtOH 2 hours 4 °C
100% EtOH + eosin overnight 4 °C
100% EtOH + eosin 30 minutes Room temperature
100% EtOH + eosin 30 minutes Room temperature
50% xylene 2 hours Room temperature
75% xylene 60 minutes Room temperature

12
100% xylene 2 hours Room temperature
100% xylene 60 minutes Room temperature
50% paraffin 3 hours 63 °C
75% paraffin overnight 63 °C
100% paraffin 3 days, change twice a day 63 °C
The embedded tissues were sliced with a microtome at 7 um, obtained slices were fixed with MQ on
Superfrost™ slides if used for general observation. In case slices were used for in situ hybridization they
were fixed on Superfrost™ Ultra Plus Adhesion slides and baked overnight at 38 °C.
Probe design Probes were created by cloning the gene of interest with primers containing overhangs of the T7 and SP6
promoter sequences. For all probes it was chosen T7 to be the sense and Sp6 to be antisense probe. The
sense T7 probe serves as a negative control, as it cannot bind to the mRNA resulting in no signal. This sense
control shows whether non-specific binding of the probe occurs. No signal in the sense control samples
indicates the antisense Sp6 probe only binds to sequence specific mRNA and thus not to binding of other
targets in the cell.
Figure 4. The process of making probe transcripts of putative gene. 1. PCR on cDNA with primers using T7 or SP6
overhangs. 2. PCR product having the T7 and SP6 promoter sequences. 3. Run-off transcripts are made with DIG labelling kit, the
antisense SP6 probe transcripts will bind to mRNA during in situ hybridization, while the sense T7 probe will thus not bind to
mRNA.
This experiment focussed on the Br-ARF3.1 gene. The cDNA of this gene was cloned from a pdonr221
plasmid created by Xiaoxue Sun in earlier stages of the research. Also reference probes were created to give
an indication whether the in situ hybridization worked or not. Reference probes should hybridize to a gene
known to be high expressed or expressed at a particular site in the cell. In total three reference probes were
created, i.e. on basis of Br-GAPDH, Br-CYP and Br-SPL15.1. These sequences were cloned directly from
cDNA of Chiifu and PC024. Primers used for cloning probes are found in Appendix table 15.

13
After cloning, the probe sequences were cut from gel and send to sequencing for confirmation of the
presence of probe sequences. Hereafter, probe transcripts with NTP labelling were created by following the
Roche DIG RNA Labelling Kit. The probe transcripts were visualized on gel, using 1 ul of probe, 8 ul mq
and 1 ul of dye, and using 4 ul of 1 kb plus ladder. Also probe concentrations were measured by nanodrop.
Hybridization In short, the first part of the hybridization starts with pre-hybridization steps, which were performed to
reduce background staining. This was followed up by the in situ hybridization, in which a labelled probe
binds to the mRNA of interest. During the post-hybridization several washing steps were performed to
remove unbound probes. After this the bound probes can be detected by an enzyme-tagged antibody,
resulting in a cytochemical reaction producing a coloured precipitate (Wilkinson 1998). The latter can be
observed under a light microscope.
During the first in situ hybridization experiment all steps were followed as described in the protocol (Saiga
et al., 2008). For the second experiment we changed the time of antibody incubation to 4 hours, so the
antibodies had more time to penetrate the dense tissue. In addition new antibody solution and dye was used.
During the last in situ hybridization several conditions were tested. First we changed the proteinase K
concentration from 0.4 ug/ml to 100 ug/ml, based on a protocol designed for meristem in situ hybridizations.
Second half of the samples were incubated with proteinase K for 20 minutes, while the other half for 40
minutes. A third condition tested was the probe concentration, for half of the samples 0.5 ul of probe was
applied while at the other samples 1.5 ul probe was applied (in 200 ul probe solution). Also the hybridization
temperature of the probe was tested, hybridizing half of the samples at 50 °C and the other half at 55 °C. In
addition at one slide a higher antibody concentration was tested, instead of 1 ul/ml antibody, 11 ul/ml
antibody was applied.
RNA quality
RNA quality was tested by applying acridine orange to the slides of interest. Acridine orange is a fluorescent
dye emitting green light when contacting DNA, and emitting red light when contacting RNA. This dye can
be applied on slides when they have been rehydrated and paraffin has been removed. This means the slides
were used immediately after the in situ experiment, or the slides were washed in xylene and subsequently
hydrated from 100% EtOH to 100% MQ by following the first steps of the pre-hybridization part in the in
situ hybridization protocol. This is necessary as paraffin is a hydrophobic compound and thus will block the
entering of acridine orange to the tissues.
Dot blot Performance of the probe can be tested with a dot blot (See appendix figure 20 for protocol). The dot plot
was performed several times. First time we performed exactly as described in the protocol. Second time we
performed it again as in the protocol, but used new dye and antibody solution. Hereafter we performed it
again, but now also using UV light (30 seconds) to crosslink the probe to the membrane.
Meristem morphology observation
A general observation was performed of the harvested embedded meristems for one time point per week per
genotype (Chiifu and PC024) during all vegetative growth stages till early heading. For this observation
longitudinal as well as transverse sections were made of the meristems. The size of the meristem as well as
the leaves surrounding were observed using a light microscope and compared between genotypes.
Leaf number counting To determine when leaves with a certain function, i.e. rosette or heading, are initiated, leaf numbers and
functions were assessed during this experiment. First, during the meristem harvest in the ISH experiment the

14
number and function of true leaves taken off were counted. In turn when observing the meristem under the
light microscope, in transverse view, the number of still intact leaves as well as leaf primordia were also
counted. These numbers were added up to the number of leaves taken off during the meristem harvest, to
gain insight of the total leaf number. In addition, the function of leaves taken of were assessed at 7.5 weeks
after sowing for 6 plants, and for one plant at 13 weeks after sowing. The number and function of leaves in
these plants were compared to the leaf number during the meristem harvests in each stage of development,
to deduce when each leaf function was developed.
EMS genotyping and phenotyping During this experiment the siblings of EMS genotypes which were identified in China for their mutant
heading phenotype, were phenotyped during the vegetative growth stages. Interesting phenotypes were in
addition genotyped for Br-ARF3.1. Three M2 lines (EMS7-EMS9) were identified by Xiaoxue Sun by a
screen for Br-ARF3.1 mutations in China, prior to this thesis, however these lines had not been phenotyped.
EMS line 7 has an insertion, EMS line 8 has a transversion of an A to T, EMS line 9 has an transversion of
a T to a G. Sister seeds of six other lines (EMS1-EMS6) had been grown for phenotyping and were selected
for a non-heading phenotype, but have not been screened for their Br-ARF3.1 gene (table 2). EMS10 had
been selfed for four times, and was also selected for its non-heading phenotype.
Table 2: Pictures of EMS M2 sister plants grown in China. The selfing round is indicated behind the line name.
Line Picture Line Picture
EMS1 M2
EMS4 M2
EMS2 M2
EMS5 M2
EMS3 M2
EMS6 M2
The 10 EMS mutant lines were grown for phenotyping during all vegetative growth stages. As phenotyping
of the heading trait is difficult in greenhouse growth conditions in Wageningen, also the leaf colour, number,
size, shape, surface structures and growth angle were assessed. This was done by comparing the EMS lines
to the A003 wild type. The leaf numbers of all plants were assessed on a weekly basis till 7.5 weeks after
sowing, for the week after (8.5 weeks after sowing) only leaves of interesting phenotypes were counted.

15
Leaf counting was stopped after this time point as it was impossible without destroying the plant in process
(due to heading). The leaf colour was assessed more accurately at one time point with a spad meter
(SPAD502), which measures chlorophyll content. This chlorophyll content is an indicator for ‘leaf
greenness’. Three measurements per plant were taken, on young expanded leaves which were around 7 to 10
cm in size. The spadmeter automatically calculated the average relative SPAD value over the three
measurements. In addition, leaves of interesting phenotypes will be sectioned to analyse the phenotype at
cellular level. After phenotyping, interesting EMS plants will be kept and selfed for seed collection.
Lines showing interesting phenotypes were in turn genotyped. Especially non-heading lines were interesting
for genotyping, in order to see if there is a mutation in Br-ARF3.1. We thus combined the Br-ARF3
genotype and phenotype of the EMS lines to deduce whether there is a relation. For genotyping, DNA of
initially all EMS plants was isolated using the RETCH1.3 protocol of Gert van Arkel and Maarten
Nijenhuis. After isolation nanodrop was performed and subsequently the DNA was diluted to 5ng/ul.
Interesting lines were chosen based on phenotype, of these lines the Br-ARF3.1 gene was genotyped by use
of High Resolution Melt (HRM) technique. This technique is based on the melting temperature of double
stranded DNA. By using this technique indications can be found for SNPs. For HRM analysis 14 primers
pairs were designed with primer3plus (see appendix table 16, figure 21), which covered the whole Br-
ARF3.1 gene. Each primer pair covered an amplicon of around 200 base pairs, an ideal length for HRM.
First by PCR the region of interest is amplified. For 1x PCR reaction the following compounds were used:
DNA 2 µl (5ng/µl)
MQ 3.5 µl
5X buffer 2 µl
DNTP 0.4 µl
Primer mix 1 µl
LC green 1 µl
Enzyme 0.1 µl
Total 10 µl + 10 µl Mineral oil
To amplify the region of interest the following PCR-programme was performed:
98 °C 30 s
98 °C 5 s 39 x
60 °C 5 s
72 °C 10 s
72 °C 60 s
94 °C 30 s
25 °C 30 s
10 °C ∞
The primer pairs were tested by using the HRM PCR programme and visualized on gel. In case only one
band was present the primer pair could be used for the eventual HRM. Hereafter the HRM process starts, in
here temperature is increased from 75 to 95 degrees. The melting temperature, i.e. the temperature in which
the DNA strands separate, is measured in real time. This can be done by using an intercalating fluorescent
dye, which only binds to double stranded DNA. When the DNA strands separate, the fluorescence of the
sample decreases and can therefore be measured. A SNP causes a change in the melting temperature, and
can thus be observed by this high resolution technique. Results were analysed by LightScanner software.
The data was first normalized against two A003 samples of one individual primer pair. Hereafter the other
samples of the same primer pair were visualized in the graph. Possible genotypic variants can be found by
observing the difference in fluorescence graph. A curve shift of 0.05 was used serving as significance value.

16
An arbitrary threshold of 0.10 Δ fluorescence was chosen to determine whether samples were interesting for
sequencing. In case the Δ fluorescence was bigger than 0.10 the sample of this line as well as the wild-type
A003 were send to sequencing for verification of the SNP. Sequencing is necessary as HRM only provides
indication a SNP might be present, but these need to be verified by sequencing.
qRT-PCR and preparations To quantify gene expression qRT-PCR was performed during each stage of development in Chiifu and
PC024. During qRT-PCR gene expression is measured in real time by using a fluorescent signal during
amplification. A Ct value for each sample is obtained, i.e. the intersection between an amplification curve
and threshold line where the fluorescent signal can be observed. A higher Ct value means that more
amplification cycles had to be performed to observe the signal. This Ct value thus correlates to the inverse of
mRNA in the sample.
On a weekly basis, young non-expanded leaves surrounding the meristem of three Chiifu and three PC024
were harvested during the meristem harvest for the ISH. After harvest the leaves were grinded in liquid
nitrogen to destroy the cell walls. RNA isolation was performed following an RNA isolation protocol using
Trizol. Hereafter the RNA concentration and quality will be measured with nanodrop and quality tested on
1.5% agarose gel. After this the RNA was made into cDNA using the iScriptTM
cDNA synthesis kit.
Subsequently the cDNA concentration was measured by nanodrop and in turn diluted to 60ng/ul, the desired
concentration for qRT-PCR.
Several primers for qRT-PCR were already present, i.e. Br-ARF3.1, Br-ARF3.2, Br-ARF4.1, Br-AXR1, Br-
KAN1.1, Br-KAN1.2, Br-KAN2.1, but some were designed by use of Primer3Plus, i.e. Br-ARF3.2, Br-
ARF4.2 and Br-KAN2.2 (appendix table 14.). Each gene per genotype had at least two biological replicates,
plus two water controls per tested gene. Br-GAPDH was used as a reference gene. First a duplicate of Br-
GAPDH including two biological controls each genotype per time point was performed in order to measure
accuracy of pipetting and see whether samples had a bad quality, i.e. a too high Ct value. In case of the
latter, the bad sample was replaced by the DNA of the third biological control for follow up plates. For 1x
qRT-PCR reaction the following compounds were used:
DNA 1.5 µl (60ng/µl)
MQ 3.4 µl
Primer mix 0.6 µl
SYBR green master mix 5 µl
Total 10 µl
The qRT-PCR programme included the following steps:
95 °C 3 min
95 °C 15 s 39 x
60 °C 60 s
95 °C 10 s
65 °C 5 s
95 °C
Data was obtained in CFX manager, result were analysed in Excel by using the 2-ΔΔCT method. In this
method first the ct value of the reference gene is extracted from the Ct value of the gene of interest for each
sample, this gives the Δ value. Hereafter I chose to normalize against the first time point of Chiifu. This was
done by extracting the Δ value of the first biological control of this Chiifu time point to its own Δ value,
returning an ΔΔ value of 0. The Δ values of all other samples and time points were also extracted from that

17
first Δ value, to give a relative ΔΔ value per sample. Lastly the negative value of ΔΔ of each sample is
squared giving the relative expression level. Standard deviations were calculated over all biological controls
per time point.

18
Results
week 2 week 3 week 4 week 5 week 6.5 week 7.5
Figure 5. Time points of harvest of Chinese cabbage (first row) and pak choi (second row) in weeks after sowing.
This thesis aimed to characterize (early events of) leaf heading in Chinese cabbage at the molecular and
morphological level. First, the morphology of shoot apical meristems and surrounding leaves was assessed
between the heading Chinese cabbage (Chiifu) and non-heading but closely related pak choi (PC024), from
seedling to early heading stage on a weekly basis (see figure 5). Plants shown in figure 5 are single
representatives of the plants chosen for meristem harvest and qRT-PCR leaf harvest. The first three weeks
after sowing both Chiifu and PC024 were in seedling stage. This can be seen as the plants have rounder
leaves, with long petioles. At 4 weeks after sowing both accessions were in rosette stage, which is
characterized in Chinese cabbage by formation of big round leaves. At 6.5 weeks after sowing Chiifu
entered the folding stage, the inner new formed leaves started folding inwards. Pak choi meristem harvest
was stopped at 6.5 weeks after sowing due to bolting. At 7.5 weeks after sowing the newest formed leaves of
Chiifu were very densely packed, i.e. starting to form a head.
Fixation, embedding and cutting of meristems Meristems were fixated in PFA and embedded in paraffin. The first embedded tissues were not embedded
well. The tissues were soft, and did not have the same density as the paraffin. When cutting the samples the
embedded tissue was just squeezed or fell out completely. Hereafter the embedding protocol was changed to
a protocol with longer ethanol, xylene and paraffin incubation steps. In addition the water bath used for the
heating steps was exchanged for an air incubator. Hereafter the embedded samples could be cut with a
microtome without problems. Several thicknesses for cutting the slices were assessed, it was found that at 7
um the slices seemed to be best. Thinner slices resulted in ripping of bigger cells, while thicker slices gave
more cell layers of the small cells, making it harder to observe.
General observation of shoot apical meristems A time-series was created of the shoot meristems of PC024 and Chiifu accessions in transverse and
longitudinal views (table 3) in order to observe how the meristem and surrounding leaves develop over time,
and how this differs between heading Chinese cabbage and non-heading pak choi. The shown slices are
single representatives of genotype/time combinations. PC024 was flowering 6.5 weeks after sowing, which
can be seen back in the meristem. At 5 weeks after sowing the development of the meristem into a

19
inflorescence meristem (which is more elongated) can be observed, with at the sides developing floral
meristems. This could also be seen in the transverse view even earlier, at week 4.
In the longitudinal sections, both Chiifu and PC024 leaves positioned immediately around the meristem
grow inwards, folding over the meristem. In Chiifu the leaves are more densely packed in the outer leaf
layers surrounding the meristem, this can already especially be seen four weeks after sowing. In pak choi
the ‘older’ leaves which are three leaf layers away from the meristem are folding less inwards than in
Chinese cabbage, where inwards curving of the leaves is observed in all leaf layers surrounding the
meristem. At 7.5 weeks after sowing the leaves in Chinese cabbage seem to have more space between them,
which could be due to the upwards growth of the stem beneath the meristem, giving more space for the
leaves to grow.
In pak choi the stem beneath the meristem is slightly more growing upwards than in Chinese cabbage at
early time points, due to the longer internodes. At the last time point, 5 weeks after sowing, it is hard to say
whether this increased internode lengths of the stem beneath the meristem is due to initiation of flowering or
is part of the natural growing process. In Chinese cabbage this upwards growth of the stem beneath the
meristem is only observed at 7.5 weeks after sowing. Earlier time points the internodes between leaves are
very short, givings a horizontal transition between stem and meristem.
In transverse sections, the Chinese cabbage leaves are shown to be more densely packed than the leaves in
pak choi. In pak choi mainly the leaf petioles are seen, while these structures in Chinese cabbage are mid
ribs of the leaf (circumfied in green in figure 6). In pak choi at the early time points very thin leaf tissues can
be seen between the petioles, originating from leaves folding over the meristem. However at 5 weeks after
sowing no leaf tissue from leaves folding over the meristem is observed anymore. This could be due to the
upwards growth of the stem beneath the meristem, resulting in leaves not being long enough to reach fully
over the meristem. In Chiifu during all stages leaf tissues can be seen between the mid veins, originating
from folding over leaves. In both accessions clearly the spiral phyllotaxis of leaf formation can be seen.
As leaves fold inwards, the abaxial side of the leaf is the side facing outwards from the meristem, while the
adaxial side is facing towards the meristem. This is visualized, for ease, in the leaf mid-veins of the earliest
time point (week 2 after sowing) in Chinese cabbage in figure 6.
Figure 6. Transverse view of Chiifu 2 weeks after sowing. Mid ribs are shown in green circumcision. Indicated in the outer
midvein is the abaxial and adaxial position th leaf will have. Scale bar represents 500 um.

20
Table 3. Meristem observation in transverse and longitudinal view. The first two rows are accession PC024, and last two rows are accession Chiifu. Meristems are depicted 2,3,4,5,6.5 and
7.5 weeks after sowing. All pictures are edited to grey-scale for ease of comparison. Scale bars represents 500 um.
Week 2 Week 3 Week 4 Week 5 Week 6.5 Week 7.5
Pc
Pc
Cc
Cc

21
The size of the meristems was also measured. The meristem of Chinese cabbage seems to increase slightly
in size over time (table 4.). At two weeks after sowing the meristem is around 120 um, while at 7.5 weeks
after sowing it is slightly larger than 200 um. However it must be noted these plants are single
representatives, and also the position of the sample during the cutting could possibly influence the observed
size.
Table 4. Longitudinal view of Chinese cabbage meristems in weeks after sowing. Scale bars represent 200 um.
2 weeks 3 weeks 4 weeks
5 weeks 6.5 weeks 7.5 weeks
Leaf counting
The next part of the experiment aimed to deduce at which time point leaves with certain function when fully
grown, e.g. rosette, folding or heading, were initiated. During meristem harvest, the leaves removed to
obtain the meristem were counted for both PC024 and Chiifu. For Chiifu, at 7.5 weeks after harvest also the
function, e.g. rosette or pre-heading, of each leaf which was removed was determined. This was not
necessary for pak choi as it is non-heading, and thus every true leaf after seedling stage is a rosette leaf. The
remaining meristem was fixed and embedded and transverse sections were observed microscopically to
count the number of remaining leaves and leaf primordia. For instance, in Figure 6 (Chiifu 2 weeks after
sowing) 11 leaves were counted.
The number of leaves removed during harvest and number observed under the microscope were added up, in
order to obtain the total leaf number at each assessed time point. As also the leaf functions were recorded, it
can be deduced at which time leaves were formed that will gain certain functions. Results for Chiifu are
shown in figure 7A. For pak choi only the earliest two time points include the total leaf numbers (figure
7B). The two later time points only show the number of leaves removed during harvest. This as the
meristem formed into a inflorescence meristem which made leaf counting not accurate, as what is seen are
flowering meristems and not true leaf primordia.
Leaf numbers increase slowly until 3 weeks after sowing, but there after numbers increase more rapid,
which possibly is due to re-potting of plants at the this time point. In Chiifu pre-heading leaves start to form

22
around 4 weeks after sowing. Between 5 and 6.5 weeks after sowing leaf primordia will most probable
develop into heading leaves.
Figure 7A-B. Leaf number and leaf function characterization. A: Chinese cabbage Chiifu, leaf numbers are the total of leaves
counted under the microscope and removed during harvest B: Accession PC024, leaf numbers are separated between counted
under the microscope (in red) and removed during harvest (pink and blue). From week four on, the meristem had changed in an
inflorescence meristem, so leaves could not be counted anymore.
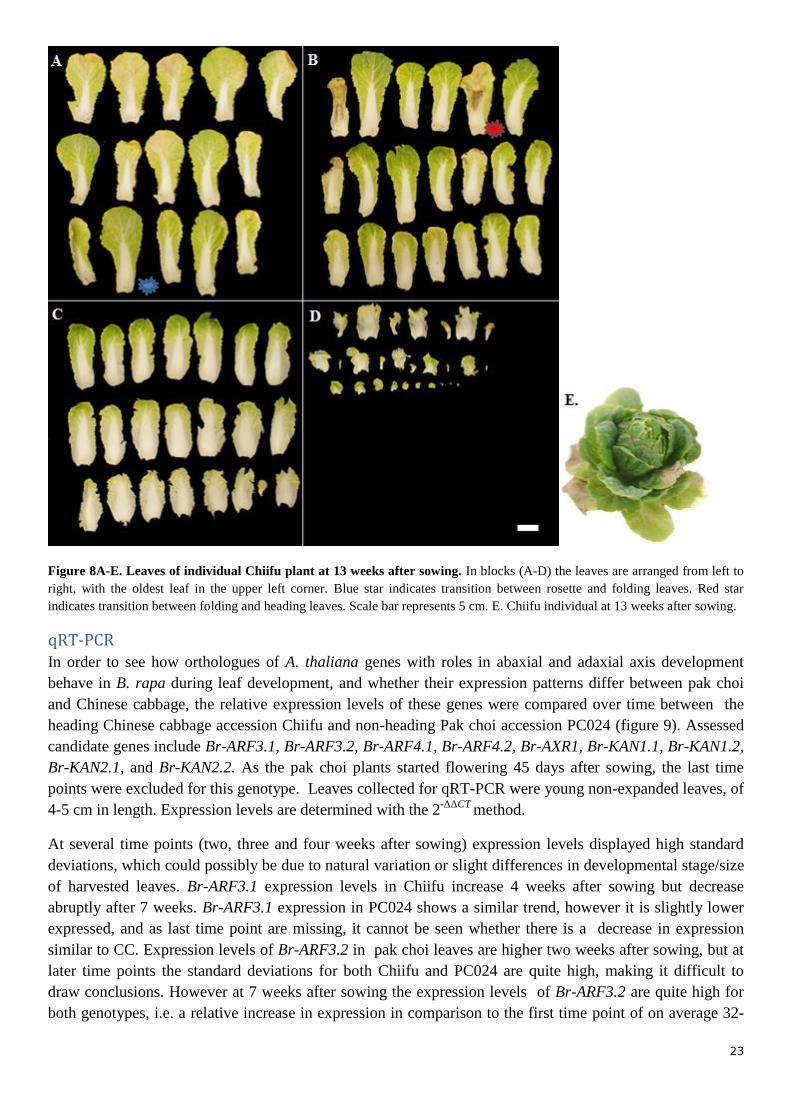
At a later time point, 13 weeks after sowing, again the leaves were counted and functions assessed of a
single Chiifu plant (figure 8E), to check whether this corresponds with the previous leaf function numbers.
All leaves of this plant were photographed (figure 8A-D). In this plant mant rosette leaves were already gone
(senescened, fallen off) and only ~12 rosette leaves remained, 8-10 pre-heading leaves and 50-52 heading
leaves were counted, excluding counting of side shoots which were found between the heading leaves. Even
though a lot of rosette leaves already fell off at 13 weeks after sowing, the function and number of leaves
was in line with counts at 7.5 weeks after sowing, i.e. on average 32 rosette, 8 pre-heading and 10 heading
leaves (measured over 6 plants).
0
20
40
60
80
2 3 4 5 6.5 7.5
Leaf
nu
mb
ers
Weeks after sowing
7A.
Heading
Pre-heading
Rosette
Seedling
0
2
4
6
8
10
12
14
16
2 3 4 5
Leaf
nu
mb
ers
Weeks after sowing
7B.
Rosette microscope
Rosette
Seedling
23
Figure 8A-E. Leaves of individual Chiifu plant at 13 weeks after sowing. In blocks (A-D) the leaves are arranged from left to
right, with the oldest leaf in the upper left corner. Blue star indicates transition between rosette and folding leaves. Red star
indicates transition between folding and heading leaves. Scale bar represents 5 cm. E. Chiifu individual at 13 weeks after sowing.
qRT-PCR In order to see how orthologues of A. thaliana genes with roles in abaxial and adaxial axis development
behave in B. rapa during leaf development, and whether their expression patterns differ between pak choi
and Chinese cabbage, the relative expression levels of these genes were compared over time between the
heading Chinese cabbage accession Chiifu and non-heading Pak choi accession PC024 (figure 9). Assessed
candidate genes include Br-ARF3.1, Br-ARF3.2, Br-ARF4.1, Br-ARF4.2, Br-AXR1, Br-KAN1.1, Br-KAN1.2,
Br-KAN2.1, and Br-KAN2.2. As the pak choi plants started flowering 45 days after sowing, the last time
points were excluded for this genotype. Leaves collected for qRT-PCR were young non-expanded leaves, of
4-5 cm in length. Expression levels are determined with the 2-ΔΔCT
method.
At several time points (two, three and four weeks after sowing) expression levels displayed high standard
deviations, which could possibly be due to natural variation or slight differences in developmental stage/size
of harvested leaves. Br-ARF3.1 expression levels in Chiifu increase 4 weeks after sowing but decrease
abruptly after 7 weeks. Br-ARF3.1 expression in PC024 shows a similar trend, however it is slightly lower
expressed, and as last time point are missing, it cannot be seen whether there is a decrease in expression
similar to CC. Expression levels of Br-ARF3.2 in pak choi leaves are higher two weeks after sowing, but at
later time points the standard deviations for both Chiifu and PC024 are quite high, making it difficult to
draw conclusions. However at 7 weeks after sowing the expression levels of Br-ARF3.2 are quite high for
both genotypes, i.e. a relative increase in expression in comparison to the first time point of on average 32-

24
fold for Chiifu and on average 37-fold for PC024. Again after the latter time point the expression levels
decrease drastically for Chiifu.
Expression levels (in fold change) of Br-ARF4.1 are less variable over time in central leaves of PC and CC,
however from week 3.5 slightly higher in Chiifu leaves. For this genotype a slight increase can be seen over
time, with again a decrease after 7 weeks. For PC024 there is a decrease in gene expression after 2 weeks,
however with a high standard deviation. After this time point the expression level increases and remains
stable. The expression levels of Br-ARF4.2 in Chiifu leavesfirst increases but after 3 weeks decrease and
remain stable there after. The expression of Br-ARF4.2 in PC024 leaves starts higher but decreases and
again increases, remaining higher than in Chiifu leaves.
For Br-AXR1 the expression levels of Chiifu and PC024 are very close, also as standard deviations are quite
high for the second two time points no difference can be observed between the two accessions. Also
expression levels of Br-KAN1.1 and Br-KAN1.2 in leaves were assessed. There is a similar trend per
genotype between Br-KAN1.1 and Br-KAN1.2. PC024 slightly decreases and 3 weeks steadily increases. It
can be seen that although Br-KAN1.1 and Br-KAN1.2 follow the same trend, the expression is slightly Br-
KAN1.1. The expression in Chiifu decreases slightly more than in PC024 and increases again in a more steep
way. After 5 weeks it slowly decreases again. Between Br-KAN1.1 and Br-KAN1.2 no big difference can be
seen for Chiifu. Lastly Br-KAN2.1 and Br-KAN2.2 were assessed. Here expression levels are very close to
each other, not showing big variation within the genotypes, and only very slight variation between
genotypes.
Based on the expression levels of Br-ARF3.1, time points of Chiifu and PC024 were chosen for the further
parts of the experiment
0.1
1
10
1.5 3.5 5.5 7.5
REL
ATI
VE
EXP
RES
SIO
N L
EVEL
WEEKS AFTER SOWING
A.
0.1
1
10
100
1.5 3.5 5.5 7.5
REL
ATI
VE
EXP
RES
SIO
N L
EVEL
WEEKS AFTER SOWING
B.
0.1
1
10
100
1.5 3.5 5.5 7.5
REL
ATI
VE
EXP
RES
SIO
N L
EVEL
WEEKS AFTER SOWING
C.
0.1
1
10
100
1.5 3.5 5.5 7.5
REL
ATI
VE
EXP
RES
SIO
N L
EVEL
WEEKS AFTER SOWING
D.

25
In situ hybridization: Probe design In order to perform an in situ hybridization first probes have to de created which detect our gene of interest.
It was chosen to first focus on creating a probe for one of the candidate heading genes; Br-ARF3.1. In
addition a reference probe was created to visualize Br-GAPDH, a gene which is known to be highly
expressed in leaf cells. Later also reference probes were created based on Br-CYP and Br-SPL15.1. The
latter was based on literature. Probe templates were first succesfully sequenced for confirmation of SP6 and
T7 promoter presence. Hereafter the transcripts where created which were visualized on gel to show their
presence (see figure 10). The size of the probe transcripts of the Br-ARF3.1 probe are 257 bp, while the
exact size of Br-GAPDH is not known but thought to be around 200 bp. Br-CYP probes were 187 bp in size
and Br-SPL15.1 was the largest with 452 bp. Most shiny bands are the probe transcripts, while the upper
bands are most probable either dimerizations of the probe or presence of template DNA. As transcripts are
single stranded they run easier through a gel and thus travel further than the expected height indicated by the
0.1
1
10
1.5 3.5 5.5 7.5
REL
ATI
VE
EXP
RES
SIO
N L
EVEL
WEEKS AFTER SOWING
E.
0.01
0.1
1
10
1.5 3.5 5.5 7.5
REL
ATI
VE
EXP
RES
SIO
N L
EVEL
WEEKS AFTER SOWING
F.
0.01
0.1
1
1.5 3.5 5.5 7.5 9.5
REL
ATI
VE
EXP
RES
SIO
N L
EVEL
WEEKS AFTER SOWING
G.
0.1
1
10
1.5 3.5 5.5 7.5
REL
ATI
VE
EXP
RES
SIO
N L
EVEL
WEEKS AFTER SOWING
H.
0.1
1
10
1.5 3.5 5.5 7.5
REL
ATI
VE
EXP
RES
SIO
N L
EVEL
WEEKS AFTER SOWING
I. Figure 9 A-G. qRT-PCR results of several candidate
genes on inner leaves of Chiifu (blue) and Pak choi
(red). Y-axis shows fold difference. Standard deviations
are visualized. With: A. Br-ARF3.1, B. Br-ARF3.2, C.
Br-ARF4.1, D. Br-ARF4.2, E. Br-AXR1. F. Br-KAN1.1
G. Br-KAN1.2 H. Br-KAN2.1 I. Br-KAN2.2

26
marker. For the Br-CYP probe, bands are visible below the probe transcripts, these are probably remainders
from the template.
Figure 10. Presence of probes on gel. M indicated the 1kb plus marker. With 1. Br-ARF3.1 CC T7, 2. Br-ARF3.1 PC T7, 3.
Br-ARF3.1 CC SP6, 4. Br-ARF3.1 PC SP6, 5. Br-GAPDH CC T7, 6. Br-GAPDH PC T7, 7. Br-GAPDH CC SP6, 8. Br-
GAPDH PC SP6, 9. Br-CYP CC T7, 10. Br-CYP PC T7, 11. Br-CYP CC SP6, 12. Br-CYP PC SP6, 13. Br-SPL15.1 CC T7, 14.
Br-SPL15.1 PC T7, 15. Br-SPL15.1 CC SP6, 16. Br-SPL15.1 PC SP6.
In addition probes were tested by a dot blot. During this dot blot test the probes are applied to a membrane
and treated with antibodies and dye, by using the same buffers as in the in situ hybridization. We would
expect a dark blue dot around the spot the probe was applied to. The dot blot was performed several times,
including using new antibodies and dye and using uv light to crosslink the probe to the membrane (see
figure 11A-B). However, no signal was observed in any of the performed dot blots. In this dot blot test also
a positive probe control was included, provided by the company, which also gave no signal.
First in situ hybridization To visualize the temporal and spatial expression of our candidate genes we performed in situ hybridizations
on meristems of PC024 and Chiifu. During the first in situ hybridization we analysed the Br-ARF3.1 gene at
three different time points of only Chiifu (2, 4 and 6.5 weeks after sowing) based on the qRT-PCR
Figure 11A-B. Dot blot with
new antibody and dye
solution. With 1. Br-ARF3.1
probe, 2. Br-CYP probe, 3.
Br-GAPDH probe, 4. Positive
control provided by
company, 5.Water control. A.
Not crosslinked with UV light.
For Br-ARF3.1 and Br-CYP
probe only the SP6 of PC are
B. Crosslinked with UV light

27
expression results. It was chosen to only do samples of Chinese cabbage in order to see whether the system
works. Slices were made transverse in order to get a clear view of adaxial and abaxial patterning of the gene.
We would expect to see the signal in a gradient decreasing from abaxial to adaxial, as highest Br-ARF3.1
transcript abundance is to the abaxial side of the leaf in Arabidopsis thaliana.
Slides treated with the antisense SP6 probe should show signal in case of expression, while the sense T7
probe should give no signal (table 5). There was an obvious difference between the slides hybridized with
T7 and SP6 probes at the last time point (6.5 weeks after sowing). Blue spots are observed in the slides
treated with the SP6 probe at week 6.5, when high expression is expected. The blue dots could be due to
nuclear signal. The dots are not visible in all cells, however it is possible the nucleus is just not visible in the
other cells. The dots seem quite large, sometimes overlapping multiple cells, making it unlikely these are
true signals located in the nuclei. In addition there is a blue precipitate at the corners of the cell (see table
5B), which is an indication of background signal. At the earlier time points no difference has been observed
between T7 and SP6 hybridized slides (see Appendix table 17). No signal was observed for the positive
control probe, for Br-GAPDH, a gene highly expressed in cells.
Table 5 A-B. Chiifu meristem (6 weeks after sowing) in transverse view of first in situ hybridization, with sense T7 and
anti-sense SP6 treated slides. A. Scale bar represents 200 um. B. Scale bar represents 100 um.
A B
T7
SP6
To see whether the RNA was still present, one sample (Chiifu week 4), was tested. This was tested with
acridine orange, a selective fluorescent dye which emits green light when binding to DNA and red light
when binding to RNA. As can be seen in figure 12, the RNA of the sample is still present.

28
Figure 12. RNA presence of Chiifu (5 weeks after sowing) meristem slice, used during the in situ hybridization experiment.
Second in situ hybridization
As the first in situ hybridization was not successful, the protocol was changed at few steps. For the second in
situ hybridization we used longitudinal sections instead of transverse sections, in order to better visualize the
leaves. when looking at transverse slides, we mainly see the mid ribs, while the true leaves are hard to
observe. Less slices were put on each slide, in order to have more similar pictures between slides. This
makes it easier to compare between SP6 and the negative control T7 slides. A big change in comparison to
the previous in situ experiment was that the antibody incubation time was changed from 1 to 4 hours, so the
antibody solution had more time to penetrate the dense tissue. In addition new antibody solution and dye
was used and a new reference probe was created, based on the Br-CYP gene, as the previous reference (Br-
GAPDH) gave no result. Two time points were chosen, i.e. 5 weeks and 6.5 weeks after sowing, as here high
expression was expected for Br-ARF3.1 in comparison to other time-points. For the 5 week time point both
Chiifu and PC024 were assessed. Unfortunately, again no difference was observed between SP6 and T7
probes for either the Br-ARF3.1 treated and Br-CYP treated slides (table 6).
Table 6 A-D. Longitudonal meristems hybridized with with antisense SP6 probe (lower row) and sense T7 probes (upper
row) for Br-CYP and Br-ARF3.1 genes: . A. Chiifu, 6.5 weeks after sowing reference Br-CYP B. Chiifu. 6.5 weeks after
sowing, Br-ARF3.1 C. PC024, 6.5 weeks after sowing, Br-ARF3.1 D. Chiifu, 5 weeks after sowing, Br-ARF3.1
A B C D
T7
SP6
As no signal was observed in the slides treated with the antisense SP6 probes, it was decided to again test
the RNA presence. This time all samples used during the experiment were tested, instead of only one (table

29
7). It can be seen that mainly green signal is present, this being even low at the bottom of the samples. Red
can slightly be observed at the edges of the tissues, e.g. outer leaf layers. This suggests that DNA is mainly
intact, however RNA most probable has been degraded.
Table 7. RNA presence test. Same meristems slides that were used during second in situ hybridization. Top pictures visualize the
meristem, while the bottom pictures show the outer layers of the sample.
Chiifu 5 weeks PC024 5 weeks Chiifu 6.5 weeks
RNA presence validation As the RNA presence of the last in situ hybridization did not seem well, it was questionable whether this
was due to RNAse contamination during the experiment or during earlier steps, e.g. embedding or fixation.
Therefore several samples of different embedding rounds were tested (table 8). Overall the signal seems red,
indicating RNA is still intact/present. Still some green can be observed in some parts of the tissues,
whicheither indicates RNA degradation, but it is also possible the dye has not fully reached the tissue. Also
in PC 3 weeks, a green glow can be seen; here is still an excess of dye on the sample, however a red signal
can be seen behind the green glow. The slices of the sample CC 6.5 weeks, were from the same sample as
used during the second in situ hybridization. The RNA quality of this slice is better than seen after the
second in situ (table 7).
Table 8. RNA presence test of several samples of different embedding rounds. Accession, time point (weeks after sowing).
PC 2.5 weeks PC 2.5weeks CC 4 weeks CC 4 weeks
PC024 3 weeks PC 3 weeks CC 5 weeks CC 5 weeks

30
PC 5 weeks PC 5 weeks CC 6.5 weeks CC 6.5 weeks (
Third in situ hybridization For the third in situ hybridization a new reference probe was created based on literature, i.e. Br-SPL15.1. We
decided to only test this probe, to get an indication whether our system works. The probe is slightly different
than in literature as they did not give the exact primers but only the position, i.e. positions of 282-767 bp on
the Br-SPL15.1 gene. Our probe contains the positions of 339 – 771 bp.
In addition during the experiment several conditions were tested, i.e. proteinase K concentration and
incubation time, probe concentration, probe hybridization temperature and one sample was treated with
higher antibody concentration. All samples were treated with a 250x higher proteinase K concentration,
based on a protocol which focussed on shoot meristem in situ hybridizatiom. Three time points were chosen,
one of Chiifu 5 weeks after sowing, as here the RNA is present (see table 8), but also new sown samples of
one week old (Chiifu) and two weeks old (PC024). This was done for two reasons, first these new samples
were embedded in one time, without a stop at 70% EtOH, while other samples have been in 70% EtOH for a
longer time. In addition, we tested a new reference gene, which is known to increase expression over time.
By using very young samples we wanted to see whether expression is still observable at very early stages.
Unfortunately, after proteinase K treatment a lot of slices started to loosen from the slides during the
washing steps and were floating in the washing solutions. it was hard to see whether remaining slices were
still there, as they were very lightly coloured. Still, the experiment was continued, but two important T7 anti
sense control slides (both containing meristems at time point 5 weeks after sowing) were empty at the end of
the experiment.
Results of slides treated with sense SP6 probes, of Chiifu (5 weeks after sowing) are shown in Appendix
table 18. For many slides several slices were lost, however still some slices remained. The meristems of the
two early time points (1 and 2 weeks after sowing), were more often (partially) lost than the other samples.
From the results no consistent trend can be observed. It seems that the cell structure of the samples are less
good visible in comparison to the results of the earlier two experiments, where still cell structure could be
easily observed (table 5 and 6). In all shown samples in Appendix table 18., except one (A, 40 proteinase K),
small dark dots can be observed, which are strongest visible on one of the slides which was treated for 40
minutes with proteinase k, treated with 0.5 ul probe and hybridized at 55 degrees (table 9, SP6 anti-sense).
One slide with one week old Chiifu meristems treated with sense T7 probe was still present. This slide was
treated with proteinase k for 40 minutes, 0.5 ul probe and hybridized at 55 degrees. These conditions are the
same as the antisense SP6 slide (Chiifu, 5 weeks after sowing) in which the dots are strongest visible.
31
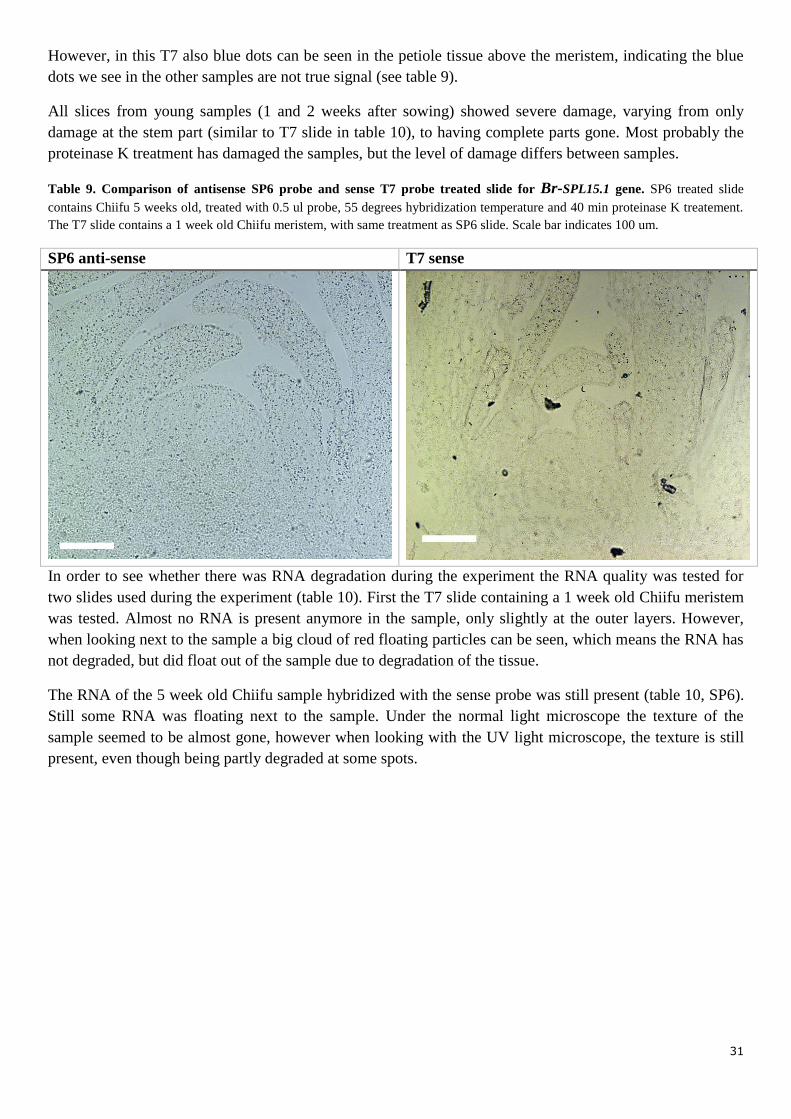
However, in this T7 also blue dots can be seen in the petiole tissue above the meristem, indicating the blue
dots we see in the other samples are not true signal (see table 9).
All slices from young samples (1 and 2 weeks after sowing) showed severe damage, varying from only
damage at the stem part (similar to T7 slide in table 10), to having complete parts gone. Most probably the
proteinase K treatment has damaged the samples, but the level of damage differs between samples.
Table 9. Comparison of antisense SP6 probe and sense T7 probe treated slide for Br-SPL15.1 gene. SP6 treated slide
contains Chiifu 5 weeks old, treated with 0.5 ul probe, 55 degrees hybridization temperature and 40 min proteinase K treatement.
The T7 slide contains a 1 week old Chiifu meristem, with same treatment as SP6 slide. Scale bar indicates 100 um.
SP6 anti-sense T7 sense
In order to see whether there was RNA degradation during the experiment the RNA quality was tested for
two slides used during the experiment (table 10). First the T7 slide containing a 1 week old Chiifu meristem
was tested. Almost no RNA is present anymore in the sample, only slightly at the outer layers. However,
when looking next to the sample a big cloud of red floating particles can be seen, which means the RNA has
not degraded, but did float out of the sample due to degradation of the tissue.
The RNA of the 5 week old Chiifu sample hybridized with the sense probe was still present (table 10, SP6).
Still some RNA was floating next to the sample. Under the normal light microscope the texture of the
sample seemed to be almost gone, however when looking with the UV light microscope, the texture is still
present, even though being partly degraded at some spots.

32
Table 10. RNA quality of antisense T7 probe (Chiifu 1 week after sowing) and sense SP6 probe (Chiifu 5 weeks after
sowing) treated samples, 10x magnification. A: meristem. B: RNA floating next to the sample.
A B
antisense
sense

33
EMS phenotyping During this experiment siblings of EMS genotypes that were identified in China for their mutant heading
phenotypes or for mutations in Br-ARF3.1 were grown for phenotyping during their vegetative growth
stages and subsequently genotyping of the Br-ARF3.1 gene.
For six M2 lines (EMS1-EMS6) and one M4 line (EMS10) sister seeds have been grown and identified for
their mutant non-heading phenotypes in China (Boading) growing conditions (in the field). Three M2 lines
(EMS7-9) were identified in China by XiaoXue Sun in a screen for mutations in the ARF3.1 gene. The EMS
lines and several A003 wild type plants were grown for comparison. Within the M2 lines segregation is
expected, with a non-heading segregation of 1:4. This because the selection on phenotype happened in sister
seeds of the same generation. We expect also segregation of other traits, because these lines were selfed for
only two times, and thus still a lot of regions in the genome are segregating resulting in heterozygous alleles
which do not show a mutant phenotype (only present if the mutant allele is homozygote).
As it is difficult to phenotype the heading trait in our greenhouse growth conditions in Wageningen, also
other traits such as leaf angle, surface and colour were assessed. First characteristics observed in several
lines will be described, hereafter individual lines showing interesting phenotypes are described in more
detail, with a complementing table showing the phenotype in time (table 13). Leaf numbers were counted
from 3 to 8.5 weeks after sowing, hereafter non-destructive leaf counting was impossible due to head
formation. In figure x the leaf numbers of individual interesting plants, selected on aberrant leaf formation,
are shown.
Table 11. Germination rate of EMS lines. Selfing round is indicated behind line name.
Line Seeds sown Germination rate Line Seeds sown Germination rate
EMS1 M2 8 75 % EMS7 M2 15 100%
EMS2 M2 9 100% EMS8 M2 10 100%
EMS3 M2 14 100% EMS9 M2 7 100%
EMS4 M2 8 87.5% EMS10 M4 7 85.7%
EMS5 M2 8 87.5 – 100% A003 WT 10 100%
EMS6 M2 15 93.3%
The germination rate of the EMS lines was high, for
several lines even 100% (see table 11). Between
plants of different lines several morphological
differences were observed. In general, two weeks
after germination, around 12% of all plants had one
big true leave, while the next leaf in opposit position
was smaller and had a more bulged surface. This
could be due to the EMS treatment, as this was not
observed in the wild-type. However in following
weeks the new growin leaves were the same as in
A003. Also at 3 weeks after sowing, the phyllotaxis
of the first 4-6 leaves in several plants seemed to be
horizontal way, i.e. the leave were positioned
opposite each other at 180 degree (see table 12, WT and EMS5.5 3 weeks after sowing). However in
following weeks these differences disappeared and the leaves were growing in the common spiral pattern.
Most plants were in rosette stage at 4 weeks after sowing, in folding stage around 7.5 weeks after sowing
Figure 13. Double lobed leaf observed in A003 wild type. 3
weeks after sowing.
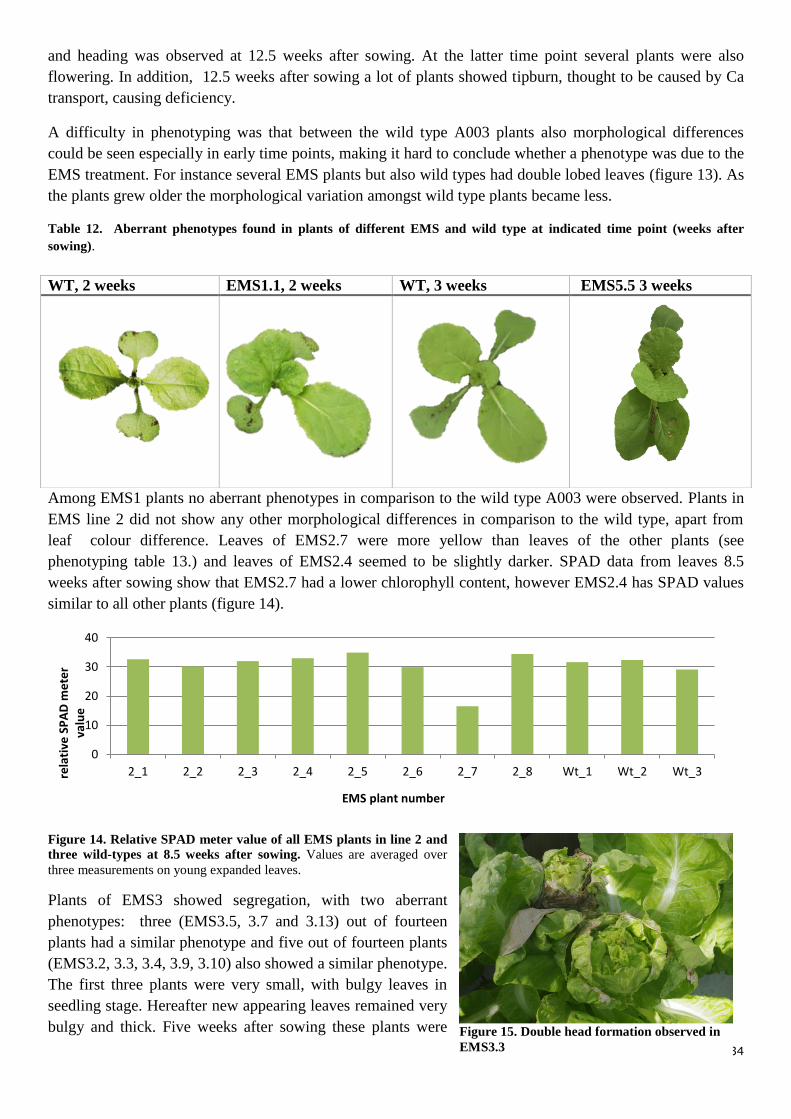
34
and heading was observed at 12.5 weeks after sowing. At the latter time point several plants were also
flowering. In addition, 12.5 weeks after sowing a lot of plants showed tipburn, thought to be caused by Ca
transport, causing deficiency.
A difficulty in phenotyping was that between the wild type A003 plants also morphological differences
could be seen especially in early time points, making it hard to conclude whether a phenotype was due to the
EMS treatment. For instance several EMS plants but also wild types had double lobed leaves (figure 13). As
the plants grew older the morphological variation amongst wild type plants became less.
Table 12. Aberrant phenotypes found in plants of different EMS and wild type at indicated time point (weeks after
sowing).
Among EMS1 plants no aberrant phenotypes in comparison to the wild type A003 were observed. Plants in
EMS line 2 did not show any other morphological differences in comparison to the wild type, apart from
leaf colour difference. Leaves of EMS2.7 were more yellow than leaves of the other plants (see
phenotyping table 13.) and leaves of EMS2.4 seemed to be slightly darker. SPAD data from leaves 8.5
weeks after sowing show that EMS2.7 had a lower chlorophyll content, however EMS2.4 has SPAD values
similar to all other plants (figure 14).
Figure 14. Relative SPAD meter value of all EMS plants in line 2 and
three wild-types at 8.5 weeks after sowing. Values are averaged over
three measurements on young expanded leaves.
Plants of EMS3 showed segregation, with two aberrant
phenotypes: three (EMS3.5, 3.7 and 3.13) out of fourteen
plants had a similar phenotype and five out of fourteen plants
(EMS3.2, 3.3, 3.4, 3.9, 3.10) also showed a similar phenotype.
The first three plants were very small, with bulgy leaves in
seedling stage. Hereafter new appearing leaves remained very
bulgy and thick. Five weeks after sowing these plants were
0
10
20
30
40
2_1 2_2 2_3 2_4 2_5 2_6 2_7 2_8 Wt_1 Wt_2 Wt_3rela
tive
SP
AD
me
ter
valu
e
EMS plant number
WT, 2 weeks EMS1.1, 2 weeks WT, 3 weeks EMS5.5 3 weeks
Figure 15. Double head formation observed in
EMS3.3
35
already pre-heading having upwards growing leaves, while other plants were still in rosette stage. At 7.5
weeks after sowing these plants started heading. The heads were very small and leaves remained thick and
bulgy. Leaf numbers in these three plants were lower than in the wild type (figure 16).
The other five plants had in general more oval shaped leaves with wider mid-veins. One plant, EMS3.2, had
pak-choi like features already visible in seedling stage, i.e. having elongated petioles and more narrow and
oval leaves. Already after 4 weeks, the leaves were growing more upwards. 6 weeks after sowing 4 more
plants showed this similar phenotype, while in earlier weeks these plants showed normal phenotype. The
phenotype however was less strong than that of the EMS3.2 individual. The plants had oval shaped leaves,
with leaf margins curve inwards, however the leaf angle was smaller. One of these plants (EMS3.3) in
addition formed two meristems, which was only observed at 6 weeks after sowing. Due to the double
meristems two heads were formed (figure 15).
The phenotypes of EMS4 plants were not different from wild-type, except for one plant, i.e. EMS4.1. At 3
weeks after sowing this plants had extremely outwards curving rosette leaves. One week later the outer
rosette leaves still were outwards curving, while new emerging leaves were curving similar to the wildtype.
At 7.5 weeks after sowing the leaves started to have a more bulged surface and were more narrow. Hereafter
the plant started pre-heading. Leaves were still bulged compared to the wild type, especially visible in the
younger leaves. At week 12.5 this plant was flowering.
Four EMS5 plants showed an aberrant phenotype in comparison to the wild type A003. For EMS5.3 rosette
leaves had a low leaf angle 4 weeks after sowing. The leaves were also thinner and had a very smooth
surface without bulging, the leaf angle was small. At later weeks the leaves were more round shaped, and
remained having a smooth surface with low leaf angle. At 12.5 weeks after sowing no head-formation was
observed, outer leaves were curving inwards (still having a smooth surface) but the young leaves did not
show signs of inwards curving. At the last time point EMS5.3 started flowering. Another plant, EMS5.4, had
at 4 weeks after sowing more narrow leaves with a bigger leaf angle than the wt. A week later more bulges
in the young leaves appeared. At 6 weeks after sowing this plant was pre-heading, and one week later started
heading. New formed leaves remained to be bulgy while the rosette leaves were similar to the wild-type.
During all time points EMS5.4 was a lot smaller than the wild-type, and had also lower leaf numbers (figure
16). EMS5.8 was a lot smaller than the wild-type at early time-points. At 5 weeks after sowing this plant had
thinner leaves, and thinner mid-veins. In addition the apex of young leaves seemed to be more serrate than
in the wild type. This serrated apex became stronger visible at later weeks, e.g. 7.5 weeks after sowing.
EMS5.7 had similar phenotype to EMS5.8. At 12.5 weeks EMS5.8 was still relatively small, and did not
form a head. The serrate apex was no longer visible, as all young leaves showed tipburn. Pre-heading and
rosette leaves were wrinkly between the veins.
In EMS 6 two plants showed aberrant phenotype, EMS6.14 had an aberrant phenotype during the earlier
time points, while EMS6.5 only showed a difference at heading stage. The outer leaves of EMS6.14 were
more curving outwards at rosette stage. At 5 weeks after sowing the new formed leaves did not show
outwards curving, however the growth angle of the leaves was larger At 6 weeks after sowing the edges of
the pre-heading leaves became more yellow and these leaves were more bulgy. At this time point EMS6.14
was pre-heading. Hereafter the leaves became even more bulgy with some having tipburn. At 12.5 weeks
after sowing a very loose head was formed, however a lot of leaves had brown spots at the edges, indicating
disease. One other plant, EMS6.5, showed to be similar to the wild-type during all early growth stages,
however at 12.5 weeks after sowing a very big head was observed. This head was more compact than the
wild type, possibly due to high leaf numbers within the head.

36
Plants of EMS lines 7, 8 and 9, identified for their ARF3.1 mutation, did not show aberrant phenotypes in
comparison to the wild type.
EMS10 was an interesting line as it was supposedly non-heading and had been selfed for 4 times. From the
six germinated plants, two died at seedling stage. In the four other plants a segregation could be observed,
two plants (EMS10.1 and 10.2) were overall smaller and the expanded leaves had a more yellow/brownish
surface, especially at the corners of the leaf. This could possibly be due to disease. EMS10.1 in figure 16,
representing both plants, is shown to have less leaves during all counted time points. The other two plants
(EMS10.4 and 10.5) showed a normal colour in comparison to the wild-type and at early stages were even
bigger than the wild-type. During rosette stage the leaves of the EMS10 plants were more flat and had a
smaller leaf angle than the leaves of A003. At 8.5 weeks after sowing, the leaves remained flat but the leaf
angle increased, still this leaf angle was less than in the wild-type. At 12.5 weeks after sowing head
formation could be observed in all four plants, which was against our expectations. The leaf numbers of
EMS10.4, representing both EMS10.4 and EMS10.5, were slightly higher for the first 7.5 weeks after
sowing, however after it was similar to the wild type (figure 16).
Figure 16. Number of leaves for several individual EMS plants and two A003s. Leaf numbers are individual plant numbers
counted, not averaged over lines.
Table 13. Pictures of EMS individuals with interesting phenotypes through all vegetative growth stages
0
5
10
15
20
25
30
35
40
45
50
3 4 5 6 7.5 8.5
Leaf
nu
mb
er
Weeks after sowing
2_7 3_2
3_3 3_5
3_7 3_13
4_1 5_3
5_4 6_14
10_1 10_4
A003_1 A003_2

37
Week 2 Week 3 Week 4 Week 5 Week 6 Week 7.5 Week 8.5 Week 12.5
A003
EMS 2.7
EMS 3.2
EMS 3.3
EMS3.7

38
Week 2 Week 3 Week 4 Week 5 Week 6 Week 7.5 Week 8.5 Week 12.5
A003
EMS 4.1
EMS 5.3
EMS 5.4
EMS 5.8

39
Week 2 Week 3 Week 4 Week 5 Week 6 Week 7.5 Week 8.5 Week 12.5
A003
EMS 6.5
EMS 6.14
EMS 10.2
EMS 10.4

40
EMS genotyping For genotyping, EMS plants with an interesting phenotype were screened for mutations in Br-ARF3.1 by
using HRM. First 14 primer pairs which covered the whole Br-ARF3.1 gene were designed. The primers
were tested on gel, and in case only 1 band was present the primers were used for further HRM analysis.
Figure 17. Primers genotyping Br-ARF3.1 with HRM on gel, with DNA of A003. M indicates 1kb plus marker.
From the gel, primer pair 3, 7 and 12 were excluded for further HRM analysis (figure 17). Pair 2 shows also
multiple bands, however it was discovered there was an accidental primer swap. Therefore it was chosen to
include primer pair 2 in the analysis. In total 14 EMS plants with interesting phenotype were chosen for
analysis, i.e. EMS3.2, 3.3, 3.5, 3.7, 3.13, 4.1 ,5.3, 5.4, 5.8, 6.5, 6.14, 10.1, 10.4, 10.5 and two A003 wild
types as controls.
In the HRM fluorescence curves no obvious differences between the plants were observed (see Appendix
table 19). The curves were all following the same trend with a maximal difference in fluorescence of 0.1,
which gives no indication of presence of mutations between plants. Small differences can be observed, for
instance the second primer pair shown in figure 18, showed one EMS plant (EMS3.5, in green) to have a
slightly larger difference in fluorescence, also the first primer pair shows a slight difference (EMS3.5 and
EMS3.13 are visualised in the lower two curves, respectively in blue and brown).
To see whether such a small difference could be due to a mutation or might have another cause, e.g.
concentration difference, the part of the ARF3.1 gene uncaptured by the second primer pair in EMS3.5
(brown lowest curve) and A003 was cloned and send to sequencing. Also EMS3.13 was send to sequencing,
as in overlapping sequence (enclosed by primer pair 1), this plant clustered together with EMS3.5.
Sequencing results are shown in appendix figure 22. It can be seen there are no differences between A003,
EMS3.5 and EMS3.13, for this region. Unfortunately the reverse primer did not give result, so the region
enclosed by the first primer pair was not fully sequenced. Outliers in other graphs were often also EMS3.5
and/or EMS313, indicating these differences in curves is due to slight concentration differences.
Figure 18. Difference in fluorescence curves for primer pair 1 (left) and primer pair 2 (right) in EMS3.2, 3.3, 3.5, 3.7, 3.13,
4.1 ,5.3, 5.4, 5.8, 6.5, 6.14, 10.1, 10.4, 10.5 and two A003. For the first primer pair, the two lower lines belong to EMS3.5 and
EMS3.13. For the second primer pair the low green line belongs to EMS3.5.

41
Discussion
This thesis aimed to characterize leaf heading in Chinese cabbage (Brassica rapa), using a molecular and
morphological approach. The closely related, but non-heading pak choi was used as a control. First the
morphology of Chinese cabbage (accession Chiifu) and pak choi (accession PC024) meristems during all
vegetative growth stages till pre-heading stage were assessed. Hereafter several qRT-PCRs on candidate
genes of the leaf heading trait were performed. Based on results of the qRT-PCR of one of the candidate
genes, time points were chosen for the next part of this thesis, i.e. in situ hybridization on pak choi and
Chinese cabbage meristem slices. With in situ hybridization we aimed to visualize spatial and temporal
expression pattern of heading candidate genes in apical meristems, and see whether these differ between
Chinese cabbage and pak choi.
The second part of this thesis focusses on EMS lines, which had been selected for their mutant heading
phenotype in northern China or identified for a mutation in the Br-ARF3.1 gene. After phenotyping, plants
with interesting phenotypes were screened for mutations in Br-ARF3.1 by HRM and send to sequencing for
validation.
Fixation, embedding and cutting of meristems Meristem enriched samples were fixated in 4%PFA, which crosslinks proteins within the tissue (Howat and
Wilson, 2014). After fixation samples were treated with alcohol and xylene and embedded in paraffin. The
first embedded tissues were not embedded well. This could have two reasons, first it could relate to the
length of ethanol, xylene and paraffin steps, which were shorter in the initial protocol (Saiga et al., 2008)
than in the protocol we used described in materials and methods. By using longer ethanol, xylene and
paraffin steps, the compounds have more time to penetrate the meristem containing very densely packed and
small cells. Second, we exchanged the water bath, used for heating steps, with an incubator, as we feared
that water droplets could get into the tubes, which is disastrous for paraffin as it is a hydrophobic lipid. After
changing the protocol and using an incubator the embedding of the samples was good. I chose to use 7 um
for cutting, as it keeps bigger cells (from leaf or stem tissue) intact while the meristem itself still contains
several cell layers. In case it is desired to really only look at the meristem itself and not at surrounding
leaves, thinner slices can possibly be used, so the cells in the meristem itself are better distinguishable.
Meristem morphology observation Meristems were studied throughout development in both genotypes. The apical shoot meristems of PC024
and Chiifu both show curving of leaves over the meristem. In Chiifu this curving of leaves over the
meristem is stronger visible than in PC024 especially at four weeks after sowing. At this time point, the
leaves closest to the meristem of PC024 also show folding around the meristem. However the outer layers
are more loose, and do not fully grow over the younger leaves. In Chiifu the outer leaves still fold tightly
over the new formed leaves at all developmental stages.
The leaves are most probable forced to be packed densely because high leaf numbers are formed in Chiifu
which all fold inwards. Also when comparing leaf development, 4 weeks after sowing pre-heading leaves
start to form in Chiifu, while in PC024 all observed leaves are rosette leaves. It seems that after this week
the leaves in Chiifu become more and more packed. Interesting to see is that after this time point the
internodes become longer in Chiifu, giving the leaves more space to grow and/or leaves to initiate, thus most
probable giving more space for head formation. In Chiifu internode elongation, observed at 7 weeks after
sowing, is not related to flowering, as the meristem does not show any sign of inflorescence.

42
PC024 has longer internodes, especially 4 and 5 weeks after sowing this difference is clearly visible.
However it is difficult to say whether this is a morphotypic difference during the vegetative stage or or due
to the start of bolting. In both the longitudal and the transverse sections the PC024 leaves are clearly
growing less densely, which can be influenced by the longer internodes, leaving more space for the leaves.
The size of the meristem in Chiifu, increases slightly over time. However it is difficult to assess the exact
size as this could possibly be influenced by the position of the sample during cutting. During leaf primordia
formation, the apical shoot meristem is known to fluctuate in size and form (Beck et al., 2005, Kwiatkowska
2008). The maximum size (longitudinal) is reached just prior to formation of the next primordium, due to an
increase in the pheripheral zone of the meristem (Beck et al., 2005, Kwiatkowska 2008).
Leaf number and function
The number and function of removed leaves were assessed during meristem harvest of CC Chiifu and added
up to the number of leaves and leaf primordia counted during microscope observation, to deduce at which
time point leaves are formed with a certain function, e.g. folding or heading leaves. Plants were re-potted at
3 weeks after sowing, which likely caused an increase in growth speed and thus in leaf appearance after this
time-point.
In Chiifu, pre-heading (folding) leaves started to form at 4 weeks after sowing, while this accession was in
pre-heading stage at 6.5 weeks. Within this time frame of only 2.5 weeks, the leaf numbers doubled from 30
to 60 (12 leaves/week). Heading leaves started to form between 5 and 6.5 weeks after sowing, within this
timeframe on average an increase of 23 leaves was observed (15 leaves/week). This is the highest increase
of leaf numbers numbers observed, possibly the heading leaves have to increase in number to form a mold
for further head formation. At 7.5 weeks after sowing, a very small head started to form. In total 70 leaves
were counted at this time point. In Pak choi due to flowering no leaves and leaf primordia were counted
beneath the microscope, as no true leaf primordia were found but flowering meristems, at 4 and 5 weeks
after sowing.
qRT-PCR A difficulty in giving meaning to the qRT-PCR data is the high standard deviations between biological
repeats (non-expanded leaves of different plants) in earlier time points and the fact that PC024 was bolting,
at 6.5 weeks after sowing. Especially the latter makes it difficult to say whether a higher level of expression
of a heading candidate gene in Chiifu, e.g. Br-ARF3.1 and Br-ARF4.1 6.5 weeks after sowing, is due to
Chiifu starting heading or whether this is lower in pak choi because this accession started flowering. Still it
is interesting to see that at 6.5 weeks after flowering, when heading-leaves already were forming and thus
heading leaves were used for RNA isolation, an increase in expression is seen in both Br-ARF3.1 and Br-
ARF4.1. However, hereafter the expression for both genes decrease in Chiifu. For the other evaluated genes,
i.e. Br-ARF3.2, Br-AXR1, Br-KAN1.1, Br-KAN1.2, Br-KAN2.1 and Br-KAN2.2, no obvious differences can
be observed between Chiifu and PC024.
In a late stage of this thesis, Xiaoxue Sun phenotyped A. thaliana Col-0 plants overexpressing Br-ARF3.1
alleles of Chinese cabbage and Pak choi. This analysis found no phenotype for overexpression of the
Chinese cabbage allele, while overexpression of Pak choi allele resulted in downwards curving, more
narrow leaves and earlier flowering. In addition these plants flowered earlier. This indicates the Br-ARF3.1
gene in Chinese cabbage is actually the non-functional mutant allele and thus high Br-ARF3.1 expression
does not affect leaf development in A.thaliana. If Br-ARF3.1 is also not functional in Chinese cabbage, the
abaxial-adaxial balance is changed. It might therefore be interesting to look at expression levels of the Br-
TAS3 gene, as tasiR-ARFs (generated from TAS3) are involved in the adaxial restriction of ARF3/4 in A.
thaliana (Williams et al., 2005).

43
In Br-ARF4.2 a higher expression is found in PC024 than in Chiifu for the last 3 time points, this contradicts
with a study which assessed the expression of Br-ARF4.2 (Huang et al., 2015). They found no expression in
all evaluated tissue (including leaf) and this gene was shown to lack the first part of the sequence including
the DNA binding domain compared to Br-ARF4.1, and therefore suggested this paralogous gene is
pseudogenized (Huang et a., 2015).
In A. thaliana ARF3 is shown to be involved in the determination of floral meristems (Sessions et al., 1997).
The increase in Br-ARF3.1 at 6.5 weeks after sowing in PC024 could thus be related to bolting at this time-
point. As the overexpression analysis of Xiaoxue Sun showed that pak choi, carrying the non-heading allele
of Br-ARF3.1, was flowering earlier, this expression increase could thus be related to flowering. This
increase is also seen in Br-ARF3.2, a paralogous gene thought to be less functional (Mun et al., 2012). No
Chiifu plants showed signs of bolting at 6.5 and 7.5 weeks after sowing.
The high standard deviation in the earlier time points is interesting, this could possibly be due to using
slightly different sized leaves for the RNA isolation or natural variation. In following research I think more
Chinese cabbage accessions should be used to give more grounded results, and possibly also use three
biological controls. During this experiment only two biological repeats, which results more easily in higher
variation.
Probes for in situ hybridization Probe templates were created by PCR on cDNA using primers with the SP6 and T7 promoter overhangs.
After producing run-off probe transcripts, the presence of the probes were visualized on gel. It is desired to
obtain one single band, however often two bands are observed. The most shiny band is most probably the
probe while the other band is thought to be either the result of dimerization (Zimmerman et al.,2013) or
presence of template product. depending on the height of the less shiny band. For the Br-ARF3.1 probe, the
less shiny band has a molecular weight twice as high as the probe transcripts, suggesting this is due to
dimerization. For all other produced probes the less shiny bands are thought to be template products. These
dimerization structures/template products are not thought to influence the in situ hybridization because the
probe is produced in abundance.
The optimal length of the probe is dependent on the tissue to be penetrated (Zimmerman et al., 2013,
Jackson et al., 1991). As the probe has to diffuse through the dense matrix of crosslinked proteins, we
initially made small probes of less than 300 bp. The Br-SPL15.1 probe was based on a paper on earliness in
Brassica rapa, where Br-SPL15.1 is shown to increase over time and visualized by in situ hybridization in
shoot apical meristems (Wang et al., 2014). The probe in the paper was 485 bp, and shown to be effective
(figure 19) (Wang et al., 2014).
A difficult issue is the absence of signal in the dot blots (including in positive control), even after using new
antibody solution and dye, and crosslinking the probe with uv light. There is a possibility, however unlikely,
something was wrong with the DIG-labelling kit (which also provided the positive control). In addition, our
technician used a tube instead of blot to visualize the colouring reaction, again giving no result. Contact with
the Roche/Sigma Aldrich company by our technician did not result in any clear recommendations to solve
this problem.
Crucial steps for in situ hybridizations The in situ hybridization starts with pre-hybridization, in which the meristem slices are re-hydrated and
treated with proteinase K. The latter is necessary to digest fixed proteins, and thus make the RNA accessible
for the probe. This step is critical as too long incubation time or too high proteinase K concentration can
cause breakdown of the tissue, while if too low the mRNA will not be accessible for the probe (Saiga et al.,

44
2008, Javelle et al., 2011). Another important step during pre-hybridization is the triethanolamine step, in
which the sample gets acetylated. This decreases background signal and decreases a-specific probe binding
(Saiga et al., 2008). Hereafter the samples are being dehydrated.
The following crucial part is the probe hybridization. Probes are applied in a probe solution, containing
formamide, 50x denhardt’s, 50% dextran sulfate (increases probe hybridization rate), 10x in situ salt and
tRNA (acts as carrier) (Eisel et al., 2008, Saiga et al., 2008). Formamide reduces the temperature the probe
can bind to the mRNA. Hybridizations can be performed at 30 °C – 45 °C with 50% formamide present in
the probe mixture (Eisel et al., 2008); this percentage was used in our procotol (Saiga et al., 2008). Another
important characteristic is the probe concentration, in the initial protocol 0.2 ul probe was pippeted in 200 ul
probe solution (Saiga et al., 2008), however the second protocol (Javelle et al., 2011) advised to use a range
of 0.5 to 4 ul probe in 100 ul probe solution. Too low probe concentration will result in no signal, while too
high concentration will give background (Eisel et al., 2008). The probe hybridization temperature is another
important step, and is dependent on the probe. Usually the hybridization temperature has to be higher for
longer probes (Zimmerman et al., 2013). The protocol of Saiga et al. advises to use 45 degrees, while the
protocol of Javelle et al., advises to use a range of 50-55 degrees. Both protocols use the same formamide
percentage (50%). Overall, it is difficult to assess which conditions are best, as these are dependent on the
probe and tissue.
After probe hybridization (overnight) post-hybridization steps are performed, in this antibodies are applied
which will bind to the probe labels, and subsequently the substrate NBT-BCIP is applied which will
generate a blue precipitate when in contact with the antibodies (Wilkinson 1998). The antibody incubation
time is crucial, and needs be longer if tissue contains small dense cells, as seen in meristems (4 hours) as
advised by an expert.
In situ hybridizations In the first in situ hybridization only Chiifu meristems were assessed, in order to see if the system worked
following exactly a protocol adapted for A. thaliana embryos (Saiga et al., 2008). A difference was observed
between slides threated with the sense T7 and antisense SP6 Br-ARF3.1 probes, for Chiifu (6.5 weeks after
sowing), the time point at which we expected the highest expression. We initially expected to see a gradient
from the abaxial to adaxial side of the leaves, with nuclear signals as Br-ARF3.1 is a transcription factor
localized in the nuclei. We expected to see this gradient as in A. thaliana ARF3 is restricted from the adaxial
side by TasiR-ARFs generated from the TAS3 gene (Williams et al., 2005). However, Xiaoxue Suns
overexpression experiment gave indication that the Br-ARF3.1 in Chinese cabbage is the non-functional
mutant while the pak choi allelic variant of Br-ARF3.1 is functional (results were obtained in a later stage of
this thesis). This possible pseudogenization in Chinese cabbage, could lead to aberrant regulation of TasiR-
ARFs, and therefore possibly result in no adaxial restriction anymore. It is therefore very interesting to
visualize the Br-ARF3.1 in both pak choi and Chinese cabbage, to assess if there is a difference in spatial
patterning.
The blue observed spots could be due to nuclear signal. However, some blue spots overlap multiple cells,
making it questionable whether this is true nuclear signal. In addition, several experts examined the pictures,
opinions were divided whether this is true signal or not. Most probable the observed signal is background,
the blue precipitate at the edges of the leaves is an indication for this. In addition, we were advised to
increase the antibody incubation time from 1 hour to 4 hours, as the antibody solution needs time to
penetrate the dense cells in the meristem. The initial protocol is specialized for Arabidopsis embryos, tissue
which is easier to penetrate. Still if the observed signal was actual true signal, it would be interesting as the
blue colouring is observed at the adaxial side of the leaf, the side were no expression was expected. The

45
RNA presence of one sample was tested (Chiifu, 4 weeks after sowing), which indicated that RNA was
intact.
No difference was observed between sense T7 and antisense SP6 probe in the positive control (Br-GAPDH).
Primers (also used during qRT-PCR as reference, and known to work well) for the Br-GAPDH probe were
provided by China , without obtaining the exact sequence of this gene (not found in brassica database).
GAPDH is a housekeeping gene, known to be stably expressed under different conditions (Xiao et al, 2012).
However, it is always possible that the probe cannot hybridize well to the mRNA, even though this gene is
highly expressed, possibly due to repetitive sequences (Javelle et al., 2011). As the sequence was not
available, a new probe could not be made on the same gene. Therefore we decided to make a new reference
probe, based on Br-CYP gene. This gene is one of the best reference genes for qRT-PCR, as it is highly and
stably expressed in Chinese cabbage (Xiao et al., 2012).
For the second in situ we increased the antibody incubation to 4 hours for better tissue penetration, and in
addition used new dye and antibodies. The latter because there was suspicion something might be wrong
with the dye or antibodies, e.g. breakdown of antibodies. Slices were cut in longitudinal view, so we could
better visualize the leaves, instead of mainly seeing mid-veins. We decided to again use the highly expressed
Br-ARF3.1 time point in Chiifu (6.5 weeks after sowing), and the time point prior to this one (5 weeks after
sowing), where also a relative high expression is seen, for both Chiifu and PC024. Unfortunately, no
differences could be observed between sense and antisense Br-ARF3.1 treated slides, and also positive
control treated slices (Br-CYP). RNA quality test on all samples used during the in situ hybridization
showed no RNA was present anymore. To see whether this absence of RNA was due to RNase
contamination during the experiment, or due to problems in earlier steps we decided to test the RNA quality
of several samples of different embedding rounds. Fortunately RNA quality of these samples seemed good,
indicating RNase contamination occurred during the second in situ hybridization.
For the third in situ hybridization we decided to only focus on one reference gene, of which was known it
worked in literature, as advised by an expert. The previous reference genes were selected on high
expression, however the fact that a gene is highly expressed does not necessarily mean it is a good reference
gene. An important characteristic is that the probe should have good hybridization with mRNA, which could
also be just in one cell layer. As long as the probe gives results as described in literature, you know your
system works. We found a gene SPL15.1 which controls earliness in heading in B. rapa, its spatial
expression has been visualized by in situ hybridizations (Wang et al., 2014). Br-SPL15.1 gene increases over
time (figure 19). In order to see if this reference gene can be used for very young tissue we decided to grow
and harvest new plants to use for this experiment, of 1 and 2 weeks after sowing. We fixated meristems of
these plants overnight and performed the whole embedding protocol in one time, without storing steps in
between. All other samples had been stored in 70% ethanol for up to 2 months, which was suggested to be
no problem by the protocol (Saiga et al., 2008). Still, we wanted to be sure this long storage of ethanol did
not affect the RNA quality. In addition we used old Chiifu meristem samples of 5 weeks after sowing, as at
this time point the RNA was shown to be highly present, and the SPL15.1 probe might be better visible as it
increases expression over time.
In addition we chose to use a big increase in proteinase K concentration (250 x increase), which was used by
a protocol (Javelle et al., 2011) specified for meristem in situ hybridizations. As we talked with an expert it
was suggested to test several conditions which can influence the outcome of an experiment, i.e. proteinase k
incubation time, probe concentration, probe hybridization temperature and antibody concentration. These
differences are usually not deal-breakers in whether an experiment works or not, but are known to influence

46
signal intensity. Still we thought it would be interesting to see whether specific combinations could together
result in real observable signal.
Unfortunately due to the high proteinase K concentration the samples degraded/floated off during the
washing steps following proteinase K incubation. It is possible the proteinase the used in the publication is
less vigorous, also the protocol cuts thicker slices at 8-10 um, possibly affecting the tissue less severe.
Another possibility is that the rack with slides was moved too much during the washing steps after the
proteinase K incubation. In addition the protocol mentions an incubation time of 20 minutes, however
optimization may be required. We tested 20 and 40 minutes proteinase K incubation, we could better have
tested a shorter incubation time, e.g. 10 and 20 minutes. Overall, I think it is better to use a lower proteinase
K concentration for a longer time, than a high concentration for a short time to better control the tissue
integrity.
The small dark dots observed in the anti-sense probe treated samples are most probable not true signal, as
these are also observed in the sense probe treated slide. The dots could be due to too high probe
concentration, which is a possible cause for background signal (Eisel et al., 2008). It is hard to give
conclusions to these results as the samples were damaged by proteinase K in different degrees, which also
degraded important antisense treated samples (negative control).
Figure 19. BrpSPL15-1 in situ hybridization in B. rapa from reference paper (Wang et al., 2014). K. 3 weeks old, anti-sense
probe, L. 3 weeks old, sense probe. M. 6 weeks old, anti-sense probe and N. 9 weeks old, anti-sense probe.
Overall, it is difficult to give a cause to the lack of clear results. In situ hybridizations include many steps
which can influence the outcome. Possibly this could be due to the probes, as the dot blots did not yield any
result. It is also possible that equipment plays a role, our lab was not specialized in in situ hybridizations,
and therefore did not have specialized equipment, such as hybridization ovens.
RNA presence The presence of RNA was shown by acridine orange, this fluorescent dye emits red light upon contact with
RNA. All tested embedded samples showed to have RNA present, however this does not necessarily mean
the quality/integrity of the RNA is good. In follow up experiments, RNA quality can be tested by isolating
the RNA from the fixed and embedded meristem and test it on gel, as suggested by Xiaoxue Sun.
In addition there is a possibility some of our samples have been over-fixated, this as we started the
embedding process once a week. Some samples were therefore in fixative for only one day while other
where in fixative for four days. We initially thought longer fixation time would not affect in situ
hybridization results, as once the molecules are cross-linked they are fixed. However several sources warn
for over-fixation when samples are in fixative for longer than 1 to 2 days, making it more difficult for the
probe to assess the mRNA (Eissel et al., 2008).
EMS phenotyping and genotyping In this experiment siblings of EMS plants selected for their mutant heading phenotype (in China field
conditions in October) had been grown for phenotyping, and genotyping of interesting phenotypes. In

47
addition three M2 lines were identified by Xiaoxue Sun after screening for a mutation in the Br-ARF3.1
gene. During the time this EMS experiment was in the end phase, Xiaoxue Sun had performed the
overexpression analysis of the Br-ARF3.1 alleles of Chinese cabbage and Pak choi in A. thaliana, which
indicated the heading Br-ARF3.1 alleles in Chinese cabbage are non-functional. These results explain why
no aberrant phenotypes were found for EMS7-9, which were identified for an Br-ARF3.1 mutation. This also
explains why no indications of mutations were found in the other non-heading EMS plants that were
genotyped for Br-ARF3.1, as a mutation in the Br-ARF3.1 gene would not be causal to the aberrant observed
phenotype.
The EMS line in generation M4 was fully non-heading in China, while the other six M2 lines were identified
for the segregation of non-heading plants. Plants were selfed in order to create a more uniform line by fixing
mutations. In each line we initially expect 300-600 mutations (data based on resequencing of progeny). By
selfing twice, 75% of these loci become homozygous (of which 50% wt and 50% mutant). This means that
we expect segregation of phenotypic mutations in M2 plants. Recessive mutant alleles, related to a
phenotype, have to be homozygous in order to show. As the M2 lines were identified for the segregation of
non-heading plants, we expect to see a segregation of 1:4 of non-heading in these M2 lines.
As the heading phenotype was difficult to assess in Wageningen greenhouse growth conditions, and as this
phenotype only shows at the heading stage, the plants were assessed during all vegetative growth for several
characteristics, i.e. leaf angle, surface structures, colour, size, shape and leaf numbers. We were especially
interested in mutant phenotypes at early developmental stages that could relate to non-heading at later
stages.
Unfortunately, no non-heading phenotypes were observed. Still 5 plants belonging to EMS line EMS3
showed pak choi features, having more oval leafs, which could be interesting as this may affect heading.
Three other plants (EMS3) were small, and showed a small head that appeared earlier then the wt, with
bulged leaf surface. These plants could be interesting for breeding purposes, e.g. breeding for small and
early heading Chinese cabbage. It is possible that traits, such as leaf bulginess, could result in a non-heading
phenotype under ideal conditions, such as in China. One other, less likely explanation for absence of non-
heading is that the seeds were mixed and that we did not have the correct EMS lines. Double segregation,
observed for instance in EMS3, is due to segregation of other traits, not related to non-heading.
Plants in the EMS10 line had a non-heading phenotype in China, and had been selfed four times (M4).
However at 12.5 weeks after sowing all these plants showed to be heading during our experiment. As this
line was M4 less segregation within the line was expected. Still 2 plants seemed to be smaller, but as stated
above this could be disease symptoms.
Overall, the non-heading phenotypes observed in the sister plants are not seen back in the plants grown in
this experiment, and the supposedly non-heading M4 line was heading. These unexpected results could be
due to differences in growing conditions, as leaf heading is known to be influenced by environmental
conditions (Wang et al., 2014). In China the plants were grown in the field, not showing signs of
deficiencies, while we grew the plants in the greenhouse. Also plants were positioned quite close to each
other, which might influence the leaves to have a larger leaf angle. Another difference is that our plants have
been grown in May (and encountered several weeks of hot temperature) while plants in China were grown in
October, under colder and shorter day conditions. It is possible that certain mutations only show under
specific conditions, as paralogues take over when conditions are changed. For future research it might be
good for researchers in China to also grow the EMS plants under different conditions, to see what is the
effect of the growth conditions on the phenotypes.
48
As many genes contribute to aberrant phenotypes, like non heading, screening for mutations in a single
candidate gene may not lead to results. A more effective method to identify causal genes of non-heading
phenotypes observed in EMS mutant populations would be to generate a segregating population by crossing
your non-heading mutant EMS plant with the heading wildtype (here A003) and self the F1 to create an F2.
After phenotyping the F2 population, where you expect a 1:3 segregation for the phenotype (1/4 recessive
homozygous), you make large pools of each phenotype (at least 40 plants/pool) and re-sequence these pools
(Illumina hiseq). The reads can be aligned to the reference genome and SNPs that differ between the mutant
phenotype pool (homozygous SNP allele) compared to the wildtype phenotype pool (heterozygous for that
SNP marker) are likely associated with candidate genes. SNPs can in turn be mapped to a specific region in
the genome, as the surrounding sequence is known. The EMS lines harbour many induced SNPs, and
because of that you expect to find several linked polymorphic SNPs between these pools, as recombination
frequency in an F2 are limited. Within this region candidate genes can be found by use of literature. Single
SNPs found outside these regions are most probable false positives. This method was proven successful by
finding causal genes for leaf color mutants (Mengyang Liu , personal communication)
Conclusions
This thesis aimed to characterize leaf heading in Chinese cabbage (Brassica rapa) using a molecular and
morphological approach. The non-heading close related pak choi was used as a control. The morphology of
shoot apical meristems of Chinese cabbage accession Chiifu and pak choi accession PC024 were assessed
during all vegetative growth stages, until folding stage in Chiifu. In comparison to PC024, Chiifu leaves
around the meristem are more folding inwards in leaf layers further from the meristem, causing tight
packing of the leaves. Also the internodes in Chiifu are smaller, except for the latest assessed time point (7.5
weeks after sowing), here the internodes become longer, probably giving more space for leaves to grow
and/or leaves to initiate for head formation. At 6.5 weeks after sowing PC024 started bolting.
In Chiifu folding leaves started to initiate at 4 weeks after sowing, while heading leaves started to initiate
between 5 and 6.5 weeks after sowing. At the latter timeframe the biggest increase in leaf numbers could be
observed, possibly important for the start of head formation. In PC024 due to bolting the total amount of leaf
numbers could only be assessed till 4 weeks after sowing.
QRT-PCRs were performed on several heading candidate genes. Higher expression in Br-ARF3.1 and Br-
ARF4.1 was found in Chiifu in comparison to PC024, at 6.5 weeks after sowing. At this time point Chiifu
was forming heading leaves, while PC024 was bolting. Therefore it is difficult to conclude if this difference
is possibly related to bolting or heading. All other assessed candidate genes did not show obvious
differences in expression between Chiifu and PC024.
In situ hybridizations were performed in order to assess the spatial and temporal expression of Br-ARF3.1 in
the meristems of Chiifu and PC024. Three experiments were performed, however none resulted in
hybridization signals as expected. This could be due to various reasons, e.g. choice of reference gene, RNA
integrity, non-ideal conditions (such as un-optimal probe hybridization temperature) or not having
specialized equipment.
By an overexpression analysis Xiaoxue Sun found indications that the Br-ARF3.1 allele in Chinese cabbage
is a non-functional mutant, while the Pak choi allele is indicated to be functional. Therefore it is very
interesting to keep on working on visualizing the expression patterns of this gene, and assess the difference
between Chinese cabbage and Pak choi.

49
Several EMS were identified in China for a non-heading phenotype in sister plants or for a mutation in the
Br-ARF3.1 gene. During this thesis the EMS lines were phenotyped and interesting plants were genotyped
for their Br-ARF3.1 gene. No non-heading phenotypes were observed, and genotyping did not identify Br-
ARF3.1 mutants. Heading is tightly influenced by environmental changes. Absence of non-heading is
therefore most probable due to the different growth conditions in the greenhouse in Wageningen in
comparison to China (field). The over-expression analysis performed by Xiaoxue Sun indicated why the
EMS plants identified for their mutations in the Br-ARF3.1 gene did not show a different phenotype, and
also why no mutations in the Br-ARF3.1 gene were found for other genotyped plants.
Recommendations
For tissue fixation it is advisable to not keep the tissue longer in 4% PFA than mentioned in the protocols
(only overnight), to exclude possible over-fixation. For follow-up in situ hybridizations, I would suggest to
keep using the protocol of Saiga et al., 2008, with only adjusting the antibody incubation step from 1 hour to
4 hours. Also I think it is best to keep on working with the reference probe from literature, i.e. Br-SPL15.1.
First a signal should be obtained without changing any steps, once signal is obtained changes can be made to
increase the signal intensity. If changing steps, it will be important to use negative controls for each
examined conditions and tissue in order to give good conclusions. If working further with the Br-ARF3.1
probe, it is advisable to produce first new probe (possibly in aliquots) instead of using the old one, as this
probe has been repeatedly frozen and thawed, which can result in degradation of the probe. In the protocol
of Javelle et al, 2012, it is advised when making new probes to design 2 or 3 probes covering the whole cds
of interest, to see which one yields the best signal.
In addition it would be interesting to assess the expression of heading candidate genes in leaf tissue,
however the embedding protocol has to be altered for this. The embedding protocol of this thesis resulted in
damaged leaf tissue, possibly steps have to be changed, e.g. shorter ethanol, or other embedding methods
have to be assessed, e.g. technovit.

50
References
Birchler, J. A., & Veitia, R. A. (2007). The gene balance hypothesis: from classical genetics to modern
genomics. The Plant Cell, 19, 395-402.
Boer, D. R., Freire-Rios, A., van den Berg, W. A., Saaki, T., Manfield, I. W., Kepinski, S., ... & Weijers, D.
(2014). Structural basis for DNA binding specificity by the auxin-dependent ARF transcription factors. Cell,
156, 577-589.
Bonaccorso, O., Lee, J. E., Puah, L., Scutt, C. P., & Golz, J. F. (2012). FILAMENTOUS FLOWER controls
lateral organ development by acting as both an activator and a repressor. BMC plant biology, 12, 176.
Byrne, M. E. (2012). Making leaves. Current opinion in plant biology, 15, 24-30.
Cheng, F., Sun, R., Hou, X., Zheng, H., Zhang, F., Zhang, Y., ... & Liu, D. (2016). Subgenome parallel
selection is associated with morphotype diversification and convergent crop domestication in Brassica rapa
and Brassica oleracea. Nature Genetics.
Del Pozo, J. C., Timpte, C., Tan, S., Callis, J., & Estelle, M. (1998). The ubiquitin-related protein RUB1 and
auxin response in Arabidopsis. Science, 280(5370), 1760-1763.
Finet, C., Berne-Dedieu, A., Scutt, C. P., & Marlétaz, F. (2012). Evolution of the ARF gene family in land
plants: old domains, new tricks. Molecular biology and evolution, 220.
Fukushima, K., & Hasebe, M. (2014). Adaxial–abaxial polarity: the developmental basis of leaf shape
diversity. genesis, 52, 1-18.
Gómez-Campo, C., & Prakash, S. (1999). Origin and domestication. Biology of Brassica coenospecies, 33-
58.
Guilfoyle, T. J., & Hagen, G. (2007). Auxin response factors. Current opinion in plant biology, 10, 453-460.
Hay, A., Kaur, H., Phillips, A., Hedden, P., Hake, S., & Tsiantis, M. (2002). The gibberellin pathway
mediates KNOTTED1-type homeobox function in plants with different body plans. Current Biology, 12,
1557-1565.
Howat, W. J., & Wilson, B. A. (2014). Tissue fixation and the effect of molecular fixatives on downstream
staining procedures. Methods, 70, 12-19.
Huang, Z., Duan, W., Song, X., Tang, J., Wu, P., Zhang, B., & Hou, X. (2015). Retention, molecular
evolution and expression divergence of the auxin/indole acetic acid and auxin response factor gene families
in Brassica rapa shed light on their evolution patterns in plants. Genome Biology and Evolution, 259.
Jackson, D. A. V. I. D. (1991). In situ hybridization in plants. Molecular plant pathology: a practical
approach. Oxford University Press, Oxford, 163-174.
Javelle, M., Marco, C. F., Timmermans, M. In Situ Hybridization for the Precise Localization of Transcripts
in Plants. J. Vis. Exp. (57), e3328, doi:10.3791/3328 (2011).
Kalve, S., De Vos, D., & Beemster, G. T. (2014). Leaf development: a cellular perspective. Frontiers in
plant science, 5, 362.

51
Mao, Y., Wu, F., Yu, X., Bai, J., Zhong, W., & He, Y. (2014). MicroRNA319a-targeted Brassica rapa ssp.
pekinensis TCP genes modulate head shape in chinese cabbage by differential cell division arrest in leaf
regions. Plant physiology, 164, 710-720.
Moon, J., & Hake, S. (2011). How a leaf gets its shape. Current opinion in plant biology, 14, 24-30.
Mun, J. H., Yu, H. J., Shin, J. Y., Oh, M., Hwang, H. J., & Chung, H. (2012). Auxin response factor gene
family in Brassica rapa: genomic organization, divergence, expression, and evolution. Molecular genetics
and genomics, 287, 765-784.
Nagaharu U.(1935). Genome analysis in Brassica with special reference to the experimental formation of B.
napus and peculiar mode of fertilization. Japan. J. Bot 7: 389–452
Nishijima, T., & Fukino, N. (2005). Geometrical analysis of development of erect leaves as a factor in head
formation of Brassica rapa L.:(II) Comparative analysis of headed and non-headed cultivars. Scientia
horticulturae, 104, 421-431.
Pekker, I., Alvarez, J. P., & Eshed, Y. (2005). Auxin response factors mediate Arabidopsis organ asymmetry
via modulation of KANADI activity. The Plant Cell, 17(11), 2899-2910.
Schranz, M. E., Lysak, M. A., & Mitchell-Olds, T. (2006). The ABC's of comparative genomics in the
Brassicaceae: building blocks of crucifer genomes. Trends in plant science, 11, 535-542.
Saiga, S., Furumizu, C., Yokoyama, R., Kurata, T., Sato, S., Kato, T., Tabata, S., Suzuki, M. & Komeda, Y.
2008. The Arabidopsis OBERON1 and OBERON2 genes encode plant homeodomain finger proteins and
are required for apical meristem maintenance. Development, 135, 1751-1759.
Tan, C. M. (1979). The origin, distribution and evolution of the cultivars of Chinese head cabbage (B.
compestris ssp. Pekinensis). China Agric. Sci., 4, 68-75.
Tiwari, S. B., Wang, X. J., Hagen, G., & Guilfoyle, T. J. (2001). AUX/IAA proteins are active repressors,
and their stability and activity are modulated by auxin. The Plant Cell, 13, 2809-2822.
Vernoux, T., Brunoud, G., Farcot, E., Morin, V., Van den Daele, H., Legrand, J., ... & Guédon, Y. (2011).
The auxin signalling network translates dynamic input into robust patterning at the shoot apex. Molecular
systems biology, 7.
Wang, Y., Wu, F., Bai, J., & He, Y. (2014). BrpSPL9 (Brassica rapa ssp. pekinensis SPL9) controls the
earliness of heading time in Chinese cabbage. Plant biotechnology journal, 12, 312-321.
Wang, X., Wang, H., Wang, J., Sun, R., Wu, J., Liu, S., ... & Huang, S. (2011). The genome of the
mesopolyploid crop species Brassica rapa. Nature genetics, 43, 1035-1039.
Wilkinson, D. G. (1998). In situ hybridization: a practical approach. Oxford University Press.
Williams, L., Carles, C. C., Osmont, K. S., & Fletcher, J. C. (2005). A database analysis method identifies
an endogenous trans-acting short-interfering RNA that targets the Arabidopsis ARF2, ARF3, and ARF4
genes. Proceedings of the National Academy of Sciences of the United States of America, 102, 9703-9708.
Xiao, D., Zhang, N. W., Zhao, J. J., Bonnema, G., & Hou, X. L. (2012). Validation of reference genes for
real-time quantitative PCR normalisation in non-heading Chinese cabbage. Functional Plant Biology, 39,
342-350.

52
Zimmerman, S. G., Peters, N. C., Altaras, A. E., & Berg, C. A. (2013). Optimized RNA ISH, RNA FISH
and protein-RNA double labeling (IF/FISH) in Drosophila ovaries. Nature protocols, 8, 2158-2179.
Eisel, D., Seth, O., Grünewald-Janho S., Kruchen B., (2008). Guidelines for In situ Hybridization. DIG
Application Manual for Nonradiactive In Situ Hybridization (18-26). Roche Diagnostics GmbH.

53
Appendix
Table 14. Primers for qRT-PCR
Forward primer Reverse primer
ARF3.1 TGGTGATGCTGTGCTTTTCC AAGAACTTCGGTGCAGGGA
ARF3.2 AGAGGAAATTGCGTGAGGGA AGAAGCTCCTGAGATGGCC
ARF4.1 GCTGGTGTAGTGACTGGA TTTGGGCCTTGGAGATGACT
ARF4.2 GGAAAACAGAAAGGTGGCGG TGCAGCTCCAAGACACCAAA
AXR.1 AGGACGAGTTCAGCAATCCT TCCCCAACATCGGAACAAAC
KAN1.1 ACCCTAGTTCGAGTCCAAGC AGACCGGGATGCCTCTAATC
KAN1.2 CGCTTACCGGTCGTTACAG TACTCCTCCAACGCATCCTC
KAN2.1 CACGGCAACCAACAATAGCT TGAACAAAACGGGCATGGAG
KAN2.2 AGCATCCACTCCTTCTCCCT GCTATTGTTGGTTGCCGTGG
GAPDH CACTTGAAGGGTGGTGCGAAGAAA GACGGTGGTCATGAGTCCCTCG
Table 15. Primers for in situ hybridization probes
Forward primer Reverse primer product
size
ARF3.1
T7
TAATACGACTCACTATAGGG-
GAGCCAGAGGAACATTTGGTG
GAACTCCCATTTTGCCCTTCC 257
ARF3.1
SP6
GAGCCAGAGGAACATTTGGTG ATTTAGGTGACACTATAGAA-
GAACTCCCATTTTGCCCTTCC
257
CYP T7 TAATACGACTCACTATAGGG-
CCGGGTATTCTCTCCATGGC
CCGCTGTCAGATCCAACCTT 187
CYP
SP6
CCGGGTATTCTCTCCATGGC ATTTAGGTGACACTATAG-
CCGCTGTCAGATCCAACCTT
187
GAPDH
T7
TAATACGACTCACTATAGGG-
CACTTGAAGGGTGGTGCGAAGAAA
GACGGTGGTCATGAGTCCCTCG -
GAPDH
SP6
CACTTGAAGGGTGGTGCGAAGAAA ATTTAGGTGACACTATAGAA-
GACGGTGGTCATGAGTCCCTCG
-
SPL15.1
T7
TAATACGACTCACTATAGGG-
AGAAGACGACTTGCTTGCCA
CAGTCTCAAAGCAGGGGAGG 452
SPL15.1
SP6
AGAAGACGACTTGCTTGCCA ATTTAGGTGACACTATAG-
CAGTCTCAAAGCAGGGGAGG
452

54
Figure 20. Protocol Dot Blot.

55
Table 16. Primers for screening Br-ARF3.1 by HRM of EMS lines
Forward Reverse product
size
1 tctctctctctgATGGGTGGT CCCAGACGAAGAAGAAGACCC 156
2 CTTCTGCGTTTGGTGTGAGTG GTAAATCGCGGCGGAGAAATC 167
3 AGAACAAGCCCCCGATTTCTC GGAAGCAGAGAGACTTGAGCA 245
4 GGTTTTGTAGGCAGAGACAGC TCATAATCCTCCTCCCCACCA 202
5 AAGGTGCGTGAGGGAGTGATA GCAATGTAGAGAGTGTGTGTGC 202
6 TGTAGGACTATACTCAGCCCA ACAAACGCACTCCATCCAGTA 207
7 GGATGGAGTGCGTTTGTGAAC AAGCTCTTCTCACTCCCAAGC 183
8 GCTTGGGAGTGAGAAGAGCTT TGTGGTTGGAGCTTACTTGGG 161
9 CTTTTTCAGGGCAAGCTGGTC ACTCATGTGTTGCCAAAAGTTCT 173
10 TGCATATGTTATGTCAGATCCCC ATATAGTTTCAGTGCAAGCAAGT 150
11 TCACTTGCTTGCACTGAAACT CTGCTTCTCTTGGGACCAGTT 167
12 ATCTCCAGTTCAGGCAGCTTC GTCACCAAACTCCGTTCCTTTG 234
13 GAGAGGCCGGTTCAAAGGAA GCTTGAGGGTAGTGGTGAAGA 214
14 TCTTCACCACTACCCTCAAGC accaaacaacaCTAGAGAGCA 263
aaatgtagaatataacggtaatccacagttccacacattcaaatctaaccataaacaaaaaaaaaaacacatgaactgcctttcgttttgtttttactacgcacacatggaccgc
ctgaaataataaattgataataatgtggtaaataccttaaactaatcacttatgtgcatcgatccctaaaagtatgcgaccactattctccaccactagaaataaaaaagtaatc
aaaagagacgacaaataaagagattaattattcttgcagatcttattgtataacccatcattaatacttgtaatgaaaaaacacttgtataaagtacatctgtaaaaacccaata
gtattatcaacattgcaaaaacctttggttaaaaaaaagggtaataaagaagaagaagaagaaaccaatctatcaaaaaatctaatctcaacacgcacaaaaggtctaaaa
gccacaccacacacatcagtcaccagacgtagcagaagagaccactgtactacacagagagcagcactcagtactattctgagttctgaccctcccgctctcctcttaaacact
gtctcaaaagaaaaattaaaaatcaaaacttttattctcaaacgaaaaattaaaaatcttggcttttaagactcactcgctcatatcactgtgctgctctcttctcttcacttttctga
aagagggtaaagttccaagtcatgaagaaataaaaaaagctcttatcttttatctctttatctctctctctctctctgATGGGTGGTTTAATTGATCTGAACGTGACG
GAGGAGCAAGAAGAAGAAACGACACCGTCTTCAGGCTCCGGGTCTCTCTCTCCGTGTGATTCTTCGTCTTCAGCTTCTGCGTTTGGTG
TGAGTGGGTCTTCTTCTTCGTCTGGGGTATGTCTGGAGCTGTGGCATGCTTGTGCTGGACCCCTCATCTCTCTCCCGAAAAGAGGAAG
CCTCGTGTTGTATTTCCCTCAGGGACATTTAGAACAAGCCCCCGATTTCTCCGCCGCGATTTACGGGCTCCCTCCTCACGTGTTCTGTC
GTATTCTTGATGTCAAGCTTCACGTATGTCTTTATAAACCTCTTCTTGTCTTTTTATTTATTTTTGTTTCTTTTGGAGGAGGAGAAAAAAA
AAATTTATCTTTTTTTTTTTGTGAATCTGAATTGAGATGGTTTTGTAGGCAGAGACAGCTACTGATGAAGTTTATGCTCAAGTCTCTCTG
CTTCCTGAGTCTGAGGTGAGTGTTTTCTTTTTAAAGCTTTTGAGTCTTGGAACAGTTTTTAGAGAAGAGGTTTTTTTTTTTGTTACAGGA
CGTTGAGAGGAAGGTGCGTGAGGGAGTGATAGATGTTGATGGTGGGGAGGAGGATTATGAGGTGGTTAAGAGGACTAATACTCCTCA
TATGTTCTGTAAAACACTCACTGCTTCTGATACAAGTACACATGGTGGCTTCTCTGTTCCTCGCCGTGCTGCTGAGGATTGCTTCCCTCC
TCTGGTACTTGCTGCACACACACTCTCTACATTGCACATTATTTGTCTGAGATAATTCAGAGATTTAGTTGTTTTTTTCATAAGTTTATTG
TGATGTTATATCGTTATGTAGGACTATACTCAGCCCAGGCCTTCCCAGGAGCTTCTTGCTAGGGATCTTCATGGCCTGGAGTGGCGTTT
TCGCCACATATACCGAGGTAATTTTGTTGCCTTATGTTGCTTCTTGTTTCCCTTGAGACAATAGATGAATGGTTTGAGTGTCTTTTAGGA
CAACCTAGGAGGCATTTGCTCACTACTGGATGGAGTGCGTTTGTGAACAAGAAGAAGCTTGTCTCTGGTGATGCTGTGCTTTTCCTCA
GGTAATTAAAAAAAAACTTTTTACTGTTCTCTAGCTACAATAAAAATCTCTTTGAATCTTATGGTTTTTTCTCTAATATAGAGGTGATGAT
GGCAAACTGCGCTTGGGAGTGAGAAGAGCTTCTCAAATCGAAGGTGCTTCTGCTTTCTCCAGTCAGTATAATCAGAACATGAACCACA
ATAATTTCGCTGAAGTAGTTCATGCCATATCCACCAATAGTGCTTTCAACATCTACTACAACCCCAAGTAAGCTCCAACCACAATAGTTC
TTGTTTATTGATTCCATTCTAAGTAATAAGGTGCAATTGGCAAAACCTTTTTCAGGGCAAGCTGGTCAAACTTCATAATCCCTGCACCGA
AGTTCTTGAAGACTGTTGACTATCCATTTTGTATCGGTATGAGATTCAAAGCAAGGGTTGAGTCTGAAGATGCCTCTGAGAGAAGGTTA
TATCTCAAGCTTTTAAGAGAACTTTTGGCAACACATGAGTTTTATTTTCTCTATCCTTCTAAAATGTTTTTTTTTTCTTTTGCATATGTTAT
GTCAGATCCCCTGGGATAATAACTGGAATCAACGACTTGGATCCTATCAGGTGGCCTGGTTCTAAATGGAGATGCCTCTTGGTAAGCT
ATGAGTTATAGATCTTCTAAAAATATCACTTGCTTGCACTGAAACTATATTTTGATGTCATATCCAGGTAAGGTGGGACGACACTGATGC
AAATGGGCATCATCAACAGCGCATCTCACCATGGGAGATAGAACCATCTGGTTCAATCTCCAGTTCAGGCAGCTTCATAACAACTGGTC
CCAAGAGAAGCAGGATTGGCTTTTCCTCAGGAAAGCCTGACATCCCTGTCTCTGGTTCTGGTGCCACAGACTTTGAGGAATCTCTAAG
ATTCCAGAGGGTCTTGCAAGGTCAAGAAATTTTTCACGGTTTCATCAACACCTCTTCGGATGGTGGTGCTGGTGCCAGGAGAGGCCGG
TTCAAAGGAACGGAGTTTGGTGACTCTTATGGGTTCCATAAGGTCTTGCAAGGTCAAGAAACAGTTCCCGCTTACCCAATGATGACCG
ATCAACGGCACCAGGGGATGAGCCAGAGGAACATTTGGTGTGGTCCGTTCCAGAACTTTAGCACACGTATCCTCCCGCCATCTTCGGT
CCAGGTGTCTTCACCACTACCCTCAAGCGGTCCTAACGTGCGGATGGAAGAGCACCACGGAGGTTCGGGCAGGTGCAGGCTGTTTGG
TTTCCCGTTGAGGGATGAGACCACGGCGGTTGGGTCTGGGATGGTTGTTGGCCCTTGTGTGGAAGGGCAAAATGGGAGTTCCATAAG
AGGTGGTGTTTCTGCTGTTCAGAGCAGTCATCATGGAAGGGACATATATGGGATGAGAGATATGTTGCTAGACATTGCTCTCTAGtgttg
tttggtttatgtgtgtgtttgtatgcttgtggcttaagtatgtttttagttgattttattattatggagatgacttggctagctaactttcggatgtcacaagttgatggcttttgtaaact
tggttgtttctttgcaagaatgatttttattattagcttcaagttatgaaaaagtattttttttttattgatggttgtggtttggtattatttttgtggcatgtatttattggctactgagatt

56
aagtgaacgtgtgtttttttcccctttggctggttatgacttgtgtggttctaaaccgggatctcttcagcttataatttgatgataaatgtagaaggaaatgcggttagtattggta
gcgttatgagttatgatggcctaatcagcatttttgtttgttacactggttgttgactcaagggtggtaacgtttgcaatttttggtgtgttgttatttgctcatcgaggtttcgccttcc
ctatcacaatgacacctcgtagttgcatgtggagaggaattgaagaaaatcaacctcaattttccctacatcatttagggtgacaccaagtgaacgaagatgaacactatgttct
ttaacatcctttaaactttttaccattcacaaggaataggttatccttttcgttcctcttcgttcctttatttgtaaaaaattatagaacaaattaattcttcattaattttgataaagaac
tattatttttcattatttctaaaattt
Figure 21. Position of primers used for HRM indicated with colours in Br-ARF3.1. Exons are coloured in grey. Capital letters
are part of the ARF3.1 gene, while letters in non-capital are regions outside this gene.
Table 17 A-B. Meristems first in situ hybridization in Chiifu. A. Two weeks after sowing 10x amplification B. Four weeks
after sowing10x amplification
A B
T7
SP6

57
Table 18. Results slides treated with sense SP6 probes during third in situ hybridization. With columns depicting incubation
time of proteinase K treatment, i.e. 20 or 40 minutes. A. 0.5 ul probe and 50°C hybridization temperature. B. 0.5 ul probe and
55°C hybridization temperature. C. 1.5 probe and 50°C hybridization temperature. D. 1.5 ul probe and 55 °C hybridization
temperature. Scale bar represents 200 um. Empty cell contains no picture due to floated off meristem. Pictures are edited with
photo-editing software in order to create more similar light colouring in the pictures.
20 minutes proteinase K 40 minutes proteinase K
A
B
C
x
D

58
Table 19. Difference in fluorescence graphs of HRM analysis
Primer pair 1 Primer pair 2
Primer pair 4 Primer pair 5
Primer pair 6 Primer pair 8
Primer pair 9 Primer pair 10
Primer pair 11 Primer pair 13

59
Primer pair 14
Figure 22. Multiple alignment of A003 , EMS3.5 and EMS3.13 for primer pair 2. Sequences in yellow indicate the position of
forward and reverse primer of primer pair 2. Sequence in grey is part of the first exon of the ARF3.1 gene. forwardA003 :
sequenced A003, forward3.5 : sequenced EMS3.5, forward3.13 : sequenced EMS3.13, forward_part_arf3.1 : DNA sequence of
ARF3.1 from the brad database
CLUSTAL 2.1 multiple sequence alignment
forwardA003/1-380 --------------------------------------------
----------------
forward3.5/1-344 --------------------------------------------
----------------
forward3.13/1-345 --------------------------------------------
----------------
forward_part_arf3.1/1-614
ATGGGTGGTTTAATTGATCTGAACGTGACGGAGGAGCAAGAAGAAGAAACGACACCGTCT
forwardA003/1-380 -ANGGCTCCGGG--TCT-
CTCTCTCCGTGTGATTCTTCGTCTTCAGCTTCTGCGTTTGGT
forward3.5/1-344 --GNCTCCCGGG--
TCNTCTCTCTCCGTGTGATTCTTCGTCTTCAGCTTCTGCGTTTGGT
forward3.13/1-345 ---GGCTCCNGGGTCCT-
CTCTCTCCGTGTGATTCTTCGTCTTCAGCTTCTGCGTTTGGT
forward_part_arf3.1/1-614 TCAGGCTCCGGG--TCT-
CTCTCTCCGTGTGATTCTTCGTCTTCAGCTTCTGCGTTTGGT
** ** *
******************************************
forwardA003/1-380
GTGAGTGGGTCTTCTTCTTCGTCTGGGGTATGTCTGGAGCTGTGGCATGCTTGTGCTGGA

60
forward3.5/1-344
GTGAGTGGGTCTTCTTCTTCGTCTGGGGTATGTCTGGAGCTGTGGCATGCTTGTGCTGGA
forward3.13/1-345
GTGAGTGGGTCTTCTTCTTCGTCTGGGGTATGTCTGGAGCTGTGGCATGCTTGTGCTGGA
forward_part_arf3.1/1-614
GTGAGTGGGTCTTCTTCTTCGTCTGGGGTATGTCTGGAGCTGTGGCATGCTTGTGCTGGA
************************************************************
forwardA003/1-380
CCCCTCATCTCTCTCCCGAAAAGAGGAAGCCTCGTGTTGTATTTCCCTCAGGGACATTTA
forward3.5/1-344
CCCCTCATCTCTCTCCCGAAAAGAGGAAGCCTCGTGTTGTATTTCCCTCAGGGACATTTA
forward3.13/1-345
CCCCTCATCTCTCTCCCGAAAAGAGGAAGCCTCGTGTTGTATTTCCCTCAGGGACATTTA
forward_part_arf3.1/1-614
CCCCTCATCTCTCTCCCGAAAAGAGGAAGCCTCGTGTTGTATTTCCCTCAGGGACATTTA
************************************************************
forwardA003/1-380
GAACAAGCCCCCGATTTCTCCGCCGCGATTTACGGGCTCCCTCCTCACGTGTTCTGTCGT
forward3.5/1-344
GAACAAGCCCCCGATTTCTCCGCCGCGATTTACGGGCTCCCTCCTCACGTGTTCTGTCGT
forward3.13/1-345
GAACAAGCCCCCGATTTCTCCGCCGCGATTTACGGGCTCCCTCCTCACGTGTTCTGTCGT
forward_part_arf3.1/1-614
GAACAAGCCCCCGATTTCTCCGCCGCGATTTACGGGCTCCCTCCTCACGTGTTCTGTCGT
************************************************************
forwardA003/1-380
ATTCTTGATGTCAAGCTTCACGTATGTCTTTATAAACCTCTTCTTGTCTTTTTATTTATT
forward3.5/1-344
ATTCTTGATGTCAAGCTTCACGTATGTCTTTATAAACCTCTTCTTGTCTTTTTATTTATT
forward3.13/1-345
ATTCTTGATGTCAAGCTTCACGTATGTCTTTATAAACCTCTTCTTGTCTTTTTATTTATT
forward_part_arf3.1/1-614
ATTCTTGATGTCAAGCTTCACGTATGTCTTTATAAACCTCTTCTTGTCTTTTTATTTATT
************************************************************
forwardA003/1-380
TTTGTTTCTTTTGGAGGAGGAGAAAAAAAAAATTTATCTTTTTTTTTTTGNAANTNTAAA
forward3.5/1-344
TTTGTTTCTTTTGGAGGAGGAGAAAAAAAAAATTTATCTTTTTTTTTT------------
forward3.13/1-345
TTTGTTTCTTTTGGAGGAGGAGAAAAAAAAAATTTATCTTTTTTTTTTT-----------
forward_part_arf3.1/1-614
TTTGTTTCTTTTGGAGGAGGAGAAAAAAAAAATTTATCTTTTTTTTTTTGTGAATCTGAA
************************************************