MOLECULAR AND MORPHO-ANATOMICAL CHARACTERIZATION …5)/25.pdf · pak. j. bot., 48(5): 1979-1988,...
10
Pak. J. Bot., 48(5): 1979-1988, 2016. MOLECULAR AND MORPHO-ANATOMICAL CHARACTERIZATION OF SOME EGYPTIAN DURUM WHEAT CULTIVARS/LINES OSAMA M. SALEH 1* , NAHLA HAMIEDELDIN 1 , AHMED F. KHAFAGA 1 AND RASHAD M. SHOAIB 2 1 National Centre for Radiation Research and Technology (NCRRT), Nasr City, Cairo, Egypt 2 National Research Centre (NRC), Dokki, Giza, Egypt * Corresponding author’s email address: [email protected] Abstract Grains of eight durum wheat cultivars were tested for identification of genetic relationship among molecular, anatomical and morphological levels. On the molecular level, two techniques have been used; Randomly Amplified Polymorphic DNA (RAPD) and Inter Simple Sequence Repeats (ISSR). Amplification of RAPD primers showed different numbers of fragments ranged from six to thirteen fragments. Percentage of polymorphism ranged from 0% to 100%. The highest similarity value recorded was 91%, while the lowest similarity value was 69%. Amplification of ISSR primers showed different numbers of fragments ranged from six to twelve fragments. The highest similarity value recorded was 91%, while the lowest similarity value was 68%. The grain’s coat morphology was reticulated in all taxa. There were variations with regard to the alignment and the shape of network and architecture of interspaces enclosed by raised line. Reticulate surface patterns appeared some variations ranged from weakly reticulate such as G 413 to strongly reticulate such as G 203. Stem cuticles of all cultivars were thick except cultivar; Benisweif 1. For leaf anatomy, all cultivars had epidermis composed of one layer of thick wall cells except cultivars; G 203 and Benisweif 1. Key words: Durum wheat, RAPD, ISSR, Morphology, Anatomy. Introduction Wheat is the most widely grown cereal in the world (Anon., 2003). It is the staple food for 35% of the world’s population, and is becoming increasingly important in the developing world (Cimmyt, 2003).The estimation of genetic diversity at the DNA level improves the identification and characterization of primary and secondary centers of diversity (Serret et al., 1997; Chowdhury & Slinkard, 2000). Knowledge of diversity patterns will also allow breeders to better understand the evolutionary relationships among accessions, to sample germplasm in a more systematic fashion, and to develop strategies to incorporate useful diversity in their breeding programs (Bretting & Widrlechner, 1995). Zafar et al. (2015) reported that study of genetic patternson soybean can help its breeders to make better plan for selecting germplasm from wide sources for a specific purposes. Using molecular marker in wheat cultivar characterization now became more stable and accurate than morphological and cytogenetic traits which at present are unstable, time-consuming, and affected by environmental conditions, (Boggini et al., 1990). Using the RAPD method for detection of polymorphism among wild and cultivated tetraploid wheat and genetic diversity is very important in reducing genetic vulnerability during plant breeding efforts (Joshi & Nguyen, 1993). In order to estimate the genetic diversity, molecular markers provided excellent tools (Sofalian et al., 2008). Inter simple sequence repeats (ISSRs) are one of the DNA-based markers that have become widely used in various areas of plant research (Karaca & Izbirak, 2008). ISSR technique exploits the abundant and random distribution of SSRs in plant genomes by amplifying DNA sequences between closely linked simple sequence repeats (SSRs). ISSR technique has been widely used in studies of cultivar identification, genetic mapping, genetic diversity, evolution and molecular ecology (Yang et al., 1996). ISSR markers provided sufficient polymorphism and reproducible fingerprinting profiles for evaluating genetic diversity in combination with agronomical and morphological traits (Najaphy et al., 2012). El-Assal & Gaber, (2012) evaluated eleven wheat cultivars collected from Egypt and Saudi Arabia using RAPD, SSR and ISSR markers. They investigated the discriminating capacity and effectiveness of these markers in establishing genetic relationship and diversity of these landraces. The dendrogram cluster diagram classified the evaluated genotypes in three major clusters corresponding to the cultivation regions. ISSR markers could be efficiently used to evaluate genetic variations in the wheat germplasm, genetic similarity and dissimilarity among genotypes. ISSR is a useful technique for genetic differentiation of wheat accessions, selection strategies and genetic development of crop plants (Sofalian et al., 2008, 2009). ISSRs markers used for genetic diversity analysis of some wheat varieties and no statistically significant differences were found between genetic diversity parameters of durum and bread wheat, most cultivars belonging to the same botanical variety were clustered in the same main group, however intra-variety ISSR polymorphism was also observed, (Carvalho et al., 2008a, 2008b, 2009). The cluster analysis tree using ISSR markers placed tested genotypes in groups. The known origin and the genetic relationships estimated by this polymorphism revealed greater level of genetic variability in Indian bread wheat varieties of wide adaptability and applicability (Chowdhury et al., 2008). The efficiency of ISSR markers is very high and two primers were sufficient to distinguish some examined durum wheat cultivars (Pasqualone et al., 2000). The genetic relationships of wheat accessions estimated by the polymorphism of ISSR markers were identical with those inferred by restriction fragment length polymorphism (RFLP) and RAPD markers, indicating the reliability of ISSR markers for estimation of genotypes (Nagaoka & Ogihara, 1997). ISSR markers succeeded in distinguishing most of 20 hexaploid, tetraploid and diploid genotypes of wheat (Abou-Deif et al., 2013).
Transcript of MOLECULAR AND MORPHO-ANATOMICAL CHARACTERIZATION …5)/25.pdf · pak. j. bot., 48(5): 1979-1988,...

Pak. J. Bot., 48(5): 1979-1988, 2016.
MOLECULAR AND MORPHO-ANATOMICAL CHARACTERIZATION OF SOME
EGYPTIAN DURUM WHEAT CULTIVARS/LINES
OSAMA M. SALEH1*, NAHLA HAMIEDELDIN1, AHMED F. KHAFAGA1 AND RASHAD M. SHOAIB2
1National Centre for Radiation Research and Technology (NCRRT), Nasr City, Cairo, Egypt
2National Research Centre (NRC), Dokki, Giza, Egypt *Corresponding author’s email address: [email protected]
Abstract
Grains of eight durum wheat cultivars were tested for identification of genetic relationship among molecular,
anatomical and morphological levels. On the molecular level, two techniques have been used; Randomly Amplified
Polymorphic DNA (RAPD) and Inter Simple Sequence Repeats (ISSR). Amplification of RAPD primers showed different
numbers of fragments ranged from six to thirteen fragments. Percentage of polymorphism ranged from 0% to 100%. The
highest similarity value recorded was 91%, while the lowest similarity value was 69%. Amplification of ISSR primers
showed different numbers of fragments ranged from six to twelve fragments. The highest similarity value recorded was
91%, while the lowest similarity value was 68%. The grain’s coat morphology was reticulated in all taxa. There were
variations with regard to the alignment and the shape of network and architecture of interspaces enclosed by raised line.
Reticulate surface patterns appeared some variations ranged from weakly reticulate such as G 413 to strongly reticulate such
as G 203. Stem cuticles of all cultivars were thick except cultivar; Benisweif 1. For leaf anatomy, all cultivars had epidermis
composed of one layer of thick wall cells except cultivars; G 203 and Benisweif 1.
Key words: Durum wheat, RAPD, ISSR, Morphology, Anatomy.
Introduction
Wheat is the most widely grown cereal in the world
(Anon., 2003). It is the staple food for 35% of the world’s
population, and is becoming increasingly important in the
developing world (Cimmyt, 2003).The estimation of genetic
diversity at the DNA level improves the identification and
characterization of primary and secondary centers of
diversity (Serret et al., 1997; Chowdhury & Slinkard, 2000).
Knowledge of diversity patterns will also allow breeders to
better understand the evolutionary relationships among
accessions, to sample germplasm in a more systematic
fashion, and to develop strategies to incorporate useful
diversity in their breeding programs (Bretting &
Widrlechner, 1995). Zafar et al. (2015) reported that study of
genetic patternson soybean can help its breeders to make
better plan for selecting germplasm from wide sources for a
specific purposes. Using molecular marker in wheat cultivar
characterization now became more stable and accurate than
morphological and cytogenetic traits which at present are
unstable, time-consuming, and affected by environmental
conditions, (Boggini et al., 1990). Using the RAPD method
for detection of polymorphism among wild and cultivated
tetraploid wheat and genetic diversity is very important in
reducing genetic vulnerability during plant breeding efforts
(Joshi & Nguyen, 1993). In order to estimate the genetic
diversity, molecular markers provided excellent tools
(Sofalian et al., 2008). Inter simple sequence repeats (ISSRs)
are one of the DNA-based markers that have become widely
used in various areas of plant research (Karaca & Izbirak,
2008). ISSR technique exploits the abundant and random
distribution of SSRs in plant genomes by amplifying DNA
sequences between closely linked simple sequence repeats
(SSRs). ISSR technique has been widely used in studies of
cultivar identification, genetic mapping, genetic diversity,
evolution and molecular ecology (Yang et al., 1996). ISSR
markers provided sufficient polymorphism and reproducible
fingerprinting profiles for evaluating genetic diversity in
combination with agronomical and morphological traits
(Najaphy et al., 2012). El-Assal & Gaber, (2012) evaluated
eleven wheat cultivars collected from Egypt and Saudi
Arabia using RAPD, SSR and ISSR markers. They
investigated the discriminating capacity and effectiveness of
these markers in establishing genetic relationship and
diversity of these landraces. The dendrogram cluster diagram
classified the evaluated genotypes in three major clusters
corresponding to the cultivation regions. ISSR markers could
be efficiently used to evaluate genetic variations in the wheat
germplasm, genetic similarity and dissimilarity among
genotypes. ISSR is a useful technique for genetic
differentiation of wheat accessions, selection strategies and
genetic development of crop plants (Sofalian et al., 2008,
2009). ISSRs markers used for genetic diversity analysis of
some wheat varieties and no statistically significant
differences were found between genetic diversity parameters
of durum and bread wheat, most cultivars belonging to the
same botanical variety were clustered in the same main
group, however intra-variety ISSR polymorphism was also
observed, (Carvalho et al., 2008a, 2008b, 2009). The cluster
analysis tree using ISSR markers placed tested genotypes in
groups. The known origin and the genetic relationships
estimated by this polymorphism revealed greater level of
genetic variability in Indian bread wheat varieties of wide
adaptability and applicability (Chowdhury et al., 2008). The
efficiency of ISSR markers is very high and two primers
were sufficient to distinguish some examined durum wheat
cultivars (Pasqualone et al., 2000). The genetic relationships
of wheat accessions estimated by the polymorphism of ISSR
markers were identical with those inferred by restriction
fragment length polymorphism (RFLP) and RAPD markers,
indicating the reliability of ISSR markers for estimation of
genotypes (Nagaoka & Ogihara, 1997). ISSR markers
succeeded in distinguishing most of 20 hexaploid, tetraploid
and diploid genotypes of wheat (Abou-Deif et al., 2013).

OSAMA M. SALEH ET AL., 1980
Morphological characterization and evaluation of the
diversity of wheat resources & landraces has been
extensively studied around the world (Buerkert et al., 2006;
Dotlacil et al., 2002; Al-Maskri et al., 2003). Anatomical
parameters may play an important role in plant taxonomy
(Metcalfe & Chalk, 1957). Anatomical characters have
proved to be more useful for delimitation of higher
taxonomic ranks, such as genera and families. There are a
large number of examples where anatomical parameters
have contributed in solving significant taxonomic problems
within different taxonomic groups (Carlquist, 1996;
Carlsward et al., 1997; Colombo & Spadaro, 2003; Scatena
et al., 2005; Satil & Selvi, 2007; Matias et al., 2007;
Schweingruber, 2007; Erxu et al., 2009; De la Estrella et
al., 2009; Zarrei et al., 2010). Stem mechanical strength is
an important characteristic of cereal breeding. The
flattening of cereal crops, known as lodging, can cause
large reductions in grain yield and quality (Berry et al.,
1998). The principal method to minimize growers lodging
is through the use of high mechanical strength cultivars.
Therefore, high mechanical stem strength is an object in
wheat breeding. There are many reports concerning stem
mechanical properties related to lodging resistance. Most of
the studies have mainly focused on morphological and
structural features of stem (Wang & Hu, 1991; Tripathi et
al., 2003; Wang & Li, 1997, 1998; Crook & Ennos, 1995),
physiological and developmental mechanisms of stem
strength (Tripathi et al., 2003), and measurement
technology (Berry et al., 2003; Kashiwagi & Ishimaru,
2004). However, some information on the relationship of
cell wall components and mechanical properties of stems is
available (Li et al., 2003). The importance of grain
morphology for classification has long been recognized
(Matias & Soares, 2009). Echlin, (1968) firstly used
Scanning Electron Microscopy (SEM) photographs of
grains of Arenaria, revealing the grain micro sculpturing
without taxonomic comments. Since then, SEM pictures
were used in systematic studies on different genera such as
Sagina (Crow, 1979), Arenaria (Wofford, 1981; Wyatt,
1984), Silene (Melzheimer, 1977; Greuter, 1995; Oxelman,
1995; Hong et al., 1999). To meet the demand for high
yielding and stress-resistant wheat cultivars, it is desirable
to increase the genetic base of this crop. Traditionally,
germplasm has been characterized based on agronomic and
morphological studies, but recently the use of molecular
markers to study diversity within domesticated species has
become common.
The objective of this study is to investigate the
genetic differences between some genotypes of
Egyptian durum wheat using molecular and traditional
techniques.
Materials and Methods
Grains of 8 durum wheat (Triticum durum L.)
cultivars; (Giza 203, Giza 409, Giza 413, Giza 823,
Beniswif 1, Beniswif 2, Sohag 1 and Sohag 2) were
obtained from the Agricultural Research Center (ARC),
Giza, Egypt.
Molecular identification
Genomic DNA extractions: DNeasyTM Plant Mini Kit
(Qiagen Inc., cat. no. 69104) was used for DNA isolation
from the leaves of the eight wheat cultivars.
Randomly amplified polymorphic DNA analysis
(RAPD): RAPD reactions were conducted according to
the method of Michelmore et al. (1991) using ten random
10-mer primers from Operon Technology (USA). Their
codes, sequences and GC % are shown in Table 1.
The amplification was carried for as follows: 4 min at
94°C/ for denaturation; followed by 40 cycles of 1 min at
94°C/, 1 min at 36°C/, 2 min at 72°C/; finally; l0 min at
72°C/ for extension. PCR products were migrated on
agarose (1.2%) according to Sambrook et al. (1989).
Inter-simple sequence repeats (ISSRs) amplification
analysis: An alternative method to SSRs, called inter-SSR
(ISSR), was used according to Zietkiewicz et al. (1994)
using seven primers. The thermal cycler was programmed
for three main steps as follows: 94°C /4 min. fordenaturation,
followed by 40 cycles of 1 min at 94°C/, 1 min at 55°C/, 1
min at 72°C/; finally; l0 min at 72°C/ for extension. PCR
products were migrated on agarose (1.2%) according to
Sambrook et al. (1989).
Table 2 shows the codes of these primers, their
sequences and GC%.
Data analysis: DNA fragments were detected and
photographed using Gel-Documentation 2000, Bio-Rad TM apparatus and analyzed by diversity database V.2.1.1.
Cluster analysis based on RAPD and ISSRs were carried
out using UPGMA computer program.
Table 2. Codes, sequences and GC% for the seven
primers used in ISSRs analysis.
No. Primer Sequences (5'→3') GC %
1. HB-09 GTG TGT GTG TGT GC 57%
2. HB10 GAGAGAGAGAGACC 57%
3. HB11 GTGTGTGTGTGTCC 57%
4. HB12 CAC CACCAC GC 73%
5. HB13 GAG GAGGAG GC 73%
6. HB14 CTCCTCCTCGC 73%
7. HB15 GTGGTGGTGGC 73%
Table 1. Primer names, their sequences and GC% used for RAPD analysis.
No. Primer name Sequences (5'→3') GC % No. Primer name Sequences (5'→3') GC %
1. OP-A07 GTAACCAGCC 60% 6. OP-C11 AAAGCTGCGG 60%
2. OP-A09 GGGTAACGCC 70% 7. OP-C18 TGAGTGGGTG 60%
3. OP-A10 GTGATCGCAG 60% 8. OP-D02 GGACCCAACC 70%
4. OP-B07 GGTGACGCAG 70% 9. OP-F04 GGTGATCAGG 70%
5. OP-B12 CCTTGACGCA 60% 10. OP-F08 GGGATATCGG 60%

MOLECULAR, MORPHOLOGICAL & ANATOMICAL CHARACTERIZATION OF WHEAT 1981
Grains micro morphology and stem & leaf anatomical
analyses
Grains micromorphology: Grains surface detailed scan attributes features were examined by Scanning Electronic Microscope (SEM) on copper stubs and coated with thin layer of gold in polaron E5000 sputter coater then examined by Joel-SMT330 SEM at an acceleration voltage of 20 kV. The magnification power was 50 μm for all photographs.
Anatomical analysis of stem and leaf: The segments of the organs from the middle part of fresh plants were separated, fixed and preserved in F.A.A (formalin 37% formaldehyde: 10m, glacial acetic acid: 5ml, ethanol 95%: 50 ml and distilled water: 35ml) for 48 hour then transfer to ethanol 70%. Stem and leaves sectioned at 10-20 μm using sliding microtome. Safranin, 2% and light green, 1% were used for double staining. Stem and leaves section examined under a light microscope (Olympus, BH2 REC, Tokyo, Japan) equipped with a digital camera (JVC, TK1280E, Japan) and an image analyzing system (Leica, Qwin, Cambridge, UK). The magnification power was 100 μm for all photographs.
Results
Molecular identification of durum wheat cultivars
Randomly amplified polymorphic DNA (RAPD) analysis: PCR-based methods using arbitrary primers have been widely used as fingerprinting techniques. Among these techniques, RAPD is a reliable and very useful method for cultivar identification and genomic analysis. In this study, ten arbitrary 10-meroligo-nucleotide primers were used to amplify the genomic DNA from the eight durum wheat cultivars.
Amplification of RAPD primers showed different
numbers of fragments ranged from six fragments (primers;
OP- A10 and OP- C11), seven fragments (primer; OP-
C18), nine fragments (primers; OP-A07, OP- A09, and OP-
D02), eleven fragments (primers; OP- B07 and OP- B12),
twelve fragments (primer; OP- F08) and thirteen fragments
(primer OP- F04). All these data are shown in Fig. 1.
Percentage of polymorphism ranged from 0% (primer;
OP- A10), 36.4% (primer; OP- B07), 44.4% (primer; OP-
A09), 50% (primer; OP- F08), 66.7% (primer; OP- D02),
69.2% (primer; OP- F04), 77.8% (primer; OP- A07),
81.8% (primer; OP- B12) and 100% (primers; OP- C11 and
OP- C18).
The results of the amplified fragments using RAPD
method with ten arbitrary 10-mer primers for the eight
durum wheat cultivars are presented in Table 3. The
number of total amplified fragments (TFA), polymorphic
fragments (PF) for each primer, amplified fragments (AF)
and specific marker (SM) for each genotype are shown in
Table 3.
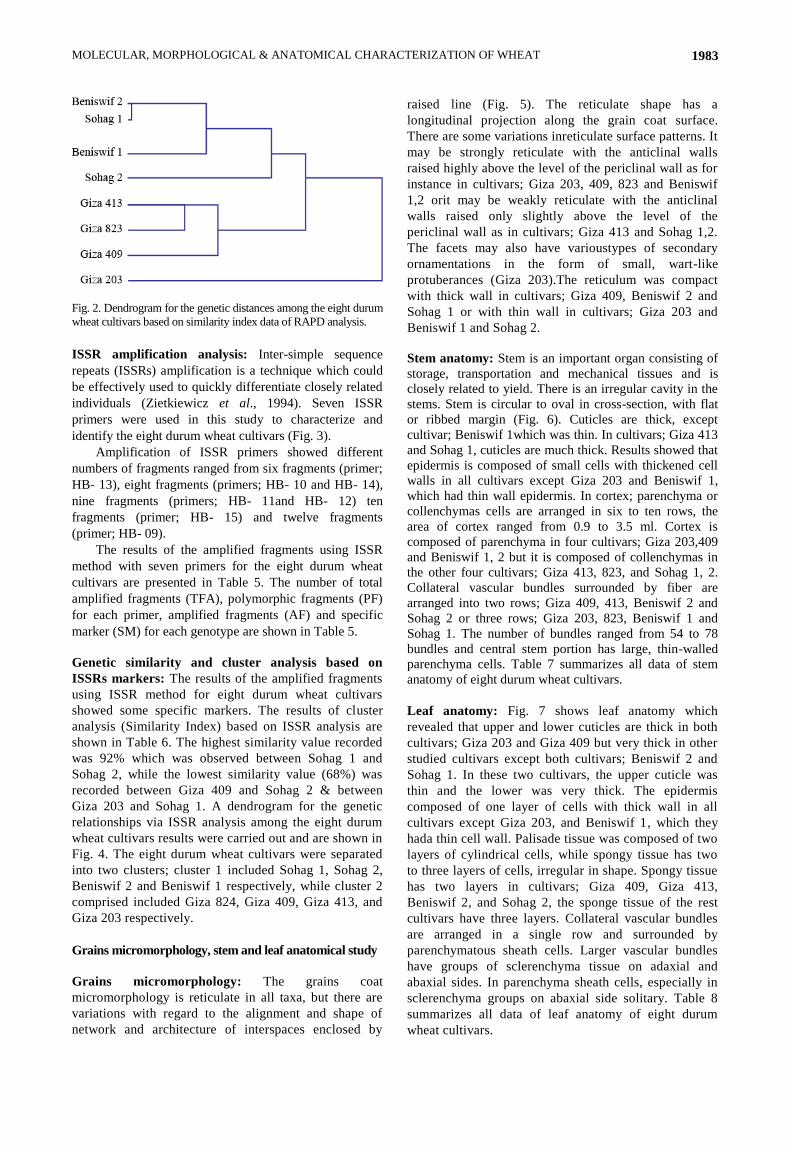
Genetic similarity and cluster analysis based on RAPD markers: The results of cluster analysis (Similarity Index) based on RAPD analysis are shown in Table 4. The highest similarity value recorded was 91% which was observed between Beniswif 2 and Sohag 1, while the lowest similarity value (69%) was recorded between Giza 203 and Sohag 2. A dendrogram for the genetic relationships via RAPD analysis among the eight durum wheat cultivars results were carried out and are shown in Fig. 2. The eight durum wheat cultivars were separated into two clusters; cluster 1 included Beniswif 2, Sohag 1, Beniswif 1 and Sohag 2 respectively, while cluster 2 comprised included Giza 413, Giza 824, Giza 409 and Giza 203 respectively.
Table 3. Number of amplified fragments and specific markers of the 8 durum wheat cultivars based on RAPD analysis.
Primers
Giza 203 Giza 409 Giza 413 Giza 823 Beniswif 1 Beniswif 2
Sohag
1
Sohag
2
TAF PF AF SM AF SM AF SM AF SM AF SM AF SM AF SM AF SM TSM
OP-A07 9 7 6 1 (-) 7 - 7 - 6 - 7 - 5 - 7 1(+) 4 - 3
OP-A09 9 4 6 1 (-) 9 1(+) 8 - 8 - 8 - 7 1 (-) 8 - 7 1 (-) 3
OP-A10 6 0 6 - 6 - 6 - 6 - 6 - 6 - 6 - 6 - 0
OP-B07 11 4 10 - 8 - 8 - 9 - 10 - 10 - 11 - 6 - 3
OP-B12 11 9 3 - 7 - 4 - 9 2(+) 2 - 5 - 9 - 5 - 2
OP-C11 6 6 3 - 3 - 4 - 4 - 3 - 2 1 (-) 3 - 2 - 1
OP-C18 7 7 4 1(+) 3 1(+) 1(-) 5 - 3 - 4 - 3 1 (-) 5 - 4 - 4
OP-D02 9 6 5 - 8 - 9 1(+) 7 - 6 - 5 - 6 - 4 - 1
OP-F04 13 9 6 - 7 - 8 - 10 - 10 1(+) 9 - 10 - 10 - 1
OP-F08 12 6 8 - 9 1 (+) 8 - 6 1 (-) 11 - 11 - 11 - 8 - 2
Total 93 58 57 3 67 4 67 1 68 3 67 1 63 3 76 1 56 1 20 TAF = Total amplified fragments, PF = Polymorphic fragment for each primer. AF = Amplified fragments. SM = Specific markers including either
the presence or absence of a fragment. TSM = Total number of specific markers.
Table 4. Similarity matrix among the 8 durum wheat cultivars based on RAPD analysis.
Giza 203 Giza 409 Giza413 Giza823 Beniswif 1 Beniswif 2 Sohag1
Giza 409 0.790
Giza 413 0.780 0.857
Giza 823 0.720 0.844 0.866
Beniswif 1 0.790 0.791 0.842 0.815
Beniswif 2 0.750 0.754 0.791 0.794 0.846
Sohag 1 0.752 0.797 0.831 0.847 0.867 0.906
Sohag 2 0.690 0.715 0.770 0.832 0.797 0.824 0.833

OSAMA M. SALEH ET AL., 1982
Fig. 1. DNA polymorphism using 10 primers for RAPD - PCR technique with the 8 durum wheat cultivars. Lanes a to h represent
cultivars; a; Giza203, b; Giza409, c; Giza413, d; Giza823, e; Beniswif1, f; Beniswif2, g; Sohag1, h; Sohag2 and M = 100 bp DNA
ladder. A= Primer; OP- A07, B= Primer; OP- A09, C= Primer; OP- A10, D= Primer; OP- B07, E= Primer; OP- B12, F= Primer; OP-
C11, G= Primer; OP- C18, H= Primer; OP- D02, I= Primer; OP- F04, J= Primer; OP- F08.
MOLECULAR, MORPHOLOGICAL & ANATOMICAL CHARACTERIZATION OF WHEAT 1983
Fig. 2. Dendrogram for the genetic distances among the eight durum
wheat cultivars based on similarity index data of RAPD analysis.
ISSR amplification analysis: Inter-simple sequence
repeats (ISSRs) amplification is a technique which could
be effectively used to quickly differentiate closely related
individuals (Zietkiewicz et al., 1994). Seven ISSR
primers were used in this study to characterize and
identify the eight durum wheat cultivars (Fig. 3).
Amplification of ISSR primers showed different
numbers of fragments ranged from six fragments (primer;
HB- 13), eight fragments (primers; HB- 10 and HB- 14),
nine fragments (primers; HB- 11and HB- 12) ten
fragments (primer; HB- 15) and twelve fragments
(primer; HB- 09).
The results of the amplified fragments using ISSR
method with seven primers for the eight durum wheat
cultivars are presented in Table 5. The number of total
amplified fragments (TFA), polymorphic fragments (PF)
for each primer, amplified fragments (AF) and specific
marker (SM) for each genotype are shown in Table 5.
Genetic similarity and cluster analysis based on
ISSRs markers: The results of the amplified fragments
using ISSR method for eight durum wheat cultivars
showed some specific markers. The results of cluster
analysis (Similarity Index) based on ISSR analysis are
shown in Table 6. The highest similarity value recorded
was 92% which was observed between Sohag 1 and
Sohag 2, while the lowest similarity value (68%) was
recorded between Giza 409 and Sohag 2 & between
Giza 203 and Sohag 1. A dendrogram for the genetic
relationships via ISSR analysis among the eight durum
wheat cultivars results were carried out and are shown in
Fig. 4. The eight durum wheat cultivars were separated
into two clusters; cluster 1 included Sohag 1, Sohag 2,
Beniswif 2 and Beniswif 1 respectively, while cluster 2
comprised included Giza 824, Giza 409, Giza 413, and
Giza 203 respectively.
Grains micromorphology, stem and leaf anatomical study
Grains micromorphology: The grains coat
micromorphology is reticulate in all taxa, but there are
variations with regard to the alignment and shape of
network and architecture of interspaces enclosed by
raised line (Fig. 5). The reticulate shape has a
longitudinal projection along the grain coat surface.
There are some variations inreticulate surface patterns. It
may be strongly reticulate with the anticlinal walls
raised highly above the level of the periclinal wall as for
instance in cultivars; Giza 203, 409, 823 and Beniswif
1,2 orit may be weakly reticulate with the anticlinal
walls raised only slightly above the level of the
periclinal wall as in cultivars; Giza 413 and Sohag 1,2.
The facets may also have varioustypes of secondary
ornamentations in the form of small, wart-like
protuberances (Giza 203).The reticulum was compact
with thick wall in cultivars; Giza 409, Beniswif 2 and
Sohag 1 or with thin wall in cultivars; Giza 203 and
Beniswif 1 and Sohag 2.
Stem anatomy: Stem is an important organ consisting of
storage, transportation and mechanical tissues and is
closely related to yield. There is an irregular cavity in the
stems. Stem is circular to oval in cross-section, with flat
or ribbed margin (Fig. 6). Cuticles are thick, except
cultivar; Beniswif 1which was thin. In cultivars; Giza 413
and Sohag 1, cuticles are much thick. Results showed that
epidermis is composed of small cells with thickened cell
walls in all cultivars except Giza 203 and Beniswif 1,
which had thin wall epidermis. In cortex; parenchyma or
collenchymas cells are arranged in six to ten rows, the
area of cortex ranged from 0.9 to 3.5 ml. Cortex is
composed of parenchyma in four cultivars; Giza 203,409
and Beniswif 1, 2 but it is composed of collenchymas in
the other four cultivars; Giza 413, 823, and Sohag 1, 2.
Collateral vascular bundles surrounded by fiber are
arranged into two rows; Giza 409, 413, Beniswif 2 and
Sohag 2 or three rows; Giza 203, 823, Beniswif 1 and
Sohag 1. The number of bundles ranged from 54 to 78
bundles and central stem portion has large, thin-walled
parenchyma cells. Table 7 summarizes all data of stem
anatomy of eight durum wheat cultivars.
Leaf anatomy: Fig. 7 shows leaf anatomy which
revealed that upper and lower cuticles are thick in both
cultivars; Giza 203 and Giza 409 but very thick in other
studied cultivars except both cultivars; Beniswif 2 and
Sohag 1. In these two cultivars, the upper cuticle was
thin and the lower was very thick. The epidermis
composed of one layer of cells with thick wall in all
cultivars except Giza 203, and Beniswif 1, which they
hada thin cell wall. Palisade tissue was composed of two
layers of cylindrical cells, while spongy tissue has two
to three layers of cells, irregular in shape. Spongy tissue
has two layers in cultivars; Giza 409, Giza 413,
Beniswif 2, and Sohag 2, the sponge tissue of the rest
cultivars have three layers. Collateral vascular bundles
are arranged in a single row and surrounded by
parenchymatous sheath cells. Larger vascular bundles
have groups of sclerenchyma tissue on adaxial and
abaxial sides. In parenchyma sheath cells, especially in
sclerenchyma groups on abaxial side solitary. Table 8
summarizes all data of leaf anatomy of eight durum
wheat cultivars.

OSAMA M. SALEH ET AL., 1984
Fig. 3. DNA polymorphism using 7 primers for ISSR technique with the eight durum wheat cultivars. Lanes a to h represent cultivars;
a; Giza 203, b; Giza 409, c; Giza 413, d; Giza 823, e; Beniswif 1, f; Beniswif 2, g; Sohag 1, h; Sohag 2 and M = 100 bp DNA ladder.
A= Primer; HB09, B= Primer; HB10, C= Primer; HB11, D= Primer; HB12, E= Primer; HB13, F= Primer; HB14, G= Primer; HB15.
Table 5. Number of amplified fragments and specific markers of the 8 durum wheat cultivars based on ISSR analysis.
Primers Giza 203 Giza 409 Giza 413 Giza 823 Beniswif 1 Beniswif 2 Sohag 1 Sohag 2
TAF PF AF SM AF SM AF SM AF SM AF SM AF SM AF SM AF SM TSM
HB-09 12 6 8 - 8 - 10 - 11 - 10 - 10 - 10 - 11 - -
HB-10 8 6 4 1 (-) 5 - 5 - 5 - 7 - 6 - 6 - 7 - 1
HB-11 9 6 6 - 9 - 9 - 7 - 5 - 6 - 8 - 3 1 (-) 1
HB-12 9 3 9 - 8 - 9 - 8 - 9 - 7 - 7 1 (-) 8 - 1
HB-13 6 3 3 - 3 - 5 - 5 1(+) 4 - 4 - 5 - 5 - 1
HB-14 8 7 3 - 6 1 (-) 7 1(+) 5 - 4 - 6 1 (-) 4 - 4 - 2
HB-15 10 8 6 1(+) 5 1(+) 3 1 (-) 5 - 6 1 (-) 9 - 9 - 9 - 2
Total 62 39 39 2 44 2 48 2 46 1 45 1 48 1 49 1 47 1 8 TAF = Total amplified fragments. PF = Polymorphic fragment for each primer. AF = Amplified fragments. SM = Specific markers including either the presence or absence of a fragment. TSM = Total number of specific markers.

MOLECULAR, MORPHOLOGICAL & ANATOMICAL CHARACTERIZATION OF WHEAT 1985
Table 6. Similarity matrix among the 8 durum wheat cultivars based on ISSR analysis.
Giza 203 Giza 409 Giza 413 Giza 823 Beniswif 1 Beniswif 2 Sohag 1
Giza 409 0.867
Giza 413 0.805 0.870
Giza 823 0.824 0.822 0.830
Beniswif 1 0.810 0.742 0.774 0.813
Beniswif 2 0.736 0.739 0.771 0.851 0.860
Sohag 1 0.682 0.710 0.784 0.821 0.830 0.907
Sohag 2 0.721 0.681 0.737 0.839 0.891 0.905 0.917
Table 7. Stem anatomical structure ofeight durum wheat cultivars.
Characters
Cultivars
Cuticle Epidermis Cortex Vascular bundles
Size(mm) Structure Size (mm) Structure Size (mm) Structure Number Structure
Giza 203 0.1 Thick 0.1-0.3 Thin 0.9-2.0 Parenchyma 72 3 rows
Giza 409 0.15 Thick 0.2-0.4 Thick 2.0-3.5 Parenchyma 54 2 rows
Giza 413 0.1 Very thick 0.15-0.4 Thick 1.3-2.3 Chollenchyma 62 2 rows
Giza 823 0.15 Thick 0.15-0.5 Thick 1.5-2.5 Chollenchyma 56 3 rows
Beniswif 1 0.1 Thin 1.5-0.3 Thin 1.3-2.3 Parenchyma 62 3 rows
Beniswif 2 0.1 Thick 0.1-0.3 Thick 1.2-1.6 Parenchyma 58 2 rows
Sohag 1 0.1 Thick 0.15-0.5 Thick 1.7-3.0 Chollenchyma 78 3 rows
Sohag 2 0.15 Very thick 0.15-0.3 Thick 1.4-4.0 Chollenchyma 73 2 rows
Table 8. Leaf anatomical structure of eight durum wheat cultivars.
Characters
Cultivars
Cuticle Epidermis Palisade tissue Sponge tissue
Size (mm) Structure Size
(mm) Structure
Size
(mm) Structure
Size
(mm) Structure
Giza 203 0.05-0.1 Thick 0.4-1.5 Thin 1.3-2 2 row 1.5-2 3 rows
Giza 409 0.05-0.1 Thick 0.2-0.4 Thick 1.5-2.5 2 row 2-3 2 rows
Giza 413 0.05-0.15 Very thick 0.3-1.5 Thick 1-2 2 row 2-3 2 rows
Giza 823 0.05-0.15 Very thick 0.2-1.1 Thick 1.5-2.3 2 row 2-2.5 3 rows
Beniswif 1 0.05-0.15 Very thick 0.3-0.5 Thin 1-2.5 2 row 3-4.5 3 rows
Beniswif 2 0.05-0.15 Upper thin, lower very thick 0.2-0.5 Thick 1-1.5 2 row 1-1.5 2 rows
Sohag 1 0.05-0.15 Upper thin, lower very thick 0.5-1.5 Thick 1.5-2.5 2 row 2-2.5 3 rows
Sohag 2 0.05-0.15 Very thick 0.2-1.1 Thick 2-2.5 2 row 2-2.5 2 rows
Fig. 4. Dendrogram for the genetic distances among the eight durum
wheat cultivars based on similarity index data of ISSR analysis.
Discussion
The introduction of molecular markers in plant breeding has presented a valuable tool for the characterization of genetic materials (Aliyev et al., 2007). However, there are genetic structure changes in the populations and genetic variations in the individuals at the molecular level (Yuhan et al., 2015).The genetic similarity values calculated from RAPD markers were very similar to those calculated with RFLP markers for intra specific comparisons of 49 diploid wheat accessions (Castagna et al., 1997). Knowledge of genetic diversity within as well as genetic relatedness among populations from different geographic areas is expected to have a significant impact on the conservation and utilization programs of emmer germplasm (Teklu et al., 2007). Our data is in agreement with (Karaca & Izbirak, 2008) whose used 42 RAPD and 18 ISSR primers to characterize the genetic relationship among 25
durum wheat cultivars. Guasmi et al. (2012), reported that RAPD and ISSR techniques are very useful to assay the genetic diversity among 80 barley specimens and the percentage of polymorphism was 66.67%. In our data, similarity of ISSR ranged between 68% and 91% while it was 77% (Zamanianfard et al., 2015) among 25 durum genotypes examined, 84.4% (Abou-Deif et al., 2013) among 20 wheat cultivars and 83% (Shirnasabian et al., 2014) via 18 durum wheat cultivars. The use of the Scanning Electron Microscopy (SEM) in the study of seeds has revealed a great variation in seed coat micromorphology and allowed the description of a number of morphological features, for these, comparison with seeds of closely related. The use of microscopic methods and anatomical characteristics can supply useful information to differentiate between cultivars. The importance of seed morphology for classification has long been recognized (Matias & Soares, 2009). Few SEM studies have been concerned with the fine structural differences in taxonomical and morphological features of closely related species, especially within groups of plants of the same species (Liu et al., 2005; Joshi et al., 2008).Also Minuto et al. (2006) used seed micromorphological characters to compare between taxa within the caryophyllaceae. While, Silva et al. (2012) used leaves epidermis to differentiate between ten Solanum species. Characters of the leaf, such as the epidermis, stomata and indumentums characters, have proved to be much more reliable for taxonomic considerations in many genera (Dickison, 2000; Yang & Lin, 2005; Strgulc-Krajsek et al., 2006).The layers of each cross section of leaf mesophyll differed according to the taxa (Gowayed, 2003).

OSAMA M. SALEH ET AL., 1986
Giza 203
Giza 409
Giza 413
Giza 823
Beniswif1
Beniswif2
Sohag1
Sohag2
Fig. 5. SEM of grains surface micro morphology of eight durum wheat cultivars.
Giza 203
Giza 409
Giza 413
Giza 823
Beniswif1
Beniswif2
Sohag1
Sohag2
Fig. 6. Light micrographs of stem cross section of eight durum wheat cultivars.
Giza 203
Giza 409
Giza 413
Giza 823
Beniswif1
Beniswif2
Sohag 1
Sohag 2
Fig. 7. Light micrographs of leaf anatomy of eight durum wheat cultivars.
50 µm
50 µm
100 µm
100 µm

MOLECULAR, MORPHOLOGICAL & ANATOMICAL CHARACTERIZATION OF WHEAT 1987
Conclusion
Detection of genetic relationship is very useful for
breeders to know the best relation between cultivars for
breeding programs to obtain the best hybrid with
improved characters specially yield to cover increased
consumption all over the world. Phylogenetic
relationships detected the percentage of similarity
between cultivars and these molecular results supported
by morphological and anatomical results. Data from
phylogeny suggests the possible hybridizations may be
done between different Egyptian durum cultivars.
References
Abou-Deif, M.H., M.A. Rashed, M.A.A. Sallam, E.A.H.
Mostafa and W.A. Ramadan. 2013. Characterization of
twenty wheat varieties by ISSR markers. Middle-East J. of
Scientific Res., 15: 168-175. Aliyev, R.T., M.A. Abbasov and A.C. Mammadov. 2007.
Genetic identification of diploid and tetraploid wheat
species with RAPD markers. Turk. J. Biol., 31: 173-180.
Al-Maskri, A., M. Nagieb, K. Hammer, A.A. Filatenko, I. Khan
and A. Buerkert. 2003. A note about Triticum in Oman.
Genet.Resour. Crop Evol., 50: 83-87.
Anonymous. 2003. FAO Statistical Databases.http://apps.fao.org/.
Berry, P.M., J. Spink and M. Sterling. 2003. Methods for rapidly
measuring the lodging resistance of wheat cultivars. J.
Agron. Crop Sci., 189: 390-401.
Berry, P.M., J.H. Spink and J.M. Griffin. 1998. Research to
understand, predict and control factors affecting lodging in
wheat. Home-Grown Cereals Authority Research Project
No. 169. HGCA, London.
Boggini, G., M. Palumbo and F. Galcagno. 1990. Characterization
and utilization of sicilian landraces of durum wheat in
breeding programmes. Wheat Gen. Res., 223-234.
Bretting, P.K. and M.P. Widrlechner. 1995. Genetic markers and
plant genetic resources. Plant Breed. Rev., 13: 11-86.
Buerkert, A., M. Oryakhail, A.A. Filatenko and K. Hammer.
2006. Cultivation and taxonomic classification of wheat
landraces in the upper Panjsher Valley of Afghanistan after
23 years of war. Genet. Resour. Crop Evol., 53: 91-97.
Carlquist, S. 1996. Wood, bark and stem anatomy of Gnetales: a
summary. Int. J. Plant Sci., 157: S58-S76.
Carlsward, B.S., W.L. Stern, W.S. Judd and T.W. Lucansky. 1997.
Comparative leaf anatomy and systematics in Dendrobium,
sections Aporum and Rhizobium (Orchidaceae). Int. J. Plant
Sci., 158: 332-342.
Carvalho, A., J.L. Brito, B. Macas and H.G. Pinto. 2008a.
Genetic variability analysis of a collection of old
Portuguese bread wheat using ISSRs. Options
Mediterraneennes. Ser. A. Sem. Medit., 81: 35-38.
Carvalho, A., J.L. Brito, B. Macas and H.G. Pinto. 2008b.
Molecular characterization of a Portuguese collection of
durum wheat. Options, Mediterraneennes. Ser. A, Sem.
Medit., 81: 59-61.
Carvalho, A., J.L. Brito, B. Macas and H.G. Pinto. 2009.
Genetic diversity and variation among botanical varieties of
old Portuguese wheat cultivars revealed by ISSR assays.
Biochem. Genet., 47: 276-294.
Castagna, R., S. Gnocchi, M. Perenzin and M. Heun. 1997.
Genetic variability of the wild diploid wheat Triticumurartu
revealed by RFLP and RAPD markers. Theor. Appl.
Genetics, 94: 424-430.
Chowdhury, M.A. and A.E. Slinkard. 2000. Genetic diversity in
grass pea (Lathyrus sativus L.). Genet. Resour. Crop Evol.,
47: 163-169.
Chowdhury, R.M.V.K., S.J.S. Kundu and R.K. Jain. 2008.
Applicability of ISSR markers for genetic diversity
evaluation in Indian bread wheat genotypes of known
origin. Environ. Ecol., 26: 126-131.
Cimmyt. 2003. Wheat in developing world. http://www.cimmyt.org.
Colombo, P. and V. Spadaro. 2003. Anatomical studies on the
Sicilian helianthemum (Cistaceae). Flora Medit., 13: 205-218.
Crook, M.J. and A.R. Ennos. 1995. The effect of nitrogen and
growth regulators on stem and root characteristics
associated with lodging in two cultivars of winter wheat. J.
Exp. Bot., 46: 931-938.
Crow, G.E. 1979. The systematic significance of seed
morphology in Sagina (Caryophyllaceae) under scanning
electron microscopy. Brittonia, 31: 52-63.
De la Estrella, M., C. Aedo and M. Velayos. 2009. A
morphometric analysis of Daniellia (Fabaceae–
Caesalpinioideae). Bot. J. Linn Soc., 159: 268-279.
Dickison, W.C. 2000. Integrative plant anatomy. Academic
Press, San Diego. Dotlacil, L., E. Gregova, J. Hermuth, Z. Stehno and J. Kraic.
2002. Diversity of HMW-Glu alleles and evaluation of their
effects on some characters in winter wheat landraces and old
cultivars. Czech J. Genet. Plant Breed., 38: 109-116.
Echlin, P. 1968. The use of scanning reflection electron
microscope in the study of plant and microbial material. J.
Roy. Microscop. Soc. London, 88: 407-418.
El-Assal, S.E.D. and A. Gaber. 2012. Discrimination capacity of
RAPD, ISSR and SSR markers and their effectiveness in
establishing genetic relationship and diversity among Egyptian
and Saudi wheat cultivars. Am. J. Appl. Sci., 9: 724-735.
Erxu, P., P. Qiufa, L. Hongfei, S. Jingbo, D. Yueqiang, H. Feilai
and H. Hui. 2009. Leaf morphology and anatomy of
Camellia section Camellia (Theaceae). Bot. J. Linn Soc.,
159: 456-476.
Gowayed, S.M.H. 2003. Some botanical studies on Triticum
genus. Thesis of M.Sc., Suez Canal Uni., Ismailia, Egypt.
Greuter, W. 1995. Silene (Caryophyllaceae) in Greece: a sub
generic and sectional classification. Taxon., 44: 543-581.
Guasmi, F., W. Elfalleh, H. Hannachi, K. Feres, L. Touil, N.
Marzougui, T. Triki and A. Ferchichi. 2012. The Use of
ISSR and RAPD markers for genetic diversity among south
Tunisian barley. ISRN Agron., 2012: 1-9.
Hong, S.P., M.J. Han and K.J. Kim. 1999. Systematic significance
of seed coat morphology in Silene L. s. str. (Silenenae-
Caryophyllaceae) from Korea. J. P. Biol., 42: 146-150.
Joshi, C.P. and H.T. Nguyen. 1993. Application of the random
amplified polymorphic DNA technique for the detection of
polymorphism among wild and cultivated tetraploid wheat.
Genome, 36: 602-609.
Joshi, M., K. Sujatha and S. Harza. 2008. Effect of TDZ and 2,4-D
on peanut somatic embryogenesis and in vitro bud
development. Plant Cell, Tissue and Organ Culture, 94: 85-90.
Karaca, M. and A. Izbirak. 2008. Comparative analysis of genetic
diversity in Turkish durum wheat cultivars using RAPD and
ISSR markers. J. Food Agric. Environ., 6: 219-225.
Kashiwagi, T. and K. Ishimaru. 2004. Identification and
functional analysis of a locus for improvement of lodging
resistance in rice. Plant Physiol., 134: 676-683.
Li, Y.H., Q. Qian and Y.H. Zhou. 2003. Brittle Culm1, which
encodes a COBRA-like protein, affects the mechanical
properties of rice plants. Plant Cell, 15: 20-25.
Liu, Q., N.N. Zhao, G. Hao, X.Y. Hu and Y.X. Liu. 2005.
Caryopses morphology of the Chloridoideae (Gramineae) and
its systematic implications. Bot. J. Linn. Soc., 148: 57-72.
Matias, L.Q. and G. Soares. 2009. Morphology and
micromorphology of the seed coats of speciesofEchinodorus
(Alismataceae) from Brazilian Northeastern. Bol. Mus. Para.
EmílioGoeldi. Cienc. Nat., Belém, 4(2): 165-173.

OSAMA M. SALEH ET AL., 1988
Matias, L.Q., A. Soares and V.L. Scatena. 2007. Systematic
consideration of petiole anatomy of species of Echinodorus
Richard (Alismataceae) from north-eastern Brazil. Flora.,
202: 395-402.
Melzheimer, V. 1977. Biosystematis cherevisioneiniger Silene-
Arten (Caryophyllaceae) der Balkanhalbinsel (Griechenland).
Bot. Jahrb. Syst., 98: 1-92.
Metcalfe, C.R. and L. Chalk. 1957. Anatomy of the dicotyledons.
Vol. I. Clarendon Press, Oxford, pp: 502-535.
Michelmore, R.W., I. Psaran and R.V. Kesseli. 1991.
Identification of markers linked to disease-resistance genes
by bulked segregate analyses. A rapid method to detect
markers in specific region by using segregating
population.Proc. Nat. Acad. Sci., 88: 9828-9832.
Minuto, L., S. Fior, E. Roccotiello and G. Casazza. 2006. Seed
morphology in Moehringia L. and its taxonomic
significance in comparative studies within the
Caryophyllaceae. Pl. Syst. Evol., 262: 189-208.
Nagaoka, T. and Y. Ogihara. 1997. Applicability of inter-simple
sequence repeat polymorphisms in wheat for use as DNA
markers in comparison to RFLP and RAPD markers.
Theor. Appl. Genet., 94: 597-602.
Najaphy, A., R.A. Parchin and E. Farshadfar. 2012. Comparison
of phenotypic and molecular characterizations of some
important wheat cultivars and advanced breeding lines.
Aust. J. Crop Sci., 6: 326-332.
Oxelman, B. 1995. A revision of the silenesedoides-group
(Caryophyllaceae). Willdenowia, 25: 143-169.
Pasqualone, A., C. Lotti, A. Bruno, P. Vita, N. Fonzo and A.
Blanco. 2000. Use of ISSR markers for cultivar
identification in durum wheat. Options, Mediterraneennes.
Ser. A., Sem. Medit., 40: 157-161.
Sambrook, J., E.F. Fritch and T. Maniatis. 1989. Molecular
cloning a laboratory manual. Cold Spring Harbore
laboratory press.
Satil, F. and S. Selvi. 2007. An anatomical and ecological study
of some Crocus L. taxa (Iridaceae) from the west part of
Turkey. Acta Bot. Cro., 66: 25-33.
Scatena, V.L., A.M. Giulietti, E.L. Borba and C. Van den Berg.
2005. Anatomy of Brazilian Eriocaulaceae: correlation with
taxonomy and habitat using multivariate analyses. Plant
Syst. Evol., 253: 1-22.
Schweingruber, F.H. 2007. Stem anatomy of Caryophyllaceae.
Flora., 202: 281-292.
Serret, M.D., S.M. Udupa and F. Weigand. 1997. Assessment of
genetic diversity of cultivated chickpea using microsatellite
derived RFLP markers: implications for origin. Plant
Breed., 116: 573-578.
Shirnasabian, S., A. Etminan, R. Mohammadi and L. Shooshtari.
2014. Molecular variation of improved durum wheat
genotypes based on inter-simple sequence repeats
fingerprinting. International J. of Biosciences, 5: 222-228.
Silva, K.N., R.C. Silva, I.J.L.D. Basílio and M.F. Agra. 2012.
Leaf epidermal characters of Brazilian species of Solanum
section Torva as taxonomic evidence. Botany, 90: 806-814.
Sofalian, O., N. Chaparzadeh and M. Dolati. 2009. Genetic
diversity in spring wheat landraces from northwest of Iran
assessed by ISSR markers. Notul. Bot. Hort. Agric., Cluj-
Napoca, 37: 252-256.
Sofalian, O., N. Chaparzadeh, A. Javanmard and M.S. Hejazi.
2008. Study the genetic diversity of wheat landraces from
northwest of Iran based on ISSR molecular markers. Int. J.
Agric. Biol., 10: 466-468.
Strgulc-Krajsek, S., M. Dermastia and N. Jogan. 2006.
Determination key for Central European Epilobium species
based on trichome morphology. Bot. Helv., 116: 169-178. Teklu, Y., K. Hammer and M.S. Roder. 2007. Simple sequence
repeats marker polymorphism in emmer wheat (Triticum
dicoccon Schrank): analysis of genetic diversity and
differentiation. Genet Resour. Crop. Evol., 54: 543-554.
Tripathi, S.C., K.D. Sayre and J.N. Kaul. 2003. Growth and
morphology of spring wheat (Triticum aestivum L.) culms
and their association with lodging: effects of genotypes, N
levels and ethephon. Field Crops Res., 84: 271-290.
Wang, Q.Y. and C.H. Hu. 1991. Studies on the anatomical
structures of the stalks of maize with different resistance to
lodging, Acta Agron. Sin., 17: 70-75.
Wang, Y. and C.H. Li. 1997.The primary research on wheat
culm quality. J. Triticeae Crops, 17: 28-31.
Wang, Y. and Q.Q. Li. 1998.Studies on culm quality and the
anatomy of wheat varieties, Acta Agron. Sin., 24: 452-458.
Wofford, B.E. 1981. External seed morphology of Arenaria
(Caryophyllaceae) of the south eastern United States. Syst.
Bot., 6: 126-135.
Wyatt, R. 1984. Intraspecific variation in seed morphology of
Arenariauniflora (Caryophyllaceae). Syst. Bot., 9: 423-431.
Yang, W., A.C. Olivera, I. Godwin, K. Schertz and J.L.
Bennetzen. 1996. Comparison of DNA marker technologies
in characterizing plant genome diversity: variability in
Chinese sorghums. Crop Sci., 36: 1669-1676.
Yang, Z.R. and Q. Lin. 2005.Comparative morphology of the
leaf epidermis in schisandra (Schisandraceae). Bot. J. Linn.
Soc., 148: 39-56. Yuhan, S., Y. Zhang, C. Yuan, Q. Yang,C. Long, Y. Li and M.
Yang. 2015. Assessment of genetic diversity and variation
of Acer monomax seedlings after spaceflight. Pak. J. Bot.,
47: 197-202.
Zafar I., R. Naeem, M. Ashraf, M. Arshad, A. Afzal, A.H. Shah,
M.S. Khan and M. Farooq. 2015. Genetic diversity of
soybean accessionsusing seed storage proteins. Pak. J. Bot.,
47: 203-209.
Zamanianfard, Z., A. Etminan, R. Mohammadi and L.
Shooshtari. 2015. Evaluation of molecular diversity of
durum wheat genotypes using ISSR markers. Biological
Forum – An International J., 7: 214-218.
Zarrei, M., P. Wilkin, M.J. Ingrouille, S. Zarre and M.W. Chase.
2010. The systematic importance of anatomical data in
Gagea (Liliaceae) from the Flora Iranica area. Bot. J. Linn.
Soc., 164: 155-177.
Zietkiewicz, E., A. Rafalski and D. Labuda. 1994. Genome
fingerprinting by simple sequence repeat (SSR)-anchored
polymerase chain reaction amplification. Genomics, 20:
118-176.
(Received for publication 6 August 2015)