
MOLECULAR AND FUNCTIONAL CHARACTERISATION OF AN … Thuy Trang_Le... · 2018-01-30 · Molecular...
287
Molecular and Functional Characterisation of an Osmotin Gene from the Resurrection Plant Tripogon loliiformis MOLECULAR AND FUNCTIONAL CHARACTERISATION OF AN OSMOTIN GENE FROM THE RESURRECTION PLANT TRIPOGON LOLIIFORMIS By Thi Thuy Trang LE BSc of Agronomy (Hons.) MSc of Plant Science Submitted in fulfilment of the requirements for the degree of Doctor of Philosophy at the Centre for Tropical Crops and Biocommodities Science and Engineering Faculty Queensland University of Technology 2018
Transcript of MOLECULAR AND FUNCTIONAL CHARACTERISATION OF AN … Thuy Trang_Le... · 2018-01-30 · Molecular...

Molecular and Functional Characterisation of an Osmotin Gene from the Resurrection Plant Tripogon
loliiformis 1
MOLECULAR AND FUNCTIONAL
CHARACTERISATION OF AN OSMOTIN
GENE FROM THE RESURRECTION PLANT
TRIPOGON LOLIIFORMIS
By
Thi Thuy Trang LE
BSc of Agronomy (Hons.)
MSc of Plant Science
Submitted in fulfilment of the requirements for the degree of
Doctor of Philosophy
at the
Centre for Tropical Crops and Biocommodities
Science and Engineering Faculty
Queensland University of Technology
2018

2 Molecular and Functional Characterisation of an Osmotin Gene from the Resurrection Plant Tripogon
loliiformis
Intentionally blank

Molecular and Functional Characterisation of an Osmotin Gene from the Resurrection Plant Tripogon loliiformis i
Keywords
Abiotic stress, Agrobacterium-mediated transformation, Agro-infiltration, BiFC,
cell membrane integrity, co-localisation, cold stress, cold tolerance, confocal
microscopic analysis, Coomassie stain, drought stress, drought tolerance, dry biomass,
electrolyte leakage, embryogenic callus, EYFP, genetic engineering, GO term
enrichment, Gus-reporter gene, Gus stain, His tag, hygromycin resistant marker,
infiltration, KDEL, leaf damage, morphology, membrane protein tracker, Myc, NaCl,
Nicotiana benthamiana, Nicotiana tabacum, Oryza sativa, osmotin, panicle length,
plasmid cloning, photosynthesis, protein extraction, protein microarray, protein-
protein interaction, protein purification, protein structure, qRT-PCR, recombinant
proteins, resurrection plant, rice, ROS, RWC, salinity stress, salinity stress tolerance,
transcriptional expression, transgenic plant, transient expression, Tripogon loliiformis,
Ubi promoter, yield component.

ii Molecular and Functional Characterisation of an Osmotin Gene from the Resurrection Plant Tripogon
loliiformis

Molecular and Functional Characterisation of an Osmotin Gene from the Resurrection Plant Tripogon
loliiformis iii
Abstract
Abiotic stresses such as drought, salinity, and extreme temperature are key
factors that limit crop productivity and are major constraints to meeting global food
demands. The development of stress-tolerant crops that mitigate the effects of abiotic
stresses on crop productivity is crucially needed to sustain agricultural production. The
narrow genetic variation of stress-tolerant traits among crops and sexual barrier
between species have restricted the success of developing stress-tolerant crops by
conventional breeding. Genetic engineering of crops with stress-tolerant traits is a
promising approach for improving stress tolerance in crops. Prior to the development
of stress tolerant crops by genetic engineering, it is essential that key genes regulating
stress-tolerant traits are characterised.
Stress-tolerant traits in plants are genetically coded. Naturally tolerant species,
such as the resurrection plant Tripogon loliiformis, represent an ideal starting point for
the identification of genes encoding stress-tolerant traits. T. loliiformis has evolved
mechanisms to tolerate extreme dehydration down to 4% relative water content
(RWC), facilitate cellular protection and survival during desiccation, and to rapidly
recover within 48-72 h of rehydration to full metabolic activity. These mechanisms
hold great potential for the introduction into crop species. It is important to identify
the key regulators of these stress-tolerance mechanisms for effective transfer of stress-
tolerant traits into crop species.
This PhD study describes the molecular characterisation of an osmotin gene
(TlOsm) from the desiccation tolerant plant T. loliiformis. The conserved and novel
characteristics of TlOsm were identified in comparison with two osmotins, OsOlp1_A
from a drought-tolerant cultivar and OsOlp1_I from a drought-sensitive cultivar, of the
stress sensitive species Oryza sativa (rice). Protein structural-to-functional predictions,
the response of transgenic rice plants constitutively expressing each of the osmotins to
cold, drought, and salinity stress, and the profiles of plant proteins interacting with
three osmotins on the Arabidopsis protein microarrays (chip) and in living Nicotiana
benthamiana plants were analysed. The results revealed the common and unique
characteristics of TlOsm, the profiles of TlOsm protein interactors, possible

iv Molecular and Functional Characterisation of an Osmotin Gene from the Resurrection Plant Tripogon
loliiformis
pathways involving TlOsm, and functional roles of TlOsm in enhanced rice
tolerance to cold, drought, and salinity stresses. The results highlight the higher
functional efficacy of TlOsm, compared to rice osmotins, in regulating plant response
to stress, indicate the potential use of TlOsm for developing crops tolerant to multiple
abiotic stresses, and provide useful information for elucidating molecular mechanisms
underlying osmotin functions in regulating plant response to stress.
Transcriptional profiling of TlOsm during T. loliiformis plant development and
on exposure to cold, heat, drought, and salinity stresses indicated that TlOsm was
induced up to a thousand fold upon cold, drought, and salinity stresses. The plasma
membrane localisation of TlOsm was observed by confocal microscopy of transgenic
Nicotiana tabacum expressing Enhanced Yellow Fluorescent Protein (EYFP)-tagged
TlOsm. Sequence analysis of TlOsm revealed its conserved characteristics of an
osmotin, the close genetic relationship with monocotyledonous osmotins, and a
sequence of 50 AA at its C-terminus that is not homologous to other osmotins.
Analyses based on structural-to-functional predictions, compared to two rice osmotins,
revealed that TlOsm had more glucan-binding and phosphorylation sites than rice
osmotins and four binding sites with enzymatic functions in sugar metabolism, which
did not exist in either of rice osmotins.
The effects of TlOsm, OsOlp1_A, and OsOlp1_I on enhancing plant tolerance to
cold, drought, and salinity stress were compared in transgenic rice expressing each of
the osmotin gene. Agrobacterium-mediated transformation was used to generate 42
transgenic rice lines expressing TlOsm, OsOlp1_A, OsOlp1_I, or the Gus reporter
gene. Transgenic plants of two successive generations were assessed for enhanced
tolerance to cold, drought, and salinity stresses. The results demonstrate the capacity
of TlOsm and OsOlp1_A to enhance rice tolerance to cold, drought, and salinity
stresses and emphasise the additional efficacy of TlOsm. The tolerant traits passed on
to the next generation. The results suggest a positive correlation between functional
binding sites of the osmotins and the levels of enhanced stress tolerance in transgenic
rice.
Interactive protein partners and possible pathways involving the osmotins were
revealed by Arabidopsis protein chip assays. The results were validated in N.
benthamiana. On the protein chips, 267, 239, and 237 proteins interacted with TlOsm,
OsOlp1_A, and OsOlp1_I respectively. Osmotin interactors were found involved

Molecular and Functional Characterisation of an Osmotin Gene from the Resurrection Plant Tripogon
loliiformis v
in the diverse biological processes and pathways fundamental in plant development
and adaptation. The three dominant pathways were fructose and mannose metabolism,
glycolysis, and pentose phosphate pathways. Interestingly, 21 proteins interacted only
with TlOsm and were involved in plant responses to stress, chemical, and endogenous
stimuli. Nine of these 21 proteins are involved in nine pathways that do not contain
any interactors of the rice osmotins. Fifteen interactions were validated in planta by
Bimolecular Fluorescence Complementation (BiFC) analysis and 14 of those
confirmed the results on the chip assays. Protein-protein interaction assays revealed
that TlOsm is capable of interacting with more stress-responsive proteins than
osmotins from sensitive species, O. sativa.
The study contributes significantly to understanding the proteomic evolution of
osmotins from tolerant and sensitive species as well as from tolerant and sensitive
cultivars within species. The results provide evidence highlighting the potential of T.
loliiformis genetic resource for identification of stress-tolerant traits to introduce into
crop species. The study also deepens our understanding of the molecular mechanisms
underlying osmotin functions in regulating plant stress response.

vi Molecular and Functional Characterisation of an Osmotin Gene from the Resurrection Plant Tripogon
loliiformis
List of Publications and Conferences
Thi Thuy Trang LE, Brett Williams, and Sagadevan Mundree (2017). An osmotin
from the resurrection plant Tripogon loliiformis (TlOsm) confers tolerance to multiple
abiotic stresses in transgenic rice. Physiologia Plantarum, doi: 10.1111/ppl.12585.
Thi Thuy Trang LE, Brett Williams, and Sagadevan Mundree (2016). Comparative
analysis of osmotins from Tripogon loliiformis and Oryza sativa revealed role in
abiotic stress tolerance through signalling pathways. Poster in the Combio2016
Workshop, 03-07 Oct 2016, Brisbane, Australia.
Thi Thuy Trang LE, Brett Williams, and Sagadevan Mundree (2016).
Characterization of an osmotin gene from resurrection plant Tripogon loliiformis. Oral
presentation in the 7th International Workshop on Desiccation Sensitivity and
Tolerance across Life Forms, 11-15 Jan 2016, Cape Town, South Africa.

Molecular and Functional Characterisation of an Osmotin Gene from the Resurrection Plant Tripogon
loliiformis vii
Table of Contents
Keywords .................................................................................................................................. i
Abstract ................................................................................................................................... iii
List of Publications and Conferences ...................................................................................... vi
Table of Contents ................................................................................................................... vii
List of Figures ....................................................................................................................... xiii
List of Tables ........................................................................................................................ xvi
List of Abbreviations ........................................................................................................... xvii
Statement of Original Authorship ......................................................................................... xxi
Acknowledgements ............................................................................................................. xxiii
Chapter 1: Introduction and Literature Review ............................................... 1
1.1 INTRODUCTION ..........................................................................................................1
1.2 PLANTS AND ENVIRONMENTAL STRESSES ........................................................3 1.2.1 Plants affected by environmental factors .............................................................3 1.2.2 Plant responses to abiotic stresses ........................................................................4 1.2.3 Abiotic stress, world food security, and molecular breeding .............................11
1.3 OSMOTIN AND OLP: THE STRESS-RESPONSIVE MULTIFUNCTIONAL
PROTEINS .............................................................................................................................13 1.3.1 Osmotins and OLPs, the members of pathogenesis-related proteins .................13 1.3.2 Osmotins and OLPs play roles in multi-stress responses ...................................15 1.3.3 Expression of osmotins and OLPs enhanced plant tolerance to multiple
stress factors .......................................................................................................17 1.3.4 Possible roles of osmotins and OLPs in response to abiotic and biotic
stress ...................................................................................................................19 1.3.5 Osmotins and OLPs as potential candidate genes for enhancing multi-
stress tolerance and for other uses in food industry............................................22
1.4 RESURRECTION PLANTS: A NOVEL SOURCE FOR STRESS-RESPONSIVE
GENES ....................................................................................................................................23
1.5 RICE AS A TARGET FOR ENHANCING ABIOTIC STRESS TOLERANCE VIA
TRANSGENIC APPROACH .................................................................................................25 1.5.1 Rice is an important staple food crop .................................................................25 1.5.2 Rice is the model plant for monocots .................................................................26 1.5.3 Rice is susceptible to abiotic stresses .................................................................26
1.6 RECENT ADVANCES IN STUDYING FUNCTIONAL PROTEINS .......................28 1.6.1 Bioinformatics tools ...........................................................................................29 1.6.2 Advances in genetic manipulation ......................................................................30 1.6.3 Functional protein microarrays ...........................................................................31 1.6.4 Detection tools for protein-protein interactions in living cells ...........................32
1.7 PROBLEM STATEMENT, GAPS, AIMS, AND OBJECTIVES ...............................35
viii Molecular and Functional Characterisation of an Osmotin Gene from the Resurrection Plant Tripogon
loliiformis
Chapter 2: General Materials and Methods .................................................... 39
2.1 MATERIALS ............................................................................................................... 39 2.1.1 Source of general chemicals and specialized reagents ....................................... 39 2.1.2 Plant materials.................................................................................................... 39 2.1.3 Bacterial strains.................................................................................................. 40 2.1.4 Oligodeoxyribonucleotide (Primers) ................................................................. 40 2.1.5 Backbone vectors ............................................................................................... 43 2.1.6 General media, solutions: abbreviation and composition .................................. 47 2.1.7 Plant tissue culture medium ............................................................................... 48
2.2 METHODS .................................................................................................................. 49 2.2.1 Cloning and bacterial transformation................................................................. 49 2.2.2 General methods in nucleic acid extraction, amplification and analysis ........... 54 2.2.3 Agrobacterium-mediated transient transformation of plants ............................. 57 2.2.4 Confocal imaging ............................................................................................... 57 2.2.5 Relative water content ...................................................................................... 58 2.2.6 Electrolyte leakage measurement ...................................................................... 58 2.2.7 Agrobacterium-mediated plant transformation and regeneration ...................... 58 2.2.8 Bioinformatics analysis ...................................................................................... 58 2.2.9 Abiotic stress treatment of T. loliiformis ........................................................... 58 2.2.10 Transgenic rice acclimatisation and abiotic stress treatments ........................... 58 2.2.11 Protein extraction, purification and analysis ...................................................... 59 2.2.12 Protein microarray hybridisation and detection of protein-protein
interaction .......................................................................................................... 59 2.2.13 Data analysis ...................................................................................................... 59
Chapter 3: Molecular Characterisation of TlOsm, an Osmotin from
Tripogon loliiformis .................................................................................................. 61
3.1 INTRODUCTION ....................................................................................................... 61
3.2 MATERIALS AND METHODS ................................................................................. 63 3.2.1 Plant materials.................................................................................................... 63 3.2.2 Sequence analysis of TlOsm ........................................................................... 63 3.2.3 Phylogenic tree construction .............................................................................. 64 3.2.4 Comparison of TlOsm with Os-OlP1_A and OsOlp1_I by
bioinformatic tools ............................................................................................. 64 3.2.5 Growth conditions, abiotic stress treatments and sampling for T.
loliiformis plants ................................................................................................ 64 3.2.6 RNA extraction and RT_qPCR analysis ............................................................ 65 3.2.7 Generation of transgenic tobacco expressing EYFP-tagged TlOsm and
VC .................................................................................................................... 66 3.2.8 Agro-infiltration of transgenic tobacco .............................................................. 68 3.2.9 Salinity stress treatment of tobacco plants ......................................................... 68 3.2.10 Confocal imaging ............................................................................................... 69
3.3 RESULTS .................................................................................................................... 69 3.3.1 Sequence analysis of TlOsm ........................................................................... 69 3.3.2 TlOsm is induced by cold, drought and salinity stresses ................................... 74 3.3.3 TlOsm localises to the plasma membrane ...................................................... 77 3.3.4 TlOsm, OsOlp1_A and OsOlp1_I differ in active binding residues ..... 81
3.4 DISCUSSION .............................................................................................................. 83 3.4.1 TlOsm is a member of osmotins and OLPs .................................................... 83 3.4.2 TlOsm is involved in osmotic stress response of T. loliiformis plants ............... 84 3.4.3 TlOsm localises to the plasma membrane regardless of stress condition ....... 85

Molecular and Functional Characterisation of an Osmotin Gene from the Resurrection Plant Tripogon
loliiformis ix
3.4.4 TlOsm has more binding sites typical for osmotins than OsOlp1_A
and OsOlp1_I .................................................................................................86
Chapter 4: Generation of Transgenic Rice Constitutively Expressing Oryza
sativa and Tripogon loliiformis Osmotins ............................................................... 89
4.1 INTRODUCTION ........................................................................................................89
4.2 MATERIALS AND METHODS .................................................................................91 4.2.1 Plasmid constructs and Agrobacterium strains ...................................................91 4.2.2 Plant materials and culture media .......................................................................92 4.2.3 Rice callus induction, transformation, selection and regeneration .....................92 4.2.4 Characterisation of transgenic rice plants ...........................................................94
4.3 RESULTS .....................................................................................................................97 4.3.1 Callus induction, transformation, selection and regeneration of putative
transgenic rice plants ..........................................................................................97 4.3.2 Confirmation of transgenes in putative transgenic rice lines .............................99 4.3.3 Expression of transgenes in transgenic rice plants confirmed by RT-PCR ......101 4.3.4 Expression of GUS protein confirmed in GUS-expressing rice lines. ..............103
4.4 DISCUSSION .............................................................................................................105
Chapter 5: Comparative Analysis of Transgenic Rice Constitutively
Expressing Osmotins from Tolerant and Sensitive Species ............................... 109
5.1 INTRODUCTION ......................................................................................................109
5.2 MATERIALS AND METHODS ...............................................................................111 5.2.1 Plant materials ..................................................................................................111 5.2.2 Acclimatisation of tissue-cultured rice plants ..................................................112 5.2.3 Growth conditions and stress treatments at seedling stage ...............................112 5.2.4 Germination of T1 transgenic rice plants .........................................................113 5.2.5 Screening of T1 transgenic rice plants .............................................................113 5.2.6 Growth conditions and reproductive-stage stress treatments ...........................114 5.2.7 Electrolyte leakage ...........................................................................................114 5.2.8 Relative water content determination ...............................................................115 5.2.9 Plant dry weight determination ........................................................................115 5.2.10 Measurement of photosynthetic parameters .....................................................115 5.2.11 Statistical analysis ............................................................................................116
5.3 RESULTS ...................................................................................................................117 5.3.1 Rice plants constitutively expressing TlOsm or OsOlp1_A maintained
growth under cold, drought, and salinity stresses .............................................117 5.3.2 Rice plants constitutively expressing TlOsm or OsOlp1_A produce more
tillers than WT, NT, and VC plants under cold, drought, and salinity
stresses ..............................................................................................................119 5.3.3 Rice plants constitutively expressing OsOlp1_A or TlOsm retained water
better than OsOlp1_I, VC and NT or WT plants under cold, drought, and
salinity stresses .................................................................................................121 5.3.4 Rice plants constitutively expressing osmotins maintain membrane
integrity better than VC and WT or NT plants under cold, drought, and
salinity stresses .................................................................................................123 5.3.5 Rice plants constitutively expressing TlOsm or OsOlp1_A maintained
photosynthesis efficiency under drought and salinity stresses .........................125 5.3.6 Stressed rice plantlets constitutively expressing TlOsm or OsOlp1_A
showed heathier morphological appearance than VC and WT ........................130 5.3.7 Rice plants constitutively expressing TlOsm or OsOlp1_A resulted in
higher dry biomass under cold, drought, and salinity stresses .........................133
x Molecular and Functional Characterisation of an Osmotin Gene from the Resurrection Plant Tripogon
loliiformis
5.3.8 Constitutive expression of TlOsm or OsOlp1_A improves survival rate
under salinity, drought and cold stress in transgenic rice. ............................... 135 5.3.9 Constitutive expression of TlOsm or OsOlp1_A improved yield under
drought and salinity in transgenic rice ............................................................. 137
5.4 DISCUSSION ............................................................................................................ 141 5.4.1 TlOsm and OsOlp1_A confers tolerance to cold, drought and salinity
stresses in rice .................................................................................................. 142 5.4.2 Retaining water, maintaining membrane integrity, and maintaining
photosynthesis activities are some strategies TlOsm and OsOlp1_A plants
used to cope with cold, drought, and salinity stresses. .................................... 145 5.4.3 TlOsm plants showed advantages over OsOlp1_A plants in drought and
cold stresses, not in salinity stresses ................................................................ 148 5.4.4 OsOlp1_I did not sufficiently enhance rice plants tolerance to cold,
drought, and salinity stresses ........................................................................... 149 5.4.5 Low stomata conductance is possibly a cause of growth penalty of TlOsm
plants under unstressed conditions. ................................................................. 150
Chapter 6: Analysis of Protein-Protein Interactions of Osmotins from Stress
Tolerant and Sensitive Species .............................................................................. 155
6.1 INTRODUCTION ..................................................................................................... 155
6.2 MATERIALS AND METHODS ............................................................................... 157 6.2.1 Plant materials.................................................................................................. 157 6.2.2 Plasmid vectors ................................................................................................ 157 6.2.3 Protein expression in Nicotiana benthamiana ................................................. 159 6.2.4 Recombinant protein extraction, purification, and enrichment ........................ 160 6.2.5 SDS-PAGE ....................................................................................................... 161 6.2.6 Coomassie blue staining .................................................................................. 161 6.2.7 Western blotting ............................................................................................... 161 6.2.8 Protein chip hybridisation and scanning .......................................................... 162 6.2.9 Identification of significant interactions .......................................................... 163 6.2.10 Determination of significant protein interactors of target osmotins ................ 163 6.2.11 Identification of pathways containing interactive protein partners of
TlOsm, OsOlp1_A, and OsOlp1_I ........................................................ 164 6.2.12 BiFC performance and analysis ......................................................................... 164
6.3 RESULTS .................................................................................................................. 167 6.3.1 Expression and purification of recombinant osmotin proteins ........................ 167 6.3.2 Arabidopsis proteins interacting with TlOsm, OsOlp1_A, and
OsOlp1_I revealed ...................................................................................... 169 6.3.3 Gene ontology (GO) enrichment for interactors of the three osmotins ........... 172 6.3.4 Pathways of TlOsm, OsOlp1_A, and OsOlp1_I interactive protein
partners revealed .............................................................................................. 174 6.3.5 Physical interactions of selected Arabidopsis proteins with TlOsm,
OsOlp1_A, and OsOlp1_I confirmed in planta ..................................... 176
6.4 DISCUSSION ............................................................................................................ 183 6.4.1 Production of pure and functional recombinant osmotins ............................... 187 6.4.2 Analysing potential protein interactors of TlOsm, OsOlp1_A and
OsOlp1_I affirms their multiple functions .................................................. 189 6.4.3 Common and specific potential interactors of TlOsm, OsOlp1_A, and
OsOlp1_I provide testable target proteins for unravelling osmotin
functions ........................................................................................................... 191 6.4.4 Possible mechanisms underlying TlOsm, OsOlp1_A, and
OsOlp1_I functions ..................................................................................... 193

Molecular and Functional Characterisation of an Osmotin Gene from the Resurrection Plant Tripogon
loliiformis xi
Chapter 7: General Discussion ....................................................................... 197
7.1 TlOsm has more functional efficacy in regulation of plant stress response than rice
osmotins ................................................................................................................................198
7.2 TlOsm is a multi-functional protein playing a role in plant response to stresses ....201
7.3 TlOsm (and OsOlp1_A) likely contribute to plant stress response through signal
transduction ...........................................................................................................................203
7.4 TlOsm has potential for use in improving crop tolerance to multiple abiotic stresses 206
7.5 Concluding remarks ....................................................................................................207
Appendices .............................................................................................................. 209
Bibliography ........................................................................................................... 243

xii Molecular and Functional Characterisation of an Osmotin Gene from the Resurrection Plant Tripogon
loliiformis

Molecular and Functional Characterisation of an Osmotin Gene from the Resurrection Plant Tripogon
loliiformis xiii
List of Figures
Figure 1.1 Plant gene regulation in response to salt and drought stress ...................... 6
Figure 1.2 Structure homology of osmotin, thaumatin and antifungal PR-5 ............... 15
Figure 1.3 Principle of BiFC and multicolour BiFC analysis. .................................... 34
Figure 1.4 General research outline and thesis presentation ..................................... 38
Figure 2.1 Plasmid maps for primary cloning. ........................................................... 43
Figure 2.2 Map of backbone vector used for cloning genes stably expressing in
rice................................................................................................................ 44
Figure 2.3 Maps of destination vectors for cloning EYFP-tag TlOsm and VC. ..... 45
Figure 2.4 Map of destination vector used for recombinant osmotin production. ..... 46
Figure 2.5 Maps of destination vectors used for detecting protein-protein
interaction in planta. .................................................................................... 47
Figure 3.1 Schematic diagram of gene constructs for expressing EYFP-tagged
TlOsm and EYFP control in N. tabacum ...................................................... 66
Figure 3.2 Alignment of TlOsm with selected plant osmotins.. ............................. 70
Figure 3.3 Property analysis of TlOsm. .................................................................. 71
Figure 3.4 The phylogenic tree showing the relationship of TlOsm and
osmotins from different monocotyledonous and dicotyledonous
species. ......................................................................................................... 73
Figure 3.5 Developmental stages of T. loliiformis for sampling................................ 74
Figure 3.6 Expression of TlOsm under developmental stages and various
abiotic stresses. ............................................................................................ 76
Figure 3.7 Fluorescence-based selection of transgenic tobacco expressing
EYFP-tagged TlOsm and VC. ...................................................................... 77
Figure 3.8 Confirmation of stable transgene integration in transgenic tobacco
by PCR.. ....................................................................................................... 78
Figure 3.9 Cellular localisation of TlOsm. ............................................................... 79
Figure 3.10 Subcellular co_localisation analysis of EYFP-tagged TlOsm and
EYFP in N. tabacum. ................................................................................... 80
Figure 3.11 Localisation of EYFP-tagged TlOsm and EYFP in transgenic N.
tabacum cells under unstressed and 150 mM NaCl stress. .......................... 81
Figure 4.1 Schematic diagram of gene expression cassettes for expressing
osmotins and GUS-reporter gene (control-VC) in O. sativa. .................... 92
Figure 4.2 Procedure of rice callus induction, transformation, selection, and
plant regeneration......................................................................................... 98
Figure 4.3 Characterisation of putative transgenic rice lines by PCR. .................... 100

xiv Molecular and Functional Characterisation of an Osmotin Gene from the Resurrection Plant Tripogon
loliiformis
Figure 4.4 Transcriptional expression of transgenes in transgenic rice by RT-
PCR.. .......................................................................................................... 102
Figure 4.5 GUS expression in transgenic rice calli and plants.. ............................... 104
Figure 5.1 Relative shoot growth of WT or NT, VC and transgenic plants
expressing OsOlp1_A, OsOlp1_I, and TlOsm. .......................................... 119
Figure 5.2 Tiller number of WT or NT, VC and transgenic plants expressing
OsOlp1_A, OsOlp1_I, and TlOsm. ............................................................. 120
Figure 5.3 Leaf relative water content (RWC) of WT or NT, VC and transgenic
plants expressing OsOlp1_A, OsOlp1_I, and TlOsm. ................................ 122
Figure 5.4 Leaf electrolyte leakage of WT or NT, VC and transgenic plants
expressing OsOlp1_A, OsOlp1_I, and TlOsm ........................................... 124
Figure 5.5 Net photosynthesis of NT, VC and transgenic plants expressing
OsOlp1_A, OsOlp1_I, and TlOsm. ............................................................. 127
Figure 5.6 Transpiration rate of NT, VC and transgenic plants expressing
OsOlp1_A, OsOlp1_I, and TlOsm. ............................................................. 128
Figure 5.7 Stomatal conductance of NT, VC and transgenic plants expressing
OsOlp1_A, OsOlp1_I, and TlOsm. ............................................................. 129
Figure 5.8 Morphology of T0 rice plants under cold, drought and salinity
stresses at seedling stage. ........................................................................... 131
Figure 5.9 Morphology of T1 rice plants and panicles under unstressed, drought
and salinity stresses when plants exposed to stresses at reproductive
stage. .......................................................................................................... 133
Figure 5.10 Survival rate and morphology of rice plants recovered from stress
treatments at seeding stage. ........................................................................ 136
Figure 6.1 Schematic diagram of gene expression cassettes for transiently
expressing tagged osmotins in N. benthamiana. ...................................... 158
Figure 6.2 Schematic diagram of gene expression cassettes for detecting target
osmotins and Arabidopsis protein interaction in N. benthamiana. ............ 159
Figure 6.3 Recombinant osmotin production. .......................................................... 168
Figure 6.4 Procedure of recombinant osmotins hybridising with protein chips
and data generation .................................................................................... 170
Figure 6.5 Biological processes involving protein interactors of TlOsm,
OsOlp1_A and OsOlp1_I .................................................................. 173
Figure 6.6 Analysis of in planta interactions between AtCPK4 and TlOsm,
OsOlp1_A, or OsOlp1_I. .................................................................. 178
Figure 6.7 Analysis of in planta interactions between AtCPK5 and TlOsm,
OsOlp1_A, or OsOlp1_I. .................................................................. 179
Figure 6.8 Analysis of in planta interactions between AtMS1 and TlOsm,
OsOlp1_A, or OsOlp1_I. .................................................................. 180
Figure 6.9 Analysis of in planta interactions between AtALDH7B4 and
TlOsm, OsOlp1_A, or OsOlp1_I. ................................................... 181

Molecular and Functional Characterisation of an Osmotin Gene from the Resurrection Plant Tripogon
loliiformis xv
Figure 6.10 Analysis of in planta interactions between AtPER42 and
TlOsm, OsOlp1_A, or OsOlp1_I. ................................................. 182
Figure 6.11 Protein interaction networks of Arabidopsis genes selected for
BiFC analysis.. ........................................................................................... 186

xvi Molecular and Functional Characterisation of an Osmotin Gene from the Resurrection Plant Tripogon
loliiformis
List of Tables
Table 1.1 Representatives of transgenic plants expressing plant osmotins and their
phenotypes ................................................................................................... 18
Table 2.1 List of primers for plasmid cloning ............................................................ 41
Table 2.2 List of plant expression vectors constructed and used in the research ....... 51
Table 3.1 List of primers for PCR characterisation of transgenic tobacco plants ...... 68
Table 3.2 Characteristics of TlOsm, OsOlp1_A, and OsOlp1_I by
functional predictions ................................................................................... 82
Table 4.1 List of primers used for characterisation of transgenic plants ................... 95
Table 4.2 Summary of generating and characterising transgenic rice lines
expressing target osmotins and control gene in the research ..................... 105
Table 5.1 A summary of experiments in the study .................................................. 116
Table 5.2 Dry biomass of plants in seedling-stage stress treatment experiments .... 134
Table 5.3 Dry biomass of plants in reproductive-stage stress treatment
experiments ................................................................................................ 135
Table 5. 4 Yield components of TlOsm, OsOlp1_A, OsOlp1_I, VC and NT
(control) plants under unstressed, drought, and salinity stress
conditions ................................................................................................... 139
Table 6.1 Select Arabidopsis genes for BiFC analysis ............................................ 165
Table 6.2 Combinations of osmotins and Arabidopsis genes used for co-
expression and BiFC analysis .................................................................... 166
Table 6.3 Comparison of significant interactions between Arabidopsis proteins
on the chip with the three osmotins ........................................................... 171
Table 6.4 Significant pathways of Arabidopsis proteins interacting with
TlOsm, OsOlp1_A, and OsOlp1_I ................................................ 174
Table 6.5 Pathways of Arabidopsis proteins interacting with TlOsm and
OsOlp1_A, or TlOsm only ................................................................. 175
Table 6.6 Pathways of Arabidopsis proteins commonly interacting with
TlOsm, OsOlp1_A, and OsOlp1_I in relation to published and
predicted functions of osmotin ................................................................... 176

Molecular and Functional Characterisation of an Osmotin Gene from the Resurrection Plant Tripogon
loliiformis xvii
List of Abbreviations
Abbreviations
AA = amino acids
ABA = abscisic acid
AMP = adenosine monophosphate
AMPK = Adenosine monophosphate-activated protein kinase
APX = ascorbate peroxidase
ATP = adenosine triphosphate
BAP = 6-benzylaminopurine
BiFC = Bimolecular Fluorescence Complementation
BLAST = Basic Logical Alignment Tool
bp = base pairs
BSA = bovine serum albumin
CaM = calmodulin
CaMV = Cauliflower mosaic virus
cDNA = complementary DNA
CDPK = Calcium-dependent protein kinase
CML = Calmodulin-like
CTAB = cety trimethyl ammonium bromide
CTCB = Centre for Tropical Crops and Biocommodities
C-terminal = carboxyl- terminal
DEPC = diethylpyrocarbonate
DHAR = dehydro ascorbate reductase
dH2O = distilled water
DIG = digoxygenin
DMSO = dimethyl sulphoxide
DNA = deoxyribonucleic acid
dNTPs = deoxyribonucleotide triphosphates
DTT = 1, 4-dithiothreitol
DW = dry weight
2, 4,-D = 2, 4-dichlorophenoxyacetic acid
EDTA = ethylenediaminetetraacetic acid
EL = electrolyte leakage

xviii Molecular and Functional Characterisation of an Osmotin Gene from the Resurrection Plant Tripogon
loliiformis
ER = endoplasmic reticulum
E. coli = Escherichia coli
EYFP = Enhanced Yellow Fluorescence Protein
FRET = Fluorescence Resonance Energy Transfer
GMO = Genetically modified organism
GUS = β-glucoronidase
His = Histidine
HK = Histidine kinase
HSP = Heat shock protein
IAA = indole-3-acetic acid
IBA = indole-3-butyric acid
IPTG = iso-propyl-β-D-thiogalatopyranoside
kbp = kilo base pair(s)
KDEL = Lys-Asp-Glu-Leu, an ER retention signal peptide
LB = Luria-Bertani
LEA = Late Embryogenic Abundant
MAB = Marker-assisted breeding
MAP = Mitogen-activated protein
MAPK = Mitogen-activated protein kinase
MDHAR = Monodehydroascorbate reductase
mRNA = messenger RNA
MS = Murashige and Skoog media
NAA = α-naphthalene acetic acid
NCBI = National Centre for Biotechnology Information
Nos = Nopaline synthase
nt = nucleotide
N-terminal = amino terminal
OD = optical density
OD600 = optical density at 600 nm
OLP = Osmotin-Like Protein
PBS = phosphate buffered saline
PCD = programmed cell death
PCR = polymerase chain reaction
pDNA = plasmid DNA
PEG = Polyethylene glycose

Molecular and Functional Characterisation of an Osmotin Gene from the Resurrection Plant Tripogon
loliiformis xix
pH = -log (proton concentration)
PPAR = Peroxisome proliferator activated receptor
PR5 = pathogenesis-related proteins group 5
QUT = Queensland University of Technology
RKN = root-knot nematode
RLK = receptor-like kinase
RNA = ribonucleic acid
RNase = ribonuclease
ROS = reactive oxygen species
RT-PCR = reverse transcription polymerase chain reaction
RT_qPCR = reverse-transcription quantitative real-time polymerase
chain reaction
RWC = relative water content
SDS = sodium dodecyl sulphate
SDS-PAGE = sodium dodecyl sulphate polyacrylamide gel
electrophoresis
SE = standard error
SOD = superoxide dismutase
ssp = subspecies
TAE = Tris acetate EDTA
TAP = Tandem Affinity Purification
TBS = Tris buffer saline
TBS-T = Tween Tris buffer saline
TEMED = N,N,N’,N’-tetramethylethylenediamine
TLP = Thaumatin-like protein
Tris = Tris (hydroxymethyl) aminomethane
TW = turgor weight
Tween20 = polyoxyethylene (20) sorbitan monolaurate
Ubi = ubiquitin
uidA = reporter gene encoding β-glucuronidase
UTR = untranslated region
UV = ultraviolet
VC = vector control
X-gal = 5-bromo-4-chloro-3-indolyl-β-D-galactopyranoside
X-gluc = 5-bromo-4-chloro-3-indolyl-β-D-glucuronide-
cyclohexylamine salt

xx Molecular and Functional Characterisation of an Osmotin Gene from the Resurrection Plant Tripogon
loliiformis
Units
°C = Degree Celsius
d = days
Da = Daltons(s)
dSm-1 = deciSiemens per metre
g = Gram(s)
g = relative centrifugal force in units of gravity
h = Hour(s)
L = Litre(s)
M = Molar
m = Metre(s)
MW = Molecular weight
min = Minute(s)
mol = Mole(s)
rpm = Revolutions per minute
s = Second(s)
V = Volt(s)
vol = Volume(s)
v/v = Volume per volume
w/v = Weight per volume
Prefixes
K = kilo
m = milli
µ = micro

Molecular and Functional Characterisation of an Osmotin Gene from the Resurrection Plant Tripogon
loliiformis xxi
Statement of Original Authorship
The work contained in this thesis has not been previously submitted to meet
requirements for an award at this or any other higher education institution. To the best
of my knowledge and belief, the thesis contains no material previously published or
written by another person except where due reference is made.
Signature:
Date: 16/01/2018
QUT Verified Signature

xxii Molecular and Functional Characterisation of an Osmotin Gene from the Resurrection Plant Tripogon
loliiformis

Molecular and Functional Characterisation of an Osmotin Gene from the Resurrection Plant Tripogon
loliiformis xxiii
Acknowledgements
The successful completion of my thesis would not have been possible without a
supportive and encouraging supervisory committee, a diverse technical support team,
my wonderful family and friends, and funding from Australian Government.
With deep sense of gratitude, I wish to thank Professor Sagadevan Mundree my
principal supervisor for giving me the opportunity to undertake my PhD study at QUT;
for his guidance, support, and encouragement throughout my PhD research; for his
helpful criticisms and stimulating discussions during thesis preparation; and for setting
a high standard of academic conscientiousness and achievement for his students.
I would like to express my sincere thanks to my associate supervisor Dr Brett Williams
for his rigorous scientific guidance, excellent mentorship, incessant encouragement,
and his availability in times of needs during the course of my PhD research; and for
his critical guidance, comments and suggestions in the preparation of this thesis.
I acknowledge my special thanks to Dr S. Robin (deceased) and Dr M. Raveendran
my external supervisors at the Tamil Nadu Agriculture University (Coimbatore, India)
for the conceptualisation of plant osmotin evolution and for sharing experimental
information of two rice osmotins. I wish to pray for the departed soul to rest in peace.
I would like to extend my thanks to CTCB fellow HDR students, Postdocs, and
technical staff and Abiotic stress group members: Linh Hoang (rice transformation and
stress treatments), Isaac Njaci (protein modelling and confocal imaging), Peraj
Karbaschi (protein chip); Hao Long (cloning and RT-qPCR), Grace Tan
(photography), Sudipta, Alam, Jacqui, Michael, Laleh, Anthony Brinin, Tom, Pauline,
and Abagail for contributions to my project update presentations, for their friendship
and supports; Dr Benjamin Dugdale for providing the pEAQ-HT construct. The entire
CTCB family for their friendship, support, and encouragement. The assistance of all
of these fellow students and research fellows is deeply appreciated.
Special thanks go to Central Analytical Research Facility (CARF) staff: Sanjleena
Singh and Jamie Riches for their assistant with the confocal microscope.
Thanks go to the QIMT, Lea Lekieffre and Penny Groves for facility and support in
protein chip scan and analysis using the Genepix 4300A slide scanner.
I wish to acknowledge Professor Acram Taji for introducing me to such wonderful
supervisors and research team and for her ceaseless encouragement.
My dream for PhD program at QUT would not have been reached without the financial
support from Australian Government through the Endeavour Prime Minister PhD
Award scholarship. I acknowledge the support with gratitude.
I am very grateful to my family: to my husband Dai Huong Nguyen and children Le
Huong Giang Nguyen and Le Thuy Ninh Nguyen for their love, support, patience, and
encouragement; for giving me the faith and strength to complete my PhD program; to
my parents, parents-in-law, brothers, and sisters for their understanding, caring, and
encouragement.


Chapter 1: Introduction and Literature Review 1
Chapter 1: Introduction and Literature
Review
1.1 INTRODUCTION
The global population is estimated to reach 9.8 billion by 2050. To provide
sufficient food for this population globally, agricultural production must double (Ray
et al., 2013). However, increasing agricultural productivity is a massive challenge and
is limited by decreased yields and arable land as well as increased disease incidence
and abiotic stress; both of which are significantly affected by changing climate
conditions. Of the limitations, abiotic factors such as drought, extreme temperature,
and salinity have been identified as the major factors hindering agricultural production
worldwide (Cominelli et al., 2013). There is an urgent need to develop technologies
for the generation of enhanced crops that can survive long spells of stresses, and upon
return of favourable conditions, continue to grow and yield. Genetic engineering of
crops with foreign gene(s) is an approach that offers a great potential for crop
improvement particularly to abiotic stress tolerant traits. However, the complex nature
of abiotic stress responses, the availability of the stress tolerant genes and the lack of
knowledge regarding stress pathways in plants have affected the implementation of
this approach in solving problems associated with abiotic stresses (Gosal et al., 2009).
The success of genetic engineering approaches to improve plant tolerance to abiotic
stresses relies on the ability of transgene products to play a key role in tolerance. Studies
have shown that stress tolerance in plants is a multigenic trait (Sairam and Tyagi, 2004).
To develop strategies for the improvement of crops adapted to future extreme
environment, it is important to identify the key upstream regulators of stress acclimation
from the stress-adapted species and to engineer them into crop plants (Mittler and
Blumwald, 2010). It is believed that such genes might provide the crop plants the
necessary arsenal to tolerate extreme stress conditions compared to the non-modified
parental plants (Cominelli et al., 2013). A small group of angiosperms known as
resurrection plants can tolerate extreme levels of dehydration down to 4% relative water
content and resume full metabolic activity upon watering. Studies on the Australian native

2 Chapter 1: Introduction and Literature Review
resurrection grass, Tripogon loliiformis, have shown that this plant implements a number
of molecular, biochemical, physiological and structural mechanisms for rapid response to
water deficit and quick recovery upon rehydration as well as for facilitating survival
mechanism during desiccation state (Williams et al., 2015; Karbaschi et al., 2016).
Therefore, resurrection plants such as T. loliiformis represent both ideal model plants and
a unique source for the identification of novel, functionally relevant, stress-associated
genes and pathways for utilisation in enhancement of stress tolerance in crops.
Among genes involved in stress response networks, gene encoding osmotin has
shown as a potential candidate gene. Osmotins and osmotin-like proteins (OLPs) are
members of the pathogenesis-related proteins that have been proven to play key roles in
both abiotic and biotic stress responses. Osmotin and OLP genes are induced in response
to various abiotic and biotic stresses in different plant species (Singh et al., 1985; Zhu et
al., 1995; Hong et al., 2004; Zhang and Shih, 2007). Genes encoding osmotins and OLPs
have been characterised from many plant species and shown to have multiple functions in
enhancing plant stress tolerance (Singh et al., 1987; Yen et al., 1994a; Kim et al., 2002;
Onishi et al., 2006; Jami et al., 2007). Additionally, the constitutive expression of osmotin
genes in transgenic crops has improved tolerance to drought, high-salinity, and cold stresses
and some combinations of these stresses (D'Angei and Altamura, 2007; Goel et al., 2010;
Subramanyam et al., 2011; Subramannyan et al., 2012; Patade et al., 2013). Although
intensive studies have been conducted to dissect the roles of osmotins in plant stress
responses, the mechanisms by which osmotins mediate these responses have not been well
established. Primarily, it was suggested that osmotin improves salt tolerance by reducing the
accumulation of Na+ ion in the cytoplasm, the uptake of Na+ into the cells, or acting as
Na+/H+ antiporter (Singh et al., 1987; Yen et al., 1994a). Later, number of studies have
shown osmotin enhanced abiotic tolerance in plants by modulating transcript abundance and
functional expression of stress responsive genes and upregulating the levels of several
compatible osmolytes and reactive oxygen species (ROS) scavengers (Barthaker et al.,
2001; Husaini and Abdin, 2008a; Parkhi et al., 2009; Das et al., 2011; Subramanyam et al.,
2011; Subramannyan et al., 2012; Patade et al., 2013). These studies hypothesised that
osmotin might be a transcription factor of the key genes of plant response to abiotic and
biotic stresses. However, this hypothesis was later ruled out by the evidence that osmotin
structures did not contain any DNA-binding motif (Abdin et al., 2011). Osmotins were also
shown to activate MAPK proteins (Yun et al., 1998), which are the key enzymes catalysing
Chapter 1: Introduction and Literature Review 3
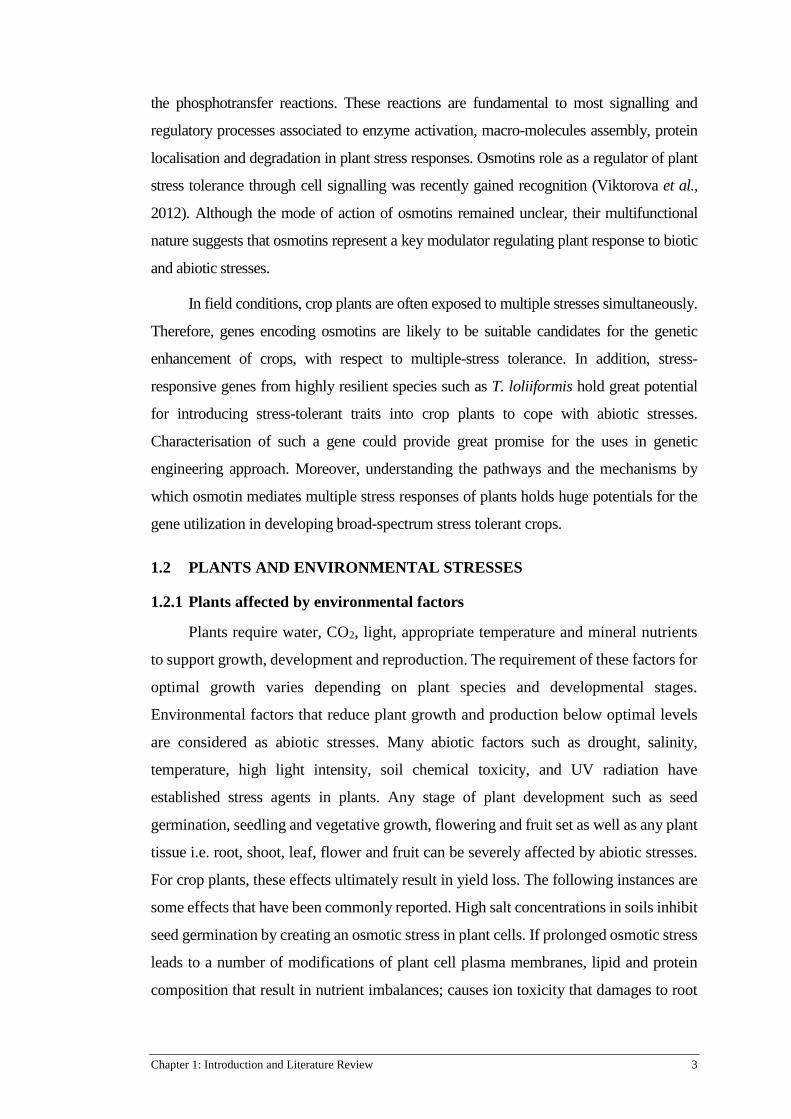
the phosphotransfer reactions. These reactions are fundamental to most signalling and
regulatory processes associated to enzyme activation, macro-molecules assembly, protein
localisation and degradation in plant stress responses. Osmotins role as a regulator of plant
stress tolerance through cell signalling was recently gained recognition (Viktorova et al.,
2012). Although the mode of action of osmotins remained unclear, their multifunctional
nature suggests that osmotins represent a key modulator regulating plant response to biotic
and abiotic stresses.
In field conditions, crop plants are often exposed to multiple stresses simultaneously.
Therefore, genes encoding osmotins are likely to be suitable candidates for the genetic
enhancement of crops, with respect to multiple-stress tolerance. In addition, stress-
responsive genes from highly resilient species such as T. loliiformis hold great potential
for introducing stress-tolerant traits into crop plants to cope with abiotic stresses.
Characterisation of such a gene could provide great promise for the uses in genetic
engineering approach. Moreover, understanding the pathways and the mechanisms by
which osmotin mediates multiple stress responses of plants holds huge potentials for the
gene utilization in developing broad-spectrum stress tolerant crops.
1.2 PLANTS AND ENVIRONMENTAL STRESSES
1.2.1 Plants affected by environmental factors
Plants require water, CO2, light, appropriate temperature and mineral nutrients
to support growth, development and reproduction. The requirement of these factors for
optimal growth varies depending on plant species and developmental stages.
Environmental factors that reduce plant growth and production below optimal levels
are considered as abiotic stresses. Many abiotic factors such as drought, salinity,
temperature, high light intensity, soil chemical toxicity, and UV radiation have
established stress agents in plants. Any stage of plant development such as seed
germination, seedling and vegetative growth, flowering and fruit set as well as any plant
tissue i.e. root, shoot, leaf, flower and fruit can be severely affected by abiotic stresses.
For crop plants, these effects ultimately result in yield loss. The following instances are
some effects that have been commonly reported. High salt concentrations in soils inhibit
seed germination by creating an osmotic stress in plant cells. If prolonged osmotic stress
leads to a number of modifications of plant cell plasma membranes, lipid and protein
composition that result in nutrient imbalances; causes ion toxicity that damages to root

4 Chapter 1: Introduction and Literature Review
systems, generates leaf mottling and leaf necrosis, and ultimately impairs growth and
development. The consequence of all these can ultimately cause plant death as a result
of growth arrest and molecular damage (Sairam and Tyagi, 2004). High temperature
generates high respiration and evaporation in plants. These together can push plants to
permanent wilting and temperatures exceeding 46 oC can lead to complete yield loss
(Nagarajan and Nagarajan, 2010). In self-fertilising cereals such as rice and wheat, a
short period of cold or drought stress at the young microspore stage of pollen
development results in pollen sterility that can destroy all harvested products (Dolferus
et al., 2011). In fruit crops, water logging inhibits flower bud initiation, anthesis, fruit
set, size and quality. During fruit development, if flooding occurs, the high osmotic
absorption of water through the root results in high internal pressure that causes the
fruit to burst or crack thus reducing quality (Nagarajan and Nagarajan, 2010). The
severity of the effects caused by abiotic stress is dependent on plant species, plant
developmental stages, severity of condition and harvested parts of plants.
In addition to environmental factors, crop plants are often exposed to various
pathogens that are also influenced by adverse environmental conditions. Recent
evidence suggests that climate change has altered disease complexes, triggered plant
pathogen adaptation, and changed pathogen vectors. The implications of climate
change for crop pathogens have contributed to significant yield losses and the
deterioration of crop quality (Newton et al., 2011). Pressure of weeds, pests and
diseases on crops associated with current and future changing climate has also been
evaluated and estimated with a projected increase of soil-borne pathogens linked to
their multiplication rates promoted by warmer weather (Jaggard et al., 2010). For
example, evaluation of root-knot nematode (RKN) mediated aerobic rice yield loss
combined with normal or abiotic stress conditions showed that abiotic stresses
contributed to more severe yield failure caused by RKN (Kreye et al., 2009).
Furthermore, Masutomi et al. (2009) used 18 general circulation models to estimate
the yield loss of rice in agro-ecological zones of Asia based on climatic projections
and concluded that rice yield would decrease by 8% in 2050, most of this yield
reduction to warmer winters would be the effects of weeds, pests and diseases.
1.2.2 Plant responses to abiotic stresses
Being sessile, plants have evolved numerous mechanisms in response to abiotic
stresses. Many strategies that plants implement in response to abiotic stresses have been
Chapter 1: Introduction and Literature Review 5
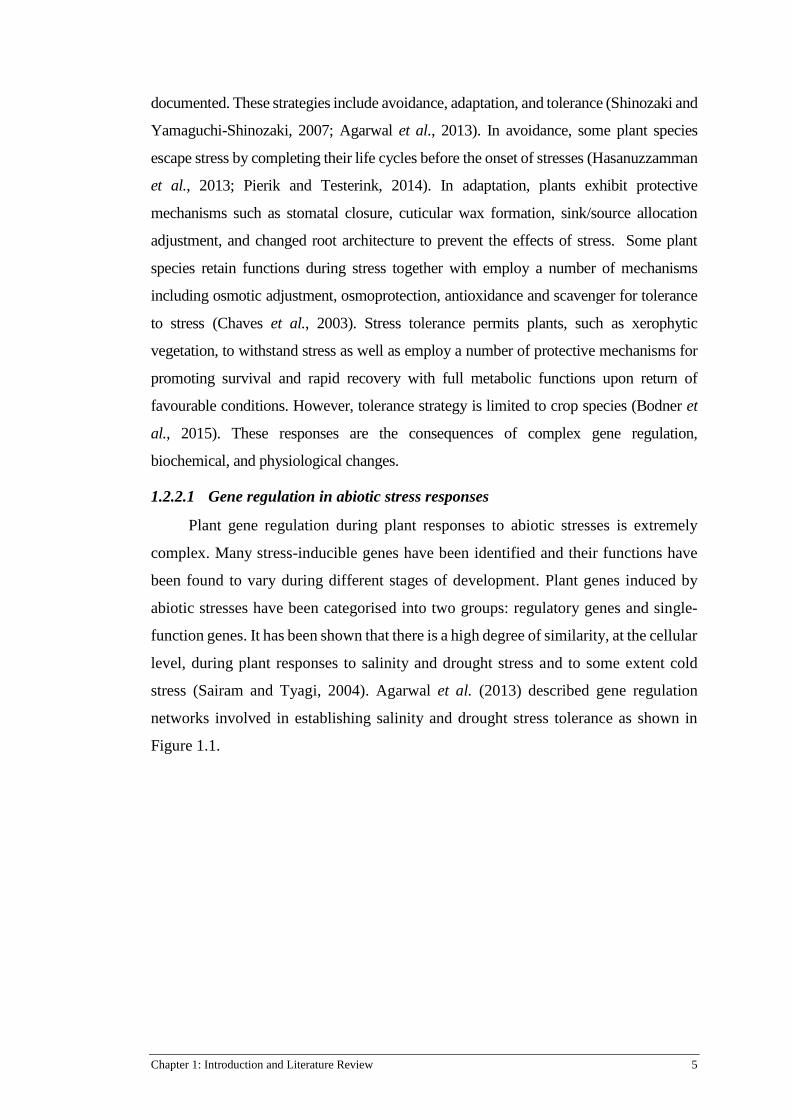
documented. These strategies include avoidance, adaptation, and tolerance (Shinozaki and
Yamaguchi-Shinozaki, 2007; Agarwal et al., 2013). In avoidance, some plant species
escape stress by completing their life cycles before the onset of stresses (Hasanuzzamman
et al., 2013; Pierik and Testerink, 2014). In adaptation, plants exhibit protective
mechanisms such as stomatal closure, cuticular wax formation, sink/source allocation
adjustment, and changed root architecture to prevent the effects of stress. Some plant
species retain functions during stress together with employ a number of mechanisms
including osmotic adjustment, osmoprotection, antioxidance and scavenger for tolerance
to stress (Chaves et al., 2003). Stress tolerance permits plants, such as xerophytic
vegetation, to withstand stress as well as employ a number of protective mechanisms for
promoting survival and rapid recovery with full metabolic functions upon return of
favourable conditions. However, tolerance strategy is limited to crop species (Bodner et
al., 2015). These responses are the consequences of complex gene regulation,
biochemical, and physiological changes.
1.2.2.1 Gene regulation in abiotic stress responses
Plant gene regulation during plant responses to abiotic stresses is extremely
complex. Many stress-inducible genes have been identified and their functions have
been found to vary during different stages of development. Plant genes induced by
abiotic stresses have been categorised into two groups: regulatory genes and single-
function genes. It has been shown that there is a high degree of similarity, at the cellular
level, during plant responses to salinity and drought stress and to some extent cold
stress (Sairam and Tyagi, 2004). Agarwal et al. (2013) described gene regulation
networks involved in establishing salinity and drought stress tolerance as shown in
Figure 1.1.
6 Chapter 1: Introduction and Literature Review
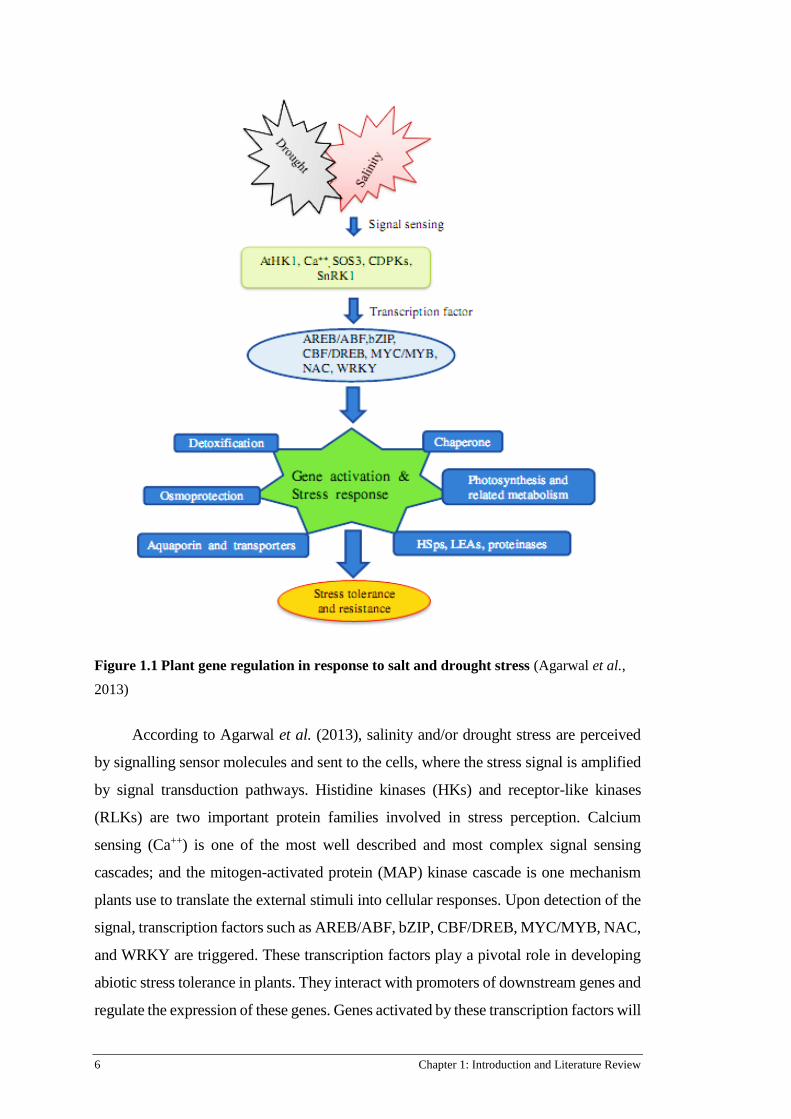
Figure 1.1 Plant gene regulation in response to salt and drought stress (Agarwal et al.,
2013)
According to Agarwal et al. (2013), salinity and/or drought stress are perceived
by signalling sensor molecules and sent to the cells, where the stress signal is amplified
by signal transduction pathways. Histidine kinases (HKs) and receptor-like kinases
(RLKs) are two important protein families involved in stress perception. Calcium
sensing (Ca++) is one of the most well described and most complex signal sensing
cascades; and the mitogen-activated protein (MAP) kinase cascade is one mechanism
plants use to translate the external stimuli into cellular responses. Upon detection of the
signal, transcription factors such as AREB/ABF, bZIP, CBF/DREB, MYC/MYB, NAC,
and WRKY are triggered. These transcription factors play a pivotal role in developing
abiotic stress tolerance in plants. They interact with promoters of downstream genes and
regulate the expression of these genes. Genes activated by these transcription factors will

Chapter 1: Introduction and Literature Review 7
subsequently produce many classes of molecules, which may help mitigate damage by
these stresses. These stress-involved functional proteins include ROS scavengers,
osmoprotectants, ion transporters, chaperones, photosynthesis and fatty acid metabolism
enzymes, proteinase inhibitors, late embryogenic-abundant (LEA) proteins, and heat
shock proteins (HSPs) that protect plant cells and macromolecules from damage and
ultimately lead to tolerance. In addition, many other genes encoding transcription
factors, protein kinases and phosphatases involved in signal transduction pathways are
induced in plant cells under stress conditions (Bhatnagar-Mathur et al., 2008). As a
consequence, genes induced by a specific stress are considered to function in that stress
response (Swindell, 2006; Shinozaki and Yamaguchi-Shinozaki, 2007; Ni et al., 2009).
Genes involved in stress perception, signal transduction, and immediate protection are
activated early in the initial stages of stresses. While those induced later are likely
responsible for stress adaptive establishment such as homeostasis and recovery
(Swindell, 2006; Mishra et al., 2016; Zhu, 2016).
Stress perception has been found to be specific for certain stress factors and to
be unique for some stress combinations (Mittler, 2006). However, drought, salt, and
cold stresses (termed osmotic stresses) have been shown to share several common
signal transduction pathways that further regulate the expression of similar gene sets
(Xiong and Zhu, 2002; Fujita et al., 2006; Barnabas et al., 2008; Fujii and Zhu, 2012;
Mishra et al., 2016). In fact, the genes induced by drought stress were found to be
identical to those induced by salinity stress and some of those induced by cold stress
(Qureshi et al., 2007). Studies have suggested that osmotic stresses are transmitted
through at least two pathways: ABA-dependent and ABA-independent pathways. The
existence of cross-talk or convergence between these signalling pathways has also
been demonstrated (Fujita et al., 2006; Baena-Gonzalez and Sheen, 2008; Huang et
al., 2012). As a result, there is an overlap in the expression pattern of stress-responsive
genes after cold, drought, high salt, and ABA application. For example, analysis of
cDNA harvested from rice exposed to cold, drought, high-salinity stresses and ABA
application by cDNA microarray followed by RNA gel blot indicated that (1) 40% of
drought-or high salinity-inducible genes were also inducible by cold and (2) more than
98% of the high salinity- and 100% of ABA inducible genes were induced by drought
stress (Rabbani and Maruyama, 2003). The convergent point among abiotic stress
signalling pathways was thought to be a MAP kinase cascade because it connects

8 Chapter 1: Introduction and Literature Review
diverse sensors to a broad range of cellular responses to abiotic stress (Fujita et al.,
2006; Huang et al., 2012). For instance, an Arabidopsis gene, AtMPK3, was found to
be induced at the mRNA level by drought, cold, high salinity and mechanical stresses
that regulate the expression of many stress-responsive genes including pathogen
defense genes (Mizuguchi et al., 1996). Perhaps, it is this convergent point among
abiotic stress signalling pathways that enables plants to efficiently respond and adapt
to multiple stresses during their life cycles in their changing living environments.
Regarding to functions of stress-inducible gene products in initial stress response and
in establishing plant stress tolerance together with the existence of convergent points
among various stresses, targeting genes in stress signalling pathways for engineering
plants with enhanced abiotic stress tolerance appears to be the most promising
approach (Mittler and Blumwald, 2010). These reports suggest that it is feasible to
generate crop varieties that are tolerant to multiple abiotic stresses.
1.2.2.2 Biochemical changes in abiotic stress responses affect crop quality
Upon detection of abiotic stress, numerous biochemical changes occur in plant
tissues. Initial abiotic stresses generate ROS that in turn cause oxidation of membrane
lipids, proteins, and nucleic acids in plant cells and subsequently cause biochemical
changes. In the development of stress tolerance, numerous biochemical reactions occur
that alter the chemical composition of plant cells. With regard to crop plants, these
chemical alterations affect the quality of harvested products. Observed biochemical
changes affecting food quality are available in the literature (Nagarajan and Nagarajan,
2010; Wang and Frei, 2011; Halford et al., 2015); and several major changes related to
the above-mentioned gene expression network are summarised herein as examples.
Under stress conditions, a higher protein concentration in harvested parts of crops has
been observed as a result of increased expression of various genes. Similarly,
antioxidants such as phenol, ascorbate, carotenoids and tocopherol have been recorded
to be produced at higher levels for detoxifying ROS during stress responses. In the case
of carbohydrates, changes in chemical composition vary depending on the plant tissues.
Grain crops experiencing abiotic stress, especially during drought and heat stress,
reduced grain starch concentrations and most possibly due to reduced activity of the
enzyme starch synthase. In tuber crops such as potato, cassava, and sweet potato,
decreases in starch concentration due to inhibition of starch synthase activity and
increases in concentration of maltose due to higher activity of β-amylase, which

Chapter 1: Introduction and Literature Review 9
decomposes starch to maltose, have been observed. Sugar concentration in fruit and
vegetable crops was not consistent across crops. Sugars and sugar alcohol such as
mannitol and sorbitol play an important role in abiotic stress tolerance and are
accumulated during stress responses by conversion from other sugars such as fructose-
6-phosphate and glucose by stress induced enzymes Therefore, changing concentration
of certain forms of sugars under stress may be the result of the conversion from one form
to another. Leaf senescence as a result of programmed cell death induced by ROS,
together with a reduction of chlorophyll content and leaf water content negatively affects
physical and sensory traits of vegetables. Alterations in fatty acid composition of oil
crops under stress have also been recorded with the general trend of increased and
decreased proportions of saturated fatty acids and (poly) unsaturated fatty acids,
respectively. These are believed to be due to changing activities of enzymes involved in
lipid synthesis and conversion (Nagarajan and Nagarajan, 2010). Changes in membrane
lipid composition by increased unsaturated fatty acids were found in chilling
temperature adapted cells and transgenic tobacco plants with increased levels of
unsaturated fatty acids have shown improved in chilling tolerance (Bhatnagar-Mathur et
al., 2008).
In general, from initial responses to adaptation establishment in crop plants
undergoing abiotic stresses, various sets of stress-responsive genes are activated and
resulted in the changes to biochemical profiles of harvested parts. Many biochemical
substances such as phytochemicals, vitamins, antioxidants, proteins, sugars, free amino
acids, oils, and aroma volatiles are important determinants for food quality and safety.
As analysed in the above-mentioned studies, some of the changes including increased
antioxidants, proteins, and monounsaturated fatty acids were found to be beneficial for
food quality. However, most of the changes were identified to have negative impacts on
food quality and food safety.
1.2.2.3 Physiological adaptation
Stresses including drought, salinity, and cold inhibit plant growth by primarily
osmotic stress and decreasing cell turgor leading to the arrestment of shoot growth, cell
division and expansion. To counteract the effects of osmotic stress and maintain cell
turgor, adaptive plants use efficient osmotic adjustment strategies. Numerous
physiological mechanisms, as a result of osmotic adjustments, are significantly
advantageous for drought and salinity stress adaptation of plants include maintaining cell

10 Chapter 1: Introduction and Literature Review
stability, accumulating antioxidants and compatible solutes, effectively using water,
increasing soil water extraction by changing root architecture, maintaining higher leaf
relative water contents, controlling stomatal closure to reduce water loss (Manavalan and
Nguyen, 2012; Shabala and Munns, 2012). Additional beneficial physiological
mechanisms that reduce sodium ion toxicity caused by salinity stress include exclusion of
Na+ uptake by the root, sequestration of Na+ at intracellular and extracellular levels,
retention of K+ in the cytosol and uptake of Na+ to the vacuole (Shabala and Munns, 2012).
As a consequence of adjustments to stresses, various physiological, anatomical,
and morphological changes have been observed and considered as essential features in
plant adaptation to these stresses. Cell wall and leaf folding to avoid desiccation have
been found to be important and novel features in resurrection plants (Mundree et al.,
2002; Ingle et al., 2007; Karbaschi et al., 2016). Similarly, some heat-tolerant wheat
cultivars implement leaf rolling to prevent structural and functional damage of the
pigment antenna complexes, the reaction centre of photosynthetic system (PS) II, and
the electron transport between PSII and PSI (Sarieva et al., 2010). Changes of root
architecture by increasing branch root growth that enhance total root surface area for
better access to water and nutrients have been identified as desirable traits of adaptive
plants to both salinity and drought stresses (Manavalan and Nguyen, 2012; Shabala and
Munns, 2012; Pierik and Testerink, 2014). For example, studies on how maize roots
adjusted to optimize water and nitrogen uptake in different soil environments revealed a
number of root architecture alterations contributing to effective water and nutrients
uptake or avoidance of toxicity in their living environments (Lynch, 2013). The
modulations upon stresses on the primary root diameter, the growth angles of seminal
roots, the numbers of lateral roots, the length of root hairs, the branching ability of crown
roots, the abundance of cortical aerenchym, the size of cortical cells resulted in a deeper
or shallower root system to match the water and nutrient conditions in the soil. Leaf
modifications have been found to facilitate protection of photosynthetic machinery,
preventing toxicity of ionic and oxidative radicals, and reducing leaf transpiration, light
and UV irradiation damage. Salinity and drought adapted genotypes can be identified
by several morphological features of leaves such as smaller and thicker leaves, leaf
surface covered by epicuticular wax, anthocyanin pigmentation, glaucous layer, or
pubescent layer. Salt glands and bladders were found in leaves of many halophytes, the
salt tolerant plants (Manavalan and Nguyen, 2012; Shabala and Munns, 2012; Karbaschi
et al., 2016).

Chapter 1: Introduction and Literature Review 11
The above-mentioned plant responses to abiotic stresses showed that the response
is complex and depends on the species and genotype, the type of stresses, the length and
severity of stresses, the age and stage of plant development, the organ and cell type, the
subcellular compartment, gene and its mode of action. Understanding the full picture of
how plants respond to abiotic stress will enable the determination of key processes that
contribute to crop yield under stress. This knowledge will be valuable for plant breeding
towards improving crop yield stability under changing climatic conditions.
1.2.3 Abiotic stress, world food security, and molecular breeding
Abiotic stresses negatively affect plant growth, reduce crop productivity, food
quality, and impact global food security. It has been shown that over 85% of crop loss is
due to environmental stresses (USDA, 2017). For cereal crops, the most important staple
food of most human societies, even a mild abiotic stress without affecting survival of the
vegetative parts at a short period before anthesis could irreversibly affect grain yield
(Dolferus et al., 2011). Wang and Frei (2011) extensively analysed the impact of the five
most common environmental stresses on seven parameters used for evaluating food
quality. Their results showed that only two parameters, levels of protein and antioxidants,
were positively affected while five parameters including lipids, non-structural
carbohydrates, minerals, feed value and sensory traits were negatively affected; the net
effects were also negative. Moreover, in most of the future climate-change projections, an
increase in aridity of many areas in the globe is the major concern for sustainability of
global agriculture. It is predicted that about 7% of total land area and 20% of the irrigated
agriculture land is affected by soil salinity (Agarwal et al., 2013). The impacts of abiotic
stresses undoubtedly impose threats for global agricultural sustainability and food
security. Future increases in the human population and living standards combined with
soil water deficits and salinisation as a result of climate changes continuously threaten
global agricultural sustainability and food security. These remain constraints for plant
breeders towards ensuring food security for future populations. Enhancing plant resilience
to the effects of abiotic stresses shows great potential as the most effective target for
improved agricultural sustainability (Newton et al., 2011).
Many attempts have been made by plant breeders worldwide to improve abiotic
stress tolerance. Conventional breeding has been extensively used with limited success
(Bhatnagar-Mathur et al., 2008; Gosal et al., 2009; Ashraf, 2010; Agarwal et al., 2013;
Shahbaz and Ashraf, 2013). In fact, although a number of cereal crop cultivars tolerant to

12 Chapter 1: Introduction and Literature Review
drought developed through conventional breeding have been commercialised, the
effectiveness is very low (Ashraf, 2010). A number of reasons accounting for the limited
success of this breeding method include (1) reliance on the existence of naturally tolerant
cultivars among species because of the sexual barrier between species, (2) the procedure
is time-consuming, cost-and labour-intensive, and (3) the transference of unwanted linked
traits along with desirable traits. Marker-assisted breeding (MAB), a procedure combining
conventional breeding with DNA markers, has also been applied for improving abiotic
stress tolerance in crops with better results. This process is still reliant upon conventional
breeding for producing new cultivars, however the efficiency has been significantly
enhanced as using DNA markers for selection reduces the length of breeding cycles
(Cominelli et al., 2013). The combination of DNA markers in this breeding method have
allowed high-throughput screening of germplasm for beneficial traits and the
identification of quantitative trait loci (QTLs) of abiotic tolerant traits. A number of QTLs
for abiotic stress tolerance have been identified in important crops including QTLs for
salinity stress tolerance in rice (Shahbaz and Ashraf, 2013), QTLs for drought tolerance
in maize, barley, cotton, sorghum, and rice (Ashraf, 2010). However, due to a lack of
understanding of the key genes underlying the QTLs, the undesirable agronomic traits
involved in QTLs from donor parents are also brought along with stress tolerance
(Bhatnagar-Mathur et al., 2008). While MAB has still been widely used, the development
of enhanced abiotic stress tolerant crops by genetic engineering approaches has recently
gained attention. These approaches overcome the limitations of the two previously
mentioned methods because it uses genes from tolerant species, across the genetic barrier,
and only transfers the desirable traits into pre-selected elite cultivars. During the last
several decades, many genes from different sources have been transferred to a variety of
crop species to develop abiotic stress tolerant lines. These genes can be categorized into
two groups: structural and regulatory genes (Gosal et al., 2009; Agarwal et al., 2013).
Currently, transgenic crop lines are being evaluated under laboratory, greenhouse and field
conditions. For example, maize plants transformed with a nuclear factor ZmNF-YB2
improved yields under drought stress at both greenhouse and field conditions (Nelson et
al., 2007). Similarly, Shi et al. (2015) used ZmARGOS8, a regulator of ethylene signal
transduction, to overexpress in maize plant and demonstrated that ZmARGOS8-
overexpressing maize plants increased grain yield under drought stress conditions without
reduction of grain yield under unstressed conditions. Furthermore, Shi et al. (2017)
generated the maize ARGOS8 variants using genome editing technology, the CRISPR-

Chapter 1: Introduction and Literature Review 13
Cas9. The maize lines carrying ARGOS8 genome-edited variants were tested in the field
of eight locations across the United State with different environmental conditions. The
results showed that maize lines carrying ARGOS8 genome-edited variants improved grain
yield under field drought stress conditions and had no yield loss under well-water
conditions. There are still some considerations on the types of genes that should be used
for this method. Genetic engineering is currently thought to hold the greatest potential in
developing enhanced abiotic stress tolerance crops. It is believed that the gaps between
future required food and what conventional breeding can provide will be filled by
achievements of genetic engineering technology in a sustainable and responsible manner
(Oliver, 2014).
To fulfil the task of sustainable future food demand, the future crops need to
maintain high yield under stressful environmental conditions and unpredictable changing
climates. It is likely that crops of the future need to be stacked with multiple desired traits
for higher yielding while mitigate the effects of abiotic stresses and complex pathogenesis
incidences triggered by changing climates. Therefore, combining multiple desired traits
into existing nutritive value and high yielding varieties through genetic engineering
appears to be the most appropriate approach to generate such crops. While multigene
manipulation remains the technical hurdles impeding the combination of numerous genes
into single selective genotype (Halpin, 2005), using single gene of upstream regulators to
activate the balanced adaptive response that will enhance plant tolerance to different
stresses has been considered the most effective strategy to achieve multiple desired traits
combined in future crop generation (Mittler and Blumwald, 2010; Cominelli et al., 2013).
1.3 OSMOTIN AND OLP: THE STRESS-RESPONSIVE
MULTIFUNCTIONAL PROTEINS
1.3.1 Osmotins and OLPs, the members of pathogenesis-related proteins
Osmotin protein was first isolated and characterised in tobacco cells cv.
Wisconsin 38 adapted to grow in vitro in a medium containing high concentrations of
NaCl or polyethylene glycol (PEG) (Singh et al., 1985). This 26 kDa protein was
suggested to be involved in the adaptation to NaCl and water stress of tobacco cells.
When cultured for long durations in a medium containing high levels of NaCl, tobacco
cells synthesized and accumulated osmotin up to 12% of total cellular protein (Singh
et al., 1987). Since these initial experiments, genes encoding osmotin and OLPs have
been identified in many other plants such as petunia, Petunia hybrida (Kim et al.,

14 Chapter 1: Introduction and Literature Review
2002), pepper, Capsicum annuum (Hong et al., 2004), soybean, Glycine max (Onishi
et al., 2006) black nightshade, Solanum nigrum (Jami et al., 2007), strawberry,
Fragaria x ananassa (Zhang and Shih, 2007), ginger, Zingiber officinale (Prasath et
al., 2011), and black pepper, Piper colubrinum (Mani and Manjula, 2010), to name a
few. Although the accumulation of osmotin in plant cells has been found to be related
to osmotic stress, its antifungal activity and its sequence homology with thaumatin, a
pathogenesis-related protein, have reclassified osmotin as a pathogenesis-related
protein group 5 (PR-5) (Singh et al., 1987; Yen et al., 1994b; Zhu et al., 1995; Husani
and Rafiqi, 2012). Based on their isoelectric point (pI), PR-5 proteins are divided into
three subclasses, osmotin proteins were in the basic subclass and OLPs in the neutral
subclass (Koiwa et al., 1994).
Tobacco osmotin can exist in two forms; an aqueous soluble form (osmotin-I) and
a detergent soluble form (osmotin-II). Characterisation of tobacco osmotin showed
slight differences in their pI (7.8, and 8.2) and molecular weight of the two forms, the
N-terminal sequences however were identical (Singh et al., 1987). Tobacco osmotin is
synthesized as a pre-protein with a molecular weight of 26 kDa, the mature form has a
24 kDa (Singh et al., 1989). The N-terminal sequence and an alanine in the cleavage site
of N-terminus are conserved among PR5 proteins (Min et al., 2004). This N-terminal
signal peptide is responsible for protein transport across endoplasmic reticulum (ER)
membrane. Like other PR5 proteins, osmotin was thought to be synthesized as precursor
with an N-terminus, after sorting in ER the signal peptide is cleaved off and the mature
form has slightly smaller weight (Singh et al., 1989).
Crystal structure analysis of tobacco osmotin revealed a noncrystallographic
dimer in the asymmetric unit; its two monomers were slightly different in tertiary
structure; and its folding was similar to that of thaumatin and other PR proteins (Min et
al., 2004) (Figure 1.2). The comparison of the three-dimensional structure of tobacco
osmotin with other osmotin and OLPs showed that the osmotins comprise three
conserved domains and one large acidic cleft. Domain I consists of an 11-strand flattened
β-sandwich that forms the compact core of the molecule. Domain II consists of several
loops extending from domain I that is stabilized by four disulfide bonds. Domain III
consisted of a small loop with two disulfide bonds. The tertiary structures of osmotin,
thaumatin, zeamatin, and antifungal PR-5 showed high homology (Fig 1.2). Small
differences however were observed in domain II and the distribution of surface charge

Chapter 1: Introduction and Literature Review 15
(Anzlovar and Dermastia, 2003). It is widely accepted that this acidic cleft possesses
amino acid residues acting as catalytic pair capable of glucan hydrolysis and this
structural feature is required for antifungal activity of osmotins and other PR5 proteins
(Mani et al., 2012).
Figure 1.2 Structure homology of osmotin, thaumatin and antifungal PR-5
(Min et al., 2004). Surface representation of the clefts of osmotin (A), PR-5d (B), zeamatin (C)
and thaumatin (D) depicting the electrostatic potential with a colour scale that varies from blue
to red, representing positive and negative potential, respectively.
The presence of alanine at the cleavage site of N-terminal sequence and 16
cysteine residues distributed throughout the protein sequence and linked by disulfide
bridge formation was considered the conserved features of PR5 protein (Min et al.,
2004). The 8 disulfide bridges formed by these conserved cysteines were found to be
responsible for stability and correct folding of the molecule, supporting its resistance
to protease degradation and its stability under extreme thermal and pH conditions (Liu
et al., 2010). In addition, the presence of acidic clefts, as a common feature, in the PR5
protein structures was found to be essential for their antifungal activities against
diverse fungal pathogens (Liu et al., 2010).
1.3.2 Osmotins and OLPs play roles in multi-stress responses
Osmotin and OLP genes are reported to be induced by at least ten hormonal,
pathogenesis and environmental stimuli (Kononowicz et al., 1992; LaRosa et al.,
1992; Raghothama et al., 1993; Zhu et al., 1995). These stimuli included ABA, auxin,
ethylene, drought, salinity, cold, UV light, tobacco mosaic virus infection, fungal
infection, and wounding. Expression profiling studies have demonstrated the
involvement of osmotin in both osmotic and pathogenic defence functions. However,
the abundance of mRNA did not always reflect the levels of protein accumulation. In
tobacco cells, the osmotin mRNA in cells adapted to salt are approximately 15 fold
higher than the non-adapted cells and present at a constant level. The mRNA was

16 Chapter 1: Introduction and Literature Review
decreased in exponential phase of growth and increased in stationary phase in non-
adapted cells. The osmotin protein was synthesized and accumulated in NaCl-adapted
cells; in non-adapted cells the protein was synthesized but not accumulated (LaRosa
et al., 1992). In tobacco plants, the protein accumulated to substantial amounts only
treated with ethylene, fungal infection or long-term exposed to salinity or water
deficits. The levels of osmotin accumulation could go up to 12% total cellular protein
when cultured for long duration in high-NaCl containing medium (Singh et al., 1987).
Studies on osmotin promoters have also shown activity in response to a number
of stress factors. The promoter region of a tobacco OLP contains two AGCCGCC
sequences responsible for ethylene-induced expression that are common in PR5
proteins (Sato et al., 1996). Additionally, the tobacco osmotin promoter has three
elements specifically interacting with nuclear factors (Liu et al., 1995) and contains
several sequences that are highly similar to ABRE, as-1 and E-8 cis element sequences
(Raghothama et al., 1993) or OLP from Curcuma amada had the GT-1 box and
TGTCA element (Prasath et al., 2011), which are typical for response to osmotic
stresses. Subsequent analysis of the promoter sequences of Arabidopsis and rice in
thaumatin-like protein (TLP) and OLP genes showed that most OLP genes of
Arabidopsis contain the binding elements associated with fungal response while these
binding elements are absent in all OLP genes of rice (Dehimi et al., 2012). These
results have suggested the involvement of osmotins and OLPs in both abiotic and
biotic responses of plants and that investigation on the promoter together with the
coding sequence may provide more information supporting the functions of certain
osmotin and OLP genes.
Subcellular localisation of a protein is typically related to its functions (O'Rourke
et al., 2005). Tobacco osmotin was found to target to vacuole inclusion bodies and this
localisation was dictated by the presence of a C-terminal 20 amino acid peptide sequence
(Singh et al., 1987). CaOsm1 from pepper, Capsicum annuum, was validated to
localise to the plasma membrane (Choi et al., 2013). Other osmotins have been shown
be secreted proteins and localise to other sub-cellular organelles. The presence of an N-
terminal signal peptide was found to be essential for transport to endoplasmic reticulum,
the first location within the secretion pathway (Sato et al., 1995). Depending on their
either N- or C- signal peptides, osmotin or OLPs are predicted to localise in either
extracellular matrix, plasma membrane, chloroplast, vacuole, or endoplasmic reticulum.

Chapter 1: Introduction and Literature Review 17
The diverse subcellular localisations of plant osmotins and OLPs have demonstrated
their multiple functions in response to various stress factors.
1.3.3 Expression of osmotins and OLPs enhanced plant tolerance to multiple
stress factors
Osmotin and OLP genes have been expressed in various crops. Some of these
plants are presented in the Table 1.1. In these transgenic plants, osmotin and OLPs
have consistently shown stress-responsive multifunctional roles that enhanced
tolerance to salt, drought, and cold stress as well as improved bacterial and fungal
resistance. These results have validated the functional involvements of osmotins and
OLPs in plant response to abiotic and biotic stresses. The ability of osmotins to exhibit
dual functions in a broad-range of abiotic and biotic stresses has indicated osmotins as
potential candidate genes for resolving global problems in agriculture such as
increasing severity of drought, salinity, low temperature and rising disease incidence.

18 Chapter 1: Introduction and Literature Review
Table 1.1 Representatives of transgenic plants expressing plant osmotins and
their phenotypes
Transgenic
plant
Source of
osmotin gene Phenotype of transgenic plants References
Potato Tobacco Resistance to Phytophthora infestans (Liu et al., 1994)
Rice Rice Resistance to Rhizoctonia solani (Datta et al., 1999)
Olive tree Tobacco Tolerance to cold stress (D'Angei and
Altamura, 2007)
Strawberry Tobacco Tolerance to salinity stress
(Husaini and Abdin,
2008a)
(Husaini and Abdin,
2008b)
Wheat Tobacco Enhanced ability to produce roots in
high 250 mM NaCl
(Noori and Sokhansanj,
2008)
Cotton Tobacco
(truncated) Tolerance to drought (Goel et al., 2010)
Chilli
pepper Tobacco Tolerance to salinity stress
(Subramanyam et al.,
2011)
Mulberry Tobacco
Tolerance to drought and salinity,
resistant to Fusarium pallidoroserum,
Collectotrichum gloeosporioide and
C. dematium
(Das et al., 2011)
Soybean Tobacco Tolerance to salinity stress and
resistance to fungal infection
(Subramannyan et al.,
2012)
Tomato Tobacco Tolerance to cold stress (4 oC) (Patade et al., 2013)
Arabidopsis Pepper Resistance to Pseudomonas syringe
and Hyaloferronosspra arabidopsidis (Choi et al., 2013)
Tea Tobacco Improved drought tolerance and
quality
(Bhattacharya et al.,
2014)
Carrot Tobacco Tolerance to drought (Annon et al., 2014)
Soybean Solanum
nignum Tolerance to drought (Weber et al., 2014)

Chapter 1: Introduction and Literature Review 19
1.3.4 Possible roles of osmotins and OLPs in response to abiotic and biotic stress
The mechanisms by which osmotins mediate plant defence have not been fully
understood. Similar to other PR-5 proteins, osmotin and OLP have antifungal properties
against a broad range of plant pathogens. Tobacco osmotin is involved in antifungal
responses by permeabilizing the plasma membrane and killing fungal cells (Abad et al.,
1996). Inducing fungal membrane permeabilization was also shown as antifungal
properties of CpOsm from Calotropis procera (Freitas et al., 2011). In addition, osmotins
have been associated with the MAPK pathway in yeast to weaken yeast cells and resulted
in rapid cell death (Ibeas et al., 1998) or to suppress the Ras2/cAMP stress response
pathway causing apotosis in yeast (Narasimhan et al., 2001). The role of pepper osmotin
(CaOsm1) in anti-microbial responses was demonstrated to be associated with the
hypersensitive cell death response and oxidative signalling (Choi et al., 2013). The
common constituents of fungal cell walls are glucan molecules, a type of polysaccharide.
Typical structural features of osmotins are glucan binding and hydrolysation into simpler
carbohydrates. Binding β-1,3-glucan was thought to be required for antifungal activities
of osmotin (Prasath et al., 2011; Mani et al., 2012). A study on two osmotins with
differential antifungal activity from Piper colubrium revealed that an internal deletion of
50 amino acid residues of the smaller one (PcOsm1), as compared to the PcOsm2,
resulted in its structure distortion in domain III and reduced the number of active binding
sites to β-1,3-glucan, 17 in PcOsm1 vs 21 in PcOsm2. Corresponding in vitro
antifungal assay of these two osmotins revealed a significant difference in antifungal
activity. While PcOsm1 showed undetectable antifungal activity, PcOsm2 exhibited
strong antifungal activity (Mani et al., 2012). It has been proposed that osmotin requires
cell wall components of fungal target for its functions (Abad et al., 1996). Phosphomanno
proteins, the mannoproteins on the outer layer of yeast cell wall were determined to be a
surface determinant for osmotin binding to the yeast cell wall (Yun et al., 1997). In
addition, Narasimhan et al. (2005) provided evidence that PHO36, a seven
transmembrane domain receptor-like polypeptide, which regulates lipid and phosphate
metabolism, was an osmotin binding plasma membrane protein that is required for full
sensitivity to osmotin in yeast. Although the antifungal activities of osmotin have been
demonstrated, its receptors and factors facilitating osmotin binding on fungal cells have
been determined and the mechanisms of its actions have been proposed, a full
understanding of its mode of action is still unclear and needs to be further elucidated.

20 Chapter 1: Introduction and Literature Review
There is evidence of osmotin binding cytokinin, a hormonal signalling molecule.
The biological implementations of osmotins in hormonal signalling is yet to be elucidated
but its binding to protein receptors has shown to affect ion flux, phosphorylation of
regulatory proteins, transcription, translation, and secretion (Kobayashi et al., 2000). It has
been proposed that binding to cytokinin may be a mechanism by which osmotin mediates
plants resistance to bacteria. Many bacteria, such as Agrobacterium tumefaciens, modulate
host plant activities to produce specific cytokinins. By binding to cytokinins, osmotin
deactivates of cytokinins, which prevents the spreading of bacterial infection (Viktorova
et al., 2012). Thus, binding hormonal signalling molecules may be involved in host
defence mechanism of osmotin.
Diverse functions of osmotin have been exhibited in response to abiotic stresses.
Tobacco osmotin found to be associated with salt adaptation and localised in the vacuole
together with an OLP identified from the intercellular space of halophyte led to the
suggestion that osmotin is involved in salt tolerance mechanisms of plants by reducing the
build-up of Na+ ion in the cytoplasm and the uptake of that ion into the cell or acting as
Na+/H+ antiporter (Singh et al., 1987; Yen et al., 1994b). Binding and hydrolysing glucan,
particularly β-1,3- and β-1,4-glucan may be one of the mechanisms of osmotin
contributing to abiotic stress tolerance in plants. It has been known that small sugar
molecules can act as osmolytes and contribute to maintaining cell turgor under osmotic
stress and/or play roles in organelle membrane formation, chloroplast protection under
drought (Dway and Smille, 1971; Satoh et al., 1976; Lee et al., 2003). β-1,3-glucan is a
component of plant cell wall and β-1,4-glucan is available in cytoplasm. Thus, osmotin
may generate osmolytes through β-1,3- and β-1,4-glucanase hydrolysing activities for
enhancing abiotic stress tolerance in plants. However, a direct evidence of plant cell wall
β-1,3-glucan binding to osmotin is still lacking and need to be further exploited. The
performance of plants expressing osmotin suggested its roles in signalling pathway.
Programmed cell death (PCD) induction is one of the features related to cold adaptation
of olive trees. In transgenic olive trees, osmotin was proven to induce PCD by blocking
cold-induced calcium signalling and modifying cytoskeleton in response to cold stimuli
(D'Angei and Altamura, 2007), suggested its relationship to calcium signalling cascade.
Osmotin has shown enhanced cold tolerance in transgenic tomato by modulating transcript
abundance and functional expression of stress-responsive genes (Patade et al., 2013);
enhanced salt and drought stresses in other above-mentioned transgenic plants by
upregulating the levels of several compatible osmolytes and ROS scavengers (Barthaker

Chapter 1: Introduction and Literature Review 21
et al., 2001; Husaini and Abdin, 2008a; Parkhi et al., 2009; Das et al., 2011; Subramanyam
et al., 2011; Subramannyan et al., 2012; Annon et al., 2014). These observations together
with the similarity in molecular weight to transcription factors suggest that osmotin might
regulate plant responses to abiotic stress by acting as either a transcription factor or cell
signal modulator, or both (Abdin et al., 2011). However, osmotin does not have any DNA-
binding motif to function as a transcription factor, the role in signalling pathways as a cell
signal modulator has been strongly supported (Abdin et al., 2011; Viktorova et al., 2012;
Kumar et al., 2015). Moreover, tobacco osmotin was proven to interact with AMP-
activated protein kinase, a member of MAP kinase (Narasimhan et al., 2005). MAP kinase
represents the key molecules catalysing the phosphotransfer reaction fundamental to most
signalling and regulatory processes associated with enzyme activation, macro-molecule
assembly, protein localisation and degradation in plant stress responses. In plants, MAPKs
and calcium-dependent protein kinases (CDPKs) are in two major signal transduction
pathways involved in plant response to various abiotic and biotic stresses. Some members
of the two protein family were found working together to mediate crosstalk that triggers
common stress responses such as ROS and hormonal signalling, accumulation of
osmoprotectants and ROS scavengers, stomatal closure, osmotic adjustment leading to
cross-tolerance to different stress conditions (Fujita et al., 2006; Wurzinger et al., 2011;
Mohanta and Sinha, 2016). The roles of osmotins in plant response have shown to be
associated with these two signalling pathways that helps osmotin-expressing plants
tolerance to different abiotic and biotic stress factors. The intensive studies on osmotins
discussed above have linked functions of osmotins and OLPs to a number of signalling
crosstalk between abiotic and biotic stress responses. Although the mode of action of
osmotins remains unclear, their multifunctional nature suggested that osmotins represent
the key regulators mediating plant response to biotic and abiotic stresses.
Even though osmotin was discovered early and identified as the most abundant
protein in cultured tobacco cells adapted to osmotic stress (Singh et al., 1985), the
difficulties in recombinant osmotin productions have prevented functional studies on the
protein level and resulted in its poor elucidated mode of action (Viktorova et al., 2012).
To date, only two published studies described the expression and purification of
recombinant osmotins in microbial systems (Campos et al., 2008; Tzou et al., 2011). The
poor availability of purified recombinant osmotin was demonstrated to be due to its
toxicity and physical properties. Failure to produce recombinant tobacco osmotin in
microbial systems in earlier studies was believed to be caused by osmotin antimicrobial

22 Chapter 1: Introduction and Literature Review
activity that resulted in toxicity to osmotin expressing microbes (Tzou et al., 2011). In
addition, osmotin protein structure has eight disulfide bonds and proper folding of these
disulfide bonds is required for maintaining its functions. To minimize toxicity to bacterial
cell, Campos et al (2008) and Tzou et al. (2011) targeted recombinant osmotin (Solanum
nigrum OLP and truncated tobacco osmotin, respectively) accumulation in inclusion
bodies and the system resulted in high accumulation of recombinant osmotin up to 30%
of total protein extracts. However, targeting osmotins to inclusion bodies resulted in a
majority of insoluble and aggregated form with misfolded protein present and the correct
eight disulfide bonds in osmotin structure were not achieved. Further steps designed for
denaturing and refolding these recombinant osmotins led to the highly pure osmotin with
antifungal activities against a broad range of plant and human fungal pathogens. The
protocols for expression and purification of recombinant osmotins in bacteria are now
available but including the denaturation and refolding steps that have made it difficult for
application in large scale. For proper folding of recombinant osmotins, the use of plant
expression systems seem to be more feasible. However, the high hydrophobic nature of
osmotins and the fact that many osmotins contain a membrane binding domain need to be
taken into consideration when manipulating gene constructs for expressing in plants.
1.3.5 Osmotins and OLPs as potential candidate genes for enhancing multi-
stress tolerance and for other uses in food industry
Intensive studies and experimental data on biological systems have provided
various practical evidences for the roles of osmotin and OLPs as master regulators in
plant stress signalling that activates the acclimation response leading to enhancing
plant tolerance to multiple abiotic and biotic stress factors. Hence, osmotin appears to
be one of the potential candidate genes for developing multi-stress tolerant crops to
suit the requirements for future crop generations, as discussed above. The expression
of osmotin or OLP genes improved plant resistance to various fungal and bacterial
pathogens. Recombinant osmotin maintained antifungal activities against a broad
spectrum of fungi. These functions have made osmotin to be recommended for uses as
a food preservative in food industry and as plant-derived fungicide in feed stock for
organic meat industry (Liu et al., 2010; Viktorova et al., 2012; Kumar et al., 2015).
Besides, recent studies in mammalian system have shown that osmotin shares
similar functions of human adiponectin, the hormone playing critical role in obesity,
insulin resistance and atherosclerosis in human. Thus, osmotin was suggested to be
Chapter 1: Introduction and Literature Review 23
used as a therapeutic component in replace of adiponectin for treatment of diseases
related to adiponectin deficiency. Tobacco osmotin shares similarity in both structure
and function with human adiponectin. Adiponectin functions by binding to its plasma
membrane receptors called AdipoRs that further activates either 5’ adenosine
monophosphate-activated protein kinase (AMPK) pathways in skeletal muscles or
peroxisome proliferator activated receptor (PPARs) pathway in the liver to increase
insulin sensitivity and decrease inflammation. Osmotin competes with adiponectin for
binding to its receptors (Miele et al., 2011). Further experiment revealed that tobacco
osmotin acted as an adiponectin agonist in type II diabetes and obesity and could be
used as a therapeutic agent in replacement of adiponectin for type II diabetes and
obesity treatment in human (Trivedi et al., 2012). Similarly, a study on a rat model
system showed that both adiponectin and osmotin involved in neuroprotection against
glutamate-induced synaptic dysfunction, excitotoxicity and neurodegeneration in
developing brain, in which the role of osmotin as adiponectin agonist was confirmed.
The study indicated the beneficial use of osmotin in the treatment of human
neurodegenerative diseases (Shah et al., 2014). Adiponectin deficiency relates to some
diseases such as insulin resistance found in obesity and diabetic type II patients,
coronary artery disease, inflammation, and liver fibrosis. With the prevalence of
diseases related to adiponectin deficits, the use of osmotin as pharmaceutical products
appears to be feasible.
In summary, multifunctional properties of osmotin have made it a potential
candidate for future applications in engineering crop plants for enhanced stress
tolerance, in food and feed stock industries and as therapeutic agent in treatment
various mammalian disorders related to adiponectin deficiency.
1.4 RESURRECTION PLANTS: A NOVEL SOURCE FOR STRESS-
RESPONSIVE GENES
Resurrection plants belong to a small group of angiosperms that can tolerate
extreme levels of dehydration down to 4% relative water content and are thought to
possess unique mechanisms to cope with desiccation. Unlike their desiccation
sensitive counterparts, resurrection plants have developed a distinctive strategy to
withstand drought. Examples of their physiological responses to desiccation include
(1) the loss of all free water in vegetative tissues then rehydration when water becomes
available; (2) shading or dismantling photosynthetic machinery to reduce net

24 Chapter 1: Introduction and Literature Review
photosynthetic rate during severe cellular water deficit by either leaf folding and
anthocyanin accumulation or disassembling chloroplasts and chlorophyll on drying;
(3) regulating protection mechanisms to minimize cell damage such as forming
multiple vacuoles to maintain cell volume, cell wall folding to prevent mechanical
damage, or replacing water by compatible solutes (Mundree et al., 2002). With respect
to biochemical responses, resurrection plants have evolved a number of mechanisms
against subcellular stresses as listed by Ingle et al. (2007). These include changes in
cell wall composition, cytoplasmic packaging, and membrane lipid composition for
preventing mechanical damage; increasing enzymatic activities in degradation of
chlorophyll and elevating antioxidant production for reducing photosynthetic
damages. The synthesis of compatible solutes such as sucrose, trehalose, LEA, and
chaperone proteins for protecting the integrity of macromolecular is another strategy
used by resurrection plants. Proteomic analysis of the resurrection plant Xerophyta
viscosa during dehydration by Ingle et al. (2007) identified a number of dehydration-
responsive proteins including antioxidants, RNA-binding proteins and photosynthesis-
related proteins. These identified proteins provide evidence of the biochemical
changes that occur during desiccation tolerance of this plant species. Therefore,
resurrection plants represent both ideal model plants and a unique source for the
identification of novel, functionally relevant, stress-associated genes and pathways
(Mundree et al. 2002).
Primary studies on the Australian native resurrection grass that is a close relative of
the economically important cereals such as rice, sorghum and maize, the T. loliiformis,
have highlighted important strategies this plants used to withstand dehydration (Williams
et al., 2015; Karbaschi et al., 2016). The study by Karbaschi et al. (2016) showed that this
plant utilizes a number of physiological and structural mechanisms for rapid response to
water deficit and quick recovery upon rehydration. These mechanisms include (1) leaf
folding, cell wall folding and vacuole fragmenting quickly at the onset of dehydration that
mitigate the mechanical damages to tissues; (2) shutting off the photosynthesis at early
stage of dehydration for protecting the photosynthetic machinery and avoiding the
subcellular damages caused by ROS laid down upon stress; and (3) accumulating of
anthocyanin pigments and maintaining membrane integrity during drying resulted in the
protection of tissues during drying and minimizing repairs needed upon rehydration.
Williams et al. (2015) demonstrated that T. loliiformis modulates the trehalose metabolism

Chapter 1: Introduction and Literature Review 25
to induce and maintain autophagy pathways that prevent senescence and program cell
death, contributing to desiccation tolerance. These mechanisms suggested the potential of
T. loliiformis for exploiting genes for utilisation in enhancement of stress-tolerance in
crops, with special consideration in its close genetic relationship to important cereal crops.
With their unique ability to tolerate severe water deficit in drying vegetative
tissues, resurrection plants represent a potentially rich source of genes conferring
tolerance to abiotic stresses. A number of genes conferring dehydration tolerance have
been isolated from resurrection plants including XvINO1encoding a myo-inositol 1-
phosphate synthase (Lehner et al., 2008), XvSAP1 encoding a stress responsive protein
(Garwe et al., 2003), and XvGolS encoding galatinol synthase enzyme responsible for
the first catalytic step in raffinose family oligosaccharides (Peters et al., 2007). While
the gene product of XvSAP1 was thought to play roles in stabilizing plasma membrane
to prevent membrane damage, products of XvGolS and XvINO1 were proven to enhance
carbohydrate accumulation during response to water deficit. The expression of XvSAP1
in Arabidopsis thaliana enhanced tolerance to salinity, osmotic, and high temperature
stresses (Garwe et al., 2006). For effective utilisation of this potential genetic source for
the generation of genetic engineered crops with enhanced abiotic stress tolerance, other
genes involved in important abiotic stress responsive pathways need more investigation.
If considering the combined tolerance to multiple abiotic and biotic stress factors,
osmotin from resurrection plants is one of the most potential candidates for utilisation
through genetic engineering due to increasing evidence supporting the role of osmotin as
key regulators in response to abiotic and biotic stresses (as discussed in section 1.3.4).
1.5 RICE AS A TARGET FOR ENHANCING ABIOTIC STRESS
TOLERANCE VIA TRANSGENIC APPROACH
1.5.1 Rice is an important staple food crop
Rice is among the most important cereal crops and is the staple food for more than
a half of the world’s population. More than 90% of world rice production has been
produced and consumed in developing Asian countries that are experiencing a
population boom. Prediction of future climate change has led to an estimation that
affected rice culture areas will double at the end of this century (Jagadish et al., 2011),
thus impacting the food security of many Asian regions (Lobell et al., 2008). Manavalan
and Nguyen (2012) indicated that temperature increase, rising seas and changes in
patterns of rainfall and its distribution under global climate changes are the main causes

26 Chapter 1: Introduction and Literature Review
of substantial modifications in land and water resources for rice production and the
productivity of rice crops grown in different parts of the world, resulting in a threat of
global food security. Increasing rice production and productivity under such predicted
climate conditions is a challenging task but imperative to feed the increasing population
and to maintain world food security.
1.5.2 Rice is the model plant for monocots
Rice has been considered to be the model plant for monocots for many reasons.
Rice has the smallest genome size among cereal crops, estimated as 430 Mb. though
small the rice genome is 3.7 times larger than the model plant, Arabidopsis thaliana. Its
genome has high degrees of synteny among cereal genomes (Goff, 1999). In fact, rice
has been a favourite crop for genetic studies due to a well-defined protocol for genetic
transformation as well as widely distributed high density and physical maps (Shahbaz
and Ashraf, 2013). The complete genome sequences of the two major sub-species of
rice, indica and japonica, are now available (Londo et al., 2006) that have enabled the
discovery of genes and molecular pathways associated with diverse agronomic traits,
thus providing great opportunities for genetic improvements of this crop (Edwards and
Batley, 2010; Bolger et al., 2014). Rice is familiar with most populations around the
world because it is among the earliest domesticated crops, which is now cultivated
globally (Londo et al., 2006). In addition, its short life cycle and the ease to be handled
in laboratory conditions have made it a desirable crop for genetic studies. Many
screening and phenotyping techniques as well as modern tools developed on rice (Singh
et al., 2010; Zhang et al., 2014) have facilitated researches on rice. These advantages
have made rice to be a model crop for monocots.
1.5.3 Rice is susceptible to abiotic stresses
Among cereal crops, rice has been classified as a susceptible crop to major abiotic
stresses such as drought, high salinity, heat, and cold. Based on the salinity threshold
used to compare the salinity tolerance between species, rice is rated as a salt-sensitive
crop with a threshold of 3 dSm-1 and a slope of 12% per dSm-1. This means that rice
yield starts reducing when cultured in 30 mM NaCl and from that point, rice yield reduce
12% per 10 mM NaCl increasing of saturated soil extract (Sankar et al., 2011; Shabala
and Munns, 2012). Differential effects by salinity were found at different developmental
stages of rice plants, duration and severity of stress (Negrao et al., 2011). Rice
germination stage is more tolerant to salt than seedling stage, and reproductive stage is

Chapter 1: Introduction and Literature Review 27
the most susceptible phase. The mild stress at growth stage usually results in reducing
photosynthesis and growth that lead to decreased yields. A long duration of exposure to
even low salt concentration at 30 mM NaCl leads to reduced number of tillers per plant,
number of spikelets per panicle, spikelet fertility, and grain weight and reduced grain
production (Gay et al., 2009). Higher salt concentration leads to mature leaf death, and
if the rate of leaf death overtakes the rate of new leaf initiation and expansion then the
plant death occurs due to the lack of photosynthetic supply for further growth and
development (Munns and Tester, 2008). During growth stage, exposure of rice plants to
> 100 mM NaCl causes plant death before mature; but to < 50 mM NaCl delays panicle
initiation and flowering, reduces pollen viability and results in poor seed setting.
Reproductive stage is most susceptible to salt stress since ion toxicity affects pollen
viability and high level of toxic ions can lead to sterility (Negrao et al., 2011).
Drought is the leading factor affecting global rice production and severe effects
have been found in rainfed rice accounting for 45% of rice cultivation area (Babu, 2010).
Rice has been found to be susceptible to drought stress throughout its life cycle but if
stress occurs during flowering results in huge failure or complete yield loss (Swamy and
Kumar, 2013). The effects of drought on rice production is much more serious when
drought occurs in combination with heat stress (Barnabas et al., 2008; Dolferus et al.,
2011; Rang et al., 2011; Powell et al., 2012). According to these authors, rice is sensitive
to drought stress at the critical stage of flower development such as anthesis, pollination,
and pollen germination. Drought stress during flowering together with heat stress (above
37 oC) at a short period can lead to complete yield loss because these combined stresses
results in spikelet sterility. Drought brought about by recent changed climate conditions
has affected rice production in almost all rice culture areas and caused tremendous loss,
even in well-irrigated lands, and resulted in enormous social impacts (Breviariao and
Genga, 2013). These severe impacts were evidenced by the 2002 drought in India and
the 2004 drought in Thailand that affected 300 million Indian and 8 million Thai people,
respectively (Mohanty et al., 2013).
Likewise, the “cold spell” or low temperature threshold (typically night
temperature) for rice is 16 oC, considerably higher than other cereal crops. Under cold
conditions, rice exhibits poor seedling establishment at the start of the season, resulting
in delayed growth and massive grain losses at the end of the season when temperatures
drop below 16 oC at night (Dolferus et al., 2013). If temperatures drop below 12 oC at

28 Chapter 1: Introduction and Literature Review
the young microspore stage of rice pollen development, pollen sterility occurs resulting
in maximum yield losses (Oliver et al., 2005; Powell et al., 2012). Cold stress is
problematic for rice cultured in temperate or elevated regions and temperatures below
cold spell can lead to yield reductions of over 40% (Dolferus et al., 2013).
The young microspore stage of pollen development of rice has been shown to be
the most sensitive stage to a number of major abiotic stresses that account for a major
grain losses. The growth stage of rice is not sensitive to abiotic stresses as that of the
reproductive stage to most abiotic stresses, however, sensitivity to abiotic stress is
evaluated based on yield reduction. Therefore, rice has been classified as an abiotic stress
susceptible crop.
Being an important crop that provides staple food for a large part of world
population, rice production must be maintained in a sustainable way to ensure the food
supply for an increasing population. Its importance and abiotic stress susceptible features
have attracted numerous research programs for improving productivity while mitigating
stress effects. Intensive studies on rice genetic improvement have brought about various
tools, protocols, techniques for rice transformation, phenotyping, and genome sequence
readily for uses. Much information and knowledge of rice response to abiotic stresses
have also been revealed. These make rice the best target for expressing foreign stress-
responsive genes.
1.6 RECENT ADVANCES IN STUDYING FUNCTIONAL PROTEINS
Traditional methods for characterising a plant gene have relied mainly on primary
DNA sequence and transcriptional expression profile. It is well known that biological
functions are carried out mostly by proteins but RNA expression levels do not always
correlate with protein expression levels. In addition, biological properties of a protein
encoded by a given gene cannot be predicted based on its RNA expression profiles. It
has been widely recognised that studying protein structures, functionalities, and protein-
protein interactions will provide a direct way to characterise biological functions of a
given gene (Hu et al., 2011). However, the laborious and time-consuming nature of
traditional methods such as X-ray crystal analysis for protein structures and yeast two-
hybrid systems for protein interactions, together with the shortage of detection systems
have limited the functional studies of genes. In addition, the difficulties in solubilising,
separating, and identifying membrane proteins have limited functional studies on

Chapter 1: Introduction and Literature Review 29
membrane proteins (Tan et al., 2008). The recent innovation of bioinformatics and the
development of modern technologies for studying biological functions have enabled
researchers to mine data for protein functions, target binding predictions and structure-
to-function relationships. Many newly-developed high-throughput tools provide
opportunities to effectively unravel crucial questions related to protein functions and
structures that were previously laborious, time-consuming or impossible. Likewise,
recent advances in genetic manipulation have facilitated recombinant protein
productions in various biological expression systems, which further make it possible to
study gene functions at protein levels.
1.6.1 Bioinformatics tools
The creation of bioinformatics tools such as 3-D protein modelling and sequence-
or structure-based functional prediction has sped up gene characterisation and enabled
precise predictions of biological functions of target genes in an evolutionary relationship
manner, without the need of prior knowledge of gene identity. For example, to predict
the function of a protein, researchers need to retrieve similar structures from huge protein
databases and classify them into the same protein fold, which was a time-consuming
process, but this process is now more efficient and more precise (Mirceva and Davcev,
2009). Computational tools can be used to discover new roles of genes according to their
promoter architecture and co-expressed gene analyses. Dehimi et al. (2012) used this
approach to demonstrate the multiple roles of TLP and OLP in biotic and abiotic stresses
and recommended it as an effective means to discover unknown functions of genes.
Various methods developed for protein structure prediction are now available and have
made it possible for biologists without background in bioinformatics to access and
investigate their genes of interest (Kelley and Sternberg, 2009; Roy et al., 2010;
Jaroszewski et al., 2011). The quality and precision of these methods have been
progressively assessed and improved for the best accuracy possible (Kryshtafovych and
Fidelis, 2009; Schmidt et al., 2009; Zhang, 2009). In addition, many methods for
determining protein properties such as subcellular localisation, ligand binding, protein-
protein interactions and predicting active binding sites of protein are now accessible
(Chen et al., 2007; Emanuelsson et al., 2007; Hernandez et al., 2009; Wass et al., 2010;
Plasnas-Iglesias et al., 2013). Undoubtedly, these promising tools play a critical role in
gene characterisation studies today.
30 Chapter 1: Introduction and Literature Review
1.6.2 Advances in genetic manipulation
Unlike nucleic acids, proteins are prone to denature or degrade in standard buffer
conditions and at ambient temperature; protein conformations change depending on the
expressing systems; and so far proteins cannot be routinely amplified in artificial
conditions using protein templates, reaction reagents, and amino acids like PCR-
amplification-based for nucleic acid. These features have made it more challenging to
study protein functions. The studies on functional proteins would not have been possible
without the achievements of genetic manipulation and the availabilities of different
expression vector systems. Besides binary vector systems that have been widely used
for stably expressing foreign proteins in plants, many overexpression vector systems
have been developed to facilitate the ability to easily express proteins of cloned genes
and to enhance the protein expression levels of target genes required for functional
analysis. For example, Gateway-compatible vectors have been developed to facilitate
high-throughput cloning of target genes and have been demonstrated to be useful in
studying protein localisation, protein-protein interactions, specificity of promoters, gene
knockdown mutants, and protein production for affinity purification (Earley et al.,
2006). Due to its features of efficient cloning and high sensitivity of fluorescent
detection, Gateway vectors are increasingly used for studying subcellular localisation of
proteins and testing the interactions of target protein with other fluorescently tagged
proteins within living cells. Similarly, the pEAQ vectors have been designed to allow
easy and quick production of recombinant proteins in plants (Peyret and Lomonossoff,
2013). Using pEAQ vectors allows cloning and expressing proteins of interest within
several weeks that has made it the most suitable for agrobacterium infiltration and
transient expression studies. The most advantages of pEAQ vector are the use of the
Cowpea Mosaic Virus hypertranslational “CPMV-HT” that produces extremely high
yield of recombinant proteins through enhancing high translational efficiency and the
incorporation of P19 suppressor of gene silencing in the expression cassette that reduces
the complicacy in sample preparation and maximizes expression efficiency. These
distinct features have accelerated the utilisation of pEAQ in transient expression of
recombinant proteins in plants. Another achievement that can be used to enhance protein
production in plants is the incorporation of Lys-Asp-Glu-Leu (KDEL) peptide in the C-
terminus of target protein. The KDEL retention peptide was discovered as a C-terminal
signal peptide that makes proteins permanently reside in the lumen of the endoplasmic
reticulum (ER) (Munro and Pelham, 1987). This signal peptide has been shown to be

Chapter 1: Introduction and Literature Review 31
essential for retention of transmembrane proteins in the ER by preventing them from
secretion (Jackson et al., 1990). The KDEL peptide has been incorporated in a number
of recombinant proteins expressed in plants and shown to significantly enhance the
accumulation levels of recombinant proteins that primarily were cytoplasmic, secretion,
or transmembrane proteins (Wandelt et al., 1992; Schouten et al., 1996). The
accumulation level was reported up to 100 fold higher than control in leaf tissues of
transgenic tobacco plants (Wandelt et al., 1992). It has been evidenced from these
studies that the high accumulation levels of KDEL-tag proteins were the results of
increasing protein stability, reducing exposure of proteins to proteases during
translocation pathways, and increasing yield of protein extraction from ER as in the case
of membrane proteins. In addition, the achievements in genetic manipulation have
allowed to design a number of vector series for validating and visualizing the protein-
protein interactions in living plant cells (Lee et al., 2008; Nishimura et al., 2015;
Kamigaki et al., 2016). The progresses in genetic manipulation have facilitated studies
on protein functions that have allowed to gain knowledge on protein mechanism and
mode of action and have made it more convincible in explaining functions of a gene.
1.6.3 Functional protein microarrays
Alternative to the high-throughput methodologies established for identifying
protein-protein interactions, such as protein complex purification coupled with mass
spectrometry analysis and the yeast two-hybrid system, functional protein microarray
technology has recently emerged as a powerful approach for simultaneously studying
thousands of proteins. A protein microarray (protein chip) is a solid surface on which
thousands of different proteins are immobilized in discrete spatial locations, forming a
high density protein dot matrix (Hu et al., 2011). To identify which proteins interact with
a target plant protein, the gene is first fused with affinity and detecting tags and cloned;
the recombinant protein will then be expressed in a suitable plant, extracted and purified;
the purified recombinant protein will then be labeled and hybridised with a plant protein
chip; an appropriate detection system will be applied to analyse interactions between
target protein and known proteins in the chip. The applications of protein microarrays
have enhanced efficiency for characterisation of protein-protein interactions,
identification of relevant binding substrates for proteins under investigation and
exploration of novel functions of known proteins (Popescu et al., 2007b; Fukao, 2011).
Calcium sensor and MAP kinase are two major cascades in stress signalling and

32 Chapter 1: Introduction and Literature Review
transduction of plants. Using Arabidopsis protein microarrays has allowed researchers
to screen binding targets and identify uncharacterised targets of Calmodulin (CaM) and
Calmodulin-like (CML) proteins that unravel the unknown roles of CaMs/CMLs in
calcium sensor network contributing to plant growth, development, and stress and
defense responses (Popescu et al., 2007a). Similarly, a total of 570 MAPK
phosphorylation substrates involved in MAP kinase network were revealed by one study
using an Arabidopsis protein array (Popescu et al., 2009). Functional protein
microarrays are now available and considered a valid tool for high-throughput
characterisation of protein-protein interactions (Sutandy et al., 2013). Hu et al. (2011)
stated that functional protein microarrays will soon become an indispensable tool in
proteomics research and systems biology. In plant system, the commercial availability
of Arabidopsis microarrays together with public-accessible progresses in functional and
pathway analysis of Arabidopsis proteins allow the rapid identification of pathway and
interactive protein partners of an under-studied plant protein. This system provides a
mean to speed up functional protein studies.
1.6.4 Detection tools for protein-protein interactions in living cells
Detection of protein interactions in living cells is of significant importance for
studying protein-protein interactions because it allows the capture of the interactions that
occur in a particular cell with a full complement of proteins present in the cell and the
external stimuli that influence the cell. The visualisation and detection of protein-protein
interaction in plant living cells is now eased by Bimolecular Fluorescence
Complementation (BiFC) technique, in which the interaction of two non-fluorescence
proteins, separately fused with N-terminus or C-terminus of a fluorescence molecule, is
indicated by fluorescence emission (Kerppola, 2008) (Fig. 1.3 A). Even two protein
complexes can be simultaneously detected in a single plant cell by BiFC using two
coloured fluorescent complementary pairs (Kodama and Wada, 2009) (Figure. 1.3 B).
Tsutsumi et al. (2009) used BiFC to study Ras proteins and successfully determined
their spatio-temporal regulation in signalling. Ras proteins are monomeric GTPases that
have a complex effectors and regulate a number of signal transduction cascades involved
in cell growth, differentiation, survival and mortality. Application of BiFC in this study
revealed the mechanism that Ras exploits different effectors via Ras-PI3K interaction,
Ras subsequently regulates downstream signalling in the endosome. Likewise, a
multicolour BiFC technique has been used to analyse the efficiencies of complex

Chapter 1: Introduction and Literature Review 33
formation between small subunits of the large family of cytoplasmic G protein (Dupre
et al., 2006; Mervine et al., 2006). As compared with alternative methods for the
visualisation of protein-protein interaction, including fluorescence resonance energy
transfer (FRET), Kerppola (2008) indicated six advantages of using BiFC instead of
FRET. BiFC method has become a standard approach for visualising protein interactions
in living cells and has been applied in a variety of research applications during the last
five years. There are still considerations in choosing fluorescent fragments for avoiding
spontaneous association and for enhancing fluorescence intensity; in preparing an
adequate control system for avoiding false positive; and in the quantitative evaluation of
the efficiency of complex formation, many protocols and guidance for using BiFC are
available (Hu et al., 2005; Kerppola, 2009, 2013). In addition, Identification of different
fluorescence proteins and improvement of fluorescence intensity for BiFC use have been
progressively carried out. Consequence, at least 15 fluorescence proteins have been
developed for BiFC and some mutant versions of fluorescent proteins have improved
intensity up to 8 fold as compared to their native versions (Komada and Hu, 2012). Its
advantages and recent progress have made BiFC become a key technique that should be
incorporated into studies on protein-protein interaction.
These above-mentioned advances provide significant means to promote research
on the identification, characterisation and validation of protein functions.

34 Chapter 1: Introduction and Literature Review
Figure 1.3 Principle of BiFC and multicolour BiFC analysis (Kerppola, 2009).
A. Principle of BiFC: The red and blue rectangles represent putative interaction partners (A
and B). They are fused to fragments of a fluorescent protein, represented by silver half-
cylinders (YN and YC). If the proteins interact with each other, they can facilitate association
of the fluorescent protein fragments to produce a fluorescent complex (green cylinder YN-
YC). The image shows an example of a complex formed by nuclear proteins.
B. Principle of Multicolar BiFC: Two alternative interaction partners (A and B) are fused to
fragments of different fluorescent protein fragments (tinted grey half-cylinders). These fusions
are co-expressed in cell with a shared interaction partner, Z, fused to a complementary fragment
(grey half-cylinder). Complexes formed by A and Z can be distinguished from complexes
formed by B and Z based on the difference in their fluorescence spectra. The image shows an
example of the visualization of two protein complexes in the same cell, one nucleolar (cyan)
and the other nucleoplasmic (yellow).
A
B

Chapter 1: Introduction and Literature Review 35
1.7 PROBLEM STATEMENT, GAPS, AIMS, AND OBJECTIVES
The current and the predicted changing climate scenarios could result in more
prevalent of environmental stress factors such as drought, salinity, extreme
temperature and excess UV radiation. These environmental factors have been
identified as the key limiting factors in agricultural productivity and food quality
(Lobell et al., 2008; Wang and Frei, 2011). With the projected future increasing human
population, the global food production was estimated to be double by 2050 with a
significant annual grain yield increase of 44 million metric tons will be need (Tester
and Langridge, 2010). However, the massive increase agricultural production have
been challenged by such environmental stress conditions together with the reduced
agricultural land (due to urbanisation, industrialisation, and desertification brought
about by climate change) and the declined available resources (Oliver, 2014). It is
obvious that food security for future population is threatened. To meet the food
demand (both quantity and quality) of future rising population, the challenges of
improving crops production in unfavourable environmental conditions and limited
agricultural resources need to be addressed. The current rate of crop improvement,
mostly contributed by conventional breeding, was found to be far below the future
rising food demand (Ray et al., 2013). Oliver (2014) indicated that the agricultural
production gaps between future food demand and crop improvement brought by
conventional breeding can be filled by the applications of genetically-modified
organism (GMO) technologies, which offer more rapid crop improvement, novel
genetic strategies for crop improvement and the ability to use genes from all sources
regardless of origin. Besides, identifying the key factors for crop adaptation to adverse
climate conditions could shape the severity of climate change impacts on food
production (Lobell et al., 2008).
Plant adaptive response to environmental stress is a multigenic trait that involved
a complex gene network. For more efficient use of GMO technologies in improving
crop adaptation to environmental stresses, it is important to identify the master
regulators of stress adaptation from the stress-tolerant species and engineer them into
crop plants (Mittler and Blumwald, 2010; Cominelli et al., 2013). The Australian
native resurrection plant T. loliiformis represents the ideal starting point for searching
potential candidate genes for developing stress-tolerant crops, regarding the adaptive
strategies this plant implements to cope with the environmental stresses (Section 1.4).

36 Chapter 1: Introduction and Literature Review
Among the functional and regulatory genes identified to be involved in plant stress
response, plant osmotin holds great potential for enhancing stress tolerance in crops
through genetic engineering approach, due to increasing evidence supporting the role
of osmotin as key regulators in plant stress response (Husani and Rafiqi, 2012;
Viktorova et al., 2012; Kumar et al., 2015).
Intensive studies conducted on osmotin have shown its potential for enhancing
both abiotic and biotic stress tolerance in plants but the mechanisms by which osmotin
mediates plants response to stress remains for further elucidation. Osmotin and OLP
genes have been shown to be induced by a number of abiotic and biotic stresses and
hormonal stimuli indicating their involvement in plant response to these factors
(Section 1.3.2). Transgenic plants expressing osmotin and OLP genes have shown
consistently enhanced tolerance to various abiotic stresses, bacterial and fungal
pathogens (as discussed in Section 1.3), which indicate critical roles of osmotins and
OLPs in promoting plant tolerance to abiotic and biotic stresses and the multifunction
nature of the proteins. However, the direct evidence explaining stress response
mechanisms of osmotins and OLPs such as stress-responsive pathways, their
interactive protein partners, and their mode of action are still shortage in the literature.
Regardless the early discovery of osmotins and a large number of studies designed to
dissect the role of osmotins and OLPs in plant stress response, the difficulties in
obtaining recombinant osmotins remain the obstacle for functional studies directly at
protein levels. Recent advances in studying functional proteins (discussed in Section
1.6) would provide useful means for facilitating the discovery of osmotin functions
and pathways. Likewise, comparative studies of osmotins from natural drought-
tolerant species with those of drought-sensitive species would provide novel insights
into molecular mechanisms required for adaptive response to stresses and shed the
light for identifying unknown functions of osmotins.
In this study, an osmotin from the native Australian resurrection plant T. loliiformis
(TlOsm), previously isolated from a drought-induced cDNA library of T. loliiformis,
was molecularly characterised and functionally validated on transgenic plants in
comparison with the two osmotin genes (OsOlp1_A and OsOlp1_I) from drought-
tolerant (Apo) and -sensitive (IR64) cultivars of the stress sensitive crop, Oryza sativa
(rice). Despites large numbers of osmotins and OLPs have been characterised from
many plant species and numerous transgenic crops expressing osmotins and OLPs

Chapter 1: Introduction and Literature Review 37
have shown enhanced tolerance to abiotic and biotic stresses (Section 1.3), none of
osmotins from a desiccation tolerant species such as the resurrection plant T.
loliiformis has been characterised. Resurrection plants possess a unique ability to
tolerate severe water deficit in vegetative tissues and represent a potentially rich source
of genes conferring tolerance to abiotic stresses (Ingle et al. 2007; Karbaschi et al.
2016; Mundree et al. 2002; Williams et al. 2015). Even though a number of genes
conferring dehydration tolerance have been isolated from other resurrection plants
(Garwe et al. 2003; Garwe et al. 2006; Lehner et al. 2008; Peters et al. 2007), very
little has been reported about the expression of these stress-responsive genes in crop
species. A comparative drought responsive transcriptome analysis of the tolerant and
susceptible rice genotypes (Apo vs IR64) identified two osmotin genes (OsOlp1-A and
OsOlp1-I, respectively) that are only different in 10 amino acid of their encoded protein
sequences but are differentially expressed in response to drought stress. Further analysis of
these two proteins suggested that changes in amino acid residues on the functional sites of
the proteins may account for their differential responses to drought of these two rice
genotypes (unpublished, personal communication with S. Robin, TNAU-India). Therefore,
the incorporation of two rice osmotin genes OsOlp1-A and OsOlp1-I into the study is
necessary for comparison with TlOsm and to understand the mechanisms that these osmotins
regulate abiotic stress responses in plants. In the field, crop plants are often exposed to
multiple stresses either simultaneously or successively. Therefore, genes encoding osmotins
are likely to be suitable candidates for the genetic enhancement of plants, with respect to
multiple-stress tolerance. Understanding the molecular characteristics and functions of
TlOsm in plant defense holds a great promise for the gene utilisation in improving crop
tolerance to abiotic stresses through genetic engineering.
The overall aim of this research was to address a number of key questions that will
improve our understanding of the roles of plant osmotin in general and TlOsm
specifically:
1. Whether TlOsm plays a role in abiotic stress response?
2. How does TlOsm act during abiotic stress response?
3. Which stress responsive pathway is TlOsm involved in?
4. What is the role of TlOsm in abiotic stress responses in a crop species?

38 Chapter 1: Introduction and Literature Review
This overall aim was addressed through the following specific objectives:
Objective 1: Determining the molecular characteristics of TlOsm
Objective 2: Generating transgenic plants constitutively expressing target osmotins
and appropriate reporter gene.
Objective 3: Investigating the roles of TlOsm, in comparision with OsOlp1_A and
OsOlp1_I, in abiotic stress responses of transgenic rice plants.
Objective 4: Identifying interactive protein partners of the TlOsm, OsOlp1_A, and
OsOlp1_I and exploring stress responsive pathways involving these osmotins.
The general research outline and thesis presentation are shown in the Figure 1.4
Figure 1.4 General research outline and thesis presentation

Chapter 2: General Materials and Methods 39
Chapter 2: General Materials and Methods
This chapter describes the general materials and methods used throughout the
entire research project. The materials include general chemicals and specialized
reagents, Tripogon loliiformis, Oryza sativa, Nicotiana tabacum and Nicotiana
benthamiana plants, bacteria, primers, backbone vectors, and common solutions and
media in Section 2.1. Section 2.2 presents the general methods for gene construct
cloning, E. coli transformation, Agrobacterium tumefaciens transformation, DNA and
RNA extraction, purification and amplification. Specific methods relevant to particular
objectives will be referred to Chapter 3, 4, 5 and 6.
2.1 MATERIALS
2.1.1 Source of general chemicals and specialized reagents
All general laboratory reagents of analytical grade were obtained from Sigma-
Alrich (USA), Merck Millipore (USA), Chem-supply (Australia), unless otherwise
stated. Agarose used for gel electrophoresis was supplied by Roche (Australia).
Restriction enzymes were supplied by Roche (Astralia) or New England Biolabs
(Australia). DNA markers and PCR reaction mix were supplied by Promega (USA)
and Invitrogen (USA). Miniprep plasmid extraction kits was supplied by Promega.
Plant tissue culture media and phyto hormone were supplied by PhytoTech (USA).
Plant DNA extraction kits and Plant RNA extraction kits were supplied by QiAgen
(Netherlands). His Spintrap columns and protein G Mag sepherose Xtra were supplied
by GE Healthcare Life Sciences. Ligation enzymes, LR recombination reaction, cDNA
reverse transcription reaction and antibodies was purchased from Invitrogen. Protein
chip ArabidopsisChip1 and plasmid pYL436 were purchased from Arabidopsis
Resource center (ABRC-USA).
2.1.2 Plant materials
2.1.2.1 Plant materials for T. loliiformis mixed elicitor cDNA libraries
Tripogon loliiformis plants were germinated from seeds originally colected from
Charliville (GPS: 26o42’ S 146o15’ E) Queensland, Australia and propagated for
generations in glasshouse. The plants were grown in a glasshouse under a 12 h

40 Chapter 2: General Materials and Methods
photoperiod (light intensity of 900 ±100 µmol m-2 s-1) with day/night temperature of
27 oC.
2.1.2.2 Plant materials for stable transformation
Rice seeds (Oryza sativa L. spp Japonica cv. Nipponbare) previously provided
by Yanco Agricultural Institude (NSW, Australia) and propagated in a glasshouse
under a 12 h photoperiod with day/night temperature of 27 oC were used to generate
calli for stable transformation.
Nicotiana tabacum plants were maintained in sterile closed tissue culture
vessels with monthly sub-cultured and placed in growth chamber at 16 h photoperiod,
25 oC and moderate light. In vitro microcutting plants after 2-3 weeks sub-cultured in
fresh medium were used to provide leaves for stable transformation.
2.1.2.3 Plant materials for transiently expression assays
Nicotiana benthamiana plants were used for both producing recombinant
osmotins and detecting protein-protein interactions in planta. The plants were
germinated in 1.6-L pots with 3 plants/pot. They were grown under controlled
conditions of 25 oC, light intensity of 900 ±100 µmol m-2 s-1, 65% relative humidity
and 16 h photoperiod. Plants were ready for Agro-infiltration after 4-5 weeks.
2.1.3 Bacterial strains
Escherichia coli (E. coli) strain XL-1-Blue was used for all general plasmid
cloning, except for plasmid carrying the lethal ccdB gene. Agrobacterium
tumefaciences strain LBA4404 was used for tobacco transformation and strain Agl1
was used for both rice stable transformation and transient expression assays in N.
benthamiana. Except for the One Shot® ccdB Survival™ 2 T1R Competent Cells were
supplied by Invitrogen (used for cloning plasmid carrying the lethal ccdB gene), other
bacterial competent cells were readily available within the CTCB.
2.1.4 Oligodeoxyribonucleotide (Primers)
All primers used for plasmid consruction and confirm the presence of the target
genes in the plasmids in this chapter are shown in Table 2.1. Details of primers for
characterisation of transgenic rice and tobacco and TlOsm expression in T. loliiformis
refer to Chapter 4. All primers were synthesised by GeneWorks (Hindmarsh, South
Australia). Primers were diluted to a concentration of 100 µM and working stocks of
10 µM were prepared for PCRs and 3.2 µM stocks were for sequencing.

Chapter 2: General Materials and Methods 41
Table 2.1 List of primers for plasmid cloning
Primer
set Primer name Sequence (5'-3')
Product size
(bp) Aims
A1 TlOsmBamHI F GGATCCATGGCGAGATTACGAGGGGCTG
1232 Amplify TlOsm and Nos terminator in the
pCambia2300-TlOsm NosTerHindIII R AAGCTTCCCGATCTAGTAACATAGATGACA
A2 UidA BamHI F GGATCCATGGTCCGTCCTGTAGA
2083 Amplify UidA gene and Nos terminator
in the pCambia1300 NosTerHindIII R AAGCTTCCCGATCTAGTAACATAGATGACA
A3 OsOsmApoBamHI F GGATCCATGGGATTAGACCAAGCTGC
836 Amplify OsOlp1_A from 13ABRIKP-
OsOsmApo_pMK_RQ M13 R AACAGCTATGACCATG
A4 OsOsmIR64BamHI F GGATCCATGGCTTCTGCCAAGCTG
836 Amplify OsOlp1_I from 13ABRIKP-
OsOsmIR64_pMK_RQ M13 R AACAGCTATGACCATG
B1 EYFPTopo F CACCATGGTGCCTAGCGTGACCAAGG
838 Amplify EYFP gene with the Topo
overhang from pEarleyGate 101 EYFPTopo R TTAAGCGTAATCTGGAACATCG
B2 TlOsmTopo F CACCATGGCGAGATTACGAGGGGCTG
943
Amplify TlOsm with Topo overhang and
no stop codon from pCambia 2300-
TlOsm TlOsmTopo R GTGCAGGGCACCAGCGAGCACGAG
B3 TlOsmTopo F CACCATGGCGAGATTACGAGGGGCTG
952
Amplify TlOsm with Topo overhang and
with the stop codon from pCambia 2300-
TlOsm TlOsmBstEII R GGTCACCTCAGTGCAGGCCACGAG
C1 AttR1_AGEF ACCGGTACAAGTTTGTACAAAAAAGCTGAACG
2798

42 Chapter 2: General Materials and Methods
Primer
set Primer name Sequence (5'-3')
Product size
(bp) Aims
IgG_KDEL_StuIR AGGCCTTCAGAGTTCATCCTTTACCGAGCTCGAATTCGCGTC
Amplify fragment from AttR1 to IgG of
pYL436 with KDEL signal sequence and
AgeI and StuI sites for modifying
pEAQ_HT
C2 OsOsmApoTopoF CACCATGGGATTAGACCAAGCTGC
745
Amplify OsOlp1_A without the stop
codon from 13ABRIKP-
OsOsmApo_pMK_RQ OsOsmApoTopoR GTGGCAGAAGATGACCTTGAGCTC
C3 OsOsmIR64TopoF CACCATGGCTTCTGCCAAGCTG
745
Amplify OsOlp1_I without the stop
codon from 13ABRIKP-
OsOsmIR64_pMK_RQ OsOsmApoTopoR GTGGCAGAAGATGACCTTGAGCTC
D1 AtCPK4_Topo F CACCATGGAGAAACCAAACCCTAGAAGAC
1507
Amplify AtCPK4 with Topo overhang
and no stop codon from Arabidopsis
thaliana cDNA AtCPK4_Topo R CTTTGGTGAATCATCAGATTTAGCAG
D2 AtCPK5_Topo F CACCATGGGCAATTCTTGCCGTG
1672
Amplify AtCPK5 with Topo overhang
and no stop codon from Arabidopsis
thaliana cDNA AtCPK5_Topo R CGCGTCTCTCATGCTAATGTTTA
D3 AtALDH7_TOPO F CACCATGGGTTCGGCGAACAACG
1528
Amplify AtALDH7B4 with Topo
overhang and no stop codon from
Arabidopsis thaliana cDNA AtALDH7_TOPO R ACCGAAGTTAATTCCTTGCGCTAGAG
D4 AtMS1_TOPO F CACCATGGCTTCACACATTGTTGGATACC
2299
Amplify AtMS1 with Topo overhang and
no stop codon from Arabidopsis thaliana
cDNA AtMS1_TOPO R CTTGGCACTGGCGAGCTGGG
D5 AtPER42_TOPO F CACCATGGGAGGCAAAGGTGTG
994
Amplify AtPER42 with Topo overhang
and no stop codon from Arabidopsis
thaliana cDNA AtPER42_TOPO R ATGGTTCTTGTTTGCGAGATTACATTG

Chapter 2: General Materials and Methods 43
2.1.5 Backbone vectors
2.1.5.1 Vector for primary cloning
The pGEM®T Easy vector (Figure 2.1A) was used for primary amplification of
the genes used for common cloning by restriction enzyme digestion and then ligation.
The pENTR/D-TOPO® was used for primary cloning of genes for GatewayTM
recombination cloning technology.
Figure 2.1 Plasmid maps for primary cloning. A) pGEM®T Easy vector used for amplification of genes for common cloning and B)
pENTR/D-TOPO® used as entry vector for GatewayTM recombination cloning technology.
2.1.5.2 Vector for cloning genes stably expressing in rice
The pYC27 UidA vector (Figure 2.2) was used as a backbone plasmid for
cloning the OsOlp1_A, OsOlp1_I, TlOsm, and UidA genes that were stably
transformed into rice.
A B

44 Chapter 2: General Materials and Methods
Figure 2.2 Map of backbone vector used for cloning genes stably expressing in rice.
2.1.5.3 Destination vectors for cloning genes stably expressing in tobacco
The vector pCE100, pCE101, and pCE104 (Figure 2.3) were previously
modified from vector series pEaleyGate 100, 101, and 104, respectively. These vectors
were used as destination vectors in GatewayTM recombination cloning to generate the
vector control and EYFP-tagged TlOsm used for stable transformation of tobacco.
pYC27 UidA
12999 bp
UidA
hptII Ubi promoter
35S
NosT
BamHI (2016)
EcoRI (1)
SmaI (11955)
XmaI (11953)
HindIII (4093)
PstI (23)
PstI (2014)
ApaLI (1319)
ApaLI (2955)
ApaLI (3280)
ApaLI (8460)
ApaLI (8958)
ApaLI (11353)
ApaLI (11655)

Chapter 2: General Materials and Methods 45
Figure 2.3 Maps of destination vectors for cloning EYFP-tag TlOsm and VC.
A) pCE100 used for the expression of EYFP control, B) pCE101 used for tagging EYFP at C-
terminus of TlOsm, C) used for tagging EYFP at N-terminus of TlOsm
pCE100
12221 bp
Hyg(R)
Kan(R)
CCDB
Cm(R)
left border
bom site from pBR322
STA from pVS1
right border
aTTR2
aTTR1
M13R CaMV35S promoter
lacZ promoter
CaMV 35S promoter, duplicated
pBR322 origin of replication
pVS1-REP
CaMV 3'UTR
nos 3'UTR
Octopine Synthase Terminator
A
pCE104
13077 bp
Hyg(R)
Kan(R)
left border
bom site from pBR322
STA from pVS1
right border
nos 3'UTR
attR1
Cm(R)
ccdB
aTTR2
EYFP
M13R
CaMV35S promoter
lacZ promoterCaMV 35S promoter, duplicated
pBR322 origin of replication
pVS1-REP
CaMV 3'UTR
Octopine Synthase Terminator
C
pCE101
13026 bp
Hyg(R)
Kan(R) E-YFP
Cm(R)
CCDBleft border
bom site from pBR322
STA from pVS1
right border
nos 3'UTR
attR2
M13R
CaMV35S promoter
lacZ promoterCaMV 35S promoter, duplicated
pBR322 origin of replication
pVS1-REP
CaMV 3'UTR
Octopine synthase terminator
attR1
HindIII (3359)
HindIII (4196)
B

46 Chapter 2: General Materials and Methods
2.1.5.4 Destination vector for recombinant osmotin production
The vector pEAQ-436 (Figure 2.4) was used as destination vector in gerarating
plasmids for producing recombinant osmotins in N. benthamiana. This vector was
modified from pYL436 and pEAQ-HT (Appendix A-Figure 2) by incoparating the
AgeI and StuI restriction sites and KDEL sequence into the GatewayTM recombination
site and the Tandem affinity purification (TAP) of pYL436, then inserting whole
sequence within AgeI and StuI sites into backbone pEAQ-HT at AgeI and StuI sites.
Figure 2.4 Map of destination vector used for recombinant osmotin production.
2.1.5.5 Destination vectors used for detecting protein-protein interaction in
planta
The pE3132 (Figure 2.5A) and pE3134 (Figure 2.5B) were used as destination
vectors for cloning plasmids used in Bimolecular fluorescence complementation
(BiFC) assays which was used for detecting protein-protein interactions in planta. The
pEA Q -436
12737 bp
P19
NPTIII
TrfA
NPTII
ccdB
KDEL
attR1-CmR-ccdB-attR2 GATEW AY cassette
9x myc tag
6x HIS tag
protease 3C cleavage site
2x IgG binding domain
Cm(R)
C1
C3
35S promoter
CaMV 35S promoter
ColE1
OriV
35S terminator
Nos Terminator
CPMV RNA-2 3'UTR
CPMV RNA-2 5'UTR
LB
RB
attR1
attR2
AgeI (1296)
Stu I (4090)

Chapter 2: General Materials and Methods 47
pE3132 was used for the fusion of the half C-EYFP (from AA 175 to the end of the
molecuole) with Arabidopsis genes. The pE 3134 was used to for the fusion of half N-
EYFP (from AA 1 to 174 of the molecuole) with OsOlp1_A, OsOlp1_I, and TlOsm.
Figure 2.5 Maps of destination vectors used for detecting protein-protein interaction in
planta.
2.1.6 General media, solutions: abbreviation and composition
Acetosyringone: 100 mM acetosyringone; dissolved in DMSO
Agarose gel loading dye (6X)
0.25% (w/v) bromophenol blue, 50% TE (w/v), 50% (v/v) glycerol
Alkaline lysis solution I
50 mM Glucose, 25 mM Tris-HCl pH 8.0, 10 mM EDTA pH 8.0
Alkaline lysis solution II: 0.2 M NaOH, 1% (w/v) Sodium Dodecyl Sulphate (SDS)
Alkaline lysis solution III: 2 M Glacial acetic acid, 3 M potassium acetate
Ampicillin (100 mg mL-1): Dissolved in ampicillin in deionised water, filter sterilised
BAP (1 mg mL-1): Dissolve 6-Benzylaminopurine in 1 M NaOH
CHCl3: IAA: Chloroform isoamyl alcohoh in a ratio of 24:1 (v/v)
Coomassie Blue solution:
50% ethanol, 10% acetic acid, 0.1% Coomassie Blue G-250 (Biorad)
CTAB buffer: 2% CTAB (cetyltrimethylammonium bromide), 2 M NaCl, 25 mM
EDTA pH 8, 100 mM Tris-HCl, 2% polyvinylpyrrolidone (PVP 40 000)
EDTA: 0.5 M Ethylene diamine tetra-acetic acid, pH 8.0
pSAT5 DEST cEYFP N1 (pE3132)
5743 bp
Cm R
ccdB
Amp R
c(175 end)EYFP
TEV enhancer
att R2
att R1
35S
35S
35S terminator
A
pSAT4 DEST nEYFP N1 (pE3134)
6054 bp
Cm R
ccdB
Amp R
(n174)EYFP
TEV enhancer
attR1
attR2
35S promoter
35S promoter
35S terminator
B

48 Chapter 2: General Materials and Methods
Fixation solution: 4% paraformaldehyde, 0.1% PBS buffer, pH 7.2
Gus stain solution: 100 mM phosphate buffer pH 7.0, 10 mM EDTA, 1 mM
potassium ferriccyanide, 0.1% Triton X-100, 2 mM 5-bromo-4-chloro- 3-indolyl-β-D-
glucuronide.
IAA (2 mg mL-1): Dissolved indole-3-acetic acid in 1 N NaOH
Infiltration medium: 10 mM MES, 10 mM MgCl2, 100 mM acetosyringone
IPTG: 0.1 M Isopropyl-β-B-thiogalactopyranoside in sterile water
Kanamycin (100 mg mL-1): Dissolved kanamycin in deionised water, filter sterilised
Kinetin (2 mg mL-1): Dissolved kinetin in 1 N KOH
Luria Bertani (LB) solid medium: 10 g L-1 tryptone; 5 g L-1 yeast extract; 10 g L-1
NaCl; 1 5 g L-1 agar (pH to 7.5, autoclaved)
Luria Bertani (LB) liquid medium
10 g L-1 tryptone; 5 g L-1 yeast extract; 10 g L-1 NaCl (pH to 7.5, autoclaved)
NAA (1 mg mL-1): Dissolved 1-Naphthaleneacetic acid in ethanol
PBS buffer: 137 mM NaCl, 10 mM phosphate (10 mM Na2HPO4 and 1.8 mM
KH2PO4), 2.7 mM KCl, pH 7.4
Phosphate buffer (50 mM pH 7.4): 9.5 mM NaH2PO4, 40.5 mM Na2HPO4
Rifampicin (25 mg mL-1): Dissolved rifampicin in DMF (dimethylformanmide)
SDS-PAGE destaining solution: 15% ethanol, 10% acetic acid
SDS-PAGE loading buffer:
50 mM Tris pH 6.8, 1% SDS, 10% glycerol, 10 mM DTT, 0.025% bromophenol blue
SDS-PAGE running buffer (1X): 25 mM Tris, 192 mM glycin, 0.1% (w/v) SDS
TAE buffer: 10 mM Tris-HCl, 0.5 mM EDTA pH 7.8
TBS buffer: 100 mM Tris pH 7.5, 150 mM NaCl
TBS-T buffer: TBS buffer, 0.1% Tween 20
TE buffer: 10 mM Tris-HCL pH 8.0, 1 mM EDTA
Timentin (200 mg mL-1): Dissolved timentin in deionzed water, filter sterilized
TPS buffer: 100 mM Tris, 1 M KCl, 10 mM Na2EDTA
Western blotting buffer: 25 mM Tris, 192 mM glycin, 20% methanol
X-gal: 5-bromo-4-chloro-3-indolyl-β-D-galactopyranoside, 2% (w/v) prepared DMF
2.1.7 Plant tissue culture medium
Refer to tobacco and rice transformation in Chapter 3 and 4
Chapter 2: General Materials and Methods 49
2.2 METHODS
2.2.1 Cloning and bacterial transformation
2.2.1.1 Primary cloning
The primers in the primer set A1, A2, A3, A4 and C1 and the respective
templates in the Table 2.1 (refer to Appendix A-Figure 1 & 2 for the maps of plasmids)
were used in PCR reactions to amplify the target genes by Taq polymerase for PCR
product with A-tail. The A-tailed PCR products were cloned into pGEM-T Easy®
vector system (Promega) in a 10 µL reaction mixture containing 3 µL of purified DNA
fragments, 1 µL vector DNA, 5 µL 2X ligation buffer, 1U of T4 DNA Ligase and
topped to volume with dH2O. The mixture was incubated overnight at 14 oC to
maximize the number of ligations. The mixture was transformed into E. coli. The
transformants were analysed by restriction enzyme analysis to identify transformants
containing the target genes. The positive transformants were further grown to isolate
plasmids (using Promega wizard miniprep plasmid isolation kit, Promega, USA) and to
sequence plasmids for confirming the genes of interest. The pGEMT-easy vectors carrying
the confirmed sequences were used to sub-clone into appropriate backbone vectors. The
resulted vectors and their use in different purposes in the project is shown in Table 2.2.
The primers in the primer set B1-B3, C2-C3, and D1-D5 and their respective
templates in the Table 2.1 were used in PCR reactions to amplify the target genes by
Taq polymerase for PCR products containing target genes with Topo-overhang. The
PCR products containing target genes with Topo-overhang were purified from agarose
gel after electrophoresis using a Freeze ‘N Squeeze DNA gel extraction spin column
(Bio-Rad) follow the manufacturer’s protocol. The purified fragments were cloned
into the pENTRTM Directional TOPO® vector (Invitrogen) in a 10 µL reaction mixture
containing 1 µL vector DNA, 1 µL of salt solution, 8 µL of purified DNA fragments
diluted in dH2O to get the insert/vector molar ratio of 3:1 in the reaction. The mixture
were incubated overnight at room temperature for 5 min. The mixture was transformed
into E. coli. The transformants were analysed by restriction enzyme analysis to identify
transformants containing the target genes. The positive transformants were further grown
to isolate plasmids and to sequence plasmids for confirming the genes of interest. The
pENTR vectors carrying the confirmed sequences were used to sub-clone into appropriate
destination vectors. The resulted vectors and their use as entry vectors in different purposes
in the project is shown in Table 2.2.

50 Chapter 2: General Materials and Methods
2.2.1.2 Sub-cloning by restriction enzyme digestion and ligation by T4 ligase
This method was used for generating 4 plasmid constructs used in rice
transformation and the pEAQ-436 destination vector for enhancing recombinant
osmotin production. The pGEMT vectors containing the target genes and their
corresponding backbone vectors (Table 2.2) were separately digested with appropriate
restriction enzymes. To avoid re-circulation of plasmid backbone without the cloned
insert, the phosphate group of linearized plasmid DNA 5’ ends were removed using
alkaline phosphatase enzyme (AP). One unit of AP and 1 X AP buffer was added to
the 20 µL digest reaction mixture and incubated for 40 min; after which the AP was
inactivated by incubation at 65 oC for 10 min. The digested products of pGEMT
vectors containing the target insert sequences and the backbone vectors were separated
by agarose gel electrophoresis and the target insert fragments and backbone were
separately purified using the High Pure PCR product purification kits (Roche) as per
manufacturer’s instruction. The purified DNA was quantified by a NanoDropTM 2000
spectrophotometer (Thermo scientific, USA). In the ligation reaction, using the insert:
backbone molar ratio of 3:1 with 50 ng of backbone for 10 µL reaction together with
1 X ligation buffer, 1U of T4 DNA Ligase (Promega) and topped to volume with dH2O.
The mixture was incubated overnight at 14 oC to maximize the number of ligations.
2.2.1.3 Sub-cloning by GatewayTM recombination technology
This method was used to sub-clone the target genes in the pENTR vectors into
their corresponding destination vectors (Table 2.2). In this project, the resulted
expression vectors were used in detecting of TlOsm localisation, producing
recombinant osmotins for protein chip hybridisation, and detecting protein-protein
interaction in planta. The pENTR vectors containing the target genes were digested
with appropriate restriction enzyme and fragments containing the target genes together
with the attL1 and attL2 recombination sites were purified from agarose gel after
electrophoresis using the Freeze ‘N Squeeze DNA gel extraction spin column (Bio-
Rad). The purified fragments with their corresponding destination vectors were used
in a 10 µL LR recombination reaction using Gateway LR Clonase II enzyme mix
(Invitrogen) according to the manufacturer’s protocol. After termination of the LR
reaction, each 2 µL of reaction mixture was used for E. coli transformation. All
resulted expression vectors were verified by restriction enzyme digestion and PCR

Chapter 2: General Materials and Methods 51
with gene specific primers. The confirmed expression vectors were then transformed
into Agrobacterium tumefaciens for expressing in plants.
Table 2.2 List of plant expression vectors constructed and used in the research
Primer
set
Name of entry
vectors
Destination
and backbone
vectors
Name of expression
vectors Purposes of uses
A1 pGEMT-TlOsm pYC27 UidA pYC-TlOsm Stably expressing TlOsm in rice
A2 pGEMT-Gus pYC27 UidA pYC-Ubi-Gus Stably expressing the GUS-reporter
gene in rice (control)
A3 pGEMT-OsOlp1_A pYC_TlOsm pYC-OsOlp1_A Stably expressing OsOlp1_A in rice
A4 pGEMT-Oslp1_I pYC_TlOsm pYC-OsOlp1_I Stably expressing OsOlp1_I in rice
B1 pENTR-EYFP pCE100 pCE100-EYFP Stably expressing EYFP in tobacco for
detecting protein localisation (control)
B2 pENTR-TlOsm pCE101 pCE101-TlOsm
Stably expressing EYFP-C-terminus-
tagged TlOsm in tobacco for detecting
TlOsm localisation
pEAQ-436 pEAQ-TlOsm Producing recombinant TlOsm for
protein chip hybridisation
pE3134 pE3134-TlOsm BiFC assay for detecting protein-
protein interaction in planta
B3 pENTR-TlOsm w
TGA pCE104 pCE104-TlOsm
Stably expressing EYFP-N-terminus-
tagged TlOsm in tobacco for detecting
TlOsm localisation
C1 pGEMT-436 pEAQ-HT pEAQ-436
Modifying backbone vector for
enhancing recombinant osmotin
production
C2 pENTR-OsOlp1_A pEAQ-436 pEAQ-OsOlp1_A Producing recombinant OsOlp1_A for
protein chip hybridisation
pE3134 pE3134-OsOlp1_A BiFC assay for detecting protein-
protein interaction in planta
C3 pENTR-OsOlp1_I pEAQ-436 pEAQ-OsOlp1_I Producing recombinant OsOlp1_I for
protein chip hybridisation
pE3134 pE3134-OsOlp1_I BiFC assay for detecting protein-
protein interaction in planta
D1 pENTR-AtCPK4 pE3132 pE3132-AtCPK4 BiFC assay for detecting protein-
protein interaction in planta
D2 pENTR-AtCPK5 pE3132 pE3132-AtCPK5 BiFC assay for detecting protein-
protein interaction in planta
D3 pENTR-AtALDH7 pE3132 pE3132-AtALDH7 BiFC assay for detecting protein-
protein interaction in planta
D4 pENTR-AtMS1 pE3132 pE3132-AtMS1 BiFC assay for detecting protein-
protein interaction in planta
D5 pENTR-AtPER42 pE3132 pE3132-AtPER42 BiFC assay for detecting protein-
protein interaction in planta

52 Chapter 2: General Materials and Methods
2.2.1.4 E. coli transformation, growth in liquid culture and storage
Chemically-competent E. coli XL1 Blue cells were transformed using the heat
shock method as described by Inoue et al. (1990). A 2 µL aliquot of either T4 ligation
reaction mixture, Topo reaction mixture, or LR recombination reaction mixture in a 2-
mL tube was mixed with 50 µL of thawed competent E. coli cells and incubated on ice
for 20 min. Cells were heat shocked at 42 oC for 90 sec, immediately transferred to ice
for 2 min, resuspended in 500 µL LB media and incubated at 37 oC for 60 min on a
rotary shaker at 200 rpm for aeration. The transformant was spread onto LB agar plates
containing appropriate antibiotic and selecting agents and incubated at 37 oC
overnight. The single and well growth colonies were selected to inoculate in overnight
liquid cultures for subsequent plasmid DNA extraction.
The commercial E. coli strain ccdB minus competent cells (Invitrogen) were
used for transformation of plasmid constructs pCE100, pCE101, pCE104, and pEAQ-
436 by the same heat shock method.
E. coli liquid cultures were initiated from either single colony or from glycerol
stock and inoculated in liquid LB supplemented with appropriate antibiotics. E. coli
liquid cultures were incubated at 37 oC for up to 16 h or overnight on a rotary shaker
at 200 rpm.
For storage, an aliquot of 500 µL overnight-incubated E. coli liquid culture was
mixed with 500 µL of autoclaved 80% glycerol in an autoclaved 2-mL cryovial. The
cryovials were snap-frozen in liquid nitrogen and stored in -80 oC freezer.
2.2.1.5 Agrobacterium tumefaciens transformation, growth in liquid culture and
storage
Electro-competent cells of Agrobacterium either strain Agl1 or LBA4404 (used
for tobacco transformation) were transformed using electroporation. An aliquot of 100
µL Agrobacterium electro-competent cells was thawed on ice and 1 µL of mini-
prepped plasmid DNA was added and gently mixed by aspiration with a pipette. The
mixture was transferred into a sterile pre-chilled electro cuvette before electroporation
at 1.8 KV for 5 ms using an EC100 electroporator (Thermo EC). Cells were allowed
to recuperate in 600 µL of LB for 2 h at 28 oC on a rotary shaker at 200 rpm. A 100
µL aliquot of cells was spread on each Petri plate containing LB agar supplemented
with 25 mg L-1 rifampicin and appropriate antibiotic. The remaining cells were
centrifuged at 12,000 rpm for 1 min, discarded the supernatant, re-suspended the pellet,

Chapter 2: General Materials and Methods 53
and plate on another Petri plate containing the same medium and selecting agents. The
plates were incubated at 28 oC for 48 h to allow the transformed colonies to grow. The
transformed single colonies were selected for liquid cultures for verification of
transformants containing the desired plasmid.
Agrobacterium liquid cultures were initiated from either single colonies or from
glycerol stock and inoculated in liquid LB supplemented with appropriate antibiotics.
Agrobacterium liquid cultures were incubated at 28 oC for 48 h on a rotary shaker at
200 rpm. Agrobacterium liquid cultures were used for preparation of plasmid
verification, plant tissue transformation, infiltration, and storage.
Similar protocol for storage of E. coli in glycerol stock was applied to storage of
Agrobacterium.
2.2.1.6 Plasmid DNA extraction and purification
A standard alkaline lysis protocol (Sambrook et al., 2001) was used to isolate
plasmid DNA from E. coli cultures in primary cloning and from Agrobacterium
cultures for verification of bacterial clones carrying the desired plasmid constructs. A
2 mL of E. coli or 4 mL of Agrobacterium culture aliquot was centrifuged at 14,000
rpm for 1 min and the resulting pellet was resuspended in 100 µL of Solution I.
Bacteria was lysed in 200 µL of Solution II and mixed by inversion. Bacterial proteins
and chromosomal DNA were then precipitated by the addition of 150 µL Solution III
and cellular components were separated by centrifugation at 14,000 rpm for 5 min at
room temperature. Plasmid DNA was then precipitated by transferring 400 µL of the
supernatant to 1 mL of ice-cold 100% ethanol and centrifuged at 14,000 rpm for 5 min.
The pellet was washed with 70% ethanol, re-centrifuged at 14,000 rpm for 5 min,
allowed to air dry and finally resuspended in 50 µL dH2O with 10 ng mL-1 of RNaseA
(Roche).
Alternatively, the pure plasmid DNA from E. coli cultures used for sequencing
and confirming the desired expression vectors was isolated using the Wizard® Plus SV
Minipreps DNA Purification Kits (Promega) as per the manufacturer protocol. The
concentration and purity of the plasmid DNA were determined using a NanoDropTM
2000 spectrophotometer (Thermo scientific, USA).

54 Chapter 2: General Materials and Methods
2.2.1.7 Plasmid DNA sequencing
All sequencing reactions were performed using the Big Dye Terminator Cycle
Sequencing KitTM version 3.1 (Applied Biosystems). Each reaction contained 200 ng
of purified plasmid DNA template, 20 pmol primer, 4 µL of 5X reaction buffer and 1
µL BDTv3.1 ready mix in a final volume of 20 µL topped up with dH2O. All
sequencing PCRs used an initial denaturation at 96 oC for 1 min prior to 35 cycles of
96 oC for 10 s, 50 oC for 5 s and 60 oC for 4 min. After cycling, PCR products were
precipitated by the additional two volumes of 100% ethanol, 2 µL of 3 M sodium
acetate (pH 5.2), 2 µL of 125 mM EDTA (pH 8.0), incubation at room temperature for
30 min, and centrifugation at 14,000 rpm for 20 min. DNA pellets were washed with
500 µL of 80% ethanol and centrifuged for further 10 min at 14,000 rpm. DNA pellets
were air dried and capillary sequenced at the Molecular Genetics Research Facility
(QUT).
2.2.1.8 Restriction enzyme digestion of plasmid DNA
A reaction contained 1 µg of plasmid DNA, 5-10 U of appropriate restriction
endonuclease, specific buffer, topped up to 20 µL with dH2O. The reaction was
incubated at corresponding temperature for specific enzyme for 1 h. For double
digestion with non-compatible buffers, sequential digests were performed.
2.2.2 General methods in nucleic acid extraction, amplification and analysis
2.2.2.1 Extraction of plant total DNA
Genomic DNA from putative transgenic rice lines and WT was extracted using
the DNeasy® plant mini kits (Qiagen). Approximately 100 mg of frozen rice leaves in
a 2 mL Eppendorf containing a metal bead was frozen by immersing in liquid nitrogen
and homogenised using TissueLyser (Qiagen) at maximum frequency for 30 sec and
the tube was immersed back in liquid nitrogen. Genomic DNA was subsequently
extracted from the ground leaf samples following the manufacturer’s instruction.
Genomic DNA from transgenic tobacco leaves and T1 transgenic rice leaves was
isolated following the rapid release DNA protocol (Thomson and Henry, 1995). An
aliquot of 50 mg of frozen leaves in a 2 mL Eppendorf containing a metal bead sample
was homogenised as described above. 100 µL of ice-cold TPS buffer was added to the
tube and the tube was incubated at 95 oC for 10 min following by a quench on ice.
Proteins, pigments, and other organic compounds were extracted by adding 100 µL of

Chapter 2: General Materials and Methods 55
chloroform: isoamyl alcohol (24:1) to the slurry. The resulting mixture was mixed by
gently flicking and was centrifuged at 14,000 rpm for 5 min at room temperature. The
resulting aqueous supernatant (40 µL) was carefully transferred to a fresh 1.5 mL microtube.
The dilution of the supernatant in dH2O (1:5 ratio) was used in the PCR reaction (1 µL in
20 µL PCR reaction).The stock extract and dilution were stored at -20 oC.
2.2.2.2 Extraction of plant total RNA
Total RNA from roots and shoots of T. loliiformis and transgenic rice leaves was
extracted using RNeasy® plant mini kits (Qiagen). An aliquot of approximately 100
mg of frozen plant tissues was ground in liquid nitrogen using a mortar and a pestle.
The total RNA was subsequently extracted from the ground leaf samples as per
manufacturer’s instruction.
2.2.2.3 Quality and quantitative assessment of nucleic acids
The concentration and purity of isolated DNA and RNA were determined using
the NanodropTM 2000 spectrophotometer. Sample absorbance was measured at
wavelengths of 230, 260 and 280 nm. The purity of the RNA was assessed using the
ratio of absorbance at 260/280 and 260/230 nm and the samples with absorbance ratios
approximate to 2 were acceptable. For the DNA, a 260/280 of ~ 1.8 was desirable. The
total RNA was further assessed for integrity by agarose gel electrophoresis analysis with
the presence of two ribosomal RNA bands at approximately 1.6 and 2 Kbp and the
intensity of the 2 Kbp band as twice as the 1.6 Kbp band. The presence of genomic DNA
in the rapid-released extract was analysed by PCR reaction with the primer forward (5’-
CATCACAGGATTTCGGTCCT-3’) and reverse (5’AGACAAATCGCTCCACCAAC-
3’) followed by agarose gel electrophoresis with the presence of a unique band of 507 bp.
2.2.2.4 Elimination of genomic DNA from total RNA
Total RNA was treated with DNase I to eliminate any traces of genomic DNA using
an RQ1 RNase-free DNase Kit (Promega) as per manufacturer’s instructions. The treated
RNA was used as template in a PCR reaction with the primer forward (5’-
CATCACAGGATTTCGGTCCT-3’) and reverse (5’AGACAAATCGCTCCACCAAC-
3’) followed by agarose gel electrophoresis to confirm the absence of genomic DNA in
RNA samples. The presence of a 507 bp band on the gel indicated the contamination of
genomic DNA in RNA samples, whereas no amplified products indicated the absence of
genomic DNA in RNA samples.
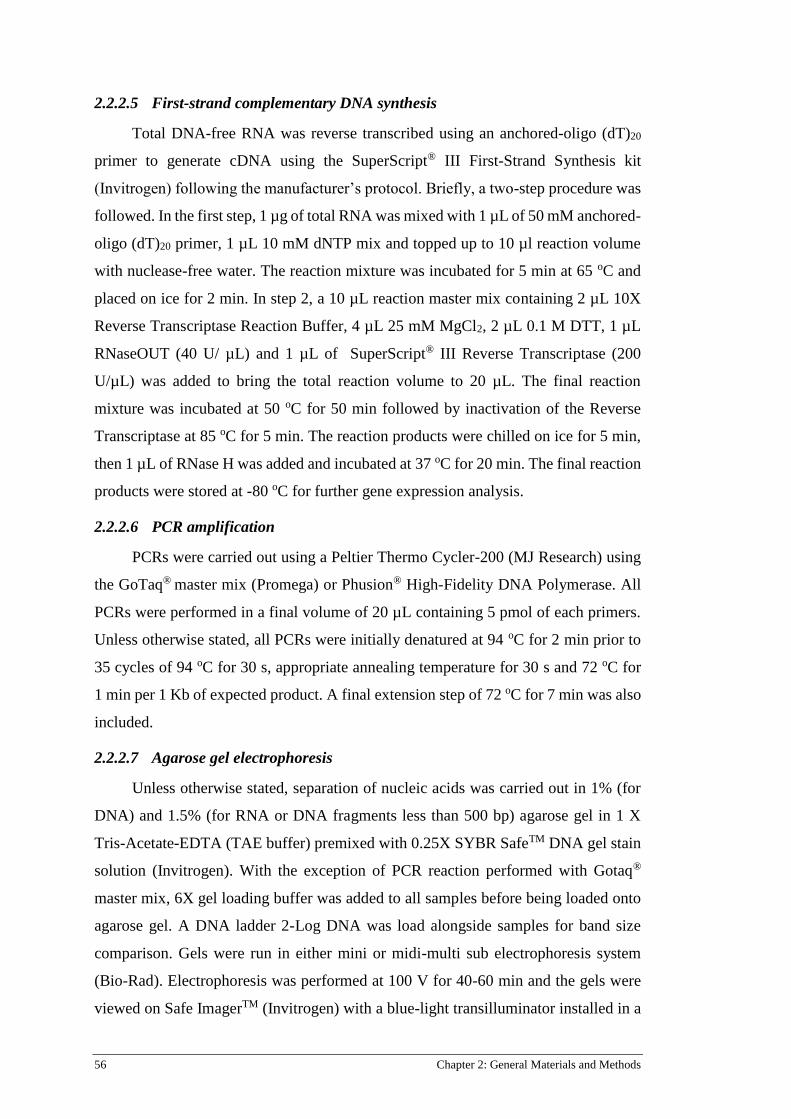
56 Chapter 2: General Materials and Methods
2.2.2.5 First-strand complementary DNA synthesis
Total DNA-free RNA was reverse transcribed using an anchored-oligo (dT)20
primer to generate cDNA using the SuperScript® III First-Strand Synthesis kit
(Invitrogen) following the manufacturer’s protocol. Briefly, a two-step procedure was
followed. In the first step, 1 µg of total RNA was mixed with 1 µL of 50 mM anchored-
oligo (dT)20 primer, 1 µL 10 mM dNTP mix and topped up to 10 µl reaction volume
with nuclease-free water. The reaction mixture was incubated for 5 min at 65 oC and
placed on ice for 2 min. In step 2, a 10 µL reaction master mix containing 2 µL 10X
Reverse Transcriptase Reaction Buffer, 4 µL 25 mM MgCl2, 2 µL 0.1 M DTT, 1 µL
RNaseOUT (40 U/ µL) and 1 µL of SuperScript® III Reverse Transcriptase (200
U/µL) was added to bring the total reaction volume to 20 µL. The final reaction
mixture was incubated at 50 oC for 50 min followed by inactivation of the Reverse
Transcriptase at 85 oC for 5 min. The reaction products were chilled on ice for 5 min,
then 1 µL of RNase H was added and incubated at 37 oC for 20 min. The final reaction
products were stored at -80 oC for further gene expression analysis.
2.2.2.6 PCR amplification
PCRs were carried out using a Peltier Thermo Cycler-200 (MJ Research) using
the GoTaq® master mix (Promega) or Phusion® High-Fidelity DNA Polymerase. All
PCRs were performed in a final volume of 20 µL containing 5 pmol of each primers.
Unless otherwise stated, all PCRs were initially denatured at 94 oC for 2 min prior to
35 cycles of 94 oC for 30 s, appropriate annealing temperature for 30 s and 72 oC for
1 min per 1 Kb of expected product. A final extension step of 72 oC for 7 min was also
included.
2.2.2.7 Agarose gel electrophoresis
Unless otherwise stated, separation of nucleic acids was carried out in 1% (for
DNA) and 1.5% (for RNA or DNA fragments less than 500 bp) agarose gel in 1 X
Tris-Acetate-EDTA (TAE buffer) premixed with 0.25X SYBR SafeTM DNA gel stain
solution (Invitrogen). With the exception of PCR reaction performed with Gotaq®
master mix, 6X gel loading buffer was added to all samples before being loaded onto
agarose gel. A DNA ladder 2-Log DNA was load alongside samples for band size
comparison. Gels were run in either mini or midi-multi sub electrophoresis system
(Bio-Rad). Electrophoresis was performed at 100 V for 40-60 min and the gels were
viewed on Safe ImagerTM (Invitrogen) with a blue-light transilluminator installed in a

Chapter 2: General Materials and Methods 57
G:Box gel documentation system (Syngene) and documented using a computer
installed with GeneSnapTM version 6.07 image acquisition software (Syngene).
2.2.2.8 Purification of DNA from agarose gels
Restriction digested DNA or PCR products were separated by electrophoresis on
agarose gel. DNA fragments were visualised under UV light, and the fragments
corresponding to the expected size were excised from the stained gels using sterile
scalpel blades and purified using either the Freeze ‘N Squeeze DNA gel extraction
spin column (Bio-Rad) or the High Pure PCR product purification kits (Roche) as per
manufacturer’s instructions.
2.2.2.9 RT-qPCR analysis
Refer to Chapter 3
2.2.3 Agrobacterium-mediated transient transformation of plants
Agro infiltration was performed in wild type N. benthamiana for recombinant
osmotin production and for protein-protein interaction in planta analysis as well as in
transgenic tobacco plants for co-localisation analysis. A. tumefaciens strain Agl1
carrying the target plasmid was grown in a 5 mL LB medium supplemented with
rifampicin (25 µg mL-1) and appropriate antibiotic in a 50-mL Falcon tube and
incubated at 28 oC for 48 h with shaking at 200 rpm. The culture volume was increased
with LB containing the same set of antibiotic and incubated overnight at 28 oC with
shaking at 200 rpm. The bacterial cell culture was collected by centrifugation at 4000
rpm for 10 min, washed three times with infiltration medium (10 mM 2-(N-
morpholino) ethaesulfonic acid (MES), pH 5.5, 10 mM MgCl2), and resuspended with
an infiltration medium containing 200 µM acetosyringone to a concentration of OD600
= 0.8. The bacterial suspension was incubated for further 3 h with gentle shaking at
room temperature prior to infiltration. The bacteria were delivered into the underside
of leaves of 5-week-old WT N. benthamiana plants or 3-week-acclimatised transgenic
tobacco plants using a blunt tipped plastic syringe and applying gentle pressure.
2.2.4 Confocal imaging
Leaves and roots of wild-type and transgenic tissue cultured tobacco plants
expressing EYFP, TlOsm-EYFP, or EYFP-TlOsm were cut into 0.5 x 0.5 cm squares
or 0.5 cm long, washed in PBS buffer (137 mM NaCl, 2.7 mM KCl, 10 mM Na2HPO4,
1.8 mM KH2PO4, pH 7.4), fixed in 4% paraformaldehyde at 4 oC for 1 h and stored in
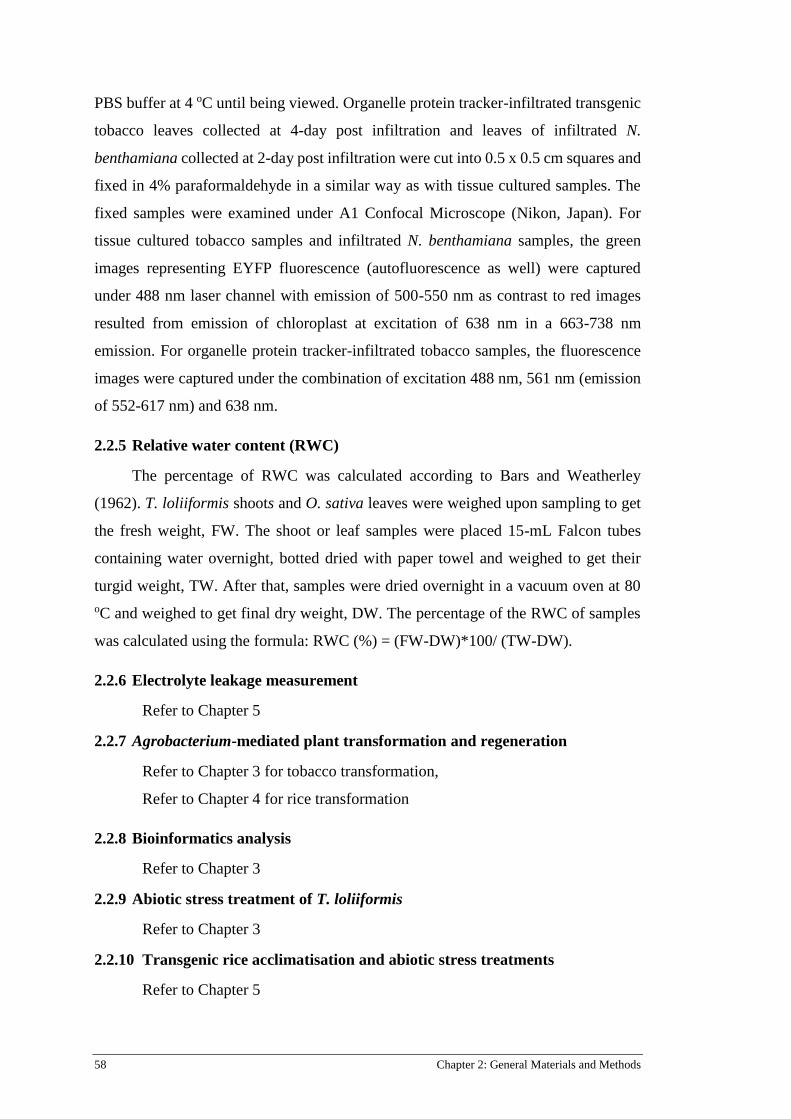
58 Chapter 2: General Materials and Methods
PBS buffer at 4 oC until being viewed. Organelle protein tracker-infiltrated transgenic
tobacco leaves collected at 4-day post infiltration and leaves of infiltrated N.
benthamiana collected at 2-day post infiltration were cut into 0.5 x 0.5 cm squares and
fixed in 4% paraformaldehyde in a similar way as with tissue cultured samples. The
fixed samples were examined under A1 Confocal Microscope (Nikon, Japan). For
tissue cultured tobacco samples and infiltrated N. benthamiana samples, the green
images representing EYFP fluorescence (autofluorescence as well) were captured
under 488 nm laser channel with emission of 500-550 nm as contrast to red images
resulted from emission of chloroplast at excitation of 638 nm in a 663-738 nm
emission. For organelle protein tracker-infiltrated tobacco samples, the fluorescence
images were captured under the combination of excitation 488 nm, 561 nm (emission
of 552-617 nm) and 638 nm.
2.2.5 Relative water content (RWC)
The percentage of RWC was calculated according to Bars and Weatherley
(1962). T. loliiformis shoots and O. sativa leaves were weighed upon sampling to get
the fresh weight, FW. The shoot or leaf samples were placed 15-mL Falcon tubes
containing water overnight, botted dried with paper towel and weighed to get their
turgid weight, TW. After that, samples were dried overnight in a vacuum oven at 80
oC and weighed to get final dry weight, DW. The percentage of the RWC of samples
was calculated using the formula: RWC (%) = (FW-DW)*100/ (TW-DW).
2.2.6 Electrolyte leakage measurement
Refer to Chapter 5
2.2.7 Agrobacterium-mediated plant transformation and regeneration
Refer to Chapter 3 for tobacco transformation,
Refer to Chapter 4 for rice transformation
2.2.8 Bioinformatics analysis
Refer to Chapter 3
2.2.9 Abiotic stress treatment of T. loliiformis
Refer to Chapter 3
2.2.10 Transgenic rice acclimatisation and abiotic stress treatments
Refer to Chapter 5

Chapter 2: General Materials and Methods 59
2.2.11 Protein extraction, purification and analysis
Refer to Chapter 6
2.2.12 Protein microarray hybridisation and detection of protein-protein
interaction
Refer to Chapter 6
2.2.13 Data analysis
All graphs and standard errors were prepared using Microsoft Excel. Statistical
analysis of TlOsm transcriptional expression upon abiotic stresses and developmental
stages was done using BioRad CFX ManagerTM software. Genetic relationship of
TlOsm with other osmotins was analysed by default program in MEGA 7 software
(refer to Chapter 3). Growth and physiological parameters of transgenic rice were
analysed using ANOVA and significant differences among experimental treatments
were analysed by Tukey’s HSD tests (Arend, 2010; refer to Chapter 5). Statistical
analyses used for significant protein interactors of the three osmotins, gene ontology
(GO) term enrichment of the protein sets, and significant pathways involving the
osmotins were the default programs of indicated software and web servers (refer to
Chapter 6).

60 Chapter 2: General Materials and Methods

Chapter 3: Molecular Characterisation of TlOsm, an Osmotin from Tripogon loliiformis 61
Chapter 3: Molecular Characterisation of
TlOsm, an Osmotin from
Tripogon loliiformis
Chapter 3 starts with an introduction to the first objective of this research project
which includes the identification of novel and conserved characteristics of TlOsm,
examination of expression profile of TlOsm upon major abiotic stresses and during
developmental stages, and determination of TlOsm sub-cellular localisation. Section
3.2 briefly describes the materials and methods used to achieve the goals of this
objective. Section 3.3 presents the identified novel and conserved characteristics of
TlOsm, the expression profile of TlOsm upon abiotic stress and developmental stages,
the sub-cellular localisation of TlOsm. The discussion of the results and findings in
this objective is presented in Section 3.4.
3.1 INTRODUCTION
Abiotic stresses have been identified as the key limiting factor on agricultural
production (Mittler and Blumwald, 2010). Rising food demand due to increasing
global population is another challenge for future agriculture. Couple together,
changing climate and increasing population undoubtedly pose a significant threat to
agricultural production in meeting the global food demand. It has been estimated that
agricultural production must be increased by at least 60% globally and doubled in
some particular regions to fulfil the global food demand by 2050 (FAO, 2016).
Progresses made by genetic improvement and agricultural resource management
during the last century have significantly contributed to sustaining current food needs.
To meet the needs for future food, agricultural productivity need to be constantly
increased and that can only be achieved by both genetic improvement and sufficient
management of agricultural production system. However, the current trends in yield
improvement of major crops were not sufficient for future food demand (Ray et al.,
2013). While crop yield progress made by conventional breeding reaches plateau and
is unable to keep pace with the target crop production, the production of biotechnology
together with genetically-engineered crops would be potentially filling the gap (Oliver,
2014). The abilities of more rapid and precise genetic improvement and transfer genes

62 Chapter 3: Molecular Characterisation of TlOsm, an Osmotin from Tripogon loliiformis
across species barriers have made genetic engineering an attractive tool to achieve the
desired traits in crops to gain necessary yield sustainable in the near future.
There is a great need to identify the key factors contributing to genetic engineering
applications for steadily increasing crop production under predicted adverse climate
conditions. Characterisation of stress-responsive genes is necessary for utilisation in
genetic engineering to generate enhanced crops that can cope with stresses and in
return of favourable conditions they continue to grow and gain maximum yield. It has
been suggested that the introduction of stress-responsive genes from stress-adapted
species to crops might enable them to withstand more extreme abiotic stresses (Mittler
and Blumwald, 2010). Resurrection plants, such as T. loliiformis, possess unique
tolerant mechanisms in their vegetative tissues enable them to survive dehydration to
air-dried state and restore full physiological activity and growth upon several days of
rehydration (Dinakar and Bartels, 2013; Gaff and Oliver, 2013; Karbaschi et al., 2016).
Therefore, resurrection plants represent an ideal genetic resource for seeking genes
encoding for unique stress-adaptive mechanisms allow plants to survive extreme stress
conditions.
Identification of key upstream regulators of stress adaptation and use of these for
enhancing abiotic stress tolerance are believed to be more effective in genetic
engineering approach (Mittler and Blumwald, 2010; Cominelli et al., 2013). Among
the genes isolated from a drought-induced cDNA library of T. loliiformis at the Centre
for Tropical Crop and Biocommodities (CTCB), Queensland University of
Technology (QUT), TlOsm was one of the candidate genes for use in developing
enhanced abiotic stress tolerant crops. Plant osmotins have been found to be the key
proteins associated with plant response to abiotic and biotic stresses. As discussed in
Section 1.3, osmotin genes have been identified and characterised from many plant
species and demonstrated to have multi-functions in plant response to abiotic and
biotic stresses. Expression of osmotins has been used to generate a number of
transgenic plants tolerant to drought, high salinity, cold, fungal pathogens and some
combinations of these (see Table 1.1 for phenotype of transgenic osmotin plants and
references). There have been progressive evidence showing osmotin roles as key
regulators in plant defense response. However, no such osmotin from the resurrection
plants, particularly in T. loliiformis, has been characterised.

Chapter 3: Molecular Characterisation of TlOsm, an Osmotin from Tripogon loliiformis 63
The aim of this research was to identify the novel and conserved characteristics of
TlOsm, an osmotin from the resurrection plant T. loliiformis. The specific objectives
of this chapter were to:
1. Identify the novel and conserved characteristics of TlOsm
2. Examine the transcriptional expression profile of TlOsm upon major abiotic
stresses and during developmental stages.
3. Determine the sub-cellular localisation of TlOsm.
3.2 MATERIALS AND METHODS
3.2.1 Plant materials
Seeds of T. loliiformis were propagated though multiple generations in
glasshouse conditions, air dried at room temperature, and stored at 4 oC. These seeds
were used to germinate plants for examining the transcriptional expression of TlOsm
under major abiotic stresses and developmental stages.
Tobacco plants as described in Section 1.1.1 were used for generation of
transgenic tobacco plants expressing EYFP-tagged TlOsm and EYFP control.
3.2.2 Sequence analysis of TlOsm
The nucleotide sequence of TlOsm was translated at the ExPASY translation tool
(Gasteiger et al., 2005). Hydropathy profile of TlOsm based on Kyle & Doolittle
scale was performed using the ExPASY Proscale. Molecular weight of TlOsm was
calculated using the ExPASY Compute pI/Mw tool. Physicochemical properties of the
protein were obtained from the ExPASY ProtParam. Disulfide bridges were predicted
on the ExPASY ProSite. The BLAST program of the National Centre for
Biotechnological Information (NCBI) was used to search the sequences with similarity
to TlOsm. Multiple sequence alignment of TlOsm with other selected osmotins was
done using the T-coffee program (Tommaso et al., 2011) using the ClustalW method.
To predict the signal peptide and cleavage site, SignalP server and TargetP 1.1 server
were used (Emanuelsson et al., 2007). Subcellular localisation of TlOsm was
predicted in the WoLF PSORT server (Horton et al., 2007), the SMART program
(Schultz et al., 1998), and the MEMSAT server (Buchan et al., 2010). SUMOylation
sites of TlOsm was predicted using SUMOsp server (Xue et al., 2006).

64 Chapter 3: Molecular Characterisation of TlOsm, an Osmotin from Tripogon loliiformis
3.2.3 Phylogenic tree construction
Amino acid sequences of 39 osmotins and OLPs were obtained from the NCBI
Protein Bank. Among these, 20 sequences originated from dicots that had been well–
characterised and functionally validated and 19 sequences originated from monocot
that had evidences of expression upon stress. The entire phylogenetic analysis was
performed in MEGA 7 software. The amino acid sequence of TlOsm and 39 above-
mentioned proteins were aligned using the ClustalW with all default settings for
protein weight matrix. This alignment was used as input data for phylogenetic tree
construction. The tree was constructed by the Maximum Likelihood method with all
default settings and the JTT model method (Jones et al., 1992). The gaps/missing data
were treated by partial deletion with site coverage cutoff 95%. The phylogeny was
treated by Bootrapping with 1000 replications.
3.2.4 Comparison of TlOsm with Os-OlP1_A and OsOlp1_I by bioinformatic
tools
The sequence similarities of the three osmotins were compared and aligned using
the ClustalW method of the T-coffee program (Tommaso et al., 2011). All the methods
for signal peptide identification, protein localisation, SUMOylation site predictions
applied for TlOsm (Section 3.2.2) were also applied for OsOlp1_A and OsOlp1_I.
The active binding residues of the three osmotins were determined by submitting the
three corresponding sequences to the I-TASSER for protein 3-D structure modelling
and function predictions (Zhang, 2008; Roy et al., 2010). After receiving the packages
from the server, the number one model suggested by the server of each osmotin was
used for determine the active binding residues (also indicated for each model by the
server) (Yang et al., 2015) and for comparison. Similarly, the sequences of the three
osmotins were submitted to the GPS web server (Xue at el., 2005) and SUMOsp for
prediction of potential phosphorylation sites and SUMOylation sites respectively.
Then, the functional site comparison were made based on the results provided by these
servers.
3.2.5 Growth conditions, abiotic stress treatments and sampling for T. loliiformis
plants
Seeds of T. loliiformis were germinated and grown in 50-mL pots in glasshouse
at 27 oC and 16 h photoperiod until stress treatments were applied and samples were
taken. For cold stress, 6-week old plants were placed in a cold room at 4 oC for 24 h

Chapter 3: Molecular Characterisation of TlOsm, an Osmotin from Tripogon loliiformis 65
with 16 h light and 8 h dark conditions; then the cold-stressed plants were recovered
in the glasshouse. Samples were taken at 0, 1, 3, 6, 9, 12 and 24 h during stress and 48
h after recovery (72 h post initial stress). For heat stress, plants were grown at 45 oC
in a growth chamber in a similar way as cold stress and samples were taken at the same
time-points as cold stress. For salinity stress treatment, 6-week old plants in plastic
pots were first treated with 200 mM NaCl solution when the leaf relative water content
(RWC) was about 85% and the second treatment was 48 h later in a manner that the
potting mix was saturated by NaCl solution and the exceeded NaCl solution was
absorbed by paper towel placed underneath the pots. After 96 h and two 200 mM NaCl
solution applications, salt solution was washed off from potting mix by submerging
the pots in water and draining off for 5 times (change water every time). Plants were
led to recover and were watered with a 2-day interval until the data collection for
recovered plants completed. Salinity stress samples were taken at 0, 1, 3, 6, 12, 24, 48
and 96 h after salt treatment and 1 and 5 days after recovery. Previous to drought stress
treatment, the morphological changes in shoots of T.loliiformis plants corresponding
to specific leaf RWC (80, 70, 60, 40 and < 10%) were determined. In drought stress,
40-day old plants were fully watered in the late afternoon and the fully-hydrated
samples were taken in the morning of the next day. Plants were then challenged by
withholding water for a period of time until the leaf RWC reached the pre-determined
points. Then the plants with <10% RWC were re-watered with a 2-day interval for
recovery. Samples were taken at full hydration, 80, 70, 60, 40, <10% RWC and 24 and
72 h after re-hydration. In sampling for different developmental stages, plants were
sampled at 2, 4, 6, 8 and 10 weeks post germination. For the drought stress, 8 pots of
multiple plants were collected for each RWC point and RWC was determined for
plants in each pot based on randomly-selected 15 leaves. For the remaining
experiments, four pots of multiple plants were collected for each stress or
developmental time-points. Each pot was considered as one biological replicate.
Leaves and roots of the above stress-treated plants and the corresponding controls
sampled at different stress time-points and developmental stages were snap frozen in
liquid nitrogen and stored at -80 oC for RNA extraction.
3.2.6 RNA extraction and RT_qPCR analysis
Total RNA was extracted from 100 mg of shoot or root samples using the
methods described in Section 2.2.2.2. Genomic DNA in the total RNA samples was

66 Chapter 3: Molecular Characterisation of TlOsm, an Osmotin from Tripogon loliiformis
eliminated as in Section 2.2.2.4. cDNA was synthesized from 1 µg of total RNA in a
25 µl reaction using the methods described in Section 2.2.2.5. The synthesized cDNA
was used as templates in PCR assay using a specific pair of primers that yields
distinguish amplicons from T. loliiformis cDNA and genomic DNA to confirm the
complete elimination of genomic DNA in each of cDNA samples. Real-time RT-PCR
was performed on an optical 384-well plate with a BioRad CFX 384TM Real-time PCR
system using SYBR premix (BioRad) according to the manufacturer’s protocol and
TlOsm specific primers forward (5’- CTGCAAGCCGTCGCAGTACT-3’) and reverse
(5’-AGGTGATGGCGTAGGTGGTGT-3’). The T. loliiformis Actin1 and Ubi10
genes were used as internal references. The PCR thermal cycling protocol was as
follows: 95 oC for 10 s, followed by 40 cycles at 95 oC for 5 s and 60 oC for 30 s.
BioRad CFX ManagerTM software was used for data analysis. The RT-qPCR products
with highest, medium and lowest levels of TlOsm expression were ligated into
pGEMT-easy vector (Invitrogen) and transformed into E. coli. Five individual E. coli
colonies were randomly selected from each RT-qPCR product for sequencing to
confirm the same amplicons of TlOsm.
3.2.7 Generation of transgenic tobacco expressing EYFP-tagged TlOsm and VC
3.2.7.1 Plasmids for tobacco transformation
Three plasmids pCE101-TlOsm, pCE104-TlOsm, and pCE100-EYFP
constructed by the methods described in Section 2.2.1 were used for tobacco
transformation. The gene expression cassette between left and right borders of these
plasmids are shown in Figure 3.1.
Figure 3.1 Schematic diagram of gene constructs for expressing EYFP-tagged TlOsm
and EYFP control in N. tabacum

Chapter 3: Molecular Characterisation of TlOsm, an Osmotin from Tripogon loliiformis 67
3.2.7.2 Agrobacterium-mediated transformation of tobacco
N. tabacum transformation, selection and regeneration were performed by leaf
disc transformation as described by Clemente (2006). Leaves from 4-6 week-old N.
tabacum plants germinated in vitro and cultured at 16 h photoperiod, 25 oC, and
moderate light were used as target tissues for transformation. The day before
transformation, Agrobacterium carrying the pCE-100-EYFP, pCE-101-TlOsm and
pCE-104-TlOsm plasmids stored in glycerol were cultured overnight in LB medium
(100 µl of bacterial stock in 10 ml of liquid LB). On the day of transformation,
agrobacterial overnight cultures were diluted in inoculation medium containing full
strength MS salts and 3% sucrose to get the OD600 of 0.1. Leaf discs about 1 cm in
diameter were punched from fresh leaves, immersed in diluted bacterial suspension
for 10 min with well agitation 3 times, blotted on filter paper and placed upside down
on co-cultivation medium in Petri plates. These plates were incubated for 1 day at 25
oC in darkness. The infected leaf discs were washed 3 times with autoclaved water
containing 200 mg L-1 timentin and cultured on Petri plates containing 30 mL of
selection medium (full-strength MS salts and vitamins, 30 g L-1 of sucrose, 1 mg L-1 of
NAA, 3 mg L-1 of BA, 8 g L-1 of agar, 200 mg L-1 of timentin and 25 mg L-1 of
hygromycin, pH 5.7). These plates were placed in the growth room with 16 h
photoperiod, 25 oC, and moderate light and frequently subcultured at 2 week intervals
until shoot formation. For each plasmid construct, 10 plates of 10 leaf discs per plate
were used in transformation.
3.2.7.3 Selection and regeneration of transgenic tobacco plants
Shoots just emerged from calli induced by leaf disc after 3 subsequent selections
in Petri plates were scanned under fluorescent microscope (Zeiss SteREO Lumar
V.12). The well-defined stem shoots expressing EYFP, which was not observed in
WT, were transferred into selection rooting medium containing 1/2 strength MS salts,
200 mg L-1 of timentin and 25 mg L-1 of hygromycin. For each plate, 5 strongest shoots
were selected from 5 different leaf discs to ensure independent lines. Rooted plantlets
were scanned under fluorescent microscope to ensure the EYFP expression in both
root and shoot of plants. Well-rooted plantlets constitutively expressing EYFP were
subjected for molecular characterisation of the transgenes. When the transgenic status
were confirmed, plants were in vitro multiplied, subjected for analysis and
acclimatised in the controlled growth room.

68 Chapter 3: Molecular Characterisation of TlOsm, an Osmotin from Tripogon loliiformis
3.2.7.4 PCR confirmation of transgenes in regenerated transgenic tobacco
PCR analysis was used to confirm the presence of TlOsm and EYFP genes in
EYFP expressing tobacco plants. Two WT and 12 normal-looking plants transformed
with each plasmid construct were chosen. Genomic DNA from 38 tobacco leaf
samples was isolated by following rapid protocol (Thomson and Henry, 1995) with a
minor modification as described in Section 2.2.2.1. The presence of DNA in 38 rapid-
released extracts were confirmed by PCR using Musa 18Sr primers (Table 3.1). For
PCR and agarose gel electrophoresis, refer to methods as described in Section 2.2.2.6
and 2.2.2.7.
Table 3.1 List of primers for PCR characterisation of transgenic tobacco plants
Gene Primer sequence (5’-3’) Annealing
temperature (oC)
Amplicon
size (bp)
TlOsm TGGCCGAGTTCACCATGGAC
AGGTGATGGCGTAGGTGGTGT 60 405
EYFP CACCATGGTGCCTAGCGTGACCAAGG
TTAAGCGTAATCTGGAACATCG 50 838
Musa 18Sr CATCACAGGATTTCGGTCCT
AGACAAATCGCTCCACCAAC 56 507
3.2.8 Agro-infiltration of transgenic tobacco
The binary plasmid Pm-rk CD3-1007 (Nelson et al., 2007) carrying the
mCherry-tagged protein targeting plasma membrane was used for co-localisation
analysis. A. tumefaciens strain Agl1 carrying the plasmid were grown, prepared, and
infiltrated into acclimatised transgenic tobacco plants expressing either EYFP,
EYFP:TlOsm, or TlOsm: EYFP by the methods described in Section 2.2.3.
3.2.9 Salinity stress treatment of tobacco plants
Tissue cultured transgenic tobacco plants were placed in autoclaved pots
containing autoclaved half-strength MS medium with vitamins supplemented with 150
mM NaCl solution until the solution surface reached 1 cm above the root collar. Pots
were placed in growth chamber with conditions as for tissue culture tobacco plants for
24 h. Roots of treated plants were used for preparing fixed samples in confocal analysis
of TlOsm localisation under salinity stress as described in Section 2.2.4.

Chapter 3: Molecular Characterisation of TlOsm, an Osmotin from Tripogon loliiformis 69
3.2.10 Confocal imaging
Refer to Section 2.2.4
3.3 RESULTS
3.3.1 Sequence analysis of TlOsm
3.3.1.1 TlOsm belongs to Thaumatin-like protein (TLP) superfamily but has a
non-homologous C-terminal sequence
Osmotin, OLP, and TLP are relatively low-molecular-weight proteins that plants
produce in response to abiotic and biotic stresses (Liu et al., 2010). TlOsm was
previously isolated from a T. loliiformis drought-induced cDNA library (unpublished,
Williams). The full-length TlOsm cDNA encoded a protein consisting of 313 amino
acids (AA). Its molecular weight was estimated to be 31 kDa. The BLAST search on
the NCBI database revealed it to be homologous to those of a GH64-TLP_SF
superfamily (osmotin, OLP, and TLP proteins) with a high similarity at its 26-252 AA
sequence. The protein has 8 predicted disulfide bridges, which are conserved across
osmotins, formed by 16 cysteine residues. Its theoretical pI is 4.75. To compare the
TlOsm AA sequence with other osmotins, the five selected osmotin AA sequences,
which were well characterised and validated to have roles in plant stress tolerance,
were aligned with TlOsm. The alignment showed high identity only between N-
terminus to AA 252 of TlOsm AA sequence (Figure 3.2). TlOsm sequence of AA
253-313 was not found homologous to other proteins in the database.

70 Chapter 3: Molecular Characterisation of TlOsm, an Osmotin from Tripogon loliiformis
Figure 3.2 Alignment of TlOsm with selected plant osmotins. Arabidopsis thaliana
(accession number NM117234.2), Capsicum annuum (AY262059), Glycine max
(NM001249476.1); Nicotiana tabacum (X65701.1); and Solanum nigrum (AF450276.1), as
in order from the top. The identical amino acid are indicated as *. The 16 conserved Cysteines
among osmotins are boxed. Multiple alignment was done in the T-coffee program
(http://www.ebi.ac.uk/Tools/msa/tcoffee/) using the ClustalW). Arrow indicates the signal
peptide of TlOsm.
The hydropathy profile showed that TlOsm is highly hydrophobic at the N- and
C-terminus and is neutral in the middle of its sequence (Figure 3.3 A). It was predicted
that TlOsm has a 24 AA N-terminal signal peptide with a cleavage site between Ser
and Lys. Following cleavage of the signal peptide, TlOsm molecular weight was

Chapter 3: Molecular Characterisation of TlOsm, an Osmotin from Tripogon loliiformis 71
estimated to be 28.76 kDa with a pI of 4.60. A transmembrane α-helix at its AA
sequence 294-309 determines TlOsm to be an integral transmembrane protein type I
(Figure 3.3 B).
Figure 3.3 Property analysis of TlOsm. A: Hydropathy profile of TlOsm based on Kyte
& Doolittle scale was performed at http://web.expasy.org/protscale/. B: Sub-cellular
localisation prediction of TlOsm using MEMSAT server
(http://bioinf.cs.ucl.ac.uk/psipred/?memsatsvm=1)

72 Chapter 3: Molecular Characterisation of TlOsm, an Osmotin from Tripogon loliiformis
3.3.1.2 TlOsm is closely related to osmotins of monocotyledonous plants
To gain an understanding of the genetic relationship of TlOsm and other plant
osmotins, a phylogenetic tree was generated for TlOsm with other osmotin sequences,
19 from monocotyledonous plants and 20 from dicotyledonous plants (Figure 3.4).
The respective sequences were grouped in two distinct clades. All sequences from
dicotyledonous plants formed one clade and the other clade grouped by those of
monocotyledonous plants. The clade of monocotyledonous osmotins had two sub-
groups, with TlOsm grouped to a sub-group containing the majority of sequences (15
sequences). TlOsm AA sequence was found to be closest to the osmotins of Setaria
italica (foxtail millet).

Chapter 3: Molecular Characterisation of TlOsm, an Osmotin from Tripogon loliiformis 73
Figure 3.4 The phylogenic tree showing the relationship of TlOsm and osmotins from
different monocotyledonous and dicotyledonous species.
Only the complete published sequences of osmotin and osmotin-like proteins were selected
including 20 sequences from dicotyledonous species and 19 sequences from
monocotyledonous species. The amino acid sequences were obtained from the NCBI Protein
bank with accession number indicated. Entire phylogenetic analysis was performed in MEGA
7 software. Alignment of 40 sequences was done using the ClustalW. The tree was constructed
by the Maximum Likelihood method with all default settings. The gap/missing data were
treated by partial deletion with site coverage cutoff 95%. The phylogeny was tested by
Bootstrapping with one thousand replications. Arrow indicates the position of TlOsm. Two
rice osmotins used to compare with TlOsm in this study were boxed: the sequence in red box
from the drought-tolerant cultivar Apo and the sequence in blue box from the drought-sensitive
cultivar IR 64.

74 Chapter 3: Molecular Characterisation of TlOsm, an Osmotin from Tripogon loliiformis
3.3.2 TlOsm is induced by cold, drought and salinity stresses
Determination of critical sampling time-points is necessary for examining the
expression pattern of TlOsm during developmental stages. To determine the time-
points for sampling, the life cycle of T. loliiformis plants in controlled glasshouse
conditions was first observed. T. loliiformis plants started tillering at about 4 weeks
after germination and reached maximum density at 6 weeks. The plants started
flowering at week 7 and in week 8, all of them were bearing flowers. Their seeds were
all filled at week 10 and could be harvested at week 12. The plants completed their life
cycle at about 12-14 weeks after germination. Therefore, five time-points including 2-
, 4-, 6-, 8- and 10-week post germination were determined for examining TlOsm
expression during developmental stages (Figure 3.5). Then, transcriptional expression
of TlOsm during developmental stages was determined on these five time-point
samples. The expression of TlOsm remained unchanged in shoots during development
(Figure. 3.6 A) but was found at higher level in roots only at 6-week post germination
(Figure 3.6 B).
Figure 3.5 Developmental stages of T. loliiformis for sampling. Time-points indicated as
weeks after germination. Plants at 6 weeks were used for all stress treatments

Chapter 3: Molecular Characterisation of TlOsm, an Osmotin from Tripogon loliiformis 75
To determine the expression profile of TlOsm in response to abiotic stresses, the
6-week old plants were separately exposed to four major abiotic stresses including cold
(4 oC), heat (45 oC), salinity (200 mM NaCl) and drought. Samples were collected at
different time-points during the course of stress as indicated in the graphs in Figure
3.6 and analysed by RT-qPCR. TlOsm was down-regulated in shoot within first 12 h
exposure to heat stress, then went up to the level before stress at 24 h and during
recovery (Figure 3.6 C); while its expression levels in root remained unchanged during
the course of heat stress and recovery (Figure 3.6 D). In response to cold stress, TlOsm
was rapidly and transiently activated in both roots and shoots after only 1 - 3 h of
treatment, then went down to normal levels after 6 h in shoots (Figure 3.6 E) and down-
regulated during 6 - 24 h of stress in roots (Figure 3.6 F). Under drought stress, TlOsm
expression was similar in shoots and roots that was sharply induced at 80% RWC,
reached a peak at 70% RWC, and remained high levels at 60% RWC (Figure 3.6 G &
H). The different response of roots and shoots in drought stress was found at 40-10%
RWC where TlOsm transcripts went down to level of before stress in shoots (Figure
3.6 G) but remained significantly higher than unstressed levels in roots (Figure 3.6 H).
TlOsm was rapidly and sharply activated upon exposure to salt stress in roots, reached
thousand fold after only 1 h of stress treatment and remained significantly high levels
within 12 h of salt stress (Figure 3.6 G). The activation in shoots was slower (started
at 3 h), at lower levels, but lasted longer (until 96 h of stress) as compared to that in
root (Figure 3.6 I).
Together, this investigation showed that TlOsm gene expression is sharply
activated at early stages of osmotic stress (cold, drought, and salinity) in both roots
and shoots of T. loliiformis. In plant recovery from all four types of abiotic stresses,
the expression of TlOsm remained unchanged as compared to pre-stress levels for both
roots and shoots.

76 Chapter 3: Molecular Characterisation of TlOsm, an Osmotin from Tripogon loliiformis
Figure 3.6 Expression of TlOsm under developmental stages and various abiotic stresses.
Type of tissues and stresses are indicated. Sampling time-points during developmental stages
expressed as weeks post-germination. Six week old T. loliiformis plants were subjected to cold
(4 oC), heat (45 oC), salt (200 mM NaCl) and drought (withholding the water supply from the
plants) stresses. The transcript expression levels were determined by RT-qPCR and
normalized to the Actin and Ubi endogenous controls. Values represent means + SE of three
biological replicates x 3 technical replicates (* indicates significant differences at P ≤ 0.05).
Sequencing data from RT-qPCR products of the highest, medium, and lowest expression levels
confirmed single product of TlOsm.

Chapter 3: Molecular Characterisation of TlOsm, an Osmotin from Tripogon loliiformis 77
3.3.3 TlOsm localises to the plasma membrane
To gain insights into the function of TlOsm, its subcellular localisation was
analysed. Predictions by bioinformatics tools suggested membrane localisation for
TlOsm (Figure 3.3 B). To validate the subcellular localisation of TlOsm in planta,
transgenic tobacco plants stably expressing EYFP-tagged TlOsm were generated and
transgenic plants were subjected to confocal laser scanning analysis.
3.3.3.1 Generation of transgenic tobacco stably expressing EYFP-tagged TlOsm
TlOsm was tagged with EYFP at its either C- or N-terminus together with EYFP
control (vector control, VC), these three gene constructs (Figure 3.1) were stably
transformed in N. tabacum by Agrobacterium-mediated transformation using leaf disc
method (Clemente, 2006). After 3 cycles of culture in fresh selective media, newly
emerging shoots expressing EYFP (Figure 3.7 A) were selected for further regeneration.
When plants were fully regenerated, their roots were scanned for the expression of
EYFP, which was not seen in WT, to confirm plants expressing EYFP (Figure 3.7 B).
Figure 3.7 Fluorescence-based selection of transgenic tobacco expressing EYFP-tagged
TlOsm and VC. A: representatives of newly emerging shoots expressing EYFP selected for
regeneration. B: representative of regenerated plant roots expressing EYFP. Type of under-
expressing genes are indicated.

78 Chapter 3: Molecular Characterisation of TlOsm, an Osmotin from Tripogon loliiformis
When the EYFP-expressing status of tobacco plants was confirmed, 12 lines
with normal-looking morphology transformed with each gene construct and 2 WT
plants were selected for PCR analysis of transgene presence. The presence of DNA in
rapid-released DNA samples were confirmed by using the Musa 18Sr primers in PCR
reactions. All 38 samples showed the presence of genomic DNA, including 12
TlOsm:EYFP plants (Figure 3.8 A), 12 EYFP:TlOsm plants (Figure 3.8 B), 12 EYFP
plants (Figure 3.8 G) and 2 WT plants (Figure 3.8 A & B). The presence of TlOsm
gene in the plants transformed with EYFP-tagged TlOsm was shown in Figure 3.8 C
& E. Similarly, the presence of EYFP gene in EYFP expressing plants but not in WT
plants was confirmed (Figure 3.8 D, F & H).
Figure 3.8 Confirmation of stable transgene integration in transgenic tobacco by PCR. The presence of DNA in rapid-released DNA solutions of WT1 and 12 TlOsm:EYFP plants
(A) WT2 and 12 EYFP:TlOsm plants (B) and EYFP plants (G). The presence of TlOsm gene
in TlOsm:EYFP plants (C) and EYFP:TlOsm plants (E). The presence of EYFP gene in
TlOsm:EYFP plants (D), EYFP:TlOsm (F), and EYFP plants (H). ML: molecular ladder, P:
positive control-plasmid DNA, N: negative control, Kb: kilo base pair.

Chapter 3: Molecular Characterisation of TlOsm, an Osmotin from Tripogon loliiformis 79
3.3.3.2 TlOsm localised to the plasma membrane in unstressed conditions
To examine the subcellular localisation of TlOsm, confocal laser scanning
microscopy was used for leaf samples of tissue-cultured transgenic N. tabacum plants.
As shown in Figure 3.9, in the EYFP-tagged TlOsm plants, the fluorescence was
surrounding the cell borders of leaf cells. However, in N. tabacum cells expressing
EYFP alone, the fluorescence was distributed throughout the cell.
Figure 3.9 Cellular localisation of TlOsm. A: leaf tissues expressing EYFP, B: leaf tissues
expressing TlOsm:EYFP, C: leaf tissues expressing EYFP:TlOsm. The wavelengths captured
the images are indicated. Fitc light channel captures the EYFP fluorescence, Cy5 light captures
red fluorescence of chlorophyll (where green autofluorescence emitted), bars 10 µm.
To confirm the localisation of TlOsm, a positive control for a plasma
membrane-localised protein, a fusion construct of AtPIP2 with red fluorescent protein
mCherry (Nelson et al. 2007), was agro-infiltrated into leaves of acclimatised
transgenic N. tabacum expressing EYFP tagged TlOsm and EYFP control. As shown
in Figure 3.10, the EYFP-tagged TlOsm in both C- and N terminus co-localised with

80 Chapter 3: Molecular Characterisation of TlOsm, an Osmotin from Tripogon loliiformis
the plasma membrane protein marker as shown by the overlap of red and yellow
fluorescence (Figure 3.10 B & C). The distribution of yellow fluorescence in cells
expressing EYFP alone was throughout the cells and the overlap with red fluorescence
pattern was not observed (Figure 3.10 A). These results confirmed the localisation of
TlOsm to the plasma membrane.
Figure 3.10 Subcellular co_localisation analysis of EYFP-tagged TlOsm and EYFP in
N. tabacum. Confocal microscopy images of leaf tissues co-expressing plasma membrane
protein tracker AtPIP2A-mCherry with (A) EYFP, (B) EYFP:TlOsm, and (C) TlOsm:EYFP
are shown. Images taken under Fitc light channel (488nm) captured green and EYFP
fluorescence, Tritc (561 nm) captured plasma membrane tracker AtPIP2A-mCherry (and some
photosynthesis pigments as well), Cy5 (668 nm) captured red fluorescence of chlorophyll
(where auto-fluorescence and photosynthesis pigment emitted). Bars 10µm.
3.3.3.3 Localisation of TlOsm remains unchanged under salinity stress
It has been evidenced that some stress-responsive proteins containing
SUMOylation motifs translocate during stress conditions in order to perform their
functions (Johnson, 2004). Two SUMOylation motifs were predicted to be present in
TlOsm AA sequence, suggesting that TlOsm protein might translocate under stress
conditions. To determine if TlOsm localises differently under unstressed and stressed

Chapter 3: Molecular Characterisation of TlOsm, an Osmotin from Tripogon loliiformis 81
conditions, tissue cultured plants expressing EYFP, EYFP:TlOsm, and TlOsm:EYFP
were stressed by culture in liquid medium supplemented with 150 mM NaCl for 24 h.
Then, roots of these plants were subjected to confocal laser scanning analysis. As
shown in Figure 3.11, fluorescence distributions in the cells were the same for plants
that had undergone unstressed and 150 mM NaCl stress treatments for all EYFP,
EYFP:TlOsm, and TlOsm:EYFP samples. The results indicated that localisation of
TlOsm was unchanged under salinity stress.
Figure 3.11 Localisation of EYFP-tagged TlOsm and EYFP in transgenic N. tabacum
cells under unstressed and 150 mM NaCl stress. Confocal microscopy images of root tissues
expressing (A) EYFP, (B) EYFP:TlOsm, and (C) TlOsm:EYFP under unstressed (first
column) and 150 mM NaCl stress treatment (the second and third columns). Images taken
under Fitc light channel (488nm) captured green and EYFP fluorescence. Bars 10µm
3.3.4 TlOsm, OsOlp1_A and OsOlp1_I differ in active binding residues
OsOlp1_A and OsOlp1_I were isolated from drought-tolerant cultivar (Apo) and
drought-sensitive cultivar (IR 64) of the stress sensitive species O. sativa. The two
genes share 96% similarity in their encoded AA sequences but found differentially
expressed upon drought. Thus, their only 10 AA difference must make the differences
of their response to drought. To gain insights the functions and mechanisms of TlOsm
and possible differences between osmotins from tolerant vs. sensitive species as well

82 Chapter 3: Molecular Characterisation of TlOsm, an Osmotin from Tripogon loliiformis
as from tolerant vs. sensitive cultivars within species in plant abiotic stress response,
these two genes were incorporated in all the experiments for validating the role of
TlOsm in biological system. Functional predictions for the three proteins were carried
out using bioinformatic tools, as described in Section 3.2.4. Some of the characteristics
in relevant to stress response of plant genes, which were different among the three
proteins, are presented in Table 3.2.
Table 3.2 Characteristics of TlOsm, OsOlp1_A, and OsOlp1_I by functional
predictions (numbers indicate the number of binding sites)
Characteristics TlOsm OsOlp1_A OsOlp1_I
Localisation Plasma
membrane
ER or
chloroplast Apoplast
SUMOylation motifs 2 3 3
Glucan-endo 1,3-beta-D
glucosidase 8 5 2
Isoamylase activity 1 0 0
Cellulase activity 1 0 0
Chondroitin AC lyase activity 1 0 0
Beta-fructofuranosidase activity 1 0 0
Serine/threonine type
phosphorylation residue 55 14* 14*
Tyrosine type phosphorylation
residue 9 1 1
(*) the same number of residues but different in one site: Ser142 in OsOlp1_A and Thr144
in OsOlp1_I
The predictions showed the difference in the localisation, SUMOylation motifs,
and active binding residues of the three proteins. Glucan hydrolysis and
phosphorylation have been proposed to be functions of osmotins in response abiotic
and biotic stresses. TlOsm was predicted to have more glucan binding residues and
potential phosphorylation sites than 2 rice osmotins. OsOlp1_A has more glucan-
binding residues than OsOlp1_I. Even OsOlp1_A and OsOlp1_I has the same
number of potential phosphorylation residues, one site was found different in their
protein sequences (Appendix B-Figure 1; Appendix B-Table 1). Four binding residues
of the four enzymes (Isoamylase, Chondroitin AC lyase, Cellulase, and Beta-
fructofuranosidase) responsible for break down carbohydrate into small sugar
molecules such as monosaccharide or disaccharide only present in TlOsm (Appendix

Chapter 3: Molecular Characterisation of TlOsm, an Osmotin from Tripogon loliiformis 83
B-Figure 2). These differences may provide the key mechanism in the functions of
these osmotins.
3.4 DISCUSSION
Osmotins and OLPs belong to the pathogenesis-related PR-5 family and have
been shown to be a key protein associated with osmotic adjustment in plants. Large
numbers of osmotins and OLPs have been characterised from diverse plant species. In
addition, numbers of transgenic crops expressing osmotins and OLPs have
demonstrated enhanced tolerance to abiotic and biotic stresses (D'Angei and Altamura,
2007; Goel et al., 2010; Subramanyam et al., 2011; Subramannyan et al., 2012; Patade
et al., 2013). However, no osmotin from a desiccation tolerant species such as the
resurrection plant T. loliiformis has been characterised. Resurrection plants possess a
unique ability to tolerate severe water deficit in vegetative tissues and represent a
potentially rich source of genes conferring tolerance to abiotic stresses (Mundree et
al., 2002; Ingle et al., 2007; Williams et al., 2015; Karbaschi et al., 2016). In this study,
we characterised an osmotin gene from T. loliiformis. The common and novel
characteristics, transcriptional expression profile under various developmental stages
and abiotic stresses, and the subcellular localisation of TlOsm were revealed. In
addition, the predictions on proposed functional characteristics of TlOsm were made
and compared with two rice osmotin genes, which were further incorporated in
functional validation of TlOsm. Results from this study suggest the involvement of
TlOsm in plant response to multiple stresses including cold, drought and salinity.
3.4.1 TlOsm is a member of osmotins and OLPs
Osmotins and OLPs have been characterised in many monocotyledonous and
dicotyledonous plant species. Thus, a large number of partial and complete sequences
of osmotin are available in the NCBI database. A BLAST search of the database
revealed that the AA sequence of TlOsm has high similarity to osmotins and OLPs at
its 26-252 AA sequence only. TlOsm has the conserved characteristics of an osmotin
or OLP such as 16 cysteine residues that form 8 disulfide bonds, N-terminus signal
peptide, and a protease cleavage site. However, the alignment of TlOsm AA sequence
with other five osmotins that were well characterised and validated to have roles in
plant stress tolerance revealed the identities up to 54% (Figure 3.2). Hydrophobic
nature, which has shown in common of an osmotin and made it difficult for

84 Chapter 3: Molecular Characterisation of TlOsm, an Osmotin from Tripogon loliiformis
recombinant osmotin production, was also shown in TlOsm (Figure 3.3).
Phylogenetic analysis describing the relationship between TlOsm with 39 other
osmotins from monocots and dicots showed that TlOsm has close genetic relationship
to major group of osmotins from monocots and closest to the osmotins of Setaria
italica (Figure 3.4). These results demonstrated that TlOsm is a member of osmotins
and OLPs, has close genetic relationship to monocotyledonous osmotins, but has a
non-homologous C-terminal sequence of about 50 AA.
3.4.2 TlOsm is involved in osmotic stress response of T. loliiformis plants
Plant osmotin genes have been shown to be induced by at least ten abiotic and
biotic stimuli (Raghothama et al., 1993). Osmotin was primarily named on the basis of
its activation upon osmotic stress response (Singh et al., 1985). Results from this study
showed that TlOsm was induced by cold, drought and salinity stresses. Transcriptional
profiling of TlOsm under major abiotic stress and during developmental stages
suggested the involvement of TlOsm in osmotic stress tolerance. TlOsm was up-
regulated sharply in both roots and shoots at early stages of cold, drought, and salinity
stress exposure. The gene was activated at highest levels within 1 - 3 h upon cold stress,
at 80%-60% of leaf RWC in drought stress, and at 1 – 3 h in roots to 3 - 6 h in shoots
upon salinity stress exposure (Fig. 2 E - J). High salt levels cause plant stress in two
phases, osmotic stress at early phase and ion stress at later phase (Munns and Tester,
2008). TlOsm expression levels were reduced sharply in shoots and to the levels of
unstressed in roots only after 12 h from the onset of NaCl stress, suggested that TlOsm
is not directly involved in ion stress mechanism. In heat stress, TlOsm expression
remained unchanged in roots but was down-regulated in shoots during the first 12 h of
stress. While the direct evidence in regulating stomata has not been reported for
osmotin, the main different responses of plants to osmotic stress and heat stress are the
regulation of stomata. One of the responses of plants to osmotic stress is stomatal
closure to reduce water loss, while in heat stress stomata are open to reduce heat
(Mittler, 2006). It could be the reason that the expression of TlOsm connected to
stomatal closure generating no advantage for leaf response to heat stress, resulted in
the reduced TlOsm expression in shoots during heat stress. During the recovery from
each of the four stresses, TlOsm expression levels were not different with those of
before stress. This indicated that the gene does not play a role in plant recovery. During
the course of development, the TlOsm expression remained unchanged except a slight

Chapter 3: Molecular Characterisation of TlOsm, an Osmotin from Tripogon loliiformis 85
increase at 6 weeks in roots. Although osmotin was found to express at basal levels in
the cells that were not exposed to osmotic stress (Singh et al. 1985), the involvement
of osmotin in plant development has not been reported so far. T. loliiformis plants had
maximum density at this stage might consume more water that could generate the
temporary water deficits in root environment at the time of sampling and might be the
reason for this increase of TlOsm transcripts.
The expression levels of TlOsm upon stresses were found much higher than other
characterised osmotins. It is difficult to make a comparison among studies because different
methods were used to monitor the gene expression in the reports. However, if the comparison
made by measuring mRNA using RT-qPCR, the expression levels of TlOsm by stress stimuli
were by far higher. For example, strawberry FaOLP was induced up to 40 fold upon salicylic
acid (Zhang and Shih, 2007). Similarly, PhOsm from Petunia were induced 40-80 fold by
salt, wounding, jasmonic acid and salicylic acid (Kim et al., 2002). In this study, TlOsm was
up-regulated a thousand fold in shoot after 1 h exposure to cold (Figure 3.6 E), in roots
exposed to 200 mM NaCl (Figure 3.6 J) for 1 h or drought at 70% leaf RWC (Figure 3.6 H).
It is not known if very high expression level of a gene upon stress would provide additive
advantages for stress resilience in plants, the noticeably high expression levels of stress-
responsive genes under drought were also found in other resurrection plants such as
Haberlea rhodopensis (Gechev et al., 2013) and Craterostigma plantagineum (Rodriguez et
al., 2010) by transcriptome analysis. It has been suggested that genes activated rapidly upon
stress stimuli are involved in stress signalling while those activated later during the course of
stresses are involved in adaptation (Zhu, 2016). In addition, there are some existing
convergences among signal transduction pathways of different stress stimuli that help plants
induce similar responses to a wide range of stresses and develop cross-tolerance to various
stresses (Qin et al., 2011). TlOsm was sharply induced by a broad range of abiotic stress and
at early stage of stress duration implies that the gene plays a positive role in plants stress
response and might be involved in stress signalling pathway.
3.4.3 TlOsm localises to the plasma membrane regardless of stress condition
In subcellular localisation analysis of TlOsm, the stable expression of EYFP-
tagged TlOsm and EYFP control in tobacco was chosen for more convenience and
facilitating analysis of plants undergone stress. The fluorescent signal in transgenic
samples was critical for the detection of TlOsm localisation. Thus, the selection of
tobacco plants for regeneration was based on the EYFP expression. When the stable
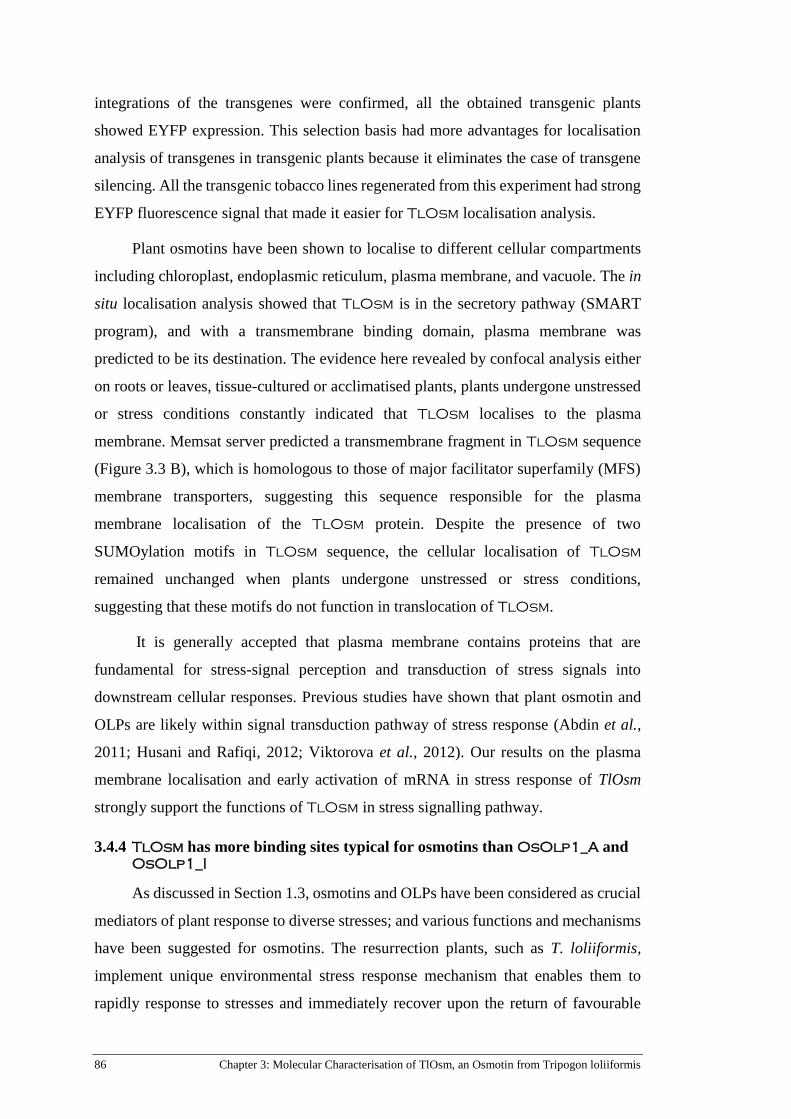
86 Chapter 3: Molecular Characterisation of TlOsm, an Osmotin from Tripogon loliiformis
integrations of the transgenes were confirmed, all the obtained transgenic plants
showed EYFP expression. This selection basis had more advantages for localisation
analysis of transgenes in transgenic plants because it eliminates the case of transgene
silencing. All the transgenic tobacco lines regenerated from this experiment had strong
EYFP fluorescence signal that made it easier for TlOsm localisation analysis.
Plant osmotins have been shown to localise to different cellular compartments
including chloroplast, endoplasmic reticulum, plasma membrane, and vacuole. The in
situ localisation analysis showed that TlOsm is in the secretory pathway (SMART
program), and with a transmembrane binding domain, plasma membrane was
predicted to be its destination. The evidence here revealed by confocal analysis either
on roots or leaves, tissue-cultured or acclimatised plants, plants undergone unstressed
or stress conditions constantly indicated that TlOsm localises to the plasma
membrane. Memsat server predicted a transmembrane fragment in TlOsm sequence
(Figure 3.3 B), which is homologous to those of major facilitator superfamily (MFS)
membrane transporters, suggesting this sequence responsible for the plasma
membrane localisation of the TlOsm protein. Despite the presence of two
SUMOylation motifs in TlOsm sequence, the cellular localisation of TlOsm
remained unchanged when plants undergone unstressed or stress conditions,
suggesting that these motifs do not function in translocation of TlOsm.
It is generally accepted that plasma membrane contains proteins that are
fundamental for stress-signal perception and transduction of stress signals into
downstream cellular responses. Previous studies have shown that plant osmotin and
OLPs are likely within signal transduction pathway of stress response (Abdin et al.,
2011; Husani and Rafiqi, 2012; Viktorova et al., 2012). Our results on the plasma
membrane localisation and early activation of mRNA in stress response of TlOsm
strongly support the functions of TlOsm in stress signalling pathway.
3.4.4 TlOsm has more binding sites typical for osmotins than OsOlp1_A and OsOlp1_I
As discussed in Section 1.3, osmotins and OLPs have been considered as crucial
mediators of plant response to diverse stresses; and various functions and mechanisms
have been suggested for osmotins. The resurrection plants, such as T. loliiformis,
implement unique environmental stress response mechanism that enables them to
rapidly response to stresses and immediately recover upon the return of favourable

Chapter 3: Molecular Characterisation of TlOsm, an Osmotin from Tripogon loliiformis 87
conditions (refer to Section 1.4). To investigate whether proteins from T. loliiformis
have evolved unique characteristics contributing to additional level of stress tolerance,
as compared to their desiccation sensitive counterparts, the comparison among
TlOsm OsOlp1_A and OsOlp1_I were made based on functional predictions.
It is generally accepted that the presence of glucan-binding residues around
acidic cleft is essential for antifungal activity of PR5 proteins. Osmotins have been
thought to use endoglucanase catalytic activity to hydrolyse the fungal cell wall for
killing fungi (Mani et al., 2012). The products of glucan hydrolysis were believed to
act as osmolytes plants use for osmotic adjustment and organelle membrane formation
(Dway and Smille, 1971; Satoh et al., 1976; Lee et al., 2003) but the direct evidence that
links endoglucanase catalytic property of osmotins to plant abiotic stress response is
still lacking. Functional predictions indicated that TlOsm contains more glucan-
binding residues than the two rice osmotins; and the osmotin from rice drought tolerant
cultivar also contains more glucan-binding residues than the osmotin from rice drought
sensitive cultivar (Table 3.2). Hence, this predicted feature may represent the
important clues insight the mechanism of these osmotins in plant stress response.
Calcium-signalling and MAPK cascades represent the core plant stress-signalling
pathways mainly regulated by CDPKs and MAPKs (Mohanta and Sinha, 2016; Zhu,
2016). The common features of CDPKs and MAPKs are the phosphorylation
activities. Some pathways involving CDPKs and MAPKs were found to regulate
crosstalk between abiotic and biotic stress and function in multiple stress responses of
plants (Mohanta and Sinha, 2016). Osmotin has been shown to interfere calcium
signalling for enhancing cold stress tolerance in olive tree (D'Angei and Altamura,
2007). It has been demonstrated that tobacco osmotin triggered an AMP kinase
pathway in yeast and mammalian cells (Narasimhan et al., 2005). These observations
suggested that the function of osmotin involving kinase activities. Predictions on
phosphorylation activities showed that both serine/threonine type and tyrosine type are
present in TlOsm and rice osmotins, OsOlp1_A and OsOlp1_I, but the number of
potential phosphorylation sites of both types in TlOsm is significantly higher (Table
3.2). Accumulation of small sugar molecules such as sucrose, trehalose, and raffinose
at remarkably high levels in vegetative tissues has been proven to be unique in
desiccation tolerant plants for effective cellular protection during dehydration (Alpert
and Oliver, 2002; Dinakar and Bartels, 2013; Gaff and Oliver, 2013). Such small sugar
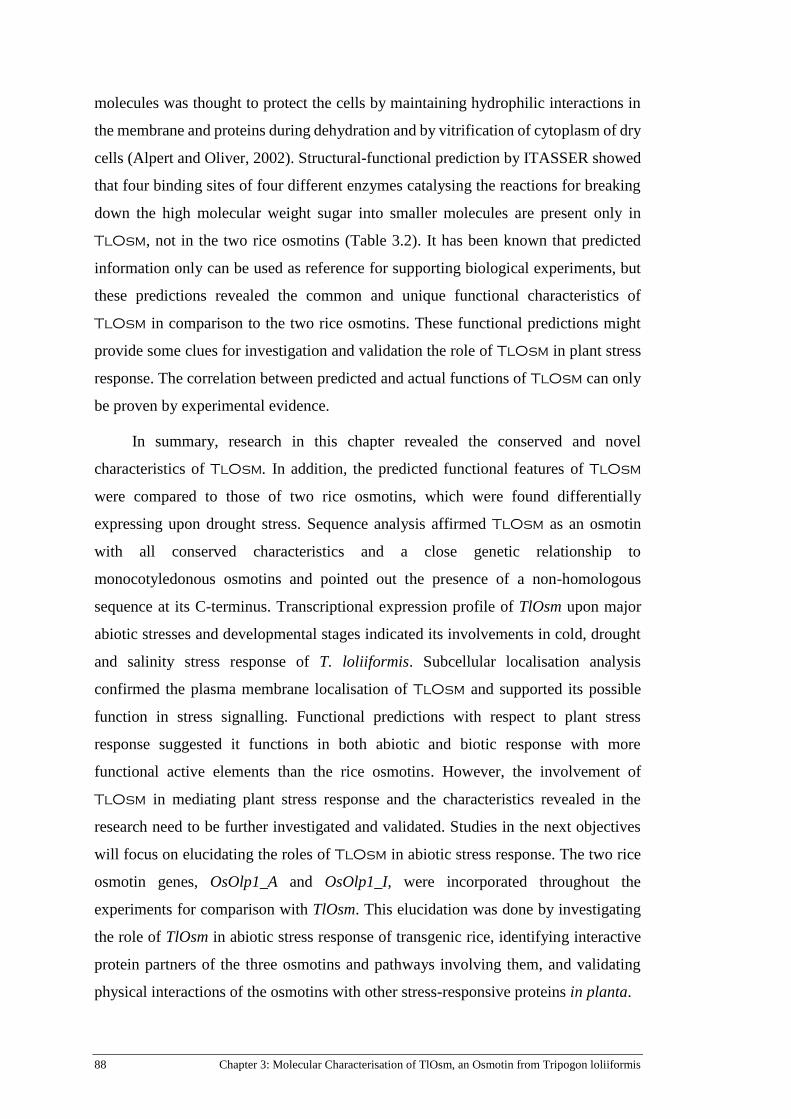
88 Chapter 3: Molecular Characterisation of TlOsm, an Osmotin from Tripogon loliiformis
molecules was thought to protect the cells by maintaining hydrophilic interactions in
the membrane and proteins during dehydration and by vitrification of cytoplasm of dry
cells (Alpert and Oliver, 2002). Structural-functional prediction by ITASSER showed
that four binding sites of four different enzymes catalysing the reactions for breaking
down the high molecular weight sugar into smaller molecules are present only in
TlOsm, not in the two rice osmotins (Table 3.2). It has been known that predicted
information only can be used as reference for supporting biological experiments, but
these predictions revealed the common and unique functional characteristics of
TlOsm in comparison to the two rice osmotins. These functional predictions might
provide some clues for investigation and validation the role of TlOsm in plant stress
response. The correlation between predicted and actual functions of TlOsm can only
be proven by experimental evidence.
In summary, research in this chapter revealed the conserved and novel
characteristics of TlOsm. In addition, the predicted functional features of TlOsm
were compared to those of two rice osmotins, which were found differentially
expressing upon drought stress. Sequence analysis affirmed TlOsm as an osmotin
with all conserved characteristics and a close genetic relationship to
monocotyledonous osmotins and pointed out the presence of a non-homologous
sequence at its C-terminus. Transcriptional expression profile of TlOsm upon major
abiotic stresses and developmental stages indicated its involvements in cold, drought
and salinity stress response of T. loliiformis. Subcellular localisation analysis
confirmed the plasma membrane localisation of TlOsm and supported its possible
function in stress signalling. Functional predictions with respect to plant stress
response suggested it functions in both abiotic and biotic response with more
functional active elements than the rice osmotins. However, the involvement of
TlOsm in mediating plant stress response and the characteristics revealed in the
research need to be further investigated and validated. Studies in the next objectives
will focus on elucidating the roles of TlOsm in abiotic stress response. The two rice
osmotin genes, OsOlp1_A and OsOlp1_I, were incorporated throughout the
experiments for comparison with TlOsm. This elucidation was done by investigating
the role of TlOsm in abiotic stress response of transgenic rice, identifying interactive
protein partners of the three osmotins and pathways involving them, and validating
physical interactions of the osmotins with other stress-responsive proteins in planta.

Chapter 4: Generation of Transgenic Rice Constitutively Expressing Oryza sativa and Tripogon loliiformis
Osmotins 89
Chapter 4: Generation of Transgenic Rice
Constitutively Expressing Oryza
sativa and Tripogon loliiformis
Osmotins
In the previous chapter, the conserved and novel characteristics of TlOsm were
described. Transcriptional expression analyses indicated the role of TlOsm in T.
loliiformis response to cold, drought, and salinity stresses. The subcellular localisation
analysis revealed that TlOsm is a plasma membrane protein. Functional prediction of
TlOsm compared with two rice osmotins provided some insights into their differential
active binding residues, which could be useful for understanding the functions and
stress response mechanisms of these osmotins. The suggested information and
predicted functions of these osmotins need to be elucidated in biological experiments.
Generation of transgenic plants is a critical step to study the functions of transgenes in
plant system. This chapter outlines the methods used to develop and characterise
transgenic rice plants expressing osmotin genes and a control gene. The outcome
transgenic plants from this chapter were used for experiments in Chapter 5.
4.1 INTRODUCTION
Rice is among the most important cereals with more than a half of the world
population reliant upon it as a staple crop. During the last few decades, abiotic stresses
such as drought, salinity, and extreme temperature have represented the most important
factors limiting rice production (Das et al., 2015; Mohanty et al., 2013; Tripathi et al.,
2012; Wani and Sah, 2014). Among cereals, rice is the most sensitive crop to drought,
salinity, and extreme temperature. For instance, rainfed rice cultivation which accounts
for 45% of global production has been substantially affected by drought (Wani and Sah,
2014). The 2002 drought in India affected 55% of country area and 300 million people,
reduced rice production by 20% inter-annual baseline trend (Pandey and Bhandari,
2007). Salinity is the second most prevalent abiotic stress limiting rice production with
approximately 30% of rice cultivation regions containing salt levels higher than
threshold for normal rice yield (Das et al., 2015; Singh et al., 2010; Wani and Sah, 2014).
The reduction of rice yield under salt-affected soil was estimated to be 68% (Naheed et
90 Chapter 4: Generation of Transgenic Rice Constitutively Expressing Oryza sativa and Tripogon loliiformis
Osmotins
al., 2007). Similarly, in temperate areas, rice production is severely declined by cold
stress (Zhang et al., 2014). Rice plants expose to cold stress during seedling stage display
poor establishment, delayed growth and ununiformed maturation (Kim et al., 2012); if
cold occurs during the reproductive stage, complete yield loss may occur (Powell et al.,
2012). Therefore, rice is an ideal plant for study toward understanding the effects of
abiotic stress tolerant traits.
Given its importance in global agriculture, countless attempts have been made to
improve abiotic stress tolerance in rice. Conventional rice breeders have screened
existing stress tolerant cultivars and made genetic alterations that have resulted in
commercial cultivars adapting to a wide range of environments of rice ecosystems
(Das et al., 2015; Sankar et al., 2011; Swamy and Kumar, 2013). The utilisation of
molecular marker-assisted breeding techniques has contributed to significant progress
in breeding programs, resulting in the generation of a number of current commercial
stress tolerance cultivars. For example, combination of major-effect QTL for grain
yield under drought into conventional breeding lines have generated drought tolerant
rice cultivars that gained an increase of 150-500 kg ha-1, account for 10-30% yield
advantage over parental genotypes (Swamy and Kumar, 2013). Similarly, the
mutagenesis-induced VTL5 cultivar was developed and recommended for commercial
cultivation in the coastal ecosystem of Kerala (Shylaraj and Sasidharan, 2005). The
low success of rice breeding for abiotic stress tolerance through crossing was mainly
due to (1) incompatibility between subspecies (Guo et al., 2016); (2) the low levels of
stress tolerant traits present in existing compatible species (Singh et al., 2008); (3) the
yield drag associated with conventional breeding (Peng et al., 2009; Sankar et al.,
2011); and (4) a lack of understanding of the complex genetics underlying stress
tolerance (Singh et al., 2008). Genetic engineering addresses many of the challenges
associated with the development of tolerant rice varieties by breeding and is now
considered an attractive option for developing abiotic stress tolerant rice. Genetic
engineering has been used to develop abiotic stress tolerant rice with promising results
at the glasshouse scale (Babu 2010; Das et al. 2015; Sankar et al. 2011; Singh et al.
2008; Swamy and Kumar 2013; Wani and Sah 2014). Hence, rice represents a suitable
crop plant for engineering stress-responsive traits. Besides improvement of agronomic
traits, transgenic plants have offered informative means for studying the functions and
regulations of biochemical, physiological, and developmental processes (Hansen and

Chapter 4: Generation of Transgenic Rice Constitutively Expressing Oryza sativa and Tripogon loliiformis
Osmotins 91
Wright, 1999; Ziemienovicz, 2014). Therefore, generation of transgenic rice
expressing stress-responsive genes is critical for gaining knowledge in the functions
and regulations of the transgenes affecting rice stress tolerance.
Several strategies have been suggested for the effective improvement rice with
enhanced abiotic stress tolerance via genetic engineering. These strategies include the
use of genes from stress tolerant species as well as the use of key regulators of multiple
stress tolerant trait (Das et al., 2015; Singh et al., 2008). It is believed that genes from
tolerant species would introduce additional tolerant effects that enable rice plants
withstand more extreme stress conditions. In addition, the key regulator would provide
rice more effective response to multiple stresses. In previous study, an osmotin gene
(TlOsm) from desiccation tolerant plant T. loliiformis was characterised and
demonstrated to have role in T. loliiformis response to multiple stresses including cold,
drought, and salinity stresses. A comparison on functional sites of TlOsm with those
of two rice osmotins suggested some potential differential functions in regulating
stress response among three osmotins. To understand the functions these osmotins and
to determine if more functional sites of TlOsm would bring advantage effects to
enhanced plant stress tolerance compared with osmotins from sensitive species, we
need to develop transgenic plants expressing the three osmotin genes.
The aim of this study was to develop transgenic rice plants constitutively
expressing the three osmotins and control gene for further experimental investigations.
With the availability of transformation protocols for rice, the specific objectives of this
study were set as follow:
1. Transform Nipponbare rice embryogenic calli with OsOlp1_A, OsOlp1_I,
TlOsm and UidA genes.
2. Generate for each gene about 10 independent transgenic rice lines.
3. Confirm the stable integration of transgenes in the rice genome and the
constitutive expression of the transgenes.
4.2 MATERIALS AND METHODS
4.2.1 Plasmid constructs and Agrobacterium strains
Plasmids pYC-OsOlp1_A, pYC-OsOlp1_A, pYC-TlOsm, and pYC-Ubi-Gus
(VC) constructed by the methods described in Section 2.2.1 were used for rice
transformation. Agrobacterium strain Agl1 was used for carrying these plasmids.

92 Chapter 4: Generation of Transgenic Rice Constitutively Expressing Oryza sativa and Tripogon loliiformis
Osmotins
Figure 4.1 presents the T-DNA of these plasmids. Briefly, the target osmotin genes
and GUS-reporter gene (UidA) are under driven of the Ubi promoter and the Nos
terminator, the selection marker is hygromycin resistant gene (hpt) regulated by the
CaMV 35S promoter and the Nos terminator.
Figure 4.1 Schematic diagram of gene expression cassettes for expressing osmotins and
GUS-reporter gene (control-VC) in O. sativa. LB: left border, RB: right border
4.2.2 Plant materials and culture media
Rice seeds of O. sativa L. spp Japonica cv. Nipponbare propagated and
maintained as described in Section 2.1.2.2 were used to induce embryogenic calli as
explants for Agrobacterium infection. Media for rice callus induction, transformation,
selection, and plant regeneration were the basic N6 medium (Appendix C) added with
growth hormones and other supplements depending on the stages of culture (described
when appropriate).
4.2.3 Rice callus induction, transformation, selection and regeneration
Rice embryogenic callus initiation, transformation and regeneration process
followed the protocol established by Khanna and Raina (1999) with some minor
modifications in regeneration step as in Sahoo et al. (2011).
4.2.3.1 Rice callus induction
Rice seeds were de-husked, washed 3 times in deionised water, sterilised in 70%
ethanol for 1 min followed by 4% sodium hypochlorite for 30 mins in a shaker.
Sterilised de-husked seeds were washed 3 times with autoclaved deionised water and
10 seeds were placed on each Petri plate containing callus induction medium (N6 basal

Chapter 4: Generation of Transgenic Rice Constitutively Expressing Oryza sativa and Tripogon loliiformis
Osmotins 93
salts and vitamins supplemented with 60 g L-1 sucrose, 0.3 mg L-1 casein hydrolysate,
0.5 mg L-1 proline, 2 mg L-1 2,4-D, 3 mg L-1 BAP, 0.5 mg L-1 NAA, pH 5.8 and 2.5 g
L-1 phytogel). The plates were placed in the dark at 27 oC for 2 weeks. Embryogenic
calli induced from scutellum of seeds were isolated and place on Petri plates containing
the same callus induction medium and culture conditions for 2 weeks. Then calli were
multiplied by frequently subcultured with 2-week intervals.
4.2.3.2 Transformation of rice
Four days before transformation, embryogenic calli were selected and
transferred onto the same callus induction medium except pH 5.5 with the same culture
conditions. These calli were used as target tissues for transformation. Agrobacterium
tumefaciens strain Agl1 separately carrying pYC-OsOlp1_A, pYC-OsOlp1_I, pYC-
TlOsm, and pYC-Ubi-GUS stored in glycerol was used for transformation. Four days
prior to transformation, Agrobacterium from glycerol stocks was grown in LB liquid
medium containing 50 mg L-1 of kanamycin and 25 mg L-1 of rifampicin in a shaking
incubator at 28 oC, 200 rpm for 40 h to get maximum density. Cultures were then
transferred to a large volume of growth medium and grown for a further 16 h. On the
day of transformation, Agrobacterium cultures were grown in medium containing 200
mM glucose and 200 µM acetosyringone to activate virulence of Agrobacterium. Rice
calli were heat shocked by placing in a water bath at 45 oC for 5 min then placing in a
fridge at 4 oC for 30 min. Heat-shocked calli were immersed in activated
Agrobacterium suspension, centrifuged for 10 min at 1000 rpm, then inoculated for 30
min in the hood, and decanted. The decanted calli were inoculated for 3 days at 25 oC
in Petri plates containing 30 mL of MS medium. Infected calli were washed 4 times
with liquid medium (N6 basal salts and vitamins containing 200mg L-1 timentin) by
submersing in liquid medium for 1h per each wash with shaking at 100 rpm, then
blotting on sterile towel paper. Ten clumps of washed calli were cultured on solid first
selection medium (callus induction medium containing 200 mg L-1 of timentin and 25
mg L-1 of hygromycin). Plates were placed in the dark at 27 oC for 2 weeks. A total of
4 batches of transformation was done in this study (2 batches in 4 week calli, 1 batch
in 6 week calli, and 1 batch in 8-week calli).
4.2.3.3 Selection and regeneration of putative transgenic rice plants
Transformed calli from the first selection medium were sequentially sub-
cultured for 3 times with 2-week intervals on second selection medium (the first

94 Chapter 4: Generation of Transgenic Rice Constitutively Expressing Oryza sativa and Tripogon loliiformis
Osmotins
induction medium but hygromycin increased to 50 mg L-1). Only calli strongly
proliferating on selection medium were selected for regeneration. Single clump of
selected calli was cultured on each plate containing 30 mL of first regeneration
medium (N6 basal salts and vitamins supplemented with 30 g L-1 sucrose, 0.1 mg L-1
casein hydrolysate, 0.5 mg L-1 proline, 2 mg L-1 kinetin, 3 mg L-1 BAP, 0.2 mg L-1
NAA, pH 5.8, 10 g L-1 agarose, 200 mg L-1 of timentin and 25 mg L-1 of hygromycin)
and cultured under the light at 25 oC for 3 weeks. Then, somatic embryos were transfer
onto plates containing 30 mL of second regeneration medium (N6 basal salts and
vitamins supplemented with 30 g L-1 sucrose, 0.1 mg L-1 casein hydrolysate, 0.5 mg
L-1 proline, 2 mg L-1 kinetin, 3 mg L-1 BAP, 0.1 mg L-1 NAA, pH 5.8, 10 g L-1 agar,
200 mg L-1 of timentin and 25 mg L-1 of hygromycin) and cultured under the light at
25 oC until shoot formation. Shoots were selected and rooted in 250-mL pots
containing 80 mL of rooting medium (half strength N6 basal salts and N6 vitamins
supplemented with 10 g L-1 sucrose, 0.1 mg L-1 casein hydrolysate, 0.5 mg L-1 proline,
2 mg L-1 kinetin, 1 mg L-1 BAP, 0.2 mg L-1 IAA, pH 5.8, 9 g L-1 agar, 200 mg L-1
timentin and 25 mg L-1 hygromycin). Plantlets from each plate were cultured in two
pots, one pot with the best plantlet for confirming the transgenic status, the other
containing the rest of regenerated plantlets as a back-up. Until the transgenic status
was confirmed by PCR, the confirmed transgenic plantlets were sub-cultured in 500-
mL pot containing 150 mL of rooting medium and samples were taken from these
plants for RT-PCR to confirm transcriptional expression of the transgenes. Then the
transgenic plants were in vitro multiplied in 500-mL pots containing 150 mL rooting
medium without growth hormone and hygromycin. A similar process was concurrently
used to generate wild-type (WT) plants. However, Agrobacterium was not included in
the inoculation medium for WT callus and hygromycin was excluded in selection,
regeneration, and rooting medium for WT.
4.2.4 Characterisation of transgenic rice plants
4.2.4.1 PCR analysis
To confirm the presence of transgenes in putative transgenic lines, PCR analyses
were performed using gene specific primers of the target genes, hygromycin resistant
gene specific primers, and virC gene primers (Table 4.1). Genomic DNA from
independent putative transgenic lines and wild-type control was extracted from 100
mg fresh rice leaf tissue using the DNeasy Plant Mini Kit. The plasmids used to
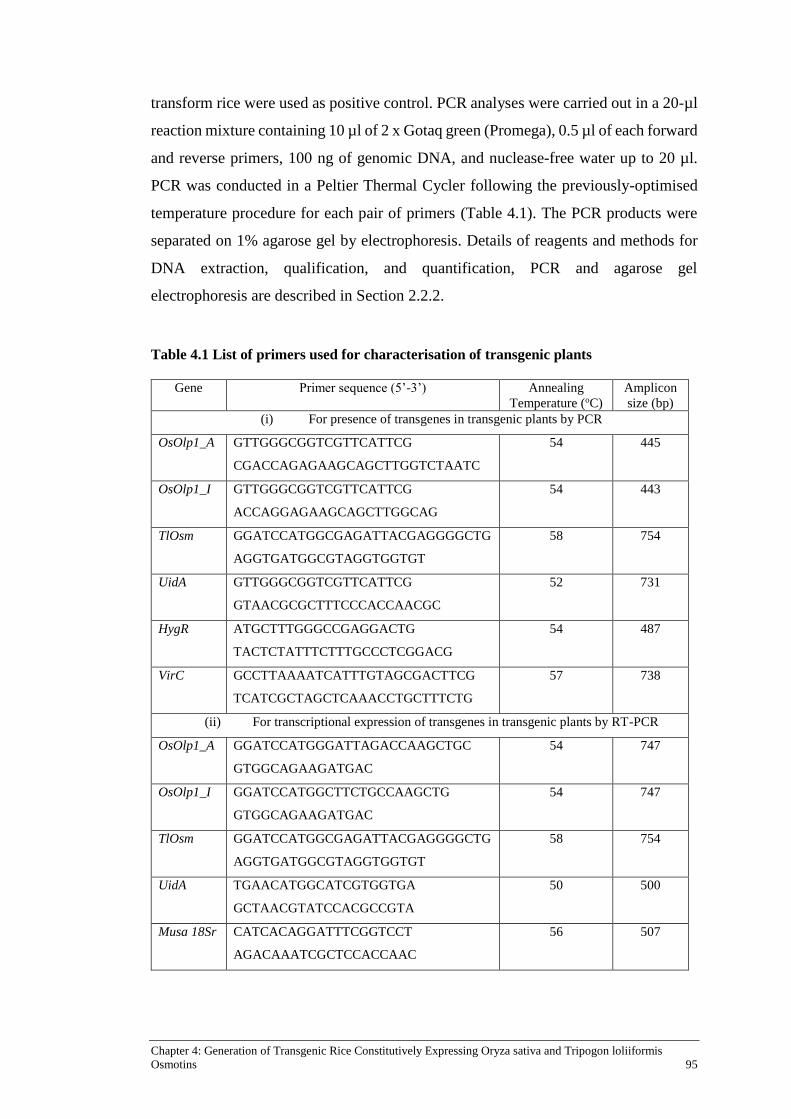
Chapter 4: Generation of Transgenic Rice Constitutively Expressing Oryza sativa and Tripogon loliiformis
Osmotins 95
transform rice were used as positive control. PCR analyses were carried out in a 20-µl
reaction mixture containing 10 µl of 2 x Gotaq green (Promega), 0.5 µl of each forward
and reverse primers, 100 ng of genomic DNA, and nuclease-free water up to 20 µl.
PCR was conducted in a Peltier Thermal Cycler following the previously-optimised
temperature procedure for each pair of primers (Table 4.1). The PCR products were
separated on 1% agarose gel by electrophoresis. Details of reagents and methods for
DNA extraction, qualification, and quantification, PCR and agarose gel
electrophoresis are described in Section 2.2.2.
Table 4.1 List of primers used for characterisation of transgenic plants
Gene Primer sequence (5’-3’) Annealing
Temperature (oC)
Amplicon
size (bp)
(i) For presence of transgenes in transgenic plants by PCR
OsOlp1_A GTTGGGCGGTCGTTCATTCG
CGACCAGAGAAGCAGCTTGGTCTAATC
54 445
OsOlp1_I GTTGGGCGGTCGTTCATTCG
ACCAGGAGAAGCAGCTTGGCAG
54 443
TlOsm GGATCCATGGCGAGATTACGAGGGGCTG
AGGTGATGGCGTAGGTGGTGT
58 754
UidA GTTGGGCGGTCGTTCATTCG
GTAACGCGCTTTCCCACCAACGC
52 731
HygR ATGCTTTGGGCCGAGGACTG
TACTCTATTTCTTTGCCCTCGGACG
54 487
VirC GCCTTAAAATCATTTGTAGCGACTTCG
TCATCGCTAGCTCAAACCTGCTTTCTG
57 738
(ii) For transcriptional expression of transgenes in transgenic plants by RT-PCR
OsOlp1_A GGATCCATGGGATTAGACCAAGCTGC
GTGGCAGAAGATGAC
54 747
OsOlp1_I GGATCCATGGCTTCTGCCAAGCTG
GTGGCAGAAGATGAC
54 747
TlOsm GGATCCATGGCGAGATTACGAGGGGCTG
AGGTGATGGCGTAGGTGGTGT
58 754
UidA TGAACATGGCATCGTGGTGA
GCTAACGTATCCACGCCGTA
50 500
Musa 18Sr CATCACAGGATTTCGGTCCT
AGACAAATCGCTCCACCAAC
56 507
96 Chapter 4: Generation of Transgenic Rice Constitutively Expressing Oryza sativa and Tripogon loliiformis
Osmotins
4.2.4.2 RT-PCR analysis
RT-PCR analysis was performed to confirm the transcriptional expression of
transgenes in transgenic rice lines. Total RNA was isolated from 100 mg leaves of
each transgenic rice line or WT using the RNeasy Plant Mini Kit following
manufacturer’s protocol. Genomic DNA in the total RNA samples was eliminated by
using the RQ1-RNase_Free DNase as per manufacturer’s protocol. The complete
elimination of genomic DNA in the RNA samples was confirmed by PCR reactions
with Musa 18Sr housekeeping gene primers (Table 4.1) and RNA samples as
templates. cDNA was synthesized from total RNA using the SuperScriptTM III First-
strand synthesis system for RT-PCR according to the manufacturer’s instruction. The
cDNA samples of transgenic and 2 WT plants were confirmed by PCR reactions with
the Musa 18Sr primers. The partial sequences of the transgenes were amplified from
corresponding cDNA samples using gene specific primers, Platinum® Taq DNA
Polymerase high fidelity kits (Invitrogen) and previously-optimised temperature
procedure. The RT-PCR products were separated on 1% agarose gel by
electrophoresis. Details of reagents and methods for RNA extraction, qualification,
and quantification, RT-PCR reactions and agarose gel electrophoresis are described in
Section 2.2.2.
4.2.4.3 Histochemical GUS assay
Histochemical GUS assays were performed on rice calli and plants transformed
with plasmid control, the pYC-Ubi-GUS. Transformed calli after 9-week selection
were immersed in a GUS staining solution containing 100 mM phosphate buffer (pH
7.0), 10 mM EDTA, 1mM potassium ferriccyanide, 0.1% Triton X-100, and 2 mM 5-
bromo-4chloro-3-indolyl-β-D-glucuronide. The calli in the GUS staining solution
were then vacuum infiltrated for 10 min and incubated overnight at 37 oC. The staining
solution was removed and calli were washed and reimmersed in 75% ethanol. Calli
were viewed with a Zeiss Steri-2000-C stereomicroscope and images were acquired
with a Digital microscope camera Progress®C5 (Jenoptic, Germany). The same GUS
stain protocol was applied for transgenic T0 plants and images were captured by a
Canon camera.

Chapter 4: Generation of Transgenic Rice Constitutively Expressing Oryza sativa and Tripogon loliiformis
Osmotins 97
4.3 RESULTS
4.3.1 Callus induction, transformation, selection and regeneration of putative
transgenic rice plants
Genetic engineering has become a great avenue to modify crops with desired
traits and to provide solutions to gain an understanding of the functions and regulations
of foreign genes in plants. The combination of genetic engineering and conventional
breeding has made it possible to incorporate the important traits encoded by exogenous
genes into commercial crop cultivars, which has overcome the existing species barrier
faced by conventional breeding. Moreover, transgenic plants have provided
informative means for understanding the functions and regulations of biochemical,
physiological, and developmental processes modulated by a foreign gene (Hansen and
Wright, 1999; Ziemienovicz, 2014). Therefore, generation of transgenic rice plants
expressing the target osmotins is critical for gaining knowledge in the functions and
mechanisms of the three osmotins in regulating abiotic stress response of rice.
Among the methods developed for genetic engineering, Agrobacterium-
mediated transformation has been considered as a method of choice thanks to its ability
to transfer a defined DNA fragment (T-DNA) into plant genome; and low copy number
of T-DNA integrated in plant chromosomes (Gelvin, 2003; Tzfira and Citovsky, 2006).
The plant transformation would not have achieved such progress without the success
in plant tissue culture, in which plants can regenerate from various types of initial
explants. Somatic embryogenesis has been shown to be a preferred method for
developing transgenic plants because plants regenerated from single cell origin that
can eliminate problems associated with chimeras (Deo et al., 2010). Embryogenic calli
induced from scutellum of mature seeds were reported to be the best explants of rice
transformation due to the high transformation efficiency and the availability of initial
explants (Hiei and Komari, 2008).
In this study, the transgenic rice expressing three osmotins and a GUS-reporter
gene were generated by transformation of calli produced from mature seeds of the rice
Nipponbare cultivar using Agrobacterium carrying each of the plasmid described in
Section 4.2.3. Generally, explants underwent the process as described in Figure 4.2.

98 Chapter 4: Generation of Transgenic Rice Constitutively Expressing Oryza sativa and Tripogon loliiformis
Osmotins
Figure 4.2 Procedure of rice callus induction, transformation, selection, and plant
regeneration. A: calli induced from scutellum of mature seeds after 2 weeks in callus
induction medium, B: calli at the stage used as explants for transformation, C: representative
one plate of transformed calli entered first step of selection, D: transformed callus proliferation
after 4 steps of selection, E: transformed somatic embryos germination in selection medium;
F: putative transgenic plants regenerated after 7 steps of selection; arrows indicate selected
calli and plants.
Chapter 4: Generation of Transgenic Rice Constitutively Expressing Oryza sativa and Tripogon loliiformis
Osmotins 99
Primarily, the transformation experiment was designed to transform calli at 4, 6, and
8 weeks in order to determine if any effect of callus age on transformation efficiency and
plant regeneration capacity. Three batches of transformation on calli induced from 3,000
seeds and 1000 callus clumps per each batch underwent 4-5 cycles of selection. However,
temperature fluctuation in the tissue culture lab due to the laboratory refurbishment led to
heating the culture room that damaged all the embryos and the plantlets from 1-5 weeks
in regeneration medium (the same stage in Figure 4.2 D & F). Therefore the forth batches
of transformation was carried out on 4-week-old calli. A total of 43 independent lines were
regenerated from calli transformed with 4 plasmid constructs.
4.3.2 Confirmation of transgenes in putative transgenic rice lines
To confirm the transgenes stably integrated into genome of regenerated plants,
genomic DNA was extracted from leaves of each independent line transformed with
different constructs and WT plants. These DNA samples were used as templates for
PCR. Both selectable marker hygromycin resistant, hpt, and gene-specific primers
were used for PCR. In addition, the VirC primers (Table 4.1) were also used for PCR
to detect the Agrobacterium residual in order to eliminate the possibility of false
positive PCR. The PCR products followed by agarose electrophoresis are presented in
Figure 4.3.
All 43 independent lines had the presence of hpt gene because of the presence of
the expected 487 bp amplicon when using hpt gene primers in PCR mixtures (Figure 4.3
A, C, E & G). However, one of the 12 lines transformed with pYC-OsOlp1-A did not
have the band in agarose gel running PCR product of OsOlp1-A specific primers (Figure
4.3 B). In this particular line, three leaf samples were taken at different times for DNA
extractions and PCR reactions, the same results appeared that confirmed the absence of
OsOlp1-A gene in this line. All 10 lines transformed with pYC-OsOlp1-I (Figure 4.2 D),
9 lines with pYC-TlOsm (Figure 4.2 F), and 12 lines with pYC-Ubi-Gus (Figure 4.2 H)
construct had the presence of expected bands in PCR products using gene specific
primes. Each of 43 lines was checked for the presence of Agrobacterium residual by
using VirC gene primers. The results showed that none of the lines had the presence of
Agrobacterium, suggesting that these bands were the hpt gene and other target genes
stably integrated in the genome of these rice lines. The results also showed that 42 of 43
regenerated lines had both hpt gene and target gene insertions.

100 Chapter 4: Generation of Transgenic Rice Constitutively Expressing Oryza sativa and Tripogon loliiformis
Osmotins
Figure 4.3 Characterisation of putative transgenic rice lines by PCR. A: PCR products of
putative OsOlp1_A plants with hpt primers and B: with gene specific primers, C: PCR products
of putative OsOlp1_I plants with hpt primers and D: with gene specific primers, E: PCR
products of putative TlOsm plants with hpt primers and F: with gene specific primers, G: PCR
products of putative GUS plants with hpt primers and H: with gene specific primers, I-L: PCR
products of putative OsOlp1_A, OsOlp1_I, TlOsm, and GUS plants with VirC gene primers.
M: molecular DNA ladder, P: positive control, N: negative control, WT: wild type, Kb: kilo
base pair, numbers above each gel indicate the line ID.

Chapter 4: Generation of Transgenic Rice Constitutively Expressing Oryza sativa and Tripogon loliiformis
Osmotins 101
4.3.3 Expression of transgenes in transgenic rice plants confirmed by RT-PCR
To confirm the transcriptional expression of the target transgenes in transgenic
rice, RT-PCR was used. Forty-four RNA samples were extracted from leaves of 42
transgenic rice lines and 2 WT plants. RQ1-DNase was used to eliminate the DNA
contaminated in these RNA samples. Then, PCR with house-keeping gene Musa 18Sr
primers was performed to confirm if the genomic DNA was completely removed from
RNA samples. Results showed that none of the PCR products from these 44 RNA
samples had the presence of 507 bp amplicon, suggesting that these RNA samples
were DNA free (Figure 4.4 I-L).
cDNAs were then reverse transcribed from these RNA samples. PCR with
house-keeping gene Musa 18Sr primers was again used to confirm if the cDNAs were
successfully transcribed from each of RNA samples. The presence of a bright 507 bp
band in all cDNA samples from 42 transgenic rice lines and 2 WT plants indicated the
presence of cDNA in all the samples (Figure. 4.4 B, D, F & H).
PCR with gene specific primers and cDNA samples of 42 transgenic rice lines
and the control were performed by pre-determined annealing temperature for specific
pair of primers. Results showed that 11 OsOlp1_A lines (Figure 4.4 A), 10 OsOlp1_I
lines (Figure 4.4C ), 9 TlOsm lines (Figure 4.4 E), and 12 UidA (GUS) lines (Figure
4.4 G) had the expected bands, which were the same sizes with corresponding control
but absence in the WT and negative control samples. The intensity of RT-PCR
products found varying among lines transformed with the same gene suggested that
there may be some different levels of transgene expression among the lines. These
results indicated that the target transgenes expressed at transcriptional level in all 42
transgenic rice lines.

102 Chapter 4: Generation of Transgenic Rice Constitutively Expressing Oryza sativa and Tripogon loliiformis
Osmotins
Figure 4.4 Transcriptional expression of transgenes in transgenic rice by RT-PCR. A:
RT-PCR products of OsOlp1_A plants with gene specific primers and B: with Musa 18Sr
primers, C: RT-PCR products of OsOlp1_I plants with gene specific primers and D: with Musa
18Sr primers, E: RT-PCR products of TlOsm plants with gene specific primers and F: with
Musa 18Sr primers, G: RT-PCR products of GUS plants with gene specific primers and H:
with Musa 18Sr primers, I-L: PCR products of the RQ1-DNase treated RNA samples from
OsOlp1_A, OsOlp1_I, TlOsm, and GUS plants with Musa 18Sr primers. M: molecular DNA
ladder, P: positive control, N: negative control, WT: wild type, Kb: kilo base pair, numbers
above each gel indicate the line ID.

Chapter 4: Generation of Transgenic Rice Constitutively Expressing Oryza sativa and Tripogon loliiformis
Osmotins 103
4.3.4 Expression of GUS protein confirmed in GUS-expressing rice lines.
In order to investigate if GUS-reporter gene expresses at protein level in these
transgenic rice plants and how the transgene expresses under the regulation of the Ubi
promoter, a histochemical GUS assay was conducted on all lines of selective calli after
9 weeks of selection in hygromycin-containing media and regenerated plants. Results
showed that GUS expression and activity indicated as blue colour was observed in the
entire callus clumps of all lines proliferated after 9 weeks in selective media, while no
blue colour observed in the control (Figure 4.5 A). In the plants, a strong GUS activity
was detected in all parts of tissues throughout 12 independent transgenic lines at 2
different stages of regeneration but not in the WT control (Figure 4.5 B). Since the
GUS gene in pYC-Ubi-Gus had an intron, this expression should not be interfered by
Agrobacterium residues that may be attached in rice tissues. GUS-staining results
confirmed that GUS gene was constitutively regulated by the Ubi promoter that led to
GUS expression at different stages and in all the cell types. Thus, OsOlp1_A,
OsOlp1_I, and TlOsm should be regulated in the same manner.

104 Chapter 4: Generation of Transgenic Rice Constitutively Expressing Oryza sativa and Tripogon loliiformis
Osmotins
Figure 4.5 GUS expression in transgenic rice calli and plants. A: GUS expression of
representative transgenic rice calli after 9 weeks of transformation and selection in 50 mg L-1
hygromycin – containing media, B: GUS expression of transgenic rice plants; upper row shows
plants at 4 weeks regenerated from somatic embryos and lower row shows plants at 8 weeks
regenerated from somatic embryos, WT: wild type, numbers indicate the ID of independent
transgenic lines.
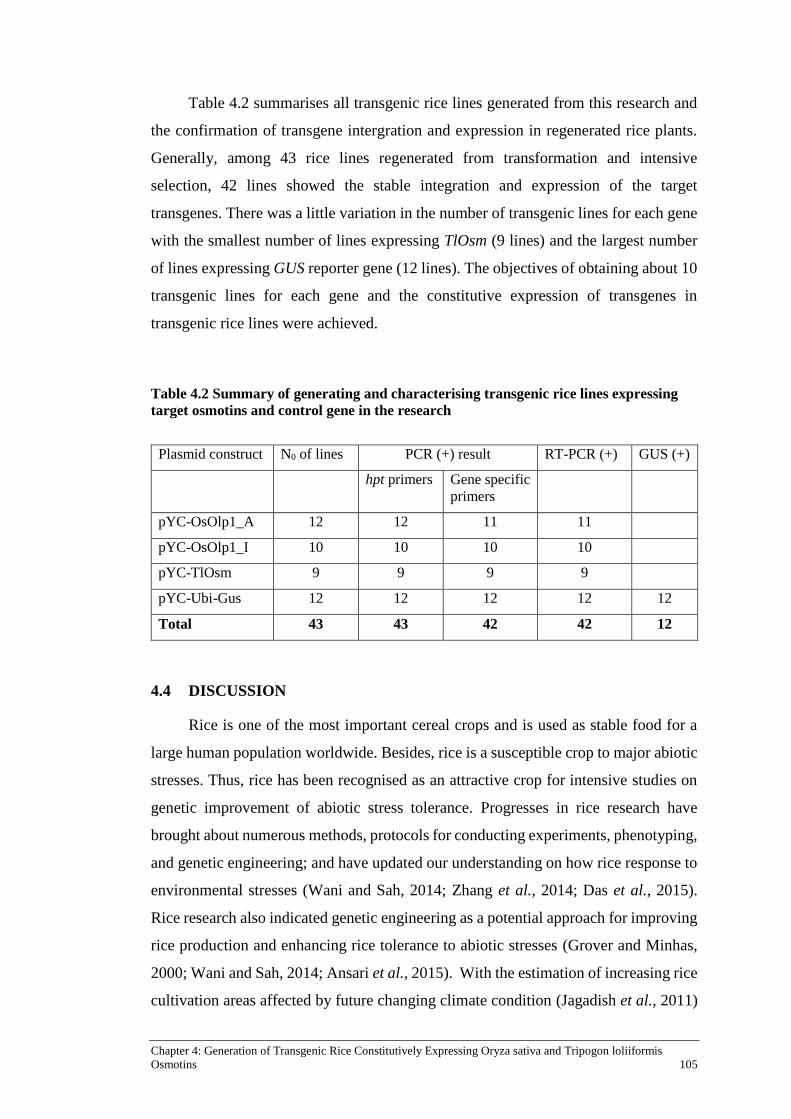
Chapter 4: Generation of Transgenic Rice Constitutively Expressing Oryza sativa and Tripogon loliiformis
Osmotins 105
Table 4.2 summarises all transgenic rice lines generated from this research and
the confirmation of transgene intergration and expression in regenerated rice plants.
Generally, among 43 rice lines regenerated from transformation and intensive
selection, 42 lines showed the stable integration and expression of the target
transgenes. There was a little variation in the number of transgenic lines for each gene
with the smallest number of lines expressing TlOsm (9 lines) and the largest number
of lines expressing GUS reporter gene (12 lines). The objectives of obtaining about 10
transgenic lines for each gene and the constitutive expression of transgenes in
transgenic rice lines were achieved.
Table 4.2 Summary of generating and characterising transgenic rice lines expressing
target osmotins and control gene in the research
Plasmid construct N0 of lines PCR (+) result RT-PCR (+) GUS (+)
hpt primers Gene specific
primers
pYC-OsOlp1_A 12 12 11 11
pYC-OsOlp1_I 10 10 10 10
pYC-TlOsm 9 9 9 9
pYC-Ubi-Gus 12 12 12 12 12
Total 43 43 42 42 12
4.4 DISCUSSION
Rice is one of the most important cereal crops and is used as stable food for a
large human population worldwide. Besides, rice is a susceptible crop to major abiotic
stresses. Thus, rice has been recognised as an attractive crop for intensive studies on
genetic improvement of abiotic stress tolerance. Progresses in rice research have
brought about numerous methods, protocols for conducting experiments, phenotyping,
and genetic engineering; and have updated our understanding on how rice response to
environmental stresses (Wani and Sah, 2014; Zhang et al., 2014; Das et al., 2015).
Rice research also indicated genetic engineering as a potential approach for improving
rice production and enhancing rice tolerance to abiotic stresses (Grover and Minhas,
2000; Wani and Sah, 2014; Ansari et al., 2015). With the estimation of increasing rice
cultivation areas affected by future changing climate condition (Jagadish et al., 2011)

106 Chapter 4: Generation of Transgenic Rice Constitutively Expressing Oryza sativa and Tripogon loliiformis
Osmotins
and the needs to increase 60% rice production to fulfil the demand of increasing
world’s population by 2020 (Grover and Minhas, 2000), the key factors for sustainably
increasing rice grain yield production while minimising effects by environmental
stresses needed to be addressed. Hence, rice appears to be an appropriate target crops
for expressing and validating the functions of stress-responsive genes in crop plants.
In addition, an effective transformation and plant regeneration process plays a key role
in the success of functional studies of foreign genes in rice plants.
Agrobacterium-mediated transformation is now a dominant method for plant
genetic engineering. However, the efficiency of a transformation protocol depends on
many factors such as virulence of Agrobacterium strain, types of initial plant tissues,
regeneration capability of target plants, and strength of selectable marker (Tzfira and
Citovsky, 2006). Rice has been a favourite cereal crop for genetic studies and protocol
for Agrobacterium-mediated transformation has been established and routinely used
in many laboratories worldwide. Somatic embryogenic callus is a preferred starting
tissues for rice transformation. However, regeneration of transformed calli has been
identified as a major obstacle for rice transformation (Sahoo et al., 2011). Moreover,
initiation of rice embryogenic calli for transformation is a time-consuming and tedious
process. In this study, beside the purpose of obtaining transgenic rice plants for
evaluating abiotic stress tolerance, we attempted to investigate the effects of callus
stages for transformation on plant regeneration efficiency in order to recommend the
best callus stage as target tissues for transformation. However, this objective failed to
achieve due to heating in culture room during embryo germination, which is the most
sensitive stage to heat, led to most of 300 putative transgenic lines damaged.
Nevertheless, 43 independent lines were regenerated (Table 4.2). Hygromycin
selection was reported to be very efficient for the selection of transformed rice with
the concentration ranged from 20-50 mg L-1 (Zuraida et al., 2013). In this study,
transformed calli were first selected in the medium containing 25 mg L-1 of
hygromycin, followed by three cycles of selection in 50 mg L-1 of hygromycin; then
embryo germination, shooting, and rooting were selected in the medium containing 25
mg L-1 of hygromycin. This selection process resulted in 100% regenerated plants had
the hpt gene integration (Figure 4.1) and expression and evidenced by the survival of
transgenic plants in the selection media. The results confirm the effectiveness of
hygromycin selection marker in rice transformation. Among 43 regenerated lines, one

Chapter 4: Generation of Transgenic Rice Constitutively Expressing Oryza sativa and Tripogon loliiformis
Osmotins 107
line transformed with pYC-OsOlp1_A did not show the presence of the target
OsOlp1_A, despite the hygromycin selection marker was detected. Agrobacterium has
been used as a method of choice for genetic transformation due to its ability to transfer
a well-defined T-DNA fragment (Tzfira and Citovsky, 2006); but in this case it was
not known why the T-DNA fragment was truncated. The purpose of this study was to
obtain enough transgenic rice lines expressing the target transgenes for further
experiments on gene functions. Thus the mechanism by which T-DNA truncated was
beyond the objectives of this study and did not get attention.
The choice of an appropriate promoter for driving the target transgenes is
another factor needed to be considered in generating transgenic plants. The purpose of
this study was to generate transgenic rice plants constitutively expressing the genes of
interest and the Zea maize Ubi (ZmUbi or Ubi) promoter was chosen for directing the
TlOsm, OsOlp1_A, OsOlp1_I, and UidA. The Ubi promoter was reported to regulate
the high levels of constitutive gene expression in rice and other cereal crops (Cornejo
et al., 1993; Rooke et al., 2000). This promoter was shown to be active in many cell
types and direct the strongest expression in dividing tissues such as young roots and
leaves of transgenic rice (Cornejo et al., 1993). Hence, this promoter has been widely
used in genetic transformation of monocots. In our study, all 42 transgenic rice lines
expressing target genes under the control of Ubi promoter showed the expression of
transgenes at transcriptional level (Figure 4.4). Furthermore, the results from the
histochemical GUS assay conducted on all lines of selective calli and regenerated
plants demonstrated the constitutive expression of GUS-reporter gene in the selected
rice lines. The presence of GUS protein and its activity indicated as blue colour were
observed in entire callus clumps, while no blue colour observed in the control (Figure
4.5 A) proved the uniform expression of GUS in the callus clumps. In the plants, a
strong GUS activity was detected all parts of tissues throughout 12 independent
transgenic lines at either 4 or 8 weeks after regeneration but not in the WT control
plants, indicating the presence and activity of GUS in all the plant parts at both stages
of regenerated plants (Figure 4.5 B). Since an intron was included in the GUS-reporter
gene in the pYC-Ubi-Gus plasmid, the presence of GUS should only be the results of
GUS expression in rice plants, not of Agrobacterium residues that may be attached in
rice tissues. GUS-staining results confirmed that the Ubi promoter used for regulating

108 Chapter 4: Generation of Transgenic Rice Constitutively Expressing Oryza sativa and Tripogon loliiformis
Osmotins
the genes in this study is a constitutive promoter that expresses at different stages and
all the cell types.
Conclusion: using the established agrobacterium-mediated rice transformation
system, total of 42 transgenic rice lines constitutively expressing either OsOlp1_A,
OsOlp1_I, TlOsm, or GUS-reporter gene were generated. These transgenic rice lines
together with WT will be tested for cold, drought, and salinity stress tolerance in
Chapter 5.
Chapter 5: Comparative Analysis of Transgenic Rice Constitutively Expressing Osmotins from Tolerant and
Sensitive Species 109
Chapter 5: Comparative Analysis of
Transgenic Rice Constitutively
Expressing Osmotins from
Tolerant and Sensitive Species
Results from Chapter 3 suggested the involvement of TlOsm in Tripogon
loliiformis responses to cold, drought and salinity stresses and identified possible
functional differences among TlOsm, OsOlp1_A, and OsOlp1_I. Analysis of
these differences might provide useful information for understanding the functions of
osmotins in plant stress response. In Chapter 4, 42 transgenic rice lines constitutively
expressing TlOsm, OsOlp1_A, OsOlp1_I, and the Gus-reporter gene as vector control
(VC) were generated together with wild type (WT) control plants. This chapter details
the assessment of the transgenic plants expressing TlOsm, OsOlp1_A, and OsOlp1_I
for enhanced tolerance to cold, drought and salinity stresses.
5.1 INTRODUCTION
Previous studies have proposed additional advantages of using genes from stress
tolerant species for engineering crops with enhanced abiotic stress tolerance (Mittler and
Blumwald, 2010; Cominelli et al., 2013). It is believed that such genes would bring to
engineered crops additional resilience not observed in parental crops. Thus, naturally
tolerant species have great potential for seeking stress-responsive genes for use in
improving abiotic stress tolerance in crops. Among stress tolerant species, the
Australian-native resurrection grass, T. loliiformis, has great potential as a genetic
resource for the identification of stress tolerant genes. T. loliiformis is capable of
withstanding desiccation of its vegetative tissues which regain for metabolic function
within 24 - 72 h of watering (Karbaschi et al., 2016; Williams et al., 2015). In Chapter
3, an osmotin from T. loliiformis (TlOsm) was identified and demonstrated to play role
in T. loliiformis response to salinity, drought, and cold stresses. Comparision of TlOsm
amino acid (AA) sequence and predicted structure with those of two osmotins from
stress sensitive species, O. sativa, revealed some possible differences in their functions

110 Chapter 5: Comparative Analysis of Transgenic Rice Constitutively Expressing Osmotins from Tolerant and
Sensitive Species
(Table 3.2). Two rice osmotins, OsOlp1_A and OsOlp1_I were identified from rice
drought tolerant and drought sensitive cultivar, respectively. However, only OsOlp1_A
was induced by drought. Comparative analysis of the three protein sequences and
structures indicated differences in number of the potential glucan-binding and
phosphorylation sites. TlOsm encoded the highest number of both potential glucan-
binding sites (8) and phosphorylation sites (64). OsOlp1_A contained five glucan-
binding sites while OsOlp1_I encoded two. OsOlp1_A and OsOlp1_I encode the same
number of phosphorylation sites (15) but one Ser site in OsOlp1_A is replaced by the
Thr site in OsOlp1_I. In addition, TlOsm has four binding sites of four enzymes
including isoamylase, cellulase, chondroitin AC lyase and beta-fructofuranosidase that
function in breaking high molecular-weight into lower molecular-weight sugars (Table
3.2). The differences in the predicted protein structures of the three osmotins suggest
differences in their functions. Here, we hypothesized that proteins with more functional
sites would have more functional activities.
Typically osmotins and other PR5 protein structures contain three domains with
glucan-binding sites and an acidic cleft (Min et al., 2004). Previous studies have
suggested that glucan-binding sites surrounding the acid cleft are essential for the
antifungal activities of osmotins (Liu et al., 2010; Mani et al., 2012; Min et al., 2004;
Viktorova et al., 2012). How glucan-binding sites contribute to the capacity of
osmotins to regulate plant tolerance to abiotic stress however remains to be elucidated.
Tobacco osmotin has been demonstrated to activate an AMPK cascade in yeast and
mammalian cells (Narasimhan et al., 2001; Narasimhan et al., 2005). In transgenic
plants, osmotin functions are linked to MAP kinase activities (Viktorova et al., 2012).
The main function of most protein kinases is phosphorylation. These suggest that
phosphorylation activities might contribute to osmotin functions. Rohrig et al. (2006)
investigated the involvement of phosphorylation during acquisition of desiccation
tolerance in resurrection plant C. plantagineum. They showed that at least two LEA
proteins CDeT11-24 and CDeT6-19 were transiently phosphorylated during
dehydration. Dinakar and Bartels (2013) proposed that the increased phosphorylation
activities of these stress-responsive proteins might increase the hydrophilic residues
necessary for interaction with macromolecules, which is required for cellular
protection during desiccation tolerance. In addition, soluble sugar metabolism and
accumulation during desiccation tolerance have been found distinct features of

Chapter 5: Comparative Analysis of Transgenic Rice Constitutively Expressing Osmotins from Tolerant and
Sensitive Species 111
resurrection plants for protection of their vegetative tissues from damage. Four
functional sites for sugar metabolism were found in the predicted structure of TlOsm,
but none of them was found in two rice osmotins. To understand the effects of the
three osmotins on enhancing plant abiotic stress tolerance, in relation to their predicted
functional binding sites, we developed transgenic plants independently expressing the
three osmotins and assessed them for enhanced abiotic stress tolerance.
To gain an understanding insights into the functions of these osmotins in
improved rice tolerance to abiotic stress, the physiological and morphological
responses of transgenic rice expressing TlOsm, OsOlp1_A, and OsOlp1_I need to be
investigated. Moreover, comparative analysis of transgenic rice expressing TlOsm,
OsOlp1_A, and OsOlp1_I might reveal any superior role of osmotin from highly
tolerance species over those from rice. In this chapter, the response of transgenic rice
constitutively expressing TlOsm, OsOlp1_A, OsOlp1_I, and the Gus-reporter gene
were comparatively analysed under unstressed, cold, drought, and salinity stresses.
The comparisons were made on T0 generation with stress treatments at seedling stage
and on T1 generation with stress treatments at reproductive stage.
The objectives of this study were set as follows:
1. Investigation of physiological response of the T0 and T1 transgenic rice plants
exposure to cold, drought and salinity stresses at seedling and reproductive
stages.
2. Investigation of morphological response of the T0 and T1 transgenic rice plants
exposure to cold, drought and salinity stresses at seedling and reproductive
stages.
3. Comparison of the effects of TlOsm, OsOlp1_A, and OsOlp1_I on enhancing
rice tolerance to cold, drought, and salinity stresses.
5.2 MATERIALS AND METHODS
5.2.1 Plant materials
Nine transgenic lines for each gene construct and the WT were included for
evaluation of cold, drought, and salinity stress tolerance at the seedling stage. T0 plants
were multiplied and maintained in tissue culture for assessment at seedling stage.
Seeds from T0 plants were harvested from plants grown in controlled glasshouse
conditions. T1 plants germinated from seed pools of all available lines were used for

112 Chapter 5: Comparative Analysis of Transgenic Rice Constitutively Expressing Osmotins from Tolerant and
Sensitive Species
reproductive stage evaluation and the segregated non-transgenic (NT) plants were used
as control.
5.2.2 Acclimatisation of tissue-cultured rice plants
Tissue cultured rice plants were acclimatised using 50-mL plastic pots and
premium potting mix (Searles, Sunshine coast, Qld, Australia) following the protocol
described by Hoang et al. (2014). Plants containing one tiller were transplanted into
pots containing potting mix moistened with tap water. Pots were placed in a container
filled with tap water to one-third the height of the pots and the container was covered
with clear plastic foil and placed in a growth room at 24 oC, day/night cycle of 12 h/12
h, light intensity of 800 ± 100 µmol m-2 s-1, and relative humidity at 65%. Plants were
sprayed with water twice a day for seven days and then the plastic foil was removed.
Plants were grown for another seven days with water added into the container to cover
the height of the pots. After that, Aquasol fertiliser (Yates, Pastow, NSW, Australia)
containing nitrogen, phosphorus, potassium and trace elements (N: P: K: 23: 3.95: 14)
was added to the water in the container to the concentration of 0.5 g L-1 and plants
were grown for another seven days.
5.2.3 Growth conditions and stress treatments at seedling stage
Cold, drought and salinity stresses were applied to 3-week post acclimatised
plants when three fully expanded leaves had developed and the forth leaf had just
emerged. For salinity stress, water in the container was drained out and 100 mM NaCl
solution was poured in until the surface of salt solution was 1 cm above the potting
mix level. The water level was maintained at this level by adding tap water daily into
the container. After three weeks in 100 mM NaCl solution, plants were recovered by
removing the salt solution from the container, washing off salt in the potting mix by
submerging in water and draining five times. Tap water was added to the containers
containing washed pots to the level of 1 cm above the potting mix level. For drought
stress, the pots containing plants in water containers were drained off (potting mix
saturated with water) and transferred to empty containers. Water was not added to
these plants for three weeks. After stress, plants were recovered by adding tap water
to the containers at a height of 1 cm above the potting mix. The survival rate was
calculated three weeks after recovery for both experiments. In the unstressed
experiment, water was maintained daily in the same level of 1 cm above the potting
mix level during the course of experiment. Plants were grown in growth chambers

Chapter 5: Comparative Analysis of Transgenic Rice Constitutively Expressing Osmotins from Tolerant and
Sensitive Species 113
(Thermoline, Japan) at 27 oC, day/night cycle of 12 h/12 h, light intensity of 800 ± 100
µmol m-2 s-1 and humidity at 65%. For cold stress, 4-leaf-stage plants were divided into
two parts and concurrently placed in unstressed (27 oC) and cold stress (10 oC)
conditions for 4 weeks. Cold water (10 oC) was added to plants in cold treatment at the
same time with tap water added to unstressed plants to replace the evaporated water.
After that, temperature in the cold treatment was changed to (27 oC) for plants to
recover. The survival rate was calculated three weeks after recovery.
5.2.4 Germination of T1 transgenic rice plants
Seeds harvested from glasshouse grown T0 transgenic rice were dried in an oven
at 37 oC for a week and maintained at room temperature for 4-5 months. Seeds from
plants transformed with each gene construct were separately placed on paper towels
moistened with tap water in a plastic box and the boxes were placed in the dark at room
temperature for a week. The germinated seeds were transferred into 50-mL pots
containing potting mix moistened with tap water. Pots were placed in a container filled
with tap water to one-third the height of the pots and the container was covered with
clear plastic foil and placed in growth room at 24 oC, day/night cycle of 12 h/12 h,
light intensity of 800 ± 100 µmol m-2 s-1, and relative humidity at 65%. Plants were
sprayed daily with water for seven days and then the plastic foil was removed. Plants
were grown for another seven days with water added into the container to cover the
height of the pots. After that, the Aquasol fertiliser was added weekly to the water in
the container to the concentration of 0.5 g L-1 and plants were grown for another 14
days for screening of transgenic T1 plants.
5.2.5 Screening of T1 transgenic rice plants
The T1 transgenic rice plants were screened by PCR for the presence of the
transgenes. One leaf from each 2- to 3-leaf stage plants was sampled and subjected for
quick-released DNA following the rapid release DNA protocol by Thomson and Henry
(1995) as described in Chapter 2 (Section 2.2.2.1). One microliter of each quick-
released DNA sample was used as template in a 20 µl PCR mixture with either
hygromycin resistant gene primers or gene-specific primers. The PCR products were
separated in 1% agarose gels by electrophoresis. Plants that were PCR positive using
both hygromycin resistant gene primers and gene-specific primers were considered
transgenic. The plants generated a faint band with either primer pairs or both were

114 Chapter 5: Comparative Analysis of Transgenic Rice Constitutively Expressing Osmotins from Tolerant and
Sensitive Species
eliminated. The plants negative to both pairs of primers were considered as segregated
non-transgenic and used as non-transgenic (NT) control.
5.2.6 Growth conditions and reproductive-stage stress treatments
Four weeks post germination and following the confirmation of the transgene,
plants of a similar size and stage were selected and transferred into 1.2-L pots containing
full volume of potting mix moistened with tap water. At this stage, the selected plants
had one tiller and four fully expanded leaves with an immature fifth leaf and plant height
varied from 13 to 17 cm. The plants in 1.2-L pots were placed in containers filled with
tap water to 1 cm above the potting mix. Containers with plants were placed in a
controlled glasshouse at 27 ± 3 oC, day/night cycle of 12 h/12 h, light intensity of 900 ±
100 µmol m-2 s-1, and relative humidity at 65%. Plants were grown for further 14 days
with water added daily to maintain the same water levels and Aquasol fertiliser was
added weekly to the water in the containers to a concentration of 0.5 g L-1.
Drought and salinity stresses were separately applied to 6-week post germinated
plants and concurrently compared with unstressed plants. For salinity stress, water in
the container was drained out and replaced with a 100 mM NaCl solution until the
solution was 1 cm above the potting mix level. The water level was maintained at 1
cm above the potting mix level by adding tap water daily into the container. After four
weeks in 100 mM NaCl, plants were recovered using the method applied for treatment
plants at seedling stage. For drought stress, similar method applied for drought
treatment and recovery at seedling-stage was used, except for the period of water
withholding was 18 days. In the unstressed experiment, water was maintained daily in
the same level of 1 cm above the potting mix surface during the course of experiment.
For each experiment, 30 plants expressing each gene or NT control were randomly
arranged in three replicates. After 28 days, a half of plants per each replicate from all
three experiments were randomly selected for dry biomass determination and another
half were left for recovery and calculating yield components.
5.2.7 Electrolyte leakage
Electrolyte leakage was measured from leaves using a CM 100-2 conductivity
meter (Reid and Associates CC, Durban, South Africa) following the manufacturer’s
instruction. Briefly, the second youngest fully-expanded leaf was placed in a plastic
bag and immediately put on ice. Leaves were washed twice in deionised water and

Chapter 5: Comparative Analysis of Transgenic Rice Constitutively Expressing Osmotins from Tolerant and
Sensitive Species 115
blotted dry with paper towel. A 5-cm middle part of each leaf was cut into 0.5 cm
pieces, rinsed in deionised water and loaded into wells of the CM 100-2 conductivity
meter containing 1.25 ml of deionised water. Each well contained 2 pieces of leaf and
5 wells were used for each leaf as technical replicates. Measurement was carried out
every 2 min over a 60 min period. Samples were removed and dried in an oven at 80
oC overnight (until the weight remained unchanged) for measurement of dry weight
(DW). Electrolyte leakage was calculated as the slope of electrolyte leakage over time
and normalised by DW.
5.2.8 Relative water content determination
Leaf relative water content (RWC) was determined using the method described
by Lafitte (2002). Approximately 10 cm of leaf was cut off from the middle part of the
youngest fully expanded leaf, weighed (fresh weight - FW), and placed in a 15 ml
Falcon tube. The tube was kept on ice until it was filled with deionised water and kept
in dark at 4 oC overnight. The next morning, the leaf was blotted dry with tissue towel
for 30 s and weighed (turgid weight – TW). The samples were then dried in a vacuum
oven at 70 oC for 3 days and weighed (dry weight- DW). The relative water content
was calculated as RWC (%) = (FW-DW)*100/ (TW-DW).
5.2.9 Plant dry weight determination
Plants were sampled in unstressed and stress treatments at the end of treatment
periods from transgenic, WT or NT plants for dry weight determination. Six pots per
line per plasmid construct were sampled for each type of stress treatment in seedling-
stage tested experiments and fifteen plants per plasmid construct were sampled for
each type of stress treatment in reproductive-stage tested experiments. The plants in a
pot were carefully pulled out along with root and potting mix adhering to the root was
removed. Roots and shoots were dried in a vacuum oven at 80 oC for 72 h until the
weight remained unchanged. Then the dry weights were determined.
5.2.10 Measurement of photosynthetic parameters
Photosynthetic parameters such as net photosynthesis, stomatal conductance,
and transpiration rate were measured using a LI-COR Infra-Red Gas Analyser Li-6400
XT (John Morris Scientific, Chatswood, NSW, Australia). Measurements were
performed on the second fully expanded leaf at early stage or flag leaf (if available) at
day 0, 3, 6, 12, and 18 for drought stressed plants and additional day 21 for salinity

116 Chapter 5: Comparative Analysis of Transgenic Rice Constitutively Expressing Osmotins from Tolerant and
Sensitive Species
stressed and unstressed plants. For each data record, nine representative plants for each
gene constructs in each experiment were randomly chosen for measurement.
5.2.11 Statistical analysis
All experiments were conducted using a randomized complete block design and
data were analysed using one-way ANOVA. When ANOVA results showed a significant
difference at P ≤ 0.05, the Tukey’s HSD tests were used to analyse the significant
differences among each experimental treatment (using Minitab 17 Statistical Software).
All graphs and standard errors were prepared using Microsoft Excel. The number of
randomly selected samples used to calculate each mean is indicated in each graph.
Table 5.1 details all the experiments conducted in this study to assess the
transgenic rice expressing TlOsm, OsOlp1_A, OsOlp1_I, and the Gus-reporter gene
together with WT or NT control for enhanced plant tolerance to cold, drought, and
salinity stresses.
Table 5.1 A summary of experiments in the study
Seedling stage Reproductive stage
Materials T0 generation, tissue cultured propagation T1 generation, seed
propagation
Day 0 plants 1 tiller, 4 leaves, 3-week post acclimatisation 3 tillers, 6-week post
germination
Control WT and VC NT and VC
Scale Growth chambers Glasshouse
Set 1 Set 2
Experiments Unstressed, drought,
salinity (100 mM NaCl)
Unstressed and cold Unstressed, drought,
salinity (100 mM NaCl)
Stress period 3-week treatment 4-week treatment 18 days for drought
28 days for salinity
Size 9 lines x 15 plants per line
per gene construct for
each experiment (675
plants per experiment)
8 lines x 15 plants per line
per gene construct for
each experiment (600
plants per experiment)
30 plant per gene construct
for each experiment (150
plants per experiment)
Parameters Shoot growth, tiller
number, electrolyte
leakage, RWC, dry
biomass, survival rate
Shoot growth, tiller
number, electrolyte
leakage, RWC, dry
biomass, survival rate
Shoot growth, tiller
number, electrolyte
leakage, RWC, dry
biomass, photosynthesis-
related parameters, yield
components

Chapter 5: Comparative Analysis of Transgenic Rice Constitutively Expressing Osmotins from Tolerant and
Sensitive Species 117
5.3 RESULTS
5.3.1 Rice plants constitutively expressing TlOsm or OsOlp1_A maintained
growth under cold, drought, and salinity stresses
TlOsm was isolated from a drought-induced cDNA library of desiccation tolerant
species, T. loliiformis, made at the Centre for Tropical Crops and Biocommodities
(CTCB) (Williams, unpublished). OsOlp1_A and OsOlp1_I were identified from
drought-tolerant cultivar Apo and –sensitive cultivar IR64, respectively, of the stress
sensitive species, O. sativa. The two rice osmotins were differentially expressed upon
drought but different from each other in only 10 AA of their protein sequences.
Structural-to-functional prediction for the three proteins suggested their functions
associated with glucan-binding and phosphorylation sites. As shown in Table 3.2,
TlOsm has the highest potential glucan-binding and phosphorylation sites.
OsOlp1_A has more glucan-binding sites than OsOlp1_I, five vs. two sites. The
two rice osmotins have the same number of phosphorylation sites but one Ser residue
in OsOlp1_A is replaced by the Thr residue in OsOlp1_I (Appendix B-Figure 1
and Table 1). Besides, TlOsm has four unique binding sites of the enzymes function
in sugar metabolism (Appendix B-Figure 2). To determine whether these glucan-
binding sites correlate with improved stress tolerance and if the additional
phosphorylation sites and the unique binding sites of TlOsm contribute to stress
tolerance, transgenic rice expressing TlOsm, OsOlp1_A and OsOlp1_I were generated
and subjected to cold, drought, and salinity stresses. Three type of control plants:
vector control (VC), wild type (WT), and non-transgenic (NT) were included in the
assessments. The VC plants expressing the Gus-reporter gene (UidA). Similar to T0
transgenic plants, WT plants went through process of callus induction, transformation,
selection, plant regeneration, and tissue-culture multiplication, except the presence of
Agrobacterium in inoculation media and of Hygromycin in selection media (Chapter
4). The NT plants were the non-transgenic segregation in the same generation with
transgenic plants and produced by the same parental plants as transgenic plants. The
performance of these plants were assessed based on growth, physiological, and
photosynthesis-related parameters, recovery ability, and yield components.
Shoot growth rate is one of the indicators for rice stress tolerance, with higher
growth rate under stress associated with higher level of tolerance (Zhang et al., 2014).
To evaluate growth rate, plant height were measured at the day before stress

118 Chapter 5: Comparative Analysis of Transgenic Rice Constitutively Expressing Osmotins from Tolerant and
Sensitive Species
application (day 0) and 18 days after the onset of salinity and drought stress in both
seedling-stage and reproductive-stage experiments. For cold stress, growth was
measured at 25 days post stress treatment. For all stress experiments, corresponding
unstressed controls were also included. The differences in plant growth, expressed as
shoot increment, among osmotin-, Gus-expressing plants and WT or NT control were
observed in all cold, drought, and salinity stresses at both stages of plant development
that stress treatments applied (Figure 5.1). At the seedling-stage, both drought and
salinity stress significantly reduced plant growth (Figure 5.1 A). However, the growth
reduction was greater in VC and WT plants, followed by OsOlp1_I plants in
comparison to TlOsm and OsOlp1_A plants. A similar trend was observed following
cold stress with TlOsm and OsOlp1_A plants was displaying significantly higher
growth rate than the OsOlp1_I, VC, and WT plants (Figure 5.1 B). Notably, TlOsm
plants showed superior growth to OsOlp1_A plants. When stress was applied before
the transition between growth and reproductive stage on the T1 generation, the growth
reduction was also observed in 100 mM NaCl and drought exposed plants, as
compared to unstressed plants (Figure 5.1 C). At this stage, all three osmotin
expressing plants exhibited significantly greater shoot growth than the NT and VC
plants. TlOsm plants exhibited leading shoot growth in both 100 mM NaCl and drought
exposure while shoot increment of OsOlp1_A plants was only comparable to that of
TlOsm plants in 100 mM NaCl treatment (Figure 5.1). Shoot growth of OsOlp1_I
plants was significantly smaller than that of OsOlp1_A and TlOsm plants in both 100
mM NaCl and drought stress treatments. The results here demonstrated that TlOsm
and OsOlp1_A plants maintained growth better than OsOlp1_I, NT and VC plants.

Chapter 5: Comparative Analysis of Transgenic Rice Constitutively Expressing Osmotins from Tolerant and
Sensitive Species 119
Figure 5.1 Relative shoot growth of WT or NT, VC and transgenic plants expressing
OsOlp1_A, OsOlp1_I, and TlOsm grown in unstressed, 100 mM NaCl, and drought stress at
seedling stage (A); in unstressed and cold stress (B); and in unstressed, 100 mM NaCl, and
drought stress at reproductive stage (C). Data present the mean + SE of three replicates. Number
of plants (n) used to calculate each mean is indicated in the corresponding charts. Data in the
same treatment category followed by different letters are significantly different at P ≤ 0.05.
5.3.2 Rice plants constitutively expressing TlOsm or OsOlp1_A produce more
tillers than WT, NT, and VC plants under cold, drought, and salinity
stresses
Tiller number is another indicative parameter for rice growth under stress with
more tillers related to higher tolerance and potentially contribute to higher yield
(Tripathi et al., 2012). Tiller number in all experiments was recorded at the same day

120 Chapter 5: Comparative Analysis of Transgenic Rice Constitutively Expressing Osmotins from Tolerant and
Sensitive Species
as plant height, i.e. day 18 for 100 mM NaCl and drought stress with corresponding
unstressed experiments and day 25 of cold stress with its unstressed control. Figure
5.2 presents number of tillers of WT, NT, transgenic plants expressing Gus-reporter
gene, OsOlp1_A, OsOlp1_I, and TlOsm in all unstressed and cold, drought, and
salinity stress treatments.
Figure 5.2 Tiller number of WT or NT, VC and transgenic plants expressing OsOlp1_A,
OsOlp1_I, and TlOsm grown in unstressed, 100 mM NaCl, and drought stress (A); in
unstressed and cold stress (B) at seedling stage; and in unstressed, 100 mM NaCl, and drought
stress at reproductive stage (C). Data present the mean + SE of three replicates. Number of
plants (n) used to calculate each mean is indicated in the corresponding charts. Data in the
same treatment category followed by different letters are significantly different at P ≤ 0.05.

Chapter 5: Comparative Analysis of Transgenic Rice Constitutively Expressing Osmotins from Tolerant and
Sensitive Species 121
No significant difference was observed in tiller numbers among the plants under
unstressed conditions in all three experiments. However, in all three stress conditions
and regardless of plant generations and developmental stages at which stresses applied,
OsOlp1_A and TlOsm plants produced significantly more tillers than OsOlp1_I, VC
and WT or NT plants. Only T1 generation and in drought stressed at reproductive stage,
tiller numbers of TlOsm plants were significantly higher than that of OsOlp1_A plants
(Figure 5.2 C). A significant difference in tiller numbers of OsOlp1_I plants compared
to VC, WT or NT plants was observed in 100 mM NaCl stress at seedling stage (Figure
5.2 A) and both 100 NaCl and drought stresses at reproductive stage (Figure 5.2 C).
Data presented in Figure 5.2 indicate that TlOsm and OsOlp1_A plants produce more
tillers than WT, NT, and VC plants under cold, drought, and salinity stresses.
Moreover, in exposure to drought stress at reproductive stage, TlOsm plants produced
significantly more tillers than OsOlp11_A plants.
5.3.3 Rice plants constitutively expressing OsOlp1_A or TlOsm retained water
better than OsOlp1_I, VC and NT or WT plants under cold, drought, and
salinity stresses
Relative water content (RWC) is considered an appropriate measurement of
plant water status that reflects the physiological consequence of cellular water deficits
(Gonzalez and Gonzalez-Vilar, 2001). Studies on rice have shown that tolerant plants
maintain higher leaf RWC during stress (Lafitte et al., 2006; Cha-um et al., 2009; Kim
et al., 2012; Zhang et al., 2014). To understand the physiological difference among
plants expressing OsOlp1_A, OsOlp1_I and TlOsm with VC, and WT or NT plants,
leaf RWC was measured in all unstressed and stressed plants. As presented in Figure
5.3, in all three sets of unstressed plants, leaf RWC of OsOlp1_A, OsOlp1_I, TlOsm,
VC, and WT or NT plants was similar. After subjection to 100 mM NaCl, drought or
cold stresses, leaf RWC of all plants was dramatically reduced, with a noticeable RWC
reduction of plants exposed to drought stress. Leaf RWC of OsOlp1_A and TlOsm was
always significantly higher than that of OsOlp1_I, VC, and WT or NT plants
regardless of stress types, transgenic generations, and developmental stages that
stresses applied. In seedling-stage stress treatments, RWC of TlOsm was significantly
higher than that of OsOlp1_A only in drought stress (Figure 5.3 A). When stresses
applied at reproductive stage on T1 transgenic plants, leaf RWC of TlOsm plants was
significantly higher than that of OsOlp1_A in both drought and salinity stresses (Figure
5.3 C). The significant difference in leaf RWC of OsOlp1_I over VC and NT plants

122 Chapter 5: Comparative Analysis of Transgenic Rice Constitutively Expressing Osmotins from Tolerant and
Sensitive Species
was observed in both drought and salinity stresses when stresses applied at
reproductive stage (Figure 5.3 C). Among stress treatments at seedling stage, leaf
RWC of OsOlp1_I plants was significantly greater than that of WT plants only in
drought stress condition (Figure 5.3 A). Previous studies have indicated the ability to
maintain higher leaf RWC during stress as advantage trait of rice stress-tolerant
cultivars. Data from these experiments proved that OsOlp1_A and TlOsm plants
exhibited better water retention under cold, drought and salinity stresses; thus
contributing to their higher stress tolerance.
Figure 5.3 Leaf relative water content (RWC) of WT or NT, VC and transgenic plants
expressing OsOlp1_A, OsOlp1_I, and TlOsm grown in unstressed, 100 mM NaCl, and
drought stress (A); in unstressed and cold stress (B) at seedling stage; and in unstressed, 100
mM NaCl, and drought stress at reproductive stage (C). Day of measurement was indicated.
Data present the mean + SE of three replicates. Number of samples (n) used to calculate each
mean is indicated in the corresponding charts. Data in the same treatment category followed
by different letters are significantly different at P ≤ 0.05.

Chapter 5: Comparative Analysis of Transgenic Rice Constitutively Expressing Osmotins from Tolerant and
Sensitive Species 123
5.3.4 Rice plants constitutively expressing osmotins maintain membrane
integrity better than VC and WT or NT plants under cold, drought, and
salinity stresses
Electrolyte leakage reflects the ability of cells to maintain membrane integrity
and has been used as an indicator of membrane damage. Lower electrolyte leakage has
been found in rice stress-tolerant cultivars (Cha-um et al., 2009; Kim et al., 2012;
Zhang et al., 2014; Das et al., 2015). Leaf electrolyte leakage was another parameter
being measured to understand the physiological difference among plants expressing
OsOlp1_A, OsOlp1_I and TlOsm with VC, and WT or NT plants. Leaf electrolyte
leakage was measured at the same day of RWC measurement in all unstressed and
stress-treated experiments and data are presented in Figure 5.4.

124 Chapter 5: Comparative Analysis of Transgenic Rice Constitutively Expressing Osmotins from Tolerant and
Sensitive Species
Figure 5.4 Leaf electrolyte leakage of WT or NT, VC and transgenic plants expressing
OsOlp1_A, OsOlp1_I, and TlOsm grown in unstressed, 100 mM NaCl, and drought stress
(A); in unstressed and cold stress (B) at seedling stage; and in unstressed, 100 mM NaCl, and
drought stress at reproductive stage (C). Day of measurement was indicated. Data present the
mean + SE of three replicates. Number of samples (n) used to calculate each mean is indicated
in the corresponding charts. Data in the same treatment category followed by different letters
are significantly different at P ≤ 0.05.
In these experiments, relative electrolyte leakage of leaf cells was calculated as
a slope of electrolytes leaked out of cells against time in 1 h increment. The greater
electrolyte leakage is associated with higher cellular damage. In three sets of plants in
unstressed conditions, electrolyte leakage values were very small (range from 0.02 to
< 0.1, dependent on stages) and similar across the transgenic OsOlp1_A, OsOlp1_I,

Chapter 5: Comparative Analysis of Transgenic Rice Constitutively Expressing Osmotins from Tolerant and
Sensitive Species 125
TlOsm, and VC, and WT or NT plants. Under stress, these values sharply increased.
There was a noticeable increase in electrolyte leakage of drought stressed plants. The
values of OsOlp1_A and TlOsm plants were always smaller than those of OsOlp1_I,
VC, and WT or NT plants. Electrolyte leakage from TlOsm tissues was significant less
than from OsOlp1_A tissues during cold stress at the seedling stage and at both drought
and salinity stress at the reproductive stage. Except for cold stress, OsOlp1_I cells had
significantly less electrolyte leakage than that of the WT or NT plants in drought and
salinity stress at both seedling-stage and reproductive stage stress treatments. The
results on electrolyte leakage measurement demonstrated that TlOsm and OsOlp1_A
plants maintained the membrane integrity better than OsOlp1_I, VC, and WT or NT
plants. This ability of TlOsm plants was found to be superior to that of OsOlp1_A
plants when exposed to cold stress at the seedling stage and drought and salinity
stresses at the reproductive stage.
5.3.5 Rice plants constitutively expressing TlOsm or OsOlp1_A maintained
photosynthesis efficiency under drought and salinity stresses
Photosynthesis is a basic physiological process plants use to produce energy for
their development and coping with environmental challenges. Abiotic stresses leading
to photosynthesis reduction and ultimately inhibition have been well documented in
rice (Babu, 2010; Zhang et al., 2014; Das et al., 2015). Stress tolerant rice cultivars
maintain higher photosynthetic activity during stress (Moradi et al., 2007). To
investigate the physiological differences among transgenic plants expressing Gus-
reporter gene, OsOlp1_A, OsOlp1_I, and TlOsm and NT plants, photosynthetic
parameters were measured in the plants exposed to drought and salinity stresses at
reproductive stage together with corresponding unstressed control. Photosynthetic
measurements were carried out from day 0 to day 21 of stress exposure for salinity
stressed plants and unstressed control; and to day 18 for drought stressed plants.
Photosynthesis data of these plants are presented in Figure 5.5. As shown in Figure
5.5.A, in unstressed conditions, net photosynthesis of TlOsm plants was significantly
lower that of OsOlp1_I, NT and VC plants during the course of measurement. The
significantly higher photosynthesis rates of OsOlp1_A plants over TlOsm plants were
also detected at day 0, 3, 18, and 21. Net photosynthesis of OsOlp1_A plants was found
lower than NT plants at day 0 and day 12. There were some variations in
photosynthesis rate among different times of measurement, probably due to the

126 Chapter 5: Comparative Analysis of Transgenic Rice Constitutively Expressing Osmotins from Tolerant and
Sensitive Species
changes in developmental stages. Under unstressed condition, panicle initiation started
at around day 6 with the appearance of flag leaf and at day 18, 36% of OsOlp1_I, NT
and VC plants flowered. Thus, from day 12 to day 21 photosynthesis was measured
on flat leaves of unstressed plants. When exposed to 100 mM NaCl (Figure 5.5 B),
photosynthesis of OsOlp1_I, NT and VC plants was significantly reduced since day 6
with a sharp reduction from day 12. Photosynthesis reduction was also observed in
OsOlp1_A and TlOsm plants but with smaller reduction and at the later stage (day 12).
Photosynthesis rate of OsOlp1_A and TlOsm plants was similar from day 12 to day 21,
which was significantly higher than NT and VC plants. Significant lower
photosynthesis rate of OsOlp1_I in comparison to OsOlp1_A and TlOsm plants was
found from day 18 to day 21. A similar trend of photosynthesis rate was observed
when plants exposed to drought stress (Figure 5.5 C). At day 6 of withholding water,
photosynthesis of OsOlp1_I, NT and VC plants was significantly reduced and
continued to reduce to very low rate (about 10% of normal levels) at day 18. OsOlp1_A
maintained normal photosynthesis efficiency until day 6 of withholding water, then
declined but kept significantly greater than those of OsOlp1_I, NT and VC plants.
Photosynthesis rates of TlOsm plants were only significantly decreased after day 12 of
withholding water. At the end of drought stress period (day 18), net photosynthesis of
TlOsm plants was highest, followed by OsOlp1_A plants and significantly
distinguished with those of OsOlp1_I, NT and VC plants. During the course of drought
stress, OsOlp1_I plants did not show any difference in photosynthesis rate in compared
to NT and VC plants. TlOsm and OsOlp1_A`plants maintain better photosynthesis
efficiency than OsOlp1_I, NT and VC plants under drought and salinity stresses
suggesting that this is one of the strategies TlOsm and OsOlp1_A plants used to cope
with drought and salinity stresses.

Chapter 5: Comparative Analysis of Transgenic Rice Constitutively Expressing Osmotins from Tolerant and
Sensitive Species 127
Figure 5.5 Net photosynthesis of NT, VC and transgenic plants expressing OsOlp1_A,
OsOlp1_I, and TlOsm grown in unstressed (A) and exposure to 100 mM NaCl (B) and drought
stress (C) at reproductive stage. Data present the mean ± SE of nine observations. * indicates
significant difference at P ≤ 0.05.
Transpiration is the process of water loss through stomata. The trends of
transpiration of OsOlp1_A, OsOlp1_I, TlOsm, VC and NT plants under unstressed,
salinity and drought conditions (Figure 5.6) were similar as those of photosynthetic
activity. Under unstressed condition (Figure 5.6 A), TlOsm plants exhibited lower
transpiration rate than OsOlp1_I, VC and NT plants. Transpiration rate of OsOlp1_A
was lower than those of OsOlp1_I, VC and NT plants but higher than TlOsm plants.
As shown in Figure 5.6 B, at the first 6 days of exposure to 100 mM NaCl, transpiration
rate of OsOlp1_I, VC and NT plants remained the levels similar to unstressed and

128 Chapter 5: Comparative Analysis of Transgenic Rice Constitutively Expressing Osmotins from Tolerant and
Sensitive Species
significantly higher than that of TlOsm plants. Since day 12, transpiration rate of these
plants dramatically decreased. TlOsm and OsOlp1_A plants had smaller values of
transpiration rate at the first 6 day of NaCl exposure, their significant transpiration
decrease compared with before stress was found at day 18. The reduction in
transpiration rate of TlOsm and OsOlp1_A plants was slower than that of OsOlp1_I,
VC and NT plants, resulting in their significant higher transpiration rate from day 12
to day 21. Similarly, transpiration rate of all plants sharply decreased after 6 days of
withholding water (Figure 5.6 C), but the reduction rate was faster for the OsOlp1_I,
VC and NT plants, resulting in their significant lower transpiration rate in compared
with that TlOsm and OsOlp1_A plants since day 12.
Figure 5.6 Transpiration rate of NT, VC and transgenic plants expressing OsOlp1_A,
OsOlp1_I, and TlOsm grown in unstressed (A), exposure to 100 mM NaCl (B) and drought
stress (C) at reproductive stage. Data present the mean ± SE of nine observations. * indicates
significant difference at P ≤ 0.05.

Chapter 5: Comparative Analysis of Transgenic Rice Constitutively Expressing Osmotins from Tolerant and
Sensitive Species 129
Transpiration partially reflects the plant photosynthesis activity and water
balance. TlOsm and OsOlp1_A plants have lower levels of transpiration rate in
unstressed and at beginning of stress period would help in retaining water. At the later
stages of drought and salinity stresses, transpiration remained higher than OsOlp1_I,
VC and NT plants, suggesting their photosynthesis machinery was still active.
In plant, stomata control gas exchange between plant and atmosphere, thus drive
CO2 influx into leaves for photosynthesis and water vapour as transpiration. Regulation
of stomatal movement is a central mechanism to maintain photosynthesis efficiency and
water balance in plants exposure to osmotic stress (Belin and Thomine, 2010). To
understand the cause of variations in photosynthesis and transpiration among plants,
stomatal conductance of OsOlp1_A, OsOlp1_I, TlOsm, VC and NT plants under
unstressed, salinity and drought conditions was calculated and presented in the Figure 5.7.
Figure 5.7 Stomatal conductance of NT, VC and transgenic plants expressing OsOlp1_A,
OsOlp1_I, and TlOsm grown in unstressed (A), exposure to 100 mM NaCl (B) and drought
stress (C) at reproductive stage. Data present the mean ± SE of nine observations. * indicates
significant difference at P ≤ 0.05.

130 Chapter 5: Comparative Analysis of Transgenic Rice Constitutively Expressing Osmotins from Tolerant and
Sensitive Species
In unstressed conditions, stomatal conductance of TlOsm plants was
significantly lower than that of OsOlp1_I, VC and NT plants during the course of
measurement, and also of OsOlp1_A plants at day 0, day 18 and day 21. When exposed
to 100 mM NaCl, stomatal conductance of OsOlp1_I, VC and NT plants was reduced
with a noticeable reduction after day 6, while that of TlOsm plants found significant
difference with before stress only from day 18, and of OsOlp1_A from day 12. Since
day 12, conductance of OsOlp1_A and TlOsm plants was similar and significantly
higher than that of NT and VC plants. The conductance of OsOlp1_I plants was found
higher than that of the NT and VC plants only at day 12 and 18, but declined to the
same level at day 21. Similarly, six days after water was withheld, stomatal
conductance of all plants was declined. However, TlOsm plants maintained the highest
values of stomatal conductance, followed by OsOlp1_A, OsOlp1_I; the NT and VC
had the same lowest values. Regulation of stomatal closure is one of the mechanisms
plants use to tolerate osmotic stresses by reducing water loss and balancing
photosynthesis process. Constitutive expression of TlOsm or OsOlp1_A in rice resulted
in transgenic plants with lower stomatal conductance, suggesting that functions of
TlOsm and OsOlp1_A I are linked to stomatal regulation. At the later stages of drought
and salinity stress exposure, TlOsm and OsOlp1_A plants maintained significant
higher stomatal conductance than OsOlp1_I, NT and VC plants. The results here once
support that the photosynthesis machinery was still active in TlOsm and OsOlp1_A
plants in these stress treatments.
5.3.6 Stressed rice plantlets constitutively expressing TlOsm or OsOlp1_A
showed heathier morphological appearance than VC and WT
The phenotypic differences among TlOsm, OsOlp1_A, OsOlp1_I, WT and VC
plants were apparent in all cold, drought and salinity stress conditions applied at
seedling stage. Figure 5.8 shows the images capturing morphology of representative
plants before and after a given period of stress exposure. Before entering stress
treatments, plants were selected at the same stage and their morphologies were similar
across all OsOlp1_A, OsOlp1_I, TlOsm, VC, and WT plants (Figure 5.8 A and B).
Eighteen days later, in unstressed conditions all plants looked equally healthy except
for shorter shoots of TlOsm plant (Figure 5.8 C). However, upon drought (Figure 5.8
E) and salinity (Figure 5.8 F) stresses, VC and WT plants completely stopped tillering,
leaves yellowing or discoloured while the TlOsm and OsOlp1_A plants had more

Chapter 5: Comparative Analysis of Transgenic Rice Constitutively Expressing Osmotins from Tolerant and
Sensitive Species 131
tillers, plants were greener, only the leaf tips damaged but entire leaves. OsOlp1_I
plants were healthier than VC and WT plants but were not comparable to TlOsm and
OsOlp1_A plants. Similarly, after 25 days undergone cold stress (Figure 5.8. D),
OsOlp1_I, WT and VC plants had severely damaged appearance and the death of
youngest leaves while TlOsm and OsOlp1_A had less leaf and stem damages and had
more tillers.
Figure 5.8 Morphology of T0 rice plants under cold, drought and salinity stresses at
seedling stage. Images A and B were taken right before plants undergone unstressed, 100 mM
NaCl, and drought stress for three weeks (A) or unstressed and cold stress for 4 weeks (B). C, E,
and F: representatives of plants in (A) after 18 days undergone unstressed, drought, and salinity
stress respectively. D: Representative of plants in (B) after 25 days undergone cold stress.

132 Chapter 5: Comparative Analysis of Transgenic Rice Constitutively Expressing Osmotins from Tolerant and
Sensitive Species
Four weeks after germination when transgenic status was confirmed, T1 rice
plants grown in 50-ml pots were selected at similar size and at 5-leaf stage and were
transplanted into 1.2-L pots. Plants were grown for further 2 weeks in glasshouse
condition before the stresses applied. The day before stress exposure (day 0),
appearance of all plants was similar but the shorter shoots of TlOsm plants could be
observed (Figure 5.9 A). At this time, all plants typically had 3 tillers. After 18 days
of withholding water (Figure 5.9 B), leaves of NT, VC and OsOlp1_I plants were
completely rolled and discoloured, their newly-developed tillers were dried despite
their stems of main culm survived. Most leaves of TlOsm plants and some of
OsOlp1_A plants stayed expended and relatively greener, some of their newly-
developed tillers stayed alive, their stems were greener and looked healthier than those
of NT, VC and OsOlp1_I plants. After exposure to 100 mM NaCl for 28 days (Figure
5.9 B), severe senescence was observed in NT, VC and OsOlp1_I plants but not in
TlOsm and OsOlp1_A plants. TlOsm and OsOlp1_A plants looked similar in term of
green appearance and tillering.

Chapter 5: Comparative Analysis of Transgenic Rice Constitutively Expressing Osmotins from Tolerant and
Sensitive Species 133
Figure 5.9 Morphology of T1 rice plants and panicles under unstressed, drought and
salinity stresses when plants exposed to stresses at reproductive stage. A: plants before
stress treatment; B-C: representatives of plants in (A) after 18 days under drought (B) and
28 days exposed to salinity stress (C) respectively. D-F Representative of panicles in plants
undergone unstressed (D), drought (E) and salinity stress (F).
5.3.7 Rice plants constitutively expressing TlOsm or OsOlp1_A resulted in higher
dry biomass under cold, drought, and salinity stresses
Dry biomass of TlOsm, OsOlp1_A, OsOlp1_I, VC, and WT or NT plants was
determined at the end of stress periods, i.e. day 21 for plants in set 1 exposed to drought
and salinity stress at seeding stage, day 28 for plants in set 2 exposed to cold stress at
seeding stage, and day 28 for T1 plants with stresses applied at reproductive stages,
together with corresponding unstressed controls. As a result of growth arrest under

134 Chapter 5: Comparative Analysis of Transgenic Rice Constitutively Expressing Osmotins from Tolerant and
Sensitive Species
stresses, dry biomass was dramatically reduced in all TlOsm, OsOlp1_A, OsOlp1_I,
VC, WT, and NT plants in all stress conditions (Table 5.2 and 5.3). However, the
reduction in dry biomass was smaller for TlOsm plants, followed by OsOlp1_A,
OsOlp1_I plants and equally higher for VC and WT or NT plants. As shown in Table
5.2, when stresses were applied at seeding stage, dry biomass of TlOsm plants reduced
by 1.21, 1.22, and 1.66 fold for drought, salinity, and cold stress, respectively, in
comparison with corresponding unstressed control. But reduction was 2.58, 2.21, 3.50
fold for WT and 2.50, 2.18, and 2.47 for VC plants, in the same order. Dry biomass of
TlOsm plants was significantly greater than that of OsOlp1_A plants in drought and
cold stresses, but not in salinity stress. OsOlp1_I plants only produced significantly
higher dry biomass than WT plants in salinity stress.
Table 5.2 Dry biomass of plants in seedling-stage stress treatment experiments
Experiment Plants Dry biomass1 per plant (mg)
Seedling
stage plant
set 1, day 21
Unstressed Drought Salinity
OsOlp1_A 525a ± 18.9 343b ± 18.9 353a ± 20.5
OsOlp1_I 535a ± 23.1 281c ± 25.8 271b ± 18.2
TlOsm 472b ± 19.1 390a ± 28.8 386a ± 17.3
VC 562a ± 22.4 257c ± 19.6 245bc ± 15.6
WT 559a ± 15.3 253c ± 44.7 216c ± 15.7
Seedling
stage
plant set 2,
day 28
Unstressed Cold
OsOlp1_A 585a ± 13.1 218b ± 12.9
OsOlp1_I 575a ± 10.0 175c ± 10.8
TlOsm 488b ± 13.7 294a ± 12.6
VC 567a ± 11.7 166c ± 9.1
WT 584a ± 27.1 167c ± 19.2 1 data represent mean ± SE of 54 plants. Data in the same treatment category followed by
different letter are significantly different at P ≤ 0.05.

Chapter 5: Comparative Analysis of Transgenic Rice Constitutively Expressing Osmotins from Tolerant and
Sensitive Species 135
Table 5.3 Dry biomass of plants in reproductive-stage stress treatment experiments
Plants Dry biomass1 per plant (mg)
Unstressed Drought Salinity
NT 1652a ± 48 802
cd ± 36 875
c ± 38
OsOlp1_A 1598ab
± 53 1034b ± 35 1118
a ± 47
OsOlp1_I 1676a ± 51 876
c ± 39 998
b ± 56
TlOsm 1537b ± 46 1157
a ± 35 1093a ± 38
VC 1692a ± 55 795
d ± 32 895
bc ± 55
1 data represent mean ± SE of 15 plants. Data in the same treatment category
followed by different letters are significantly different at P ≤ 0.05.
Consistent with results in seedling-stage stress treatment, drought and salinity stresses
applied at the reproductive stage also sharply decreased dry biomass of all plant types (Table
5.3). Under drought stress TlOsm plants still produced highest dry biomass, followed by
OsOlp1_A plants, and both had significantly higher dry biomass than NT, VC and OsOlp1_I
plants. Under salt stress, dry biomass of TlOsm and OsOlp1_A was not different but
significantly higher than that of NT, VC and OsOlp1_I plants. Dry biomass of OsOlp1_I
plants was found greater than VC plants in drought stress, and NT plants in salinity stress.
5.3.8 Constitutive expression of TlOsm or OsOlp1_A improves survival rate
under salinity, drought and cold stress in transgenic rice.
After stress treatment, the plants were recovered and the survival rates were assessed
after 3 weeks of recovery (Figure 5.10). For salinity stress, the rates of survival plants were
42.22%, 45.56%, 50%, 70% and 74.44% for WT, VC, OsOlp1_I, OsOlp1_A, and TlOsm
plants respectively (Figure 5. 10 A); while that rates were 24.07%, 28. 40%, 48.15%, 76.54%
and 86.42% for drought stress (Figure 5.10 C). In cold stress, a symptom commonly observed
in WT and VC plants was that in the same plant the newly emerging (youngest) leaves died
while the mature leaves and stems remained alive. The tillers with the youngest leaf mortality
stopped growth and panicle initiation that ultimately became infertile. Despite the severe
effects under cold stress, in recovery, plants with infertile tillers continued tillering and new
tillers developed normally in recovery conditions and that resulted in relatively high survival
rates of cold stressed plants, compared to drought and salinity stresses (Figure 5. 10 E). The
plants with infertile tillers had less grain yield. In this respect, 75.71% TlOsm plants and 63%
of OsOlp1_A plants recovered without infertile tillers, while that rates were only 25.4%,
22.95% and 21.32% for OsOlp1_I, VC, and WT plants.

136 Chapter 5: Comparative Analysis of Transgenic Rice Constitutively Expressing Osmotins from Tolerant and
Sensitive Species
Figure 5.10 Survival rate and morphology of rice plants recovered from stress treatments
at seeding stage. A & B: salinity, C&D: drought, E & F: cold. Data present the mean + SE of
81 plants in three replicates. Data in A, C, and E followed by different letters are significantly
different at P ≤ 0.05.
In recovery, TlOsm and OsOlp1_A plants showed greener and healthier
appearance and had more tillers than the OsOlp1_I, VC, and WT plants (Figure 5.10
B, D & F). The significant higher survival rate and healthier recovery of TlOsm and
OsOlp1_A plant under these three stress conditions demonstrated that TlOsm and
OsOlp1_A enhanced tolerance to cold, drought, and salinity stresses in transgenic rice.

Chapter 5: Comparative Analysis of Transgenic Rice Constitutively Expressing Osmotins from Tolerant and
Sensitive Species 137
5.3.9 Constitutive expression of TlOsm or OsOlp1_A improved yield under
drought and salinity in transgenic rice
Morphologically, panicles and seeds of TlOsm, OsOlp1_A, OsOlp1_I, VC and
NT plants developed normally under unstressed condition with shorter panicle length
and condensed distribution of seeds found in TlOsm plants (Figure 5.9 D). In both
drought and salinity stress, panicles were shorter and seeds were smaller for all TlOsm,
OsOlp1_A, OsOlp1_I, VC and NT plants (Figure 5.9 E & F). Additionally, many
brown spots were observed on filled seeds of salt stressed plants (Figure 5.9 F),
probably due to the consequence of oxidative stress.
The parameters used in this study for evaluating yield are indicative components
contributing to rice grain yield (Tripathi et al., 2012). Yield components were
calculated for all plants in drought, salinity, and unstressed experiments when stressed
applied at reproductive stage and data are presented in Table 5.4. In drought-stressed
plants, TlOsm plants had leading values in all observed parameters, including number
of panicles per plant, panicle length, and number of spikelets per panicle, percentage
of filled seeds, total filled seeds per plant and seed weight (expressed as weight of 100
seeds). Both TlOsm and OsOlp1_A plants produced significantly higher values of yield
components than OsOlp1_I, VC, and NT plants. Panicle length and number of
spikelets per panicle of OsOlp1_A were comparable to those of TlOsm plants.
However, OsOlp1_A plants produced significantly less panicles than TlOsm plants and
the percentage of filled seeds was also significantly smaller in OsOlp1_A than in
TlOsm plants. These resulted in significant less seeds per plant of OsOlp1_A plants as
compared to TlOsm plants. In addition, OsOlp1_A seed weight was significantly
smaller than that of TlOsm. This would further contribute to less grain yield of
OsOlp1_A plants.
Similarly, in salinity stress all the yield components of TlOsm and OsOlp1_A
were significant higher than those of OsOlp1_I, VC, and NT plants. Across all yield
parameters, values of TlOsm and OsOlp1_A plants were comparable under salinity
stress conditions. As compared with applied drought stress conditions, values of all
yield parameters of each type of plants were higher in applied salinity stress conditions.
This indicates that the drought treatment has severer effects on rice yield than the
salinity treatment.

138 Chapter 5: Comparative Analysis of Transgenic Rice Constitutively Expressing Osmotins from Tolerant and
Sensitive Species
In unstressed conditions, there was no difference in number of panicles per plant,
number of spikelets per panicle, percentage of filled seeds, and total seeds per plant
among TlOsm, OsOlp1_A, OsOlp1_I, NT, and VC plants, despite significantly shorter
panicle length was observed for both TlOsm and OsOlp1_A. However, seed weight of
TlOsm and OsOlp1_A plants was significantly smaller, with the lowest value for
TlOsm seeds.
Results on yield components here demonstrate that constitutive expression of
either TlOsm or OsOlp1_A improved rice yield under drought and salinity stress.
Significant higher yield of TlOsm plants over OsOlp1_A was observed in drought
stress.

Chapter 5: Comparative Analysis of Transgenic Rice Constitutively Expressing Osmotins from Tolerant and Sensitive Species 139
Table 5. 4 Yield components of TlOsm, OsOlp1_A, OsOlp1_I, VC and NT (control) plants under unstressed, drought, and salinity stress conditions
A) Drought stress
Plants # of panicles/plant Panicle length (cm) # of spikelets/panicle Filled seeds (%) # of seeds/plant 100-seed weight (mg)
NT 1.93d ± 0.27 13.07
b ± 0.31 38.76
b ± 2.19 35.12
c ± 4.01 28
c ± 4 1669
c ± 14
OsOlp1_A 3.40b ± 0.16 13.85
a ± 0.26 45.84
a ± 1.57 57.69
b ± 3.22 92
b ± 7 1752
b ± 16
OsOlp1_I 2.87c ± 0.20 13.19
b ± 0.17 38.72
b ± 1.41 26.72
c ± 3.42 30
c ± 5 1651
c ± 15
TlOsm 4.73a ± 0.19 13.82
a ± 0.11 44.10
a ± 1.02 74.25
a ± 2.96 155
a ± 6 1790
a ± 9
VC 2.40d ± 0.22 13.21
b ± 0.18 37.04
b ± 1.45 30.78
c ± 3.16 29
c ± 4 1654
c ± 12
B) Salinity stress
Plants # of panicles/plant Panicle length (cm) # of spikelets/panicle Filled seeds (%) # of seeds/plant 100-seed weight (mg)
NT 2.87c ± 0.20 13.02
b ± 0.19 40.62
b ± 1.27 47.02
b ± 3.14 53
b ± 4 1763
b ± 11
OsOlp1_A 5.87a ± 0.17 13.64
a ± 0.15 43.97
a ± 0.99 73.58
a ± 2.35 191
a ± 7 1825
a ± 8
OsOlp1_I 3.67b ± 0.19 12.87
b ± 0.15 39.15
b ± 2.16 40.55
b ± 3.77 58
b ± 3 1782
b ± 10
TlOsm 5.93a ± 0.16 13.77
a ± 0.11 45.15
a ± 0.79 74.06
a ± 2.45 197
a ± 7 1816
a ± 7
VC 2.93c ± 0.24 13.16
b ± 0.14 41.65
b ± 0.94 45.32
b ± 2.90 55
b ± 6 1772
b ± 9
C) Unstressed
Plants # of panicles/plant Panicle length (cm) # of spikelets/panicle Filled seeds (%) # of seeds/plant 100-seed weight (mg)
NT 9.20ns
± 0.46 16.61a ± 0.23 66.68
ns ± 2.75 84.13
ns ± 1.98 515
ns ± 19 2190a ± 31
OsOlp1_A 8.93ns
± 0.51 16.04b ± 0.28 66.15
ns ± 2.51 84.47
ns ± 1.83 497
ns ± 18 2109
b ± 24
OsOlp1_I 8.33ns
± 0.45 16.45ab
± 0.25 70.08ns
± 3.57 86.26ns
± 1.74 503ns
± 16 2214a ± 22
TlOsm 8.73ns
± 0.30 15.07c ± 0.27 65.48
ns ± 3.40 87.62
ns ± 1.66 489
ns ± 21 2042
c ± 25
VC 8.60ns
± 0.31 16.53a ± 0.19 66.88
ns ± 2.78 83.79
ns ± 2.21 495
ns ± 20 2170
a ± 23
Data represent mean ± SE. Data in the same treatment category followed by different letter are significantly different at P ≤ 0.05; ns: none significance


Chapter 5: Comparative Analysis of Transgenic Rice Constitutively Expressing Osmotins from Tolerant and
Sensitive Species 141
5.4 DISCUSSION
Rice is one of the most sensitive crops to abiotic stress. Countless efforts have
been made to improve abiotic stress tolerance in rice through conventional breeding
and the supports of advanced molecular assisted breeding techniques. Attempts in rice
abiotic-stress-tolerant improvement have resulted in various commercial cultivars
adapted to a wide range of rice cultivation areas but the success has reached the
limitations (Das et al., 2015; Sankar et al., 2011; Swamy and Kim 2013). Genetic
engineering allows researchers to breach species boundaries and incorporate genes
from other species for enhancing abiotic stress tolerance. Incorporation of stress-
responsive genes from naturally tolerant species for engineering rice with enhanced
abiotic stress tolerance is essential to add adaptive traits into this species. In Chapter
3, an osmotin (TlOsm) from desiccation tolerant plant, T. loliiformis, was characterised
and proven to respond to cold, drought, and salinity stresses. In Chapter 4, transgenic
rice plants constitutively expressing TlOsm, OsOlp1-A, OsOlp1_I and Gus-reporter
gene as control were generated. This chapter investigated the response of these rice
plants under different stress and unstressed conditions.
The first aim was to validate if constitutive expression of TlOsm in rice confers
tolerance to drought, salinity and cold stresses. Secondly, OsOlp1-A and OsOlp1_I
were isolated from drought-tolerant and -sensitive cultivars Apo and IR64,
respectively. The two genes encode two proteins containing high (96%) homology at
the AA sequence level but are differentially expressed upon drought; only OsOlp1-A
is induced by drought. Functional predictions based on sequences and structures of
these three osmotins revealed different number of glucan-binding and phosphorylation
sites among them. Thus, comparatively analysing rice plants expressing these three
osmotins might reveal the key insights into osmotin functions and effects of functional
binding sites on enhancing plant stress tolerance. To date, only one study by Mani et
al. (2012) compared two Piper colubrinum osmotins, which are different in five
glucan-binding sites, on their differential antifungal activities. According to the study,
the two osmotin isoforms differ in 50 AA that results in disorder in domains I and III
and less glucan-binding sites in the smaller isoform (22 sites in the larger isoform vs.
17 sites in the smaller one). Both isoforms were transcriptionally expressed by
pathogen, wounding, jasmonic acid, and ethylene. However, recombinant protein of
smaller isoform displayed much less activity against Phytophthora capsici and

142 Chapter 5: Comparative Analysis of Transgenic Rice Constitutively Expressing Osmotins from Tolerant and
Sensitive Species
Fusarium oxysporum as compared to the larger isoform in in vitro conditions. The loss
of antifungal activity of the smaller isoform was presumably due to the disorder in
domain I and III. Thus, this study extended the possible effects of glucan-binding sites
of osmotins on their functions in regulating plant response to abiotic stresses including
cold, drought, and salinity. Thirdly, it has been proposed that genes from highly stress
tolerance species would provide more level of tolerance over those of stress sensitive
species. Additional glucan-binding and phosphorylation sites together with unique
functional sites in sugar metabolism were found in TlOsm compared to rice osmotins.
Some stress-responsive proteins of resurrection plant have been demonstrated to
maintain phosphorylation reaction during desiccation and this reaction has been
believed to be required for cellular protection during desiccation tolerance (Rohrig et
al., 2006; Dinakar and Bartels, 2013). Thus, high number of phosphorylation sites of
TlOsm might contribute to its function in regulating plant adaptive response.
Furthermore, accumulation of soluble sugars at remarkably high levels during
desiccation tolerance is a distinct characteristic of resurrection plants (Alpert and
Oliver, 2002; Dinakar and Bartels, 2013; Gaff and Oliver, 2013). The unique binding
sites with potential functions in sugar metabolism of TlOsm might be beneficial for
its modulation of plant stress response. Hence, analysing the advantage in abiotic stress
response of TlOsm expressing plants over OsOlp1-A or OsOlp1_I expressing plants
was also included in this study.
5.4.1 TlOsm and OsOlp1_A confers tolerance to cold, drought and salinity stresses
in rice
Previous studies have indicated that the effects of cold, drought, and salinity
stresses are more severe to rice when they occur at seedling stage, before tillering, and
at the transition between growth stage and reproductive stage (Lafittle et al., 2004; Das
et al., 2015). Therefore, these two stages were chosen for the assessments in this study.
Throughout the stress experiments, the control plants, NT or WT of rice Nipponbare
cultivar exhibited severe growth reduction, less tillering, leaf senescence and dry,
reduced leaf water retention, severe membrane damage, photosynthesis inhibition,
decreased survival rate, reduced panicle number and length, less spikelets, inadequate
grain filling, and reduced seed weight. The severe effects of salinity, drought, and cold
stresses on rice growth and reproductivity were sharply improved by expressing either
TlOsm or OsOlp1_A in the same rice cultivar. The only difference among the transgenic

Chapter 5: Comparative Analysis of Transgenic Rice Constitutively Expressing Osmotins from Tolerant and
Sensitive Species 143
plants were the genes they express; while WT and NT differed from transgenic plants
by the absence of transgenes. Thus, the enhanced tolerance to cold, drought, and salinity
stresses of TlOsm and OsOlp1_A plants must be a consequence of TlOsm or
OsOlp1_A functions. Moreover, the enhanced stress tolerance of TlOsm and
OsOlp1_A plants was constant through two successive generations of transgenic rice,
the T0 and T1, suggesting that the tolerant traits were passed on next generations.
Shoot growth, tillering, dry biomass, number of panicle per plants, number of
spikelets, and percentage of filled seeds per panicle were all found to directly
contribute to final grain yield of rice. These parameters together with survival rate and
plant overall health were recommended as effective parameters to evaluate abiotic
stress tolerance in rice (Singh et al., 2013). Regardless of transgenic generation and
developmental stages on which stresses applied, as compared to VC and WT or NT,
TlOsm and OsOlp1-A plants constantly maintained significantly higher shoot growth
(Figure 5.1) and produced greater number of tillers (Figure 5.2) under cold, drought,
and salinity conditions. As a result of higher growth and tillering, dry biomass of
TlOsm and OsOlp1-A plants was significantly higher than that of VC and WT or NT
(Table 5.2 & 5.3). The purpose of investigating stress response at seedling stage was
to observe the survival ability of plants after certain period of stresses and their
recovery capability. Under all cold, drought, and salinity stresses, the survival rate of
TlOsm and OsOlp1_A plants was by far higher than of the VC and WT plants. The
recovered TlOsm and OsOlp1_A plants were taller, greener and had more tillers than
the VC and WT plants (Figure 5.10). In the case of cold stress, the percentage of plants
recovered without the infertile tillers was improved in TlOsm and OsOlp1_A plants,
which would further reduce yield loss in cold stressed plants. Rice was found more
tolerant to abiotic stress at the tillering stage (Singh et al., 2010). Thus, the same
concentration of NaCl stress and mild drought applied at the tillering stage on T1
generation of transgenic rice did not cause plant death but ultimately caused severe
reduction on grain yield. Once again, this severe grain yield reduction was significantly
improved when expressing either TlOsm or OsOlp1-A in the same rice cultivar (Table
5.4). Taken all together, the results from these experiments proved that TlOsm and
OsOlp1_A confer tolerance to cold, drought, and salinity stresses. In the same genetic
background of Nipponbare cultivar for all tested plants, the tolerance to cold, drought,
and salinity stresses was enhanced in only TlOsm and OsOlp1_A plants. Thus, the
144 Chapter 5: Comparative Analysis of Transgenic Rice Constitutively Expressing Osmotins from Tolerant and
Sensitive Species
tolerance of TlOsm and OsOlp1_A plants must be a consequence of TlOsm or
OsOlp1_A expression. Results here demonstrated that both TlOsm and OsOlp1_A
played key roles in the tolerance to cold, drought, and salinity stresses in rice.
Intensive studies on transgenic plants expressing osmotins have proven the
physiological functions of osmotins in plant tolerance, but little is known about how
osmotins regulate plants tolerant to abiotic stresses. For example, tolerance to cold
stress of transgenic tomato expressing tobacco osmotin was accompanied by
increasing transcript abundance of some stress responsive genes such as transcription
factor (CBF1), osmotic adjustment (P5CS), and ROS scarvenger (APX) and the
accumulation of osmoprotectants proline and antioxidant ascorbate (Patade et al.,
2013). Drought tolerance of soybean expressing osmotin from Solanum nigrum was
associated with increased leaf water retention and maintained photosynthesis activities
(Weber et al., 2014). Similarly, enhanced salinity tolerance of transgenic chili pepper
expressing tobacco osmotin was linked to increased chlorophyll content, osmolyte
accumulation, antioxidant enzyme activities, and water retention, and decreased
membrane damage (Subramanyan et al., 2011). Generally, cold, drought, and salinity
tolerance of other transgenic osmotin plants were associated with molecular,
biochemical, and physiological changes. Molecular changes are linked to the
transcriptional activation of stress responsive genes, which function as transcription
factor, ROS scarvenger, and osmoprotectants (Patade et al., 2013). Biochemical
changes are associated with accumulation of osmolytes and non-enzymatic
antioxidants, increased activities of antioxidative enzymes, and higher chlorophyll
content (Husaini and Abdin, 2008; Goel et al., 2010; Subramanyam et al., 2011; Das
et al., 2011; Subramanyam et al., 2012; Patade et al., 2013; Bhattacharya et al., 2014;
Annon et al., 2014; Weber et al., 2014). Regardless the source of osmotins and plant
species expressing osmotins, in these studies the common physiological alterations in
osmotin expressing plants include increased water retention, maintain membrane
integrity, and maintain photosynthesis activities. Based on these changes of osmotin-
expressing plants, it has been proposed that osmotins function as a regulator in stress-
signalling pathway that modulates the expression of downstream stress-responsive
genes leading to accumulation of adaptive compounds and resulting in stress-adaptive
physiological traits (Husani and Rafiqi, 2012; Viktorova et al., 2012; Kumar et al.,
2015). Although molecular and biochemical changes were not measured in TlOsm and

Chapter 5: Comparative Analysis of Transgenic Rice Constitutively Expressing Osmotins from Tolerant and
Sensitive Species 145
OsOlp1_A plants, the physiological changes in rice plants expressing TlOsm and
OsOlp1_A were in agreement with those reported for other osmotin-expressing
plants. Therefore, we would expect TlOsm and OsOlp1_A to have similar functions
in regulating plant stress response, as other osmotins.
To the extent of this study, the levels of enhanced rice stress tolerance
positively correlated with the number of glucan-binding sites of osmotins they
expressing. TlOsm has the highest number of potential glucan-binding, 8 sites (Table
3.2) and TlOsm plants showed the highest level of stress tolerance. As compared with
OsOlp1_I, OsOlp1_A has three more glucan-binding sites (five for OsOlp1_A
vs. two for OsOlp1_I). As shown throughout the study, OsOlp1_A plants
significantly improved tolerance to cold, drought, and salinity stresses over OsOlp1_I
plants. It is accepted that glucan-binding residues around acidic cleft of osmotin
structure are required for osmotin antifungal activities (Prasath et al., 2011; Mani et
al., 2012). However, in plant abiotic stress response, osmotin functions linked with the
glucan-binding and hydrolysing activities remain to be elucidated. The responses of
transgenic rice expressing each of the three osmotins to cold, drought, and salinity
stress revealed from this study highlight a correlation of the number of glucan-binding
sites of osmotins and their efficacy in enhanced rice tolerance to cold, drought, and
salinity stress.
5.4.2 Retaining water, maintaining membrane integrity, and maintaining
photosynthesis activities are some strategies TlOsm and OsOlp1_A plants
used to cope with cold, drought, and salinity stresses.
Unlike drought condition where water is unavailable in root zone for plants to
uptake, in cold and salinity stress, water is available in root zone but the physiological
changes and the ion toxicity lead to the restriction of water-uptake ability of plants and
resulted in reduced cellular water potential. The common consequences of plants
exposed to cold, drought and salinity are cellular osmotic stress (Huang et al., 2012).
However, the stress-adaptive plants are able to cope with stresses by regulating
osmotic adjustment (Xiong and Zhu, 2002). RWC has been identified as a useful
measurement of plant water status in terms of the physiological consequence of
cellular water deficit, due to both leaf water potential and osmotic adjustment ability
are considered in the measurement (Gonzalez and Gonzalez-Vilar, 2001). In these
experiments, rice plants exposed to all cold, drought and salinity stresses either at

146 Chapter 5: Comparative Analysis of Transgenic Rice Constitutively Expressing Osmotins from Tolerant and
Sensitive Species
seedling or reproductive stage resulted in sharp decrease of leaf RWC. TlOsm- or
OsOlp1_A- expressing tissues had significantly higher RWC than those of WT and VC
under these stresses (Figure 5.3), indicating that they have better strategy for retaining
water in their tissues under osmotic stress. Ability to maintain water under stress has
been considered as an advantage trait for selection of rice cultivars tolerant to osmotic
stress (Cha-um et al., 2009; Dionisio-Sese and Tobita, 1998; Kim et al., 2012; Zhang
et al., 2014). Osmotic adjustment for retaining cell water under osmotic stress seems
to be one of the physiological mechanisms TlOsm and OsOlp1_A plants used to cope
with osmotic stress. Thus, functions of TlOsm and OsOlp1_A are likely linked with
the regulation of osmotic adjustment. In coping with osmotic stress, adaptive plants
use osmolytes in water replacement, glass formation, and chemical stability for
protection of biomolecules and osmotic adjustment (Agarwal et al., 2013). Proline is
one of the osmolytes repeatedly found to accumulate in osmotin-expressing plants.
The gene encoding a proline synthetic enzyme, the ∆1-Pyrroline 5 - Carboxylate
Synthase (P5CS), was found to be sharply activated in cold tolerant tomato expressing
tobacco osmotin (Patade et al., 2013). Hence, it is in agreement with reported functions
of osmotins that TlOsm and OsOlp1_A mediate osmotic adjustment in osmotic-
stress-exposed rice leading to higher water retention.
The cell membrane is the primary site for perception of environmental stress
signals. Under osmotic stress, plant cells generate excessive ROS production that
facilitates lipid peroxidation, resulting in membrane damage and further loss of cell
membrane integrity. One of the mechanisms plants adapted to stresses is developing a
number of changes to maintain the membrane intact (Mansour, 2013). The ability of
maintaining membrane integrity has been considered a key to conferring tolerance to
cold, drought and salinity stresses in plants (Manavalan and Nguyen, 2012; Shabala
and Munns, 2012; Zhang et al., 2014). Monitoring electrolyte leakage has been
commonly used to reflect the level of membrane damage (Bajji et al., 2002). In rice,
measurement of leaf electrolyte leakage has been used as characteristic to screen the
stress tolerant cultivars with lower electrolyte leakage indicating higher stress
tolerance (Cha-um et al., 2009; Dionisio-Sese and Tobita, 1998; Kim et al., 2012;
Zhang et al., 2014). In this study, electrolyte leakage was measured from leaves of
TlOsm, OsOlp1_A, OsOlp1_I, VC, and WT or NT plants exposed to cold, drought and
salinity stresses at seedling stage and to drought and salinity stresses at reproductive

Chapter 5: Comparative Analysis of Transgenic Rice Constitutively Expressing Osmotins from Tolerant and
Sensitive Species 147
stage. Regardless of stress types, TlOsm and OsOslp1_A plants had significantly lower
electrolyte leakage values as compared with the control plants (Figure 5.4). These
results indicated that leaf cells of TlOsm and OsOslp1_A plants maintain higher
membrane integrity than their control counterparts under all these stress conditions.
Thus, ability to maintain membrane integrity is likely to be another physiological
mechanism implemented in TlOsm and OsOlp1_A rice plants, contributing to their
tolerance to cold, drought and salinity stresses. Importantly, plasma membrane damage
by osmotic stress is mostly contributed by lipid peroxidation caused by excessive ROS
(Gill and Tuteja, 2010). To inhibit lipid peroxidation and maintain membrane intact,
plants have developed a complex antioxidative defense that scavenges stress-induced
ROS. The antioxidative defense is governed by non-enzymatic and enzymatic
antioxidants. Ascorbate is the most abundant non-enzymatic antioxidant. Ascorbate
was reported to highly accumulate in osmotin-expressing plants, and enzyme involved
in ascorbate biosynthesis (APX) was found activated in osmotin-expressing plants
(Subramanyam et al., 2012; Patade et al., 2013). Similarly, membrane integrity of
osmotin-expressing plants exposed to stresses has been demonstrated as consequence
of lipid peroxidation inhibition resulted from increased activities of antioxidative
enzymes such as APX, CAT, DHAR, MDHAR, and SOD (Parkhi et al., 2009;
Bhattacharya et al., 2014; Annon et al., 2014). Therefore, maintenance of membrane
integrity in TlOsm and OsOlp1_A plants is probably resulted from an effective ROS
scavenge mediated by TlOsm and OsOlp1_A.
Photosynthesis is a basic biological process plants use to produce all sources of
energy for their living activities. Abiotic stress factors such as drought and salinity
cause damage to photosynthetic machinery and result in photosynthesis inhibition
(Kreslavski et al., 2013). Maintenance of photosynthetic activities under stresses is a
desired trait of stress adaptive plants to produce energies necessary to maintain growth
and reproduction (Manavalan and Nguyen, 2012). Under the same period of exposing
to 100 mM NaCl or withholding water, photosynthesis activities of TlOsm and
OsOlp1_A plants lasted longer than of VC and NT plants (Figure 5.5), suggesting that
maintenance of photosynthetic activities is one of the strategies TlOsm and OsOlp1_A
plants used to overcome adverse growth reduction affected by drought and salinity
stresses and ultimately contribute to their higher dry biomass. The disturbance of
photosynthesis activities in plant response to stresses is mainly due to the disturbance
148 Chapter 5: Comparative Analysis of Transgenic Rice Constitutively Expressing Osmotins from Tolerant and
Sensitive Species
of stomatal regulation (Shabala and Munns, 2012). In plants, stomata are specialized
cells performing gas exchange that regulates the diffusion of CO2 for photosynthetic
activities and water loss through transpiration. When leaf water potential decreases,
stomata close (Brodribb and Holbrook, 2003). Changes in stomatal aperture when
exposed to osmotic stresses have been a reliable measurement for evaluating whole
plants response to stresses. (Shabala and Munns, 2012). Data in these experiments
showed that, stomatal conductance of VC and NT plants dramatically decreased after
6 days exposure to 100 mM NaCl or withholding water (Figure 5.6). The rapid
decrease of stomata conductance in VC and NT plants was positively correlated with
the reduction of net photosynthesis and transpiration rate (Figure 5.5 & 5.7).
Constitutively expressing TlOsm or OsOlp1_A caused rice plants reduced stomatal
conductance in unstressed conditions but prevented its rapid reduction in drought and
salinity stresses, suggesting that functions of TlOsm and OsOlp1_A in stress
response are related to stomatal regulation. Lower transpiration rate of TlOsm and
OsOlp1_A plants in unstressed conditions and early stage of stress exposure seems to
be contributed to their higher leaf water retention. Maintenance of photosynthesis has
been highlighted as an advanced physiological trait of TbOsm mulberry tolerant to
drought salinity (Das et al., 2011), SnOsm soybean tolerant to salinity, and TbOsm
soybean tolerant to drought (Weber et al., 2014). In these studies, the maintained
photosynthesis was believed to be the result of higher chlorophyll content in osmotin-
expressing plants. The results from our study indicated that the maintained
photosynthesis activities and water balance in TlOsm and OsOlp1_A plants were
associated with stomatal regulation. Thus, the role in stomatal regulation was
highlighted for TlOsm and OsOlp1_A.
5.4.3 TlOsm plants showed advantages over OsOlp1_A plants in drought and cold
stresses, not in salinity stresses
TlOsm was isolated from desiccation tolerant species T. loliiformis and was
shown to be rapidly induced to very high levels by cold, drought and salinity (Chapter
3). OsOlp1_A was isolated from drought tolerant cultivar of drought sensitive species
O. sativa and shown to be activated by drought but information on its response to cold
and salinity stresses was not available. Evaluation of transgenic TlOsm and OsOlp1_A
rice plants together with their control counterparts under cold, drought and salinity
stresses at seedling stage on T0 generation and under drought and salinity stresses at

Chapter 5: Comparative Analysis of Transgenic Rice Constitutively Expressing Osmotins from Tolerant and
Sensitive Species 149
reproductive stage on T1 generation constantly showed the significant improved stress
tolerance of TlOsm and OsOlp1_A plants. These data demonstrated that both TlOsm
and OsOlp1_A are positively involved in enhancing plant stress tolerance. These
data also showed that the stress tolerance of TlOsm and OsOlp1_A plants was passed
on the next generation. In comparison between TlOsm and OsOlp1_A plants in all the
measured parameters, the performance of TlOsm and OsOlp1_A plants in salinity
stress was undistinguishable except for the RWC at day 18 of reproductive stage stress
treatment. In drought conditions, TlOsm plants showed superior to OsOlp1_A plants
in most of the measured parameters. Cold stress at seedling stage caused more severe
damage to OsOlp1_A leaf cells, as measured by electrolyte leakage (Figure 5.4), more
reduction in dry biomass (Table 5.1), and produced more infertile tiller than to TlOsm
plants. Thus, TlOsm plants exhibited more advantages than OsOlp1_A plants in cold
stress response. The overlap in plant response to cold, drought and salinity stresses is
osmotic adjustment. As discussed in Chapter 3, TlOsm seems not directly involved in
ion stress at later phase of salt stress but likely to be in regulation of osmotic response
because the gene was not up-regulated at later stage of salt stress. Effective osmotic
adjustment allow plants to maintain cellular turgor when tissue water potential
declines, maintain stomatal conductance and photosynthesis at lower water potentials,
delay leaf senescence and death, reduce flower abortion, and improve plant growth
(Manavalan and Nguyen, 2012). TlOsm and OsOlp1_A are likely to have similar
functions in osmotic adjustment of plants. However, data resulting from the
experiments on TlOsm and OsOlp1_A plants suggested that osmotic adjustment in
TlOsm plants is more efficient than in OsOlp1_A plants. Based on the functional
prediction (Table 3.2), TlOsm has more than OsOlp1_A three glucan-binding and
48 phosphorylation sites, and distinct four active residues of enzymes involved in
carbohydrate metabolism. The more effective osmotic adjustment of TlOsm plants
over OsOlp1_A plants is probably a functional consequence of these additional active
residues of TlOsm. The remained question is whether these three types of residues all
contribute to the more effective functions of TlOsm.
5.4.4 OsOlp1_I did not sufficiently enhance rice plants tolerance to cold, drought,
and salinity stresses
OsOlp1_I was found different with OsOlp1_A in only 10 AA in its protein
sequence but the OsOlp1_I was isolated from drought sensitive cultivar IR64.

150 Chapter 5: Comparative Analysis of Transgenic Rice Constitutively Expressing Osmotins from Tolerant and
Sensitive Species
Additionally, transcripts of OsOlp1_I was not induced by drought stress. As compared
with VC and WT or NT plants, transgenic plants expressing OsOlp1_I did show some
slight enhancements in some parameters such as shoot growth, RWC, electrolyte
leakage, survival rate, and dry biomass but the patterns were not consistent throughout
the generations, types of stresses, and the stages that stresses applied. Importantly, grain
yield components, the target for rice improvement under stresses and the ultimate
outcome necessary in rice stress tolerance, were not found improved in OsOlp1_I plants
(Table 5.4). It has been demonstrated in rice that genes involved in stress tolerance at
seedling stage are not necessarily involved in tolerance at reproductive stage (Sankar et
al., 2011). OsOlp1_I might contribute to rice response to cold, drought, and salinity
stresses at growth phase but its contribution was not very sufficient to be detectable in
some measurements. In addition, during the adaptation process to a given environment,
plants that are insufficient to reproduce will not be able to thrive and will not considered
adaptive (Rosa et al., 2009). High proportion of OsOlp1_I spikelets was infertile when
plants exposed to drought and salinity stresses and that resulted in low percentage of
filled seeds. Even though OsOlp1_I plants produced more panicles than NT and VC
under drought and salinity stresses, the total productive seeds per plant were not
improved due to very high proportion of sterile spikelets. Seed weight of OsOlp1_I
plants was similar as those of NT and VC plants. These results pointed out that OsOlp1_I
did not confer tolerance in transgenic rice. Disregard its high sequence identity to
OsOlp1_A, OsOlp1_I did not confer tolerance to cold, drought, and salinity stresses.
Thus, activation by certain stress of a gene provides better indication for the involvement
of the gene to that stress. Moreover, three lesser glucan-binding sites and one changed
phosphorylation site as compared to OsOlp1_A would account for the lower functions
of OsOlp1_I in plant stress response.
5.4.5 Low stomata conductance is possibly a cause of growth penalty of TlOsm
plants under unstressed conditions.
Rice plants constitutively expressing TlOsm had similar morphology and
tillering capacity to control plants under unstressed conditions (Figure 5.2 & 5.8). The
ripened seeds were harvested from all nine independent lines grown in glasshouse
conditions and germinated normally, indicating that rice plants expressing TlOsm were
fertile. However, relative to control plants, in all three sets of plants under unstressed
conditions, growth rate of TlOsm plants was significantly slower (Figure 5.1), which

Chapter 5: Comparative Analysis of Transgenic Rice Constitutively Expressing Osmotins from Tolerant and
Sensitive Species 151
further resulted in less dry biomass (Table 5.2 & 5.3), reduced panicle length, and seed
weight (Table 5.4) that affected grain yield. Analysis of photosynthesis efficiency
under unstressed conditions clearly indicated that net photosynthesis, stomatal
conductance, and transpiration rate were all significantly lower in TlOsm plants.
Therefore, low stomatal conductance leading to low CO2 diffusion and resulting in low
net photosynthesis seems to be one of the possible causes for growth penalty of TlOsm
plants under unstressed conditions. There may be other causes related to energy uses
for osmotic adjustment contributing to this growth penalty in TlOsm plants and need
to be further explored. Despite the shorter panicle length, number of seeds per panicle
was not reduced in TlOsm plants, as compared with the controls suggesting that
constitutive expressing TlOsm did not alter the seed number determination. However,
the yield penalty of TlOsm plants was from the smaller seeds and lower seed weight.
It was not validated in this study but TlOsm contains potential four binding sites,
which function in breaking down high molecular-weight sugars into smaller molecules
(Table 3.2). Using soluble sugars for stress adaptation was found to be an effective
strategy in plants (Rosa et al., 2009). Resurrection plants have been found to
accumulate noticeably high level of soluble sugar for desiccation tolerance (Alpert and
Oliver, 2002; Dinakar and Bartels, 2013; Gaff and Oliver, 2013). Thus, TlOsm might
be involved in sugar metabolism to produce soluble sugars for stress adaptation that
resulted in less starch accumulation and led to smaller seed weight. However, this
assumption needs to be validated by an appropriate measurement. Similar trend was
observed in T1 OsOlp1_A plants but the lower stomatal conductance was not always
detected, which makes it difficult for an obvious explanation. A similar growth penalty
was reported in transgenic mulberry constitutively expressing tobacco osmotin (Das
et al., 2011). However, plants expressing the same gene under stress-inducible
promoter did not exhibit growth reduction in unstressed conditions. While other causes
of growth penalty in TlOsm plants need to be further exploited, the growth reduction
of transgenic TlOsm (or OsOlp1_A) plants in unstressed conditions may be improved
with the use of stress inducible promoter.
It has been known that stress tolerance in plants is a multi-genetic trait
regulated by various molecular, biological and physiological processes (Sairam and
Tyagi, 2004). However, recent studies have revealed a large overlap of genes function
in plant stress signalling pathways enable some genotypes tolerate to multiple stress

152 Chapter 5: Comparative Analysis of Transgenic Rice Constitutively Expressing Osmotins from Tolerant and
Sensitive Species
factors (Manavalan and Nguyen, 2012; Shabala and Munns, 2012). Two strategies
have been suggested for genetic engineering rice with improved multi-abiotic stress
tolerance: (1) incorporating a key regulator in common stress signalling pathways or
(2) combining a whole QTL of important tolerant traits into elite rice cultivar (Babu,
2010; Swamy and Kumar, 2013). The limited number of genes that can be engineered
into single genotype has made it difficult to combine whole QTL into one elite
genotype (Atkinson and Urwin, 2012; Halpin, 2005; Mittler, 2006). Thus, seeking
genes confer tolerance to multiple abiotic stresses holds a great promise for improving
rice multi-abiotic stress tolerance that further ensures sustainable rice productivity
under projected adverse climate conditions (Babu, 2010). Investigations in this study
showed that tolerance of rice plants to cold, drought, and salinity stresses was
significantly enhanced by expressing either TlOsm or OsOlp1_A, with a higher level
of tolerance achieved in TlOsm expression. These results indicated the key functions
of TlOsm and OsOlp1_A in enhancing plant tolerance to multi abiotic stress factors
and highlight the potential of these genes for future uses in improvement of crops
tolerance to cold, drought and salinity.
In conclusion, this chapter details the investigations in abiotic stress response of
transgenic rice plants expressing osmotin genes (TlOsm, OsOlp1_A and OsOlp1_I)
from stress tolerant and sensitive species (T. loliiformis vs. O. sativa). In contrast to
VC and WT plants, TlOsm and OsOlp1_A plants displayed enhanced tolerance to cold,
drought, and salinity stresses. This enhanced tolerance was demonstrated by
maintained shoot growth and tillering capacity that resulted in higher dry biomass,
survival rate, and grain yield than the control plants in exposure to the stresses. The
highest level of tolerance was found in TlOsm plants. The enhanced stress tolerance of
OsOlp1_I (identified from drought sensitive cultivar) was not sufficient due to few
differences in compared with VC and WT plants and no yield improvement of
OsOlp1_I plants. Tolerance of TlOsm and OsOlp1_A plants to cold, drought and
salinity was found related to abilities to retain water, to maintain cell membrane
integrity, and to maintain photosynthesis activities. The functions of TlOsm and
OsOlp1_A were found associated with the regulation of osmotic adjustment,
membrane protection, and stomatal movement. Importantly, the results pointed out a
positive correlation between levels of stress tolerance and the number of active glucan-
binding sites in the osmotin protein structures that rice plants expressing. The results

Chapter 5: Comparative Analysis of Transgenic Rice Constitutively Expressing Osmotins from Tolerant and
Sensitive Species 153
also highlighted the additional effects of osmotin from tolerant species (TlOsm) in
enhanced rice tolerance to cold and drought stresses, as compared with osmotin from
sensitive species (OsOlp1_A). The molecular characteristics associated with the
functions of these three osmotins will be investigated in the next chapter. The results
in this study demonstrated the roles of TlOsm and OsOlp1_A in osmotic stress
tolerance and highlighted the potential for their uses in developing crops tolerance to
multiple abiotic stresses including cold, drought, and salinity. However, what needed
in sustaining crop productivity for future food demand is a generation of crops that has
high yield potential and adapted to adverse climate conditions. Hence, osmotic stress
tolerance by lower stomatal conductance is not a desired trait due to its effects on
productivity under unstressed conditions. The growth and yield penalty of TlOsm and
OsOlp1_A plants in this study is probably a consequence of constitutively expressing
the transgenes. For a practical use of TlOsm and OsOlp1_A, an inducible expression
should be considered to minimize the effects on plant growth and productivity under
unstressed conditions.

154 Chapter 5: Comparative Analysis of Transgenic Rice Constitutively Expressing Osmotins from Tolerant and
Sensitive Species

Chapter 6: Analysis of Protein-Protein Interactions of Osmotins from Stress Tolerant and Sensitive Species 155
Chapter 6: Analysis of Protein-Protein
Interactions of Osmotins from
Stress Tolerant and Sensitive
Species
In Chapter 3, the comparison of potential functional binding sites of TlOsm
from stress tolerant species (T. loliiformis) with two osmotins, OsOlp1_A and
OsOlp1_I, from sensitive species (O. sativa) indicated TlOsm contained more
potential glucan-binding and phosphorylation sites, followed by OsOlp1_A and
lowest in OsOlp1_I. In Chapter 5, assessment of transgenic rice plants expressing
TlOsm, OsOlp1_A or OsOlp1-I under cold, drought, and salinity stresses confirmed
functional roles of TlOsm and OsOlp1_A in enhancing rice tolerance to cold,
drought, and salinity stresses. Notably, plants expressing TlOsm were more stress
tolerant. Osmotic stress tolerance levels in transgenic rice were found to be correlated
with numbers of predicted functional sites of osmotins that rice plants expressing.
Functions of TlOsm and OsOlp1_A in enhanced rice stress tolerance were
demonstrated to be associated with the abilities to retain water, maintain membrane
integrity and photosynthesis efficiency. These data suggest that the functional sites in
osmotins contribute to the regulation of plant stress tolerance and that osmotin from
stress tolerant species (TlOsm) have increased efficacy. Thus, an understanding of
the protein binding complexes formed by these osmotins will provide the key
information for the elucidation of the molecular mechanisms underlying their
functions. This chapter aimed to identify potential plant proteins interacting with three
target osmotins and possible stress responsive pathways involving them.
6.1 INTRODUCTION
Biological processes are driven by protein-protein interactions and the functional
properties of many proteins are determined by their respective protein-protein
interactions (Hu et al., 2005). Therefore, the study of protein-protein interaction can
provide insight into the biological functions and complex cellular networks of protein
with unknown functions (Fukao, 2012). The laborious and time-consuming procedures
associated with protein studies in the past have limited the discovery of gene functions

156 Chapter 6: Analysis of Protein-Protein Interactions of Osmotins from Stress Tolerant and Sensitive Species
at protein levels (Hu et al., 2011). The recent availability of advanced technologies
enables unprecedented options for high-throughput identification of protein-protein
interactions and visualisation of protein-protein interactions in living cellular
environment. Various studies using protein microarrays have indicated the
Arabidopsis protein microarray as an excellent platform for high throughput screening
the plant proteins interacting with a given protein (Popescu et al., 2007a; Popescu et
al., 2007b; Popescu et al., 2009). The protein-protein interactions in living cells can
be directly visualised by bimolecular fluorescence complementation (BiFC) analysis
(Kerppola, 2013). These advances offer a valuable complement to unravel biological
functions for the proteins of interest.
Osmotins are a class of pathogenesis-related proteins that play key roles in both
abiotic and biotic stress responses of plants. However, the mechanisms underlying
their functions in plant stress responses remain to be elucidated due to the lack of
information in their protein interactive partners and pathways. Numerous studies
have been carried out on osmotins, but to date only few interactive partners of
osmotin have been revealed. One of the major limitations for direct study osmotin
protein is the difficulties associated with producing recombinant osmotins. Osmotin
has been known for its hydrophobicity, anti-microbial property and the presence of
8 disulfide bonds in its structure that have made it difficult for expressing in
microbial system with proper folding of resulted proteins. The current protocols for
recombinant osmotin production in microbial system require targeting osmotin in the
inclusion bodies, denaturing osmotin during protein extraction and refolding the
protein (Campos et al., 2008; Tzou et al., 2011). However, with 8 disulfide bonds in
the structure, the refolding osmotin is a difficult step accompanied with limited
protein yield upon water-insoluble of the hydrophobic protein. These limitations
would be overcome by the progresses of genetic manipulation and protein expression
system (discussed in Section 1.6.2). For the ultimate purpose of functionally
characterising TlOsm, we compared the predicted functional sites of TlOsm with
two rice osmotins and demonstrated the roles of TlOsm and OsOlp1_A in
enhanced rice tolerance to cold, drought, and salinity stresses (in Chapter 3 and 5).
This study aimed to gain insights into functions and pathways of these osmotins via
their interactive partners and biological networks involving their interactive protein
partners.

Chapter 6: Analysis of Protein-Protein Interactions of Osmotins from Stress Tolerant and Sensitive Species 157
The objectives of this study were set as follows:
1. Produce and purify functional recombinant osmotins (TlOsm, OsOlp1_A,
and OsOlp1_I).
2. Identify potential protein partners by Arabidopsis protein chip assays.
3. Identify biological pathways that play role in osmotin functionalities.
4. Validate interactions of the three osmotins with Arabidopsis stress-responsive
proteins in planta.
6.2 MATERIALS AND METHODS
6.2.1 Plant materials
Nicotiana benthamiana plants were used for both transient expression of
recombinant osmotins and co-expression of osmotins with their putative Arabidopsis
interactive protein partners in the BiFC analysis. Plants were germinated, grown, and
prepared for Agro-infiltration as described in Section 2.1.2.3.
6.2.2 Plasmid vectors
6.2.2.1 Plasmid vectors for expressing recombinant osmotins
The plasmid pEAQ-TlOsm, pEAQ-OsOlp1-A, and pEAQ-OsOlp1-I were used
for producing recombinant osmotins. In these plasmids, osmotins were tagged with
different elements necessary for high protein production, purification, and detection of
protein-protein interaction on protein microarrays. The gene expression cassettes of
these plasmids are shown in Figure 6.1. Generally, the tagged osmotins are driven by
the CaMV 35S promoter and the Nos terminator and placed within the Cowpea Mosaic
Virus 5’ upstream translational enhancer. The P19 gene under control of the CaMV
35S promoter and terminator used for suppressing of gene silencing, which is usually
faced in plant transiently expressing of foreign genes. The NptII gene under regulation
of the Nos promoter and terminator was plant selectable marker against kanamycin
antibiotic. The methods used for constructing these plasmid are described in Section
2.2.1.

158 Chapter 6: Analysis of Protein-Protein Interactions of Osmotins from Stress Tolerant and Sensitive Species
Figure 6.1 Schematic diagram of gene expression cassettes for transiently expressing
tagged osmotins in N. benthamiana. LB: left border, RB: right border
6.2.2.2 Plasmid vectors for detection of protein-protein interactions
Plasmids with the gene expression cassettes shown in Figure 6.2 were used in
the BiFC assay for detecting protein-protein interaction in planta. The TlOsm,
OsOlp1_A and OsOlp1_I genes were fused at their protein C-terminus with a DNA
fragment encoding half molecule of EYFP from N-terminus to AA 174. Five
Arabidopsis genes AtCPK4, AtCPK5, AtMS1, AtALDH7B4, and AtPER42 were fused
at their protein C-terminus with a DNA fragment encoding half molecule of EYFP
from AA 175 to the end of protein molecule. The Tobacco Etch Virus translational
enhancer was incorporated upstream of all the three osmotins and five Arabidopsis
genes. The fused genes together with the enhancer were driven by the tandem CaMV
35S promoter and terminator. Details of methods used for constructing these plasmids
were presented in the Section 2.2.1.

Chapter 6: Analysis of Protein-Protein Interactions of Osmotins from Stress Tolerant and Sensitive Species 159
Figure 6.2 Schematic diagram of gene expression cassettes for detecting target osmotins
and Arabidopsis protein interaction in N. benthamiana. A) TlOsm, OsOlp1_A, or OsOlp1_I
cloned in the pE3134 destination vector; B) 5 Arabidopsis genes separately cloned in the
pE3132 destination vector. LB: left border, RB: right border
6.2.3 Protein expression in Nicotiana benthamiana
Wild type N. benthamiana plants were grown in pots in a growth chamber under
the conditions described in Section 2.1.2.3 for at least five weeks then were used for
agro-infiltration. The plant overexpression vectors pEAQ-TlOsm, pEAQ-OsOlp1-A,
and pEAQ-OsOlp1-I were separately transformed into Agrobacterium strain Alg1
using the methods described in Section 2.2.1.5. Agrobacterium Alg1 containing

160 Chapter 6: Analysis of Protein-Protein Interactions of Osmotins from Stress Tolerant and Sensitive Species
pEAQ-TlOsm, pEAQ-OsOlp1-A, or pEAQ-OsOlp1-I vectors were grown and
prepared for infiltration, and infiltrated into N. benthamiana leaves of 5-week-old
plants by the methods described in Section 2.2.3. Fifteen plants with 3 leaves (number
3-5 from the top) per plant were used for each plasmid construct and the WT control
was infiltrated with the infiltration medium. Four days after infiltration, N.
benthamiana leaves were harvested. Aliquots of approximately two grams of
infiltrated leaves were wrapped in aluminium foil, immediately frozen in liquid
nitrogen, and stored at -80 oC for protein extraction.
6.2.4 Recombinant protein extraction, purification, and enrichment
Extraction of total proteins from the frozen leaf tissues was done in 50 mM
phosphate buffer. Frozen infiltrated leaf samples were ground to a fine powder in liquid
nitrogen prior to homogenisation in 6 mL of 50 mM phosphate extraction buffer (50 mM
phosphate buffer pH 7.4, 300 mM NaCl, 10% glycerol, 0.1% Triton X-100, 1 mM PMSF
and 1x complete protease inhibitor cocktail (Sigma, St. Louise, MO, USA). Samples were
homogenised by gentle rotation at 4 oC for two hours. Cell debris was removed by
centrifugation at 4000 g at 2 oC for 5 min. Further removal of solids was performed by
centrifugation of the supernatant at 14 000 g at 4 oC for 20 min. The recombinant proteins
were enriched and purified using a three-step purification protocol described below. Each
total protein extract was pre-purified using 3 His-spin columns of His-Spin Trap Kits (GE
healthcare Life Sciences) following the manufacturer’ protocol, then eluted into 1200 mL
of elution buffer. The solution containing pre-purified proteins was incubated at 4 oC with
Protein G Mag SepharoseTM Xtra beads (GE healthcare Life Sciences) overnight with
gentle rotation. Beads with bound proteins were then washed two times with Wash buffer
(137 mM NaCl, 2.7 mM KCL, 100 mM Na2HPO4, 2 mM KH2PO4, pH 7.4). The
recombinant proteins were eluted from the beads through incubation with 12 µL (50 units)
of 3C protease (Precision protease; Amersham Biosciences) in 500 µL of cleavage buffer
(50 mM Tris HCl pH 7.0, 150 mM NaCl, 1 mM EDTA, 1 mM DTT, 0.1% Triton)
overnight in a cold room with gentle rotation. The following day, the recombinant proteins
in the cleavage were first separated from the beads, and went through the His-Spin
columns to eliminate the excess protease and other track elements. The proteins trapped
in the His-Spin columns were eluted, mixed with glycerol to a final concentration of 30%,
and stored at -80 oC. Protein concentration was determined using the Bradford assay
(Bradford, 1976).

Chapter 6: Analysis of Protein-Protein Interactions of Osmotins from Stress Tolerant and Sensitive Species 161
6.2.5 SDS-PAGE
SDS-PAGE (sodium dodecyl sulphate polyacrylamide gel electrophoresis) was
used to separate proteins. The protein extracts were run on a 12% resolving gel (dH2O
4.170 mL, 1.5 M tris pH 8.8 2.5 mL, 10% SDS 100 µL, 40% acryl/bis (29:1) 3.125 mL,
10% ammonium persulphate 100 µL and TEMED 5 µL) and 5% stacking gel (dH2O 2.916
mL, 1 M tris pH 6.8 0.5 mL, 10% SDS 40 µL, 40% acryl/bis (29:1) 0.5 mL, 10%
ammonium persulphate 40 µL and TEMED 4 µL). Gel was prepared using a Mini SDS-
PAGE gel apparatus (Bio-Rad, Hercules, CA, USA) according to the manufacturers’
protocol. Protein extracts and loading buffer were mixed in a ratio of 4:1 (v/v), followed
by a short spin and then heated for 10 min at 95 oC. A 15 µL aliquot was loaded to each
well and the gel was run for 3 h at 120 V. Coomassie blue dye was used for verification
of proteins on the SDS-PAGE gel.
6.2.6 Coomassie blue staining
The separated proteins in the SDS-PAGE gel were stained in Coomassie blue
solution (0.1% Coomassie Brilliant blue R-250, 50% methanol and 10% glacial acetic
acid) for at least 1 h with gentle agitation until the gel was in a uniform blue colour.
Gels were de-stained overnight in a 25% methanol and 10% glacial acetic acid solution
with gentle agitation until the background cleared. Images were captured using a
Cannon camera with a white light background.
6.2.7 Western blotting
After electrophoresis, proteins in the SDS-PAGE gel were transferred onto a
nitrocellulose membrane (immobilonTM; Millipore) using a mini SDS-PAGE apparatus
tank (Bio-Rad, Hercules, CA, USA). The sandwich was prepared according to the
manufacturers’ protocol, placed in the tank filled with blotting buffer (25 mM Tris, 192
mM glycine, 10% methanol) and proteins were transferred overnight at 15 V in the cold
room. The following day, the apparatus was disassembled. The membrane was blocked
using blocking buffer (TBST, 5% (v/w) skim milk powder) for 1 h with gentle shaking
on a rotate shaker. The blocking solution was discarded and 12 mL of a dilute (1:5000)
of primary antibody (mouse monoclonal anti-human c-myc unconjugated antibody)
(Invitrogen, Carlsbad, CA, USA) in 5%-skim milk TBS buffer solution was added. The
membrane was incubated overnight in the cold room with gentle agitation. Following
incubation, the membrane was washed four times with TBST buffer with gentle

162 Chapter 6: Analysis of Protein-Protein Interactions of Osmotins from Stress Tolerant and Sensitive Species
agitation, 10 min per each wash. The membrane was incubated with secondary antibody
(Goat-Anti-Mouse IgG (H+L)-HRP) (Life Technologies) diluted at a 1:20000 ratio in
5%-skim milk containing TBS solution for 1 h at room temperature with gentle agitation.
Following the incubation, the membrane was washed four times with TBST buffer with
gentle agitation, 10 min per each wash. The chemiluminescent detection assay was
performed according to the DIG (Roche) protocol.
6.2.8 Protein chip hybridisation and scanning
The high-density Arabidopsis protein microarrays (chip or slide; 5000-
AtPROTEINCHIP1) were provided by Dinesh-Kumar Laboratory (Department of
Plant Biology & Genome Centre, University of California, Davis, USA) and purchased
from the Arabidopsis Research Centre (Ohio, USA). These chips were used to identify
Arabidopsis proteins interacting with TlOsm, OsOlp1_A, and OsOlp1_I. The
protein slides stored at -80 oC were equilibrated at 4 oC by putting each slide into a 50-
ml Falcon tube with closed cap and placed in the cold room for 15 min. The slides
were blocked in PBS-T (137 mM NaCl, 2.7 mM KCl, 10 mM Na2HPO4, 1.8 mM
KH2PO4, 0.1% (v/v) Tween-20, and 1% (w/v) BSA) for 1 h. Eight micrograms of
purified recombinant osmotin in 50 mM phosphate buffer were diluted in a probing
solution (1X PBS, 5 mM MgCl2, 0.05% (v/v) Triton X-100, 5% (v/v) glycerol and 1%
(w/v) BSA) to the final volume of 250 µL. The probing solution containing each
osmotin was separately applied to each slide surface and the slide was covered by a
glass slide, incubated for 1.5 h at 4 oC. Slides were then washed 3 times with probing
solution with a gentle agitation for 10 min per each wash. The slides were incubated
with 12 mL of a dilute (1:5000) primary antibody (mouse monoclonal anti-human c-
myc unconjugated antibody) (Invitrogen) in probing solution for 2 h in the cold room.
The unbound antibody was removed from the slides by washing the slides 4 times in
probing solution with 10 min per wash on an orbital shaker. The slides were incubated
with Cy5 conjugated-Goat-anti-mouse IgG antibody (Jackson ImmunoResearch
Laboratory, Inc.) diluted in probing buffer (1:700) for 1 h at room temperature with a
gentle agitation. The slides were washed for 3 times with probing solution with a gentle
agitation for 10 min per each wash to remove the unbound secondary antibody. The
slides were then dried by draining off the washing solution and putting into a 50-mL
Falcon tube with a piece of Kimwipe tissues at the bottom of the tube. The tube
containing slide was spined for 1 min at 1000 g. Slides were stored inside the Falcon

Chapter 6: Analysis of Protein-Protein Interactions of Osmotins from Stress Tolerant and Sensitive Species 163
tube at room temperature until being scanned in the day after. Slides were scanned
using a Genepix 4300A slide scanner (Axon Instruments).
6.2.9 Identification of significant interactions
The scanned microarray images were subsequently processed following the
instruction described by Zhou-Da et al. (2008). The GenePix Pro software (Molecular
Devices, Union City, CA) was used to determine the spot intensity. A grid of circles
was placed over the protein spots on the chip. The position and size of the spots were
adjusted to be insight the circles for an accurate intensity data. For each slide, an output
file containing mean, median, and standard deviation of array spots and background
intensity was created by the program. These output files with background intensity of
each spot were subjected for analysis of significant interactions (Diez et al., 2012).
The mean, standard deviation, and standard error of the mean values were calculated
for 5210 entry names on the slides including all Arabidopsis proteins on the chip and
multiple positive and negative controls. The significant probe-binding candidates were
determined using one-sided Student’s t-test, pooled variance and 5% significance
level. All the mean values that were not significant lower than the mean values of
positive control, the RIN4-cMyc (12 spots) were considered as significant candidates
for further analysis.
6.2.10 Determination of significant protein interactors of target osmotins
The description of the Arabidopsis proteins on the chip significantly interacted with
the target osmotins was looked up through the DAVID database (Huang et al., 2009;
Sherman et al., 2007) using TAIR_ID identifier. The entire list of interactors of each target
osmotin was submitted to the Gene Name Batch Viewer tool for revealing the name of the
osmotin interactors. Gene ontology (GO) term enrichment was performed separately for
the protein sets considered to significant interacted with all three osmotins (271 proteins)
with TlOsm and OsOlp1_A (11 proteins), or with only TlOsm (21 proteins) using
agriGO web server (Du et al., 2010). The entire list of each set of interactors was submitted
to the analysis tool using Singular Enrichment Analysis (SEA). Each gene set was
enriched using a Fisher’s exact test with the Arabidopsis genomodel 9 as a reference and
biological process as a category. For statistical significance, P-values were corrected
according to Benjamini and Hochberg (1995) and a critical false discovery rate (FDR) q-
value of 0.05 was applied. The significant GO term for each protein set was summarised
and visualised by REVIGO server (Supek et al., 2011) and viewed as Treemap.
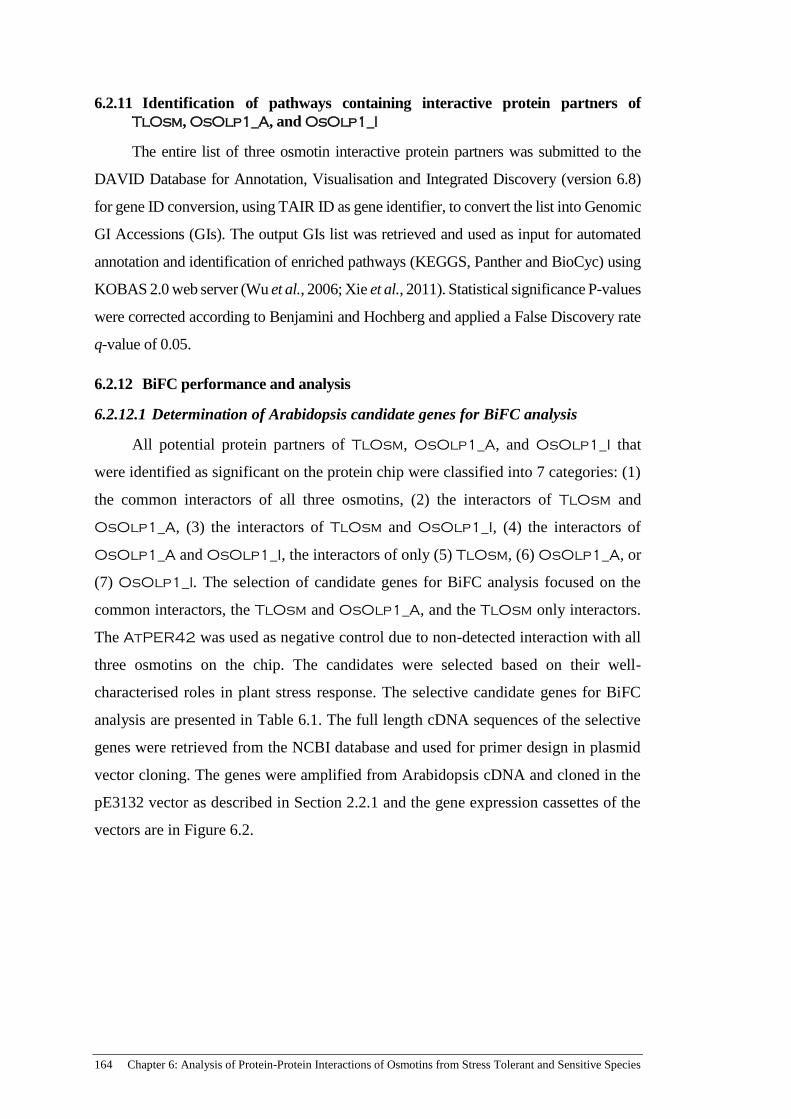
164 Chapter 6: Analysis of Protein-Protein Interactions of Osmotins from Stress Tolerant and Sensitive Species
6.2.11 Identification of pathways containing interactive protein partners of
TlOsm, OsOlp1_A, and OsOlp1_I
The entire list of three osmotin interactive protein partners was submitted to the
DAVID Database for Annotation, Visualisation and Integrated Discovery (version 6.8)
for gene ID conversion, using TAIR ID as gene identifier, to convert the list into Genomic
GI Accessions (GIs). The output GIs list was retrieved and used as input for automated
annotation and identification of enriched pathways (KEGGS, Panther and BioCyc) using
KOBAS 2.0 web server (Wu et al., 2006; Xie et al., 2011). Statistical significance P-values
were corrected according to Benjamini and Hochberg and applied a False Discovery rate
q-value of 0.05.
6.2.12 BiFC performance and analysis
6.2.12.1 Determination of Arabidopsis candidate genes for BiFC analysis
All potential protein partners of TlOsm, OsOlp1_A, and OsOlp1_I that
were identified as significant on the protein chip were classified into 7 categories: (1)
the common interactors of all three osmotins, (2) the interactors of TlOsm and
OsOlp1_A, (3) the interactors of TlOsm and OsOlp1_I, (4) the interactors of
OsOlp1_A and OsOlp1_I, the interactors of only (5) TlOsm, (6) OsOlp1_A, or
(7) OsOlp1_I. The selection of candidate genes for BiFC analysis focused on the
common interactors, the TlOsm and OsOlp1_A, and the TlOsm only interactors.
The AtPER42 was used as negative control due to non-detected interaction with all
three osmotins on the chip. The candidates were selected based on their well-
characterised roles in plant stress response. The selective candidate genes for BiFC
analysis are presented in Table 6.1. The full length cDNA sequences of the selective
genes were retrieved from the NCBI database and used for primer design in plasmid
vector cloning. The genes were amplified from Arabidopsis cDNA and cloned in the
pE3132 vector as described in Section 2.2.1 and the gene expression cassettes of the
vectors are in Figure 6.2.

Chapter 6: Analysis of Protein-Protein Interactions of Osmotins from Stress Tolerant and Sensitive Species 165
Table 6.1 Select Arabidopsis genes for BiFC analysis
TAIR ID Gene name Description Category
AT4G09570 AtCPK4 Calcium-dependent protein kinase 4 Common interactor of
all three osmotins
AT4G35310 AtCPK5 Calcium-dependent protein kinase 5
Common interactor of
all three osmotins
AT5G17920 AtMS1 5-methyltetrahydropteroyltriglutamate-
-homocysteine methyltransferase
Interactor of TlOsm
and OsOlp1_A
AT1G54100 AtALDH7B4 Aldehyde dehydrogenase family 7
member B4
Interactor of TlOsm
only
AT4G21960 AtPER42 Peroxidase 42 Negative control
6.2.12.2 Co-expression of target osmotins and Arabidopsis genes in N.
benthamiana
Five-week-old wild type N. benthamiana plants were grown in pots in a growth
chamber under the conditions described in Section 2.1.2.3. The Agrobacterium strain
Alg1 separately carrying each vector in Figure 6.2 and the pCE100_EYFP (positive
control) were grown and prepared for infiltration as method described in Section 2.2.3.
Before infiltration, equal amount of each Agrobacterium sample containing each
osmotin and each Arabidopsis gene were combined (the combinations are shown in
Table 6.2) and infiltrated into N. benthamiana leaves of 5-week-old plants by the
methods described in Section 2.2.3.

166 Chapter 6: Analysis of Protein-Protein Interactions of Osmotins from Stress Tolerant and Sensitive Species
Table 6.2 Combinations of osmotins and Arabidopsis genes used for co-expression and
BiFC analysis
N0 Combinations Interaction on the chips
1 pE3134-TlOsm and pE3132-AtCPK4 +
2 pE3134-OsOlp1_A and pE3132-AtCPK4 +
3 pE3134-OsOlp1_I and pE3132-AtCPK4 +
4 pE3134-TlOsm and pE3132-AtCPK5 +
5 pE3134-OsOlp1_A and pE3132-AtCPK5 +
6 pE3134-OsOlp1_I and pE3132-AtCPK5 +
7 pE3134-TlOsm and pE3132-AtMS1 +
8 pE3134-OsOlp1_A and pE3132-AtMS1 +
9 pE3134-OsOlp1_I and pE3132-AtMS1 -
10 pE3134-TlOsm and pE3132-AtALDH7B4 +
11 pE3134-OsOlp1_A and pE3132-AtALDH7B4 -
12 pE3134-OsOlp1_I and pE3132-AtALDH7B4 -
13 pE3134-TlOsm and pE3132-AtPER42 -
14 pE3134-OsOlp1_A and pE3132-AtPER42 -
15 pE3134-OsOlp1_I and pE3132-AtPER42 -
16 pCE100_EYFP Positive control
17 Infiltration medium Negative_WT control
6.2.12.3 Sample preparation and imaging
Two days post-infiltration, leaves from each combination were harvested and
fixed using the methods described in Section 2.2.4. The fixed samples were examined
under the A1 Confocal Microscope (Nikon, Tokyo, Japan). The images were captured
under 488 nm laser channel with emission of 500-550 nm for green fluorescence and
638 nm laser channel with emission of 663-738 nm for autofluorescence. The captured
images were used for analysis of target osmotins and Arabidopsis protein interactions
in planta.

Chapter 6: Analysis of Protein-Protein Interactions of Osmotins from Stress Tolerant and Sensitive Species 167
6.3 RESULTS
6.3.1 Expression and purification of recombinant osmotin proteins
To perform hybridisation of protein probes and the protein chips, the protein
probes need to be pure, functional, and containing the tags necessary for detection.
Gene constructs containing osmotins with all tags necessary for recombinant osmotin
purification and detection on the chip and elements for enhancing protein production
were prepared. The gene constructs were transiently expressed in N. benthamiana.
Recombinant osmotins were extracted in 50 mM phosphate buffer and purified
through 3 steps based on His and IgG tags fused with the osmotins. First, recombinant
osmotins were enriched by passing the protein extract through a His SpinTrap column
that only binds the protein with His tag. The elution from His SpinTrap columns was
inoculated with Protein G Mag Sepharose Xtra beads that bind to the IgG tag of
recombinant osmotins. The proteins were cleaved from the beads by incubating with
Precision Proteases. Then the cleaved protein solutions once went through the His
SpinTrap columns to eliminate all the tag elements and the excessive protease in the
buffer so that only proteins with His tag bound to the columns. Following elution from
the final His SpinTrap columns, the protease-cleaved and purified osmotins were
confirmed by Coomassie staining of SDS-PAGE gel and western blot analysis. Figure
6.3 presents the schematic of recombinant osmotins with estimated sizes before and
after cleavage and the images of Coomassie stained SDS-PAGE gel and western blot
film of the purified recombinant osmotins.

168 Chapter 6: Analysis of Protein-Protein Interactions of Osmotins from Stress Tolerant and Sensitive Species
Figure 6.3 Recombinant osmotin production. A-B) schematic diagram of recombinant
osmotins and estimated sizes before (A) and after protease cleavage (B); C-D) visualisation of
cleaved and purified osmotins by Coomassie staining of PAGE gel (C) and western blot (D);
film was exposed for 5 min; ML, molecular ladder; WT-Ctrl, wild type control
Results from SDS-PAGE gel Coomassie stain and western blot analysis
indicated that all three recombinant osmotins were obtained at high purity and identity.
Coomassie stained SDS-PAGE gel (Figure 6.3 C) showed the bands of OsOlp1_A,
OsOlp1_I and TlOsm with 9xMyc and His-6 downstream tags similar to their
estimated sizes (Figure 6.3 B). The bands were intense with little smearing, thus
suggesting the intact and purity of resulted osmotins. Western blotting using antibody
against Myc tag verified the identity of the purified proteins as demonstrated by
intensive bands after only 5 min of film exposure. The results here demonstrated that
the purpose of obtaining pure recombinant OsOlp1_A, OsOlp1_I and TlOsm with
all necessary tags was achieved by using advanced gene manipulation and multi-step
protein purification.

Chapter 6: Analysis of Protein-Protein Interactions of Osmotins from Stress Tolerant and Sensitive Species 169
6.3.2 Arabidopsis proteins interacting with TlOsm, OsOlp1_A, and OsOlp1_I
revealed
The functions of unknown proteins can be discovered through the study of their
respective protein partners with known functions (Rao et al., 2014). TlOsm from
desiccation tolerant species, T. loliiformis, and its counterparts, the OsOlp1_A and
OsOlp1_I, from drought-tolerant and –sensitive cultivars of stress sensitive species,
O. sativa, were previously compared in their predicted functional residues and in their
contribution in enhanced stress tolerance of transgenic rice. To provide new insights
into the mechanisms and pathways of TlOsm and its counterparts in plant stress
response, Arabidopsis proteins on the 5000-AtPROTEINCHIP1 interacting with the
three osmotins were screened. Each of purified recombinant TlOsm, OsOlp1_A,
and OsOlp1_I downstream by Myc epitope and His tags was probed with separate
protein chip. The primary antibody, the anti-Myc IgG, detected the Myc epitope was
incubated for detecting the interaction. Then, the anti-IgG antibody with Cy5
conjugated was incubated to bind the anti-Myc IgG. The protein-protein interaction
was detected by scanning with the Cy5 fluorescence for the indication of interaction.
The GenePix Pro software was used to determine the fluorescence intensity of the
spots. Fluorescent intensity of the interaction was analysed according to the instruction
of the software. For each slide, an output file containing mean, median, and standard
deviation of array spots and background intensity was created by the program. These
output files with background intensity of each spot were subjected for analysis of
interactions. This procedure is illustrated in Figure 6.4.

170 Chapter 6: Analysis of Protein-Protein Interactions of Osmotins from Stress Tolerant and Sensitive Species
Figure 6.4 Procedure of recombinant osmotins hybridising with protein chips and data
generation
6.3.2.1 Identification of Arabidopsis proteins on the chip interacting with TlOsm,
OsOlp1_A, and OsOlp1_I
The mean, standard deviation, and standard error of the mean values were
calculated for each spot (5210 entry names) on each slide including all Arabidopsis
proteins (expressed as TAIR_ID) on the chip and multiple positive and negative
controls. One-sided Student’s t-test was used and the false discovery rate by FDR
method (Storey, 2002) was applied to determine the significant interactions. Total of
271 Arabidopsis proteins on the chips were found significantly interacted with
TlOsm, OsOlp1_A, and OsOlp1_I. The list of total 271 Arabidopsis proteins
either common or specific interacted with OsOlp1_A, OsOlp1_I, and TlOsm was
analysed against the DAVID database for functional analysis using TAIR_ID identifier
(Jiao et al., 2012). The profile for all Arabidopsis proteins on the chip interacting with
each respective osmotins is provided in Appendix E-Table 1. These proteins were in
various families and appeared to be involved in a diverse biological process of plant
stress responses and development.

Chapter 6: Analysis of Protein-Protein Interactions of Osmotins from Stress Tolerant and Sensitive Species 171
6.3.2.2 More Arabidopsis proteins on the chip interacted with TlOsm than with
OsOlp1_A, and OsOlp1_I
Structural-to-functional predictions suggested more functional sites for TlOsm
than two rice osmotins. For rice osmotins, OsOlp1_A has three more glucan-binding
sites than OsOlp1_I; and the two differ in one phosphorylation site. Functional
validation in transgenic rice indicated the positive correlation between the levels of
stress tolerance and functional sites of the transgenes they expressed. In order to prove
the hypothesis that protein with more functional sites binds to more proteins in the
same condition, chips containing 5000 Arabidopsis proteins were separately
hybridised with each target osmotin. As indicated in Table 6.3, TlOsm had 267
significant interactors while OsOlp1_A had 239 interactors, and OsOlp1_I
interacted with 237 proteins. In the same hybridisation conditions and the same
quantity of proteins applied, there were more proteins interacting with osmotin from
T. loliiformis than with those from O. sativa. The results are in agreement with the
hypothesis.
Table 6.3 Comparison of significant interactions between Arabidopsis proteins on the
chip with the three osmotins
Parameters Number of Arabidopsis
proteins
All proteins interacting with 3 osmotins 271
Proteins interacting with TlOsm 267
Proteins interacting with OsOlp1_A 239
Proteins interacting with OsOlp1_I 237
Proteins commonly interacting with the 3 osmotins 225 (83.03%)
Proteins interacting with OsOlp1_A and TlOsm
(not OsOlp1_I)
11 (4.05%)
Proteins interacting with OsOlp1_A and
OsOlp1_I (not TlOsm)
1 (0.37%)
Proteins interacting with OsOlp1_I and TlOsm
(not OsOlp1_A)
10 (3.69%)
Proteins specifically interacting with TlOsm 21 (7.75%)
Proteins specifically interacting with OsOlp1_A 2 (0.74%)
Proteins specifically interacting with OsOlp1_1 1 (0.37%)

172 Chapter 6: Analysis of Protein-Protein Interactions of Osmotins from Stress Tolerant and Sensitive Species
The interactors of these three osmotins were categorised into 7 groups: those
commonly interacted with all three osmotin (83.03%), those interacted with
OsOlp1_A and TlOsm (not OsOlp1_I) (4.05%); those interacted with
OsOlp1_A and OsOlp1_I (not TlOsm) (0.37%), those interacted with OsOlp1_I
and TlOsm (not OsOlp1_A) (3.69%), those specifically interacted with only
TlOsm (7.75%), OsOlp1_A (0.74%) and OsOlp1_I (0.37%). In Chapter 5, TlOsm
and OsOlp1_A genes were proven to confer tolerance to cold, drought, and salinity
stresses with the higher level of stress tolerance found for TlOsm plants. Thus, the
interactors of OsOlp1_A and TlOsm and with only TlOsm were highlighted for
further analysis on their functions in cold, drought, and salinity response (Table 6.3).
The common interactors of these osmotins hold potential for understand the common
functions of these osmotins in biotic stress response and plant development.
6.3.3 Gene ontology (GO) enrichment for interactors of the three osmotins
To help understand the molecular function and biological process of the
Arabidopsis proteins interacting with TlOsm, OsOlp1_A, and OsOlp1_I, the GO
enrichment was performed for all the 271 proteins interacted with the three osmotins.
The GO terms were enriched in agriGO web server against the Arabidopsis genomodel
9 background (Du et al., 2010). A total of 37767 GO terms was suggested and 127 GO
terms were found significantly enriched in the protein-binding gene set (adjusted P-
value ≤ 0.05) (Appendix E-Table 2). All the significant GO terms displayed by
biological process were summarised and visualised by REVIGO web server (Supek et
al., 2011) using Treemap. Figure 6.5 presents the biological processes that the 271
interactors of TlOsm, OsOlp1_A, and OsOlp1_I significantly participate in.
The data showed that TlOsm, OsOlp1_A, and OsOlp1_I bound proteins are
involved in the diverse biological process of plant stress responses and development such
as response to abiotic stress, disease, endogenous stimuli, signal transduction, carboxylic
acid biosynthesis, cellular process and metabolism. Thus, the data suggest that the
functions of these osmotins in multiple stress responses and development of plants.
A total 83.03% of the 271 three osmotins interactors are in common for TlOsm,
OsOlp1_A, and OsOlp1_I. However, TlOsm, OsOlp1_A, and OsOlp1_I
differentially responded to cold, drought and salinity stresses as evidenced by the
results in the Chapter 5. The key functional mechanisms underlying the different
regulations of TlOsm, OsOlp1_A, and OsOlp1_I in plant stress response could

Chapter 6: Analysis of Protein-Protein Interactions of Osmotins from Stress Tolerant and Sensitive Species 173
rely on the 16.97% of their different interactive partners. Only TlOsm and
OsOlp1_A conferred tolerance to cold, drought and salinity stresses in transgenic
rice with the higher levels of tolerance to cold and drought for TlOsm. Hence,
interactors of TlOsm and OsOlp1_A should be the focus for understanding the
underlying mechanisms for abiotic stress tolerance of TlOsm and OsOlp1_A. Thus,
GO term enrichment and biological process involving the interactors of TlOsm and
OsOlp1_A and those of TlOsm only were analysed and highlighted as the black and
red ovals in Figure 6.5.
Figure 6.5 Biological processes involving protein interactors of TlOsm, OsOlp1_A and
OsOlp1_I based on Gene Ontology analysis. Area of rectangles reflects the proportion of GO
terms; back ovals indicate the GO distribution of 11 interactors of TlOsm and OsOlp1_A (not
OsOlp1_I); red ovals indicate the GO distribution of 21 interactors of TlOsm.
Interestingly, proteins interacting with TlOsm and OsOlp1_A participate in
a number of biological processes (Figure 6.5, back ovals); while those only interacting
with TlOsm participated in response to stress and stimuli only (Figure 6.5, red ovals).
Interacting with more proteins in the process of plant response to stresses and stimuli
would explain for higher effects on enhancing rice tolerance to abiotic stresses of
TlOsm (Chapter 5).

174 Chapter 6: Analysis of Protein-Protein Interactions of Osmotins from Stress Tolerant and Sensitive Species
6.3.4 Pathways of TlOsm, OsOlp1_A, and OsOlp1_I interactive protein
partners revealed
Understanding the pathways involved in a set of genes or proteins provides valuable
biological insights into their functions (Wu et al. 2006). To investigate the biological
pathways involving the target osmotins, the pathways of their interactors were analysed.
The entire list of TlOsm, OsOlp1_A, and OsOlp1_I interactors with TAIR_ID
identity was converted into gene identity (GI) in DAVID knowledgebase server. The list
with GIs was used as input for pathway analysis in KOBAS 2.0 server (Xie et al., 2011).
In this analysis, GIs were subjected for automated annotation and a Fisher’s exact test for
differential GO term distribution. The pathway enrichment analysis based on automated
annotation generated by KOBAS was further used to look up the number of interactors for
each osmotin interactor category. The details of entire putative pathways involving all
interactors of the osmotins are presented in the Appendix E-Table 3.
Table 6.4 Significant pathways of Arabidopsis proteins interacting with TlOsm,
OsOlp1_A, and OsOlp1_I (background indicates the number of proteins in the pathways
available in the database)
Biological pathway Background
number
TlOsm
interactors
OsOlp1_A interactors
OsOlp1_I interactors
Fructose and mannose
metabolism 62 8 7 6
Glycolysis 113 11 10 9
Pentose phosphate pathway 54 7 6 5
Benzoate biosynthesis II 6 3 2 2
Alkane oxidation 6 3 2 2
Riboflavin metabolism 9 3 1 1
Super pathway of lysine,
threonine and methionine
biosynthesis
24 5 4 4
Fatty acid alpha oxidation I 7 3 2 2
Flavonoid biosynthesis 21 4 3 2
Ethanol degradation II 16 4 3 3
Interactive protein partners of the three osmotins are involved in diverse putative
biological pathways, suggesting the involvements of the osmotins in various pathways.
No pathway specific to rice osmotin interactors was identified but nine pathways were
found specific for TlOsm interactors. Notably, even in conserved pathways, the numbers
of TlOsm, OsOlp1_A, OsOlp1_I interactors were different with TlOsm binding to

Chapter 6: Analysis of Protein-Protein Interactions of Osmotins from Stress Tolerant and Sensitive Species 175
more proteins in the pathways. Table 6.4 presents the ten most significant pathways
involving interactors of TlOsm, OsOlp1_A, and OsOlp1_I. These pathways provide
more informative indicator for testing hypothesized functions of these osmotins.
Moreover, the interactors involved in nine pathways specific for TlOsm would offer great
targets for exploiting any additional functions of osmotin from stress tolerant species.
Since the focuses of this study were to understand the mechanisms and pathways
associated with the osmotins conferred tolerance to abiotic stresses, the pathways only
containing TlOsm and OsOlp1_A were used for further analysis. Table 6.5 lists all the
pathways containing interactors of TlOsm and OsOlp1_A, or TlOsm only. Among
these 18 pathways, 9 pathways contain proteins interacting with TlOsm and OsOlp1_A
and 9 pathways contain proteins only interacting with TlOsm. These pathways are within
biosynthesis, oxidative phosphorylation, and amino acid degradation.
Table 6.5 Pathways of Arabidopsis proteins interacting with TlOsm and OsOlp1_A,
or TlOsm only (background indicates the number of proteins in the pathways available in
the database; input indicates the numbers of osmotin interactors)
Pathway name Database
Background
number Input TlOsm&
OsOlp1_A
TlOsm only
Scopoletin biosynthesis BioCyc 9 2 1 1
Suberin monomers
biosynthesis BioCyc 17 2 1 1
Chlorogenic acid
biosynthesis I BioCyc 17 2 1 1
Phenylalanine metabolism KEGG PATHWAY 42 2 1 1
Phenylpropanoid
biosynthesis BioCyc 37 2 1 1
Stilbenoid, diarylheptanoid
and gingerol biosynthesis KEGG PATHWAY 61 2 1 1
UDP-sugars interconversion BioCyc 19 1 1
Carotenoid biosynthesis KEGG PATHWAY 29 1 1
Oxidative phosphorylation KEGG PATHWAY 162 1 1
Valine biosynthesis BioCyc 6 1 1
Superpathway of isoleucine
and valine biosynthesis BioCyc 7 1 1
Quercetin sulfate
biosynthesis BioCyc 8 1 1
Leucine biosynthesis BioCyc 8 1 1
Superpathway of flavones
and derivatives biosynthesis BioCyc 8 1 1
UDP-D-xylose biosynthesis BioCyc 11 1 1
Leucine degradation I BioCyc 12 1 1
Valine degradation I BioCyc 14 1 1
Superpathway of leucine,
valine, and isoleucine
biosynthesis BioCyc 15 1 1
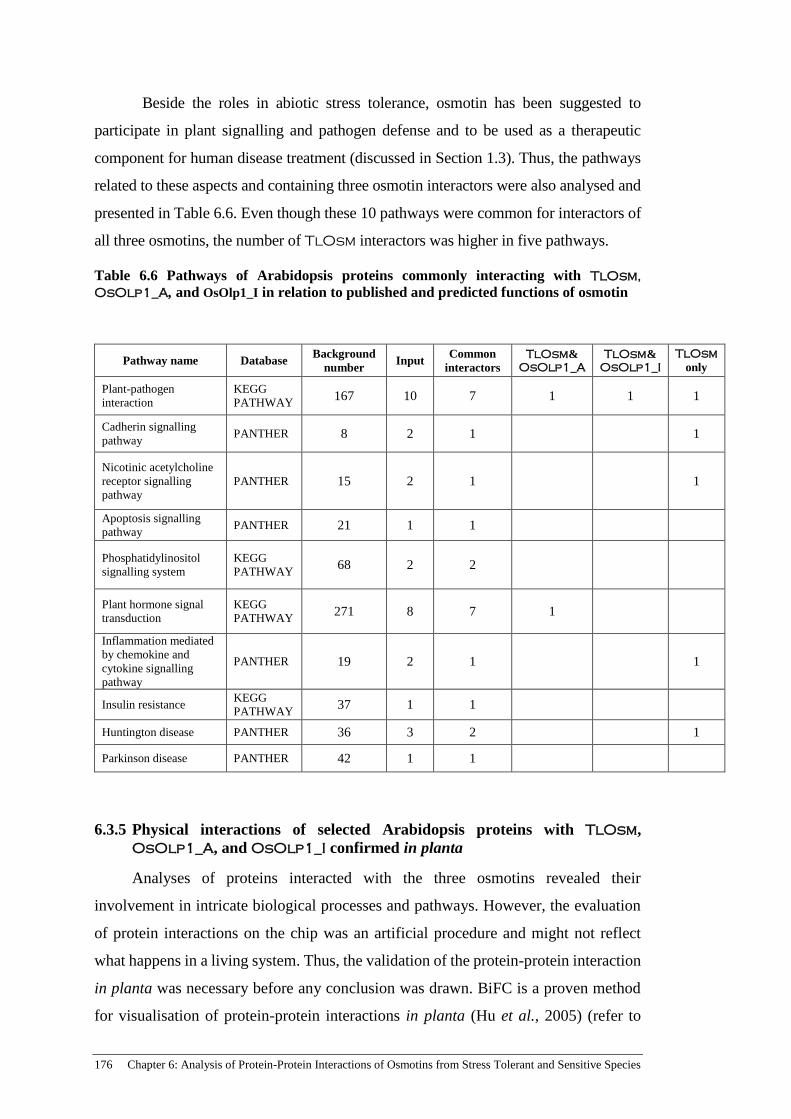
176 Chapter 6: Analysis of Protein-Protein Interactions of Osmotins from Stress Tolerant and Sensitive Species
Beside the roles in abiotic stress tolerance, osmotin has been suggested to
participate in plant signalling and pathogen defense and to be used as a therapeutic
component for human disease treatment (discussed in Section 1.3). Thus, the pathways
related to these aspects and containing three osmotin interactors were also analysed and
presented in Table 6.6. Even though these 10 pathways were common for interactors of
all three osmotins, the number of TlOsm interactors was higher in five pathways.
Table 6.6 Pathways of Arabidopsis proteins commonly interacting with TlOsm,
OsOlp1_A, and OsOlp1_I in relation to published and predicted functions of osmotin
Pathway name Database Background
number Input
Common
interactors
TlOsm& OsOlp1_A
TlOsm& OsOlp1_I
TlOsm
only
Plant-pathogen
interaction
KEGG
PATHWAY 167 10 7 1 1 1
Cadherin signalling
pathway PANTHER 8 2 1 1
Nicotinic acetylcholine
receptor signalling
pathway
PANTHER 15 2 1 1
Apoptosis signalling
pathway PANTHER 21 1 1
Phosphatidylinositol
signalling system
KEGG
PATHWAY 68 2 2
Plant hormone signal
transduction
KEGG
PATHWAY 271 8 7 1
Inflammation mediated
by chemokine and
cytokine signalling
pathway
PANTHER 19 2 1 1
Insulin resistance KEGG
PATHWAY 37 1 1
Huntington disease PANTHER 36 3 2 1
Parkinson disease PANTHER 42 1 1
6.3.5 Physical interactions of selected Arabidopsis proteins with TlOsm,
OsOlp1_A, and OsOlp1_I confirmed in planta
Analyses of proteins interacted with the three osmotins revealed their
involvement in intricate biological processes and pathways. However, the evaluation
of protein interactions on the chip was an artificial procedure and might not reflect
what happens in a living system. Thus, the validation of the protein-protein interaction
in planta was necessary before any conclusion was drawn. BiFC is a proven method
for visualisation of protein-protein interactions in planta (Hu et al., 2005) (refer to

Chapter 6: Analysis of Protein-Protein Interactions of Osmotins from Stress Tolerant and Sensitive Species 177
Figure 1.3 for the principle of BiFC analysis). The BiFC assays were used for
validating the interactions of the three osmotins with selected Arabidopsis proteins.
Among the 7 categories of Arabidopsis proteins interacting with three target
osmotins, only three categories were selected for validation in planta due to the
interests in the osmotic stress tolerant mechanisms. These categories included those
commonly interacted with all three osmotins, those interacted with TlOsm and
OsOlp1_A, and those interacted with TlOsm only. In addition, a protein did not
interact with all three osmotins on the chip was selected as negative interaction control,
the AtPER42. To select the candidates in the three chosen categories, the sub-cellular
localisation of the osmotins and their putative interactors were considered. TlOsm
was proven to localise to the plasma membrane in both normal and salt stressed
conditions (Chapter 3). The localisation of OsOlp1_A and OsOlp1_I were
unknown but bioinformatics predictions suggested the apoplast localisation for
OsOlp1_I and either ER or chloroplast localisation for OsOlp1_A. Thus, in order
for Arabidopsis proteins contact with the three osmotins, the candidate proteins should
not localise to the nucleus. Hence, all the nuclear localised proteins were eliminated
from the list. Moreover, the proteins had been well characterised and shown to play
roles in stress tolerance were selected as priority. Taken all selection criteria together,
the AtCPK4, AtCPK5 were selected as representatives of proteins commonly
interacted with all three osmotins; the AtMS1 for representing those interacted with
TlOsm and OsOlp1_A but not OsOlp1_I; and AtALDH7B4 for representing
those interacted with TlOsm only.
The TlOsm, OsOlp1_A, and OsOlp1_I were separately fused with the half N-
terminus of EYFP gene in the pE3134 plasmid vector (Figure 6.2 A). The five selected
Arabidopsis genes were separately fused with the half C-terminus of EYFP gene in the
pE3132 plasmid vector. Co-expression of target osmotin genes and selected
Arabidopsis genes together with positive and negative control (Table 6.2) was
performed transiently in N. benthamiana by agro-infiltration method. Two days after
infiltration, agro-infiltrated leaves from all combinations and controls were harvested
and fixed. These samples were subjected to confocal laser scanning microscopic
analysis. Representative images captured the fluorescence of experimental leaf
samples are presented in the Figure 6.6, 6.7, 6.8, 6.9 and 6.10.

178 Chapter 6: Analysis of Protein-Protein Interactions of Osmotins from Stress Tolerant and Sensitive Species
Figure 6.6 Analysis of in planta interactions between AtCPK4 and TlOsm, OsOlp1_A,
or OsOlp1_I. The protein combinations are indicated underneath the images. Images were
taken under Fitc light channel (488nm) captured green and EYFP fluorescence and Cy5 light
channel (668 nm) captured red fluorescence of chlorophyll. Bar 10 µm.

Chapter 6: Analysis of Protein-Protein Interactions of Osmotins from Stress Tolerant and Sensitive Species 179
Results shown in Figure 6.6 indicated the interactions of AtCPK4 with TlOsm
and OsOlp1_A but not with OsOlp1_I. Few green fluorescent spots in Figure 6.6
C reflect the autofluorescence from chlorophyll not from EYFP fluorescence as the
results of the two protein interactions, indicating no interaction of OsOlp1_I with
AtCPK4 taken place. Hence, only the interactions between AtCPK4 with TlOsm
and with OsOlp1_A were demonstrated to happen in planta. AtCPK4 and
OsOlp1_I were showed strong interaction on the chip but that interaction did not take
play in living N. benthamiana plants.
Figure 6.7 Analysis of in planta interactions between AtCPK5 and TlOsm, OsOlp1_A,
or OsOlp1_I. The protein combinations are indicated underneath the images. Light channels
for capturing images and corresponding controls refer to Figure 6.8. Bar 10 µm.
Figure 6.7 confirmed the interactions of all TlOsm, OsOlp1_A, and
OsOlp1_I with AtCPK5 in planta.

180 Chapter 6: Analysis of Protein-Protein Interactions of Osmotins from Stress Tolerant and Sensitive Species
Figure 6.8 Analysis of in planta interactions between AtMS1 and TlOsm, OsOlp1_A,
or OsOlp1_I. The protein combinations are indicated underneath the images. Light channels
for capturing images and corresponding controls refer to Figure 6.5. Bar 10 µm.
Fluorescent images in the Figure 6.8 proved the interactions between AtMS1
with TlOsm and with OsOlp1_A, not with OsOlp1_I. The interactions of these
protein combinations in living N. benthamiana plants were in agreement with the
results generated from screening interactions on the chip.

Chapter 6: Analysis of Protein-Protein Interactions of Osmotins from Stress Tolerant and Sensitive Species 181
Figure 6.9 Analysis of in planta interactions between AtALDH7B4 and TlOsm,
OsOlp1_A, or OsOlp1_I. The protein combinations are indicated underneath the images.
Light channels for capturing images and corresponding controls refer to Figure 6.6. Bar 10 µm.
Fluorescent images from the Figure 6.9 demonstrated the interactions between
AtALDH7B4 only with TlOsm, not with OsOlp1_A and OsOlp1_I. The results
of these interactions in planta completely reflected what had been observed on the
chip.

182 Chapter 6: Analysis of Protein-Protein Interactions of Osmotins from Stress Tolerant and Sensitive Species
Figure 6.10 Analysis of in planta interactions between AtPER42 and TlOsm,
OsOlp1_A, or OsOlp1_I. The protein combinations are indicated underneath the images.
Light channels for capturing images refers to Figure 6.6. Bar 10 µm.

Chapter 6: Analysis of Protein-Protein Interactions of Osmotins from Stress Tolerant and Sensitive Species 183
In comparison with the fluorescence signals from the positive and the
negative_WT controls, the results shown in Figure 6.10 indicated that no interaction
between AtPER42 and TlOsm, OsOlp1_A, or OsOlp1_A takes play in planta.
These results affirmed the observations acquired from in vitro hybridisations of the
three target osmotins with the protein chips.
BiFC analysis indicated a total of eight interactions between the three target
osmotins and the selected Arabidopsis genes as indicated by the fluorescent emission
from leaf cells of eight combinations (Figure 6.6-6.9). Among nine combinations
showed significant interactions on the chip, one combination (OsOlp1_I and
AtCPK4) did not show interaction in planta. Seven combinations not significantly
interacting on the chip were confirmed in planta. Fourteen out of 15 combinations of
three osmotins with 5 Arabidopsis proteins in planta affirmed the results generated
from protein chip hybridisation. These results showed the reliability of the interactions
screened from hybridising the three osmotins and Arabidopsis proteins on the chip.
The results of BiFC analysis provided a firm evidence for the interactions of the
osmotins with plant proteins in living plants. These results also offered the basis for
elucidating the functions of TlOsm and OsOlp1_A in plant response to osmotic
stresses.
6.4 DISCUSSION
Plant osmotins have been proven as key regulators in both abiotic and biotic
stress responses of plants (Liu et al., 2010). However, the mechanisms underlying their
functions in plant stress response are not well established due to the lack of information
in their interaction partners and pathways. The difficulties in producing recombinant
osmotins with functionality and purity have additionally slowed the progress of
studying osmotins at protein levels. Intensive studies have been carried on osmotin but
to date only few evidences on osmotin binding to other proteins have been
demonstrated. In addition, none of the physical interactions between osmotin and plant
proteins have been reported in the literature. Interactions of osmotin to the Pir proteins
were validated in the Saccharomyces cerevisiae strain resistant to osmotin (Yun et al.,
1997). Similarly, binding of osmotin to phosphomannans on the cell-wall was proven
in S. cerevisiae strain sensitive to osmotin (Ibeas et al., 2000). The binding of osmotin
to PHO36 leading to the suppression of fungal apoptosis signalling pathway was also
evidenced in S. cerevisiae (Narasimhan et al., 2001; Narasimhan et al., 2005).

184 Chapter 6: Analysis of Protein-Protein Interactions of Osmotins from Stress Tolerant and Sensitive Species
Evidence of osmotin functions as agonist of adiponectin for binding to adiponectin
receptor was demonstrated in mammalian C2C12 cell line (Narasimhan et al., 2005).
Nevertheless, the validation of these few interactions has contributed to the dissection
of osmotin functions and mechanisms of its in vitro toxicity to fungi and its
adiponectin-mimic functions.
In the previous chapter, the roles in enhancing plant tolerance to cold, drought
and salinity stresses of TlOsm, OsOlp1_A, and OsOlp1_I were compared in
transgenic rice. The results demonstrated the capacity in enhancing cold, drought, and
salinity stress tolerance in transgenic rice of TlOsm and OsOlp1_A, with the
superior tolerant levels to cold and drought stresses of TlOsm expressing plants. In this
study, to understand the functions and stress-responsive pathways by which these
osmotins mediate plant response to stresses, the potential interactive protein partners
of each TlOsm, OsOlp1_A, and OsOlp1_I were assessed by the Arabidopsis
protein microarray. Recombinant osmotin proteins were obtained with purity and
identity needed for probing with the proteins on the microarray. Arabidopsis proteins
interacting with each osmotin on the chip were identified. More proteins on the chip
interacted with TlOsm than with rice osmotins. In comparison within rice osmotins,
the OsOlp1_A from drought tolerant cultivar interacted with two more proteins than
OsOlp1_I from drought sensitive cultivar; they have 225 common interactors, 14
interactors specific to OsOlp1_A and 12 interactors specific to OsOlp1_I. The
interactors of osmotins were found to participate in a diverse biological process.
Interestingly, all proteins only interacting with TlOsm were found involved in plant
responses to stress and stimuli. Pathway analysis of osmotins interactors revealed the
conserved pathways among three osmotins and specific pathways for osmotins
conferred tolerance to abiotic stress and nine unique pathways for osmotin from T.
loliiformis.
Putative interactors of osmotins were selected for validating the interactions in
planta upon their well-characterised functions in plant stress response. CPK4 and
CPK5 belong to calcium-dependent protein kinase family that play the crucial
regulatory roles in plant signalling to diverse stress conditions including both abiotic
and biotic stresses (Mohanta and Sinha, 2016; Steinhorst and Kudla, 2013). Both
CPK4 and CPK5 were found to directly regulate ROS signalling through modulation
of RBOH by NADPH oxidases. Kobayashi et al. (2007) demonstrated in potato
(Solanum tuberosum) that StCPK4 and StCPK5 phosphorylated NADPH oxidase

Chapter 6: Analysis of Protein-Protein Interactions of Osmotins from Stress Tolerant and Sensitive Species 185
and regulated the production of ROS. Arabidopsis CPK4 together with
CPK1/CPK2/CPK11 was shown to phosphorylate NADPH oxidases in vitro and
was considered as important components for the production of ROS during immune
signalling (Gao et al., 2013). Similarly, AtCPK5 was proposed to be a key component
of self-propagating activation circuit regulating cell-to-cell communication.
AtCPK5-dependent phosphorylation activated RBOHD that generated an apoplastic
ROS wave that further enabled signal propagation upon pathogen-associated
molecular pattern stimulation to distal parts of the plants. Thus, AtCPK5 represents
a positive regulator of the NADPH oxidising RBOHD during pathogen immune
defense in Arabidopsis (Dubiella et al., 2013). Moreover, AtCPK4 was proven to
regulate ABA signal transduction in Arabidopsis (Zhu et al., 2007). Accordingly,
AtCPK4 was evidenced to be induced by ABA stimulus and to regulate ABA signal
transduction pleiotropically in seed germination, seedling growth, stomatal movement,
and in plant response to salt stress. Another stress-responsive gene, the AtMS1, was
demonstrated to interact with TlOsm and OsOlp1_A but not with OsOlp1_I on
the chip. AtMS1 is involved in various biological processes including methionine
biosynthesis, methylation, and homocysteine metabolic process and in response to salt
stress, to zinc ion, and to cadmium ion. In the significant pathways of osmotin
interactors described in Table 6.4, AtMS1 is within the super pathway of lysine,
threonine, and methionine biosynthesis. Among the four proteins selected for
elucidating interactions with osmotins in N. benthamiana plants, AtMS1 has the most
complex protein interaction network (Figure 6.11 C). This protein is involved in
biosynthesis of compounds beneficial for plant adaptation. Abiotic stresses generate
ROS that consequently cause excessive accumulation of aldehydes in plant cells.
Aldehyde dehydrogenases (ALDHs) work as aldehyde scavengers to eliminate
aldehyde toxicity caused by oxidative stress (Hou and Bartels, 2014). As a member
of the ALDH family, AtALDH7B4 was demonstrated to enhanced A. thaliana plants
tolerant to abiotic stress by protecting plants against lipid peroxidation and oxidative
stress (Kotchoni et al., 2006). According to the authors, plants overexpressing
AtALDH7B4 showed higher level of AtALDH7B4 protein accumulation and
conferred tolerance to osmotic and oxidative stresses. The stress tolerance of
AtALDH7B4-overexpresing plants was accompanied by a decreasing level of H2O2 and
MDA generated from cellular lipid peroxidation. The AtALDH7B4-knockout mutant
plants exhibited higher sensitivity to drought and salinity stresses than WT plants. The
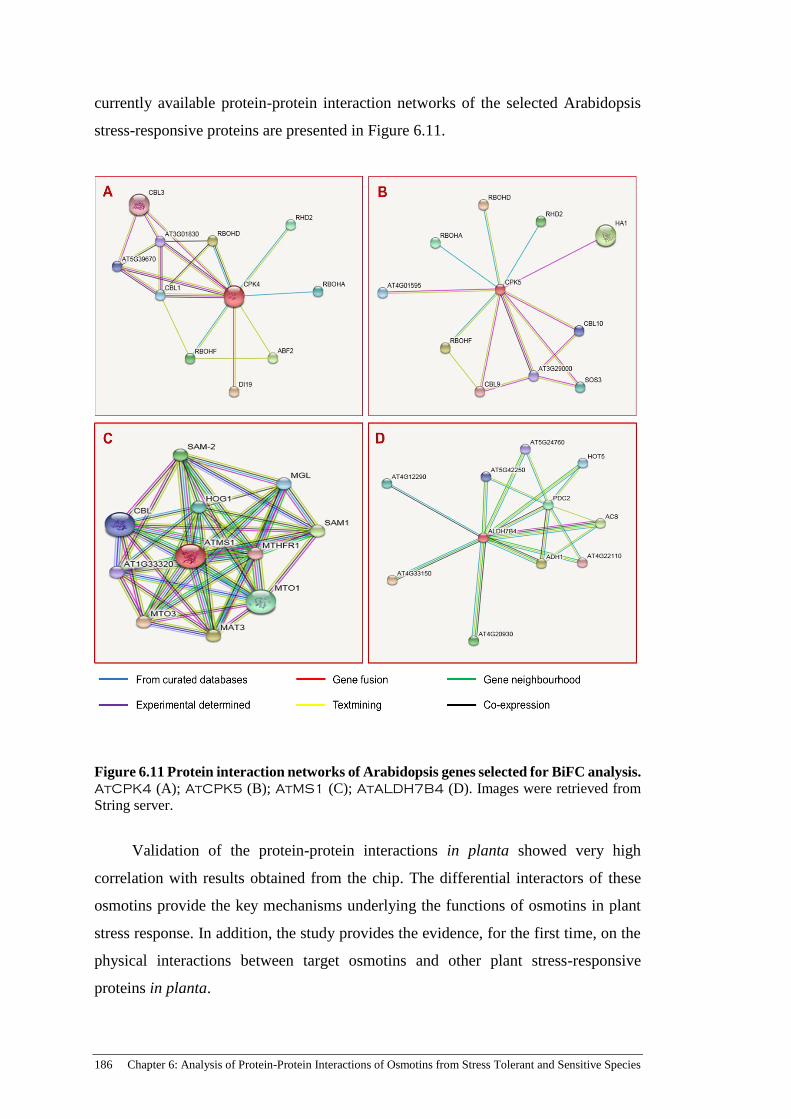
186 Chapter 6: Analysis of Protein-Protein Interactions of Osmotins from Stress Tolerant and Sensitive Species
currently available protein-protein interaction networks of the selected Arabidopsis
stress-responsive proteins are presented in Figure 6.11.
Figure 6.11 Protein interaction networks of Arabidopsis genes selected for BiFC analysis. AtCPK4 (A); AtCPK5 (B); AtMS1 (C); AtALDH7B4 (D). Images were retrieved from
String server.
Validation of the protein-protein interactions in planta showed very high
correlation with results obtained from the chip. The differential interactors of these
osmotins provide the key mechanisms underlying the functions of osmotins in plant
stress response. In addition, the study provides the evidence, for the first time, on the
physical interactions between target osmotins and other plant stress-responsive
proteins in planta.

Chapter 6: Analysis of Protein-Protein Interactions of Osmotins from Stress Tolerant and Sensitive Species 187
6.4.1 Production of pure and functional recombinant osmotins
Critical criteria for recombinant proteins used to hybridise with the protein chip
require purity, functional activity, and appropriate tags for detection of interactions.
Therefore, the gene manipulation and expression system for recombinant target
osmotin production needed to consider all the elements necessary for enhancing
protein production, facilitating proper protein folding, supporting purification process,
remaining protein activity after purification, and promoting detection of interactions.
The hydrophobicity, anti-microbial property and the presence of 8 disulfide bonds in
the structure of osmotins have made it difficult for expressing in microbial system with
proper folding of resulted proteins. Due to its toxicity to expressing microbes, osmotin
was targeted to inclusion bodies that resulted in water insoluble and aggregated form
and with misfolded proteins (Campos et al., 2008; Viktorova et al., 2012). Two current
existing protocols for recombinant osmotins in E. coli by Compos et al. (2008) and
Tzou et al. (2011) did not suit our purposes. The protocol by Compos et al. (2008)
requires targeting osmotin in the inclusion bodies, denaturing osmotin during protein
extraction and refolding the protein. However, with 8 disulfide bonds in the structure,
refolding osmotin is a difficult step accompanied with limited protein yield upon
water-insoluble of hydrophobic protein. The protocol by Tzou et al. (2011) developed
for C-terminus truncated tobacco osmotin that resulted in extra cellular secretion of
recombinant osmotin with reasonable yield and antifungal activities of recombinant
osmotin remained. However, TlOsm is a plasma membrane protein with a membrane
binding domain at its C-terminus. Truncated TlOsm at its C-terminus might affect its
native activities. Hence, another strategy was needed for gene manipulation and
expression of the three target osmotins.
Popescu et al. (2007b) compared two eukaryotic systems for protein expression,
S. cerevisiae and N. benthamiana, in order to identify the biological system that
allowed native protein folding and post-translational modification to occurs, providing
necessary cofactors for protein activity to be used on the protein chips. Their results
indicated that even though the proteins expressed at comparable levels in the two
systems, proteins produced by plants retained their enzymatic functions after
purification better than the yeast expression system. Therefore, expression of osmotins
in plant system would produce protein with more proper folding and functionally
active on the chip similarly to their cellular counterparts. However, TlOsm was

188 Chapter 6: Analysis of Protein-Protein Interactions of Osmotins from Stress Tolerant and Sensitive Species
validated to be a plasma membrane protein. If protein localises naturally, the extraction
of recombinant TlOsm must require the disruption of the plasma membrane to release
the protein. The chemicals used to disrupt cell membrane could cause protein
denatured, change protein conformation that may further effect protein activity.
Numerous studies have proven that addition of a KDEL sequence to the C-terminus of
a protein allowed it retained in the ER (discussed in Section 1.6.2). Incorporation of
the KDEL sequence in cytoplasmic, transmembrane, and other secreted proteins has
been proven to result in ER retention, higher level of expression, stabilisation, and
accumulation of recombinant proteins as compared to their native derivatives (Jackson
et al., 1990; Wandelt et al., 1992; Schouten et al., 1996). Thus, a KDEL sequence were
attached to the C-terminus of the target recombinant osmotins for their ER retention
and improvement in protein expression, stabilisation, and accumulation. Moreover,
progresses in cloning studies have identified number of elements necessary for
stabilising and maintaining native protein activities. Thus, various gene constructs
have been developed for enhancing protein production in transient expression systems
and for facilitating protein purification. The CPMV-HT sequence and P19 suppressor
of gene silencing in the gene expression cassette have been found to be advantages of
pEAQ vector for enhancing recombinant protein expression and for maximizing
expression efficiency in a transient expression system (Preyret and Lomonossoff,
2013). The Tandem affinity purification (TAP) tagged to the C-terminus of a protein
was found to be an efficient approach for isolation of recombinant protein in a plant
protein complex (Rubio et al., 2005). Taking all the considerations required for
recombinant osmotins and the advances of gene cloning into gene manipulation
strategy, we generated the plasmid constructs for expressing target osmotins with the
schematic T-DNA shown in Figure 6.1. In these gene expression cassettes, the CPMV-
HT sequence and P19 gene silencing suppressor were incorporated; and the
recombinant osmotins included either TlOsm, OsOlp1_A, or OsOlp1_I
downstreamed by 9xMyc epitope, His-6, a rhinovirus 3C protease cleavage site, the
2xIgG binding domain of protein A, and the KDEL sequence. These gene constructs
were used for transient expression in N. benthamiana by agro-infiltration method.
The recombinant osmotin proteins were purified through three-step purification
protocol. The osmotin proteins were obtained with purity and identity as evidenced by
the Coomassie staining of SDS-PAGE and western blot analysis (Figure 6.3).

Chapter 6: Analysis of Protein-Protein Interactions of Osmotins from Stress Tolerant and Sensitive Species 189
Functional activities of recombinant target osmotins were further demonstrated by
higher levels of interaction signals detected from some spots on the chip, as compared
to positive control spots (Figure 6.4). Thus, the protocols for cloning, transient
expression in plant system, and protein purification used in this study provide an
alternative method for producing pure and functional recombinant osmotin.
6.4.2 Analysing potential protein interactors of TlOsm, OsOlp1_A and
OsOlp1_I affirms their multiple functions
Protein-protein interaction is one of the fundamental networks reflecting the
complex biological processes in living organisms. Identification of protein interactors
for a protein under study is a crucial desire to unravel the mechanisms underlying the
protein functions. Revealing and cataloguing these protein interactors would provide
a comprehensive understanding of cellular functions and regulatory network of the
under-studied gene in living organism (Popescu et al., 2007a). Numerous studies on
osmotin by various methods have identified only few proteins interacting with
osmotin. These proteins include Pir proteins (Yun et al., 1997), phosphomanno
proteins (Ibeas et al., 2000), the PHO36 regulating the Ras/cAMP pathway in yeast
(Narasimhan et al., 2001), and a mammalian adiponectin receptor (Narasimhan et al.,
2005). Using the Arabidopsis protein microarrays containing 5000 proteins for
separately hybridising with TlOsm, OsOlp1_A, and OsOlp1_I, total of 271
interactive protein partners were identified. Further analysis of the osmotin interactors
revealed their involvement in diverse protein families, biological processes and
pathways. The results demonstrated the effectiveness of using protein microarray to
identify osmotin interactive protein partners that further facilitates the progress for
functional characterisation of these osmotins. The results also confirm the assumption
that TlOsm has more functional sites would interact with more proteins than the rice
osmotins, OsOlp1_A and OsOlp1_I.
Analysis of significant pathways involving three osmotin interactors indicated
the three most dominant pathways to be fructose and mannose metabolism, glycolysis
and pentose phosphate pathways (Table 6.4), with corrected P-value < 0.05. In plants,
soluble sugars not only serve as cell metabolic resources and structural constituents
but also signalling regulators in various processes of plant growth, development, and
response to stress stimuli. Members of the soluble sugar metabolism have been
evidenced to play important roles in plant signalling and adaptive response to abiotic

190 Chapter 6: Analysis of Protein-Protein Interactions of Osmotins from Stress Tolerant and Sensitive Species
stress (Rosa et al., 2009). Glycolysis is a central metabolic pathway present in all
organisms. Different to non-plant systems, plant glycolysis occurs both in the cytosol
and the plastid. The cytosolic glycolysis has been known to provide essential
components for promoting plant development and adaptation to environmental stress
(Plaxton, 1996). Parallel to glycolysis, the pentose phosphate pathway is a metabolic
pathway generating NADPH and pentoses including ribose-5-phosphate that is
fundamental for the synthesis of nucleotides and for building other molecules. In
plants, the pentose phosphate pathway has been shown to be linked with other
pathways including proline biosynthesis, antioxidant response pathway, and phenolic
biosynthesis (Shetty, 2004; Kishor et al., 2005). In the study by Shetty (2004), the
author argued that products of all these pathways are beneficial for plant and also
animal response to stresses. Thus, they suggested the key components that link the
pentose phosphate pathway to these three pathways to be exploited for producing
functional food for use in manage human diseases such as diabetes, cardiovascular,
inflammatory, and cognition diseases, and cancer; and for enhancing plant
environmental stress tolerance. Beside these three dominant pathways, less significant
numbers of osmotin interactors are involved in other 7 pathways (Table 6.4; corrected
P-value < 0.1) that somewhat relate to plant response to environmental and pathogenic
stress factors (Dong and Beer, 2000; Ferreyra et al., 2012; Kishor et al., 2005; Gerdes
et al., 2012). The involvement of osmotin interactors in numbers of fundamental
pathways in plant development and stress response demonstrated the functional roles
of osmotins in above-discussed pathways.
Screening Arabidopsis proteins interacting with TlOsm, OsOlp1_A, and
OsOlp1_I using protein microarray identified a large group of proteins with
recognised roles in biological processes associated with plants response to abiotic and
biotic stresses and development. The involvements of the osmotin interactors in
multiple biological processes and pathways demonstrate the multiple functions of the
osmotins in plant development and adaptation. However, the interactions of these
osmotins with the proteins on the chips were generally artificial environment, where
the sub-cellular localisation of interactive protein partners were not considered.
Therefore, the actual interactors of these osmotins in plants can only be drawn by the
validation of interactions in an appropriate living system.

Chapter 6: Analysis of Protein-Protein Interactions of Osmotins from Stress Tolerant and Sensitive Species 191
6.4.3 Common and specific potential interactors of TlOsm, OsOlp1_A, and
OsOlp1_I provide testable target proteins for unravelling osmotin functions
Osmotin has been demonstrated to be a multi-functional protein and a key
modulator in plant defense against pathogens and environmental stresses (Husaini &
Rafiqui, 2012; Viktorova et al., 2012; Kumar et al., 2015). As discussed in Section
1.3, its roles in both abiotic and biotic stress response of plants have been proven by
analysing gene expression upon stress stimuli, promoters, and various transgenic
plants expressing osmotins from different species. In addition, osmotins have shown
antifungal activities in vitro against a broad range of fungi. Although the mechanisms
underlying osmotin functions in plant defense have not been elucidated, some
mechanisms of osmotin antifungal properties in vitro have been determined via
proteins it interacted with. For examples, mechanisms underlying osmotin functions
that cause fungal cell permeability and susceptible to osmotin were discovered by its
interaction with cell wall phosphomanno proteins (Ibeas et al., 2000). Similarly,
resistance to osmotin toxicity of some S. cerevisiae strains was determined by the
interaction of osmotin with the Pir proteins, the cell-wall-localised stress proteins (Yun
et al., 1997). The mechanism of osmotin causing apoptosis in yeast was found by its
interaction with PHO36, which regulates lipid and phosphate metabolism. In
interacting with PHO36, osmotin suppresses the downstream RAS2/cAMP cell death
signalling pathway and causes apoptosis to yeast cells. The function of tobacco
osmotin as an agonist of mammalian adiponectin was demonstrated based on its
interaction with adiponectin receptors, which resulted in activation of AMP kinase
signalling in C2C12 myocyte cells (Narasimhan et al., 2005). Therefore, the list of 11
interactors of both TlOsm and OsOlp1_A and 21 interactors of TlOsm only
(highlighted in Table 6.3) holds a great target for understand the mechanisms by which
TlOsm and OsOlp1_A regulate plants response to cold, drought, and salinity
stresses. The comparision among TlOsm, OsOlp1_A and OsOlp1_I in transgenic
rice only focussed on plant response to abiotic stresses, particularly to cold, drought
and salinity. TlOsm and OsOlp1_A conferred tolerance to cold, drought, and
salinity in transgenic rice with a higher tolerant levels to cold and drought of TlOsm.
Thus, the mechanisms that TlOsm and OsOlp1_A use to regulate cold, drought, and
salinity stress response could be related to 11 proteins involved in various biological
processes (Table 6.3 and Figure 6.5). The physiological changes in transgenic rice
associated with additional effects of TlOsm over OsOlp1_A were higher osmotic

192 Chapter 6: Analysis of Protein-Protein Interactions of Osmotins from Stress Tolerant and Sensitive Species
adjustment, better membrane protection, and better regulation of stomatal closure. The
21 proteins, which interacted with only TlOsm and are involved in biological process
of plant response to stress, to toxic chemical, and to endogenous stimuli, would be the
ideal target for determination the mechanism of TlOsm leading to such physiological
changes.
Osmotin has been suggested to function in pathogen defence pathway and a
number of signalling pathways. Pathway analysis of osmotin interactors indicated the
involvements of various interactors in plant-pathogen interaction pathway and
numerous stress-signalling pathway such as cadherin signalling, plant hormone signal
transduction, apoptosis signalling pathways (Table 6.6). Interestingly, tobacco
osmotin has shown to share structural and functional similarities with adiponectin, an
insulin sensitising hormone in mammals (Miele et al., 2011), to mimic adiponectin in
activating AMP kinase phosphorylation in mammalian cells (Narasimhan et al., 2005),
and to function as human adiponectin in type II diabetes and obesity (Trivedi et al.,
2012). Since adiponectin has anti-diabetic, anti-atherogenic, and anti-inflammatory
activities, osmotin has been suggested to be used as a therapeutic compound in
replacement of adiponectin for treatment of human diseases related to insulin
resistance (refer to Section 1.3.5). Few proteins interacted with three osmotins on the
chip are also involved in insulin resistant pathway and inflammation mediated by
chemokine and cytokine signalling pathway. Likewise, in mammalian model systems,
osmotin has been demonstrated to function in preventing neurodegeneration and been
suggested to be used as a neuroprotective agent (Shah et al., 2014; Naseer et al., 2014).
Several proteins either commonly or specifically interacted with the three osmotins on
the chip were found to function in the Huntington’s disease and Parkinson disease, the
two neurodegenerative diseases in Human (Table 6.6). These demonstrate the relations
of the results generated from screening protein-protein interactions on the chip to the
previously reported roles of osmotin. Therefore, the osmotin interactors identified
from this study offer a direct targets for testing hypothesis on the mechanisms
underlying these osmotin functions.
Similar to other osmotins, all TlOsm, OsOlp1_A and OsOlp1_I potentially
play roles in defense response to pathogens. Many proteins in the group of common
interactors of the three osmotins are involved in recognised biological processes for
plant disease resistance and innate immunisation response. Hence, this group of

Chapter 6: Analysis of Protein-Protein Interactions of Osmotins from Stress Tolerant and Sensitive Species 193
proteins can serve as testable targets for further studies on mechanism of osmotins in
plant response to biotic stress. Thus, the resulted protein interactors of the three
osmotin provide an informative information for testing binding targets of the osmotins
for elucidation of mechanisms underlying osmotin functions in regulating plant
responses to abiotic and biotic stresses and for exploiting the use of the osmotins as
therapeutic reagents.
6.4.4 Possible mechanisms underlying TlOsm, OsOlp1_A, and OsOlp1_I
functions
The functions and mechanisms by which osmotin regulates plant stress response
have not been well-elucidated partially due to the lack of information in interaction of
osmotin with plant protein. Interactions of the three osmotins with the Arabidopsis
proteins by BiFC analysis reported here present, for the first time, the physical
interactions of the osmotins with plant proteins in plants. Arabidopsis proteins selected
for validating in planta interaction with TlOsm, OsOlp1_A, and OsOlp1_I were
on the basis of their well-characterised roles in plant stress adaptation and within
different stress-responsive pathways (Figure 6.11). The validated interactions in planta
between TlOsm, OsOlp1_A, and OsOlp1_I with Arabidopsis stress-responsive
genes serve as firm evidence for elucidating the mechanisms by which TlOsm and
OsOlp_A regulate plant tolerance to cold, drought and salinity stresses.
In this study, TlOsm and OsOlp1_A were evidenced to interact with
AtCPK4 and AtCPK5 both on the chip and in planta, while OsOlp1_I
significantly interact with AtCPK4 and AtCPK5 on the chip but only interacted with
AtCPK5 in plants (Figure 6.8 & 6.9). The interactions of TlOsm with AtCPK4 and
AtCPK5, which have been known for functions in plant stress signalling pathway,
demonstrate the functions of target osmotins in stress signalling pathways. In addition,
TlOsm and OsOlp1_A both conferred tolerance to cold, drought, and salinity
stresses in transgenic rice and interacted with AtCPK4 in living plants. AtCPK4 was
demonstrated to regulate ABA signal transduction in plant response to drought and
salinity stresses (Zhu et al., 2007). This suggests that interacting with AtCPK4 is
essential to transmit abiotic stress signals to acquire sufficient stress adaptation.
AtCPK5 has been demonstrated a positive regulator of plant signal transduction upon
pathogenic infection (Dubiella et al., 2013). All TlOsm, OsOlp1_A, OsOlp1_I
interacted with AtCPK5 in planta, suggesting their involvement in plant signalling

194 Chapter 6: Analysis of Protein-Protein Interactions of Osmotins from Stress Tolerant and Sensitive Species
defense to pathogens. Lack of interaction with AtCPK4 of OsOlp1_I probably
results in the failure to transduce abiotic stress signals that further leads to its
insufficient regulation of plant stress response, as compare to its allele OsOlp1_A.
Similarly, AtMS1 is involved in biosynthesis of compounds beneficial for plant
adaptation (its protein interaction network in Figure 6.11 C). Interactions of TlOsm
and OsOlp1_A with AtMS1 would contribute additional effects on their ability to
facilitate plant tolerance to abiotic stress. Hence, without interacting with AtMS1 of
OsOlp1_I would further limit OsOlp1_I functions in enhancing plant tolerance to
cold, drought, and salinity stresses. Moreover, in agreement with the results derived
from interaction of osmotins and Arabidopsis proteins on the chip, in N. benthamiana
plants, only TlOsm was found to interact with AtALDH7B4 (Figure 6.9). TlOsm
but not OsOlp1_A interacting with ALDH7B4 at least partially demonstrating to
the higher level of enhanced tolerance to drought and cold stress as demonstrated in
TlOsm rice plants over the OsOlp1_A plants. Failure to interact with key proteins
in stress responsive pathways explains for the failure to promote transgenic rice
tolerance to cold, drought and salinity stresses of OsOlp1_I.
Patade et al. (2013) showed that some stress-responsive genes including CBF1
(transcription factor), P5CS (osmotic adjustment), APX (antioxidant defense) were
activated in cold tolerant tomato expressing tobacco osmotin. This indicated that
osmotin should be an upstream modulator of transcription factor in the stress signal
transduction process. Choi et al. (2013) demonstrated that pepper osmotin
(CaOSM1) regulated hypersensitive cell death response and oxidative burst
signalling during infection of Xanthomonas campestris. Both CPK4 and CPK5 were
proven to regulate ROS signalling but CPK5 was likely specific for response to
pathogen stimuli (Gao et al., 2013; Dubiella et al., 2013). Interactions of TlOsm and
OsOlp1_A with both AtCPK4 and AtCPK5 suggested that these two osmotins
function in ROS signalling. OsOlp1_I interacted with AtCPK5 but not AtCPK4
suggested its function in signalling upon pathogenic stimuli. Zhu et al. (2007)
demonstrated that AtCPK4 regulated drought and salinity stress response through
ABA signal transduction and worked upstream of several ABA transcription factors.
The gene showed functions in regulating stomatal movement, osmotic adjustment and
lipid peroxidation inhibition that further lead to enhanced Arabidopsis plant tolerance
to drought and salt stresses. Considering the physiological changes in rice plants

Chapter 6: Analysis of Protein-Protein Interactions of Osmotins from Stress Tolerant and Sensitive Species 195
expressing TlOsm and OsOlp1_A, functions for TlOsm and OsOlp1_A were
also associated with stomatal closure, osmotic adjustment and lipid peroxidation
inhibition. Besides, TlOsm and OsOlp1_A showed interacting with AtMS1, which
is involved in plant response to chemical and within a biosynthesis pathways. Only
TlOsm (not OsOlp1_A) interacted with AtALDH7B4, a protein functions in
detoxification of aldehydes generated upon plant stress, which protects plants against
lipid peroxidation and oxidative stress (Kotchoni et al., 2006). Regarding localisation
of the proteins, TlOsm localises to the plasma membrane while AtCPK4 and
AtALDH7B4 are cytoplasmic proteins (Kotchoni et al., 2006; Zhu et al., 2007), and
AtMS1 is annotated as cytoplasmic or chloroplast protein. Thus, TlOsm is likely an
upstream regulator of these three proteins. Regarding the physiological differences of
rice plants expressing TlOsm or OsOlp1_A in comparison with OsOlp1_I, WT or
NT, and VC (Chapter 5), the mechanisms underlying TlOsm and OsOlp1_A
functions cold, drought, and salinity stress responses could be suggested. TlOsm
would transmit the stress signal by interacting with CPK4 homolog that further
activates ABA signal transduction leading to downstream adaptive response such as
stomatal closure, osmotic adjustment, and antioxidative defense response. Besides, it
would interact with rice MS1 homolog to regulate biosynthesis of compounds
beneficial for protecting rice plants from chemical toxicity. On the other hand, it would
interact with ALDH7B4 homolog that further mediates detoxification of aldehydes
generated by osmotic stress to prevent oxidation and lipid peroxidation. OsOlp1_A
would function in a similar way when interacting with CPK4 and MS1 homologs.
However, lack of interaction with ALDH7B4 homolog would be the reasons for less
efficiency in protect membrane damage leading to higher electrolyte leakage in
OsOlp1_A plant as compared to TlOsm plants (Figure 5.4). Without interactions with
CPK4, MS1, and ALDH7B4 homologs of OsOlp1_I would lead to failure to
transmit the stress signals and regulate other detoxification processes that result in
failure in improving rice plants to cold, drought, and salinity stress of OsOlp1_I.
In conclusion, research in this chapter has indicated that osmotin from T.
loliiformis, TlOsm, has more potential binding partners than osmotins from O. sativa.
In addition, OsOlp1_A from drought tolerant cultivar has two more binding partners
than OsOlp1_I from drought sensitive cultivar. The results are in agreement with the
hypothesis that protein with more functional binding sites interact with more proteins.

196 Chapter 6: Analysis of Protein-Protein Interactions of Osmotins from Stress Tolerant and Sensitive Species
The Arabidopsis protein interactors of TlOsm, OsOlp1_A and OsOlp1_I are
involved in the diverse biological processes and pathways of development and
adaptation. These interactors and pathways provide the testable targets for further
studies in exploiting osmotins for biotechnological applications in GMO crops, the
food industry and pharmaceuticals. The in planta experiments validated interactions
between the three osmotins and stress-responsive Arabidopsis proteins demonstrated
the functions of TlOsm and OsOlp1_A in stress signal transduction, adaptation, and
additional oxidative-stress detoxification for TlOsm. Shortage of in planta interaction
with the key stress-responsive components of OsOlp1_I provides evidence for its
limited functions in abiotic stress response, as compared with its allele, the
OsOlp1_A. These results provide evidence on the physical interactions of osmotins
with numbers of stress-responsive proteins in plants and contribute to present
knowledge and understanding insights into mechanisms of osmotin in regulation of
plant stress response. Moreover, the gene manipulation method and the N.
benthamiana transient expression system used in this study can be applied as an
alternative method for recombinant osmotin production.

Chapter 7: General Discussion 197
Chapter 7: General Discussion
Abiotic stresses such as drought, salinity, and extreme temperature are massive
challenges hindering the capacity of agriculture to meet the food demands of an
increasing global population. To feed the growing population we will need to produce
approximately 60% more food to meet the demands in 2050; this is the equivalent to
a 2.4% yield growth rate per annum for all crops. Currently, crop yield has an estimated
growth rate of 1.6%, 1.0%, 0.9%, and 1.3% for maize, rice, wheat, and soybean,
respectively (Ray et al., 2013). By looking at what causes the great levels of crop loss
we may be able to increase production. Approximately 50% yield loss of major food
crops are caused by abiotic stresses (Huang et al., 2012). Hence, besides high yielding,
future crops must be equipped with stress-adaptive traits to cope with adverse
conditions. To ensure global food security, the development of stress-adaptive crops
represents a key goal in constant supplying improved crop cultivars for commercial
cultivation. Genetic engineering high yielding crop cultivars with stress-adaptive traits
is considered a promising approach for developing such crops (Cominelli et al., 2013;
Oliver, 2014). Thus, characterisation of the key components controlling stress-
adaptive traits to be used in genetic engineering is in crucial need for the development
of resilient crops. Moreover, seeking genes from stress-tolerant species for engineering
into crops displays great promise as an effective strategy for introducing new stress-
adaptive traits into yield-improved crop cultivars (Mittler and Blumwald, 2010).
In this project, an osmotin gene from resurrection plant T. loliiformis (TlOsm)
was characterised and functionally analysed for abiotic stress response in various
systems, in comparison with two osmotin genes (OsOlp1_A and OsOlp1_I) identified
from drought-tolerant and –sensitive cultivars of stress-sensitive species O. sativa. The
common and specific characteristics of TlOsm were identified. Its involvement in plant
abiotic stress responses was analysed in T. loliiformis as well as in transgenic N.
tabacum and O. sativa. Its roles in enhancing plant tolerance to stress were validated
by comparative assessment transgenic rice expressing TlOsm, OsOlp1_A, OsOlp1_I,
and corresponding controls under cold, drought, and salinity stresses. The interactive
protein partners of the three osmotins were identified and pathways involving osmotin
interactors were also determined. Interactions between TlOsm, OsOlp1_A, or

198 Chapter 7: General Discussion
OsOlp1_I, with some stress-responsive proteins were validated in living N.
benthamiana plants. The study indicates the role of TlOsm in plant response to multiple
abiotic stresses and its additional effects over osmotins from sensitive species, O.
sativa. The study highlights potential applications of TlOsm for engineering crops with
improved tolerance to multiple stresses such as cold, drought, and salinity. The study
also deepens our understanding the functions and molecular mechanisms of osmotins
in regulating plant stress response and provides evidence, for the first time, the
physical interactions of osmotins with plant proteins in planta.
7.1 TlOsm has more functional efficacy in regulation of plant stress response
than rice osmotins
Resurrection plants have evolved unique stress-tolerant mechanisms that enable
them rapidly respond to stress, effectively protecting cellular components during
stress, whilst allowing rapid recovery to full metabolic functions within 48 – 72 h of
watering (Peters et al., 2007). Proteomic analyses on these plants during dehydration
have shown the increased abundance of many proteins functioning in antioxidance,
energy metabolism, and macromolecule protection (Dinakar and Bartels, 2013; Ingle
et al., 2007; Jiang et al., 2007). In addition, enzymatic activities of many proteins
related to antioxidant synthesis, sugar metabolism, and chaperones were found
increased during dehydration in various resurrection plants (Petersen et al., 2012;
Rohrig et al., 2006; Whithaker et al., 2001). In these studies, the increased abundance
and enzymatic activities and maintained phosphorylation activities of stress-
responsive proteins positively correlated with the accumulation of sugar metabolites,
antioxidants and other cellular protective compounds. Perhaps, proteins of resurrection
plants have evolved additional functions that enable them to more effectively mitigate
stress. Similar molecular, biochemical, physiological, and structural changes for early
response to water deficit, for promoting survival mechanisms during desiccation, and
for rapid recovering upon rehydration with minimal damage have been reported in T.
loliiformis (Karbaschi et al., 2016; Williams et al., 2015). Thus, we hypothesised that
stress-responsive proteins from T. loliiformis evolve additional functions than their
respective counterparts of sensitive species.
Comparative bioinformatics analysis of functional binding residues of TlOsm
and rice osmotins from drought-tolerant vs. -sensitive cultivars (OsOlp1_A vs.
OsOlp1_I) indicated that TlOsm contains additional glucan-binding and

Chapter 7: General Discussion 199
phosphorylation sites as well as unique sites with enzymatic functions in sugar
metabolism. The tolerant cultivar OsOlp1_A contains three more glucan-binding
sites than its sensitive counterpart OsOlp1_I. Binding and hydrolysing glucan
molecules are essential for the antifungal activities of an osmotin (Liu et al., 2010;
Mani et al., 2012). The glucan-hydrolytic functions of osmotin in plant abiotic stress
response are not clear though glucan-hydrolytic products have been suggested to be
used for development of organelle and cell membrane and for osmotic adjustment
(Dway and Smille, 1971; Satoh et al., 1976). Eight, five, and two glucan-binding
residues were predicted for TlOsm, OsOlp1_A, and OlOlp1_I, respectively
(Table 3.2). Moreover, osmotin has been proven to activate MAP kinase signalling
pathway (Narasimhan et al., 2005; Narasimhan et al., 2001). In plants,
phosphorylation reactions play the central signalling role that translates environmental
stimuli into cellular response. These reactions are common in stress signal transducers
such as the MAP kinases and calcium-dependent protein kinases and are performed by
phosphorylation sites (Mohanta and Sinha, 2016; Sinha et al., 2011; Wurzinger et al.,
2011). Phosphorylation reactions are maintained in resurrection plants during
dehydration and are believed to be essential for protecting their cells from damaged by
stress (Dinakar and Bartels, 2013; Rohrig et al., 2006). TlOsm, OsOlp1_A, and
OlOlp1_I all contain the potential phosphorylation residues but the number of
residues is higher in TlOsm (64 residues) than in either rice osmotin (15 residues for
both). In addition to these sites, TlOsm possesses 4 functional sites for sugar
metabolism, neither rice osmotin contains a similar site. Soluble sugar metabolism is
a key pathway in plant sensing and response to abiotic stress (Rosa et al. 2009). The
accumulation of remarkably high soluble sugars during desiccation is a unique feature
of desiccation tolerant plants (Dinakar and Bartels, 2013; Gaff and Oliver, 2013).
Therefore, we speculated that TlOsm is more effective in regulating plant response
to stresses. This assumption was validated in rice plants expressing these osmotins.
Investigating the response of transgenic rice expressing TlOsm, OsOlp1_A, or
OsOlp1_I upon exposure to cold, drought, and salinity stresses proved that levels of
rice stress tolerance positively correlate with the number of functional sites of the
osmotin that plants expressing. The highest levels of enhanced stress tolerance were
found in TlOsm plants, following by OsOlp1_A plants and lowest in OsOlp1_I plants.
Since OsOlp1_I did not confer stress tolerance in transgenic rice (Chapter 5), here the

200 Chapter 7: General Discussion
higher functional efficacy in regulating plant response to stresses of the osmotins from
tolerant and sensitive species is compared between TlOsm and OsOlp1_A.
OsOlp1_A was isolated from a drought tolerant rice cultivar. Similar to TlOsm,
OsOlp1_A was induced by drought (personal communication with Raveendran,
TNAU). When exposure to cold and drought stresses, transgenic OsOlp1_A plants
showed lower levels of tolerance than TlOsm plants in both physiological and
agronomic traits. The lower tolerance levels of OsOlp1_A plant were demonstrated by
lower growth rate, tillering capacity, dry biomass, survival rate, and grain yield; which
were associated with less ability to retain water, maintain membrane integrity and
photosynthesis efficiency. When exposure to salinity stress, TlOsm plants displayed
better water retention than OsOlp1_A plants (Figure 5.3). Thus, there might be
common functional features between TlOsm and OsOlp1_A that made both
TlOsm and OsOlp1_A conferred tolerance to these stresses. There might be unique
features for TlOsm that made TlOsm plants performed better than OsOlp1_A plants
under cold, drought, and salinity stresses.
Protein interactions regulate various cellular functions and provide basis for
understanding molecular mechanisms of protein functions (Hu et al. 2005). Several
interactions of tobacco osmotin with fungal and mammalian proteins have been
demonstrated (Ibeas et al. 2000; Narasimhan et al. 2005; Narasimhan et al. 2001; Yun
et al. 1997). These interactions have provided useful information for elucidation of
mechanisms underlying osmotin toxicity to fungi and its function in activating AMP
cascade in mammalian cells. To date, information on plant proteins interacting with
osmotins and evidence of osmotin interacting with other proteins in living plant cells
is still missing in the literature. For understanding insights into osmotin functions in
regulating plant response to stress, plant proteins interacting with TlOsm,
OsOlp1_A, and OlOlp1_I were identified and some interacting complexes in
living plants were also determined. To understand the functions underlying the
enhanced effects of TlOsm to improve rice stress tolerance, the potential interactive
protein partners of TlOsm and OsOlp1_A were compared. TlOsm had 28 more
interactive protein partners than OsOlp1_A (267 vs. 239) and the two osmotins share
236 common interactors. Thus, understanding the different interactors of the two
osmotins would provide the key insight into functional efficacy of TlOsm over
OsOlp1_A. Among the different interactors, 21 proteins were found unique

Chapter 7: General Discussion 201
interactors of TlOsm, not interacted with either of rice osmotins. All the 21 proteins
were found involved in three biological processes of plant response to abiotic stresses,
to chemicals, and to endogenous stimuli (Figure 6.5). This suggests that TlOsm
potentially interact with more stress-responsive proteins than OsOlp1_A. Among
these 21 TlOsm interactors, AtALDH7B4 had been demonstrated to enhanced
Arabidopsis plants tolerant to drought and salinity by protecting plants from damages
of lipid peroxidation and oxidation and effective aldehyde detoxification (Kotchoni et
al. 2006). AtALDH7B4 interacted with only TlOsm in living N. benthamiana, not
with OsOlp1_A. Thus, TlOsm interacting with AtALDH7B4 homologs probably
activates the system that mitigates damages caused by lipid peroxidation and
oxidation. This interaction ultimately contributes to its additional effects on enhanced
plants tolerant to cold, drought and salinity stresses.
It is possible that osmotin protein from tolerant species T. loliiformis has evolved
with more functional binding sites than osmotin proteins from sensitive species O.
sativa. These extra functional binding sites, including the extra number of glucan-
binding and phosphorylation residues and unique enzymatic residues functioning in
sugar metabolism, would enable TlOsm interact with more stress-responsive proteins
when plants exposed to stresses. As consequence of the interactions, more stress-
responsive processes and pathways would be activated. These activations would result
in more effective mitigation of cellular damages and enhanced physiological and
morphological responses for adaptation. Thus, proteomic evolution of TlOsm would
provide it additional functions that enhance TlOsm efficacy of regulating plant
response to stresses.
7.2 TlOsm is a multi-functional protein playing a role in plant response to
stresses
Previous studies on osmotins have indicated their multi-functional roles in plant
response to both abiotic and biotic stresses (Husani and Rafiqi 2012; Kumar et al.
2015; Viktorova et al. 2012). Analyses of transgenic plants expressing various osmotin
genes from diverse plant species (Table 1.1) have emphasised their potential for use in
genetic engineering of crops with enhanced tolerance to multiple stress factors. This is
the first time an osmotin from a resurrection plant has been characterised. In agreement
with the functional roles of other osmotins from previous studies, results in this study

202 Chapter 7: General Discussion
demonstrated that TlOsm play multi-functional role in plants response to stresses. In
addition, novel characteristics of TlOsm was identified.
TlOsm was previously isolated from T. loliiformis drought-induced cDNA
library, suggesting its involvement in plant response to drought. Sequence analysis of
TlOsm indicated it an osmotin with all conserved characteristics, with closest
relationship to osmotins of monocots, but including a non-homologous sequence of 50
AA at its C-terminus. Structural-to-functional predictions of TlOsm, in comparison
with two rice osmotins, proposed the multi-functional nature of TlOsm and its novel
characteristics. Functional predictions indicate two types of TlOsm binding sites
(glucan-binding and phosphorylation sites) in common with other osmotins and one
type of binding sites (sites with enzymatic functions in sugar metabolism) unique to
TlOsm. TlOsm contains three types of potential functional activities in different
biological processes of plant response to abiotic and biotic stresses, suggesting the
multiple functions of TlOsm in both abiotic and biotic defense response of plants.
Gene activated by stress stimuli are likely involved in the response to those
stresses. Profiling the transcriptional expression of TlOsm in native T. loliiformis
plants during development and during cold, drought, heat, and salinity stresses
indicated the involvement of TlOsm in plant response to cold, drought, and salinity
stresses (Figure 3.6). TlOsm was activated in both root and shoot of T. loliiformis
plants at noticeably high levels at very early stage of cold, drought, and salinity
stresses. The remarkable activation of TlOsm upon various stresses suggested its role
in multi-stress response of T. loliiformis.
The multi-functional roles in plant stress response of osmotins has been
demonstrated and transgenic plants expressing osmotin have exhibited enhanced
tolerance to cold, drought, salinity stresses and resistant to bacterial and fungal
infections (summarized with reference in Table 1.1). In transgenic osmotin plants,
osmotins have shown function in activating various molecular, chemical, and
physiological changes that ultimately resulted in morphological changes for
adaptation. The roles of TlOsm in plant response to multiple abiotic stress were also
validated in transgenic rice in comparision with the rice osmotins (Chapter 5).
Analyses of physiological and agronomic traits of transgenic rice expressing TlOsm,
OsOlp1_A, OlOlp1_I and controls subjected to cold, drought, and salinity stresses
proved the roles of TlOsm and OsOlp1_A in enhancing rice plants tolerance to
these stresses. Across two generations (T0 and T1) of transgenic rice plants and

Chapter 7: General Discussion 203
regardless the developmental stages (seedling and reproductive stages) when stresses
applied, TlOsm and OsOlp1_A plants showed enhanced shoot growth rate (Figure 5.1),
tiller number (Figure 5.2), dried biomass (Table 5.2 & 5.3), survival rate (Figure 5.10),
and grain yield (Table 5.4). The enhanced stress tolerance of TlOsm and OsOlp1_A
rice plants was accompanied with the abilities to greater retain leaf water content
(Figure 5.3), to better maintain cell integrity (Figure 5.4), and to more effective
regulate photosynthesis-related activities (Figure 5.5-5.7). These physiological
changes were similar to those of other transgenic osmotin plants (refer to Section
5.4.1). All the tested plants were generated from the same genetic background of rice
cultivar Nipponbare. The physiological and agronomic traits associated with rice stress
tolerance were exhibited in TlOsm and OsOlp1_A plants. Thus, the tolerance to cold,
drought, and salinity stresses of TlOsm and OsOlp1_A rice plants must be the
consequence of TlOsm and OsOlp1_A expression. These results demonstrate the
functions of TlOsm (and OsOlp1_A) in rice response to multiple stresses including
cold, drought, and salinity.
TlOsm was demonstrated to interact with various Arabidopsis proteins, which
are involved in diverse biological processes and pathways for plant signalling, abiotic
stress response, plant-pathogen interaction, biosynthesis, and metabolism (Figure 6.5,
Table 6.4, Table 6.5, Table 6.6, Appendix E-Table 2&3). Interacting with significant
numbers of proteins in the conserved and fundamental pathways in plant development
and adaptation such as fructose and mannose metabolism, glycolysis, and pentose
phosphate pathways displays different functions of TlOsm. In planta, TlOsm was
proven to interact with four stress-responsive proteins in signalling, biosynthesis, and
detoxification pathways. The involvements of TlOsm interactors in diverse biological
processes and pathways reflect the multiple functions of TlOsm.
7.3 TlOsm (and OsOlp1_A) likely contribute to plant stress response through
signal transduction
In plants, efficacy of stress responses depend on early signal perception and rapid
signal transduction that activate the appropriate cellular responses such as gene
transcriptional reprogram, hormonal alteration, and production of protective
compounds that subsequently result in adaptation (Huang et al., 2012; Mishra et al.,
2016; Zhu 2016). The characteristics of TlOsm revealed from this research suggest
its contribution to plant stress response through signal transduction.

204 Chapter 7: General Discussion
Studies have shown that genes activated early are involved in stress signal
sensing and transduction while those with delayed activation are involved in later
adaptive responses (Agarwal et al., 2013; Zhu, 2016). Transcriptional expression of
TlOsm upon major abiotic stresses indicated its early activation in cold, drought, and
salinity stresses (Figure 3.6 E-J). TlOsm was activated at highest levels in both root
and shoot within 1-3 h upon cold stress, at 80-60% of leaf RWC in in drought stress,
and at 1-6 h upon salinity stress exposure. In addition, the plasma membrane is a
sensory site and a location for many proteins functioning in environmental signal
interpretation and triggering cellular responses (Tan et al., 2008). TlOsm was
localised to the plasma membrane (Figure 3.10) regardless of stress condition (Figure
3.11). Early activation of TlOsm and its plasma membrane localisation suggest its
functions in stress signalling pathways.
Previous studies on plant stress response have indicated some common signal
transduction pathways shared by cold, drought and salinity stress responses that
subsequently regulate the expression of similar gene sets and result in similar adaptive
response of plants to more than one stress (Fujii and Zhu, 2012; Huang et al., 2012;
Mishra et al., 2016; Xiong and Zhu, 2002). These shared signalling pathways facilitate
plant adaptive responses and protect them from multiple environmental stresses.
Hence, single gene functioning in multiple stress response is likely involved in the
shared signalling pathways. TlOsm was activated by cold, drought, and salinity stresses
in T. loliiformis and thus involved in these stress responses of T. loliiformis. The
enhanced cold, drought, and salinity stress tolerance of transgenic rice plants was
achieved by expressing either TlOsm or OsOlp1_A. Therefore, it is likely that TlOsm
(and OsOlp1_A) facilitate plant stress response via signalling pathways.
The functions in stress signalling pathways of TlOsm and OsOlp1_A were
strongly confirmed by their interactions with AtCPK4 and AtCPK5 in N.
benthamiana plants (Figure 6.6 & 6.7). CPK4 and CPK5 are the members of well-
known plant stress signal transducers, the calcium-dependent protein kinase family.
CPK4 and CPK5 have been demonstrated to regulate plant defense through generation
of ROS signalling by phosphorylating NADPH oxidase/ RBOH (Gao et al., 2013;
Kobayashi et al., 2007). AtCPK4 was proven to function in plant abiotic stress response
by up-stream modulating abscisic acid signal transduction via phosphorylating ABF1
and ABF4 transcription factors (Zhu et al., 2007). Similarly, AtCPK5 was proven to

Chapter 7: General Discussion 205
regulate immune signalling by functioning in rapid cell-to-cell propagation and
mediating phyto-hormone defense response to plant pathogens (Dubiella et al., 2013).
The two interactive partners of TlOsm and OsOlp1_A are within the identified signal
transduction pathways indicating the function of TlOsm and OsOlp1_A in stress
signal transducing. It is not know the mode of action for AtCPK4 or AtCPK5 with
TlOsm or OsOlp1_A, possibly via phosphorylation, because both TlOsm and
OsOlp1_A contain potential phosphorylation sites and phosphorylation is typical
reaction of calcium-dependent protein kinase for decoding stress signals (Mohanta and
Sinha, 2016). It is clear that interacting with CPK4 is required for TlOsm and
OsOlp1_A to activate plant adaptive response to cold, drought, and salinity stresses.
Lacking of interaction with CPK4, at least, partially contributed to the failure to enhance
rice tolerance to cold, drought, and salinity stress of OsOlp1_I.
Besides, AtCPK4 and AtCPK5, TlOsm was shown to interact with AtMS1
and AtALDH7B4 in planta. It is not known from the experiments that TlOsm is
upstream or downstream of the CPK4 and CPK5 in the signalling network, as well
as of the AtMS1 and AtALDH7B4. Here, the subcellular localisation of the
interactive proteins should be considered in the interpretation. AtCPK4 was
demonstrated a cytoplasmic protein (Dammann et al., 2003); while AtCPK5 is a
plasma membrane protein (Lu and Hrabak, 2013). AtALDH7B4 was proven a
cytoplasmic enzyme by Kotchoni et al (2006) and AtMS1 was annotated a
cytoplasmic protein. TlOsm is a plasma membrane protein. Among four proteins
validated to interact with TlOsm in living plants, three of them are cytoplasmic
proteins. This evidence together with early activation of TlOsm upon cold, drought,
and salinity stress, it is likely that TlOsm is an upstream regulator of AtCPK4,
AtMS1, and AtALDH7B4.
The mechanics by which TlOsm mediates plant response to cold, drought, and
salinity stresses remain to be further detailed, due to the protein-protein interaction
network of TlOsm was not fully validated in planta. However, based on the existing
evidences, we can speculate a plausible mechanism underlying TlOsm functions. (1)
Interaction with AtCPK4 homolog is required for TlOsm and OsOlp1_A to transduce
stress signals that further activate down-stream ABA signalling and abiotic stress
responses such as osmotic adjustment, stomatal regulation, and membrane protection. (2)
Interaction with AtMS1 homolog is probably necessary for TlOsm and OsOlp1_A to

206 Chapter 7: General Discussion
regulate biosynthesis of compounds beneficial for salinity stress tolerance. (3) Interaction
with AtALDH7B4 homolog promotes TlOsm functions in enhanced aldehyde
detoxification, reduced lipid peroxidation, and increased ROS scavenge. This interaction
at least partially contributed to additional effects of TlOsm over OsOlp1_A in enhanced
rice tolerance to cold, drought, and salinity stresses. (4) AtCPK5 is required for signal
transduction upon pathogen infection (Dubiella et al., 2013), interaction of the osmotins
with AtCPK5 (or its homologs) might facilitate pathogenic signal transduction but might
not be necessary for abiotic stress response. This point is evidenced by the interaction of
OsOlp1_I and AtCPK5 occurred in planta but OsOlp1_I did not confer tolerant to
cold, drought, and salinity stresses in transgenic rice.
7.4 TlOsm has potential for use in improving crop tolerance to multiple abiotic
stresses
In field conditions, plants are exposed to multiple abiotic and biotic stresses,
either simultaneously or successively. The survival and reproduction of plants exposed
to stresses depend on the rapid perception of stress and signal transduction to switch
on adaptive responses (Mishra et al., 2016). Various studies have indicated significant
overlaps in signalling pathways involved in abiotic and biotic stress responses
(AbuQamar et al., 2009; Atkinson and Urwin, 2012; Huang et al., 2012; Mishra et al.,
2016). Thus, key components conserved in these overlapping pathways may play a
crucial role in eliciting plant adaptive responses to different stresses. Engineering crops
with the master regulator in stress signalling pathways has been considered as an
effective strategy for developing crops with broad spectrum of tolerance (Bhatnagar-
Mathur et al., 2008; Cominelli et al., 2013; Mittler and Blumwald, 2010). TlOsm has
exhibited the characteristics of a key modulator in regulating plant tolerant to multiple
stresses throughout this research. These characteristics are described as its early
transcriptional activation under different stresses and its plasma membrane localisation
(Chapter 3), the diversity of biological processes and pathways that TlOsm interactive
protein partners are involved in (Chapter 6), and especially the sufficient enhanced
tolerance to cold, drought, and salinity stress of transgenic rice constitutively
expressing TlOsm (Chapter 5). The results demonstrate the potential of TlOsm for uses
in genetic engineering plants with enhanced tolerance to multi-stress factors. It should
be noticed that osmotin gene from drought-tolerant rice cultivar (OsOlp1_A) can also
be used for develop multi-stress tolerant crop with less efficacy than TlOsm.

Chapter 7: General Discussion 207
7.5 Concluding remarks
To meet the food demands of an increasing population and to mitigate the effects
of changing climate on agricultural production, the development of stress-adaptive
crops is in crucial need. The combination of stress-adaptive traits from naturally
tolerant species into elite crop cultivars is desired and represents a key goal for genetic
engineering. Thus, identification of key components regulating stress-adaptive traits
in tolerant species is required for introduce new stress-adaptive traits into crop species.
In this project, molecular and functional characteristics of an osmotin from desiccation
tolerant plant T. loliiformis were analysed and shown potential for use in crop
improvement with multiple stress tolerant traits.
For effective utilisation of T. loliiformis genetic resource in improving crop
tolerance to stresses, a deep understanding of molecular basis and functional efficacy
of genes controlling stress tolerant traits in this species is needed. This research
presents the identification of conserved and novel characteristics of TlOsm through the
comparative analyses of TlOsm with osmotin genes from stress sensitive species, O.
saliva. The analyses were made through investigation of potential functional sites of
the osmotin proteins based on structural-to-functional predictions, identification of
their interactive protein partners and pathways, and assessment of transgenic rice
expressing each osmotin gene for enhanced abiotic stress tolerance. The results suggest
the evolved characteristics of TlOsm for more functional efficacy in regulating plant
tolerant to stresses. These characteristics were demonstrated by extra functional
binding sites in TlOsm protein structure that enable the protein interact with more
stress-responsive genes. These characteristics were validated by additional effects of
TlOsm over rice osmotins, the OsOlp1_A and OsOlp1_I, in enhanced transgenic
rice tolerance to cold, drought, and salinity stresses. Results from evaluation of
transgenic rice expressing the osmotins under cold, drought and salinity stress indicate
the functional role of TlOsm and OsOlp1_A in enhanced rice tolerant to stresses
and that the tolerant traits pass on the next generation. Importantly, the results provide
molecular basis for speculating the mechanisms by which TlOsm and OsOlp1_A
mediate plant response to osmotic stresses. The results highlight the values of T.
loliiformis genetic resource for searching stress-responsive genes for combining into
crops.

208 Chapter 7: General Discussion
In conclusion, the results highlight the additional effects on enhanced plant stress
tolerance of osmotin from tolerant species over those from sensitive species. The
results indicate the potential of TlOsm for use in genetic engineering of crops with
improved tolerance to multiple abiotic stresses including cold, drought, and salinity.
Through the analyses of TlOsm protein structure and its interactive protein partners,
TlOsm also showed potential functions in regulating plant response to biotic stress.
Further research should investigate if TlOsm plays role in biotic stress response of
plants. The contributions of glucan-binding sites to osmotin functions in plant response
to abiotic stress need to be further detailed, probably by point mutation of binding sites.
To dissect the functions of TlOsm in regulating sugar metabolism, analysis of sugar
metabolites in transgenic TlOsm plants should be carried out. In addition, some
TlOsm protein interactors involved in the pathways related to human diseases should
be interesting targets for further testing to exploit this protein as a therapeutic agent.

Appendices 209
Appendices
Appendix A
Chapter 2 supplementary figures
Appendix A-Figure 1. Maps of vectors used as templates for amplification of Gus-reporter
gene (A), OsOlp1_A (B), OsOlp1_I (C) and TlOsm (D).
A
pCambia 2301- TlOsm
10518 bp
CDS 2
CDS 3
CDS 4
Tl Osm
Misc Feature 1
Misc Feature 2
Misc Feature 3
Misc Feature 4
Misc Feature 5
Misc Feature 6
Misc Feature 7
Promoter P 1
Promoter P 2
Promoter P 3
Rep Origin 1Rep Origin 2
BstEII (947)
ApaLI (5382)
ApaLI (5880)
NcoI (360)
NcoI (822)
NcoI (8648)
13ABRIKP OsOSM IR64 pMK-RQ
3022 bp
KanR
OsOSM IR64
Col E1 origin
ApaLI (1592)
AvaI (524)
NcoI (2330)
PstI (879)
PstI (2717)
D C
B
13ABRILP OsOSM Apo pMK-RQ
3022 bp
KanR
OsOSM Apo
Col E1 origin
AvaI (524)
NcoI (2330)
ApaLI (1043)
ApaLI (1592)
PstI (879)
PstI (2717)

210 Appendices
Appendix A-Figure 2. Maps of vectors used to generate the pEAQ-436 destination vector.
The pL436 (A) was used as template to amplify the fragment from AttR1 to the end of 2x IgG
binding domain with the addition of AgeI restriction site before AttR1 and the KDEL and StuI
restriction site after the 2x IgG binding domain; the pEAQ-HT was served as the backbone for
the insertion of the amplicon from (A) within the AgeI and StuI sites.
pEAQ-HT
10003 bp
P19
NPTIII
TrfA
NPTII
enhancer region
HISx6
HISx6
C1
C3
35S promoter
CaMV 35S promoter
ColE1
OriV 35S terminator
Nos Terminator
CPMV RNA-2 3'UTR
CPMV RNA-2 5'UTR
LB
RB
AgeI (1296)
StuI (1356)
pYL436 (AY737283)
12607 bpccdB
TMV U1 omega sequence
attR1-CmR-ccdB-attR2 GATEWAY cassette
9x myc tag
6x HIS tag
protease 3C cleav age site
2x IgG binding domain
Nos terminator
Cm(R)
SpecR
duplicated CaMV 35S promoter
attR1
attR2
ClaI (7415)
NcoI (1761)
NcoI (11619)
ApaLI (2360)
ApaLI (8362)
ApaLI (8860)
ApaLI (9952)
A
B
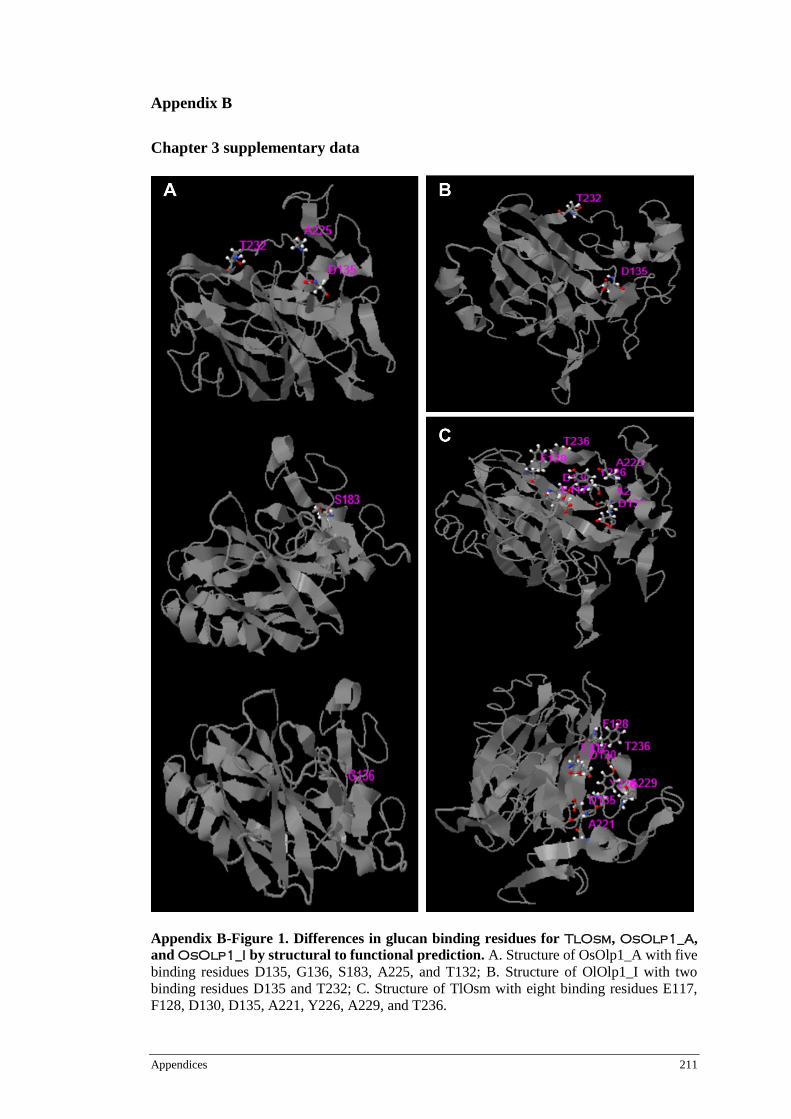
Appendices 211
Appendix B
Chapter 3 supplementary data
Appendix B-Figure 1. Differences in glucan binding residues for TlOsm, OsOlp1_A,
and OsOlp1_I by structural to functional prediction. A. Structure of OsOlp1_A with five
binding residues D135, G136, S183, A225, and T132; B. Structure of OlOlp1_I with two
binding residues D135 and T232; C. Structure of TlOsm with eight binding residues E117,
F128, D130, D135, A221, Y226, A229, and T236.
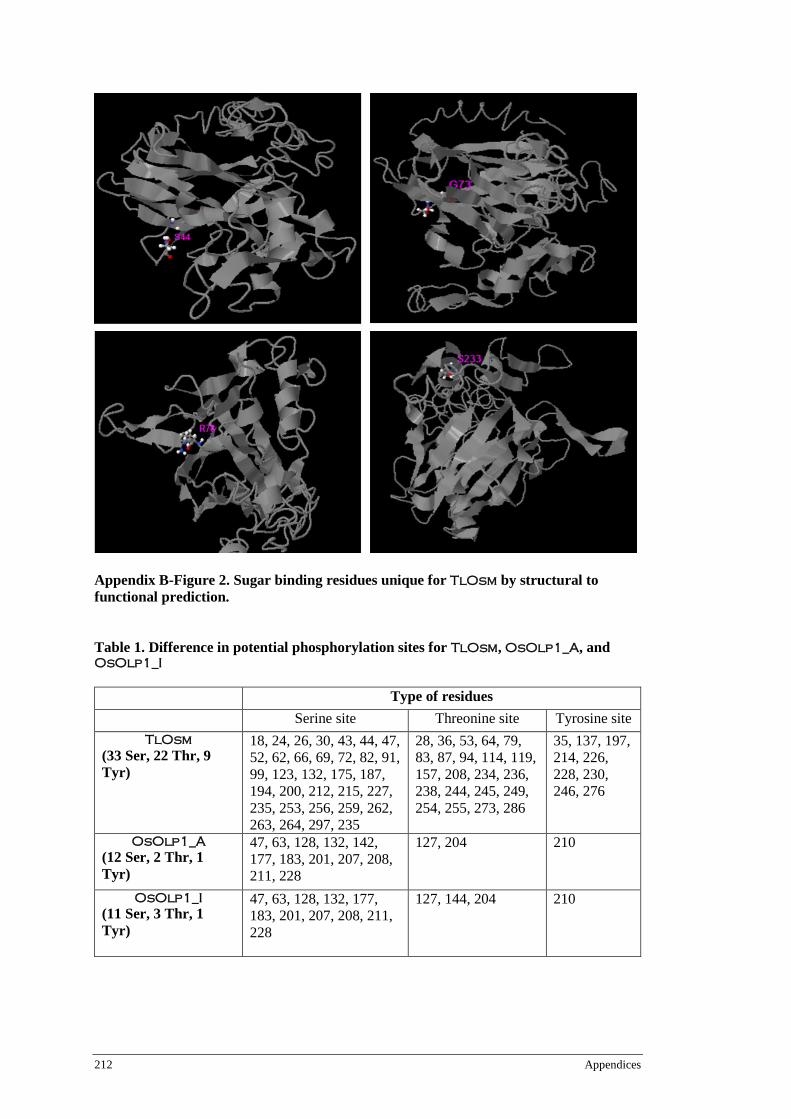
212 Appendices
Appendix B-Figure 2. Sugar binding residues unique for TlOsm by structural to
functional prediction.
Table 1. Difference in potential phosphorylation sites for TlOsm, OsOlp1_A, and OsOlp1_I
Type of residues
Serine site Threonine site Tyrosine site
TlOsm
(33 Ser, 22 Thr, 9
Tyr)
18, 24, 26, 30, 43, 44, 47,
52, 62, 66, 69, 72, 82, 91,
99, 123, 132, 175, 187,
194, 200, 212, 215, 227,
235, 253, 256, 259, 262,
263, 264, 297, 235
28, 36, 53, 64, 79,
83, 87, 94, 114, 119,
157, 208, 234, 236,
238, 244, 245, 249,
254, 255, 273, 286
35, 137, 197,
214, 226,
228, 230,
246, 276
OsOlp1_A
(12 Ser, 2 Thr, 1
Tyr)
47, 63, 128, 132, 142,
177, 183, 201, 207, 208,
211, 228
127, 204 210
OsOlp1_I
(11 Ser, 3 Thr, 1
Tyr)
47, 63, 128, 132, 177,
183, 201, 207, 208, 211,
228
127, 144, 204 210

Appendices 213
Appendix C
Chapter 4 supplementary information
Media and solutions for rice callus induction and transformation
N6 Stock Solution 1: Macronutrients (20x concentrated)
Ingredients
Quantity (g) per 1 L
stock
Quantity (mg) per 1 L
N6
KNO3 56.6 2,830
(NH4)2SO4 9.26 463
MgSO4.7H2O 3.7 185
KH2PO4 8 400
CaCl2.2H2O 3.32 166
N6 Stock Solution 2: Micronutrients (100x concentrated)
Ingredients
Quantity (mg) per 1 L
stock
Quantity (mg) per 1 L N6
KI 80 0.8
H3PO3 160 1.6
MnSO4.4H2O 440 4.4
ZnSO4.7H2O 150 1.5
Na2MoO4.2H2O 25 0.25
N6 Stock Solution 3: Vitamins (1000 x concentrated)
Ingredients
Quantity (mg) per 100ml
stock
Quantity (mg) per 1L
N6
Nicotinic Acid 50 0.5
Pyrodoxin-HCl 50 0.5
Myo-Inositol 1,000 10
Thiamine-HCl 50 0.5
Glycine 100 1

214 Appendices
N6 Stock Solution 4: Fe-EDTA (100 x concentrated)
Ingredients
Quantity (mg) per 1 L
stock
Quantity (mg) per 1L
N6
Na2EDTA.2H2O 3,725 37.25
FeSO4.7H2O 2,785 27.85
N6 basal medium and vitamins from stock solutions
Ingredients Quantity per 1 L N6
N6 stock solution 1 50 ml
N6 stock solution 2 10 ml
N6 stock solution 3 1 ml
N6 stock solution 4 10 ml

Appendices 215
Appendix D
Chapter 5 supplementary information
Appendix D – Table 1. Plant height before and after stress treatments at seedling stage
Treatment Plants Plant height (cm) at
day 0
Plant height (cm) at
day 18
Unstressed set 1 OsOlp1_A 12.59 ± 0.92 27.92 ± 1.69
Unstressed set 1 OsOlp1_I 12.58 ± 1.02 28.14 ± 1.75
Unstressed set 1 TlOsm 12.17 ± 0.70 24.56 ± 1.57
Unstressed set 1 VC 12.81 ± 0.93 28.30 ± 1.65
Unstressed set 1 WT 12.95 ± 0.73 28.79 ± 1.52
Drought OsOlp1_A 12.84 ± 0.46 22.34 ± 0.76
Drought OsOlp1_I 12.73 ± 0.46 20.79 ± 0.84
Drought TlOsm 12.56 ± 0.41 22.76 ± 0.84
Drought VC 12.72 ± 0.53 20.20 ± 0.78
Drought WT 12.86 ± 0.44 20.28 ± 0.71
Salinity OsOlp1_A 13.15 ± 0.48 23.10 ± 0.68
Salinity OsOlp1_I 12.85 ± 0.50 20.58 ± 0.65
Salinity TlOsm 12.29 ± 0.39 22.11 ± 0.65
Salinity VC 12.82 ± 0.46 19.22 ± 0.58
Salinity WT 12.88 ± 0.49 18.66 ± 0.60
Treatment Plants Plant height (cm) at
day 0
Plant height (cm) at
day 25
Unstressed set 2 OsOlp1_A 13.00 ± 0.29 29.46 ± 0.98
Unstressed set 2 OsOlp1_I 13.02 ± 0.30 29.57 ± 0.76
Unstressed set 2 TlOsm 12.60 ± 0.24 26.56 ± 0.78
Unstressed set 2 VC 13.01 ± 0.33 29.45 ± 1.35
Unstressed set 2 WT 13.44 ± 0.34 29.25 ± 1.31
Cold OsOlp1_A 13.07 ± 0.56 16.96 ± 0.35
Cold OsOlp1_I 13.08 ± 0.47 15.47 ± 0.27
Cold TlOsm 12.53 ± 0.40 16.97 ± 0.29
Cold VC 13.12 ± 0.52 15.47 ± 0.33
Cold WT 12.95 ± 0.49 15.18 ± 0.28
Data are expressed as mean ± SE of 135 plants in set 1 and 120 plants in set 2

216 Appendices
Appendix D – Table 2. Plant height before and after stress treatments at reproductive
stage
Treatment Plants Plant height (cm)
at day 0
Plant height (cm)
at day 18
Unstressed NT 22.50 ± 0.42 33.75 ± 0.65
Unstressed OsOlp1_A 21.74 ± 0.33 31.74 ± 0.32
Unstressed OsOlp1_I 22.52 ± 0.36 34.34 ± 0.59
Unstressed TlOsm 21.29 ± 0.39 30.75 ± 0.37
Unstressed VC 22.12 ± 0.36 33.99 ± 0.68
Drought NT 22.86 ± 0.36 28.17 ± 0.34
Drought OsOlp1_A 21.92 ± 0.31 28.59 ± 0.32
Drought OsOlp1_I 22.43 ± 0.40 28.25 ± 0.36
Drought TlOsm 20.90 ± 0.33 28.95 ± 0.31
Drought VC 22.42 ± 0.41 27.91 ± 0.39
Salinity NT 22.60 ± 0.38 28.82 ± 0.40
Salinity OsOlp1_A 20.06 ± 0.34 30.17 ± 0.29
Salinity OsOlp1_I 22.45 ± 0.34 29.63 ± 0.32
Salinity TlOsm 21.67 ± 0.35 29.76 ± 0.34
Salinity VC 22.88 ± 0.42 28.37 ± 0.32
Data are expressed as mean ± SE of 30 plants

Appendices 217
Appendix E
Chapter 6 supplementary information
Appendix E-Table 1. Description of Arabidopsis proteins interacting with TlOsm,
OsOlp1_A, and OsOlp1_I on the chip
TAIR-ID Description Interacting with
# of
hits
OsOlp1_A OsOlp1_I TlOsm
AT1G01080 RNA-binding (RRM/RBD/RNP
motifs) family protein X X X 3
AT1G04340 HR-like lesion-inducing protein-like
protein X 1
AT1G04420 NAD(P)-linked oxidoreductase
superfamily protein X X X 3
AT1G04550 AUX/IAA transcriptional regulator
family protein (IAA12) X X X 3
AT1G05010 Ethylene-forming enzyme (EFE) X X X 3
AT1G05410 CDPK adapter, putative (DUF1423) X X X 3
AT1G07140 Pleckstrin homology (PH) domain
superfamily protein (SIRANBP) X X X 3
AT1G07750 RmlC-like cupins superfamily protein X X X 3
AT1G07890 Ascorbate peroxidase 1(APX1) X X X 3
AT1G09630 Ras-related protein RABA2a X X X 3
AT1G10230
E3 ubiquitin ligase SCF complex
subunit SKP1/ASK1 family
protein(SK18) X X X 3
AT1G10700 Phosphoribosyl pyrophosphate (PRPP)
synthase 3(PRS3) X X X 3
AT1G11860 Glycine cleavage T-protein family X X X 3
AT1G12310 Probable calcium-binding protein
CML13 X X X 3
AT1G13280 Allene oxide cyclase 4 (AOC4) X X X 3
AT1G14030 Rubisco methyltransferase family
protein (LSMT-L) X X X 3
AT1G14950 Polyketide cyclase/dehydrase and lipid
transport superfamily protein X 1
AT1G15750 Transducin family protein / WD-40
repeat family protein (TPL) X X X 3
AT1G15930
Ribosomal protein
L7Ae/L30e/S12e/Gadd45 family
protein X X X 3
AT1G16030 Heat shock protein 70B (Hsp70b) X X X 3
AT1G18080 Transducin/WD40 repeat-like
superfamily protein (ATARCA) X X X 3
AT1G19570 Dehydroascorbate reductase (DHAR1) X X X 3
AT1G20510 4-coumarate--CoA ligase-like 5 X X X 3
AT1G20950 Phosphofructokinase family protein X X X 3

218 Appendices
TAIR-ID Description Interacting with
# of
hits
OsOlp1_A OsOlp1_I TlOsm
AT1G23800 Aldehyde dehydrogenase 2B7
(ALDH2B7) X X X 3
AT1G26640 Isopentenyl phosphate kinase (IPK) X X X 3
AT1G27500 Tetratricopeptide repeat (TPR)-like
superfamily protein (KLCR3) X X X 3
AT1G30070 SGS domain-containing protein X 1
AT1G35160 GF14 protein phi chain (GF14 PHI) X X X 3
AT1G35460 Basic helix-loop-helix (bHLH) DNA-
binding superfamily protein (FBH1) X X X 3
AT1G36390 Co-chaperone GrpE family protein X X X 3
AT1G43670 Inositol monophosphatase family
protein (FBP) X X X 3
AT1G43690 Ubiquitin interaction motif-containing
protein X 1
AT1G47420 succinate dehydrogenase 5 (SDH5) X X X 3
AT1G48630 Receptor for activated C kinase 1B
(RACK1B_AT) X X X 3
AT1G49570 Peroxidase 10 X X X 3
AT1G49820 S-methyl-5-thioribose kinase (MTK) X X X 3
AT1G50170 Sirohydrochlorin ferrochelatase B
(SIRB) X X X 3
AT1G52730 Transducin/WD40 repeat-like
superfamily protein X X X 3
AT1G54100 Aldehyde dehydrogenase family 7
member B4 (ALDH7B4) X 1
AT1G57770 FAD/NAD(P)-binding oxidoreductase
family protein X X X 3
AT1G60250 B-box zinc finger family protein
(BBX26) X 1
AT1G62820 Probable calcium-binding protein
CML14 X X X 3
AT1G65870 Disease resistance-responsive (dirigent-
like protein) family protein X X X 3
AT1G66240 Histone-lysine N-methyltransferase
ATX1 X 1
AT1G66270 Beta-glucosidase BGLU21 X X X 3
AT1G68760 Nudix hydrolase 1 (NUDX1) X X X 3
AT1G70570 Anthranilate phosphoribosyltransferase X 1
AT1G70830 MLP-like protein 28 (MLP28) X 1
AT1G70890 MLP-like protein 43 (MLP43) X X X 3
AT1G71440 Tubulin folding cofactor E / Pfifferling
(Wurzinger et al.) X X X 3
AT1G71697 Choline kinase 1 (CK1) X X X 3
AT1G71840 Transducin family protein / WD-40
repeat family protein X X X 3
AT1G73720 Transducin family protein / WD-40
repeat family protein (SMU1) X X X 3
AT1G74040 2-isopropylmalate synthase 1 (IMS1) X X 2

Appendices 219
TAIR-ID Description Interacting with
# of
hits
OsOlp1_A OsOlp1_I TlOsm
AT1G74230 Glycine-rich RNA-binding protein
5(GR-RBP5) X X X 3
AT1G75270 Dehydroascorbate reductase 2
(DHAR2) X X X 3
AT1G76040 Calcium-dependent protein kinase 29
(CPK29) X X 2
AT1G76790 Indole glucosinolate O-
methyltransferrase 5 (IGMT5) X X X 3
AT1G77120 Alcohol dehydrogenase 1 (ADH1) X X X 3
AT1G77520 O-methyltransferase family protein X X X 3
AT1G78300 General regulatory factor 2 (GRF2) X X X 3
AT1G78680 Gamma-glutamyl hydrolase 2 (GGH2) X X 2
AT1G79070 SNARE-associated protein-like protein X X X 3
AT1G79250 AGC kinase 1.7 (AGC1.7) X X X 3
AT1G79550 Phosphoglycerate kinase (PGK) X X 2
AT1G79650 Rad23 UV excision repair protein
family (RAD23B) X X X 3
AT2G02990 Ribonuclease 1 (RNS1) X X X 3
AT2G03310 Transmembrane protein X X X 3
AT2G04880 Zinc-dependent activator protein-1
(ZAP1) X X X 3
AT2G05710 Aconitase 3(ACO3) X X 2
AT2G17190 Ubiquitin receptor protein (DSK2A) X 1
AT2g17290 Calcium-dependent protein kinase
family protein (CPK6) X X X 3
AT2G17560 High mobility group B4 (HMGB4) X 1
AT2G17700 ACT-like protein tyrosine kinase
family protein (STY8) X X 2
AT2G17870 Cold shock domain protein 3 (CSP3) X X X 3
AT2G19780 Leucine-rich repeat (LRR) family
protein X X X 3
AT2G20630 PP2C induced by AVRRPM1 (PIA1) X X X 3
AT2G20690 Lumazine-binding family protein X X X 3
AT2G21100 Disease resistance-responsive (dirigent-
like protein) family protein X X X 3
AT2G22480 Phosphofructokinase 5 (PFK5) X X X 3
AT2G22910 N-acetyl-l-glutamate synthase 1
(NAGS1) X X X 3
AT2G23660 LOB domain-containing protein 10
(LBD10) X X X 3
AT2G24200 Cytosol aminopeptidase family protein
(LAP1) X X X 3
AT2G25080 Glutathione peroxidase 1 (GPX1) X X X 3
AT2G26840 MutS2 X X X 3
AT2G27860 UDP-D-apiose/UDP-D-xylose synthase
1 (AXS1) X X 2
AT2G30050 Transducin family protein / WD-40
repeat family protein X X X 3

220 Appendices
TAIR-ID Description Interacting with
# of
hits
OsOlp1_A OsOlp1_I TlOsm
AT2G30410 Tubulin folding cofactor A (KIESEL)
(KIS) X X X 3
AT2G31390 PfkB-like carbohydrate kinase family
protein X X X 3
AT2G35320 Eyes absent-like protein (EYA) X X X 3
AT2G35380 Peroxidase 20 X X 2
AT2G35500 Shikimate kinase like 2 (SKL2) X X X 3
AT2G38270 CAX-interacting protein 2 (CXIP2) X X X 3
AT2G38380 Peroxidase 22 X X X 3
AT2G38860 Class I glutamine amidotransferase-like
superfamily protein (YLS5) X X X 3
AT2G42120 DNA polymerase delta small subunit X X X 3
AT2G42540 Cold-regulated 15a (COR15A) X X X 3
AT2G43750 O-acetylserine (thiol) lyase B (OASB) X X X 3
AT2G43790 MAP kinase 6 (MPK6) X X 2
AT2G43980 Inositol 1,3,4-trisphosphate 5/6-kinase
4 (ITPK4) X X X 3
AT2G44050
6,7-dimethyl-8-ribityllumazine
synthase / DMRL synthase / lumazine
synthase / riboflavin synthase (COS1) X X X 3
AT2G44530 Ribose-phosphate pyrophosphokinase 5 X X X 3
AT2G45240 Methionine aminopeptidase 1A
(MAP1A) X X X 3
AT2G45770 Signal recognition particle receptor
protein, chloroplast (FTSY) (CPFTSY) X X X 3
AT2G46170 Reticulon-like protein B5 X 1
AT2G46370 Auxin-responsive GH3 family protein
(JAR1) X X X 3
AT3G01340 Transducin/WD40 repeat-like
superfamily protein X X X 3
AT3G01680 Sieve element occlusion amino-
terminus protein (SEOR1) X X X 3
AT3G02520 General regulatory factor 7 (GRF7) X X X 3
AT3G02540 Rad23 UV excision repair protein
family (RAD23C) X X X 3
AT3G02900 Low-density receptor-like protein X X X 3
AT3G03780 Methionine synthase 2 (MS2) X X X 3
AT3G04650 FAD/NAD(P)-binding oxidoreductase X X X 3
AT3G05020 Acyl carrier protein 1 (ACP1) X X X 3
AT3G05190
D-aminoacid aminotransferase-like
PLP-dependent enzymes superfamily
protein X 1

Appendices 221
TAIR-ID Description Interacting with
# of
hits
OsOlp1_A OsOlp1_I TlOsm AT3G06050 peroxiredoxin IIF (PRXIIF) X X X 3
AT3G06110 MAPK phosphatase 2 (MKP2) X X X 3
AT3G06650 ATP-citrate lyase B-1 (ACLB-1) X X X 3
AT3G07800 Thymidine kinase (TK1a) X X X 3
AT3G09390 Metallothionein 2A (MT2A) X 1
AT3G10230 Lycopene cyclase (LYC) X X 2
AT3G10540 3-phosphoinositide-dependent protein
kinase X X X 3
AT3G10700 Galacturonic acid kinase (GalAK) X X X 3
AT3G11200 Alfin-like 2 (AL2) X X X 3
AT3G11930 Adenine nucleotide alpha hydrolases-
like superfamily protein X X X 3
AT3G12110 Actin-11 (ACT11) X X X 3
AT3G12290 Amino acid dehydrogenase family
protein X X X 3
AT3G14940 Phosphoenolpyruvate carboxylase 3
(PPC3) X X X 3
AT3G15010 RNA-binding (RRM/RBD/RNP
motifs) family protein X X X 3
AT3G15890 PTI1-like tyrosine-protein kinase X 1
AT3G16670 Pollen Ole e 1 allergen and extensin
family protein X X X 3
AT3G16910 Acyl-activating enzyme 7 (AAE7) X X X 3
AT3G18680 Amino acid kinase family protein X X X 3
AT3G18780 Actin 2 (ACT2) X 1
AT3G19100 Protein kinase superfamily protein X X X 3
AT3G20530 Protein kinase superfamily protein X X X 3
AT3G21510 Histidine-containing
phosphotransmitter 1 (AHP1) X X X 3
AT3G22740 Homocysteine S-methyltransferase 3
(HMT3) X X X 3
AT3G24020 Disease resistance-responsive (dirigent-
like protein) family protein X X X 3
AT3G24530 AAA-type ATPase family protein /
ankyrin repeat family protein X X X 3
AT3g25150
Nuclear transport factor 2 (NTF2)
family protein with RNA binding
(RRM-RBD-RNP motifs) domain-
containing protein X X X 3
AT3G25770 Allene oxide cyclase 2 (AOC2) X X X 3
AT3G26744 Basic helix-loop-helix (bHLH) DNA-
binding superfamily protein (ICE1) X X X 3
AT3G27850 Ribosomal protein L12-C (RPL12-C) X X X 3

222 Appendices
TAIR-ID Description Interacting with
# of
hits
OsOlp1_A OsOlp1_I TlOsm
AT3G28500 60S acidic ribosomal protein P2-3 X X X 3
AT3G29350 Histidine-containing
phosphotransmitter 2 (AHP2) X X X 3
AT3G42790
Alfin1-like family of nuclear-localized
PHD (plant homeodomain) domain
containing proteins, AL3 X X X 3
AT3G44860 Farnesoic acid carboxyl-O-
methyltransferase (FAMT) X X X 3
AT3G45010 Serine carboxypeptidase-like 48
(Scpl48) X X X 3
AT3G46010 Actin depolymerizing factor 1 (ADF1) X X X 3
AT3G48000 Aldehyde dehydrogenase 2B4
(ALDH2B4) X X X 3
AT3G51130 Transmembrane protein (UPF0183) X X X 3
AT3G51780 BCL-2-associated athanogene 4
(BAG4) X X X 3
AT3G52155 Phosphoglycerate mutase family
protein X X X 3
AT3G53990 Adenine nucleotide alpha hydrolases-
like superfamily protein X X X 3
AT3G54050 High cyclic electron flow 1 (HCEF1) X X 2
AT3G54600 Class I glutamine amidotransferase-like
superfamily protein (DJ1F) X X X 3
AT3G54900 CAX interacting protein 1 (CXIP1) X X X 3
AT3G55120 Chalcone-flavanone isomerase family
protein (TT5) X X X 3
AT3G58470 Nucleic acid binding /
methyltransferase X X X 3
AT3G61080 Protein kinase superfamily protein X X X 3
AT3G61540 Alpha/beta-Hydrolases superfamily
protein X X X 3
AT3G61830 Auxin response factor 18 (ARF18) X X X 3
AT3G63260 Protein kinase superfamily protein
(ATMRK1) X X X 3
AT3G63480 ATP binding microtubule motor family
protein X X X 3
AT4G00220 Lateral organ boundaries (LOB)
domain family protein (JLO) X X X 3
AT4G02640 bZIP transcription factor family protein
(BZO2H1) X X X 3
AT4G04830 Methionine sulfoxide reductase B5
(MSRB5) X X X 3
AT4G08390 Stromal ascorbate peroxidase (SAPX) X X X 3
AT4G09180 Basic helix-loop-helix (bHLH) DNA-
binding superfamily protein (FBH2) X X X 3
AT4G09570 Calcium-dependent protein kinase 4
(CPK4) X X X 3

Appendices 223
TAIR-ID Description Interacting with
# of
hits
OsOlp1_A OsOlp1_I TlOsm
AT4G09620 Mitochondrial transcription termination
factor family protein X X X 3
AT4G10240 B-box zinc finger family protein
(Bbx23) X X X 3
AT4G10250 HSP20-like chaperones superfamily
protein (ATHSP22.0) X X X 3
AT4G11180 Disease resistance-responsive (dirigent-
like protein) family protein X X X 3
AT4G11210 Disease resistance-responsive (dirigent-
like protein) family protein X X X 3
AT4G11320 Papain family cysteine protease X X X 3
AT4G13200 Hypothetical protein X X X 3
AT4G13580 Disease resistance-responsive (dirigent-
like protein) family protein X X X 3
AT4G13930 Serine hydroxymethyltransferase 4
(SHM4) X X X 3
AT4G17510 Ubiquitin C-terminal hydrolase 3
(UCH3) X X X 3
AT4G20780 Calcium-binding protein CML42 X X 2
AT4G21470 Riboflavin kinase/FMN hydrolase
(FMN/FHY) X X X 3
AT4G23170 Receptor-like protein kinase-related
family protein (EP1) X X 2
AT4G23650 Calcium-dependent protein kinase 6
(CDPK6) X X X 3
AT4G23670 Polyketide cyclase/dehydrase and lipid
transport superfamily protein X X X 3
AT4G24690
Ubiquitin-associated (UBA)/TS-N
domain-containing protein /
octicosapeptide/Phox/Bemp1 (PB1)
domain-containing protein (NBR1) X X 2
AT4G25050 Acyl carrier protein 4 (ACP4) X X X 3
AT4G26070 MAP kinase/ ERK kinase 1 (MEK1) X X X 3
AT4G26220 S-adenosyl-L-methionine-dependent
methyltransferases superfamily protein X 1
AT4G26270 Phosphofructokinase 3 (PFK3) X X 2
AT4G27320 Adenine nucleotide alpha hydrolases-
like superfamily protein (PHOS34) X X X 3
AT4G27700 Rhodanese/Cell cycle control
phosphatase superfamily protein X X X 3
AT4G28660 Photosystem II reaction center PSB28
protein (PSB28) X X X 3
AT4G28706 PfkB-like carbohydrate kinase family
protein X X X 3
AT4G29530 Pyridoxal phosphate phosphatase-
related protein X X X 3

224 Appendices
TAIR-ID Description Interacting with
# of
hits
OsOlp1_A OsOlp1_I TlOsm
AT4G29720 Polyamine oxidase 5 (PAO5) X 1
AT4G29830 Transducin/WD40 repeat-like
superfamily protein (VIP3) X X X 3
AT4G30910 Cytosol aminopeptidase family protein X X X 3
AT4G31720 TBP-associated factor II 15 (TAFII15) X X X 3
AT4G32590 2Fe-2S ferredoxin-like superfamily
protein; X X X 3
AT4G32840 Phosphofructokinase 6 (PFK6) X X X 3
AT4G33090 Aminopeptidase M1 (APM1) X X X 3
AT4G33680
Pyridoxal phosphate (PLP)-dependent
transferases superfamily protein
(AGD2) X X X 3
AT4G34050
S-adenosyl-L-methionine-dependent
methyltransferases superfamily protein
(CCoAOMT1) X X 2
AT4G35220 Cyclase family protein (CYCLASE2) X X X 3
AT4G35310 Calmodulin-domain protein kinase 5
(CPK5) X X X 3
AT4G36910 Cystathionine beta-synthase (CBS)
family protein (LEJ2) X X X 3
AT4G37000 Accelerated cell death 2 (ACD2) X X X 3
AT4G38960 B-box type zinc finger family protein
(BBX19) X 1
AT4G39660 Alanine:glyoxylate aminotransferase 2
(AGT2) X X X 3
AT4G40010 SNF1-related protein kinase 2.7
(SNRK2.7) X X X 3
AT5G02500 Heat shock cognate protein 70-1
(HSC70-1) X X X 3
AT5G05270 Chalcone-flavanone isomerase family
protein (CHIL) X X X 3
AT5G05610 Alfin-like 1 (AL1) X X X 3
AT5G06110 DNAJ and myb-like DNA-binding
domain-containing protein X X X 3
AT5G06730 Peroxidase superfamily protein X 1
AT5G08400
Structural maintenance of
chromosomes-like protein, putative
(DUF3531) X X X 3
AT5G09810 Actin 7 (ACT7) X X X 3
AT5G10300 Methyl esterase 5 (MES5) X X X 3
AT5G10450 G-box regulating factor 6 (GRF6) X X X 3
AT5G10540 Zincin-like metalloproteases family
protein X X X 3

Appendices 225
TAIR-ID Description Interacting with
# of
hits
OsOlp1_A OsOlp1_I TlOsm
AT5G10830 S-adenosyl-L-methionine-dependent
methyltransferases superfamily protein X X X 3
AT5G11170 DEAD/DEAH box RNA helicase
family protein (UAP56a) X 1
AT5G11680 Classical AGP protein X X X 3
AT5G13120 Peptidyl-prolyl cis-trans isomerase
CYP20-2, cyclophilin 20-2 (Pnsl5) X X X 3
AT5G13280 Aspartate kinase 1 (AK-LYS1) X X X 3
AT5G13520 Peptidase M1 family protein X X X 3
AT5G13930 Chalcone and stilbene synthase family
protein (TT4) X 1
AT5G14130 Peroxidase superfamily protein,
peroxidase 55 X X X 3
AT5G16050 General regulatory factor 5 (GRF5) X X X 3
AT5G16450
Ribonuclease E inhibitor
RraA/Dimethylmenaquinone
methyltransferase X X X 3
AT5G17920 Cobalamin-independent synthase
family protein (ATMS1) X X 2
AT5G20070 Nudix hydrolase homolog 19
(NUDX19) X X X 3
AT5G20810 SAUR-like auxin-responsive protein
family X X 2
AT5G23140 Nuclear-encoded CLP protease P7
(NCLPP7) X X X 3
AT5G23580 Calmodulin-like domain protein kinase
9 (CDPK9) X 1
AT5G24490 30S ribosomal protein X X X 3
AT5G27560 DUF1995 domain protein, putative
(DUF1995) X X X 3
AT5G37850 PfkB-like carbohydrate kinase family
protein (SOS4) X X X 3
AT5G38470 Rad23 UV excision repair protein
family (RAD23D) X X X 3
AT5G38480 General regulatory factor 3 (GRF3) X X X 3
AT5G39340 Histidine-containing
phosphotransmitter 3 (AHP3) X X X 3
AT5G39790 Protein targeting to starch (PTST) X X X 3
AT5G40850 Urophorphyrin methylase 1 (UPM1) X X 2
AT5G41600 VIRB2-interacting protein 3 (BTI3) X 1
AT5G42020 Heat shock protein 70 (Hsp 70) family
protein (BIP2) X X 2
AT5G42070 Hypothetical protein X X 2
AT5G42810 Inositol-pentakisphosphate 2-kinase 1
(IPK1) X X X 3

226 Appendices
TAIR-ID Description Interacting with
# of
hits
OsOlp1_A OsOlp1_I TlOsm
AT5G43600 Ureidoglycolate amidohydrolase
(UAH) X X X 3
AT5G45070 Phloem protein 2-A8 (PP2-A8) X X X 3
AT5G45080 Phloem protein 2-A6 (PP2-A6) X X X 3
AT5G47030 ATPase, F1 complex, delta/epsilon
subunit X X 2
AT5G47810 Phosphofructokinase 2 (PFK2) X X X 3
AT5G47840 Adenosine monophosphate kinase
(AMK2) X X X 3
AT5G48485
Bifunctional inhibitor/lipid-transfer
protein/seed storage 2S albumin
superfamily protein (DIR1) X X X 3
AT5G49650 Xylulose kinase-2 (XK-2) X X X 3
AT5G58110 Chaperone binding / ATPase activator X X X 3
AT5G58730 PfkB-like carbohydrate kinase family
protein (Mik) X X X 3
AT5G59500 Protein C-terminal S-isoprenylcysteine
carboxyl O-methyltransferase X X X 3
AT5G60160 Zn-dependent exopeptidases
superfamily protein X X X 3
AT5G60790 ABC transporter family protein
(ABCF1) X X X 3
AT5G61760 Inositol polyphosphate kinase 2 beta
(IPK2BETA) X X X 3
AT5G62930 SGNH hydrolase-type esterase
superfamily protein X X X 3
AT5G63310 Nucleoside diphosphate kinase 2
(NDPK2) X X X 3
AT5G63650 SNF1-related protein kinase 2.5
(SNRK2.5) X X X 3
AT5G64380 Inositol monophosphatase family
protein X X X 3
AT5G65020 Annexin 2 (ANNAT2) X X X 3
AT5G65430 General regulatory factor 8 (GRF8) X X X 3
AT5G65620 Zincin-like metalloproteases family
protein X X X 3
Total 239 237 267

Appendices 227
Appendix E-Table 2. Significant GO terms for Arabidopsis proteins interacting with
TlOsm, OsOlp1_A, and OsOlp1_I on the chip
GO term Description Input Background p-value FDR
GO:0050896 response to stimulus 87 4057 1.1e-21 1e-18
GO:0006950 response to stress 59 2320 1.2e-17 5.6e-15
GO:0042221 response to chemical stimulus 48 2085 7.8e-13 2.4e-10
GO:0009987 cellular process 137 11684 4.3e-12 9.9e-10
GO:0006519 cellular amino acid and derivative
metabolic process 26 682 8.5e-12 1.6e-09
GO:0034641 cellular nitrogen compound metabolic
process 21 506 2.2e-10 3.3e-08
GO:0008152 metabolic process 122 10614 8.6e-10 1.1e-07
GO:0044271 cellular nitrogen compound
biosynthetic process 18 394 1e-09 1.2e-07
GO:0044237 cellular metabolic process 106 8722 1.2e-09 1.2e-07
GO:0016053 organic acid biosynthetic process 18 417 2.4e-09 2e-07
GO:0046394 carboxylic acid biosynthetic process 18 417 2.4e-09 2e-07
GO:0009628 response to abiotic stimulus 33 1471 8.2e-09 5.3e-07
GO:0006725 cellular aromatic compound metabolic
process 17 399 8.2e-09 5.3e-07
GO:0042180 cellular ketone metabolic process 25 882 7.9e-09 5.3e-07
GO:0051716 cellular response to stimulus 24 840 1.4e-08 8.3e-07
GO:0043436 oxoacid metabolic process 24 859 2.1e-08 1.1e-06
GO:0006082 organic acid metabolic process 24 860 2.1e-08 1.1e-06
GO:0019752 carboxylic acid metabolic process 24 859 2.1e-08 1.1e-06
GO:0019438 aromatic compound biosynthetic
process 13 237 3e-08 1.4e-06
GO:0010033 response to organic substance 30 1342 4.4e-08 1.9e-06
GO:0008652 cellular amino acid biosynthetic
process 12 202 4.5e-08 1.9e-06
GO:0070887 cellular response to chemical stimulus 17 452 4.7e-08 1.9e-06
GO:0005996 monosaccharide metabolic process 11 168 6.5e-08 2.6e-06
GO:0007242 intracellular signalling cascade 20 659 9.1e-08 3.5e-06
GO:0009698 Phenylpropanoid metabolic process 11 175 9.6e-08 3.5e-06
GO:0006575 cellular amino acid derivative
metabolic process 14 315 1.1e-07 3.7e-06
GO:0009699 Phenylpropanoid biosynthetic process 10 141 1.3e-07 4.1e-06
GO:0044238 primary metabolic process 102 8995 1.3e-07 4.1e-06
GO:0006066 alcohol metabolic process 13 270 1.3e-07 4.1e-06
GO:0009309 amine biosynthetic process 12 229 1.6e-07 5e-06
GO:0010035 response to inorganic substance 13 279 1.8e-07 5.3e-06
GO:0042398 cellular amino acid derivative
biosynthetic process 12 233 2e-07 5.6e-06

228 Appendices
GO term Description Input Background p-value FDR
GO:0009719 response to endogenous stimulus 24 1068 9.8e-07 2.7e-05
GO:0006979 response to oxidative stress 13 332 1.2e-06 3.2e-05
GO:0044262 cellular carbohydrate metabolic
process 14 417 2.6e-06 6.9e-05
GO:0009266 response to temperature stimulus 15 485 3.1e-06 7.8e-05
GO:0006520 cellular amino acid metabolic process 14 430 3.7e-06 9.2e-05
GO:0044106 cellular amine metabolic process 14 438 4.6e-06 0.00011
GO:0019318 hexose metabolic process 8 126 5.2e-06 0.00012
GO:0046686 response to cadmium ion 9 178 7.7e-06 0.00018
GO:0006970 response to osmotic stress 13 408 1e-05 0.00023
GO:0009755 hormone-mediated signalling pathway 11 321 2.6e-05 0.00056
GO:0032870 cellular response to hormone stimulus 11 321 2.6e-05 0.00056
GO:0009308 amine metabolic process 14 521 3e-05 0.00062
GO:0009409 response to cold 11 328 3.2e-05 0.00063
GO:0009725 response to hormone stimulus 20 982 3.2e-05 0.00063
GO:0044249 cellular biosynthetic process 59 4925 3.4e-05 0.00066
GO:0019748 secondary metabolic process 13 489 6.4e-05 0.0012
GO:0010038 response to metal ion 9 238 6.9e-05 0.0013
GO:0006096 glycolysis 5 57 7.7e-05 0.0014
GO:0009651 response to salt stress 11 366 8.2e-05 0.0015
GO:0009058 biosynthetic process 59 5118 0.0001 0.0018
GO:0009611 response to wounding 8 197 0.00011 0.0019
GO:0046483 heterocycle metabolic process 12 460 0.00014 0.0024
GO:0006952 defense response 16 766 0.00015 0.0025
GO:0007165 signal transduction 21 1228 0.00022 0.0036
GO:0009607 response to biotic stimulus 14 638 0.00024 0.0038
GO:0006007 glucose catabolic process 5 83 0.0004 0.0063
GO:0000096 sulfur amino acid metabolic process 5 84 0.00042 0.0063
GO:0019320 hexose catabolic process 5 84 0.00042 0.0063
GO:0046365 monosaccharide catabolic process 5 84 0.00042 0.0063
GO:0006006 glucose metabolic process 5 86 0.00047 0.0069
GO:0042440 pigment metabolic process 6 134 0.00048 0.007
GO:0046164 alcohol catabolic process 5 89 0.00054 0.0077
GO:0009066 aspartate family amino acid metabolic
process 5 90 0.00057 0.008
GO:0006633 fatty acid biosynthetic process 6 140 0.0006 0.0083
GO:0032787 monocarboxylic acid metabolic
process 10 408 0.00081 0.011
GO:0009605 response to external stimulus 10 429 0.0012 0.016
GO:0006091 generation of precursor metabolites
and energy 8 285 0.0012 0.016

Appendices 229
GO term Description Input Background p-value FDR
GO:0009408 response to heat 6 161 0.0012 0.016
GO:0006631 fatty acid metabolic process 7 225 0.0013 0.017
GO:0051707 response to other organism 12 599 0.0014 0.018
GO:0046148 pigment biosynthetic process 5 112 0.0015 0.018
GO:0005975 carbohydrate metabolic process 15 866 0.0016 0.019
GO:0044272 sulfur compound biosynthetic process 5 115 0.0016 0.02
GO:0051186 cofactor metabolic process 8 308 0.0019 0.023
GO:0044275 cellular carbohydrate catabolic
process 5 125 0.0023 0.027
GO:0016052 carbohydrate catabolic process 5 128 0.0025 0.03
GO:0051704 multi-organism process 13 776 0.0041 0.048
GO:0003824 catalytic activity 138 9638 9e-20 2.4e-17
GO:0016740 transferase activity 69 3321 3.3e-16 4.5e-14
GO:0016301 kinase activity 44 1641 5.5e-14 4.9e-12
GO:0016772 transferase activity, transferring
phosphorus-containing groups 47 1887 9.2e-14 6.2e-12
GO:0019200 carbohydrate kinase activity 9 53 5.3e-10 2.9e-08
GO:0045309 protein phosphorylated amino acid
binding 7 23 1.4e-09 5.3e-08
GO:0051219 phosphoprotein binding 7 23 1.4e-09 5.3e-08
GO:0016773 phosphotransferase activity, alcohol
group as acceptor 29 1154 6.4e-09 2.2e-07
GO:0016209 antioxidant activity 11 150 2.2e-08 5.4e-07
GO:0008168 methyltransferase activity 14 273 2e-08 5.4e-07
GO:0016741 transferase activity, transferring one-
carbon groups 14 275 2.1e-08 5.4e-07
GO:0008443 phosphofructokinase activity 5 12 9.5e-08 2.1e-06
GO:0004177 aminopeptidase activity 5 14 1.8e-07 3.7e-06
GO:0016684 oxidoreductase activity, acting on
peroxide as acceptor 9 127 5.6e-07 1e-05
GO:0004601 peroxidase activity 9 127 5.6e-07 1e-05
GO:0004683 calmodulin-dependent protein kinase
activity 6 42 1.1e-06 1.8e-05
GO:0008238 exopeptidase activity 7 104 1.4e-05 0.00022
GO:0008171 O-methyltransferase activity 5 45 2.7e-05 0.0004
GO:0008237 metallopeptidase activity 6 90 6.2e-05 0.00088
GO:0020037 heme binding 5 97 0.00079 0.011
GO:0016491 oxidoreductase activity 22 1463 0.00087 0.011
GO:0070011 peptidase activity, acting on L-amino
acid peptides 12 579 0.0011 0.013
GO:0008757 S-adenosylmethionine-dependent
methyltransferase activity 5 109 0.0013 0.015
GO:0008233 peptidase activity 12 646 0.0026 0.029

230 Appendices
GO term Description Input Background p-value FDR
GO:0046906 tetrapyrrole binding 5 136 0.0033 0.034
GO:0016853 isomerase activity 7 265 0.0033 0.034
GO:0005622 intracellular 149 9671 2e-25 4.7e-23
GO:0005737 cytoplasm 121 6822 2.2e-24 2.6e-22
GO:0044424 intracellular part 143 9302 7.1e-24 5.6e-22
GO:0044444 cytoplasmic part 105 6289 1.4e-18 8.5e-17
GO:0044464 cell part 176 15217 3.5e-17 1.4e-15
GO:0005623 cell 176 15217 3.5e-17 1.4e-15
GO:0005829 cytosol 32 912 2.5e-13 8.3e-12
GO:0043231 intracellular membrane-bounded
organelle 102 7615 1.1e-11 3.1e-10
GO:0043227 membrane-bounded organelle 102 7622 1.2e-11 3.1e-10
GO:0043229 intracellular organelle 106 8149 2.1e-11 4.6e-10
GO:0043226 organelle 106 8155 2.2e-11 4.6e-10
GO:0009536 plastid 53 2965 4.6e-10 9e-09
GO:0009507 chloroplast 50 2740 8e-10 1.5e-08
GO:0009570 chloroplast stroma 12 249 3.9e-07 6.5e-06
GO:0009532 plastid stroma 13 322 8.6e-07 1.4e-05
GO:0044435 plastid part 20 867 5.6e-06 8.2e-05
GO:0044434 chloroplast part 18 746 9.2e-06 0.00013
GO:0005886 plasma membrane 25 1456 5.3e-05 0.00069
GO:0019898 extrinsic to membrane 5 104 0.0011 0.012
GO:0005634 nucleus 33 2621 0.001 0.012
GO:0044422 organelle part 32 2562 0.0014 0.015
GO:0044446 intracellular organelle part 32 2561 0.0014 0.015
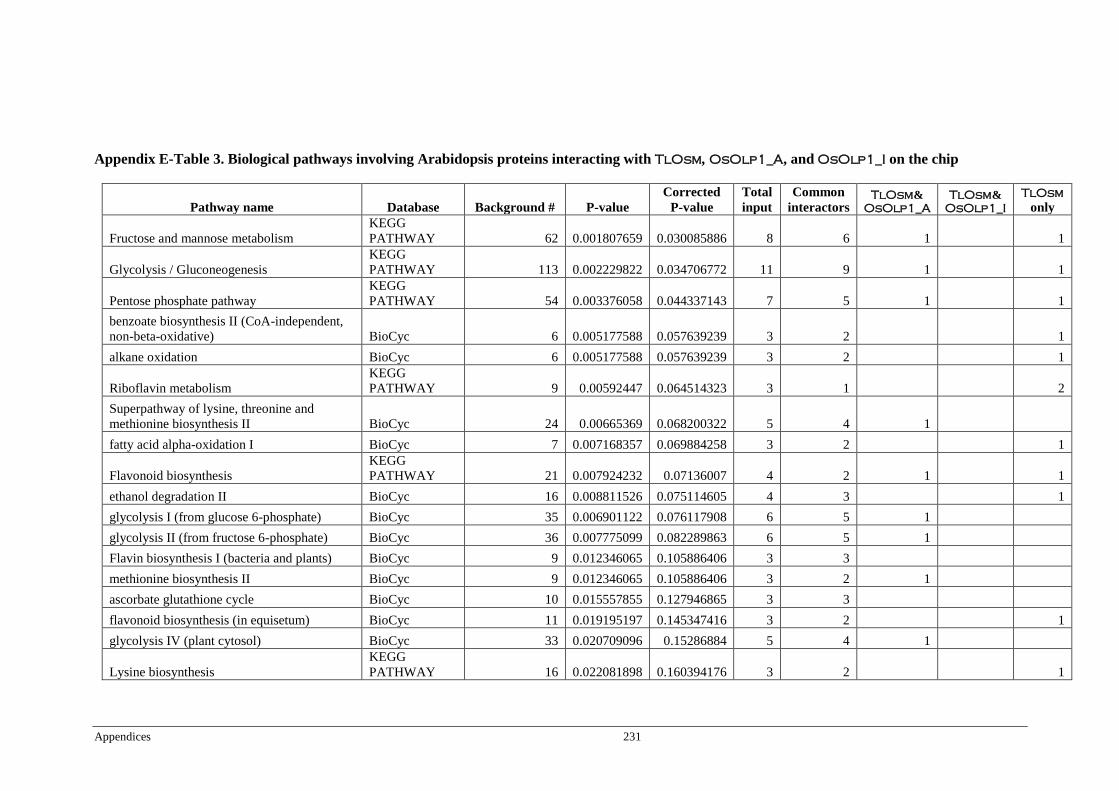
Appendices 231
Appendix E-Table 3. Biological pathways involving Arabidopsis proteins interacting with TlOsm, OsOlp1_A, and OsOlp1_I on the chip
Pathway name Database Background # P-value
Corrected
P-value
Total
input
Common
interactors TlOsm&
OsOlp1_A
TlOsm&
OsOlp1_I
TlOsm only
Fructose and mannose metabolism
KEGG
PATHWAY 62 0.001807659 0.030085886 8 6 1 1
Glycolysis / Gluconeogenesis
KEGG
PATHWAY 113 0.002229822 0.034706772 11 9 1 1
Pentose phosphate pathway
KEGG
PATHWAY 54 0.003376058 0.044337143 7 5 1 1
benzoate biosynthesis II (CoA-independent,
non-beta-oxidative) BioCyc 6 0.005177588 0.057639239 3 2 1
alkane oxidation BioCyc 6 0.005177588 0.057639239 3 2 1
Riboflavin metabolism
KEGG
PATHWAY 9 0.00592447 0.064514323 3 1 2
Superpathway of lysine, threonine and
methionine biosynthesis II BioCyc 24 0.00665369 0.068200322 5 4 1
fatty acid alpha-oxidation I BioCyc 7 0.007168357 0.069884258 3 2 1
Flavonoid biosynthesis
KEGG
PATHWAY 21 0.007924232 0.07136007 4 2 1 1
ethanol degradation II BioCyc 16 0.008811526 0.075114605 4 3 1
glycolysis I (from glucose 6-phosphate) BioCyc 35 0.006901122 0.076117908 6 5 1
glycolysis II (from fructose 6-phosphate) BioCyc 36 0.007775099 0.082289863 6 5 1
Flavin biosynthesis I (bacteria and plants) BioCyc 9 0.012346065 0.105886406 3 3
methionine biosynthesis II BioCyc 9 0.012346065 0.105886406 3 2 1
ascorbate glutathione cycle BioCyc 10 0.015557855 0.127946865 3 3
flavonoid biosynthesis (in equisetum) BioCyc 11 0.019195197 0.145347416 3 2 1
glycolysis IV (plant cytosol) BioCyc 33 0.020709096 0.15286884 5 4 1
Lysine biosynthesis
KEGG
PATHWAY 16 0.022081898 0.160394176 3 2 1

232 Appendices
Pathway name Database Background # P-value
Corrected
P-value
Total
input
Common
interactors TlOsm&
OsOlp1_A
TlOsm&
OsOlp1_I
TlOsm only
Pyruvate metabolism
KEGG
PATHWAY 84 0.027680366 0.182756418 7 5 1 1
Histidine metabolism
KEGG
PATHWAY 18 0.028907404 0.187833448 3 3
Biosynthesis of amino acids
KEGG
PATHWAY 255 0.029160885 0.187833448 15 9 2 3 1
benzoate biosynthesis III (CoA-dependent,
non-beta-oxidative) BioCyc 14 0.032681584 0.201976993 3 3 1
Cadherin signalling pathway PANTHER 8 0.034603115 0.209236822 2 1 1
alpha-Linolenic acid metabolism
KEGG
PATHWAY 36 0.039294669 0.22935534 4 4
Superpathway of scopoline and esculin
biosynthesis BioCyc 6 0.04211016 0.239956538 2 2
beta-Alanine metabolism
KEGG
PATHWAY 40 0.05286024 0.276816399 2 1 1
Fatty acid degradation
KEGG
PATHWAY 41 0.056602026 0.28832729 4 3 1
Ascorbate and aldarate metabolism
KEGG
PATHWAY 41 0.056602026 0.28832729 4 3 1
Plant-pathogen interaction
KEGG
PATHWAY 167 0.061264381 0.302898309 10 7 1 1 1
Flavonoid biosynthesis BioCyc 19 0.063499324 0.30869623 3 2 1
lipid-dependent phytate biosynthesis II (via
Ins(1,3,4)P3) BioCyc 8 0.064035815 0.30869623 2 2
1D-myo-inositol hexakisphosphate
biosynthesis V (from Ins(1,3,4)P3) BioCyc 8 0.064035815 0.30869623 2 2
S-adenosyl-L-methionine cycle II BioCyc 8 0.064035815 0.30869623 2 1 1
Superpathway of lipid-dependent phytate
biosynthesis BioCyc 8 0.064035815 0.30869623 2 2

Appendices 233
Pathway name Database Background # P-value
Corrected
P-value
Total
input
Common
interactors TlOsm&
OsOlp1_A
TlOsm&
OsOlp1_I
TlOsm only
Lysine degradation
KEGG
PATHWAY 26 0.065834464 0.314396972 3 2 1
Scopoletin biosynthesis BioCyc 9 0.076143099 0.342777218 2 1 1
Superpathway of cytosolic glycolysis
(plants), pyruvate dehydrogenase and TCA
cycle BioCyc 65 0.078189891 0.342777218 6 5 1
1D-myo-inositol hexakisphosphate
biosynthesis III (Spirodela polyrrhiza) BioCyc 10 0.088902506 0.36456647 2 2
Cysteine and methionine metabolism
KEGG
PATHWAY 112 0.090683373 0.36456647 7 6 1
Nicotinic acetylcholine receptor signalling
pathway PANTHER 15 0.092032736 0.36456647 2 1 1
Vitamin B6 metabolism
KEGG
PATHWAY 14 0.09279216 0.36456647 2 2
Biosynthesis of secondary metabolites
KEGG
PATHWAY 1078 0.100706063 0.382137455 44 32 4 4 4
isoleucine biosynthesis I BioCyc 11 0.102237897 0.383882929 2 1 1
Cytoskeletal regulation by Rho GTPase PANTHER 17 0.111594485 0.397437137 2 1 1
Arginine and proline metabolism
KEGG
PATHWAY 53 0.111874251 0.397591154 4 2 2
Galactose metabolism
KEGG
PATHWAY 55 0.122804217 0.414525879 4 3 1
Arachidonic acid metabolism
KEGG
PATHWAY 17 0.124246464 0.416833101 2 2
Superpathway of carotenoid biosynthesis BioCyc 13 0.130357842 0.416833101 2 1 1
Inflammation mediated by chemokine and
cytokine signalling pathway PANTHER 19 0.132177023 0.418436113 2 1 1
Selenocompound metabolism
KEGG
PATHWAY 18 0.135232671 0.42650304 2 1 1
jasmonic acid biosynthesis BioCyc 14 0.145014999 0.439225609 2 2

234 Appendices
Pathway name Database Background # P-value
Corrected
P-value
Total
input
Common
interactors TlOsm&
OsOlp1_A
TlOsm&
OsOlp1_I
TlOsm only
UTP and CTP de novo biosynthesis BioCyc 14 0.145014999 0.439225609 2 2
lysine biosynthesis VI BioCyc 14 0.145014999 0.439225609 2 2
Phenylpropanoid biosynthesis
KEGG
PATHWAY 157 0.165525664 0.46863376 8 4 1 1 2
Ascorbate degradation PANTHER 5 0.170984761 0.475083277 1 1
Threonine biosynthesis PANTHER 5 0.170984761 0.475083277 1 1
Suberin monomers biosynthesis BioCyc 17 0.190702417 0.499880597 2 1 1
Chlorogenic acid biosynthesis I BioCyc 17 0.190702417 0.499880597 2 1 1
Valine, leucine and isoleucine degradation
KEGG
PATHWAY 45 0.201916898 0.507357707 3 2 1
tetrahydrofolate biosynthesis II BioCyc 18 0.206339756 0.514624822 2 2
pyridine nucleotide cycling (plants) BioCyc 18 0.206339756 0.514624822 2 2
Carbon fixation in photosynthetic organisms
KEGG
PATHWAY 69 0.210092915 0.520074133 4 3 1
Tryptophan metabolism
KEGG
PATHWAY 46 0.210328205 0.520074133 3 2 1
pyrimidine ribonucleotides interconversion BioCyc 19 0.222108279 0.534507078 2 2
Superpathway of pyrimidine ribonucleotides
de novo biosynthesis BioCyc 19 0.222108279 0.534507078 2 2
tetrahydrofolate salvage from 5,10-
methenyltetrahydrofolate BioCyc 5 0.228521799 0.541812616 1 1
chlorophyll a degradation II BioCyc 5 0.228521799 0.541812616 1 1
Glycine, serine and threonine metabolism
KEGG
PATHWAY 72 0.23071846 0.54525558 4 3 1
Superpathway of pyrimidine
deoxyribonucleoside salvage BioCyc 20 0.237969174 0.551000251 2 2
Superpathway of pyrimidine nucleobases
salvage BioCyc 20 0.237969174 0.551000251 2 2
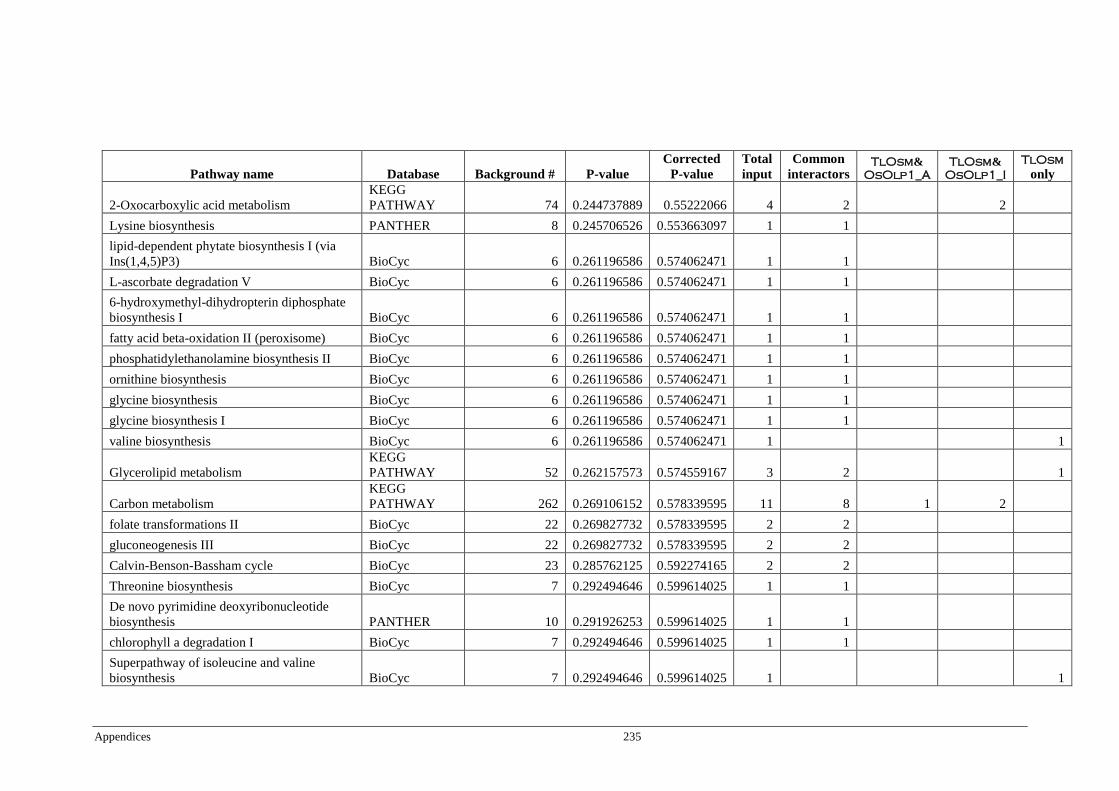
Appendices 235
Pathway name Database Background # P-value
Corrected
P-value
Total
input
Common
interactors TlOsm&
OsOlp1_A
TlOsm&
OsOlp1_I
TlOsm only
2-Oxocarboxylic acid metabolism
KEGG
PATHWAY 74 0.244737889 0.55222066 4 2 2
Lysine biosynthesis PANTHER 8 0.245706526 0.553663097 1 1
lipid-dependent phytate biosynthesis I (via
Ins(1,4,5)P3) BioCyc 6 0.261196586 0.574062471 1 1
L-ascorbate degradation V BioCyc 6 0.261196586 0.574062471 1 1
6-hydroxymethyl-dihydropterin diphosphate
biosynthesis I BioCyc 6 0.261196586 0.574062471 1 1
fatty acid beta-oxidation II (peroxisome) BioCyc 6 0.261196586 0.574062471 1 1
phosphatidylethanolamine biosynthesis II BioCyc 6 0.261196586 0.574062471 1 1
ornithine biosynthesis BioCyc 6 0.261196586 0.574062471 1 1
glycine biosynthesis BioCyc 6 0.261196586 0.574062471 1 1
glycine biosynthesis I BioCyc 6 0.261196586 0.574062471 1 1
valine biosynthesis BioCyc 6 0.261196586 0.574062471 1 1
Glycerolipid metabolism
KEGG
PATHWAY 52 0.262157573 0.574559167 3 2 1
Carbon metabolism
KEGG
PATHWAY 262 0.269106152 0.578339595 11 8 1 2
folate transformations II BioCyc 22 0.269827732 0.578339595 2 2
gluconeogenesis III BioCyc 22 0.269827732 0.578339595 2 2
Calvin-Benson-Bassham cycle BioCyc 23 0.285762125 0.592274165 2 2
Threonine biosynthesis BioCyc 7 0.292494646 0.599614025 1 1
De novo pyrimidine deoxyribonucleotide
biosynthesis PANTHER 10 0.291926253 0.599614025 1 1
chlorophyll a degradation I BioCyc 7 0.292494646 0.599614025 1 1
Superpathway of isoleucine and valine
biosynthesis BioCyc 7 0.292494646 0.599614025 1 1
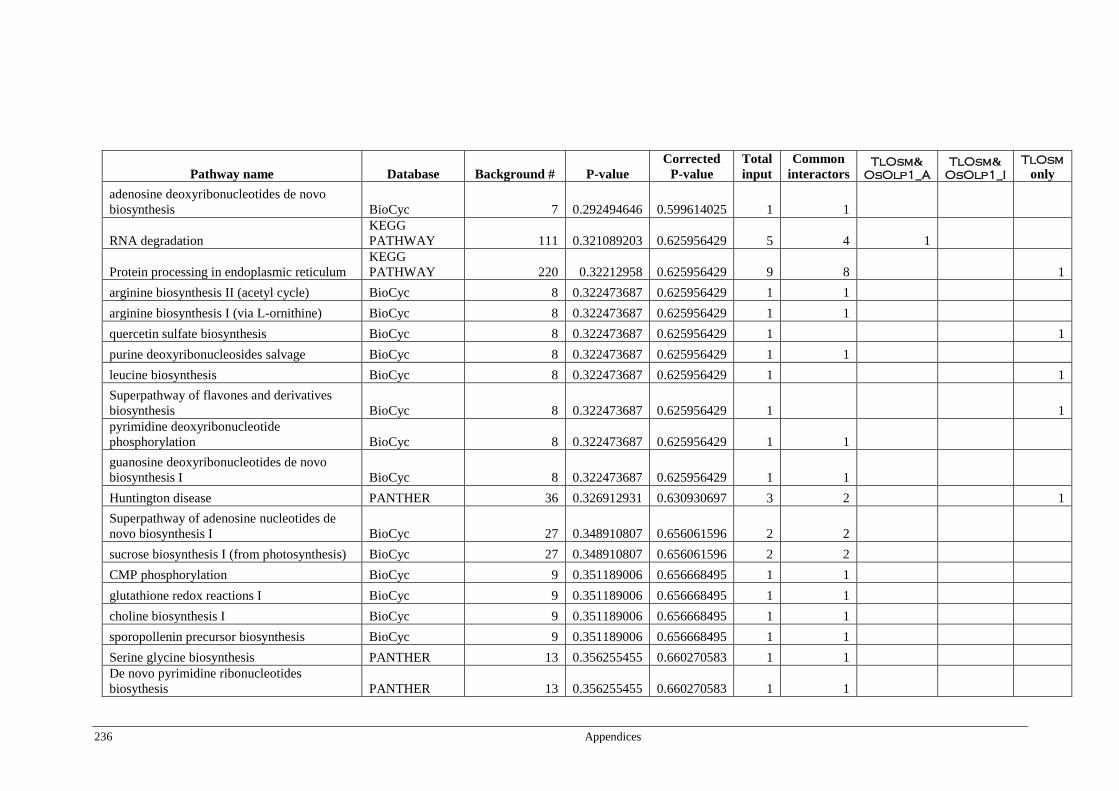
236 Appendices
Pathway name Database Background # P-value
Corrected
P-value
Total
input
Common
interactors TlOsm&
OsOlp1_A
TlOsm&
OsOlp1_I
TlOsm only
adenosine deoxyribonucleotides de novo
biosynthesis BioCyc 7 0.292494646 0.599614025 1 1
RNA degradation
KEGG
PATHWAY 111 0.321089203 0.625956429 5 4 1
Protein processing in endoplasmic reticulum
KEGG
PATHWAY 220 0.32212958 0.625956429 9 8 1
arginine biosynthesis II (acetyl cycle) BioCyc 8 0.322473687 0.625956429 1 1
arginine biosynthesis I (via L-ornithine) BioCyc 8 0.322473687 0.625956429 1 1
quercetin sulfate biosynthesis BioCyc 8 0.322473687 0.625956429 1 1
purine deoxyribonucleosides salvage BioCyc 8 0.322473687 0.625956429 1 1
leucine biosynthesis BioCyc 8 0.322473687 0.625956429 1 1
Superpathway of flavones and derivatives
biosynthesis BioCyc 8 0.322473687 0.625956429 1 1
pyrimidine deoxyribonucleotide
phosphorylation BioCyc 8 0.322473687 0.625956429 1 1
guanosine deoxyribonucleotides de novo
biosynthesis I BioCyc 8 0.322473687 0.625956429 1 1
Huntington disease PANTHER 36 0.326912931 0.630930697 3 2 1
Superpathway of adenosine nucleotides de
novo biosynthesis I BioCyc 27 0.348910807 0.656061596 2 2
sucrose biosynthesis I (from photosynthesis) BioCyc 27 0.348910807 0.656061596 2 2
CMP phosphorylation BioCyc 9 0.351189006 0.656668495 1 1
glutathione redox reactions I BioCyc 9 0.351189006 0.656668495 1 1
choline biosynthesis I BioCyc 9 0.351189006 0.656668495 1 1
sporopollenin precursor biosynthesis BioCyc 9 0.351189006 0.656668495 1 1
Serine glycine biosynthesis PANTHER 13 0.356255455 0.660270583 1 1
De novo pyrimidine ribonucleotides
biosythesis PANTHER 13 0.356255455 0.660270583 1 1
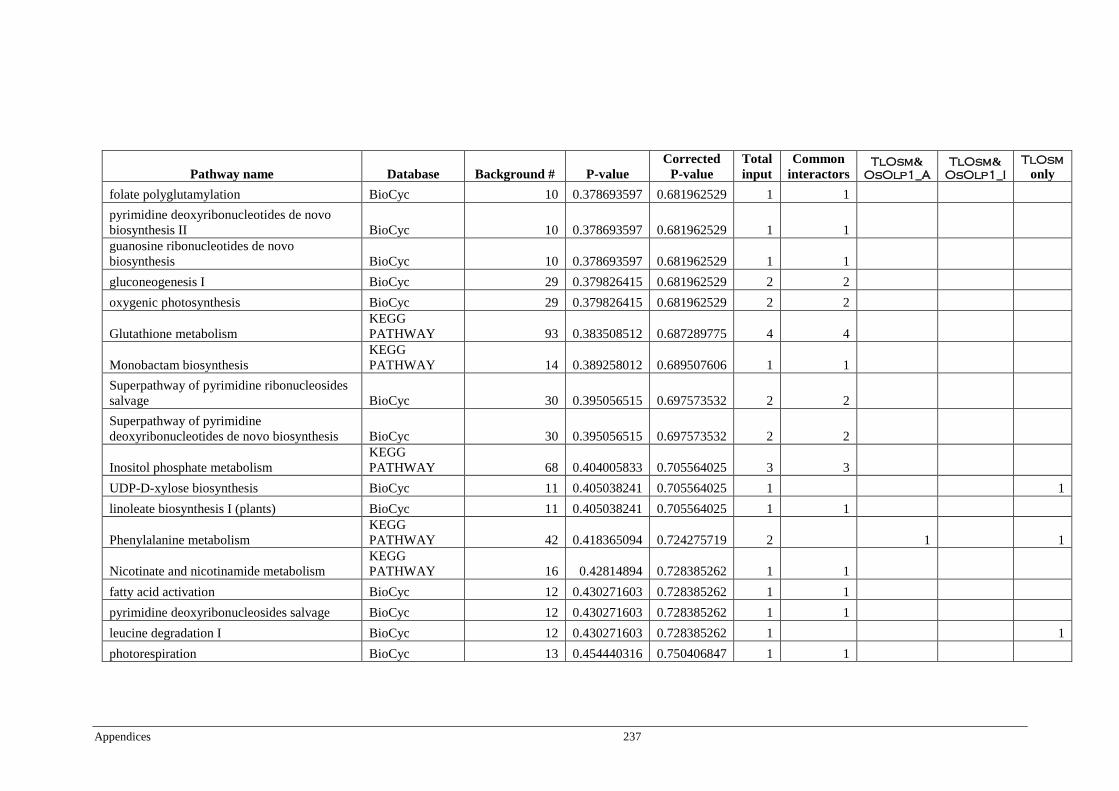
Appendices 237
Pathway name Database Background # P-value
Corrected
P-value
Total
input
Common
interactors TlOsm&
OsOlp1_A
TlOsm&
OsOlp1_I
TlOsm only
folate polyglutamylation BioCyc 10 0.378693597 0.681962529 1 1
pyrimidine deoxyribonucleotides de novo
biosynthesis II BioCyc 10 0.378693597 0.681962529 1 1
guanosine ribonucleotides de novo
biosynthesis BioCyc 10 0.378693597 0.681962529 1 1
gluconeogenesis I BioCyc 29 0.379826415 0.681962529 2 2
oxygenic photosynthesis BioCyc 29 0.379826415 0.681962529 2 2
Glutathione metabolism
KEGG
PATHWAY 93 0.383508512 0.687289775 4 4
Monobactam biosynthesis
KEGG
PATHWAY 14 0.389258012 0.689507606 1 1
Superpathway of pyrimidine ribonucleosides
salvage BioCyc 30 0.395056515 0.697573532 2 2
Superpathway of pyrimidine
deoxyribonucleotides de novo biosynthesis BioCyc 30 0.395056515 0.697573532 2 2
Inositol phosphate metabolism
KEGG
PATHWAY 68 0.404005833 0.705564025 3 3
UDP-D-xylose biosynthesis BioCyc 11 0.405038241 0.705564025 1 1
linoleate biosynthesis I (plants) BioCyc 11 0.405038241 0.705564025 1 1
Phenylalanine metabolism
KEGG
PATHWAY 42 0.418365094 0.724275719 2 1 1
Nicotinate and nicotinamide metabolism
KEGG
PATHWAY 16 0.42814894 0.728385262 1 1
fatty acid activation BioCyc 12 0.430271603 0.728385262 1 1
pyrimidine deoxyribonucleosides salvage BioCyc 12 0.430271603 0.728385262 1 1
leucine degradation I BioCyc 12 0.430271603 0.728385262 1 1
photorespiration BioCyc 13 0.454440316 0.750406847 1 1

238 Appendices
Pathway name Database Background # P-value
Corrected
P-value
Total
input
Common
interactors TlOsm&
OsOlp1_A
TlOsm&
OsOlp1_I
TlOsm only
pyrimidine deoxyribonucleotides de novo
biosynthesis III BioCyc 13 0.454440316 0.750406847 1 1
Superpathway of guanosine nucleotides de
novo biosynthesis I BioCyc 13 0.454440316 0.750406847 1 1
valine degradation I BioCyc 14 0.477589064 0.769728874 1 1
methionine salvage cycle II (plants) BioCyc 14 0.477589064 0.769728874 1 1
De novo purine biosynthesis PANTHER 20 0.485504949 0.776530752 1 1
Phenylpropanoid biosynthesis BioCyc 37 0.496246916 0.785570762 2 1 1
One carbon pool by folate
KEGG
PATHWAY 20 0.498677386 0.785872482 1 1
D-sorbitol degradation I BioCyc 15 0.499760668 0.785872482 1 1
indole glucosinolate breakdown (active in
intact plant cell) BioCyc 15 0.499760668 0.785872482 1 1
Superpathway of leucine, valine, and
isoleucine biosynthesis BioCyc 15 0.499760668 0.785872482 1 1
Apoptosis signalling pathway PANTHER 21 0.501824492 0.787751755 1 1
Pentose and glucuronate interconversions
KEGG
PATHWAY 81 0.513468972 0.796991081 3 3
Superpathway of pyrimidine
deoxyribonucleotides de novo biosynthesis
(E. coli) BioCyc 16 0.52099616 0.799812371 1 1
pyrimidine deoxyribonucleotides de novo
biosynthesis I BioCyc 16 0.52099616 0.799812371 1 1
TCA cycle II (plants and fungi) BioCyc 16 0.52099616 0.799812371 1 1
methionine salvage cycle I (bacteria and
plants) BioCyc 16 0.52099616 0.799812371 1 1
TCA cycle variation V (plant) BioCyc 17 0.541334859 0.818386623 1 1
Valine, leucine and isoleucine biosynthesis
KEGG
PATHWAY 23 0.545818841 0.818386623 1 1

Appendices 239
Pathway name Database Background # P-value
Corrected
P-value
Total
input
Common
interactors TlOsm&
OsOlp1_A
TlOsm&
OsOlp1_I
TlOsm only
Pyrimidine metabolism
KEGG
PATHWAY 116 0.546203826 0.818386623 1 1
glutamine biosynthesis III BioCyc 18 0.560814439 0.823762097 1 1
Superpathway of purine nucleotides de novo
biosynthesis I BioCyc 43 0.574017616 0.834709007 2 2
UDP-sugars interconversion BioCyc 19 0.579471002 0.841079402 1 1
Limonene and pinene degradation
KEGG
PATHWAY 59 0.591292242 0.850063642 2 2
adenosine ribonucleotides de novo
biosynthesis BioCyc 20 0.597339138 0.853834243 1 1
sucrose degradation II (sucrose synthase) BioCyc 20 0.597339138 0.853834243 1 1
Cyanoamino acid metabolism
KEGG
PATHWAY 60 0.600192619 0.853936801 2 2
Stilbenoid, diarylheptanoid and gingerol
biosynthesis
KEGG
PATHWAY 61 0.608946552 0.859056852 2 1 1
Purine metabolism
KEGG
PATHWAY 158 0.610161155 0.859056852 5 5
Metabolic pathways
KEGG
PATHWAY 1912 0.621610348 0.862567677 62 48 5 4 5
Citrate cycle (TCA cycle)
KEGG
PATHWAY 63 0.626015804 0.862567677 2 1 1
Carotenoid biosynthesis
KEGG
PATHWAY 29 0.627250698 0.863561362 1 1
salvage pathways of pyrimidine
ribonucleotides BioCyc 22 0.630841327 0.864688012 1 1
Superpathway of choline biosynthesis BioCyc 22 0.630841327 0.864688012 1 1
sucrose degradation III (sucrose invertase) BioCyc 23 0.64653757 0.876475529 1 1
glutathione-mediated detoxification II BioCyc 50 0.653306645 0.878995801 2 2
glucosinolate biosynthesis from tryptophan BioCyc 24 0.661569881 0.885429116 1 1

240 Appendices
Pathway name Database Background # P-value
Corrected
P-value
Total
input
Common
interactors TlOsm&
OsOlp1_A
TlOsm&
OsOlp1_I
TlOsm only
Phosphatidylinositol signalling system
KEGG
PATHWAY 68 0.666152615 0.887323729 2 2
Nucleotide excision repair
KEGG
PATHWAY 69 0.673751073 0.892526017 2 2
simple coumarins biosynthesis BioCyc 25 0.675966195 0.892659739 1 1
Plant hormone signal transduction
KEGG
PATHWAY 271 0.684924673 0.901611883 8 7 1
Arginine biosynthesis
KEGG
PATHWAY 35 0.694116089 0.907793402 1 1
Endocytosis
KEGG
PATHWAY 142 0.699385888 0.909959503 4 4
phospholipid biosynthesis II BioCyc 27 0.702956789 0.911782686 1 1
Superpathway of sucrose and starch
metabolism I (non-photosynthetic tissue) BioCyc 27 0.702956789 0.911782686 1 1
Circadian rhythm - plant
KEGG
PATHWAY 36 0.704033922 0.912369326 1 1
Glyoxylate and dicarboxylate metabolism
KEGG
PATHWAY 74 0.709656175 0.913424219 2 1 1
Insulin resistance
KEGG
PATHWAY 37 0.713631063 0.91708271 1 1
Mismatch repair
KEGG
PATHWAY 39 0.731904302 0.93136346 1 1
Tyrosine metabolism
KEGG
PATHWAY 40 0.740600094 0.938875383 1 1
Parkinson disease PANTHER 42 0.750090206 0.944988093 1 1
Base excision repair
KEGG
PATHWAY 43 0.76503579 0.951202043 1 1
Porphyrin and chlorophyll metabolism
KEGG
PATHWAY 48 0.800766889 0.979829731 1 1
Alanine, aspartate and glutamate metabolism
KEGG
PATHWAY 48 0.800766889 0.979829731 1 1

Appendices 241
Pathway name Database Background # P-value
Corrected
P-value
Total
input
Common
interactors TlOsm&
OsOlp1_A
TlOsm&
OsOlp1_I
TlOsm only
DNA replication
KEGG
PATHWAY 50 0.813492592 0.986465136 1 1
phosphatidylcholine acyl editing BioCyc 39 0.82387468 0.992072591 1 1
Amino sugar and nucleotide sugar
metabolism
KEGG
PATHWAY 135 0.828235371 0.993366595 3 2 1
Protein export
KEGG
PATHWAY 53 0.831077338 0.994335235 1 1
Basal transcription factors
KEGG
PATHWAY 55 0.841871876 0.997312632 1 1
Homologous recombination
KEGG
PATHWAY 56 0.847008356 0.998471982 1 1
Spliceosome
KEGG
PATHWAY 192 0.882517299 1 4 4
aerobic respiration III (alternative oxidase
pathway) BioCyc 52 0.900188299 1 1 1
RNA transport
KEGG
PATHWAY 169 0.920243315 1 3 3
Glycerophospholipid metabolism
KEGG
PATHWAY 86 0.943271383 1 1 1
Peroxisome
KEGG
PATHWAY 87 0.945119356 1 1 1
aerobic respiration I (cytochrome c) BioCyc 68 0.950502772 1 1 1
Starch and sucrose metabolism
KEGG
PATHWAY 196 0.989094977 1 2 2
Ubiquitin mediated proteolysis
KEGG
PATHWAY 149 0.993001023 1 1 1
Oxidative phosphorylation
KEGG
PATHWAY 162 0.99546225 1 1 1
Ribosome
KEGG
PATHWAY 355 0.999427687 1 3 3

242 Appendices

Bibliography 243
Bibliography
Abad, L.R., D'Urzo, M.P., Liu, D., Narasimhan, M.L., Reuveni, M., Zhu, J.K., Niu,
X., Singh, N.K., Hasegawa, P.M., Bressan, R.A. (1996) Antifungal activity of
tobacco osmotin has specificity and involves plasma membrane
permeabilization. Plant Sci 118, 11-23
Abdin, M.Z., Kiran, U., Alam, A. (2011) Analysis of osmotin, a PR protein as
metabolic modulator in plants. Bioinformation 5, 336-340
AbuQamar, S., Luo, H., LuLuk, K., Mickelbart, M.V., Mengiste, T. (2009) Crosstalk
between biotic and abiotic stress responses in tomato is mediated by the AIM1
transcription factor. Plant J, 1-14
Agarwal, P.K., Shukl, P.S., Gupta, K., Jha, B. (2013) Bioengineering for salinity
tolerance in plants: state of the art. Mol Biotechnol 54, 102-123
Alpert, P., Oliver, M.J. (2002) Drying without dying. In: Black, M., Pritchard, H.W.
(eds) Desciccation and survival in plants: drying without dying. CAB
Publishing, p 13-54
Annon, A., Rathore, K., Crosby, K. (2014) Overexpression of a tobacco osmotin gene
in carrot (Daucus carota L.) enhances drought tolerance. In Vitro Cell Dev
Biol_Plant 50, 299-306
Ansari, M.R., Shaheen, T., Bukhari, S.A., Husnain, T. (2015) Genetic improvement of
rice for biotic and abiotic stress tolerance. Turk J Bot 39, 911-919
Anzlovar, S., Dermastia, M. (2003) The comparative analysis of osmotins and
osmotin-like PR-5 protein. Plant Biol 5, 116-124
Ashraf, M. (2010) Inducing drought tolerance in plants: recent advances. Biotechnol
Adv 28, 169-183
Atkinson, N.J., Urwin, P.E. (2012) The interaction of plant biotic and abiotic stresses:
from genes to the field. J Exp Bot, 1-21
Babu, R.C. (2010) Breeding for drought resistance in rice: an integrated review from
physiology to genomics. Electron J Plant Breed 1(4), 1133-1141
Baena-Gonzalez, E., Sheen, J. (2008) Convergent energy and stress signalling. Trend
Plant Sci 13, 474-482
Bajji, M., Kinet, J.M., Lutts, S. (2002) The use of electrolyte leakage method for
assessing cell membrane stabiity as a water stress tolerance test in durum
wheat. Plant Growth Regul 36, 61-71
Barnabas, B., Jager, K., Feher, A. (2008) The effect of drought and heat stress on
reproductive processes in cereals. Plant Cell Environ 31, 11-38
Bars, H., Weatherley, P. (1962) A re-examination of the relative turgidity technique
for estimating water deficits in leaves. Aust J Biol Sci 15(3), 413-428

244 Bibliography
Barthaker, S., Babu, V., Bansal, K.C. (2001) Over-expression of osmotin induces
proline accumulation and confers tolerance to osmotic stress in transgenic
tobacco. J Plant Biochem Biotech 10, 31-37
Belin, C., Thomine, S. (2010) Water balance and the regulation of stomatal
movements. In: Pareek, A., Sopory, S.K., Bohnert, H.J., Govindjee (eds)
Abiotic stress adaptation in plants: physiological, molecular, and genomic
foundation. Springer Science + Business Media, p 283-305
Benjamini, Y., Hochberg, Y. (1995) Controlling the false discovery rate: A practical
and powerful approach to multiple testing. J R Stat Soc 57, 289-300
Bhatnagar-Mathur, P., Vadez, V., Sharma, K.K. (2008) Transgenic approaches for
abiotic stress tolerance in plants: retrospect and prospects. Plant Cell Rep 27,
411-424
Bhattacharya, A., Saini, U., Joshi, R., Kaur, D., Pal, A.K., Kumar, N., Gulati, A.,
Mohanpuria, P., Yadav, S.K., Kumar, S., Ahuja, P.S. (2014) Osmotin-
expressing transgenic tea plants have improved stress tolerance and are of
higher quality. Transgenic Res 23(2), 211-223
Bodner, G., Nekhforoosh, A., Kaul, H. (2015) Management of crop water under
drought: a review. Agron Sustain Dev 35, 401-442
Bolger, M.E., Weisshaar, B., Scholz, U., Stein, N., Usadel, B., Mayer, K.F.X. (2014)
Plant genome sequencing-aplications for crop improvement. Curr Opin
Biotechnol 26, 31-37
Bradford, M.M. (1976) Arapid and sensitive method for the quantitation of microgram
quantities of protein utilizing the principle of protein-dye binding. Anal
Biochem 72, 248-254
Breviariao, D., Genga, A. (2013) Stress response in rice. J Rice Res 4, e104
Brodribb, T.J., Holbrook, N.M. (2003) Stomatal closure during leaf dehydration,
correlation with other leaf physiological traits. Plant Physiol 132, 2166-2173
Buchan, D.W., Ward, S.M., Lobley, A.E., Nugent, T.C., Bryson, K., Jones, D.T.
(2010) Protein annotation and modelling servers at University College London.
Nucleic Acids Res 38:W565-W568. Available at
http://bioinf.cs.ucl.ac.uk/psipred/?memsatsvm=1 (accessed on 22 August 2013)
Campo, S., Baldrich, P., Messeguer, J., Lalanne, E., Coca, M., Segundo, B.S. (2014)
Overexpression of a Calcium-dependent protein kinase confers salt and
drought tolerance in rice by preventing membrane lipid peroxidation. Plant
Physiol 165, 688-704
Campos, M.D.A., Silva, M.S., Magalhaes, C.P., Ribeiro, S.G., Sarto, R.P., Vieira,
E.A., Sa, M.F.G. (2008) Expression in Escherichi coli, purification, refolding,
and antifungal activity of an osmotin from Solanum nigrum. Microb Cell Fact
7, 7-17
Cha-um, S., Trakulyingcharonen, T., Smitamana, P., Kirdmanee, C. (2009) Salt
tolerance in two rice cutivar differing salt tolerant abilities in responses to iso-
osmotic stress. Aust J Crop Sci 3, 221-230
Chaves, M.M., Maroco, J.P., Pereira, J.S. (2003) Understanding plant responses to
drought - from genes to the whole plant. Funct Plant Biol 30, 239-264

Bibliography 245
Chen, Y.C., Lo, Y.S., Hsu, W.C., Yang, J.M. (2007) 3D-partner: a web server to infer
interacting partners and binding models. Nucleic Acids Res 35, 561-567
Choi, D.S., Hong, J.K., Hwang, B.K. (2013) Pepper osmotin-like protein 1 (CaOSM1)
is an essential component for defense response, cell death, and oxidative burst
in plants. Planta 238, 1113-1124
Clemente, T. (2006) Nicotiana (Nicoiana tabacum, Nicotiana benthamiana). In:
Wang, K. (Ed.), Methods in Molecular Biology. Humana Press Inc, Totowa,
N.J., pp. 143-154
Cominelli, E., Conti, L., Tonelli, C., Galbiati, M. (2013) Challenges and perspectives
to improve crop drought and salinity tolerance. N Biotechnol 30(4), 355-361
Cornejo, M.J., Luth, D., Blankenship, K.M., Anderson, O.D., Blechl, A.E. (1993)
Activity of a maize ubiquitin promoter in transgenic rice. Plant Mol Biol 23,
567-581
Dammann, C., Ichida, A., Hong, B., Romannowsky, S.M., Hrabak, E.M., Harmon
A.C., Pickard, B.G., Harper, J.F. (2003) Subcellular targeting of nine calcium-
dependent protein kinase isoforms from Arabidopsis. Plant Physiol 132(4),
1840-1848
D'Angei, S., Altamura, M.M. (2007) Osmotin induces cold protection in olive trees by
affecting programmed cell death and cytoskeleton organization. Planta 225,
1147-1163
Das, M., Chauhan, H., Chibba, A., Mohd, Q., Haq, R., Khurana, P. (2011) High-
efficiency transformation and selective tolerance against biotic and abiotic in
mulberry, Morus indica cv. K2, by constitutive and inducible expression of
tobacco osmotin. Transgenic Res 20, 231-246
Das, P., Nutan, K., Singla-Pareek, S., Pareek, A. (2015) Understanding salinity
responses and adopting 'omics-based' approaches to generate salinity tolerant
cultivars of rice. Front Plant Sci 6, 712
Datta, K., Velazhahan, R., Oliva, N., Ona, I., Mew, T., Khush, G.S., Muthukrishnan,
S., Datta, S.K. (1999) Over-expression of the cloned rice thaumatin-like
protein (PR-5) gene in transgenic rice plants enhances environmental friendly
resistance to Rhizoctonia solani causing sheath blight disease. Theor Appl
Genet 98, 1138-1145
Dehimi, T., Niazi, A., Ebrahimi, M., Kajbaf, K., Fanaee, S., Bakhtiarizadeh, M.R.,
Ebrahimie, E. (2012) Finding the undiscovered roles of genes: an approach
using mutual ranking of coexpressed genes and prooter architecture-case study:
dual roles of thaumatin like proteins in biotic and abiotic stresses. SpringerPlus
1, 30
Deo, P.C., Tyagi, A.P., Taylor, M., Harding, R., Becker, D. (2010) Factors affecting
somatic embryogeneesis and transformation in modern plant breeding.
SPJNAS 28, 27-40
Diez, P., Dasilva, N., Gonzalez-Gonzalez, M., Matarraz, S., Casado-Vela, J., Orfao,
A. Fuentes, M. (2012) Data analysis strategies for protein microarray.
Microarrays 1, 64-83

246 Bibliography
Dinakar, C., Bartels, D. (2013) Desiccation tolerance in resurrection plants: new
insights from transcriptome, proteome, and metabolome analysis. Front Plant
Sci 4, 1-14
Dionisio-Sese, M.L., Tobita, S. (1998) Antioxidant response of rice seedlings to
salinity stress. Plant Sci 135, 1-9
Dolferus, R., Ji, X., Richards, R.A. (2011) Abiotic stress and control of grain number
in cereals. Plant Sci 181, 331-341.
Dolferus, R., Powell, N., Ji, X., Ravash, R., Edlington, J., Oliver, S., Dongen, J.,
Shiran, B. (2013) The physiology of reproductive-stage abiotic stress tolerance
in cereals. In: Rout, G., Das, A. (Eds.), Molecular stress physiology of plants.
Springer, New Delhi, India.
Dong, H., Beer, S.V. (2000) Riboflavin induces disease resistance in plants by
activating a novel signal transduction pathway. Phytopathology 90(8), 801-811
Du, Z., Zhou, X., Ling, Y., Zhang, Z., Su, Z. (2010) agriGO: a GO analysis toolkit for
the agricultural community. Nucleic Acids Res 38, W64-W70
Dubiella, U., Seybold, H., Durian, G., Komander, E., Lassig, R., Witle, C.P., Schulze,
W.S., Romes, T. (2013) Calcium-dependent protein kinase/NADPH oxidase
activation circuits is required for rapid defense signall propagation. Proc Natl
Acad Sci USA 110, 8744-8749
Dupre, D.J., Robitaille, M., Ethier, N., Villeneuve, L.R., Manmarbahi, A.M., Hebert,
T.E. (2006) Seven transmembrane receptor core signalling complexes are
assembled prior to plasma membrane trafficking. J Biol Chem 281, 34561-
34573
Dway, M.R., Smille, R.M. (1971) B-1,3-glucan: a source of carbon and energy for
chloroplast development in Euglena racili. Aust J Biol Sci 24, 15-22
Earley, K.W., Haag, J.A., Pontes, O., Opper, K., Juehne, T., Song, K., Pikaard, C.S.
(2006) Gateway-compatiple vectors for plant functional genomics and
proteomics. Plant J 45, 616-629
Edwards, D., Batley, J. (2010) Plant genome sequencing: applications for crop
improvement. Plant Biotechnol J 8, 2-9
Emanuelsson, O., Brunak, S., Heijne, G.V., Nielsen, H. (2007) Locating proteins in
the cell using TargetP, SignalsP and related tools. Nat Protoc 2(4), 953-970.
SignalP server available at http://www.cbs.dtu.dk/services/SignalP/ and
TargetP 1.1 server available at http://www.cbs.dtu.dk/services/TargetP/
(accessed on 22 August 2013)
FAO (2016) The state of food and agriculture 2016. Climate change, agriculture and
food security. Rome, FAO
Ferreyra, M.L.F., Rius, S.P., Casati, P. (2012) Flavonoids: biosynthesis, biological
functions, and biotechnological applications. Front Plant Sci 3, Acticle
222_1-16
Freitas, C.D.T., Lopes, J.L.S., Beltramini, L.M., Oliveira, R.S.B., Oliveira, J.T.A.,
Ramos, M.V. (2011) Osmotin from Calotropis procera latex: New insights into
structure and antifungal properties. Biochim Biophys Acta 1808, 2501-2507
Bibliography 247
Fujii, H., Zhu, J.K. (2012) Osmotic stress signaling via protein kinases. Cell Mol Life
Sci 69, 3165-3173
Fujita, M., Fujita, Y., Noutoshi, Y., Takahashi, F., Narusaka, Y., Yamaguchi-
Shinozaka, K., Shinozaki, K. (2006) Crosstalk between abiotic and biotic stress
responses: a current view from the points of convergence in the stress
signalling networks. Curr Opin Plant Biol 9, 436-442.
Fukao, Y. (2012) Protein-protein interactions in plants. Plant Cell Physiol 53(4),
617-625
Gaff, D.F., Oliver, M. (2013) The evolution of desiccation tolerance in angiosperm
plants: a rare yet common phenomenon. Funct Plant Biol 40, 315-328
Gao, X., Chen, X., Lin, W., Hen, S., Lu, D., Niu, Y., Li, I., Cheng, C., McCuormack,
M., Sheen, I. (2013) Bifurcation of Arabidopsis NLR immune signalling via
Ca2+ -dependent protein kinase. PlLoS Pathog 9, e1003127
Garwe, D., Thomson, J.A., Mundree, S.G. (2003) Molecular characterization of
XVSAP1, a stress-responsive gene from the resurrection plant Xerophyta
viscosa Baker. J Exp Bot 54(381), 191-201
Garwe, D., Thomson, J.A., Mundree, S.G. (2006) XVSAP1 from Xerophyta viscosa
improves osmotic-, salinity-, and high-temperature -stress tolerance in
Arabidopsis. Biotechnol J 1, 1137-1146
Gasteiger, E., Hoogland, C., Gattiker, A., Duvaud, S., Wilkins, M.R., Appel, R.D.,
Bairoch, A. (2005) Protein Identification and analysis tools on the ExPASy
Server. In: Walker JM (ed) The Proteomics Protocols Handbook. Humana
Press, p pp 571-607. ExPASY translation tool available at
http://web.expasy.org/translate/. ExPASY Protscale available at
http://web.expasy.org/protscale. ExPASY Compute pI/Mw tool available at
http://web.expasy.org/compute_pi/. ExPASY ProtParam available at
http://expasy.org/tools/protparam.html. ExPASY Prosite available at
http://prosite.expasy.org/mydomains/. (Accessed on 19 August 2013)
Gay, F., Maraval, B., Roques, S., Gunata, Z., Boulanger, R., Audeber, A., Mestres, C.
(2009) Effects of salinity on yield and 2-acetyl-1-pyrroline content in the grains
of three fragraant rice cultivars (Oryza sativaa L.) in Camargue (France). Field
Crops Res 117, 154-160
Gechev, T.S., Benina, M., Obata, T., Tohge, T., Sujeeth, N., Minkov, I., Hille, J.,
Temani, M.R., Marriott, A.S., Bergstrom, E., Thomas-Oates, J., Antonio, C.,
Mueller-Roeber, B., Schippers, J.H.M., Fernie, A.R., Toneva, V. (2013)
Molecular mechanisms of desiccation tolerance in resurrection glacial relic
Haberlea rhodopensis. Cell Mol Life Sci 70, 689-709
Gelvin, S.B. (2003) Agrobacterium-mediated transformation: the biology behind the
"gene-jockeying" tool. Microb Mol Biol Rev 67, 16-37
Gerdes, S., Laerma-Ortiz, C., Frelin, O., Seaver, S.M.D., Henry, C.S., Cracy-legard,
V.D., Hanson, A.D. (2012) Plant B vitamin pathways and their
compartmentation: a guide for the perplexed. J Exp Bot
Gill, S.S., Tuteja, N. (2010) Reactive oxygen species and antioxidant machinery in
abiotic stress tolerance in crop plants. Plant physiol Biochem 48, 909-930

248 Bibliography
Goel, D., Singh, A.K., Yadav, V., Babbar, S.B. (2010) Overexpression of osmotin
gene confers tolerance to salt and drought stresses in transgenic tomato
(Solanum lycopersicum L.) Protoplasma 245, 133-141
Goff, S.A. (1999) Rice as a model for cereal genomics. Curr Opin Plant Biol 2, 86-89
Gonzalez, L., Gonzalez-Vilar, L. (2001) Determination of relative water content. In:
Roger M (ed) Handbook of plant ecophysiology techniques. Kluwer Academic
Publisher, Netherlands, p 207-21
Gosal, S., Wani, S.H., Kan, M.S. (2009) Biotechnology and drought tolerance. J Crop
Improv 23, 19-54
Grover, A., Minhas, D. (2000) Towards production of abiotic stress tolerant transgenic
rice plants: issues, progress and future research needs. Pro. Indian natu Sci
Acad (PINSA) B66, 13-32
Guo, J., Xu, X., Li, W., Zhu, W., Zhu, H., Liu, Z., Luan, X., Dai, Z., Liu, G., Zhang,
Z., Zeng, R., Tang, G., Fu, X., Wang, S., Zhang, G. (2016) Overcoming inter-
subspecific hybrid sterility in rice by developing indica-compatiple japonica
lines. Sci Rep 6, 26878
Halford, N.G., Curtis, T.Y., Chen, Z., Huang, J. (2015) Effects of abiotic stress and
crop management on cereal grain composition: implications for food quality
and safety. J Exp Bot 66, 1145-1156
Halpin, C. (2005) Gene stacking in transgenic plants-the chellenge for 21st century
plant biotechnology. Plant Biotechnol J 3, 141-155
Hansen, G., Wright, M.S. (1999) Recent advances in the transformation of plants.
Trend Plant Sci 4, 226-231
Hasanuzzamman, M., Nahar, K., Alam, M.M., Roychowdhury, R., Fujita, M. (2013)
Physiological, biochemical, and molecular mechanisms of heat stress tolerance
in plants. Int J Mol Sci 14, 9643-9684.
Hernandez, M., Ghersi, D., Sanchez, R. (2009) SITEHOUND-web: a server for ligand
binding site identification and protein structures. Nucleic Acids Res 37, 413-
416
Hiei, Y., Komari, T. (2008) Agrobacterium-mediated transformation of rice using
immature embryos or calli induced from mature seed. Nature Protocols 3
Hoang, T.M.L., Williams, B., Khanna, H., Dale, J., Mundree, SG. (2014)
Physiological basis of salt stress tolerance in rice expressing the antiapoptotic
gene SflAP. Funct Plant Biol 41, 1168-1177
Hong, J.K., Jung, H.W., Lee, B.K., Lee, S.C., Lee, Y.K., Hwang, B.K. (2004) An
osmotin-like protein gene, CAOSM1, from pepper: differentail expression and
in situ localisation of its mRNA during pathogen infection and abiotic stress.
Physiol Mol Plant Pathol 64, 30-310
Horton, P., Park, K., Obayyashi, T., Fufita, N., Harada, H., Adams_Collier, C.J.,
Nakai, K. (2007) Wolf PSORT: protein localization predictor. Nuclic Acids Res
35, W585-W587. Available at http://wolfpsort.org/ (accessed on 22 August
2013)

Bibliography 249
Hou, Q., Bartels, D. (2014) Comparative study of the aldehyde dehydrogenase (ALDH)
gene supperfamily in the glycophyle Aranidopsis thaliana and Eutrema
halophytes. Ann Bot 10.1093/aob/mcu152, 1-15
Hu, C.D., Grinberg, A.V., Kerppola, T.K. (2005) Visualization of protein interactions
in living cells using bimolecular fluorescence complementation (BiFC)
analysis. Curr Protoc Protein Sci, 19.10.11-19.10.21
Hu, S., Xie, Z., Qian, J., Blackshaw, S., Zhu, H. (2011) Functional protein microarray
technology. Wiley Interdiscip Rev Syst Biol Med 3, 255-268
Huang, D.W., Sherman, B.T., Lempicki, R.A. (2009) Systematic and integrative
analysis of large gene lists using DAVID bioinformatics resourses. Nat
Protoc 4(1), 44-55
Huang, G.T., Ma, S.L., Bai, L.P., Zhang, L., Ma, H., Jia, P., Liu, J., Zhong, M., Guo,
Z.F. (2012) Signal transduction during cold, salt, and drought stresses in plants.
Mol Biol Rep 39, 969-987
Husaini, A.M., Abdin, M.Z. (2008a) Development of transgenic strawberry (Fragaria
x ananassa Duch.) plants tolerant to salt stress. Plant Sci 174, 446-455
Husaini, A.M., Abdin, M.Z. (2008b) Overexpression of tobacco osmotin gene leads to
salt stress tolerance in strawberry (Fragaria x ananassa Duch.) plants. Indian J
Biotechnol 7, 465-471
Husani, A.M., Rafiqi, A.M. (2012) Role of osmotin in strawbarry improvement. Plant
Mol Biol Rep 30, 1155-1164
Ibeas, D.J.Y., Lee, J.I., Narasimhan, M.A.C., Uesono, M.L., Hasegawa, P.M., Pardo,
J.M., Breassan, R.A. (1998) Osmotin, a plant antifungal protein, subverbs
signal tranduction to enhance fungal cell susceptibility. Mol Cell 1, 807-817
Ibeas, J.I., Lee, H., Damsz, B., Prasad, D.T., Pardo, J.M., Hasegawa, P.M., Pressan
R.A., Narasimhan M.L. (2000) Fungal cell wall phosphomannans facilitate the
toxic activity of a plant PR-5 prtein. Plant J 23(3), 375-383
Ingle, R.A., Schmidt, U.G., Farrant, J.M., Thomson, J.A., Mundree, S.G. (2007)
Proteomic analysis of leaf proteins during dehydration of the resurrection plant
Xeophyta viscosa. Plant Cell Environ 30, 435-446
Inoue, H., Nojima, H., Okayama, H. (1990) High efficiency transformation of
Escherichia coli with plasmids. Gene 96 (1), 23-28
Jackson, M.R., Nilsson, T., Peterson, P.A. (1990) Identification of a concensus motif
for retention of transmembrane proteins in the endomplasmic reticulum.
EMBO J 38, 3153-3162
Jagadish, K.S.V., Cairn, J.E., Kumar, A., Somayanda, I.M., Craufurd, P.Q. (2011)
Does susceptibility to heat stress confound screening for drought tolerance in
rice. Funct Plant Biol 38, 261-269
Jaggard, K.W., Qi, A., Ober, E.S. (2010) Possible changes to arable crop yields by
2050. Phil Trans R Soc B 365, 2835-2851
Jami, S.K., Anuradha, T.S., Guruprasad, L., Kirti, P.B. (2007) Molecular, biochemical
and structural characterization of osmotin-like protein from black nightshade
(Solanum nigrum). J Plant Physiol 164, 238-252

250 Bibliography
Jaroszewski, L., Li, Z., Cai, X., Webber, C., Godzik, A. (2011) FFAS: novel features
and applications. Nucleic Acids Res 39, 38-44
Jiang, G., Wang, Z., Shang, H., Yang, W., Hu, Z., Phillips, J. (2007) Proteomic
analysis of leaves from resurrection plant Boea hygrometrica in response to
dehydration and dehydration. Planta 225, 1405-1420
Jiao, X., Sherman, B.T., Huang, D.W., Stephens, R., Baseler, M.W., Lane H.C.,
Lampicki R.A. (2012) DAVID-WS: a stateful web service to facilitate
gene/protein list analysis. Application Note 28(13), 1805-1806
Johnson, E.S. (2004) Protein modification by SUMO. Annu Rev Biochem 73, 355-382
Jones, D.T., Taylor, W.R., Thomton, J.M. (1992) The rapid generation of mutation
data matrice from protein sequences. Comput Applic Biosci 8, 275-282.
Kamigaki, A., Nito, K., Hikino, K., Goto-Yamada, S., Nishamura, M., Nakagawa, T.,
Mano, S. (2016) Gateway vectors for simutaneous detection of multiple
protein-protein interactions in plant cells using bimolecular fluorescence
complementation. PloSONE 11, e0160717
Karbaschi, M.R., Williams, B., Taji, A., Mundree, S.G. (2016) Tripogon loliiformis
elicits a rapid physiological and structural response to dehydration for
desiccation tolerance. Funct Plant Biol 43(7), 643-655
Kelley, L.A., Sternberg, M.J.E. (2009) Protein structure prediction on the web: a case
study using the phyre server. Nat Protoc 4, 263-271
Kerppola, T.K. (2008) Bimolecular fluorescence complementation (BiFC) analysis as
a probe of protein-protein interactions in living cells. Annu Rev Biophys 37,
465-487
Kerppola, T.K. (2009) Visualization of molecular interaction using bimolecular
fluorescence complementation analysis: characteristics of protein fragment
complementation. Chem Soc Rev 38, 2876-2886
Kerppola, T.K. (2013) Bimolecular fluorescence comblementation (BiFC) analysis of
protein interactions in live cells. Cold Spring Harbor Protocols, 727-731
Khanna, H.K., Raina, S.K. (1999) Agrobacterium-mediated transformation of indica
rice cultivars using binary and superbinary vectors. Aust J Palnt Physiol 26,
311-324
Kim, H., Mun, J., Byun, B.H., Hwang, H., Kwon, Y.M., Kim, S. (2002) Molecular
cloning and characterization of the gene encoding osmotin protein in Petunia
hybrida. Plant Sci 162, 745-752
Kim, S., Kim, D., Tai, T.H. (2012) Evaluation of rice seedling tolerance to constant
and intermittent low temperature stress. Rice Sci 19(4), 295-308
Kishor, P.B.K., Sangam, S., Amrutha, R.N., Laxmi P.S., Naidu, K.R., Rao K.R.S.S.,
Reddy, K.J., Theriappan, P., Sreenivasulu, N. (2005) Regulation of proline
biosynthesis, degradation, uptake and transport in higher plants: its
implications in plant growth and abiotic stress tolerance. Curr Sci 88(3), 424-
438
Kobayashi, K., Fukuda, M., Igarashi, D., Sunaoshi, M. (2000) Cytokinin binding
proteins from tobacco callus share homology with osmotin-like protein and an
endochitinase. Plant Cell Physiol 41, 148-157

Bibliography 251
Kobayashi, M., Ohura, I., Kawakita, K., Yokota, N., Fujiwana, M., Shimamoto, K.,
Doke, N., Yashioka, H. (2007) Calcium-dependent protein kinase regulate the
production of reactive oxigen species by potatio NADPH oxidase. Plant Cell
19, 1065-1080
Kodama, Y., Wada, M. (2009) Simutanous visuallization of two protein complexes in
a single plant cell using multicolor fluorescence complementation analysis.
Plant Mol Biol 70, 211-217
Koiwa, H., Sato, F., Yamada, Y. (1994) Characterization of accumulation of tobacco
PR-5 proteins by IEF-immunoblot analysis. Plant Cell Physiol 35, 821-827
Komada, Y., Hu, C.D. (2012) Bimolecular fluorescence complementation (BIFC): A
5-year update and future perspectives. Biotechniques 53, 285-298.
Kononowicz, A.K., Nelson, D.E., Singh, N.K., Hasegawa, P.M., Bressan, R.A. (1992)
Regulation of the osmotin gene promoter. The Plant Cell 4, 513-524
Kotchoni, S.O., Kuhns, C., Ditzer, A., Kirch, H., Bartels, D. (2006) Over-expression
of difference aldehyde dehydrogeniase genes in Arabidopsis thaliana confers
tolerence to abiotic stress and protects plants against lipid peroxidation and
oxidative stress. Plant Cell Environ 29, 1033-1048
Kreslavski, V.D., Zorina, A.A., Los, D.A., Formina, I.R., Allakhverdiev, S.I. (2013)
Molecular mechanisms of stress resistance of photosynthetic mechinery. In:
Rout, G.R., Das, A.B. (eds) Molecular stress physiology of plants. Springer,
India, p 21-51
Kreye, C., Bouman, B.A.M., Reversat, G., Fernandez, L., Cruz, C.V., Elazegui, F.,
Faronilo, J.E., Llorca, L. (2009) Biotic and abiotic causes of yield failure in
tropical aerobic rice. Field Crop Res 112, 97-106
Kryshtafovych, A., Fidelis, K. (2009) Protein structure prediction and model quality
assessment. Drug Discov Today 14, 386-392
Kumar, S.A., Kumari, P.H., Kumar, G.S., Mohanalatha, C., Kishor, P.B.K. (2015)
Osmotin: a plant sentinel and a possible agonist of mammalian adiponectin.
Front Plant Sci 6, 163
Lafitte, H.R., Ismail, A., Bennett, J. (2004) Abiotic stress tolerance in rice for Asia:
progress and future. In: The 4th International Crop Science Congress,
Brisbane, Astralia, 2004. New directions for a diverse planet. p 1-17
Lafitte, R. (2002) Relationship between leaf relative water content during reproductive
stage water deficit and grain formation in rice. Field Crop Reseach 76, 165-
174
LaRosa, P.C., Chen, Z., Nelson, D.E., Singh, N.K., Hasegawa, P.M., Bressan, R.A.
(1992) Osmotin gene expression is posttranscriptionally regulated. Plant
Physiol 100, 409-415
Lee, L.Y., Fang, M.J., Kuang, L.Y., Gelvin, S.B. (2008) Vectors for multi-color
bimolecular fluorescence complementation to investigate protein-protein
interactions in living plant cells. Plant Methods 4
Lee, S.B., Kwon, H.B., Kwon, S.J., Park, S.C., Jeong, M.J., Han, S.E., Byun, M.O.,
Daniel, H. (2003) Accumulation of trehalose within transgenic chloroplasts
confers drought tolerance. Mol Breed 11, 1-13

252 Bibliography
Lehner, A., Chopera, D.R., Peters, S.W., Keller, F., Mundree, S.G., Thomson, J.A.,
Farrant, J.M. (2008) Protection mechanisms in the resurrection plant
Xerophyta viscosa: cloning. expression, characterisation and the role of
XvINO1, a gene coding for a myo-inositol 1-phosphate synthase. Funct Plant
Biol 35, 26-39
Liu, D., Narasimhan, M.L., Xu, Y., Raghothama, K.G. (1995) Fine structure and
function of the osmotin gene promoter. Plant Mol Biol 29, 1015-1026
Liu, D., Raghothama, K.G., Hasegawa, P.M., Bressan, R.A. (1994) Osmotin
overexpression in potato delays development of disease symtoms. Proc Natl
Acad Sci USA 91, 1888-1892
Liu, J.J., Sturrock, R. Ekramoddoullah, A.K.M. (2010) The superfamily of thaumatin-
like proteins: its origin, evolution, and expression towards biological function.
Plant Cell Rep 29, 419-436
Lobell, D.B., Burke, M.B., Tabaldi, C., Madtranfrea, M.B., Falcon, W.P., Naylor, R.L.
(2008) Prioritizing climate change adaptation needs for food security in 2030.
Science 139, 607-610
Londo, J.P., Chiang, Y., Hung, K., Chiang, T., Schaal, B.A. (2006) Phylogeography
of Asian wild rice, Oryza rufipogon, reveals multiple independent
domestications of cultivated rice, Oryza sativa. PNAS 103, 9578-9583
Lu, S.X., Hrabak, E.M. (2013) The myristoylated amino-terminus of an Arabidopsis
calcium-dependent protein kinase mediates plasma membrane localization.
Plant Mol Biol 82(3), 267-278
Lynch, J.P. (2013) Steep, cheap, and deep: an ideotype to optimize water and N
acquisition by maize root systems. Anna Bot 112, 347-357
Manavalan, L.P., Nguyen, H.T. (2012) Dought tolerance in crops: physiology to
genomics. In: Shabala S (ed) Plant stress physiology. CABI, Wallingford, UK,
p 1-23
Mani, T., Manjula, S. (2010) Cloning and characterization of two osmotin isoforms
from Peper colubrinum. Biologia Plantarum 54, 377-380
Mani, T., Sivakumar, K.C., Manjula, S. (2012) Expression and functional analysis of
two osmotin (PR5) isoforms with differential antifungal activity from Piper
colubrinum: prediction of structure-function relationship by bioinformatics
approach. Mol Biotechnol 52, 251-261
Manickavelu, A., Nadarajan, N., Ganesh, S.K., Gnanamalar, R.P., Babu, R.C. (2006)
Drought tolerance in rice: mophological and molecular genetic consideration.
Plant Growth Regul 50, 121-138
Mansour, M.M.F. (2013) Plasma membrane permiability as an indicator of salt
tolerance in plants. Biologia Plantarum 57(1), 1-10
Masutomi, Y., Takahashi, K., Hasegawa, H., Mutsuoka, Y. (2009) Impact essessment
of climate change on rice production in Asia in comprehensive consideration
of process/parameter uncertainty in general circulation models. Agric Ecosyst
Environ 131, 281-291
Mervine, S.M., Yost, E.A., Sabo, J.L., Hynes, T.R., Berlot, C.H. (2006) Analysis of G
protein beta gamma dimer formation in living cells using multicolor

Bibliography 253
bimolecular fluorescence complementation demonstrates preferences of beta1
for particular gamma subunits. Mol Pharmacol 70, 194-205
Miele, M., Costantini, S., Colonna, G. (2011) Structure and functional similarities
between osmotin from Nicotiana tabacum seeds and human adiponectin. PLoS
One 6(2), e16690
Min, K., Ha, S.C., Hasegawa, P.M., Bressan, R.A., Yun, D.J., Kim, K.K. (2004)
Crystal structure of osmotin, a plant antifungal protein. Proteins Struct Funct
Bioinforma 54, 170-173
Minitab 17 Statistical Software (2010). [Computer software]. State College, PA:
Minitab, Inc. (www.minitab.com)
Mirceva, G., Davcev, D. (2009) HMM based approach for classifying protein
structures. J Biosci Biotechnol 1, 37-46
Mishra, S., Kumar, S., Saha, B., Awasthi, J., Dey, M., Panda, S.K., Sahoo, L. (2016)
Crosstalk between salt, drought, and cold stress in plants: toward genetic
engineering for stress tolerance. In: Tuteja, N., Gill, S.S. (Eds.), Abiotic stress
response in plants. Wiley_VCH Verlag GmbH & Co. KGaA, pp. 55-86
Mittler, R. (2006) Abiotic stress, the field environment and stress combination. Trend
Plant Sci 11(1), 15-19
Mittler, R., Blumwald, E. (2010) Genetic engineering for modern agriculture:
challenges and perspectives. Annu Rev Plant Biol 61, 443-462
Mohanta, T.K., Sinha, A.K. (2016) Role of Calcium-dependent protein kinases during
abiotic stress tolerance. In: Tuteja N, Gill SS (eds) Abiotic stress response in
plants. First edition. Wiley-VCH Verlag GmbH & Co. KGaA, p 181-202
Mohanty, S., Wassmann, R., Nelson, A., Moya, P., Jagadish, S.V.K. (2013) Rice and
climate change: significance for food security and vulnarability. IRRI
Discussion Paper Series, Los Banos, philippines, 14 p
Moradi, F., Ismail, A. (2007) Response of photosynthesis, chlorophyll fluorescence
and ROS-Scavenging syntems to salt stress during seedling and reproductive
stages in rice. Ann Bot 99, 1161-1173
Mundree, S.G., Baker, B., Mowla, S., Peters, S., Marais, S., Willigen, C.V., Govender,
K., Maredza, A., Muyanga, S., Farrant, J.M., Thomson, J.A. (2002)
Physiological and molecular insights into drought tolerance. Afr J Biotechnol
1, 28-38.
Munns, R., Tester, M. (2008) Mechanism of salinity tolerance. Annu Rev Plant Biol
59, 651-681
Munro, S., Pelham, H.R.B. (1987) A C-terminal signal prevents secretion of luminal
ER proteins. Cell 48, 899-907
Nagarajan, S., Nagarajan, S. (2010) Abiotic tolerance and crop improvement. In:
Sopory, A., Bohnert, S., Govindjee, H. (Eds.), Abiotic stress adaptation in
plants: physiological, molecular, and genomic foundation. Springer Science,
pp. 1-11
Naheed, G., Shahbaz, M., Latif, C.A., Rha, E.S. (2007) Aliviation of the adverse
effects of salt stress on rice (Oryza sativa L) by phosphorus applied through

254 Bibliography
rooting medium: growth and gas exchange characteristics. Pak J Bot 39, 729-
737
Narasimhan, M.L., Coca, M.A., Jin, J.B., Yamochi, T., Ito, Y., Kadowaki, T., Kim,
K.K., Pardo, J.M., Damsz, B., Hasegawa, P.M., Yun, D.J., Bressan, R.A.
(2005) Osmotin is a homolog of mammalian adiponectin and controls
apoptosis in yeast through a homolog of memmalian adiponectin receptor. Mol
Cell 17, 611-621
Narasimhan, M.L., Damsz, B., Coca, M.A., Ibeas, J.I., Yun, D.J., Pardo, J.M.,
Hasegawa, P.M., Bressan, R.A. (2001) A plant defense response effector
induces microbial apoptosis. Mol Cell 8, 921-930
Naseer, M.I., Ullah, I., Narasimhan, M.L., Lee, H.Y., Bressan, R.A., Yoon, J.H., Yun
D.J., Kim, M.O. (2014) Neutro effect of osmotin against ethanol-induced
apoptotic neurodegredation in the developing rat brain. Cell Death Dis 5,
e1150
Negrao, S., Courtois, B., Ahmadi, N., Abreu, I., Saibo, N., Oliveira, M. (2011) Recent
updates on salinity stress in rice: from physiological to molecular responses.
Crit Rev Plant Sci 30, 329-377
Nelson, B.K., Cai, X., Nebenfuhr, A. (2007) A multicolared set of in vitro organelle
markers for co-localization studies in Arabidopsis and other plants. Plant J 51,
1126-1136
Nelson, D.E., Repetti, P.P., Adams, T.R., Creelman, R.A., Wu, J., Warner, D.C.,
Anstrom, D.C., Bensen, R.J., Castiglioni, P.P., Donnarummo, M.G., Hinchey,
B.S. (2007) Plant nuclear factor Y (NF-Y) B subunits confer drought tolerance
and lead to improved corn yields on water-limited acres. PNAS 104(42),
16450-5.
Newton, A.C., Johnson, S.N., Gregory, P.J. (2011) Implications of climate change for
diseases, crop yield and food security. Euphytica 197, 3-18
Ni, F., Chu, L., Shao, H., Liu, Z. (2009) Gene expression and regulation of higher
plants under soil water stress. Curr Genom 10, 269-280.
Nishimura, K., Ishikawa, S., Matsunami, E., Yamauchi, J., Homma, K., Faulkner, C.,
Oparka, K., Nagaya, T., Yokota, K., Nakagawa, T. (2015) New Gateway-
compatible vectors for a high throughput protein-protein interaction analysis
by a bimolecular fluorescence complementation (BIFC) assay in plants and
their application to a plant clathrin structure analysis. Biosci Biotechnol
Biochem 79, 1995-2006
Noori, S.A.S., Sokhansanj, A. (2008) Wheat plants containing an osmotin gene show
enhanced ability to produce roots at high NaCl concentration. Russ J Plant
Physiol 55, 256-258.
Oliver, M.J., (2014) Why we need GMO crops in agriculture. Mol Med 111(6), 492-
507
Oliver, S., Dongen, J.V., Alfred, S., Mamun, E., Zhao, X., Saini, H.S., Fernnaandes,
S.F., Blanchard, C.L., Sutton, B.G., Geigenberger, P., Dennis, E.S., Dolferus,
R. (2005) Cold-induced repression of the rice anther-specific cell all invertase
gene OSINV4 in correlated with sucrose accumulation and pollen sterility.
Plant Cell Environ 28, 1534-1551
Bibliography 255
Onishi, M., Tachi, H., Kojima, T., Shiraiwa, M., Takahara, H. (2006) Molecular
cloning and characterization of a novel salt-inducible gene encoding an acidic
isoform of PR-5 protein in soybean (Glycine max [L.] Merr.). Plant Physiol
Biochem 44, 574-580
O'Rourke, N.A., Meyer, T., Chandy, G. (2005) Protein localization studies in the age
of "omics". Curr Opin Chem Biol 9, 82-87
Pandey, S., Bhandari, H. (2007) Drought: an overview. In: Pandey, S., Bhandari, H.,
Hardy, B. (eds) Economic costs of drought and rice farmers' coping
mechanisms: a cross-country comparative analysis. International Rice
Research Institute, Los Banos (Philippine), p 11-30
Parkhi, V., Kumar, V., Sunikumar, G., Campbell, L.M., Singh, N.K., Rathore, K.S.
(2009) Expression of apoptically secreted tobacco osmotin in cotton confers
drought tolerance. Mol Breed 23, 625-639
Patade, V.Y., Khatri, D., Kumari, M., Grover, A., Gupta, S.M., Ahmed, Z. (2013) Cold
tolerance in osmotin transgenic tomato (Solanum lycopersicum L.) is
associated with modulation in transcrip abundance of stress responsive genes.
SpringerPlus 2, 117
Peng, S., Tang, Q., Zou, Y. (2009) Current status and challenges of rice production in
China. Plant Prod Sci 12(1), 3-8
Peters, S., Mundree, S.G., Thomson, J.A., Farrant, J.M., Keller, F. (2007) Protection
mechanisms in the resurrection plant Xerophyta viscosa (Baker): both sucrose
and raffinose family oligosacharides (RFOs) accumulate in leaves in response
to water deficit. J Exp Bot 58(8), 1947-1956
Petersen, J., Eriksson, S.K., Pierog, P., Colby, T., Bartels, D. (2012) The lysine-rich
motif of intrinsically disordered stress protein CDeT11-24 from Craterostgma
plantagineum is responsible for phosphatidic acid binding and protection of
enzymes from damaging effects caused by desiccation. J Exp Bot 63, 4919-
4929
Peyret, H., Lomonossoff, G.M. (2013) The pEAQ vector series: the easy and quick
way to produce recombinant proteins in plants. Plant Mol Biol 83, 51-58
Pierik, R., Testerink, C. (2014) The Art of being flexible: how to escape from shade,
salt, drought. Plant Physiol 166, 5-22
Plasnas-Iglesias, J., Marin-Lopez, M.A., Bonet, J., Garcia-Garcia, J., Oliva, B. (2013)
iLoops: a protein-protein interction prediction server based on structural
features. Bioinformatics 29, 2360-2362
Plaxton, W.C. (1996) The organisation and regulation of plants glycolysis. Annu Rev
Plant Physiol Plant Mol Biol 47, 185-214
Popescu, S.C., Popescu, G.V., Bachan, S., Zhang, Z., Gerstein, M., Snyder, M.,
Dinesh_Kumar, S.P. (2009) MAPK target networks in Arabidopsis thaliana
revealed using functional protein microarrays. Genes Dev 23, 80-92
Popescu, S.C., Popescu, G.V., Bachan, S., Zhang, Z., Seay, M., Gerstain, M., Snyder,
M., Dinesh-Kumar, S.P. (2007a) Differential binding of calmodulin-related
proteins to their targets revealed through high-density Arabidopsis protein
microarrays. PNAS 104, 4730-4735

256 Bibliography
Popescu, S.C., Snyder, M., Dinesh-Kumar, S.P. (2007b) Arabidopsis proteins
microarrays for the high-throughput identification of protein-protein
interactions. Plant Signal Behav 2(5), 416-420
Powell, N., Ji, X., Ravash, R., Edlington, J., Dolferus, R. (2012) Yield stability for
cereals in a changing climate. Funct Plant Biol 39, 539-552
Prasath, D., El-Sharkawy, L., Sherif, S., Tiwary, K.S., Jayasankar, S. (2011) Cloining
and characterization of PR5 gene from Curcuma amada and Zingiber officinale
in response to Ralstonia solanacearum infection. Plant Cell Rep 30, 1799-1809
Qin, F., Shinozaki, K., Yamaguchi-Shinozaki, K. (2011) Achievements and challenges
in understanding plant abiotic stress responses and tolerance. Plant Cell
Physiol 52, 9
Qureshi, M.I., Qadir, S., Zolla, L. (2007) Proteomics-based dissection of stress-
ressponsive pathway in plants. J Plant Physiol 164, 1239-1260
Rabbani, M.A., Maruyama, K.H.A. (2003) Monitoring expression profiles of rice
(Oryza sativa L.) genes under cold, drought and high-salinity stresses and ABA
application using both cDNA microarray and RNA gel blot analyses. Plant
Physiol 133, 1755-1767
Raghothama, K.G., Liu, D., Nelson, D.E., Hasegawa, P.M., Bressan, R.A. (1993)
Analysis of an osmotically regulated pathogenesis-related osmotin gene
promoter. Plant Mol Biol 23, 1117-1128
Rang, Z.W., Jagadish, S.V.K., Zhou, Q.M., Craufurd, P.Q., Heuer, S. (2011) Effect of
high temperature and water stress on pollen germination and spikelet fertility
in rice. Environ Exp Bot 70, 58-65
Rani, S.J., Usha, R. (2013) Transgenic plants: types, benefits, public concerns and
future. J Pharm Res 6, 879-883
Rao, V.S., Srinivas, K., Sujini, G.N., Kumar, G.N.S. (2014) Protein-protein interaction
detection: methods and analysis. Int J Proteomics 2014, e147648
Ray, D.K., Mueller, N.D., West, P.C., Foley, J.A. (2013) Yield trends are insufficient
to double global crop production by 2050. PloS One 8(6), e66428
Rodriguez, M.C.S., Edsgard, D., Hussain, S.S., Alquezar, D., Ramussen, M., Gilbert,
T., Nielson, B.H., Bartels, D., Mundy, J. (2010) Transcriptomes of the
desiccation-tolerant resurrection plant Craterostigma platagineum. Plant J 63,
212-228
Rohrig, H., Schmidt, J., Colby, T., Brautigam, A., Hufnage, P., Bartels, D. (2006)
Desiccation of the resurrection plant Craterostigma plantagium induces
dynamic changes in protein phosphorylation. Plant Cell Environ 29, 1606-
1617
Rooke, L., Byrne, D., Salgueiro, S. (2000) Marker gene expression driven by the maize
ubiquitin promoter in transgenic wheat. Ann Appl Biol 136, 167-172
Rosa, M., Prado, C., Podazza, G., Interdonato., R., Gonzalez, J.A., Hilal, M., Prado,
F.E.(2009) Soluble sugars-metabolism, sensing and abiotic stress. Plant Signal
Behav 4(5), 388-393

Bibliography 257
Roy, A., Kucukural, A., Zhang, Y. (2010) I-TASSER: a uniform platform for
automated protein structure and function prediction. Nature Protocols 5, 752-
738
Rubio, V., Shen, Y., Saijo, Y., Liu, Y., Gusmaroli, G., Danish-Kumar, S.P., Deng,
X.W. (2005) An alternative tandem affinity purification strategy applied to
Arabidopsis protein complex isolation. Plant J 41(5), 767-778
Sahoo, K.K., Tripathi, A.K., Pareek, A., Sopory, S.K., Singla-Pareek, S.L. (2011) An
improved protocol for efficient transformation and regeneration of diverse
indica rice cultivars. Plant Methods 7, 1-11
Sairam, R.K., Tyagi, A. (2004) Physiology and molecular biology of salinity stress
tolerance in plants. Curr Sci 86(3), 407-421
Sambrook, J., Russell, D. W. (2001) Molecular cloning: a laboratory manual (Vol.
2): CSHL press.
Sankar, P.D., Saleh, M.A.A.M., Selvaraj, C.I. (2011) Rice breeding for salt tolerance.
Res Biotechnol 2(2), 1-10
Sarieva, G.E., Kenzhebaeva, S.S., Lichtenthaler, H.K. (2010) Adaptation potential of
photosynthesis in wheat cultivars with a capability of leaf rooling under high
temparature conditions. Russ J Plant Physiol 57, 28-36.
Sato, F., Kitajima, S., Koyama, T., Yamada, Y. (1996) Ethyleene-induced gene
expression of Osmotin-like protein, a neutro isoform of tobacco PR-5, is
mediated by the AGCCGCC cis-sequence. Plant Cell Physiol 37, 249-255
Sato, F., Koiwa, H., Sakai, Y., Kato, N., Yamada, Y. (1995) Synthesis and secretion
of tobacco neutral PR-5 protein by transgenic tobacco and yeast. Biochem
Biophys Res Commun 211, 909-913
Satoh, S., Matsuda, K., Tamari, K. (1976) β-1,4-glucan occuring in homogenate of
Phaseolus aureus seedling: possible nascent stage of cellulose biosynthesis in
vivo. Plant Cell Physiol 17(6), 1243-1254
Schmidt, T., Haas, J., Cassarino, T.G., Schwede, T. (2009) Assessment of ligand
binding residue predictions in CASP9. Proteins 77, 138-146
Schouten, A., Roosien, J., Engelen, F.A., Jong, G.A.M., Borst-Vressen, A.W.M.,
Zilverentant, J.F., Bosch, D., Stiekema, W.J., Gommers, F.J., Schots, A.,
Bakker, J. (1996) The C-terminal KDEL sequence increases the expression
level of a single-chain antibody designed to be targeted to both the cytosol and
the secretory pathway in transgenic tobacco. Plant Mol Biol 30, 181-193
Schultz, J., Milpetz, F., Bork, P., Ponting, C.P. (1998) SMART, a simple modular
architecture research tool: identification of signaling domains. Proc Natl Acad
Sci 95(11), 5857-5864. Available at http://smart.embl-heidelberg.de (accessed
on 22 August 2013)
Shabala, S., Munns, R. (2012) Salinity stress: Physiological constraints and adaptive
mechanisms. In: Shabala, S. (ed) Plant stress physiology. CABI, Wallingford,
UK, p 59-93
Shah, S.A., Lee, H.Y., Bressan, R.A., Yun, D.J., Kim, M.O. (2014) Novel osmotin
attenuates glutamate-induced synaptic dusfunction and neutrodegeneration

258 Bibliography
via the JNK/PI3K/Akt pathway in postnatal rat brain. Cell Death Dis 5,
e1026
Shahbaz, M., Ashraf, M. (2013) Improving salinity tolerance in cereals. Crit Rev Plant
Sci 32, 237-249
Sherman, B.T., Huang, D.W., Tan, Q., Guo, Y., Bour, S., Liu, D., Stephens, R.,
Baseler, M.W., Lane, H.C., Lempicki, R.A. (2007) DAVID knowleddgebase:
a gene-centered database integrating heterogeneous gene annotation resourses
to facilitate high-throughput gene functional analysis. BMC Bioinformatics 8,
426
Shetty, K. (2004) Role of proline-linked pentose phosphate pathway in biosynthesis of
plant phenolics for functional food and environmental applications: a review.
Process Biochem 39, 789-803
Shi, J., Habben, J.E., Archibald, R.L., Drummond, B.J., Chamberlin, M.A., Williams,
R.W., Lafitte, H.R., Weers, B.P. (2015) Overexpression of ARGOS Genes
Modifies Plant Sensitivity to Ethylene, Leading to Improved Drought
Tolerance in Both Arabidopsis and Maize. Plant Physiol 169, 266-282.
Shi, J., Gao, H., Wang, H., Lafitte, H.R., Archibald, R.L., Yang, M., Hakimi, S.M.,
Mo, H., Habben, J.E. (2017) ARGOS8 variants generated by CRISPR-Cas9
improve maize grain yield under field drought stress conditions. Plant
Biotechnol J 15(2), 207-216.
Shinozaki, K., Yamaguchi-Shinozaki, K. (2007) Gene networks involved in drought
stress response and tolerance. J Exp Bot 58, 221-227
Shylaraj, K.S., Sasidharan, N.K. (2005) VTL5: A high yielding salinity tolerant rice
variety for the coastal saline ecosystems of Kerala. J Trop Agr 42, 25-28
Singh, A.K., Ansari, M.W., Pareek, A., Singla-Pareek, S.L. (2013) Raising salinity
toleranct rice: recent progress and future perspectives. Physiol Mol Biol Plant
14(1&2), 137-154
Singh, N.K., Bracker, C.A., Hasegawa, P.M., Handa, A.K., Buckel, S., Hermodson,
M.A., Pfankoch, E., Regnier, F.E., Bressan, R.A. (1987) Characterization of
osmotin. Plant Physiol 85, 529-536
Singh, N.K., Handa, A.K., Hasegawa, P.M., Bressan, R.A. (1985) Proteins associated
with adaptation of cultured tobacco cells to NaCl. Plant Physiol 79, 126-137
Singh, N.K., Nelson, D.E., Hasegawa, P.M., Bressan, R.A. (1989) Molecular cloning
of osmotin and regulation of its expression by ABA and adaptation to low
water potential. Plant Physiol 90, 1096-1101
Singh, R.K., Redona, E., Refuerzo, L. (2010) Varietal improvement for abiotic stress
tolerance in crop plants: special reference to salinity in rice. In: Pareek, A.,
Sopory, S.K., Bohnert, H.J., Govindjee (Eds.), Abiotic Stress Adaptation in
Plant: Physiology, Molecular and Genomic Foundation. Spring Science+
Business media B. V., pp. 387-415
Sinha, A.K., Jaggi, M., Tuteja, N. (2011) Mitogen-activated protein kinase signaling
in plants under abiotic stress. Plant Signal Behav 6(2), 196-203
Steinhorst, L., Kudla, J. (2013) Calcium and reactive oxygen species rule the waves of
signalling. Plant Physiol 163, 471-485

Bibliography 259
Storey, J. (2002) A direct approach to false didcovery rates. J R Stat Soc 64, 479-498
Subramannyan, K., Arun, M., Mariashibu, T.S., Theboral, J., Rajesh, M., Singh, N.K.,
Manickavasagam, M., Ganaphat, I.A. (2012) Overexpression of tobacco
osmotin (tbosm) in soybean conferred resistance to salinity stress and fungal
infections. Planta 236, 1909-1925
Subramanyam, K., Sailaja, K.V., Subramanyam, K., Roa, D.M., Lakshmidevi, K.
(2011) Ectopic expression of an osmotin gene leads to enhanced salt tolerance
in transgenic chilli pepper (Capsicum annum L.). Plant Cell Tiss Organ Cult
105, 181-192
Supek, F., Bosnjck, M., Skunca, N., Smuc, T. (2011) REVIGO summarizes and
visuallizes long lists of gene ontology terms. Plos One 6(7), e21800
Sutandy, F.X.R., Qian, J., Chen, C.S., Zhu, H. (2013) Overview of protein
microarrays. Curr Protoc Protein Sci 27, 27.21.21-27.21.16
Swamy, B.P.M., Kumar, A. (2013) Genomics-based precision breeding approaches to
improve drought tolerance in rice. Biotechnol Adv 31, 1308-1318
Swindell, W. R. (2006) The association among gene expression responses to nine
abiotic stress treatments in Arabidopsis thaliana. Genetics 174, 1811-1824.
Tan, S., Tan, H.T., Chung, M.C.M. (2008) Membrane proteins and membrane
proteomics. Proteomics 8, 3924-3932
Tester, M., Langridge, P. (2010) Breeding technologies to increase crop production in
a changing world. Science 327, 818-822
Thomson, D., Henry, R. (1995) Single-step protocol for preparation of plant tissues
for analysis by PCR. Biotechniques 19(3), 394-397
Tommaso, P.D., Moretti, S., Xenarios, L., Orobitg, M., Montanyola, A., Chang, J.M.,
Taly, J.F., Notredame, C. (2011) T-Coffee: a web server for the multipe sequence
alignment of protein and RNA sequences using structural information and
homology extension. Nucleic Acids Res 39, W13-W17. Available at
http://www.ebi.ac.uk/Tools/msa/tcoffee/ (accessed on 23-24 August 2013)
Tripathi, A.K., Pareek, A., Sopory, S.K., Singla-Pareek, S.L. (2012) Narrowing down
the targets for yield improvement in rice under normal and abiotic stress
conditions via expression profiling of yield-related genes. Rice 5, 37
Trivedi, V.R., Choravala, M.R., Shah, G.B. (2012) Osmotin: a new adiponectin
agonist, in type II diabetes and obesity. Int J Pharm Sci Rev Res 16(1), 70-74
Tsutsumi, K., Jujioka, Y., Tsuda, M., Kawaguchi, K., Ohba, W. (2009) Visualization
of Ras-PI3K interaction in the endosome using BiFC. Cell Signal 21, 1672-
1679.
Tzfira, T., Citovsky, V. (2006) Agrobacterium-mediated genetic transformation of
plants: biology and biotechnology. Curr Opin Biotechnol 17, 147-154
Tzou, Y.M., Huang, T.S., Huggins, K.W., Chin, B.A., Sonne, A.H., Singh, N.K.
(2011) Expression of truncated tobacco osmotin in Eschirichia coli:
purification and antifungal activity. Biochehnol Lett 33, 539-543
Viktorova, J., Krasny, L., Kamlar, M., Novakova, M., Mackova, M., Macek, T. (2012)
Osmotin, a pathogenenis-related protein. Curr Protein Pept Sci 13, 672-681

260 Bibliography
Wandelt, C.I., Khan, M.R.I., Craig, S., Schroeder, H.E., Spencer, D., Higgins, T.J.V.
(1992) Vicilin with carboxy-terminal KDEL is retained in the endoplasmic
reticulum and accumulate to high levels in the leaves of transgenic plants. Plant
J 2, 181-192
Wang, Y., Frei, M. (2011) Stressed food - the impact of abiotic environmental stresses
on crop quality. Agric Ecosyst Environ 141, 271-286
Wani, S.H., Sah, S.K. (2014) Biotechnology and abiotic stress tolerance in rice. J Rice
Res 2, e105
Wass, M.N., Kelley, L.A., Sternberg, M.J.E. (2010) 3DLigandSite: predicting ligand-
binding sites using similar structures. Nucleic Acids Res 38, 469-473
Weber, R.L.M., Wiebke-Strohm, B., Bredemeier, C., Margis-Pinheiro, M., Brito,
G.G., Rechenmacher, C., Bertagnolli, P.F., Sa, M.E.L., Campo, M.A.,
Amorim, R.M.S., Beneventi, M.A., Margis, R., Grossi-de-Sa, M.F., Bodanese-
Zanettini, M.H. (2014) Expression of an osmotin-like protein from Solanum
nigrum confers drought tolerance in transgenic soybean. BMC Plant Biol 14,
343
Whithaker, A., Bochicchio, A., Vassana, C., Lindsey, G., Farrant, J. (2001) Changes
in leaf hexakinase activity and motebolic levels in response to drying in the
desiscation tolerant species Sporopolus stapfianus and Xerophyta viscosa. J
Exp Bot 52,10.1093
Williams, B., Njaci, I., Moghaddam, L., Long, H., Dickman, M.B., Zhang, X.,
Mundree, S.G., (2015) Trehalose accumulation triggers autophagy during plant
desiccation. PLoS Genet 11, e1005705
Wu, J., Mao, X., Cai, T., Luo, J., Wei, L. (2006) KOBAS server: a web-based platform
for automated annotation and pathway identification. Nucleic Acids Res 34,
W20-24
Wurzinger, B., Mair, A., Pfister, B., Teige, M. (2011) Cross-talk of calcium-dependent
protein kinase and Map kinase signalling. Plant Signal Behav 6(1), 8-12
Xie, C., Mao, X., Huang, J., Ding, Y., Wu, J., Dong, S., Kong, L., Gao, G., Li, C., Wei,
L. (2011) KOBAS 2.0: a web server for annotation and identification of
enriched pathways and diseases. Nucleic Acids Res 39, W316-322
Xiong, L., Zhu, J.K. (2002) Molecular and genetic aspects of plant responses to
osmotic stress. Plant Cell Environ 25, 131-139
Xue, Y., Zhou, F., Fu, C., Xu, Y., Yao, X. (2006) SUMOsp: a web server for
sumoylation site predition. Nucleic Acids Res 1(34), W254-7. Available at
http://sumop.biocuckoo.org (accessed on 25 August 2013)
Xue, Y., Zhou, F., Zhu, M., Ahmed, K., Chen, G., Yao, X. (2005) GPS: a
comprehensive www server for phosphorylation sites prediction. Nucleic Acids
Res 33, W184-W187. Available at http://fps.biocuckoo.oeg/online.php
(accessed on 26 August 2013)
Yang, J., Yan, R., Xu, D., Poisson, J., Zhang, Y. (2015) The I-TASSER Suit: protein
structure and function prediction. Nature Methods 12, 7-8

Bibliography 261
Yen, H., Edward, G., Grimes, H. (1994) Characterization of salt-responsive 24-
kilodaton glycoprotein in Mesembryanthemum crystallinum. Plant Physiol
105, 1179-1187
Yun, D.J., Ibeas, J.I., Lee, H., Coca, M.A., Narasimhan, M.L., Uesono, Y., Hasegawa,
P.M., Pardo, J.M., Bressan, R.A. (1998) Osmotin, a plant antifulgal protein,
subverts signal transduction to enhance fungal cell susceptibility. Mol Cell 1,
807-817
Yun, D.J., Zhao, Y., Pardo, J.M., Narasimhan, M.L., Damsz, B., Lee, H. (1997) Stress
proteins on the yeast cell surface determine resistance to osmotin, a plant
antifulgal protein. Proc Natl Acad Sci USA 94, 7082-7087
Zhang, Q., Chen, Q., Wang, S., Hong, Y., Wang, Z. (2014) Rice and cold stress:
methods for its evaluation and summary of cold tolerance-related quantitative
loci. Rice 7, 24
Zhang, Y. (2008) I-TASSER server for protein 3D structure predition. BMC
Bioinformatics 9, 40
Zhang, Y. (2009) Protein structure prediction: when is it useful? Curr Opin Struct Biol
19, 145-155
Zhang, Y., Shih, D.S. (2007) Isolation of an osmotin-like protein gene from strawberry
and analysis of the response of this gene to abiotic stresses. J Plant Physiol
184, 68-77
Zhou-Da, X., Rui-Lian, J., Qiang, G., Hai-Pan, Z., Xue-Hui, X., Hei, L., Tai-Gaing,
L., Guo-Zhen, L. (2008) Drought-tolerant gene screening in wheat using rice
microarray. Chinese J Agric Biotechnol 5, 43-48
Zhu, B., Chen, T.H.H., Li, P.H. (1995) Activation of two osmotin-like protein genes
by abiotic stimuli and fungal pathogene in transgenic potato plants. Plant
Physiol 108, 929-937
Zhu, J.K. (2016) Abiotic stress signalling and responses in plants. Cell 167, 313-324
Zhu, S., Yu, X., Wang, X., Zhao, R., Li, Y., Fan, R., Shang, Y., Du, S., Wang, X., Du,
S., Xu, Y., Zhang X., Zhang, D. (2007) Two Calsium-dependent protein
kinase, CPK4 and CPK11, regulate abscisic acid signal transduction in
Arabidopsis. The Plant Cell 19, 3019-3036
Ziemienovicz, A. (2014) Agrobacterium-mediated plant transformation: factors,
applications and recent advances. Biocatal Biotechnol 3, 95-102
Zuraida, A.R., Rahiniza, K., Zulkifli, A.S., Alizah, Z., Zamri, Z., Aziz, A. (2013)
Hygromycin as selective marker in Agrobacterium-mediated genetic
transformation of indica rice MR 219. J Trop Agric Fd Sci 41, 71-79


