moisture effects on high performance polymer composites - T-Space
109
MOISTURE EFFECTS ON HIGH PERFORMANCE POLYMER COMPOSITES Shahriar Ghavidel Taghavi A thesis submitted in conformity with the requirements For the Degree of Master of Applied Science, Department of Chernical Engineering and Applied Cbemistry University of Toronto O Copyright by Shahriar Ghavidel Taghavi
Transcript of moisture effects on high performance polymer composites - T-Space

MOISTURE EFFECTS ON HIGH PERFORMANCE POLYMER COMPOSITES
Shahriar Ghavidel Taghavi
A thesis submitted in conformity with the requirements For the Degree of Master of Applied Science,
Department of Chernical Engineering and Applied Cbemistry University of Toronto
O Copyright by Shahriar Ghavidel Taghavi
National Library I*1 of Canada Bibliothèque nationale du Canada
Acquisitions and Acquisitions et Bibliographic Services services bibliographiques
395 Wellington Street 395, nie Wellington Ottawa ON K1A ON4 Ottawa ON K I A ON4 Canada Canada
The author has granted a non- L'auteur a accordé une licence non exclusive licence allowing the exclusive permettant à la National Library of Canada to Bibliothèque nationale du Canada de reproduce, loan, distribute or sel1 reproduire, prêter, distribuer ou copies of this thesis in microform, vendre des copies de cette thèse sous paper or electronic formats. la fome de rnicrofiche/~, de
reproduction sur papier ou sur format électronique.
The author retains ownership of the L'auteur conserve la propriété du copyright in this thesis. Neither the droit d'auteur qui protège cette thèse. thesis nor substantial extracts fiom it Ni la thèse ni des extraits substantiels may be printed or otheMrise de celle-ci ne doivent être imprimés reproduced without the author's ou autrement reproduits sans son permission. autorisation.

Moisture effects on high performance Polymer Composites
Master of Applied Science 2000
Shahnar Ghavidel Taghavi
Graduate Department of Chernical Engineering and Applied Chemistry University of Toronto
Abstract
Fiber reinforced composites have been gaining wide use in the variety of
applications such as military and aerospace. The performance of these
composites may suffer when the matenal is exposed to adverse environrnents
for long penods of time. In this research, diffusion of moisture into glass-epoxy.
carbon-epoxy and carbon-polyimide composites irnmened in 60°C and 90° C
water was investigated. Also the effect of the residual stresses on the absorption
behavior of the cross-ply composites was studied. In addition. the author
investigated the effect of the hot and moist environment on the notched tensile
strength of various types of cross-ply composites. Results of this research
indicated that the notched strength of cross-ply glass-epoxy composites
decreased by about 65% afler 7000 hours immersion in 90°C water. In another
experiment. the transverse test was used to investigate the kerosene effect on the
interface of the unidirectional composites. It was found that the interface of
unidirectional carbon-polyirnide laminates was unaffected even d e r 3500 hours
of 80°C kerosene immersion.

Acknowledgements
1 wish to express rny deepest gratitude and thanks to Professor Mark Kortschot
for bis advice, guidance, patience and encouragement during this work.
I am very thankful to professor D. W. Kirk for his suggestions and valuable
advice, it is greatly ap preciated.
Also many thanks to Jenny ClifTord for her care and frieadship. Thanks to al1
the members of the advanced composites, physics and chemistry group for their
support and friendship.
Last but not least, greatest thanks to my parents, brother, sister and my wife for
their numerous support in many many dinerent ways throughout al1 these years.
iii

TABLE OF CONTENTS
ABSTRACT
ACKNOELEDGEMENT
TABLE OF CONTENTS
LIST OF FIGURES
LIST OF TABLES
1. INTRODUCTION
1.1 COMPOSITE MATERIALS
1.2 FIBERS
1.2.1 GLASS FIBERS
1.2.2 CARBON FIBERS
1.3 POLYMERIC MATRIX
1.3.1 THERMOPLASTIC POLYMERS
1.3.2 THERMOSETTTNG RESINS
1.3 2 . 1 EPOXY RESIFIS
1.3 -2.2 POLYIMIDES
1.4 INTERFACES IN COMPOSITE MATERIALS
1.4.1 MECHANICAL METHODS FOR INTERFACE
MEASUREMENT
1.5 ENVIRONMENTAL EFFECTS ON COMPOSITE
MATEMALS
1.6 OBJECTrVE OF THIS STUDY
2 EWERIMENTAL METHOD
2.1 M A T E W S
2.2 SAMPLE PREPARATION
2.2.1 TENSILE SPECTMENS

2.2.2 SAMPLES FOR MOISTURE ABSORPTION
ME AS LJREMENT
2.2.3 SAMPLES FOR TRANSVERSE TENSILE TEST
2.2.3 SAMPLES FOR KEROSENE ABSORPTION
2.2.5 SEM SAMPLES
2.3 COMPOSITE TESTING
2.3. 1 TENSILE STRENGTH TEST
2.3.2 TRANSVERSE TENSILE TEST
2.4 SAMPLES FOR IMAGE ANALYSIS
3. EXPERIMENTAL RESULTS
3.1 MOISTURE ABSORPTION
3.2 INITIAL MOISTURE CONTENT AND FINAL WEIGHT
LOSS OF COMPOSITES
3.3 KEROSENE ABSORPTION
3.4 EFFECTS OF AQUEOUS SOLUTION ON TENSILE
STRENGTH OF CROSS-PLY COMPOSITES
3.5 EFFECT OF KEROSENE ON TRANSVERSE STRENGTH
OF UNIDIRECTIONAL COMPOSITES
3.6 SEM OBSERVATIONS OF FRACTURE SURFACES
3.7 LIGHT MICROSCOPE OBSERVATIONS
4. DISCUSSION
4.1 MOISTURE ABSORPTION
4.1-1 VARIATION BETWEEN WATER ABSORPTION
SAMPLES
4.1.2 WATER ABSORPTION BEHAVIOR OF
LAMINATES IN TWlS STUDY

4-3 MOISTURE ABSORPTION IN SATURATED SOLUTION
OF SALT AND WATER 80
4-3 MOISTURE ABSORPTION IN SATURATED SOLUTION
OF SALT AND WATER 82
3.5 KEROSENE ABSORPTION OF UNIDIRECTIONAL
COMPOSITES 86
4.6 EFFECT OF KEROSENE ON TRANSVERSE STRENGTH
OF UNIDIRECTIONAL COMPOSITES 87
5. CONCLUSION
6. REFRENCES
7. LIST OF NOMENCLATURE

LIST OF FIGURES
FIGURE 1.1 EPOXY GROUP
FIGURE 1.2 CHEMICAL STRUCTURE OF EPOXY RESIN
FIGURE 1.3 CURING PROCESS OF EPOXY RESIN
FIGURE 1.4 IMIDE GROUP
FIGURE 1.5 REACTION OF AMINE W T H AN ANHYDRIDE
FIGURE 1.6 INTERFACE IN COMPOSITE MATERIALS
FIGURE 1.7 THE THREE LOMPONEBTS COhTWBbTES 7'0 IXTERPHASE
ADHESION
FIGURE 1.8 FRAGMENTATION TEST
FIGURE 1.9 PULLOUT TEST
FIGURE 1.10 LOAD-DISPLACEMENT CURVE
FIGURE 1.1 1 MICROCOMPRESSION TEST
FIGURE 1.12 MICROTENSION TECHNIQUE
FIGURE 1.13 TRANSVERSE TENSILE TEST
FIGURE 1.14 ILLUSTRATION OF MOISTURE CONTENT VERSUS SQUARE
ROOT OF TIME PLOT
FIGURE 2.1 CURING CYCLE FOR CARBON AND GLASS EPOXY LAMINATES
FIGURE 2.2 CURING CYCLE FOR CARBON-POLYIMIDE LAMINATES
FIGURE 2.3 COMPOSITE SPECIMEN FOR TENSILE STRENGTH TEST
FIGURE 2.4 COMPOSITE SPECIMEN FOR TRANSVERSE TENSILE TEST
FIGURE 2.5 ILLUSTRATION OF THE KEROSENE BATH
FIGURE 2.6 THE OUTER CLAMP FOR THE TRANSVERSE TEST SPECIMENS
FIGURE 2.7 MTS632.27 EXTENSOMETER
FIGURE 2.8 ILLUSTRATION OF THE IMAGE ANALYSIS SYSTEM
FIGURE 3.1 WEIGHT GAIN OF GLASS-EPOXY LAMINATES IMMERSED IN
DISTILLED WATER AT 60' C
FIGURE 3.2 WEIGHT GAIN OF GLASS-EPOXY LAMINATES IMMERSED IN
DISTILLED WATER AT 90' C
FIGURE 3 3 WEIGHT GAIN OF GLASS-EPOXY LAMINATES IMMERSED 1[N
SATURATED SOLUTION OF SALT (NACL) AND DISTILLED
WATER AT 90° C

FIGURE 3.4 WIGHT GAIN OF CARBON-EPOXY LAMZNATE IMMERSED
IN DISTILLED WATER AT 60° C 41
FIGURE 3.5 W I G H T GAIN OF CARBON-EPOXY LAMINATES IMMERSED
IN DISTILLED WATER AT 90° C 41
FIGURE 3.6 VVEIGHT GAIN OF CARBON-EPOXY LAIMINATES IMMERSED
IN SATURATED SOLUTION OF SALT (NACL) AND DISTILLED
WATER AT 90° C 42
FIGURE 3.7 WEIGHT GAIN OF CARBON-POLYIMIDE LAMINATE IMMERSED
IN DISTILLED WATER AT 60° C 43
FIGURE 3.8 W I G H T GAIN OF CARBON-POLYIMIDE LAMTNATE IMMERSED
IN DISTILLED WATER AT 90° C 43
FIGURE 3.9 WEIGHT GAIN OF CARBON-POLYIMIDE LAMINATES IMMERSED
IN SATURATED SOLUTtON OF SALT (NACL) AND DISTILLED
WATER AT 90° C 44
FIGURE 3.10 W I G H T LOSS FOR GLASS-EPOXY COMPOSITES
DRIED OUT AT 160° C 45
FIGURE 3.1 1 WEIGHT LOSS FOR CARBON-EPOXY COMPOSITES
DRIED OUT AT 160° C 45
FIGURE 3.12 WEIGHT LOSS FOR CARBON-POLYIMIDE COMPOSITES
DRIED OUT AT 160° C 16
FIGURE 3.13 WATER ABSORPTION SAMPLES (GLASS-EPOXY) IN 90°C
DtSTILLED WATER DRIED OUT AT 160°C AFTER IMMERSION 47
FIGURE 3.14 WATER ABSORPTION SAMPLES (GLASS-EPOXY) IN 90°C
SATURATED SOLUTION OF SALT AND DISTILLED WATER DRIED
OUT AT 160°C AFTER IMMERSION 47
FIGURE 3.15 WATER ABSORPTION SAMPLES (CARBON-EPOXY) IN 90°C
DISTILLED WATER D R E D OUT AT 160°C AFTER W R S I O N 48
FIGURE 3.16 WATER ABSORPTION SAMPLES (CARBON-EPOXY) IN 90°C
SATURATED SOLUTION OF SALT AND DISTILLED WATER
DRIED OUT AT 160°C AFTER IMMERSION 48
FIGURE 3.17 ABSORPTION IN 80°C KEROSENE FOR GLASS-EPOXY
COMPOSITES 49
FIGURE 3.18 ABSORPTION IN 80°C KEROSENE FOR CARBON-POLYIMIDE
COMPOSITES
FIGURE 3.19 EFFECT OF T m 90°C DISTILLED WATER ON THE TENSILE
STRENGTH OF GLASS-EPOXY COMPOSITES
FIGURE 3.20 EFFECT OF THE 90°C SATURATED SOLUTION OF SALT AND
WATER ON THE TENSILE STRENGTH OF GLASS-EPOXY
COMPOSITES
FIGURE 3-21 EFFECT OF 90°C WATER IMMEMION ON THE TENSILE
STRENGTH OF [0,90js CARBON-EPOXY LAMINATES
FIGURE 3.22 EFFECT OF 90°C IMMERSION IN SATURATED SOLUTION
OF SALT (NACL) AND DISTILLED WATER ON THE TENSILE
STRENGTH OF [0,90]s CARBON-EPOXY LAMINATES
FIGURE 3.23 EFFECT OF 90°C WATER IMMERSION ON THE TENSILE
STRENGTH OF [O,!lOJs CARBON-POLYIMIDE LAMINATES
FIGURE 3.24 EFFECT OF 90°C SATURATED SOLUTTON OF SALT AND WATER
ON THE TENSILE STRENGTH OF [0,90Is CARBON-POLYIMIDE
LAMINATES
FIGURE 3.25 TYPICAL FORCE-DISPLACEMENT CURVES
FIGURE 3.26 EFFECT OF 80°C KEROSEIYE IMMERSION ON o2u GLASS-EPOXY
FIGURE 3.27 EFFECT OF 80°C KEROSENE ON TRANSVERSE MODULUS
OF GLASS-EPOXY
FIGURE 3.28 EFFECT OF 80°C KEROSENE IMMERSION ON
CARBON-POLYIMIDE COMPOSITES
FIGURE 3.29 EFFECT OF 80°C KEROSENE ON TRANSVERSE MODUlLUS
OF CARBON-POLYIMIDE
FIGURE 330 FRACTURE SURFACE OF [0,901s CARBON-EPOXY COMPOSITES
A) NO TREATMENT B)7000 HOURS IMMERSION IN 90°C DISTILLED
WATER C) 7000 HOüRS IMMERSION IN 90°C SATURATED
SOLUTION OF SALT AND DISTILLED WATER 60
FIGURE 3.31 FRACTURE SURFACE OF [0,90js CARBON-POLYLMIDE
COMPOSITES A) NO TREATMENT B)7000 HOURS IMMERSION
IN 90°C DISTILLED WATER C) 7000 HOURS IMMERSION IN
90°C SATURATED SOLUTION OF SALT AND DISTILLED WATER 61
FIGURE 332 FRACTURE SURFACE OF GLASS-EPOXY COMPOSITES
IMMERSED IN 80°C KEROSENE 62
FIGURE 333 FRACTURE SURFACE OF [90Iu CARBON-POLYIMIDE
COMPOSITES IMMERSED IN 80°C KEROSENE 63
FIGURE 3.34 CROSS-SECTIONS OF GLASS-EPOXY COMPOSITES 64
FIGURE 3-35 CROSS-SECTIONS OF CARBON-EPOXY COMPOSITES 65
FIGURE 3.36 CROSS-SECTIONS OF CARBON-POLYIMIDE COMPOSITES 66
FIGURE 4.1 ABSORPTION TYPE (A), CARBON-EPOXY AND
CARBON-POLYIMIDE IN 60°C DISTILLED WATER 69
FIGURE 4.2 ABSORPTION TYPE (B), GLASS-EPOXY IN 60°C AND 90°C
DISTILLED WATER 71
FIGURE 4.3 ABSORPTION TYPE (B), CARBON-EPOXY AND
CARBON-POLYIMIDE IN 90°C DISTILLED WATER 71
FIGURE 4.4 AVERAGE W I G H T GAIN FOR THE GLASS-EPOXY LAMINATES
IMMERSED IN 60°C DISTILLED WATER 73
FIGURE 4.5 AVEtRAGE WIGHT GAIN FOR THE GLASS-EPOXY LAMINATES
IMMERSED IN 90°C DISTILLED WATER 73
FIGURE 4.6 AVERAGE WEIGHT GAIN FOR THE CARBON-EPOXY
LAMINATES IMMERSED IN 90°C DISTILLED WATER 74
FIGURE 4.7 INITIATION, TRANSITION AND SATURATION REGIONS
OF MOiSTURE ABSORPTION CIiRVE 74
FIGURIE 1.8 PROJECTED F'ICK'S LAW BASED ON EXPERIMENTAL
ABSORPTION DATA AND SOLID MASS LOSS DATA A) GLASS-EPOXY
IN 90°C WATER B) CARBON-EPOXY IN 90°C WATER 77
FIGURE 4.9 MOISTURE DIFFUSION PATTERN FOR GLASS-EPOXY
LAMINATES IN 60°C AND 90°C WATER 78
FIGURE 3.10 MOISTURE DIFJXJSION PATTERN FOR CARBON-EPOXY
LAMINATES iN 60°C AND 90°C WATER 79
FIGURE 4.11 MOISTURE DIFFUSION P A W R N FOR CARBON-POLYIMIIDE
LAMINATES IN 60°C AND 90°C WATER 79
FIGURE 4.12 COMPARISON BETM'EEN WATER ABSORPTION OF GLASS-

EPOXY COMPOSITES IN 90°C DISTILLED WA'IXR AND 90°C
SATURATED SOLUTION OF SALT AND DISTILLED WATER 81
FIGURE 4.13 COMPARISON BETWEN WATER ABSORPTION OF CARBON-
EPOXY COMPOSITES IN 90°C DISTILLED WATER AND 90°C
SATURATED SOLUTION OF SALT AND DISTILLED WATER 81
FIGURE 4.14 COMPARISON BETU'EEN WATER ABSORPTION OF CARBON-
POLYIMIDE COMPOSITES IN 90°C DISTILLED WATER AND 90°C
S A T m T E D SOLUTION OF SALT AND DISTILLED WATER 82
FIGURE 4.15 COMPARISON BETWEEN THE NOTCWED TENSILE
STRENGTH OF GLASS-EPOXY, CARBON-EPOXY AND
CARBON-POLYIMIDE CROSS-PLY LAMINATES IMMERSED
IN 90° C DISTILLED WATER
FIGURE 4.16 COMPARISON BETWEEN THE NOTCHED TENSILE
STRENGTH OF GLASS-EPOXY, CARBON-EPOXY AND
CARBON-POLYILMIDE CROSS-PLY LAMINATES IMMERSED
IN 90° C SATURATED SOLUTION OF SALT
AND DISTILLED WATER 86
FIGURE 4.17 COMPARISON BETWEN ABSORPTION IN 80°C KEROSENE
FOR GLASS-EPOXY AND CARBON-POLYIMIDE
LAMINATES 87
FIGURE 4.18 COMPARISON BETWEEN THE TRANSVERSE MODULUS
OF [90124 GLASS-EPOXY AND CARBON-POLYIMIDE
IMMERSED IN 8Q0 C KFROSENE
FIGURE 4.19 COMPARISON BETWEEN THE TNWSVERSE TENSILE
STRENGTH OF [90Iu GLASS-EPOXY AND CARBON-
POLYIMIDE IMMERSED IN 8Q0 C KEROSENE

LIST OF TABLES
TABLE 1.1 MECHANICAL PROPERTIES OF SOMlE COMPOSITES
TABLE 1.2 APPLICATIONS OF FIBER REINFORCED COMPOSITES
IN AIRCRAFT
TABLE 1 3 GENERAL PROPERTIES OF DIFFERElVT GRADES OF GLASS FIBER
TABLE 1.4 GENERAL PROPERTIES OF DIFFERENT GRADES OF CARBON FIBER
TABLE 3.1 WEIGHT LOSS (%) OF THE WATER ABSORPTION SAMPLES
DRIED OUT AT l6O0C
TABLE 4-1 SLOPES OF INDMDUAL REGIONS OF MOISTURE ABSORPTION
CURVE
TABLE 4-2 ORDER 3 POLYNOMIAL LINES TO REPLICATE THE ABSORPTION
OF LAMINATES
TABLE 4-3 AVERAGE MAXIMUM WEIGHT GAIN ( O h )

1. INTRODUCTION
1.1 Composite Materiah:
Namal composites, such as wood have been known for several thousand years.
Around five thousand B.C. reeds were used to reinforce pitch for composite boats and over
three housand y e m agn wood larninated with shellac was produced in Thebes [I l . A
composite consists of two or more materials combined in order to improve on some weakness
of a particularly usefùl cornponent and they are ideal candidates to improve and develop usage
of existing matenals. Today the definition of composite matenals has become broader, and
includes materials like. fiber-reinforced polymers and rnolecular composites.
Fiber reinforced polymers offer a mixture of strength and modulus. which are
comparable to or even better than, many traditional metallic materiais. Some of these
properties such as the specific gravity. strength-weight ratio and modulus-weight ratio are
superior to those of metailic matenals [3](Table 1.1). Because of these properties. fiber
reinforced polymers have been considered and are being used as a replacement for metals in
many weight critical applications. Fiber reinforced polymers have the following elements:
a) The reinforcing fiber: 'The sti&ess and strength of the composite are largely determined by
reinforcing fiber. These fibers are stiff, often with the modulus higher than steel.
b) nie matrix resin: It transfen stresses b e ~ e e n the fibers and provides an obstacle against a
hostile environment. The resin has aiso several other d e s . For instance. it is the medium
which determines the serviceability and processability of the composites, and protects the
fibers fiom damage during the process. Its stiffness and strength are usually low in cornparison
with the reinforcing fibers. A factor of 100 between resin and reinforcement is common [3].

C) The interface between resin and reinforcement: The adhesion between the resin and the
fiber is very important. The properties of resin in the neighborhood of the fiber have an overall
effect on composite performance. The fibers may have chemically activated surfaces or may
be coated to promote adhesion of the resin. So, it may be more correct to consider an
interphase instead of an interface between these materials.
Table 1.1 Meehanical properties of aome composites and metals
Specific Modulus Tensile strength Ratio of modulus Ratio of strength ~ v i t Y GPa GPa to weight ( 1 0' m) to weight ( 10' m)
ASE 1 O 1 O steel 7.87 207 0.36 (coId-worked) AL 606 1 -T6 aluminum 2.70 68.9 0.3 1 Ti6A 1 .IV titanium 4.33 110 1.17 alloy High swngth carbon- 1.55 137.8 1.55 Epo'cy (unidirectional) E-glass-ep0.q 1.85 39.3 0.96 (unidirectional) Kevlar 49-cpoxy 1.38 75.8 1.37
The most common form of composites, used in structural applications, is the laminate.
It cm be obtained by stacking a number of thin layers of fibers and matrix and un img them
into the desired thickness. Fiber orientation in each layer cm be controlled to create a range of
physical and mechanical properties for the composite laminate. This anisotropic nature of
laminates creates an oppornuiity on t a i l o ~ g its properties in accordance with application.
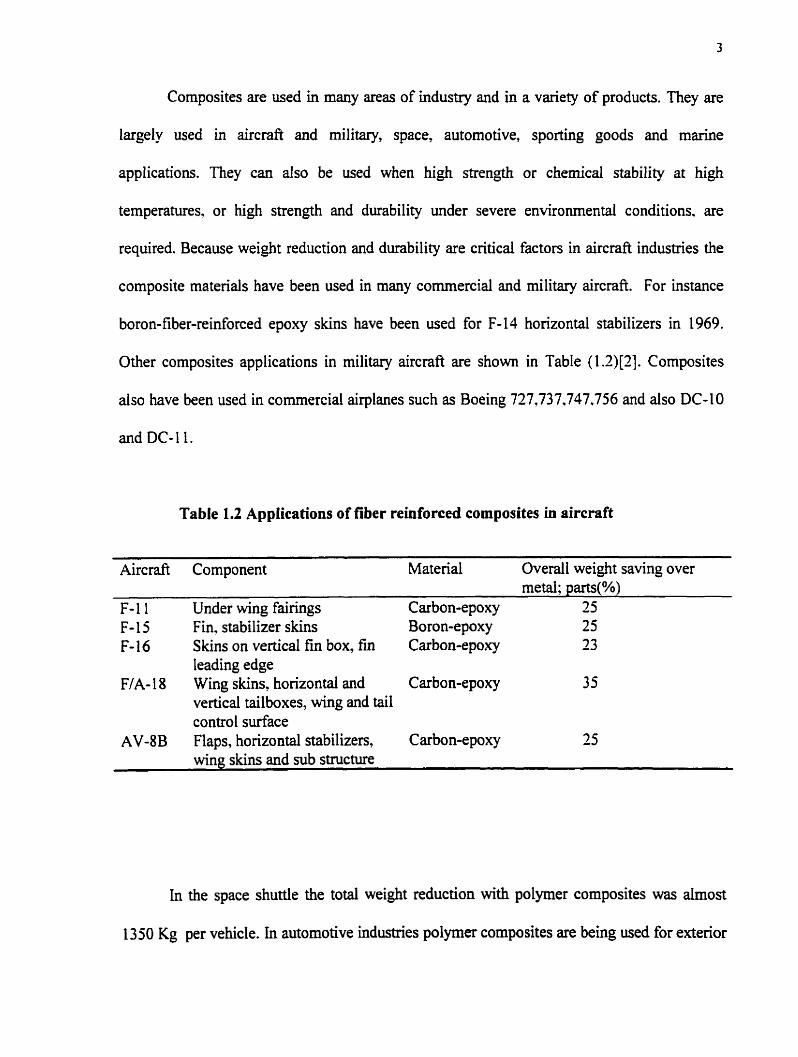
Composites are used in many areas of hdustry and in a variety of products. They are
largely used in aircraft and military, space, automotive, sporting goods and marine
applications. They c m also be used when hi& strength or chernical stability at high
temperatures. or high strength and durability under severe environmental conditions, are
required. Because weight reduction and durability are critical factors in aircmft industries the
composite materials have been used in many commercial and military aircraft. For instance
boron-fiber-reinforced epoxy skins have been used for F-14 horizontal stabiiizers in 1969.
Other composites applications in military aircraft are s h o w in Table (1.2)[2]. Composites
also have been used in commercial airplanes such as Boeing 727.737.747.756 and also DC-IO
and DC- 1 1.
Table 1.2 Applications of fiber reinforced composites in aircraft
Aircraft Component Material Overd1 weight swing over metal; parts(%)
F-1 1 Under wing fairings Carbon-epoxy 25 F-15 Fin. stabilizer skins Boron-epoxy 25 F- 16 Skins on vertical fui box, fin Carbon-epoxy 23
leading edge F/A- 1 8 Wing skins, horizontal and Carbon-epoxy 35
vertical tailboxes, wing and tail control surface
AV-8B Flaps, horizontal stabilizers, Carbon-epoxy 25 wing s b and sub structure
In the space shunle the total weight reduction with polymer composites was alrnost
1350 Kg per vehicle. In automotive industries polymer composites are being used for exterior

body components such as, hood or door panels. In recent years, because of their unique
properties, fiber reinforced composites have had a significant usage in spomng goods such as
tennis racquets, fishing rods, bicycle frames and snow and water skis.
composites can be fabricated in different ways and key elements for choosing any of
these fabrication methods are cost-effectiveness and rates of production. In recent years.
because of the big market for fiber reinforced polymer composites, especially in automotive
industries, rnany researchers have worked on their production processes optimization. The
major manufacturing methods used in fiber reinforced composites production are. bag
molding, compression rnolding, pultmion, filament winding and resin transfer molding.
Reinforcing fibee are the bones of sûuctural composite materials and should provide
the characteristic mechanical properties of composites. They shouid be stiff and have a good
strength and high modulus. and exhibit tesistance to solvents and high temperatures. Another
important factor for reinforcing fiben is density. Since composites are usuaily used in weight
sensitive applications, low densiry is desirable. Reinforcing fibers can be put into different
categories such as organic polymeric fibee, inorganic filaments and carbon fibers.
1.2.1 Glass Fibers:

Glass fibers are the most widely used inorganic fibee. They are used because of their
incombusibility, corrosion resistance and good thermal and electricai properties. These fibers
are produced by melting a designated composition of glas and drawing the melt out through
holes in a spineret. The production of this type of material in the USA and Western Europe
and Japan during 1987 was 1.4 Mt [4]. Glass fibers have a ngid silica based structure, and are
commonly non-crystalline and isotmpic. Usually a protective coating (size) is applied to their
surface to minimize damage during drawing. The two most important components of the size
are a processing aid and a coupling agent to enhance adhesion between the glass fiber surface
and polymer matrix.
One of the rnost cornmonly used g l a s fibers is E-glass and it consists of CaO(l7.5%).
A1?O3(14.4%), B203(8%), Mg0(4.5%), Si02(54.4%) and aimost 1% of other matends.
Conventional E-glass fiben have a good electrical properties and are made in large quantities
for a wide range of applications and they are relatively inexpensive. An other kind of glass
fiber is S-glas which is characterized by a higher modulus and strength than E-glas (about 85
Gpa as against 75 Gpa for E-glas) and the major components of them are Al2O3(25%). and
Mg0(10%) together with Sioz, but they are much more expensive than E-glass[3.4]. In
addition another type of glass. which is resistant to environmental attacks is. C-glass. Table
1.3 shows general properties of some glass fibers[6].
Table 13 General properties of different grades of glass fiber
Modulus (GPa) 70 86 88
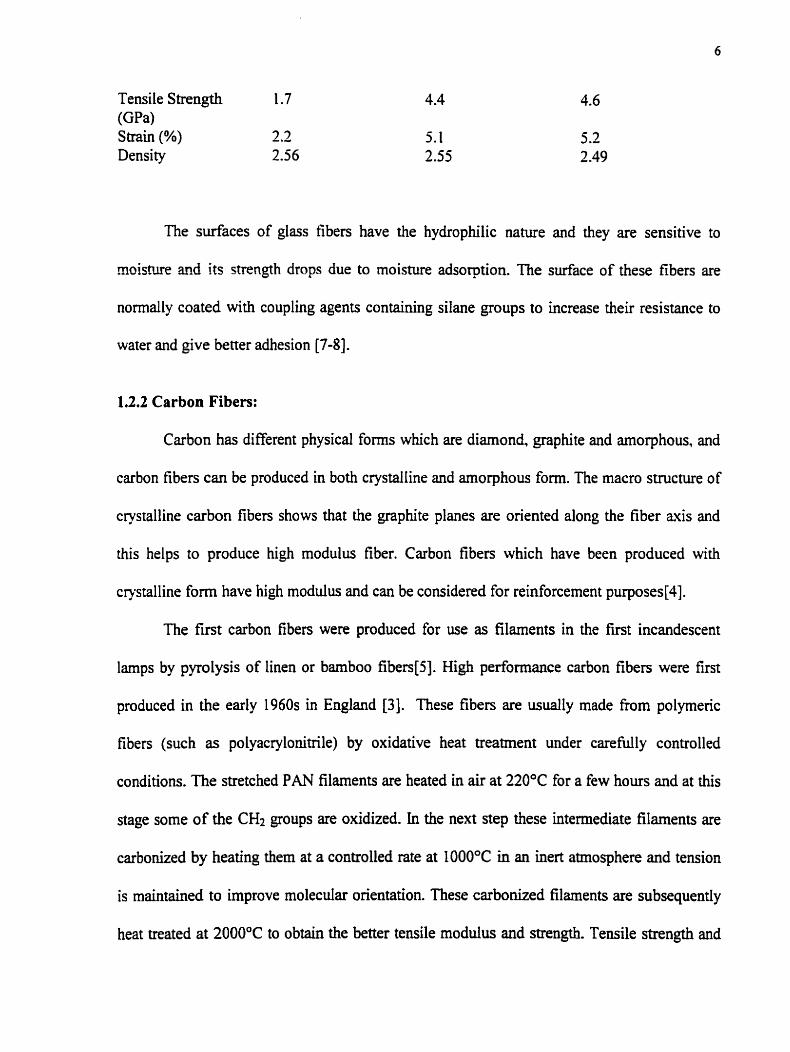
Tende Strength 1.7
Strain (%) 2.3 Density 2.56
The surfaces of g las fibers have the hydrophilic nature and they are sensitive to
nioistue and its strength drops due to moisture adsorption. The surface of these fibers are
normally coated with coupling agents containhg silane groups to increase their resistance to
water and give better adhesion [7-81.
1,2,2 Carbon Fibers:
Carbon has different physical forms which are diamond, graphite and amorphous, and
carbon fibers can be produced in both crystalline and arnorphous form. The macro structure of
crystalline carbon fibers shows that the graphite planes are oriented dong the fiber mis and
this helps to produce high modulus fiber. Carbon fibee which have been produced with
crystalline form have high modulus and cari be considered for reinforcement purposes[4].
The fmt carbon fibers were produced for use as filaments in the first incandescent
lamps by pyrolysis of linen or bamboo fiber@]. Hi& performance carbon fibers were fim
produced in the early 1960s in England [3]. These fibers are usually made fiom polymeric
fi bers (suc h as polyacry lonitnle) by oxidative heat treatment under carefull y controlled
conditions. The stretched PAN filaments are heated in air at 220°C for a few hours and at this
stage some of the CH2 groups are oxidized. In the next sep these intermediate filaments are
carbonized by heating them at a controlled rate at 1000°C in an inert atmosphere and tension
is maintained to improve molecdar orientation. These carbonized filaments are subsequently
heat treated at 2000°C to obtain the better tende modulus and strength. Tensile strength and

tensile moduius are dso affected by the degree of crystallinity. These oxidized carbon fibers
have functional groups such as carboxylics and hydroxyls and ketonic on its surfaces which
promote the adhesion between fiber and resin. The oxidized surface of carbon fibers then can
be coated with an epoxy sizing in order to increase the interface strength. Also, cold Plasma
technology can be used in order to modify the carbon fiber surface to increase the adhesion of
fiber to matrix. [9- 1 11.
The widely used carbon fibea are the high strength carbon fibers. with modulus of 230
GPa and strength 3.5 GPa and a failure strain of 1.5%. Usually for these fibers the higher the
modulus the lower the strength. Carbon fibers have better generd properties than glass fibers
and their price is much higher. Carbon fibers have several properties such as. a low coefficient
of thermal expansion, high thermal and electncd conductivity. Due to low thermal expansion
of carbon fiben. carbon fiber reinforced composites have good dimensionai stability. Table
1.4 shows the properties of different types of carbon fiber[5].
Table 1.1 GeneraI properties of different grades of carbon fiber
Low modulus Medium modulus Hiah modulus
Modulus (GPa) 230 Tensile Strength 3.5 ( G W Strain (%) 1.5 Density 1.76
1.3 PoIymeric Matrix:
It is possible to fhd many naturai polymers such as naniral rubber, wool and silk. The
unique property of polymers was the reason behind production of v the t i c polymers on a

large scale. A polymer is a large molecule containing one or more repeating units, joined
together by covalent bonds. The length of polymer chah is specified by degree of
polymerization which is the number of repeat units in the chab [12].
in cornparison with rnetals, polymers are resistant to corrosive environrnents such as
dilute solution of inorganic acids and bases and because of lower density they can be used to
reduce the weight. Also. these materials are easy to shape. Some important factors which
should be considered in resin choice are, toxicity, compatibility with the chosen process, cure
temperature and time, thermal and chernical shrinkage, mechanical properties, environment
resistant, fire. smoke and toxic gas emission and finally cost. Polymers can be divided into
two major groups: therrnoplastics and thermosets.
1.3.1Thermoplastic Polymers:
In thermoplastics polymers each molecules. is linear in structure without any chernical
linking between them and there are just secondary bonds (van der Waals and hydrogen bonds)
between the individual molecules. Interrnolecdar bonds of themioplastics c m be ternporarily
broken by heat and molecules can move and get new positions and. after cooling, the
molecules fieeze in their new positions. This is the reason that thermoplastic polymers can be
recycled and reused and reshaped many times. Some advantages of thermoplastic polymers
over thennosets are unlimited storage M i e at room temperature, short fabrication time, ease of
handling (no tac kiness) and recycleability. Examples of thermo plastic polyrners are nylons,
polyolefms. polycarbonates. and polyetheretherketone.
13.2 Thermosetting Resins:
These resins are those that change irreversibly under the influence of heat fkom a
shapeable and soluble material into a solid which are infusible and insoluble. The reason is

related to the formation of covalently crosslinked, thermally stable three-dimensional network
and short molecular ch& between molecules which inhibit molecular movement after they
are cured. Hence. once this cross-linked structure is formed the polymer cannot be reshaped by
heat. Unlike thermoplastics, which are revenibly meit-processable, thermoset resins are
irreversibly formed from low molecular-weight liquid with low viscosity. The initial low
viscosity enables higher concentrations of both fiben and fillen to be incorporated into
thermosetting matrices. After reinforcement with fibers the resin is cured to give three-
dimensional cross-linked polymeric maûix of basically high molecular weight. Some
advantages of this network are greater dimensional stability, less flow under stress. higher
chernical resistance and Iower thermal expansion coefficient. Some of the important
thermosetting resins are epoxy, polyimides, polyurethanes and formaldehyde based resins.
1.3.2.1 Epoxy Resins:
Epoxies were intmduced. independently, by Ciba AG in1943 and the Devoe and
Reynolds Co in 1950[13].This polymer fbndamentally defuies as thermosetting resins in
which the cross-linking is denved from reaction of epoxy groups (the epoxy group is aiso
called the epoxide).
Figure 1-1 Epoxy group

Presently up to 90% of commercial epoxy resins are made by the reaction of
bisphenol A and epichlorhydrin [13] and the chemical structure of this resin can be seen in
Figure 1 .Z.
Figure 1-2 Chernical structure of epoxy resin
Epoxies can be cured by various kinds of materials. such as polyamines, polyamides,
acids. polysulfides and urea and phenol formaldehyde through coupling or condensation
reactions[ 121. In general amine is one the most practical curing agents for initiating the epoxy
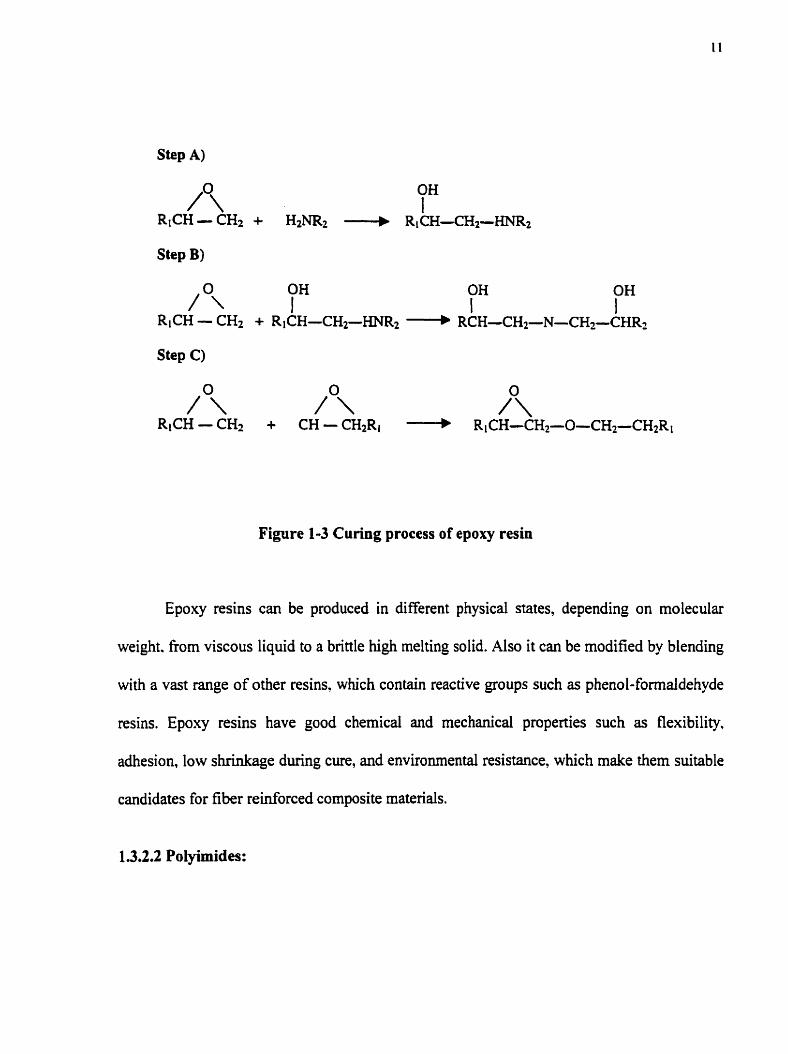
chain reaction and this reaction for a primary amine (RN&) is shown in Figure 1-3.
After the curing process the formation of polar hydroxyl groups promote the adhesion
between matrix and fiber in composite materials and, in addition, these polar groups are able
to form hydrogen bonding which increases the moisture absorption by cured epoxies. Epoxy
resins can be produced in different physical states, depending on its molecular weight. from
viscous liquid to a brittle high melting solid. AIso it can be modified by blending with a range
of other resins, which contain reactive groups such as phenol-formaldehyde resins. Epoxy
resins have good chemical and mechanical properties such as flexibility, adhesion, low
shrinkage during cure, and environmental resistance, which make them suitable candidates for
fiber r e i h c e d composite matenals.
Step B)
Step C)
Figure 1 3 Curing process of epoxy resin
Epoxy resins c m be produced in different physical States, depending on molecular
weight. fiorn viscous liquid to a brittle high melting solid. Also it c m be modified by blending
with a vast range of other resins. which contain reactive groups such as phenol-formaldehyde
resins. Epoxy resins have good chemicai and mechanical properties such as flexibility,
adhesion, low shrinkage during cure, and environmental resistance, which make them suitable
candidates for fiber reinforced composite rnatenals.

Basically any polymen with the cyclic Mide groups can be known as members of the
polyimides family and can be tailor-made to suite specific applications.
Figure 1-4 Imide goup
Polyimide resins cm be produced by the reaction of a primary amine with an
anhydride. This reaction produces an amide and a vicinal carboxyl group, which. on M e r
reaction. converts to an imide and water. This reaction is s h o w in Figurel-5 [Ml. Polyimides
can be linear or three-dimensional and for this reason, both thennoplastic and thermosetting
polyimides exist. ïhermosetting polyimides are produced by addition polymerization and
thermoplastics are produced by condensation polymerization.
The outstanding thermal stability and relative ease of fabrication make the polyimide a
viable engineering material especially as a matrix for advanced composites. Compared with
conventional epoxy resins, polyimides exhibit similar mechanical properties but have a much
better temperature performance. Polyimide resins are also notable for their very good fire,
smoke and toxicity properties. Major applications of these resins are in manufacturing of fiber
reinforced composites and the varnish and adhesive industries [15-161.

Figure 1.5 Reaction of amine with an anhydride
1.4 Interfaces in Composite Materials:
The mechanical performance of fiber-reinforced composites is dependent on strength
and modulus of the fibers as well as strength and chernical stability of the rnatnx. AIthough
these factors are important the effectiveness of the bond between matrix and fiber is essential.
In other words. the overall performance of the composite materials depends on the strong
interface in these materials. The following figure gives a basic idea of the interface in
composite materials.
Interface
Fiber Interphase
Figure 1-6 Interface in composite materiais

h the modem theory of composite materials the interphase is defined as a 3-
dimensional interfacial region between the fiber and matnx whose properties are similar to
(but distinguishably different fiom) the bulk properties [17] and also the interface is defined as
a Zdimensionai border between the fiber and the interphase. The weak interface between
matrk and reinforcement causes tesistance to crack propagation through a brinle matrix. and
consequently. toughening [18]. I t has been said that there is an exchange between shear
strength and toughness in polymer composites [19] for instance yielding and soft interphase
increases toughness without loss of shear strength [20]. This is the reason that in fiber
reinforced composite matenais an optimum interphase has been sought.
The fiber critical length is detennined by the interfacial strength and it is important
because the strength and modulus of composites depends on this factor. Normally the
adhesion between fiber and matrix and, also properties of the interphase are pvemed by
different types of bonding between the fiber and matrix and, as shown in Figure 1.7 each of
the following factors contributes to the adhesion between fiber and matrix [2 1-22].
a) Mechanicd interlocking because of surface morphology (surface roughness and
micropomsity)
b) Chernical bonding due to functional groups present on reinforcement fiber (covalent
bonding and acid-base interactions)
C) Physico-chernical interactions between the matrix and fiber (dispersive forces and dipole
dipole interactions)

Figure 1-7 The Three components contributes to interphase adhesion
ïhe effect and influence of interphases in composite properties is important but to
undentand their composition. structure and properties m e r studies are needed [23].
1.4.1 Mechanical Methods for Interface Measurement:
As discussed in the previous section the mechanical properties of reinforcing fiber, the
interface and adhesion between matrix and the fiber surface mostly govem composite
materials [24]. It is important to measure the interface capacity to transfer the stresses from
polymenc m a t h to reinforcement fiber and it can be accomplished by specific mechanical
tests on real or mode1 composites. Two micromechanical tests i.e. the hgmentation test and
pull out test have been used for many years, while the microtension test and microcompression
test were introduced relatively recentiy [25]. Among these four tests the microindentation test
is the ody test that c m be applied directly to unidirectional composites [3 11.
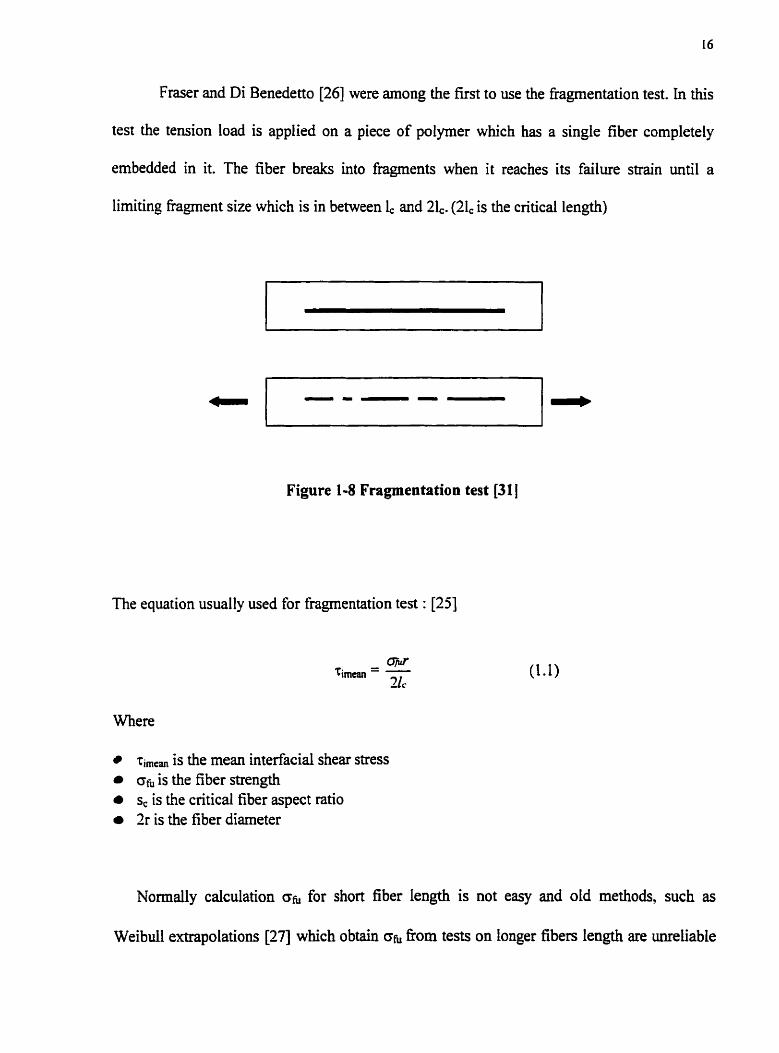
Fraser and Di Benedetto [26] were arnong the first to use the fragmentation test. In this
test the tension load is applied on a piece of polymer which has a single fiber completely
embedded in it. The fiber breaks into fragments when it reaches its failure strain until a
limiting fragment size which is in between 1, and 21,. (21, is the critical length)
Figure 1-8 Fragmentation test [311
The equation usually used for fragmentation test : [25]
Where
q,, is the mean interfacial shear stress is the fiber strength
s, is the critical fiber aspect ratio 2r is the fiber diameter
Normally calculation oh for short fiber length is not easy and old methods, such as
Weibull extrapolations [271 which obtain f?om tests on longer fibers Length are unreliable

[25]. The other popular test method is the pullout test. In this method a single fiber is partly
embedded in a polymer matrix.
Figure 1-9 Pullout test 1311
The load-displacement c u v e obtained during a pull out test is shown in Figure 1-1 0.
FA is the debonding force, and the sudden drop d e r this point is related to sudden
displacement of the fiber after debonding. The wavy part. which can be seen in this curve.
shows the frictional sliding of the fiber after being debonded from the matnx.
Load
D isplacement
Figure 1-10 load-displacement curve
This test is widely used by researchers and it has been done successfully in many cases
[28] and has an advantage compared with the othen because, it is possible to plot the

debonding force as a function of embedded length. Furthemore, basic information, such as
coefficient of fiction, is obtainable from this curve [29].
The microcompression test was proposed by Mandel1 et al [30] and is
presented in Figure 1-1 1. The ioad is applied on a single fiber cornpressively and causes
debonding at the interface and fiber slippage. In the microcompression test the problem is that
because of compression forces there are Poisson expansions which increase the interfacial
pressure. Furthemore this test cannot be used for al1 types of fibea such as Kevlar fiber [XI.
Force
Matrix
Fi ber
Figure 1-1 1 MicroCompression test
The other test method, which was k t proposed by Miller et al [3 11 is the
microtension test. This test is designed for very short embedded lengths of fibers. Figure 1-12
shows that by putthg a drop of polyrneric matrix directiy on the fiber it is possible to perform
the pullout test.

Figure 1-12 Microtension technique
It is important to realize that the experimental data for even one particular case can be
different fiom one test to another. The most important factors for this matter can be described
as various specimen geometry and consequently different failure modes. and difference in the
embedded area even within the limits of one group of testing techniques[24]. It has been
considered that when mean interfacial shear stress is almost equal to matrix shear strength
(t,,) the adhesion is good but this is not completely me. In addition another problem of these
tests is a large stress concentration at the fiber entry point as well as fiber end inside the
polymer. The high fiber stress may cause Poisson's shrinkage away From the matrix, which
decreases the pressure across the interface [32].
Jacques and Favre [33] reported the limitation of fragmentation test and dso they
discussed that the new techniques dose not claim to give tme values. In addition two other
investigation were published which showed the effect of the testing technique on the adhesive
bond strength and they reported variable results for particular cases fiom one test to another.
[34,3 61. Furthemore, because polymers fail in tension rather than shear [3 7-3 81, the results of
these tests are not always reliable.
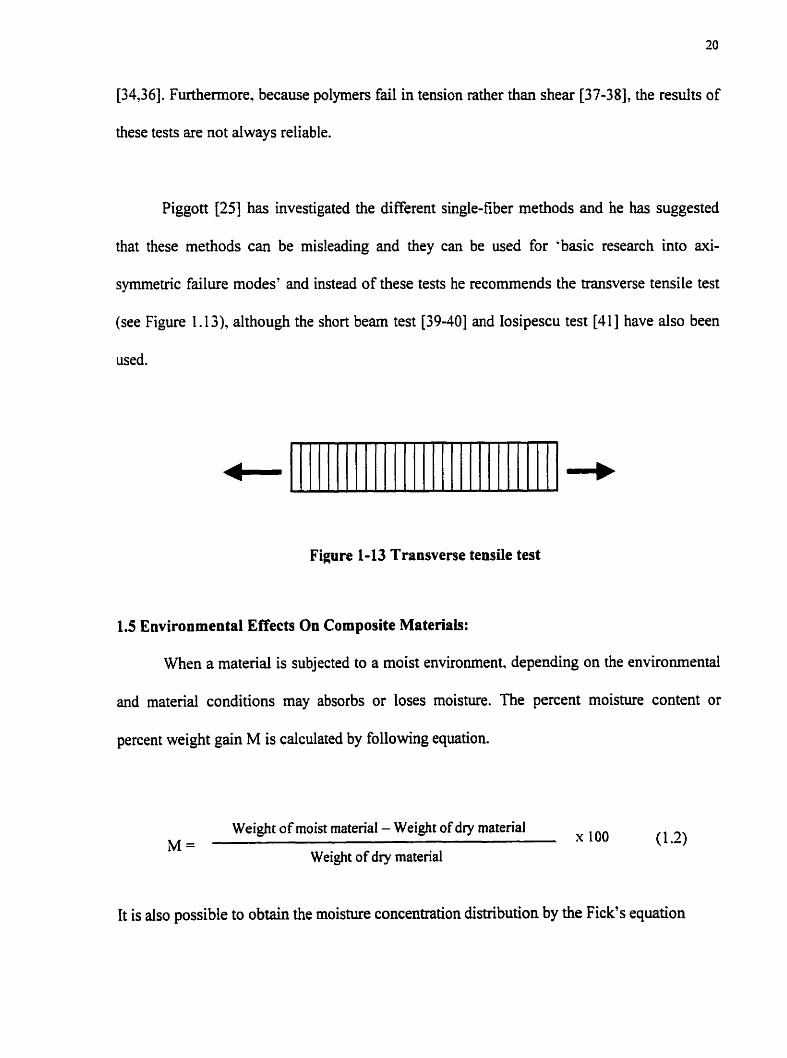
Piggon [25] has investigated the different single-fiber methods and he has suggested
that these methods c m be misleading and they can be used for -basic research into axi-
symmetric failure modes' and instead of these tests he recornmends the transverse tensile test
(see Figure 1-13), although the short beam test [39-401 and Iosipescu test [41] have also been
used.
Figure 1-13 Transverse tensile test
1.5 Environmental Effects On Composite Materiais:
When a material is subjected to a moist environment. depending on the environmental
and material conditions may absorbs or loses moisture. The percent moisture content or
percent weight gain M is calculated by following equation.
Weight of moist material - Weight of dry material x 100 M = (1 2) Weight of dry material
It is also possible to obtain the moisture concentration distribution by the Fick's equation

In the equation (1.3) D, is the mass diffusivity dong the laminate thickness direction. Since
the temperature and the diffusivity considered constant inside the material the problem can be
descnbed by the following equation:
dc d'c - = - at ax2
The final approximation of the equation (1.4) was given by Springer [42].
Where. M is the percent moisture content Mi is the initial percent moisture content Mm is the maximum percent moisture content D, is the diffiusivity h is the sample thickness
As it shown in Figure 1-14 the diffusivity ( D . ) can be obtained from the initial dope of
rnoisnire absorption ( Mm ) venus &.

Moisture Content (%)
Square root of time
Figure (1.14) Iiiustration of rnoisture content versus square root of time plot (421
Today fiber reinforced composite materials have wide applications in major industries
such as the aerospace. marine and transportation industries. Because of these uses the
performance of composite matends in hostile environrnents is very important. For instance. in
the aerospace industries. the loss of mechanicd properties. due to rnoisture absorption through
the service penod for composite materiais, is a matter of concem.
The physical and mechanical properties of polyrner composites may change under
hostile environment because water absorption, diffusion of other chemicals. or exposure to
ultraviolet light. may decrease the strength of the some trpes of fibers and consequently
change the overall performance of the composites. It has been reported that the tende strength
of Kevlar 49 fibers may decrease afler moisture absorption. Ako polymer matrices can be
degraded when they are subjected to corrosive envuonment. The molecules of polymers can
be attacked by moisture or other chemicals and even U.V and it initiates the degradation

process of the polymer. Furthemore absorption of moisture or other chernicals may affect the
interfacial bond strength in the polymer composites.
Many researchen have midied the composite properties and their performance after
exposure to corrosive media. A change in temperature and the absorption of moisture in
poljïner composites cm change the perfomyice of these rnateriels and is described as
hygrothermal effects.
It has been shown by Springer et al [4243] that Fick's Law can be applied for water
uptake in unidirectional carbon fiber reinforced epoxy resins subjected to humid
environments. Sometimes water absorption causes plastification of resin as well as swelling.
In the case of muiti layer glass-epoxy reiriforced composites. which are used in boat
manufacturing. water can penetrate in between the layes and blistering may result [Ml. The
intnnsic moisture sensitivity of epoxy mairices resulted fiom the presence of network defects
and fiom the presence of hydroxyl unreacted amines, and other polar groups in their
stmcture[45-461.
Shen and Sp~ger[47-481 investigated the effects of moisture and temperature on the
tensile strength of Thomel 300Ribente 1034 graphite epoxy composites. These properties
were measured at temperatures between 200°C to 386OC and moisture contents between 0%
and 1.5% (Mly saturated). The structures of laminates were 0°, 45' and 90". It was found that
for 90" laminates an increase in temperature from -73°C to 177OC causes 60 to 90 percent
decrease in the tensile strength of the laminates. In addition, for the 90° laminates an increase
in moisture content decreased the tensile strength significantly.
for 90" laminates the elastic moddi decreased significantly
Furthemore they reported that
with an increase in moisture
content as high as 50 to 90 percent. in the case of 0" and 45' there was no effect on elastic
moduli, even for moisture saturated laminates, regardless of temperature in the range of -73°C
to 177OC.
Strait et al 1491 researched the effect of seawater immersion on the impact resistance of
glass fiber-epoxy composites. They used two different types of E-glass fibers (woven and
nonwoven) in rubber toughened epoxy resin, and conventional epoxy resin. The result of this
study shows that total energy absorbed was reduced significantly afker immersion.
Zheng and Morgan [51] studied the change in weight of epoxy resin and carbon
reinforced epoxy resin during immersion in distilled water in various temperwes. They
reported the Tg's of dry sample and wet (2 wt% moisture) resins, which were equilibrated in
72OC water prior to the test, were determined to be 89OC and 62°C respectively. In addition
the swelling of wet resin in 22°C was small. Exposure to rnoisture causes a decrease in glass
transition temperature and consequently ir would lead to reductions in strength and stiffhess of
the matnx[50-5 11. The other factor, which may also change in composite materials (both glass
and carbon) after moisture absorption, is apparent interlaminar shear strength. For
unidirectional carbon-epoxy reinforced laminate with moimire content of 1.2% the
interlaminar shear strength decreased almost 10%. For g l a s fiber reinforced composites
reduction has been reported in interlaminar shear süength (10-50%) as well as the fiexural
strength (28%) after exposure to water[52-541.

Jiming and Lucas [55] investigated the anomalous absorption behavior in graphite-
epoxy composites and they proposed the "crackhass model", in order to descnbe this
behavior. This model explains that increase in water temperature can cause voids, cracks,
surface peeling and dissolution of matrix. Microcracks developed on the surface and inside the
matrix due to the large difference in water-induced swelling between the rnatrix and fiber.
Because of the difference in elasticity and moisture expansion coefficients. stress develops
dong the fiber and matrix interface. After this crack development, material can be lost, most
likely in the f o m of resin particles. As long as the moisnüe absorption is greater than the
material loss. the weight of the samples increased. They also reported at the surface of
composite, a layer of neat epoxy resin exists ( 1 5 ~ ) with no interlockhg by fibers and at
90°C this neat layer peels and dissolve away with tirne. They also mentioned this mechanism
resulting in a decrease of the gros weight of the specimen and when it becomes the
controlling mechanism. an overall weight reduction is dominant.
In the case of using silane coupling agent as a promoter of interface adhesion behiveen
g l a s fibers and epoxy resin matrix it has been reported that these materials can be dissolved in
water and an even higher concentration of silane couplants can increase moisture uptake and
promote leaching[56-57. Soutis and Turkmen [58] reported the effects of moisture and
temperature on the compressive strength of T800/924C carbon fiber epoxy composite system.
They showed that the compressive strength of this system, after conditionhg in a hot-wet
environment, was significantly reduced. This loss is related to the reduction of matrix strength
properties and the weakening of the ply interface.
Little information regarding the hygrothennal efEects on carbon reinforced polyimide
composites has been published yet. Kerr and Haskins [59] investigated the thermal effects on
tensile strength of HT-S17 1 0 graphitelpolyimide unidirec tional and crossplied laminates.
This investigation showed there was no effect on GPI system after 25,000 h of themai aging
at 232' C and 1-atm pressure. Although some decrease in tensile strength was measured after
50.000 h but no matrix degradation was observed.
Sawada et al. [60] investigated the interfaciai adhesion in carbon-polyimide
composites. They found that the interfacial bond strength depends on chernical bonding and
also the surface roughness and active surface area of the fiber determined the interfacial shear
strength.
1.6 Objective of this study:
Because of the excellent performance characteristic of polymeric composites, they
have been used in commercial, military and space applications. The mechanical properties of
these materhls may s u f k afier exposure to hostile environments. The objective of this
investigation was to determine the moishue content of cross-ply laminates as a function of
time after immersion in different temperatures and environments and to study the effect of the
residual stresses on the absorption behavior of these laminates. The other objective of this
study was to investigate the effect of the various environments on the mechanicd properties of
high performance cross-ply polymeric composites such as glass-epoxy. carbon-epoxy and
carbon-polyimide. In addition the effect of the high temperature Fuel on the interfaciai strength
of [90]24 laminates was studied.
2.1 MATERIALS
Three types of unidirectional prepregs h m Hexcel were used in this study. They
were T4S-2 16- 1 O-F584 glass-epoxy prepreg, T7G- 145- l2-F5 84-9 carbon-epoxy prepreg
and T9A-145- 12-F655 carbon-polyimide prepreg.
The grade of epoxy resin used in these prepregs was Hexcel F584-350F curing
epoxy resin. The grade of polyimide was Hexcel F655-Bismaleimide resin with no
condensation by-product such as water molecule after curing. Fiber grades for
reinforcement were S2 glass and Amoco carbon fiben for epoxy matrix and Hercules
carbon fiber for polyimide resin.
The epoxy resin. used in some sarnple preparations for the tensile test was Epon
8 15 by Shell Company and the curing agent was triethylene tetramine (TETA). Also. for
the transverse tensile test specimens preparation room temperature! curable epoxy
adhesive f?om Henkel was used.
The release agent used for laminate fabrication was MS-122DF fkom Miller
Chernical Company.
2.2 SampIe Preparation
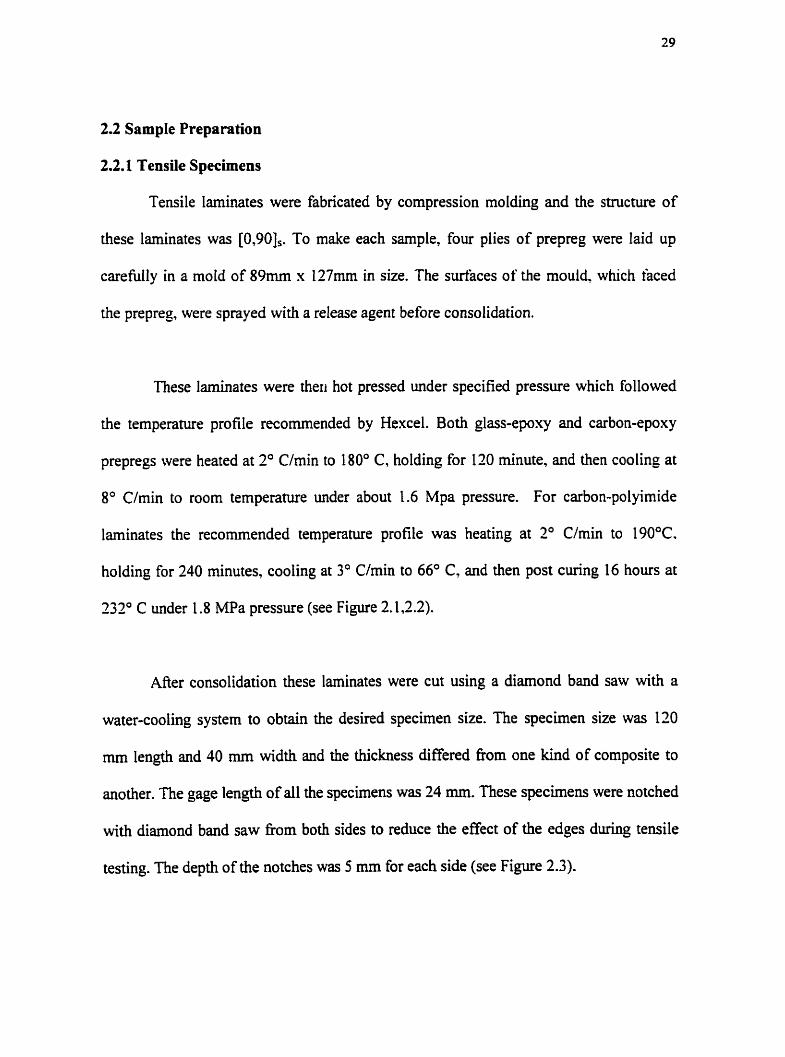
2.2.1 Tensile Specimens
Tensile laminates were fabricated by compression molding and the structure of
these laminates was [0,90],. To make each sample, four plies of prepreg were laid up
carefully in a mold of 89mm x l27mm in size. The surfaces of the mould, which faced
the prepreg, were sprayed with a release agent before consolidation.
These laminates were theri hot pressed under specified pressure which followed
the temperature profile recommended by Hexcel. Both glass-epoxy and carbon-epoxy
prepregs were heated at 2' Clmin to 180' C, holding for 120 minute, and then cooling at
8' Clmin to room temperature under about 1.6 Mpa pressure. For carbon-polyimide
laminates the recornmended temperature profile was heating at 3' Clmin to 190°C.
holding for 240 minutes, cooling at 3' Clmin to 66' C, and then post curing 16 hours at
232' C under 1.8 MPa pressure (see Figure 2.122).
After consolidation these laminates were cut using a diamond band saw with a
water-cooling system to obtain the desired specimen size. The specimen size was 120
mm length and 40 mm width and the thickness differed fiorn one kind of composite to
another. The gage length of al1 the specimens was 24 mm. These specimens were notched
with diarnond band saw fiom both sides to reduce the effect of the edges durhg tensile
testing. The depth of the notches was 5 mm for each side (see Figure 2.3).

Temperature O C
180
R w m Tcmp.
Hold 120 min
Figure 2.1 Curing cycle for carbon and glass epoxy laminates
Temperature O C
Hold 2M min
Cod down 3a Clmin
Room icmp.
Time
Figure 2.2 Curing cycle for carbon-polyimide laminates
12Omm End tab m
L r + I
1 1
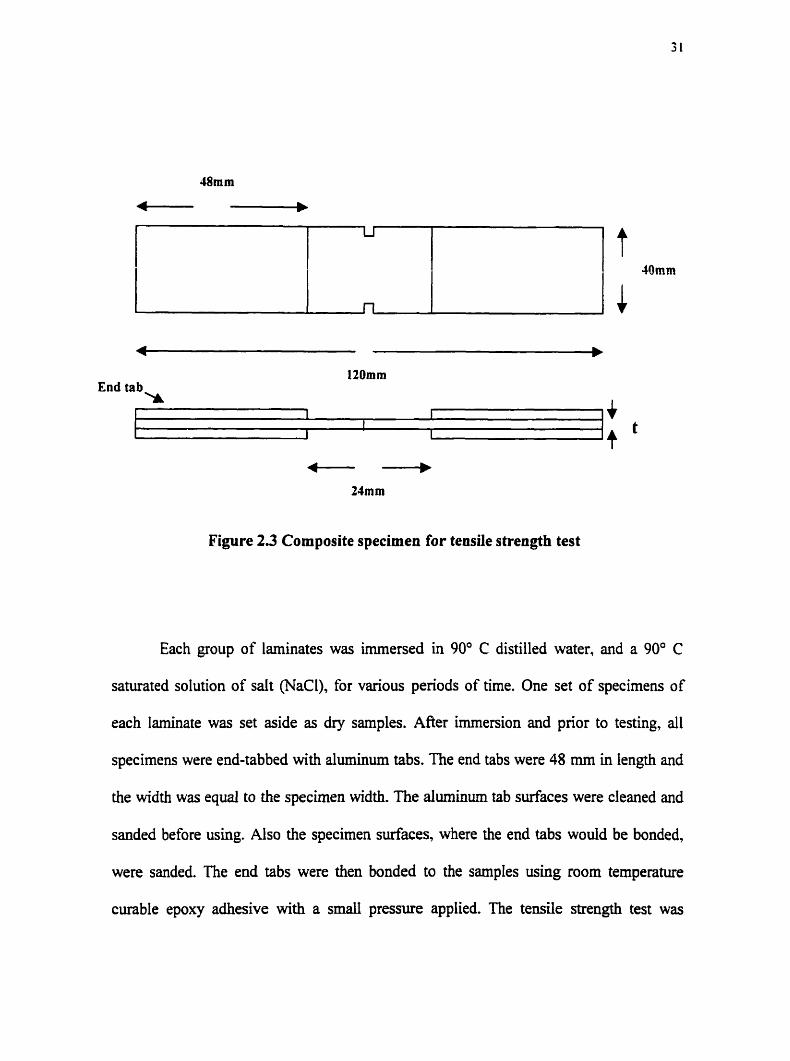
Figure 23 Composite specimen for tende strength test
Each group of laminates was irnmersed in 90' C distilled water, and a 90" C
saturated solution of salt (NaCl), for various periods of time. One set of specimens of
each Iaminate was set aside as dry samples. Mer immersion and pior to testing, al1
specimens were end-tabbed with aluminum tabs. The end tabs
the width was equal to the specimen width. The aluminum tab
were 48 mm in length
surfaces were cleaned
and
and
sanded before using. Also the specimen surfaces, where the end tabs
were sanded. The end tabs were then bonded to the samples using
curable epoxy adhesive with a small pressure appIied. The tende
wodd be bonded,
room temperature
strength test was

performed on the sarnples irnmediately f i e r they were taken out of the conditioning
environments. Pnor to the test the specimens were wiped dry with a piece of tissue paper.
2.2.2 Samples for Moisture Absorption measurement
The dimensions and structure of these specimens was the same as those that were
used for the tensile test. Water immersions at 60" C and 90" C distilled water, and 90" C
saturation solution of salt (NaCl) and distilled water, were perfomed. The distilled water
was obtained from the University distilled water supply and a thermo controller was used
to set the water temperature with minimal fluctuation. To measure the weight of the
specimens a GRAM-ATIC balance type B5 with 200gr maximum load and maximum
four significant figures was used. The specimens were taken out frorn time to time and
after they were wiped dry. they were weighed and changes were recorded.
2.2.3 Samples for transverse tensile test
The sarnples for the transverse test were made fiom glass-epoxy and carbon-
polyimide preperegs. The prepregs were cut and laid in the mold and cured according to
the recommended temperature profile a [90]24 lay up was used. Due to the size of the
mold (89 mm x 127 mm), molded laminates were cut by a diamond dressed cutting
wheel, into coupons of 120 mm length and 20 mm width with the fiber direction normal
to the tensile toad direction. Both edges of these specimens were ground smooth with
silicon carbide grinder paper, using 120, 500 and 800 grit and water jets. In order to
prevent gripping damage of the coupons diiring the test, coupons were glued to 20 mm x
20 mm duminurn using room temperature curable epoxy (Figure 2.4).

2 End tabs
Figure 2.4 Composite specimen for transverse tensile test
Some of these coupons were immersed in 80' C kerosene for various penods of
time (up to 3500 hours) to test for examine the effect of fuel immersion on composites.
The test on these conditioned samples was carried out immediately after they were taken
out of the kerosene. A nurnber of unconditioned coupons were kept aside to measure the
transverse properties of unconditioned composites.
2.2.1 Samples for kerosene absorption
For this purpose the 20 mm x 120 mm coupons of glass-epoxy and carbon-
polyimide laminates with [90]24 structure were immersed in 80" C kerosene. The coupons
were polished and weighed pnor to immersion. To minimize the nsk in this experiment a

condenser was used. This condenser was comected to the tap located under the fume
hood and, to maintain the liquid temperatw at 80' C, a digital temperature controller
was used (see Figure 2.5). These coupons were taken out periodically and weighed with
an analytical balance. Before weighing, the surfaces of the samples were carefully wiped
off. The same apparatus was used for immersion of samples to study the effect of
environment on the transverse pmperties of these composites.
Condenser
\
Water Input - - Water output
Ktmene & Spccimtns
Figure 2.5 IUustration of the kerosene bath
22.5 SEM samples
After the transverse tensile test was performed on composite specimens some of
them. which had a Fractured surface, were chosen for scanning electron microscopy.
These Fractured surfaces were separated fIom the specimens with the diarnond saw then
they gold sputtered for SEM observation.
2.3 Composite Testing
2.3.1 Tensile strength test
Tensile testing was performed on the 100 kN capacity Material Testing System
(MTS). For the maximum load a range of 10 to 50 kN was selected for diflerent types of
composites and the cross head speed was 2mmlmin. The information was recorded by an
MTS 43 1 X-Y recorder. The clamping procedure was performed carefully to make sure
that the specimen was aligned with the Ioading axis.
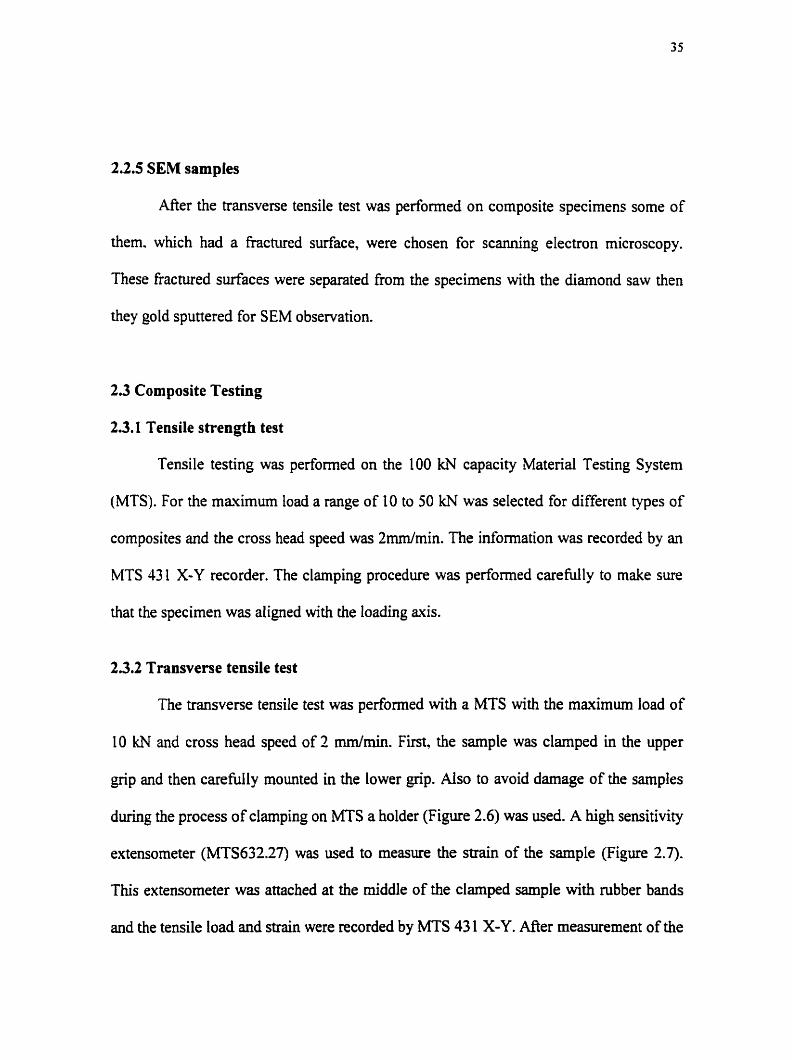
2.3.2 Transverse tensile test
The transverse tensile test was performed with a MTS with the maximum load of
10 khi and cross head speed of 2 mmfmin. Fim, the sample was clamped in the upper
grip and then carefdly mounted in the Lower Np. Also to avoid damage of the samples
during the process of clamping on MTS a holder (Figure 2.6) was used. A high sensitivity
extensorneter (MTS632.27) was used to measure the strain of the sample (Figure 2.7).
This extensorneter was attached at the middle of the clamped sample with rubber bands
and the tensile load and strain were recorded by MTS 43 1 X-Y. M e r measurement of the
transverse a modulus tensile load as applied using stroke control to obtain transverse
tensile strength. The samples which used for this experiment had [90Iz4 structure.
80mm lmm lmm
Imm
Figure 2.6 The outer clamp for the transverse test fipecimens
Figure 2.7 MTS632.27 Extemorneter

2.4 Samples for Mage analysis
In order to prepare the samples for image analysis, sections fiom molded
composite coupons were cut using diarnond saw. Then these pieces were embedded in a
block of epoxy resin premixed with the hardener (TETA 10:1.2 w.t). The whole piece
was put in the oven for two hours at 80°C. After curing, the specirnen was wet ground
with emary cloth, using 120, 500, 800 and then 1200 grit. The finest polishing was
performed with 0.3 pm dumina powder. Pictures of the specimens were captured under
an Olyrnpus Iight microscope with a video camera attached to a Machintosh 650
cornputer (Figure 2.8).
Figure 2.8 Illustration of the image analysis systern

3. EXPEIUMENTAL RESULTS:
3.1 Moisture absorption:
Weight-gain was plotted versus the square root of time for al1 the samples in the
various environments and temperatures in order to Uivestigate the absorption behavior of
the specimens. For glass-epoxy composites, moisnire absorption in 60°C and 90°C
distilled water are show by Figures 3.1 and 3.2. For each environment three difEerent
samples were used with the [0/90], structure. In the case of 60°C distilled water &er an
initial linear gain and about 1200 h o u afier immersion these samples reached their
saturation state with maximum moisture content of between about 0.98%-1.15%.
For glass-epoxy laminates irnmersed in 90°C distilled water. after about 300
hours the water content reached its maximum and after this point a reduction in mass was
observed. The mass gain regressed to 0% &er about 3600 hours immersion. Figure 3.3
shows that for glass-epoxy laminate immersed in 90°C saturated solution of salt (NaCI)
and distilled water the moisture uptake was very fast. Aiso the moisture uptake for these
sarnples was more scattered than that for the samples irnrnersed in 90°C distilled water.
After dmost 600 hours of immersion, these samples showed mass loss and no M e r
weight gain was observed.
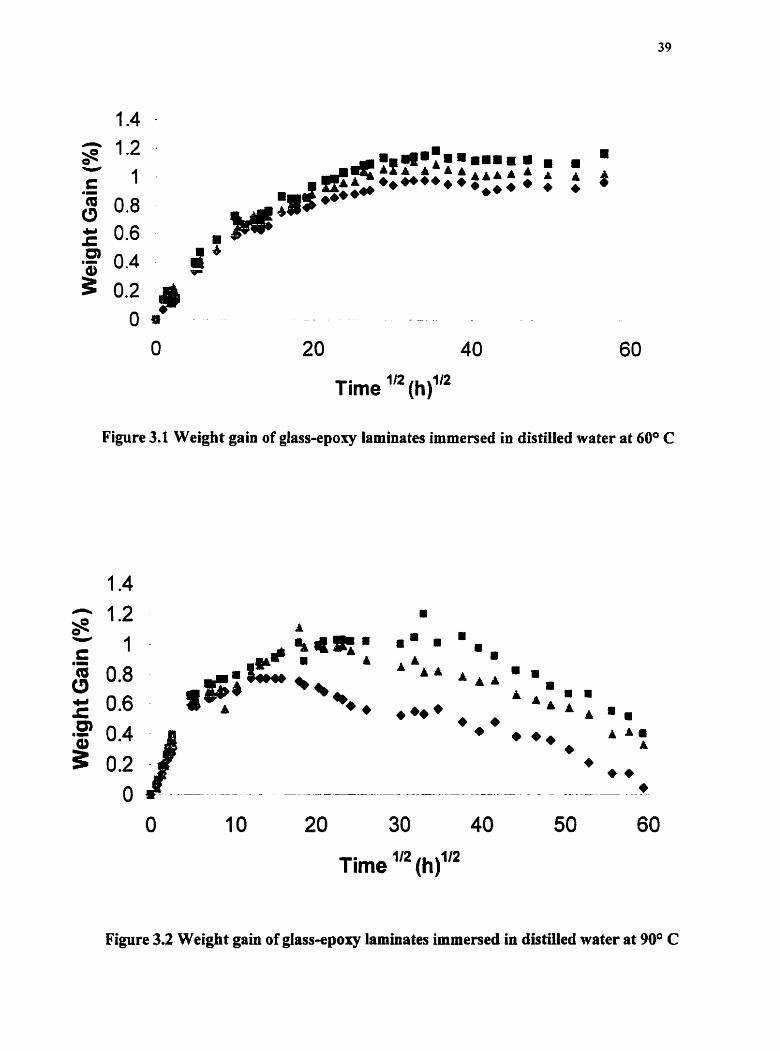
Figure 3.1 Weigbt gain of glass-epo.xy laminates immersed in distilled water at 60° C
Time '" (hfM
Figure 3.2 Weight gain of glass-epoxy laminates imrnersed in distilied water at 90° C

Time Il2 (hf2
Figure 3.3 Weight gain of glass-epoxy laminates immersed in saturated solution of salt (NaCl) and distilted water at 90° C
In the case of carbon-epoxy in 60°C distilled water, as shown in Figure 3.4. a
sharp linear increase in moisnite absorption was observed and after that the mass
increased linearly up to 3600 hours, when the measurement was stopped. For the same
composite in 90°C distilled water (Fig 3 . 9 , two samples were imrnersed. For the both
samples saturation was reached after 900 hours and the moisture content at saturation was
between about 1.12% -1.46%. Weight gain in 90°C saturated solution of sait (NaCl) and
distilled water was not as uniform as those samples which were imrnersed in 90°C
distilled water. Also the maximum gain of samples were much Iower than those samples
immersed in 90°C distilled water (Figure 3.6).
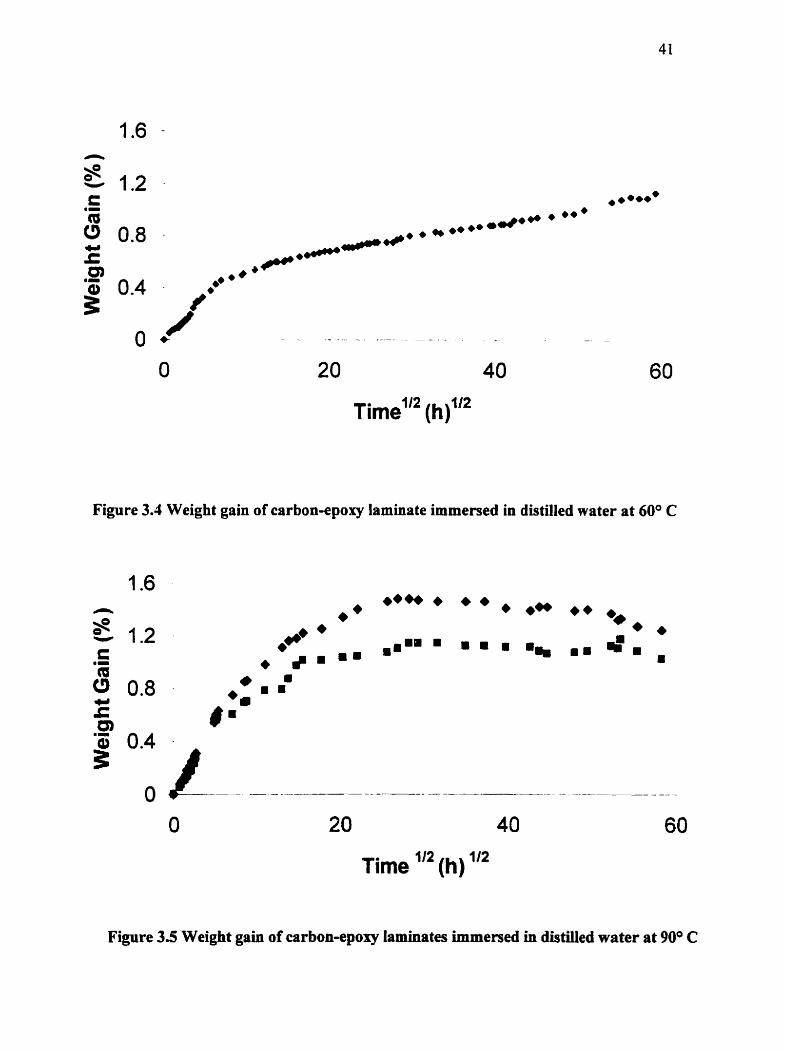
Figure 3.1 Weight gain of carbon-epoxy laminate immersed in distilled water at 60° C
20 40
Time '" (h) '12
Figure 3.5 Weight gain of carbon-epoxy laminates immersed in distüled water at 90° C

Time Il2 (h)'12
Figure 3.6 Weight gain of carbon-epoxy laminates immersed in saturated solution of salt (NaCl) and distiiied water at 90° C
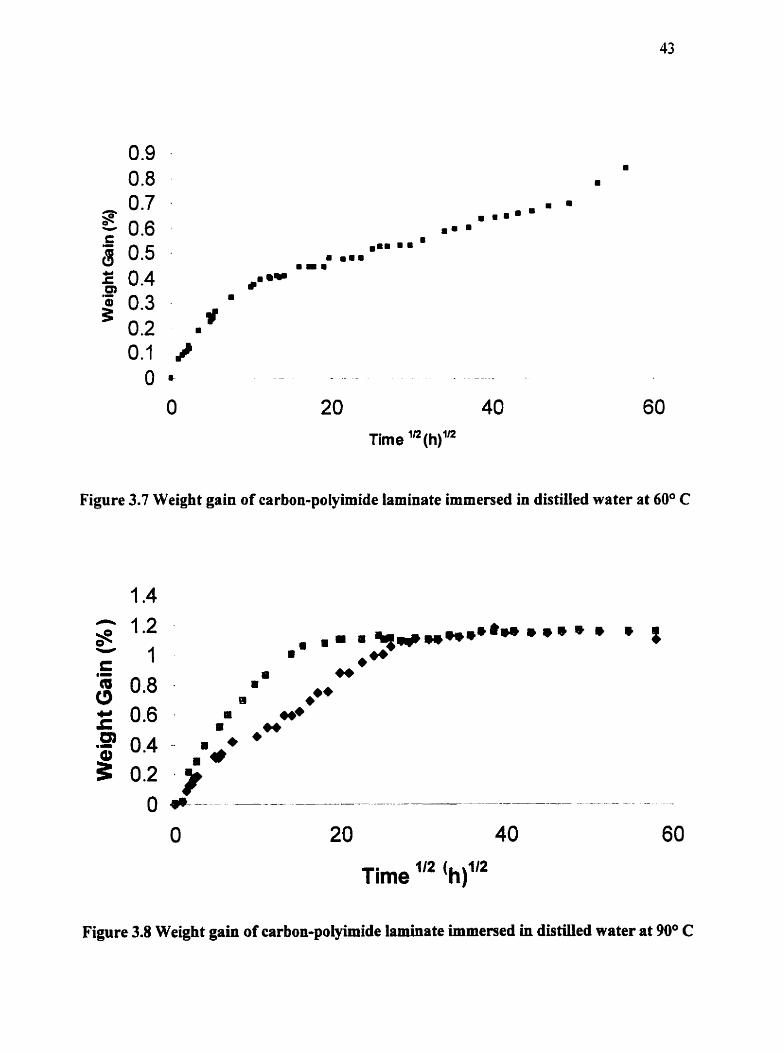
Carbon-Polyimide larninate in 60°C distilled water did not reach its saturated state
even after 3500 hours (Figure3.7). This plot shows two different linear regions one with
the sharp slope up to about 70 hours and after that it increased with a smooth slope. and
after about 3100 hours the moisture content reached about 0.85%. Carbon-polyimide
laminates in 90°C distilled water reached their saturated state after a linear increasing
region and about 850 hours of immersion, and the moisture content at equilibrium was
about 1.09% (see Figure 3.8).
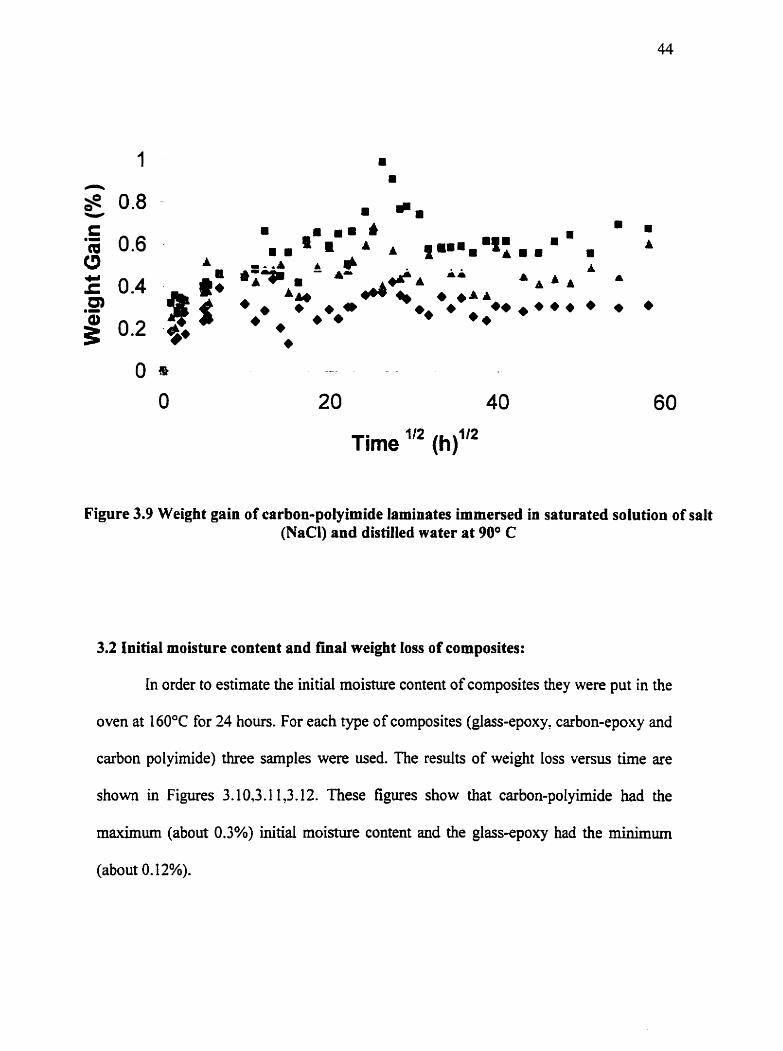
For 90°C saturated solution of salt (NaCl) and distilled water the moishue
absorption plot vernis square root of time showed much more deviation nom one sample
to another. In this case the maximum rnoisture content for the samples are less than those
which were immersed in 90°C distilled water (Figure 3.10).
20 40
Time '12 (h)lR
Figure 3.7 Weight gain of carbon-polyimide laminate immersed in distilled water at 60° C
Figure 3.8 Weight gain of carbon-pomide laminate immersed in distilled water at 90° C
Time "* (h)In
Figure 3.9 Weight gain of carbon-polyirnide laminates immened in saturated solution of salt (NaCI) and distilled water at 90° C
3.2 initial moisture content and fmal weight loss of composites:
In order to estimate the initial moisture content of composites they were put in the
oven at 160°C for 24 hours. For each type of composites (glass-epoxy. carbon-epoxy and
carbon polyimide) three samples were used. The results of weight loss versus time are
shown in Figures 3.1 O,3.11,3.12. These figures show that carbon-poiyirnide had the
maximum (about 0.3%) initial moisture content and the glass-epoxy had the minimum
(about 0.12%).

Time (h)
Figure 3.10 Weight loss for glass-epoxy composites dried out ai 160° C
Time (h)
Figure 3.11 Weight loss for carbon-epory composites dned out at 160° C
Time (h)
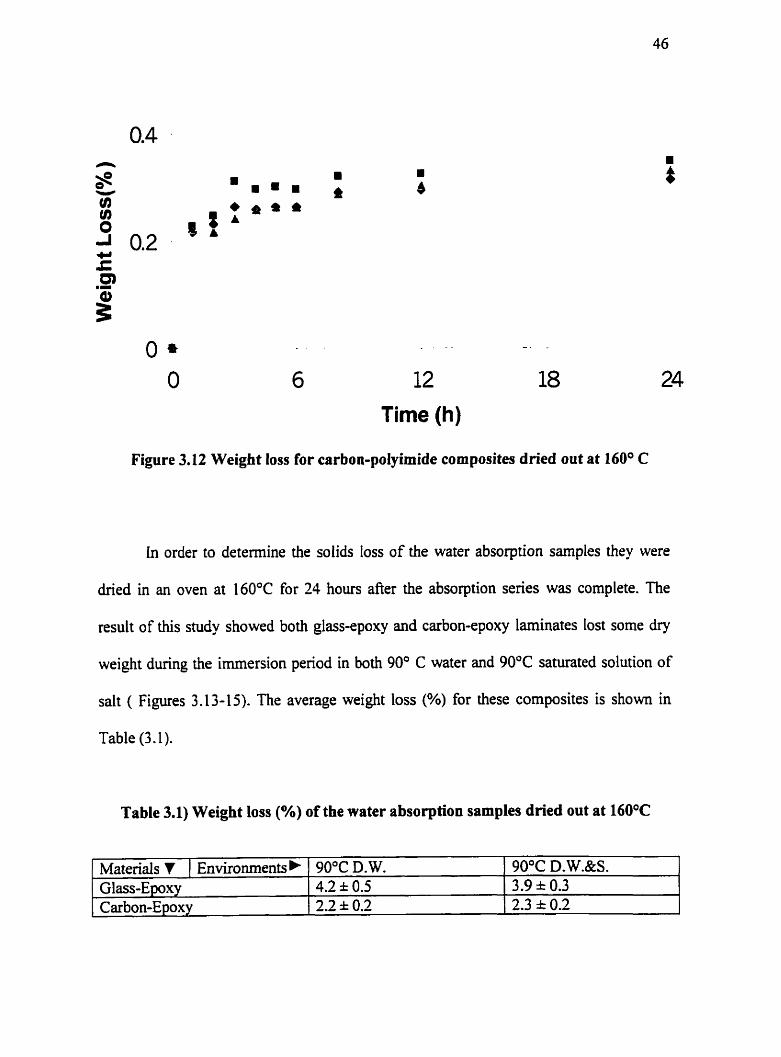
Figure 3.12 Weight loss for carboa-polyimide composites dried out at 160° C
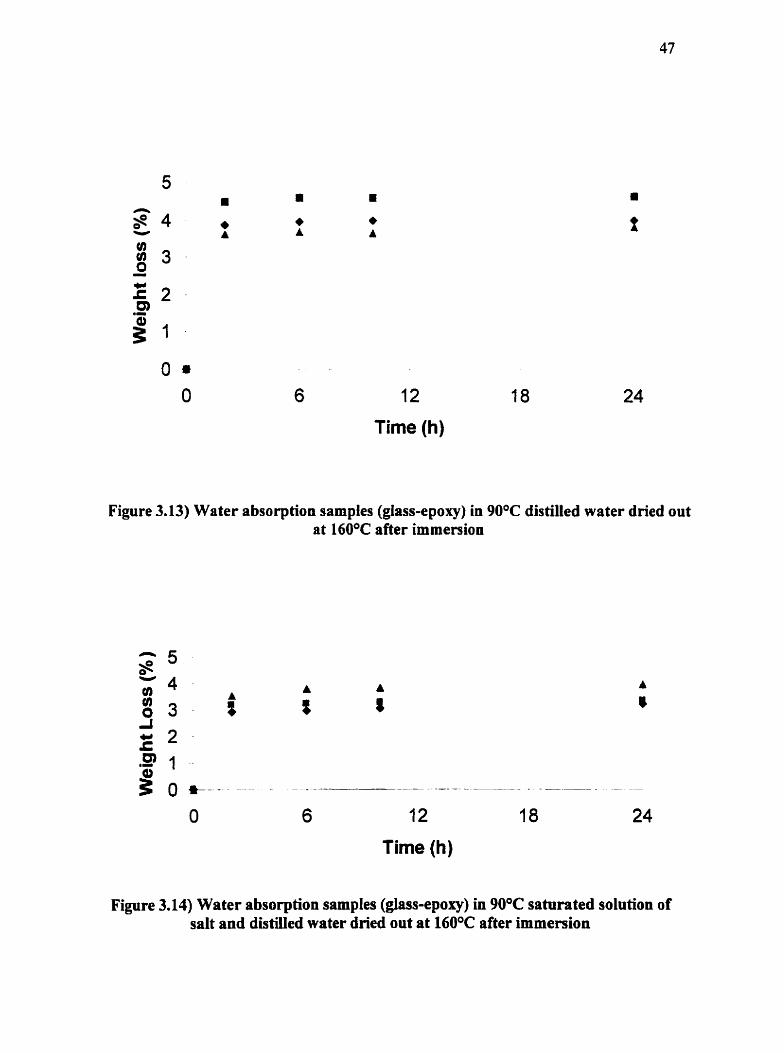
in order to determine the solids loss of the water absorption samples they were
dried in an oven at 160°C for 24 h o m afler the absorption series was complete. The
result of this study showed both glass-epoxy and carbon-epoxy laminates lost some dry
weight during the immersion period in both 90' C water and 90°C saturated solution of
salt ( Figures 3.13-15). The average weight loss (%) for these composites is s h o w in
Table (3.1).
Table 3.1) Weight loss (Oh) of the water absorption samples dried out at 160°C
90°C D.W.&S. 3.9 * 0.3 2.3 * 0.2
Materials 7 ( Environments Glass-Epoxy Carbon-Epoxy
90°C D. W. 4.2 0.5 2.2 * 0.2
12
Time (h)
Figure 3.13) Water absorption sarnples (glass-epoxy) in 90°C distilled water dried out at 160°C after immersion
Figure 3.14) Water absorption samples (glass-epory) in 90°C satorated solution of salt and distilled water dried out at 160°C after immersion

. - - - . . - - - - - - - - - -
6 12 18
Time (h)
Figure 3.15) Water absorption samples (carbon-epoxy) in 90°C distilled water dried out at 160°C after immersion
- .- . -
6 12 18 24
Time (h)
Figure 3.16) Water absorption samples (carbon-epoxy) in 90°C saturated solution of salt and distilled water dried out at 160°C after immersion

3.3 Kerosene absorption
In Figures 3.1 7-3.18 the kerosene absorption in glass-epoxy and carbon-
polyimide composites [90Il4 is ploaed versus square root of t h e . Figure 3.17 shows that
glass-epoxy laminates in this test lost weight. Up to about 400 hours. weight loss was
observed and the weight loss reached about 0.4%. From this point on up to about 700
hours the weight of the larninate was almost constant. Above this point a slight increase
in the weight of samples was observed. Absorption of kerosene in carbon-polyimide
composites showed the same trend as that observed for glas-epoxy laminates. In this
case maximum loss was observed afler about 500 hours and the larninate lost about 0.3%
of its weight. AAer this point up to 1600 hours no significant change in the laminate
weight was observed.
~ime"* (h) '" Figure 3.17 Absorption in 80°C kerosene for glass-epoxy composites

~irnel" (h) Il2
Figure 3.18 Absorption in 80°C kerosene for carbon-polyimide~cornposites
3.4 Effects of aqueous solution on tensile strength of cross-ply composites:
The cross-ply composites immersed in 90°C water and 90°C saturated salt
solution were tensile tested. Figure 3.19 shows the effect of the hot water conditioning on
the notched tensile strength of these composites. The strength of cross-ply glass-epoxy
composites decreased by about 65% after 7000 hours immersion. These composites lost a
significant amount of strength after a short period of t h e . Fig 3.20 shows that the tensile
strength of the composites immersed in sait solution decreased by about 70% afler 7000
hours. Most of the Ioss occurred during the first 1000 hours immersion t h e .

4000 6000
Time (h)
Figure 3.19 Effect of the 90°C distilled water on the tensile strength of glass-epoxy composites
O - - - - - _ - _ - _ - - . _ -_II_ _ --
O 2000 4000 6000 8000
Time (h)
Figure 3.20 Effect of the 90°C saturated solution of salt and water on the tensile strength of glass-epoxy composites

Figures 3.21 and 3.22 show the effect of aging in 90°C distilled water and 90°C
saturated solution of sait (NaCl) and distilled water, on the tensile strength of cross-ply
carbon-epoxy composites with the structure of [0,90],. The tensile strength of carbon-
epoxy composites decreased by about 22% afler 7000 hours of immersion in 90°C
distilled water. The tensiie strength of carbon-epoxy composites immened in 9OÙC
saturated solution of salt (NaCI) and water decreased in a similm way.
0 - - - - . -- - - - -- - - - ------. - -- - - -, - - - - - ---
O 2000 4000 6000 8000
Time (h)
Figure 3.21 Effect of 90°C wster immersion on the tensile strength of [0,9û], carbon-epoxy laminates

- - - - -
2000 4000 6000
Time (h)
Figure 3.22 Effect of 90°C immersion in saturated solution of salt (NaCl) and distilled water on the tensile strength of [0,90j, carbon-epouy laminates
Cross-ply carbon-polyimide composites showed good resistance to 90°C hot
water up to 250 houn after this point the tensile strength of these samples decreased.
Figure 3.23 shows a 0.16% loss in strength for carbon-polyimide after 500 h o m
immersion and after this point no M e r loss in tensile strength was observed. The effect
of 90°C saturated solution of salt and water on carbon-polyimide composites was very
similar (see Figure 3.24).

-
4000
Time (h)
Figure 3.23 Effect of 90°C water immersion on the tensile strength of [0,901, carbon- polyimide laminates
Figure 3.24 Effect of 90°C saturated solution of salt and water on the tensile strength of [0,90], carbon-polyimide laminates

3.5 Effect of kerosene on transverse strength of unidirectional composites:
The [90]?4 specimens that had been irnmersed in kerosene were tested in tension
and the typical force displacement curve is illustrated in Figure 3.25. For both glass
reinforced epoxy and carbon reinforced polyimide composites the shapes of the cuves
were similar and the force increased linearly with increasing displacement till a
maximum load was reached. The sarnple then failed and the load dropped sharply to zero.
In the case of carbon-polyimide composites the samples were completely separated into
two pieces after the test, but in the case of glass-epoxy the two halves remained attached
even after a big crack propagated. Immersion in 80°C kerosene did not change the shape
of the force displacement curve.
Figures 3.26 and 3.27 show the efliect of 80°C kerosene on transverse tensiie
strength and transverse moduius of [90]24 glass-epoxy laminates. In this case the
composites showed a loss of about 21% of their strength after 100 hours of immersion.
AAer this point no W e r change was observed up to 3500 hours. The transverse
modulus was not significantly changed even after 3500 hours of immersion. For carbon-
polyimide composites, (Figure 3.28 and Figure 3.29), even after 3500 hours immersion in
80°C kerosene neither of the transverse modulus nor the strength changed.
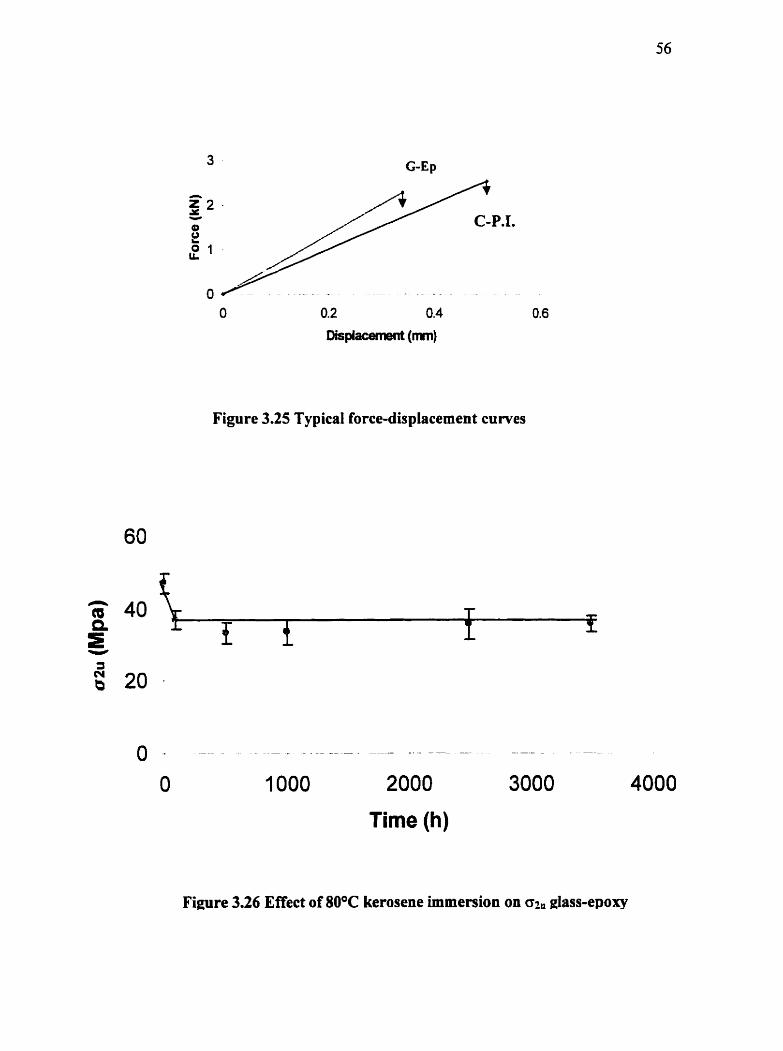
Figure 3.25 Typical force-displacement curves
Time (h)
Figure 3.26 Effect of 80°C kerosene immersion on 0 2 . glass-epoxy

- - --
2000
Time (h)
Figure 3.27 Effect of 80°C kerosene on transverse modulus of Glass-Epoxy
Time (h)
Figure 3.28 Effect of 80°C kerosene immersion on Q, Carbon-Polyimide composites

2000 3000
Time (h)
Figure 3.29 Effect of 80°C kerosene on transverse modulus of Carbon-Polyimide
3.6 SEM Observations of Fracture Surfaces:
A scanning electron microscope was used to take pictures From the fracture
surfaces of immersed glass-epoxy, carbon-epoxy and carbon-polyimide composites in
80°C kerosene and 90°C distilled water and 90°C saturation solution of salt and distilled
water. SEM pictures fiom the hcture d a c e s of [0,90], carbon-epoxy and carbon-
polyimide composites which were immersed in 90°C distilled water and 90°C saturated
solution of salt and water are shown in Figures 3.30-31. In the both cases the interface
seems as strong as it was before immersion but for carbon-epoxy some bare fibers were
O bserved.

Because of brushing effect (where the hcture swface looks like a paint brush) no SEM
pictures h m fracture surface of glass-epoxy has been taken.
SEM pictures from fhcture surfaces of [90In glas-epoxy composites immersed
in 80°C kerosene are shown in Figure 3.32. These pictures show scallops and hackles of
resin around the fibers and also a few bare fibes were exposed. M e r 500 hours
immersion in 80" C kerosene it is possible to see the effect of the elevated temperature
environment on interface between the fibers and matrix and the interface looks almost die
same as the unconditioned composite. Also dong a fiber. some uncovered parts are seen.
In the case of [90Iz4 carbon-polyimide samples immersed in 80°C kerosene showed
strong adhesion b e ~ e e n polymeric matrix and carbon fiber. Fibers were completely
coated by resin and no bare fiber was observed in the pictures even after 3500 houn
immersion in 80°C kerosene (Figure 3.3 3).

Figure 3.30 Fracture surface of [0,90], carbon-epoq composites a) No treatment b)7000 hours immersion in 90°C distilled water C) 7000 hours immersion in
90°C saturated solution of sait and distiiied water
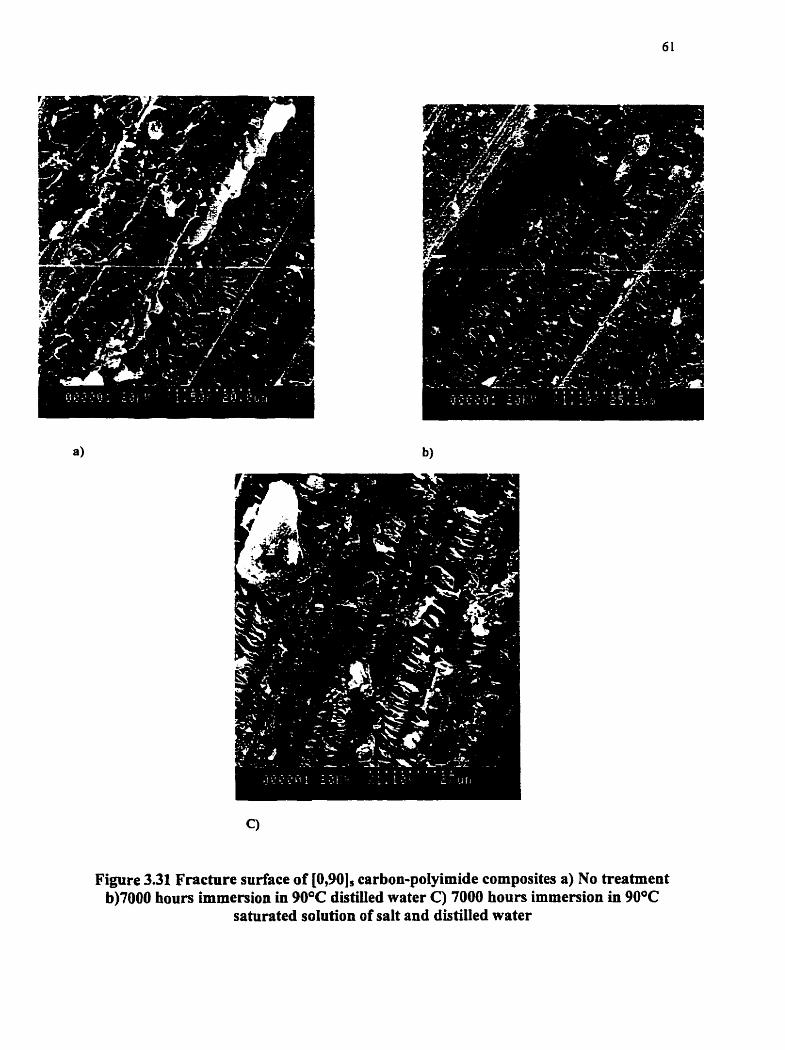
Figure 3.31 Fracture surface of [0,90], carbon-polyirnide composites a) No treatment b)7000 hours immersion in 90°C distilled water C) 7000 hours immersion in 90°C
saturated soIution of salt and distilied water

No treatment 500 boum immersion
2500 hours immersion 3500 hours immersion
Figure 332 Fracture surface of [golu glass-epoxy composites irnmersed in 80°C kerosene

No treatment 500 hours Immersion
2500 hours immersion 3500 hours immersion
Figure 3.33 Fracture surface of [90j2' carbon-poiyimide composites immened in 80°C kerosene

3.7) Light Microscope Observations:
In order to ve f i the quality of molded composites some pictures were taken
with the light microscope. Figures 3-34,35,36 show the cross sections of glass-epoxy,
carbon-epoxy and carbon polyimide. In the case of glas-epoxy and carbon-epoxy it is
possible to see some areas without fiber but no significant voids were observed. For
carbon-polyimide composites the fiber distribution is almost uniform and fibers are
covered with resin.
Figure 334 Cross-sections of Glass-Epoxy composites

Figure 3.35) Cross-sections of Carbon-Epoxy composites

Figure 336 Cross-sections of Carbon-PoIyimide Composites
4. DISCUSSION
4.1) Moisture absorption
In some cases the moisture absorption behavior of materials can be modeled by
Fick's law. Fickian Moisture diaision process is based on the assumption that the
maximum moistue contcnt of laminatc depends uniquely on the matexid mci the
surrounded environment. When the maximum moisture content changes due to other
reasons such as, cracking or delamination, moisture penetration dong the polyrner-fiber
interface or voids in the matrix, it may result in a departure fkom Fickian behavior.
Usually moisture absorption of unidirectional laminates show Fickian behavior.
During this study some of the glass-epoxy, carbon-epoxy and carbon-polyimide
composites with [0,90], lay up showed unusual absorption behavior. This behavior can be
related to residual stresses in the samples due to differentiai thermal shrinkage between
fibers and polymeric matrix.
Throughout cooling of molded composites to the ambient temperature, because of
the significant difference in coefficient of thermal expansion between matrix and fibers.
significant stresses cm be induced inside the composites. The themally induced residuai
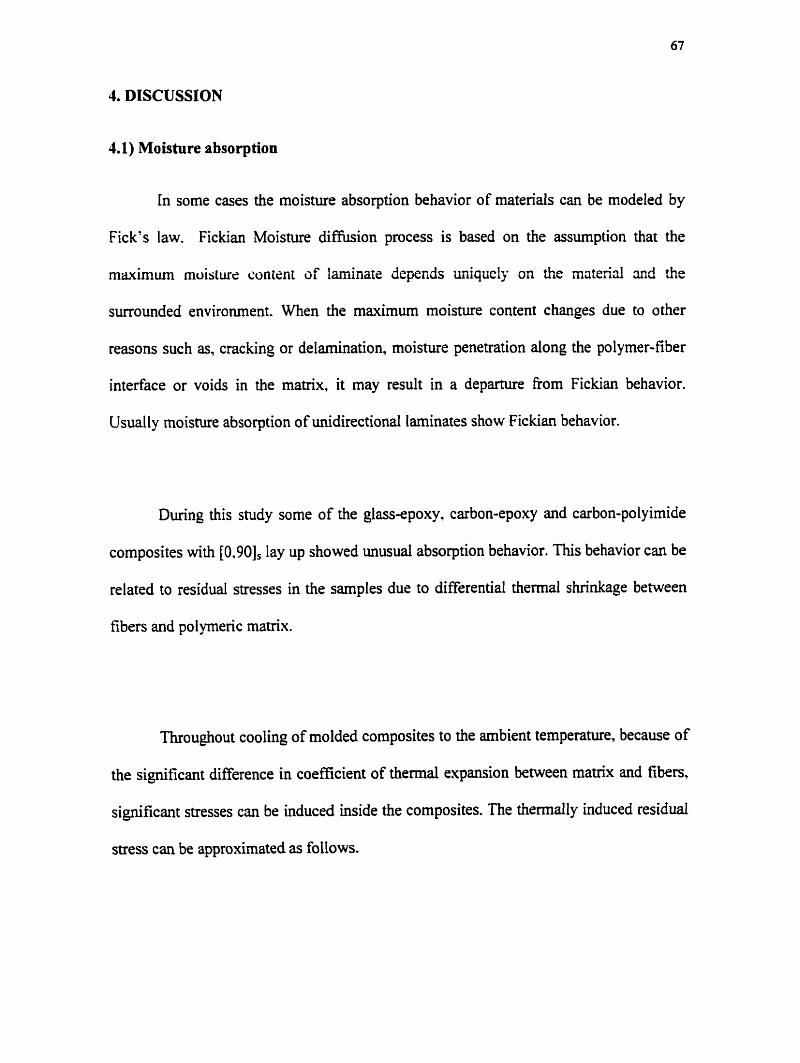
stress can be approximated as follows.
Where
4 cm, is therrnally induced stress 4 E, is the Young's modulus of the polymer 4 am is thermal expansion coefficient of the polymer 4 af is thermal expansion coefficient of the fiber 4 Tg is glass transition temperature of the polymer a Tt is the temperature of hterest
Long term hygrothennal treatment of composites and the absorption of water cm
relieve these residual stresses. Moistue absorption will result in the volume change and
therefore swelling of the ma& but this relation is not afways linear. Equation (4-2) used
to estimate the expansion stress caused by the water.
a,, is expansion stress caused by the water 4 a, is a constant + MA is the mass of the water absorbed
h the composites thermal equilibriurn can be reached in a relatively short time.
(less than one hou) depending on the thickness of material, but water saturation takes a
much longer t h e to reach. Furthemore the water absorption characteristics of
composites can be changed as the residual stresses are relieved. As shown in Figures (4-
1,2,3) The absorption behavior of glass-epoxy, carbon-epoxy and carbon-polyimide
composites with [0,90], structure in 60°C and 90°C distiued water can be divided into
two different categories.
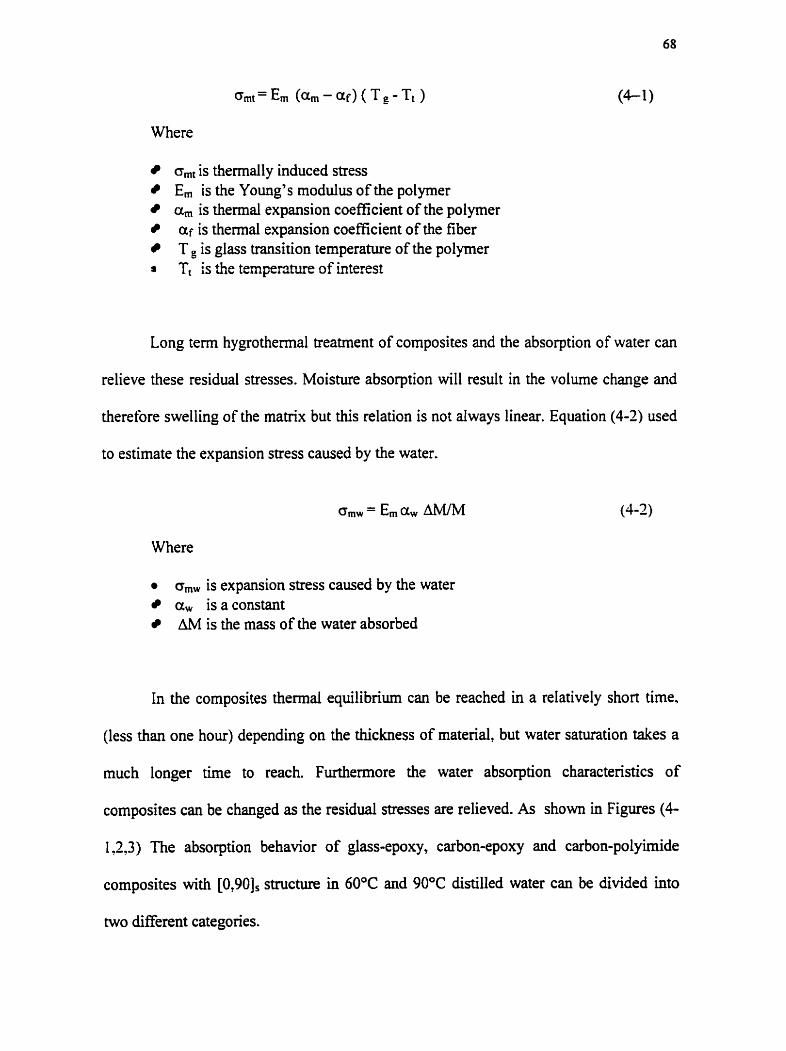
(A)Biomodal (two straîght lines joined by a curve) behavior: The water
absorption of carbon-epoxy and carbon-polyimide in 60aC distilled water (Figure 4-1).
The composites initially absorbed moisture quite quickly then water absorption became
very slow. The transition between these two zones came about 50-60 hours (t,). The
Second stage of this process may takes thousands of hours which indicates that the water
promotes a creep type of process. It is well known that residual snesses cause a tensiie
stress in the polymer dong the fiber direction. Penetration of water into the composites
will reduce the modulus and in result it gives partially stress relief. Relief of these
stresses can slow down the absorption process. However. the remaining stresses dong the
fiber direction is significant (alrnost 0.7 a,J. In this case none of the samples showed
apparent saturation during the length of experirnent.
O 20 40 60
lïme1I2 (h) Il2
Figure 4-1) Absorption Type (A), carbon-epory and carbon-po-ide in 60°C distiiled water

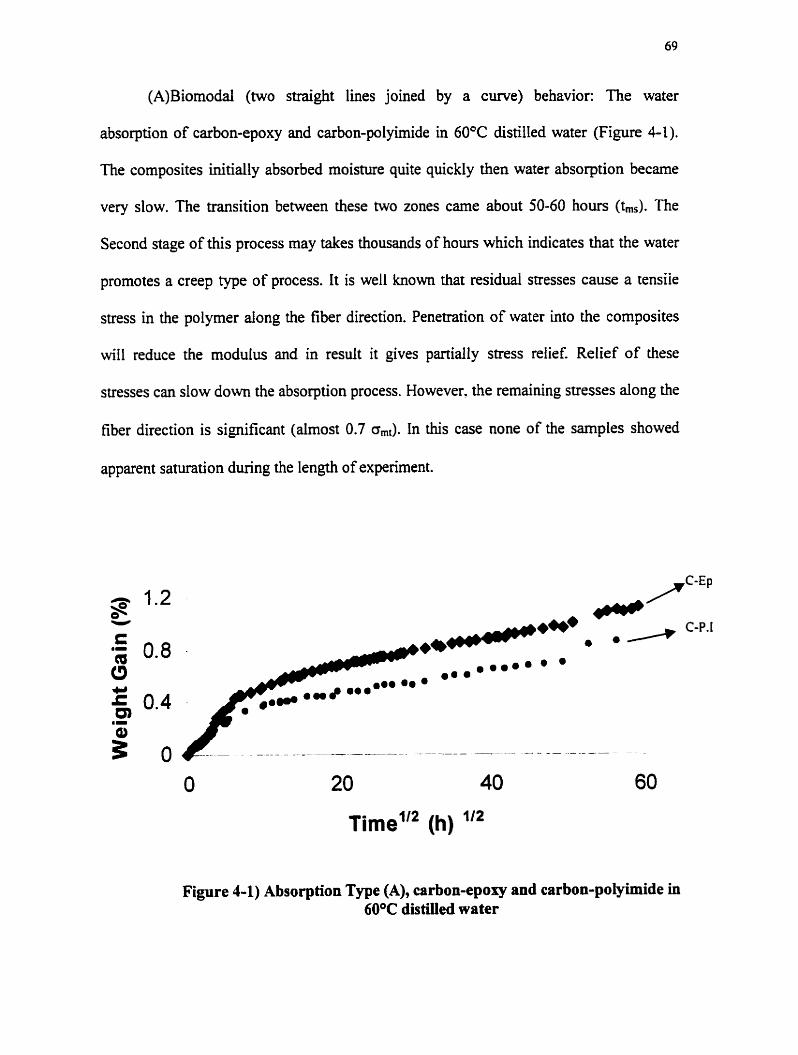
(B)Two distinct dopes initially and then saturation. The water absorption of glass-
epoxy in both 60°C and 90°C distilled water and water absorption of carbon-epoxy and
carbon-polyimide in 90°C distilled water (Figures 4-2,3). in this type samples reached
their saturation state within the length of experiments. This observation showed the
higher rate of water absorption in 90°C distilled water than that in 60°C. The exception of
higher rate in the case of 60°C glass-epoxy might be related to the reaction between the
polyrner and the sizing of the glas fiber.
In the case of carbon-epoxy in 90°C distilled water, the material Ioss is in
agreement with previous observations. The weight loss is due to dissolution of very thin
layer of epoxy resin on the surface of the composite and leaching out of the resin
components and unreacted monomers. The evidence of weight loss in this case is the
result of ckying out the conditioned and unconditioned samples at 160°C. The
unconditioned samples lost 0.1- 0.6 % at the same time 90°C conditioned samples
lost about 2% of their initial weight.
For glass-epoxy composites in 90°C distilled water a greater weight loss was
observed. The weight loss for unconditioned and conditioned samples in 160°C was
about 0.1% and 4% respectively. The reason for the greater weight loss in this case could
be related to the loses of matenal fiom the surface of glass fiben and also presence of
soluble products fiom the silane coupling agent and processing aids which were used in
the production of glas fibers.
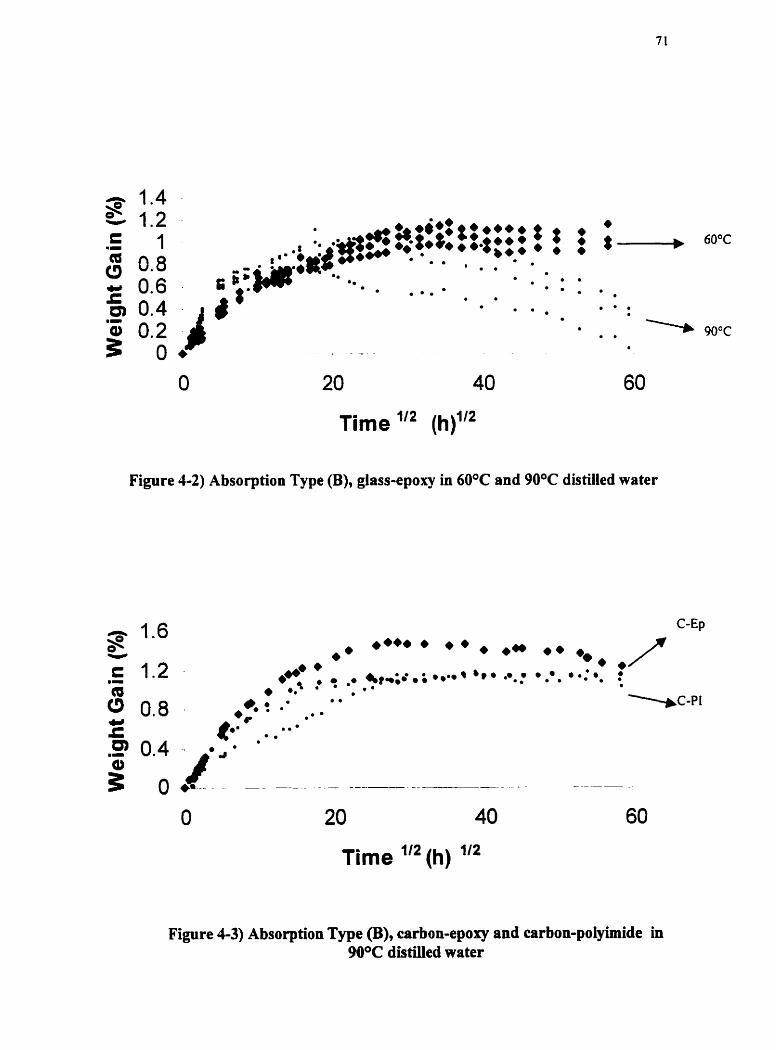
O 20 40 60
Time Il2 (h)'I2
Figure 4-2) Absorption Type (B), glass-epoxy in 60°C and 90°C distilled water
C-E p
O 20 40 60
Time Il2 (h) li2
Figure 4-3) Absorption Type (B), carbon-epoxy and carbon-polyimide in 90°C distilied water

In the case of carbon-polyimide composites because of the higher molding
temperature the residual stresses would be greater than conventional epoxy resin. Nso
gas generation during the molding process c m produce voids inside the samples. The
different densities of carbon-polyimide samples describe the presence of these voids and
in this case the higher the density the lower the arnount of absorbed water.
4.1.1) Variation between water absorption samples
To study the water absorption behavior of Glass-epoxy laminates in 60°C and
90°C water and carbon-epoxy laminates in 90°C water more than one sarnple was
utilized. Figures 4-4.6 show the average weight gain of these larninates versus square root
of time. As it shown in Figure 4-4 in the fÏrst 100 hours after immersion there is no
significant difference in the weight gain percentage of different glass-epoxy sarnples in
60°C water. but as the time goes on the error bars show bigger deviations between the
different samples. The same pattern can be seen for glass-epoxy and carbon-epoxy
larninates immened in 90°C water but by a larger magnitude.
One of the reasons for this variation in water absorption can be related to the
mo!c!ing of sarnples. For instance the glass-epoxy samples which were used in the water
absorption study were not molded at the same tirne, and consequently there rnight be a
difference between their consolidation states and the amount of residud stress in these
sarnples. As mentioned previously a long immersion in hot water and the water
absorption could relieve the residual stresses, but the required t h e for this process c m be

Vary fiom sample to sample. Aiso Figures 44.5 show the variation between the weight
gain percentage of glass-epoxy laminates in 60°C water are smailer than that of the glass-
epoxy samples immersed in 90°C water.
Figure 4 4 ) Average weight gain for the glass-epoxy laminates immersed in 60°C distilled water
Figure 4-5) Average weight gain for the glassspoxy laminates immersed in 90°C distilled water

Figure 46) Average weight gain for the carbon-epoxy laminates immersed in 90°C distilled water
4.12) Water absorption behavior of laminates in this study
Our expenmental results show that for our glas-epoxy. carbon-epoxy and
carbon- polyimides composites immersed in 60°C and 90°C distilled water the absorption
curve can be divided in to the three different regions (Figure 4-7). These regions can be
named as initiation. transition and saturation regions.
Saturation
Initiation O +
Figure 4-7) Initiation, Transition and Saturation regions of moisture absorption curve
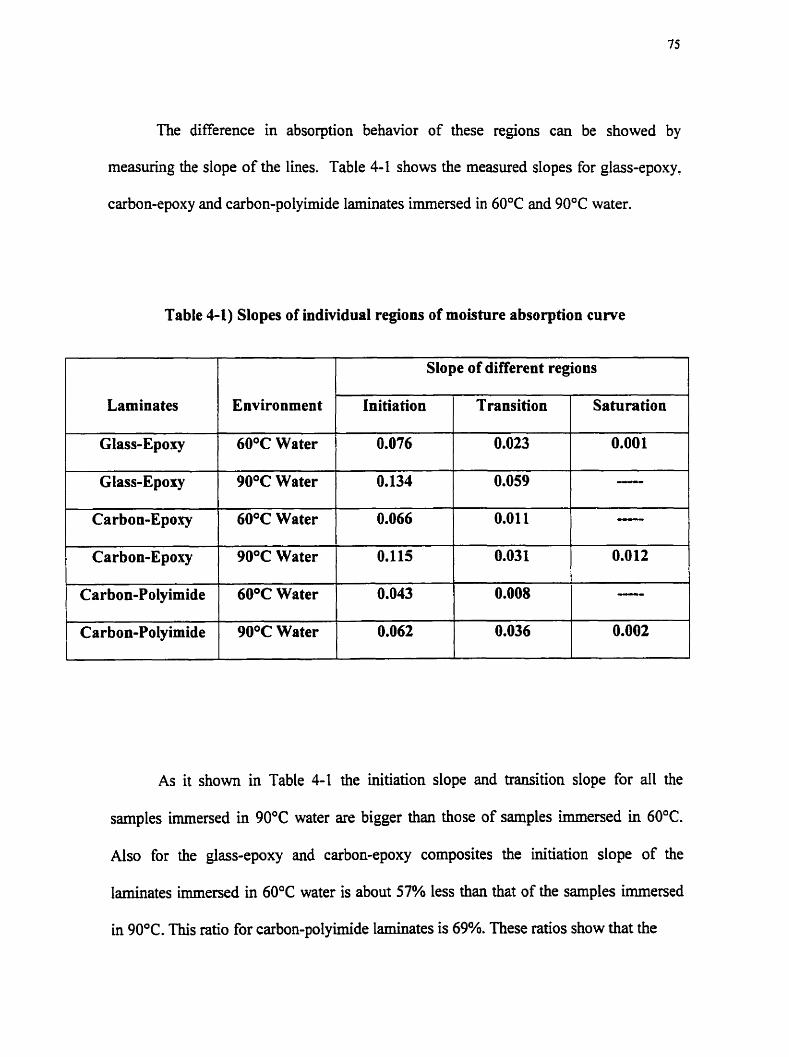
The difference in absorption behavior of these regions cm be showed by
measuring the slope of the lines. Table 4-1 shows the measured dopes for glas-epoxy,
carbon-epoxy and carbon-po lyimide laminates immersed in 60°C and 90" C water.
Table 4-1) Slopes of individual regions of moisture absorption curve
Laminates Environment
Glass-Epoxy
Slo pe of different regions
Glass-Epoxy
Carbon-Epoxy
As it shown in Table 4-1 the initiation slope and transition slope for al1 the
samples immesed in 90°C water an bigger than those of samples immesed in 60°C.
Also for the glass-epoxy and carbon-epoxy composites the initiation slope of the
laminates immersed in 60°C water is about 57% less than that of the samples immersed
in 90°C. This ratio for carbon-polyimide laminates is 69%. These ratios show that the
Initiation
Carbon-Epoxy
Carbon-Polyimide
Carbon-Polyimide
L
90°C Water
60°C Water
Transition
0.023 60°C Water
90°C Water
60°C Water
90°C Water
Saturation
0.00 1 0.076
O. 134
0.066
0.115
0.043
0.062
0.059
0.011
-O
- 0.031
0.008
0.036
0.012
--
0.002
moisture diffusion in epoxy matrix is more sensitive to the water temperature as compare
with the polyirnide polymer. It is noteworthy to mention that the cornparison between the
slopes of different type of laminates is not completely redistic. The reason for this
matter is the difference between the thickness of the absorption samples, which is a
critical parameter, especially at the begiming of the absorption. The average thickness of
glass-epoxy. carbon-epoxy and carbon-polyimide samples for the absorption experiments
was 0.56 (mm). 0.46 (mm) and 0.42 (mm) respectively.
It is important to mention that the glass-epoxy and carbon-epoxy laminates lost
4% and 2% of their initial weight during the immersion in 90°C distilled water
respectively. In the case of glass-epoxy laminates, the higher weight loss can be related to
the presence of the silane coupling agent as an adhesion promoter between glas fibers
and epoxy matix. Silane cm be dissolved in water and can increase moisture uptake and
promote leaching. Hence the real absorption pattern could be modeled based on a
superposition of moisture absorption and solids mass los. As it shown in Figures 4-8A,B
the Fick's law c w e s are obtained by using the linear solids mass loss data. in
combination with the experimental moisture absorption data

~ i m e ' " (h) '"
Experirnental
Theory line
data
~ i m e '" (h) '" 6) Carbon-Epoxy
Figure 4-8) Theory iine and Fick's law based on experimeatal absorption data and solid masfi loss data A) Glass-Epoxy in 90 C water B) Carbon-Epoxy in 90 C water
The moisture diffusion into the laminates which were used in this study can be replicated by an
order 3 curve (Figures 49.12). Table 4-2 shows the empirical curve fiteing equations for the different
types of laminates immersed in 60°C and 90°C distilled water.

Table 4-2) Order 3 Polynomial lines to replicate the absorption of laminates
Laminate Environment Line Equation
1 Glass-E poxy 90°C Water y = 3E-05x3 - 0.00336 + 0.1704~
C
Glass-Epoacy
Carbon-Epoxy 60°C Water
60°C Water y = 1E-05x3 - 0.0019~2 + 0.0769s
Carbon-Polyimide
Carbon-Epoxy
Carbon-Polyimide
90°C Water
Figure 4-9) Moistore diffnsion pattern for Glass-Epoxy Laminates in 60°C and 90°C water
90°C Water
60°C Water
y = 2E-05x3 - 0.00316 + 0.1539~
y = 2E-05x3 - 0.0014~2 + 0.047~

Figure 4- IO) Moisture diffusion pattern for Carbon-Epoxy Laminates in 60°C and 90°C water
O 10 20 30 40 50 60
~irnel" (h) ' l a
Figure 4-11) Moisture diffusion pattern for CarbonPoiyimide Laminates in 60°C and
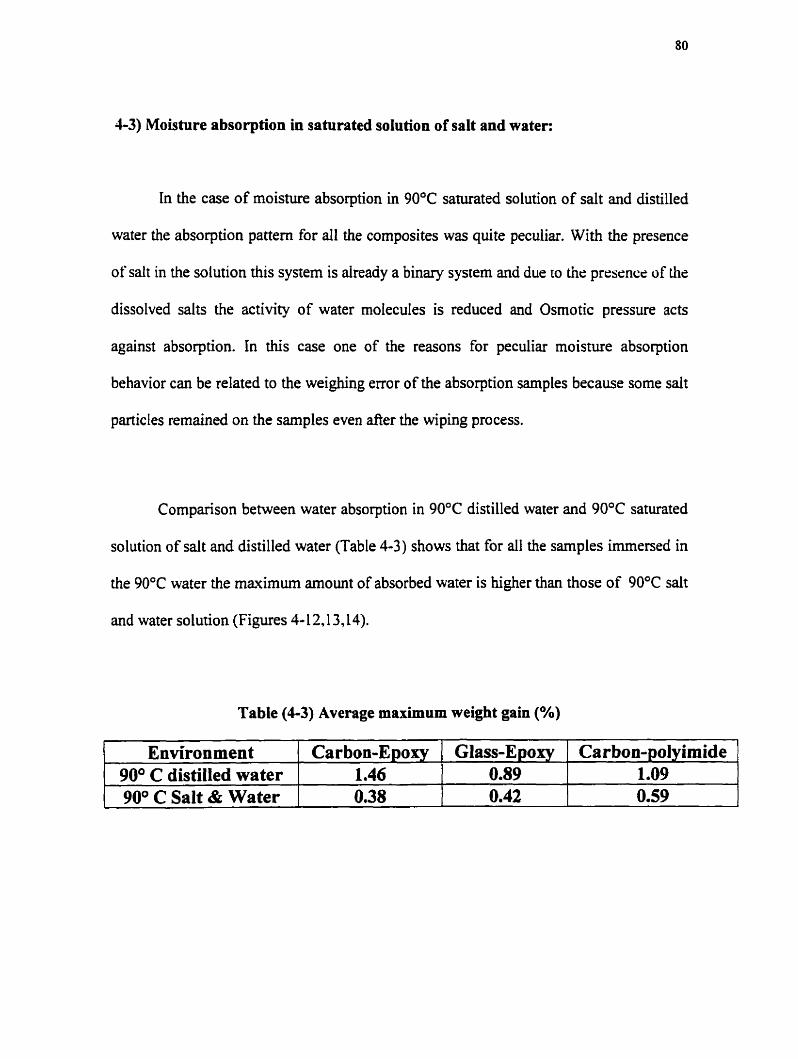
4-3) Moisture absorption in saturated solution of salt and water:
In the case of moisture absorption in 90°C sahirated solution of salt and distilled
water the absorption pattern for d l the composites was quite peculiar. With the presence
of sait in the solution this system is aiready a binax-y system and due to the prrsençe of the
dissolved salts the activity of water molecules is reduced and Osmotic pressure acts
against absorption. In this case one of the reasons for peculiar moisture absorption
behavior can be related to the weighing ermr of the absorption samples because some salt
partictes remained on the samples even after the wiping process.
Cornparison between water absorption in 90°C distilled water and 90°C saturated
solution of salt and distilled water (Table 4-3) shows that for al1 the samples immersed in
the 90°C water the maximum amount of absorbed water is higher than those of 90°C salt
and water solution (Figures 4- 12.1 3,14).
Table (4-3) Average maximum weight gain (%)
Environment 90° C distilled water 90° C Salt & Water
Carbon-Epoxy 1 .46 0.38
Glass-Epoxy 0.89 0.42
Carbon-polyimide 1.09 0.59

Time ''* (h) "* 90-C Salt &water
Figure 4-12) Comparison between water absorption of glass-epoxy composites in 9Q°C distilled water and 90°C gaturated sdiitinn nf salt and distilled water
O 20 40 60
Time If* (h)
Figure 4-13) Comparison between water absorption of carbon-epoxy composites in 90°C distilled water and 90°C saturated solution of sait and distilled water

O 20 40 60
~ i r n e ' ' ~ (h)
Figure 1-14) Cornparison between water absorption of carbon-polyimide composites in 90°C distilled water and 90°C sahirated solution of salt and distilled water
1.4) Effects of aqueous solution on notched tende strength of cross-ply composites:
The notched tende strength of the glass-epoxy, carbon-epoxy and carbon-
polyimide composites with [0,90], lay up at 90°C distilled water and 90°C saturated
solution of salt and water was investigated. Generaily cross-ply laminates are a typical
exarnple used for investigating ma& transverse cracking and its effect on load bearing
capacity of composites (Figure 4-14).
Figure 4-14) illustration of cross-ply [0,901, laminates

To a fint approximation, the strength of balanced cross-ply laminate can be estimated as:
G u = 112 ( o i , + a z u 1 (4-3 )
Where CQ, is equal to ultimate tensile strength of the matrix ( o,, ) and ci, can be
calculated by the rule of mixtures.
Where of, is the fiber strength and Vr , V, are the volume Fraction of fiber and matrix.
It has been shown that more extensive splitting of O" plies and accumulation of
damage cm contribute to higher notched strength of cross-ply laminates [61]. On the
other hand brittle matrices required less energy to &ive splitting and cracking to compare
with iougher matrices. By increasing the temperature from ambient temperature to higher
temperatures. brinle samples become more ductile and in addition residuai stresses can be
relieved by heat. Consequently these two factors simultaneously reduce the splitting and
transverse cracking and result in greater stress concentration at the notch tip therefore the
ultimate notch strength of cross-ply composite might be reduced.
in the case of [0190], glass-epoxy composites in 90°C distilled water. the notched
tensile strength of composites reduced signifcantly (60%) after 7000 hours immersion
(Figure 4- 15). This huge Ioss can be related to attack of water on the glas fibers and the
consequent reduction the strength of 0" plies.

Time (h)
Figure 4.15) Cornparison behveen the notched tensile strength of glass-epoxy, carbon-epoxy and carbon-poiyimide cross-piy laminates immersed in 90° C distilled water
The [0.90], carbon-epoxy composites immersed in 90°C distilled water showed
gradual deterioration in their notched tensile strength. It is noteworthy to mention that
because of the oxidative treatment of carbon fibers. they are very resistant to 90°C water
and this environment has no effect on their strength. But the carbon-epoxy composites
tested in this study were made with a tough commercial epoxy polymer. Hence, 90° plies
cm be weakened and softened by hot water.
In equation (43), if we consider ~ 2 . equal to 53 ma., the maximum loss of 53
MPa would be the contribution of transverse strength to the deterioration of composite
strength. In addition equation (4-4) shows the maximum contribution of polymer to oi. is
not bigger than 2%.
strength. In addition equation (4-4) shows the maximum contribution of polymer to a,, is
not bigger than 2%.
The experimental results show (Figure 4- 15) that the strength of the carbon-epoxy
composites decreased fiom 1.05 GPa to 0.9 GPa after 7000 hom of immersion in 90°C
water. Figure (4-15) also shows the strength of [0,90], carbon-polyimide composites.
decreased almost 0.43 GPa &er 500 hours immersion in 90°C water with no more loss
up to 7000 hours immersion.
Ln the case of specimens which were used in this expenment. having more
intemal cracks and longitudinal splits in the specimens, reduced the notch tip stress
concentration and consequently the ultimate strength of the notched specimens was
higher. On the other hand, long term hygrothemal treatment of composites and the
absorption of water can relieve the residual stresses, and also polymer becomes more
ductile. thercfore according to the Griffith critenon spontaneous crack propagation is less
and ultimate strength of the notched composite becomes lower. However the force
displacement curves for conditioned samples showed smoother c w e s than for
unconditioned samples.
Figure (4-16) shows the effect of 90°C saturated solution of salt and distilled
water on the notched strength of [0,90l5 glass-epoxy, carbon-epoxy and carbon-
polyimide composites. This figure shows presence of salt had no effect on the notched
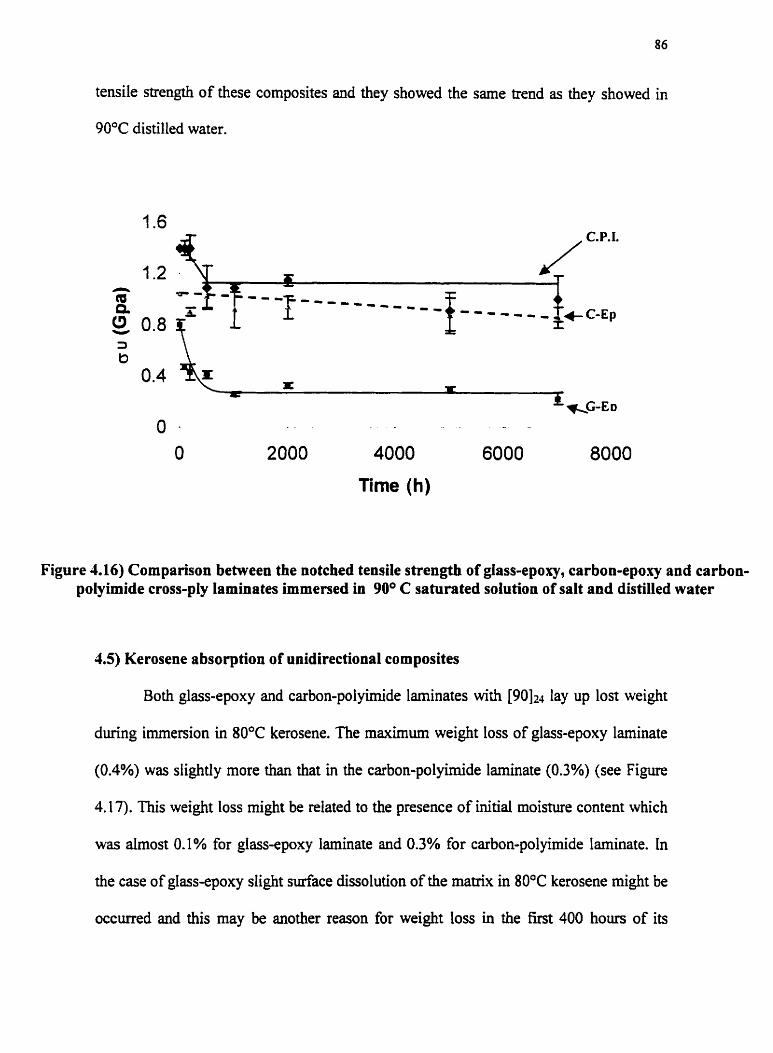
tensile strength of these composites and they showed the sarne trend as they showed in
90°C distilled water.
C.P.I.
C-Ep
- -
O 2000 4000 6000 8000
l rne (h)
Figure 4.16) Cornparison between the notched tensile strength of glass-epoxy, carbon-epoxy and carbon- polyimide cross-ply laminates imrnersed in 90° C saturated solution of salt and distilled water
4.5) Kerosene absorption of unidirectional composites
Both glas-epoxy and carbon-polyimide laminates with lay up los weight
during immersion in 80°C kerosene. The maximum weight loss of glass-epoxy laminate
(0.4%) was slightly more than that in the carbon-polyimide laminate (0.3%) (see Figure
4.17). This weight loss might be related to the presence of initial moisture content which
was almost 0.1% for glass-epoxy laminate and 0.3% for carbon-polyimide laminate. In
the case of giass-epoxy slight sinface dissolution of the ma& in 80°C kerosene might be
occurred and this may be another reason for weight loss in the £ k t 400 hours of its
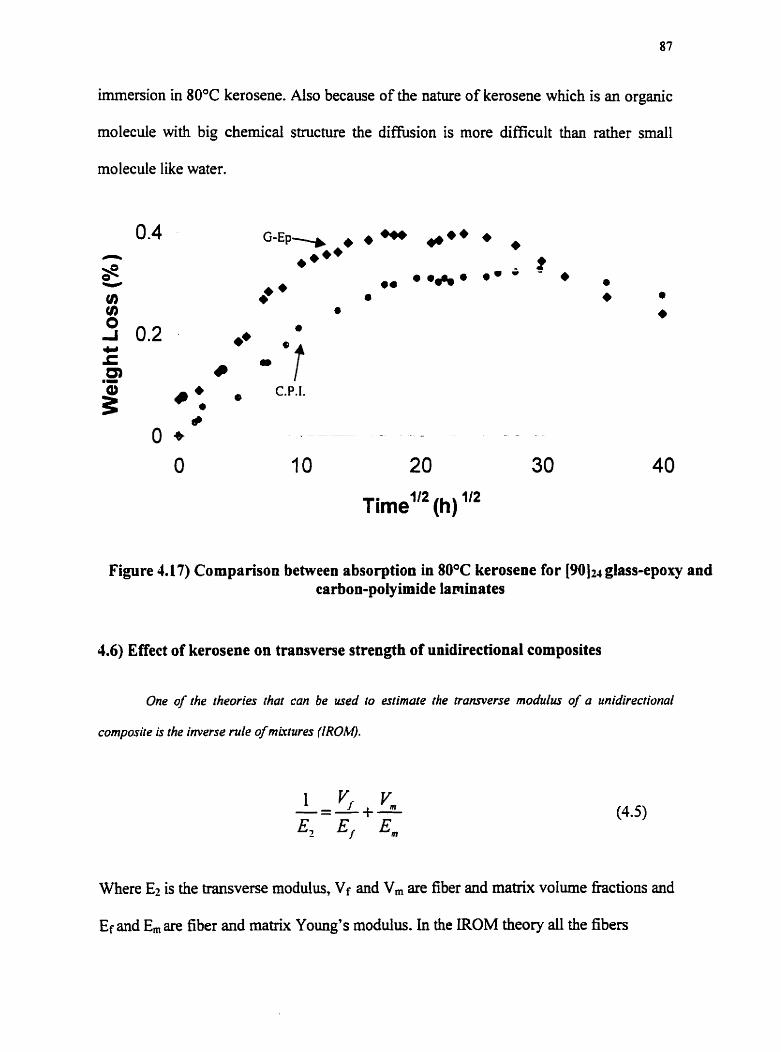
immersion in 80°C kerosene. Aiso because of the nature of kerosene which is an organic
molecule with big chernical structure the diffusion is more difficult than rather small
molecule like water.
C.P.I.
~ime"* (h) '"
Figure 4.17) Cornparison behveen absorption in 80°C kerosene for [90Iu glass-epoxy and carbon-polyimide laminates
4.6) Effect of kerosene on transverse strength of unidirectional composites
One of the theories rhat can be used to esrimate the transverse modulus of a unidirectional
composite is the inverse mle of mktures (/ROM.
1 v, v', - = + -
Where E2 is the transverse modulus, Vf and V, are fiber and matrix volume hctions and
Ef and E, are fiber and mat* Young's rnodulus. In the IRûM theory all the fibers

lumped into one band normal to the stress direction and also stress of the matrix and the
fibers assurned the same as the applied stress on the composite and for this reason the
thcory known as the Equd Stress Model.
For the carbon-polyimide composite with Vf = 0.60 and using Er =385 GPa and
E, = 3.5 GPa, E2 was calculated. For the ROM method Ez was equal to 8.6 GPa and E2
from the experimental data was equal to about 10.5 GPa.
Figure (4.18) shows the effect of 80°C kerosene on the transverse modulus of the
both glass-epoxy and carbon-polyimide laminates with [90124 lay u p No significant
change in transverse rnodulus after 3500 hours was observed. Also in the case of carbon-
polyimide no effect on transverse tensile strength of the composite was obsewed and it
shows that this type of composite is more resistant to high temperature fuel and it also
indicates the strength of the interface in these composites. But [90124 glass-epoxy
laminates lost almost 21% of their strength after 3500 of immersion in 80°C kerosene(see
Figure 4.19).
Although the transverse strength of [90Iz4 glass-epoxy laminates after 3500
immersion in 80°C kerosene was decreased, SEM pictures fiom fracture surfaces of these
laminates did not show darnage on the interface. Hence the loss of transverse strength of
these laminates might be related to the weakening of the epoxy r n a h by this hostile
environment.
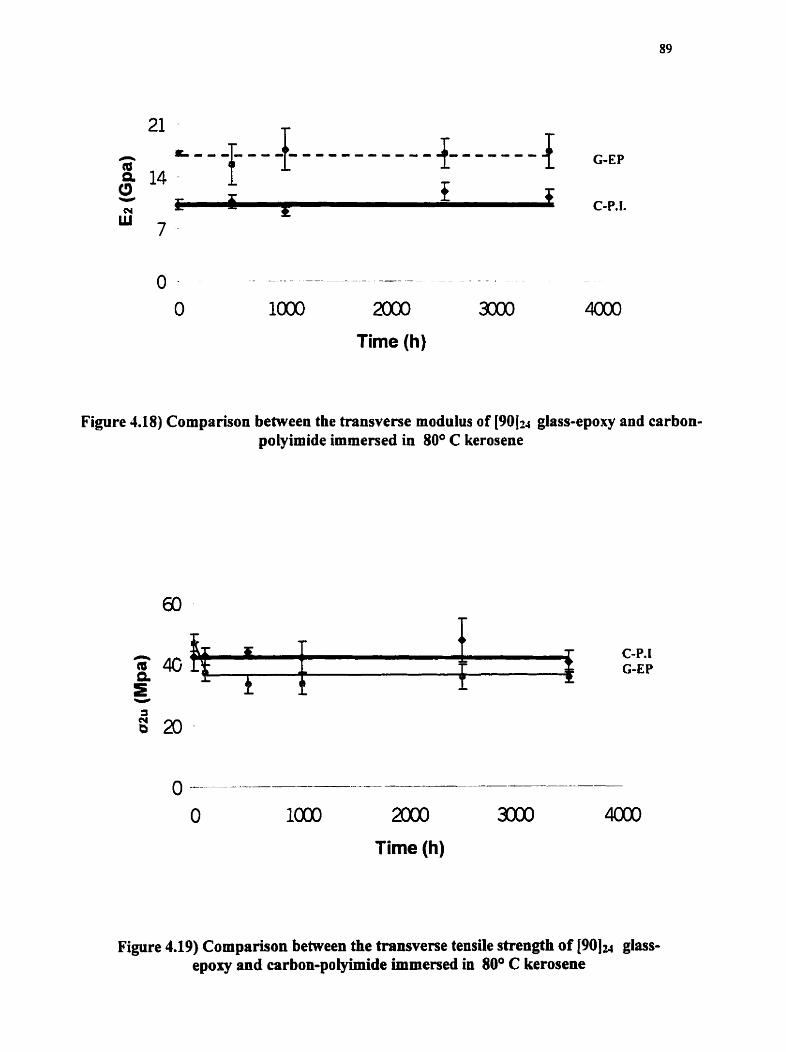
G-EP
C-P.I.
Figure 4.18) Comparison between the transverse modulus of [90Iu glass-epoxy and carbon- polyimide immersed in 80° C kerosene
C-P. 1 G-EP
Figure 4.19) Comparison between the transverse tensile strength of [90lu glass- epoxy and carbon-poiyimide immersed in 80° C keroseoe

5. Conclusions
O Water absorption experiments showed that the moisture diffusion into cross-ply
glass-epoxy, carbon-epoxy and carbon-polyimide composites was a multi-stage
diffusion process with a difhision coefficient that apparently decreased with
time.
The result of this study showed both glass-epoxy and carbon-epoxy composites
lost some dry weight during the immersion period in 90°C water therefore the
real absorption pattern could be obtained by using the ihear solids mass loss
data, in combination with the experimental rnoisture absorption data. Also it
was found that for al1 the composites immersed in the 90°C water the maximum
rnoisture content was higher than those of 60°C water.
The notched tensile strength of glass-epoxy and carbon-epoxy composites
decreased by 65% and 22% after 7000 hours of immersion in 90°C water
respectively. For glass-epoxy composites the higher ioss could be related to
attack of water on the glass fibers.
The kerosene had no effect on the transverse properties of unidirectional
carbon-polyimide composites even after 3500 hours of immersion.
91
REFERENCES:
R.B. Seymour And R.D.Deanin., History of Polymer Composites, VNU Science Press BV 1987 P.K. Mallick, Fiber Reinforced Composites, Marcel Dekker, Inc. (19931, Chapters: 1,2,5 F.N. Cogswell, Thennoplastic Aromatic Polymer Composites, Butterworth Ltd (1992) 33 M.R. Piggott, Load Bearing Fiber Composites, Pergamon Press, (198G), 42-52 K. Potter, An Introduction to Composite Products. Chapman & Hall, (1997), 64-87 V.I. Kostikov, Fiber Science And Technology, Chapman & Hall 1 995 M.R.Piggott, Tailored Interphases in Fiber Reinforced Polymers, Materials Research Society Symp. Proc. Vol. 170, (1 WO), 286-272 L.W. Jemeskens, Adhesion hprovement By Silane Coupling Agents In Composites. interfacial Phenomena In Composite Matenals, I. Verposet, F. Jones. Butteworth- Heinemann Ltd., 1 99 1 page 1 1 - 15 T.C.Chang, B.Z.Jang, The effects of Fiber Surface Treatments By A Cold Plasma In Carbon Fiber Composites, Interfaces In Composites, C.G.Pantano, E.Chen, Materials Research Society, (1 WO), 32 1-326
10. J.E. Kelemberg, L. Martinu. S. Sapieha, Control And Modification of Surfaces And Interfaces By Coma And Low Pressure Plasma, The Interfacial Interactions In Polymeric Composites, G. Akovaldi, Kulwar Academic Publishers (1 993) 20 1-222
11. E.M. Liston. Plasmas And Surfaces- A Practical Approach To Good Composites, . The Interfacial Interactions In Polymenc Composites. G. Akovaldi, Kulwar Academic Publishers (1 993) 223-268
12. F.W. Billmeyer, Text Book Of Polymer Science, Jhon Wiley & Sons Inc.. (1984) 3-4, 436-446
13. K.J. Sanders, Organic Polymer Chemistry, Chapman & Hall, (1 988). 4 12-436 14. A. Kelly, Composite Matenals, Elsevier Science Ltd., 1994 163-1 70, 295 15. D.Wilson, H.D.Stenzenberger, P.M.Hergenrother, Polyimides, Chapman and Hall,
(1990), 189-199 i 6. M.I.Bessonov, M.M.Koton, Polyllnides, Themally Stable Polymers. Plenum
Publishing, (1987), 286 17. H. Ishida, Controlled Interphases In Glass Fiber And Particdate Reinforced
Polymers, The Interfacial Interactions In Polymenc Composites, G. Akovali, Kluwer Academic Publishers, (1 993), 17 1-1 75
I 8. E.P.Plueddema~, Interfaces In Polymer Ma& Composites, Academic Press New York, 1974
1 9. M.R.Piggott, Micrornechanics of Fiber-Polymer Interfaces, Interfacial Phenomena In Composite Materials, 1. Verposet, F. Jones, Butterworth-Heinemann Ltd., (1 99 1 ), 3-6
20. M-RPiggott, Mater Res. Soc. Proc. (1989), 170-200 21. E.Klinklin, M.Guigon, Characterization of The Interface And Interphase In Carbobon
Fiber Reinforced Composites, 83-85 22. A.P. Kettle, A.J. Beck, Plasma Polymerization For Molecdar Engineering of Carbon-
Fiber Surfaces For Optimized Composites, Composites Science And Technology, VOL. 57 NO. 8, (1 997), 1023-1024

L.H. Sharpe, Interfaces, Interphases And Adhesion, The Interfacial Interactions In Polymeric Composites, G. Akovali, Kluwer Academic Publishers, (1993), 1-1 8 S.F. Zhandarov, E.V. Pisanova, The Local Bond Strength And Its Determination And Pull-Out Tests, Composites, Composites Science And Technology, VOL. 57 NO. 8, (1 997), 957-958 M.R. Piggott, Why Intedace Testing By Single-Fiber Methods Can Be Misleading, Composites, Composites Science and Technology, VOL. 57 NO. 8, (1997), 965-974 W.A. Fraser, F.H. Ancker, A.T. Di Benedetto, 30" Ann. Techn. Conf., Reinforced Plastic Composites hst., Soc. Plastic Indusiry, 22-A, (1975) W. Weibull. The Royal Swedish Institute For Engineering Research. Proc. No. 15 1, 1 93 9,4-6 M.R. Piggott, Y. Xiong, Direct Observation of Debonding in Fiber Pull-Out Specimens, ASTM STP 1290, C.J. Spragg, L.T. Drzal, Eds., American Society For Testing And Materials, ( 1996) 84-9 1 M.R. Piggott , Composite Interfaces, 1 (1993) 22 1-224 J.F. Mandell, D.H. Grande. et al., Modified Microbondinp Test for Direct In Situ FiberlMatrix Bond Strength Determination in Fiber Composites, Composite Materials. Testing and Design (7" Conference) ASTM STP893, (1 996) 87-1 08 B. Miller, P.Muri, L.Rebenfeld, A Microbond Method for Determination of The Shear Strength of A Fiber Resin Interface, Composite Sci. and Tech. 28 (1987), 17-32 M.R. Piggott, Composite Science And Technology, 42 (1 991) 57-76 D. Jacques, J.P. Farve, Determination of The Interfacial Shear Strength by Fiber Fragmentation in Resin Systems With A Small Rupture S M , ICCM, Vol 5. (1987) 47 1-479 M. Nardin, J. Schultz, Interactions and prcperties of Composites: a) Fiber-Matrix Adhesion Meamremenîs The Interfacial Interactions In Polyrnenc Composites, G. Akovaldi, Kuiwar Academic Publishers 1993 8 1-92 S.F. Zhandarov, E.V. Pisanova, V.A. Dovgyalo, Adhesive Strength in 'Thenno PIastic Polymer-niin Fiber System. Effect of The Testing Technique Mech. Composites Materids. 1993,29, 175- 1 82 L.T. Drzal, P.J. Herrera, Composite Fiber-Matrix Bond Tests, Ln Engineered Materials Handbook, Vol. 3, Adhesive and Seaiant, H.F. Brinson Tech. Chairman, ASM international, (1990) 391 M.R. Piggott, Composites Science and Technology, 55 (1995) 296-276 M.R. piggott, K. L& Composites, 26(1995) 829-840 ASTM. 2344-67, Apparent Horizontal Shear Strength of Short-Beam Method, (1 970), Part 26,4 19-423 C.A. Berg, J. Tirosh, M. Israeli, Analysis of Short Beam Composites, Composite Materids: Testing and Design (2nd (1 972), 206-2 1 8
Reinforced Plastics by
Bending of Reinforced c d . ) ASTM STP 497,
N. Iosipescu, "New Accurate Procedure For Single Shear Testing of Metals", J. of Materials 2(3), (1 967), 537-566 C.H. Shen, G.S. S p ~ g e r , Moisture Absorption and Desorption of Composite Materids. J. Composites. Materiais (l976) 10:2 A.D. Loss, G.S. Springer, Moisture Absorption of Graphite-Epoxy Composites J. Comoosites. Materials ( 1979) 13: 13 1

44. H.T. Hahn, R.Y. KUn, Swelling of Composite Laminates, J,R. Vinson, Advanced Composite Materials- Environmental Effects, ASTM STP 658. America Society For Testing And Materials, Philadelphia, Penn. (1978) 98-1 20
45. A. picella, L. Nicolais and C. de Cataldis, Characterization of The Morphological Fine Smcture of Commercial Thexmosetting Resins Through Hygrothennal Experiments, Springer-Verlag, Advances in Polymer Science, (1985), 66 189-207
46. A. Apicella, L. Nicolais, Effect of Water on The Properties of Epoxy Matrix and Composites, Spnnger-Verlag, Advances in Polymer Science. (1986), 72 69-77
47. C.H. Shen, G.S. Springer, Effects of Moisture And Temperature on the Tensile Strength of Composite Materials, G.S. Springer, Environmental effects On Composite Materials, Technomic, 1 98 1 79-93
48. C.H. Shen, G.S. Springer, Environmental Effects in the Elastic Moduli of Composite Materials, G.S. S p ~ g e r , Environmental Effects on Composite Materials, Technomic, (1981), 94-106
49. L.H. Strait, M. L. Karasek, M. F. ba t eau , Effects of Seawater Immersion On The Impact Resistance of Glass Fiber Reinforced Epoxy Composites, J. of Composite Materials. Vol. 26, No. 14 (1 992) 21 18-2 133
50. M.K. Antoon, J.L. Koenig, Irreversible Effects of Moisture on the Epoxy Matnx in Glass Reinforced Composites, Journal of Polymer Science: Polyrner Physics Edition. (1981),19 197-212
5 1. Q. Zheng, R.J. Morgan, Synergistic Thermal-Moisture Darnage Mechanism of Epoxies and Their Carbon Fiber Composites, J. of Coniposite Matenals, Vol. 27. No. 15 (1993) 1465-1478
52. O.K. Joshi, The effect of Moisture on the Shear Properties of Carbon Fiber Composites, Composites, 14 (1 983) 196
53.0. Gillat, L. J. broutrnan, Effect of an External Stress on Moistwe Diffusion and Degradation in a Graphite Reinforced Epoxy Laminate. Advanced Composite Matenals Environmental Effects, ASTM STP 658 (1 978) 6 1
54. S. Kausshal, K. Tankala, R. Rao, Kishore, Some Hygrothenai Effects on the Mechanicd Behavior and Fractography of Glass-Epoxy Composites With Modified Interface, Journal of Materiai Science, 26 (1 99 1) 6293-6299
55. J. Zhou, J. P. Lucas, The Effects of A Water Environment On Anomalous Absorption Behavior In GraphiteEpoxy Composites, Composite Science and Technology 53, (1995) pp. 57-64
56. H. Ishida, J.L. Koeing, Fourier-Transfomi h f k e d Spectroscopic Study of the Hydrolytic Stability of Silane Coupling Agents on E-Glass Fibers, Journal of Polyrner Science: Polymer Physics Edition, (1 980) 18: 193 1 - 1943
57. K.Hoh, H. Ishida, J.L. Koeing, Multi Nuclear NMR Spectroscopic and Proton NMR haging Studies On the Effect of Water on the Silane Coupling AgentMatrix Resin Interface in Glass Fiber Reinforced Composites, Polymer Composites, 1 l(3) (1990) 192- 199
58. C. Soutis, D. Turkmen, Moisture and Temperature Effects of the Compressive Failure of CFRP Unidirectional Laminates, J. of Composite Materials, Vol. 3 1, No. 8 (1 997) 832-849
59. J.R. Kerr, J.F. Haskins, Effects of 50000 h Thermal Aging on GraphiteEpoxy and GraphitelPolyimide Composites, AlAA Journal, VOL 22 No. l (1 984) 96- 102

60. Y. Sawada, A. Shindo, Y. Nakanishi, Interfacial Adhesion in A Carbon Fiber Polyimide Composite, The proceedings of ICCM, VOL 5, (1987) 448-457
6 1. C.J. Zhang, M.T. Kortschot, The Effect of Subcritical Damage on The Notched Tensile Strength of Carbon Fiber Composites Exposed to Adverse Environment, Proc. CANCOM 91, (1 99 l), 3D6,l-8

7. List of Nomenclature
mass diffusmty along the r direction (p rn" s-')
transverse rnodulus of the composite
Young's modulus of fiber
Young's modulus of matrix
thickness of the specimen for moisture absorption experiments (mm)
critical length of the fiber fragment in fragmentation test (mm)
percent rnoisture content (%)
initial weight gain ( O h )
equilibriurn weight gain (%)
half fiber diameter (mm)
critical fiber aspect ratio
time
glass transition temperature (OC)
temperature of interest ( O C )
fiber volume fraction of the composite
matrix volume fraction of the composite
thermal expansion coenicient of fiber @Ki)
thermal expansion coefficient of matrix (MIC')
constant
mass of the water absorbed (g)
strain in direction normal to fiber
stress appüed on the composite in the direction normal to the fiber
Tensiie strength of the composite
ultimate tensile strength of the matrix
Strength of the cross-ply laminate
tensile strength of fiber
thermaiiy induced stress
expansion stress caused by the water
mean interfacial shear strength


![Polymer matrix composites [pmc]](https://static.fdocuments.net/doc/165x107/5877c8191a28ab39588b6079/polymer-matrix-composites-pmc.jpg)