Moisture Durability with Vapor Permeable Insulating Sheathing Durability with Vapor Permeable...
69
Moisture Durability with Vapor Permeable Insulating Sheathing Building America Report - 1313 August 2012 Robert Lepage and Joseph Lstiburek Abstract: building science.com © 2013 Building Science Press All rights of reproduction in any form reserved. Exterior sheathing insulation is an effective strategy in increasing the overall R-value of wall assemblies; other benefits include decreasing the effects of thermal bridging and increasing the moisture durability of the built assembly. Vapor-permeable exterior insulation, such as mineral board or expanded polystyrene foam, are one such product that may be used to achieve these benefits. However, uncertainty exists on the effects of inward driven moisture and the interaction of increased sheathing temperatures on the moisture durability of the edifice.
Transcript of Moisture Durability with Vapor Permeable Insulating Sheathing Durability with Vapor Permeable...

Moisture Durability with Vapor Permeable Insulating Sheathing Building America Report - 1313 August 2012 Robert Lepage and Joseph Lstiburek
Abstract:
building science.com© 2013 Building Science Press All rights of reproduction in any form reserved.
Exterior sheathing insulation is an effective strategy in increasing the overall R-value of wall assemblies; other benefits include decreasing the effects of thermal bridging and increasing the moisture durability of the built assembly. Vapor-permeable exterior insulation, such as mineral board or expanded polystyrene foam, are one such product that may be used to achieve these benefits. However, uncertainty exists on the effects of inward driven moisture and the interaction of increased sheathing temperatures on the moisture durability of the edifice.
Moisture Durability with Vapor Permeable Insulating Sheathing R. Lepage, J. Lstiburek, Building Science Corporation
August 2012

NOTICE
This report was prepared as an account of work sponsored by an agency of the United States government. Neither the United States government nor any agency thereof, nor any of their employees, subcontractors, or affiliated partners makes any warranty, express or implied, or assumes any legal liability or responsibility for the accuracy, completeness, or usefulness of any information, apparatus, product, or process disclosed, or represents that its use would not infringe privately owned rights. Reference herein to any specific commercial product, process, or service by trade name, trademark, manufacturer, or otherwise does not necessarily constitute or imply its endorsement, recommendation, or favoring by the United States government or any agency thereof. The views and opinions of authors expressed herein do not necessarily state or reflect those of the United States government or any agency thereof.
Available electronically at http://www.osti.gov/bridge
Available for a processing fee to U.S. Department of Energy and its contractors, in paper, from:
U.S. Department of Energy Office of Scientific and Technical Information
P.O. Box 62 Oak Ridge, TN 37831-0062
phone: 865.576.8401 fax: 865.576.5728
email: mailto:[email protected]
Available for sale to the public, in paper, from: U.S. Department of Commerce
National Technical Information Service 5285 Port Royal Road Springfield, VA 22161 phone: 800.553.6847
fax: 703.605.6900 email: [email protected]
online ordering: http://www.ntis.gov/ordering.htm

i
Moisture Management with Highly Permeable Sheathing Insulations over Existing Walls with Permeable Cavity Insulation
Prepared for:
The National Renewable Energy Laboratory
On behalf of the U.S. Department of Energy’s Building America Program
Office of Energy Efficiency and Renewable Energy
15013 Denver West Parkway
Golden, CO 80401
NREL Contract No. DE-AC36-08GO28308
Prepared by:
Building Science Corporation
30 Forest Street
Somerville, MA 02143
NREL Technical Monitor: Cheryn Metzger
Prepared under Subcontract No. KNDJ-0-40342-00
August 2013

i
[This page left blank]

i
Contents List of Figures ............................................................................................................................................. ii List of Tables .............................................................................................................................................. iii Definitions ................................................................................................................................................... iv Executive Summary ..................................................................................................................................... i 1 Problem Statement ............................................................................................................................... 1
1.1 Introduction ..........................................................................................................................1 1.2 Background ..........................................................................................................................2 1.3 Relevance to Building America’s Goals ..............................................................................2 1.4 Cost-Effectiveness ...............................................................................................................3 1.5 Tradeoffs and Other Benefits ...............................................................................................4
2 Experiment ............................................................................................................................................ 4 2.1 Research Question ...............................................................................................................4 2.2 Literature Review.................................................................................................................4 2.3 Technical Approach .............................................................................................................5
2.3.1 Mechanisms of Moisture Damage and Relevant Forces ..........................................5 2.3.2 Hygrothermal Simulations .......................................................................................7 2.3.3 BEOpt Modelling ..................................................................................................13
3 Results and Analysis ......................................................................................................................... 14 3.1 Hygrothermal Simulations .................................................................................................15
3.1.1 Climatic Effects .....................................................................................................30 3.2 Energy and Cost Analysis ..................................................................................................33
4 Summary ............................................................................................................................................. 35 References ................................................................................................................................................. 38

ii
List of Figures Figure 1: Base Case Wall Assembly ......................................................................................................... 9 Figure 2: Typical Wall Assembly with Exterior Insulation .................................................................... 12 Figure 3: Exterior Side MC of Structural Sheathing with No Exterior Insulation in Chicago ............ 15 Figure 4:Interior Side MC of Structural Sheathing with No Exterior Insulation in Chicago .............. 16 Figure 5: Exterior Side of Structural Sheathing Moisture Content with 1” of Exterior Insulation .... 16 Figure 6: Interior Side of Structural Sheathing Moisture Content with 1” of Exterior Insulation ..... 17 Figure 7: Average Exterior Side Sheathing Moisture Content for 0", 1", 2", and 4” of Exterior
Insulation at Various WRB Permeances .......................................................................................... 18 Figure 8: Average Interior Side Sheathing Moisture Content for 0", 1", 2", and 4” of Exterior
Insulation at Various WRB Permeances .......................................................................................... 18 Figure 9: Peak Exterior Side Sheathing Moisture Content for 0", 1", 2", and 4” of Exterior
Insulation at Various WRB Permeances .......................................................................................... 19 Figure 10: Peak Interior Side Sheathing Moisture Content for 0", 1", 2", and 4” of Exterior
Insulation at Various WRB Permeances .......................................................................................... 20 Figure 11: Biodegradation Risk Plot for the Exterior Side of the Sheathing, with 0" Exterior
Insulation and 50 Perm WRB ............................................................................................................. 21 Figure 12: Biodegradation Risk Plot for the Exterior Side of the Sheathing, with 1" of Exterior
Insulation and 50 Perm WRB ............................................................................................................. 21 Figure 13: Biodegradation Risk Plot for Interior Side of the Sheathing, with 0" of Exterior
Insulation and 50 Perm WRB ............................................................................................................. 22 Figure 14: Biodegradation Risk Plot for Interior Side of the Sheathing, with 0" of Exterior
Insulation and 0.1 Perm WRB ............................................................................................................ 22 Figure 15: Average Exterior Side Sheathing Moisture Content for 1", 1"+ Poly, and 1"+ Kraft at
Various WRB Permeances ................................................................................................................. 24 Figure 16: Peak Exterior Side Sheathing Moisture Content for 1", 1"+ Poly, and 1"+ Kraft at
Various WRB Permeances ................................................................................................................. 25 Figure 17: Average Interior Side Sheathing Moisture Content for 1", 1"+ Poly, and 1"+ Kraft at
Various WRB Permeances ................................................................................................................. 25 Figure 18: Peak Interior Side Sheathing Moisture Content for 1", 1"+ Poly, and 1"+ Kraft at Various
WRB Permeances ............................................................................................................................... 26 Figure 19: Biodegradation Risk Plot for Exterior Side of the Sheathing, with 1" of Exterior
Insulation and 50 Perm WRB and Polyethylene Sheet Interior Vapor Control ............................ 27 Figure 20: Biodegradation Risk Plot for Interior Side of the Sheathing, with 1" of Exterior
Insulation and 50 Perm WRB and Polyethylene Sheet Interior Vapor Control ............................ 27 Figure 21: Biodegradation Risk Plot for Exterior Side of the Sheathing, with 1" of Exterior
Insulation and 50 Perm WRB and Kraft Interior Vapor Control ..................................................... 28 Figure 22: Biodegradation Risk Plot for Interior Side of the Sheathing, with 1" of Exterior
Insulation and 50 Perm WRB and Kraft Interior Vapor Control ..................................................... 28 Figure 23: Relative Humidity Adjacent to Paper Faced GWB, Incl. 7-day and 30-day Running
Average ................................................................................................................................................ 29 Figure 24: Peak Exterior Side Sheathing Moisture Content for Listed Cities with 1” of MFI Exterior
Insulation at Various WRB Permeances .......................................................................................... 31 Figure 25: Average Exterior Side Sheathing Moisture Content for Listed Cities with 1” of Exterior
Insulation at Various WRB Permeances .......................................................................................... 32 Figure 26: Peak Interior Side Sheathing Moisture Content for Listed Cities with 1” of Exterior
Insulation at Various WRB Permeances .......................................................................................... 32 Figure 27: Average Interior Side Sheathing Moisture Content for Listed Cities with 1” of Exterior
Insulation at Various WRB Permeances .......................................................................................... 33 Figure 28: BEOpt Energy Use for Chicago, Illinois ............................................................................... 34 Figure 29: BEOpt Results for Chicago, Illinois ..................................................................................... 34 Unless otherwise noted, all figures were created by Building Science Corporation.

iii
List of Tables Table 1: ASHRAE 160 Failure Criteria ....................................................................................................... 8 Table 2: Boundary Conditions ................................................................................................................. 10 Table 3: Simulated Cities and HDD and CDD Data (ASHRAE, 2009) ................................................... 10 Table 4: Cladding Material Effects on OSB Moisture Content ............................................................. 11 Table 5: Table of Testing Variables ......................................................................................................... 13 Table 6: Cost per Square Foot for Wall Options .................................................................................... 14 Table 8: Airtightness by Water Resistive Barrier .................................................................................. 14 Table 9: Reference Cities ......................................................................................................................... 14 Table 10: Hours above 28% Moisture Content for Identified Wall Assemblies .................................. 23 Table 11: Hours above 28% Moisture Content for Identified Wall Assemblies with Interior Vapor
Control ....................................................................................................... Error! Bookmark not defined. Table 12: Peak and Yearly Average Moisture Contents for Plywood Sheathing ................................ 30 Table 13: Peak and Average Moisture for Plywood Sheathing with Polyethylene Sheet .................. 30 Table 14: List of Cities and Associated Climate Zones ........................................................................ 31 Unless otherwise noted, all tables were created by Building Science Corporation.

iv
Definitions
ACH Air Changes per Hour
BA Building America Program. More information about BA can be found at www.buildingamerica.gov
BSC Building Science Corporation. More information about BSC can be found at www.buildingscience.com
DOE U.S. Department of Energy
GWB Gypsum Wall Board
MC Moisture Content
MFI Mineral Fiber Insulation
OSB Oriented Strand Board
RH Relative Humidity
VWC Vinyl wall covering
WRB Water resistive barrier
WUFI Wärme und Feuchte instationär; hygrothermal simulation software; see http://www.wufi-pro.com/

i
Executive Summary
Exterior sheathing insulation is an effective strategy in increasing the overall R-value of wall assemblies; other benefits include decreasing the effects of thermal bridging and increasing the moisture durability of the built assembly. Vapor-permeable exterior insulation, such as mineral board or expanded polystyrene foam, are one such product that may be used to achieve these benefits. However, uncertainty exists on the effects of inward driven moisture and the interaction of increased sheathing temperatures on the moisture durability of the edifice.
Inward driven moisture is only a prominent concern when a wetted moisture storing cladding is exposed to elevated levels of solar radiation. The elevated cladding temperatures create a high vapor pressure which drives the moisture into the wall assembly. To mitigate inward flowing moisture, it suffices to utilize a low permeance water resistive barrier (WRB). However, this also inhibits outward flowing moisture.. The complication arises when, during the heating season, outward flowing moisture is inhibited by the WRB, potentially resulting in condensation. The alternatives to minimize moisture accumulation are to either increase the surface temperature of the sheathing (with the use of exterior insulation), or to enable outward drying of the sheathing.
To address these concerns, Building Science Corporation (BSC) conducted a series of hygrothermal models for cities representinga range of different climate zones (DOE Climate Zones 1, 3, 4, 5, and 7). A parametric study was conducted to assess the range of impact of varying levels of exterior insulation (0”, 1”, 2”, 4” of mineral board, R4 per inch) and permeances (0.1, 1, 10, 50 perms) of the WRB . Other modulated variables include the presence of interior vapor control (polyethylene sheet, Kraft paper), type of structural sheathing (plywood or OSB), and the air exchange rates of the gap behind brick cladding (1-4 air changes per hour).
The team found that a WRB permeance in the range of 1 to 10 perms enables sufficient throttling of inward driven moisture while still enabling outward drying in all climate zones, from 1 to 7, with at least 1 in. of exterior insulation (R4). However, very low permeance WRB (less than 1 perm) should not be utilized unless 1 in. or more of exterior insulation is provided. The team recommends that at least 2 in. of exterior insultion is utilized in climate zones 6 and 7. High permeance WRBs (50 perms), should not be used with vapor-permeable exterior insulation with reservoir claddings that are exposed to elevated levels of rain. Low permeance interior vapor control results in elevated moisture content (MC) of the sheathing, by capturing the inward driven moisture. Low permeance interior vapor control layers should be avoided.
Section 1.0 provides a complete description of the research project and a rationale for the investigations as well as the cost basis. Section 2.0 details BSC’s research method, approach, the key research questions that were examined, and the procedures utilized to analyse the problems. Section 3.0 describes the analysis that will be completed and Section 4.0 summarizes the results.

1
1 Problem Statement
1.1 Introduction The moisture performance of walls with higher cavity R-values using permeable insulations, particularly in homes with lower air exchange rates, is poorly understood. Higher risks of air leakage wetting and reduced diffusive drying potentials are theoretically expected to increase moisture risk (Straube & Smegal, 2009), but little research is available to better quantify this risk. Adding insulating sheathing to existing walls with these characteristics is one way of further increasing the thermal resistance of these assemblies. However, for other reasons these exterior insulating sheathing products may reduce the outward drying potential of the assembly. Insulating sheathing are available in a range of permeances from very high (i.e., more than 70 US Perms) to very low (i.e., under 0.1 US Perms). There is a need for further research to identify the circumstance in which a vapor-permeable insulating sheathing, defined as having a permeance greater than 5 perms (IRC, 2012) (such as mineral wool, glass fiber) would be preferred over a lower permeable product. This research also includes consideration for the impact of several common cladding types, such as vinyl siding, stucco, wood, fiber cement siding, and brick.
The biggest concern regarding vapor permeable insulating sheathings is inward driven moisture caused by solar radiation hitting a wetted moisture storing cladding, a problem that occurs in all climates. When a wetted reservoir cladding is exposed to elevated solar radiation, a high vapor pressure is created behind the surface of the cladding. This high vapor pressure results in outward drying but also creates an inward vapor drive, particularly if the indoor is air conditioned to a lower vapor pressure. The vapor permeance of the weather resistive barrier (WRB), as well as any structural sheathing (i.e. OSB, plywood, etc) may throttle inward vapor drive, but the degree of vapor restriction is unknown and the effects on the moisture durability of the wall assembly has not been quantified in such circumstances. A complication arises when a low vapor permeance WRB is used in cold climates where outward vapor flows may occur. A low permeable WRB with no insulating sheathing with vapor-permeable cavity insulation results in decreased sheathing temperatures, which may result in condensation. To mitigate this, either the sheathing temperature must be elevated, through the use of exterior insulation, or a more vapor-permeable WRB must be utilized, to enable outward drying. However, the ideal range of WRB permeances and exterior insulation is not well defined or understood.
Currently, a range of cost-effective options exists for retrofitting the existing building stock, but fall beyond the scope of this project. The addition of exterior insulating sheathing is frequently cost prohibitive; however, removal of the cladding is a necessary step to access the sheathing. Only select circumstances warrant the addition of exterior insulation: a degraded cladding that requires replacement (whereby the addition of a nominal amount of exterior insulation results in little additional cost), or a building owner who desires to significantly reduce the energy consumption of the structure caused by low thermal resistance of the building enclosure. The results from this research project may be equally applied to new construction with similar parameters.
2
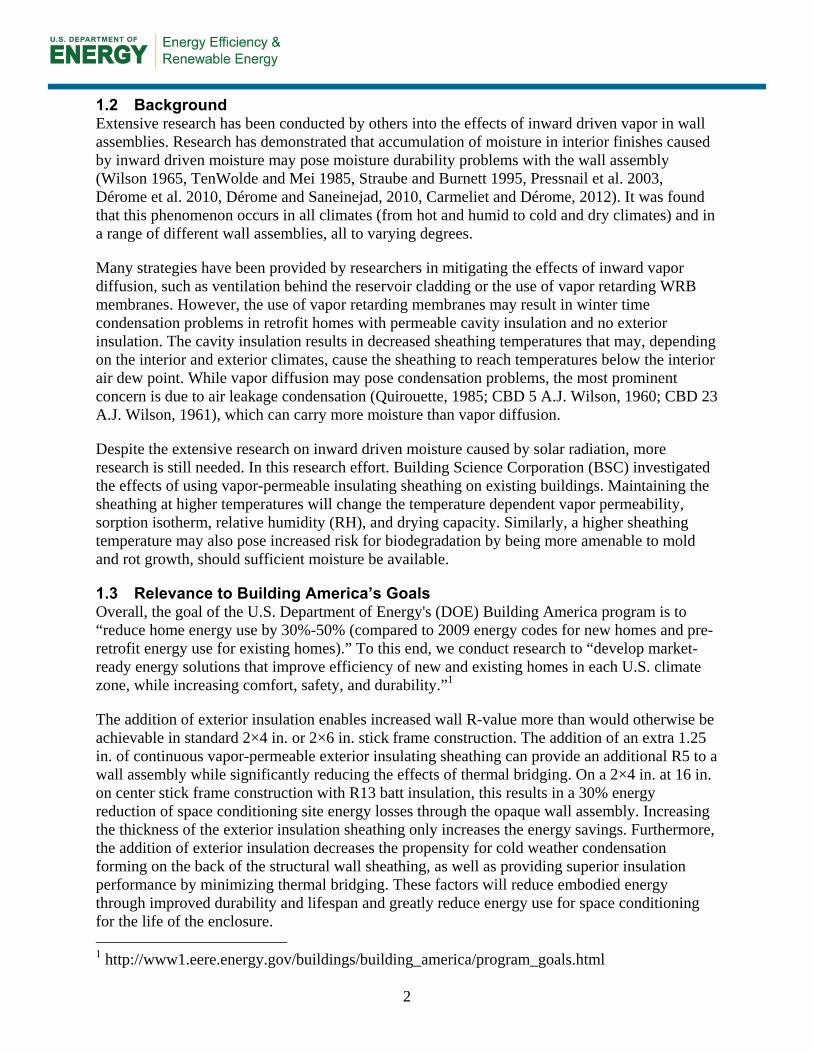
1.2 Background Extensive research has been conducted by others into the effects of inward driven vapor in wall assemblies. Research has demonstrated that accumulation of moisture in interior finishes caused by inward driven moisture may pose moisture durability problems with the wall assembly (Wilson 1965, TenWolde and Mei 1985, Straube and Burnett 1995, Pressnail et al. 2003, Dérome et al. 2010, Dérome and Saneinejad, 2010, Carmeliet and Dérome, 2012). It was found that this phenomenon occurs in all climates (from hot and humid to cold and dry climates) and in a range of different wall assemblies, all to varying degrees.
Many strategies have been provided by researchers in mitigating the effects of inward vapor diffusion, such as ventilation behind the reservoir cladding or the use of vapor retarding WRB membranes. However, the use of vapor retarding membranes may result in winter time condensation problems in retrofit homes with permeable cavity insulation and no exterior insulation. The cavity insulation results in decreased sheathing temperatures that may, depending on the interior and exterior climates, cause the sheathing to reach temperatures below the interior air dew point. While vapor diffusion may pose condensation problems, the most prominent concern is due to air leakage condensation (Quirouette, 1985; CBD 5 A.J. Wilson, 1960; CBD 23 A.J. Wilson, 1961), which can carry more moisture than vapor diffusion.
Despite the extensive research on inward driven moisture caused by solar radiation, more research is still needed. In this research effort. Building Science Corporation (BSC) investigated the effects of using vapor-permeable insulating sheathing on existing buildings. Maintaining the sheathing at higher temperatures will change the temperature dependent vapor permeability, sorption isotherm, relative humidity (RH), and drying capacity. Similarly, a higher sheathing temperature may also pose increased risk for biodegradation by being more amenable to mold and rot growth, should sufficient moisture be available.
1.3 Relevance to Building America’s Goals Overall, the goal of the U.S. Department of Energy's (DOE) Building America program is to “reduce home energy use by 30%-50% (compared to 2009 energy codes for new homes and pre-retrofit energy use for existing homes).” To this end, we conduct research to “develop market-ready energy solutions that improve efficiency of new and existing homes in each U.S. climate zone, while increasing comfort, safety, and durability.”1
The addition of exterior insulation enables increased wall R-value more than would otherwise be achievable in standard 2×4 in. or 2×6 in. stick frame construction. The addition of an extra 1.25 in. of continuous vapor-permeable exterior insulating sheathing can provide an additional R5 to a wall assembly while significantly reducing the effects of thermal bridging. On a 2×4 in. at 16 in. on center stick frame construction with R13 batt insulation, this results in a 30% energy reduction of space conditioning site energy losses through the opaque wall assembly. Increasing the thickness of the exterior insulation sheathing only increases the energy savings. Furthermore, the addition of exterior insulation decreases the propensity for cold weather condensation forming on the back of the structural wall sheathing, as well as providing superior insulation performance by minimizing thermal bridging. These factors will reduce embodied energy through improved durability and lifespan and greatly reduce energy use for space conditioning for the life of the enclosure. 1 http://www1.eere.energy.gov/buildings/building_america/program_goals.html

3
The implementation of outboard insulation wall systems is easily included into any residential building retrofits with only minor detailing required around wall penetrations and fenestration. Used in conjunction with other recommended high-R-value systems (Straube and Smegal, 2009), the use of permeable exterior insulating sheathing can significantly reduce the space conditioning energy consumption of residential homes helping to meet the Building America goals of 30%-50% energy use reduction.
1.4 Cost-Effectiveness To ensure the cost-effectiveness of the retrofit proposals, a detailed BEopt analysis was conducted. Each proposed wall assembly will be assigned a cost relative to standard construction. These costs will be developed in partnership with BSC’s prototype and community builders.
It is important to note that, should an exterior insulating strategy be adopted for a building rehabilitation project, the incremental costs of adding a nominal thickness of exterior insulation and application of a WRB with the desired vapor permeability will be very small, as the costs of the cladding, sheathing, etc., already included as part of the building rehabilitation. However, if the sole intent of the retrofit is to increase the overall wall R-value, then the associated costs of the proposed retrofit will be significantly higher.
It cannot be ignored that an initially slightly more expensive system may have to be implemented to save a significant amount of energy over the entire life of the structure, which will be much longer than a standard mortgage. Research has shown that walls exceeding an R-value of 35 can financially pay back during the life of the initial mortgage through energy savings while reducing greenhouse gases (Grin, 2008). Because the building enclosure is designed to use less energy, the energy and greenhouse gas emissions savings extend for the life of the building, not just the duration of the initial mortgage or retrofit loan.
Improving the moisture tolerance and durability of an assembly will also add into the equation of life cycle cost analysis, as decreases in expenditures will be required for repairs and remediation caused by biodegradation. Furthermore, the longer the assembly lasts, the more energy it will use over its lifetime and the more the initial energy efficiency savings will accrue. Proper detailing of the assembly is also important to ensure that, over the life of the assembly as components require replacement (such as windows and doors), the assembly easily allows these replacements without risking damage.

4
1.5 Tradeoffs and Other Benefits The benefits of the use of properly detailed and installed vapor-permeable exterior insulation in retrofit applications with vapor-permeable cavity insulation, as compared to a code wall, are as follows:
Higher R-value
Lower space conditioning costs
Enhanced durability and enclosure lifespan
Increased airtightness
Increased occupant comfort.
Each of these components are interconnected. The increased R-value and airtightness improve energy efficiency and occupant comfort through reducing drafts and improving surface temperatures. The added durability of the system reduces maintenance requirements, increases the lifespan of the structure, and tolerance to the possible operating conditions within the home.
2 Experiment
2.1 Research Question The following research questions were answered by this project.
1. What insulating sheathings are available for retrofit applications, what are their material characteristics as they relate to thermal resistance and vapor permeance, and what kind of cladding attachments can be used?
2. What are the characteristics of existing assemblies? (Note: we will characterize the two most common assemblies that are likely to be retrofit in the cold and hot climate zones.)
3. What range of cladding types are common for existing assemblies?
4. What types of interior vapor control layers are common and what are the permeances of these?
5. What is the airtightness of these assemblies?
6. What are the likely retrofit solutions and what guidelines should be established for the airtightness, water control, thermal performance and vapor permeance?
7. What are the recommended solutions? (Note: we will identify how the functions of the building enclosure (air control, etc.) are served by the retrofit layers)
2.2 Literature Review In the literature, an ASHRAE Research Project RP-1235, The Nature, Significance, and Control of Solar-Driven Water Vapor Diffusion in Wall Systems, by D. Dérome, A. Karagiozis, and J. Carmeliet (2010) was found. In it, it synthesises results from small and large scale laboratory testing, field testing, and computer simulations. The experimental testing was conducted by

5
initially wetting the cladding material and then exposing it to cyclical heating cycles to simulate the radiative heating from the sun. Sensors and scales were utilized to quantify the moisture accumulation through the depth of the test walls. A total of 18 walls were tested, including variations on the interior vapor control (either latex paint of vinyl wall coverings), as well as difference in permeability of exterior WRBs.
Some of the key discoveries from this research project include that warm and mixed climates pose a risk to vapor-permeable wall assemblies. Further, the occurrence of rain, followed by sun, a liquid-absorbing cladding, and the presence of an air cavity, resulted in large inward vapor flows.
Similar results were obtained by Wilson 1965, TenWolde and Mei 1985, Straube and Burnett 1995, Pressnail et al. 2003, Dérome et al. 2010, Dérome and Saneinejad, 2010, Carmeliet and Dérome, 2012.
2.3 Technical Approach A literature review was conducted to assess the relevant properties of moisture related concerns of vapor-permeable insulations. Subsequently, hygrothermal modeling software was utilized to evaluate the thermal and hygric properties of the proposed assemblies. The hygrothermal modelling software chosen was WUFI 5, by the Fraunhofer Institute and Oak Ridge National Laboratory. The modeling will be used to determine the most important properties of the wall assembly and local climate, which dictate the tendency for inward and outward driven moisture potentials..
Due to the focused scope of the research, only wall assemblies with reservoir claddings with vapor-permeable cavity insulation (thus necessitating stick-frame construction) were simulated and analysed. Unfortunately, this precludes other types of wall assemblies and does not properly represent certain climate zones that favour alternative building structures, such as concrete block.
The goal of the simulations is to determine an optimal range of vapor permeances for the WRBs and thickness of the vapor permeable exterior insulation such that moisture flows are controlled and throttled to safe levels. Idealized materials (i.e. a WRB with vapor permeance of 1, 3, 5, 7, etc), are utilized to obtain the range of optimal vapor permeances and comparable and readily available products on the market are selected based on how closely they comply with the suggested vapor permeance.
2.3.1 Mechanisms of Moisture Damage and Relevant Forces The concerns related to vapor-permeable wall assemblies with moisture sensitive material are the inward and outward flows of moisture, primarily by vapor diffusion and convection. Inward driven moisture is a result of precipitation being stored in the cladding and water vapor pressure differentials, created by high temperature differentials, being forced into the wall. The equation defining the vapor flow rate is shown in Equation 1 (Carmeliet & Dérome, 2012).

6
∙ (1)
where,
gv = vapor flow rate [kg∙m‐2∙s‐1]
δ = vapor diffusion coefficient [kg∙Pa‐1∙m‐2∙s‐1]
T=temperature [K]
pv= vapor pressure [Pa]
pv,sat=saturated vapor pressure [Pa]
φ= pv/pv,sat(T), relative humidity
This equation is a modified form of Fick’s Law that describes isothermal vapor flows with RH and temperature as the driving force. The first term defines the flow caused by difference in RH, and the second term defines the flow caused by temperature gradients.
Various components of the wall assembly restrict the vapor flows. Predominantly, this restriction of flow is created by the WRB or the structural sheathing (OSB or plywood). Some wall assemblies also feature polyethylene sheet immediately on the exterior of the interior gypsum wall board (GWB), which inhibits the ingress of the moisture into the conditioned space. Depending on the vapor permeance of the WRB, outward moisture flows may also create a moisture risk to the wall assembly. Structural sheathing below the dew point may result in the formation of condensation from vapor diffusion or air leakage. The use of exterior insulating sheathing increases the sheathing temperature and may result in sheathing temperatures above the dewpoint of the interstitial air, which reduces condensation risk.
The factors that affect moisture flows through wall assemblies, in approximate order of magnitude as discovered through the simulations contained within this report, are:
Climate
Micro-climate
Presence and thickness of exterior insulation
Vapor permeance of the WRB
Other factors, including interior RH, material resistance to moisture decay, etc.
Climate and Microclimate
The climate and microclimate, that is, the climate immediately adjacent to the wall surface, generate the exterior conditions of the wall assembly. Climates with high moisture loading and significant solar radiation pose a greater moisture damage threat to wall assemblies. Contrarily, wall assemblies located in dry climates with very little precipitation are much less likely to experience moisture decay. The microclimate also significantly modifies the wall’s environmental exposure. Areas that are protected from precipitation by items such as large overhangs, or are not exposed to solar radiation, are less likely to experience inward driven moisture.
7
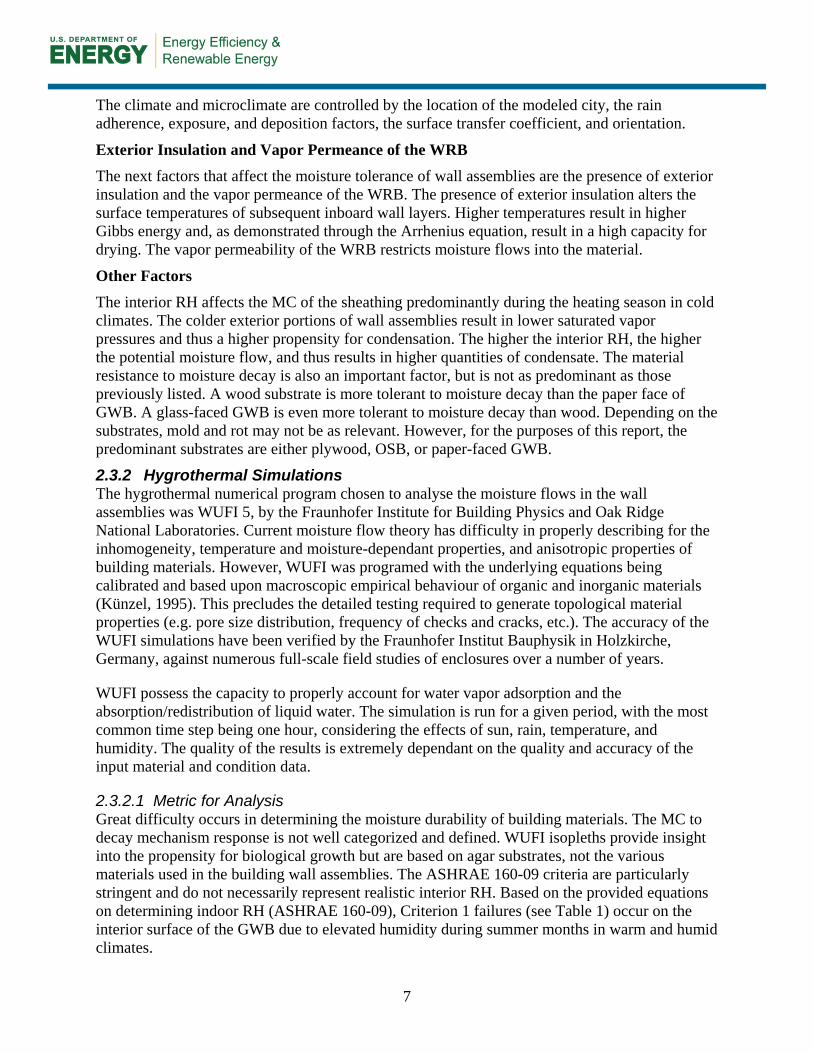
The climate and microclimate are controlled by the location of the modeled city, the rain adherence, exposure, and deposition factors, the surface transfer coefficient, and orientation.
Exterior Insulation and Vapor Permeance of the WRB
The next factors that affect the moisture tolerance of wall assemblies are the presence of exterior insulation and the vapor permeance of the WRB. The presence of exterior insulation alters the surface temperatures of subsequent inboard wall layers. Higher temperatures result in higher Gibbs energy and, as demonstrated through the Arrhenius equation, result in a high capacity for drying. The vapor permeability of the WRB restricts moisture flows into the material.
Other Factors
The interior RH affects the MC of the sheathing predominantly during the heating season in cold climates. The colder exterior portions of wall assemblies result in lower saturated vapor pressures and thus a higher propensity for condensation. The higher the interior RH, the higher the potential moisture flow, and thus results in higher quantities of condensate. The material resistance to moisture decay is also an important factor, but is not as predominant as those previously listed. A wood substrate is more tolerant to moisture decay than the paper face of GWB. A glass-faced GWB is even more tolerant to moisture decay than wood. Depending on the substrates, mold and rot may not be as relevant. However, for the purposes of this report, the predominant substrates are either plywood, OSB, or paper-faced GWB.
2.3.2 Hygrothermal Simulations The hygrothermal numerical program chosen to analyse the moisture flows in the wall assemblies was WUFI 5, by the Fraunhofer Institute for Building Physics and Oak Ridge National Laboratories. Current moisture flow theory has difficulty in properly describing for the inhomogeneity, temperature and moisture-dependant properties, and anisotropic properties of building materials. However, WUFI was programed with the underlying equations being calibrated and based upon macroscopic empirical behaviour of organic and inorganic materials (Künzel, 1995). This precludes the detailed testing required to generate topological material properties (e.g. pore size distribution, frequency of checks and cracks, etc.). The accuracy of the WUFI simulations have been verified by the Fraunhofer Institut Bauphysik in Holzkirche, Germany, against numerous full-scale field studies of enclosures over a number of years.
WUFI possess the capacity to properly account for water vapor adsorption and the absorption/redistribution of liquid water. The simulation is run for a given period, with the most common time step being one hour, considering the effects of sun, rain, temperature, and humidity. The quality of the results is extremely dependant on the quality and accuracy of the input material and condition data.
2.3.2.1 Metric for Analysis Great difficulty occurs in determining the moisture durability of building materials. The MC to decay mechanism response is not well categorized and defined. WUFI isopleths provide insight into the propensity for biological growth but are based on agar substrates, not the various materials used in the building wall assemblies. The ASHRAE 160-09 criteria are particularly stringent and do not necessarily represent realistic interior RH. Based on the provided equations on determining indoor RH (ASHRAE 160-09), Criterion 1 failures (see Table 1) occur on the interior surface of the GWB due to elevated humidity during summer months in warm and humid climates.

8
To restrict concerns over moisture failure criteria, a relative comparison is utilized instead. This eliminates concerns over the absolute accuracy of the wall assembly and is better suited to compare the moisture performance of the different wall assemblies. This approach is preferred as this is a comparative study of the effects of different vapor permeances and insulation levels of wall assemblies.
The MC of a thin slice (4mm) of the OSB on the interior and exterior faces is obtained from the simulations on an hourly basis. Only data from the second year of modelling, after verifying that first year effects were negligible, is analyzed, to minimize the effects of construction moisture. A thin slice moderates the surface MC such that the averaging function of the software does not artificially reduce the actual MC with the dryer core. To compare the results, the number of hours occurring between 5°C (41°F) to 40°C (104°F) at MC above 28% for wood substrates are calculated. Similar calculations are made for MCs above 24% and 20%. However, for GWB, due to the sensitivity of the paper facers, the ASHRAE 160 criteria will be utilized (less than 80% RH over 30 days).
The failure criteria according to ASHRAE 160-09 are listed in Table 1.
Table 1. ASHRAE 160 Failure Criteria.
Criteria Description Criterion 1 30-day running average surface RH <80%
when the 30-day running average surface temperature is between 5°C (41°F) and 40°C (104°F)
Criterion 2 7-day running average surface RH <98% when the 7-day running average surface temperature is between 5°C (41°F) and 40°C (104°F)
Criterion 3 24-h running average surface RH <100% when the 24-h running average surface temperature is between 5°C (41°F) and 40°C (104°F)
The testing will not include extreme values usually associated with major disasters such as hurricanes or 1/100 year temperatures.
2.3.2.2 Identification of Topology and Boundary Conditions A typical wall assembly was first identified by inspecting typical building wall assembly types that would be prone to inward vapor drives and that fall within the purview of this research project (i.e. in need for recladding, rehabilitation, or improvement of the thermal performance of the building). The purpose of this wall assembly is for preliminary modeling to determine relevant factors that affect the moisture load on the wall assembly. Such factors include the identification of an appropriate cladding and orientation.
This wall (Figure 1) is made up of a brick cladding, a ¾ in. air space (with 4 ACH venting), two layers of #15 felt, 7/16 in. OSB, 2×4 stick framing with R13 fiberglass batt, ½ in. GWB, and latex paint (set to a vapor resistance of 10 perms (Class III)). According to Table R601.3.1 (IRC, 2009), a class III vapor retarder may be used as the cavity space is ventilated and the location is in climate zone 5.

9
Figure 1. Base case wall assembly.
The boundary conditions aid in the generation of the moisture loads and fluxes on the wall assembly. A theoretical two story residential home, in a moderately wind exposed area with no shading from adjacent structures or objects, was designed. The values for the boundary conditions are shown in Table 2.

10
Table 2. Boundary Conditions.
Boundary Conditions Value Notes Wall Orientation E/SE/S/SW/W Worst case orientation for inward driven
moisture depends on climate Wall Inclination 90° Rain Exposure Factor 0.9 From Straube and Burnett, 2005 Rain Deposition Factor 0.5 From Straube and Burnett, 2005 Rain Adherence Factor 1 Rain adherence accounted for in rain load
calculation Exterior Surface Heat Transfer Coefficient
0.33 (0.0588) °F∙ft2∙h∙Btu-1 (m2K/W)
Short Wave Radiation Absorptivity
0.68 For red brick
Long-Wave Radiation Emissivity
0.9
Interior Surface Heat Transfer Coefficient
0.71 (0.125) °F∙ft2∙h∙Btu-1 (m2K/W)
Int. Water Vapor Resistance 0.3 In meters of equivalent still air. Represents the vapor resistance of latex paint (10 perms).
To determine the orientation and cladding type, preliminary modeling was conducted with the above hypothetical wall in select cities. These cities, seen in Table 3, were representative for a range of climate zones. The embedded weather files in WUFI were used for this modeling. The interior temperature and RH utilized in the modeling are also included in Table 3. The temperature and RH vary sinusoidally over the period of a year, with the amplitude indicated with the ± symbol. The temperature peaks on July 20, whereas the RH peaks on August 20. These values were selected based on BSC experience and recorded data.
Table 3. Simulated Cities and HDD and CDD Data (ASHRAE, 2009).
City DOE Climate Zone
HDD-65°F (18.3°C)
CDD-65°F (18.3°C)
Indoor Temperature °F (°C)
Indoor RH (%)
International Falls, MN
7 10487 (5826) 248 (138) 70±2 (21±1) 30±10
Chicago, IL 5A 6311 (3506) 842 (468) 70±2 (21±1) 40±10 St. Louis, MO 4 4504 (2502) 1631 (906) 70±2 (21±1) 40±10 Seattle, WA 4C 4729 (2627) 176 (98) 70±2 (21±1) 45±5 Atlanta, GA 3 2990 (1661) 1667 (926) 72±2 (22±1) 45±5 Miami, FL 1A 130 (72) 4459 (2477) 72±2 (22±1) 55±5 The orientation was determined by running the wall assembly in the above cities at all the cardinal orientations from East to West. The yearly average MC of the sheathing was determined and compared between each of the orientations. The orientation that resulted in the highest yearly average MC was deemed to be the “worst case” orientation for the wall assembly in that given climate.
11
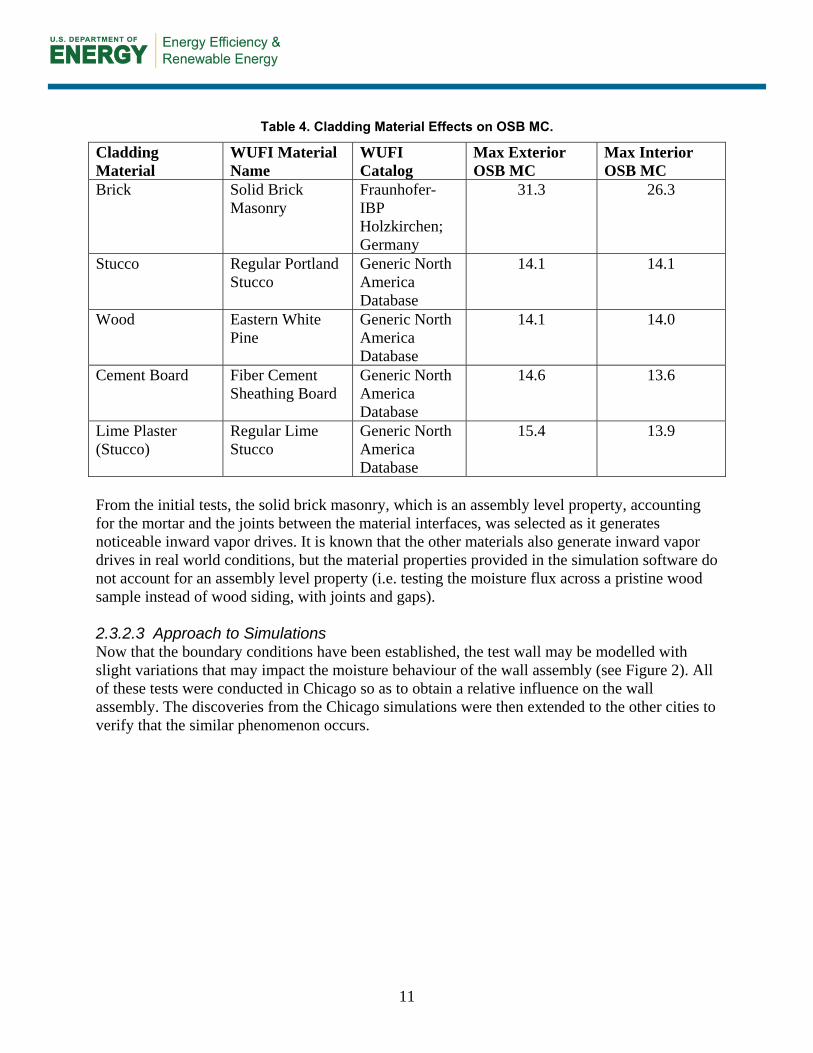
Table 4. Cladding Material Effects on OSB MC.
Cladding Material
WUFI Material Name
WUFI Catalog
Max Exterior OSB MC
Max Interior OSB MC
Brick Solid Brick Masonry
Fraunhofer-IBP Holzkirchen; Germany
31.3 26.3
Stucco Regular Portland Stucco
Generic North America Database
14.1 14.1
Wood Eastern White Pine
Generic North America Database
14.1 14.0
Cement Board Fiber Cement Sheathing Board
Generic North America Database
14.6 13.6
Lime Plaster (Stucco)
Regular Lime Stucco
Generic North America Database
15.4 13.9
From the initial tests, the solid brick masonry, which is an assembly level property, accounting for the mortar and the joints between the material interfaces, was selected as it generates noticeable inward vapor drives. It is known that the other materials also generate inward vapor drives in real world conditions, but the material properties provided in the simulation software do not account for an assembly level property (i.e. testing the moisture flux across a pristine wood sample instead of wood siding, with joints and gaps). 2.3.2.3 Approach to Simulations Now that the boundary conditions have been established, the test wall may be modelled with slight variations that may impact the moisture behaviour of the wall assembly (see Figure 2). All of these tests were conducted in Chicago so as to obtain a relative influence on the wall assembly. The discoveries from the Chicago simulations were then extended to the other cities to verify that the similar phenomenon occurs.

12
Figure 2. Typical wall assembly with exterior insulation.
The variables that are to be modulated may be found in Table 5.
13
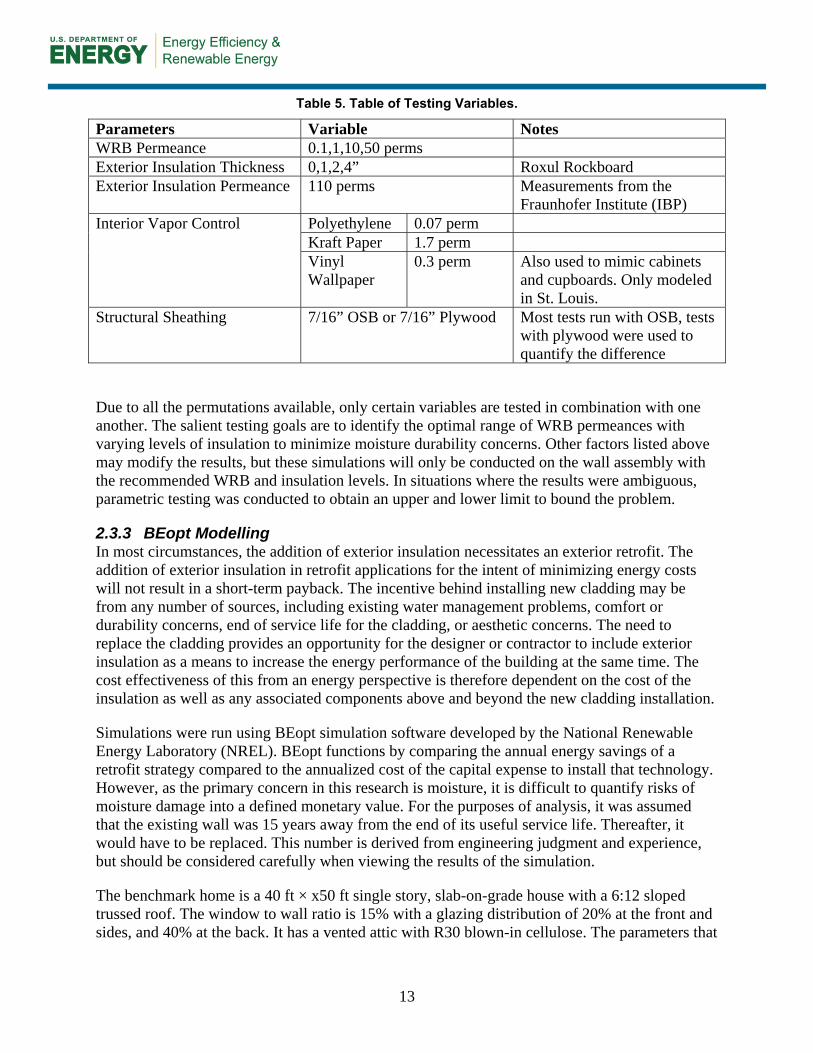
Table 5. Table of Testing Variables.
Parameters Variable NotesWRB Permeance 0.1,1,10,50 perms Exterior Insulation Thickness 0,1,2,4” Roxul Rockboard Exterior Insulation Permeance 110 perms Measurements from the
Fraunhofer Institute (IBP) Interior Vapor Control Polyethylene 0.07 perm
Kraft Paper 1.7 perm Vinyl Wallpaper
0.3 perm Also used to mimic cabinets and cupboards. Only modeled in St. Louis.
Structural Sheathing 7/16” OSB or 7/16” Plywood Most tests run with OSB, tests with plywood were used to quantify the difference
Due to all the permutations available, only certain variables are tested in combination with one another. The salient testing goals are to identify the optimal range of WRB permeances with varying levels of insulation to minimize moisture durability concerns. Other factors listed above may modify the results, but these simulations will only be conducted on the wall assembly with the recommended WRB and insulation levels. In situations where the results were ambiguous, parametric testing was conducted to obtain an upper and lower limit to bound the problem.
2.3.3 BEopt Modelling In most circumstances, the addition of exterior insulation necessitates an exterior retrofit. The addition of exterior insulation in retrofit applications for the intent of minimizing energy costs will not result in a short-term payback. The incentive behind installing new cladding may be from any number of sources, including existing water management problems, comfort or durability concerns, end of service life for the cladding, or aesthetic concerns. The need to replace the cladding provides an opportunity for the designer or contractor to include exterior insulation as a means to increase the energy performance of the building at the same time. The cost effectiveness of this from an energy perspective is therefore dependent on the cost of the insulation as well as any associated components above and beyond the new cladding installation.
Simulations were run using BEopt simulation software developed by the National Renewable Energy Laboratory (NREL). BEopt functions by comparing the annual energy savings of a retrofit strategy compared to the annualized cost of the capital expense to install that technology. However, as the primary concern in this research is moisture, it is difficult to quantify risks of moisture damage into a defined monetary value. For the purposes of analysis, it was assumed that the existing wall was 15 years away from the end of its useful service life. Thereafter, it would have to be replaced. This number is derived from engineering judgment and experience, but should be considered carefully when viewing the results of the simulation.
The benchmark home is a 40 ft × x50 ft single story, slab-on-grade house with a 6:12 sloped trussed roof. The window to wall ratio is 15% with a glazing distribution of 20% at the front and sides, and 40% at the back. It has a vented attic with R30 blown-in cellulose. The parameters that

14
were controlled were the wall assembly and infiltration. All other parameters had the BEopt 1.3 default values.
For the comparison in the model, either the existing wall was retrofitted with exterior insulation and a new WRB, or the standard wall was replaced after 15 years. Table 6 shows the per unit area cost for the improvements (including material and installation costs), whereas Table 7 shows the improved airtightness of the building as a result of standard air sealing techniques in combination with a new WRB. These values were selected based on predefined numbers included in BEopt and on anticipated achievable tightness levels in retrofit homes. Table 8 indicates the references cities that were used for the modelling.
Table 6. Cost per Square Foot for Wall Options.
Wall Assembly Additional Cost per Ft2 Sheet WRB Premium Sheet WRB Self-Adhering
Membrane Replacement Standard Wall
$3.81 $3.90 $4.34
Replacement Standard Wall + 1 in. MFI
$4.42 $4.62 $5.29
Existing Wall +1 in. MFI $0.83 $1.03 $1.70 Existing Wall +1.5 in. MFI $0.94 $1.26 $2.27 Exiting Wall + 4 in. MFI $1.74 $0.62 $0.97
Table 7. Airtightness by Water Resistive Barrier.
Water Resistive Barrier Airtightness (ACH50) Typical Existing 10.3 Typical Sheet WRB 3.7 Premium Sheet WRB 3.7 Self-Adhering Membrane 1.9
Table 8. Reference Cities.
Reference Cities Chicago, IL Duluth, MN Miami, FL
Seattle, WA
Cost data for the various wall components were taken from RS Means Construction Data (2012 Reed Construction Data). Costs that were not included were inferred based on engineering judgment, internal costing analysis, and from input from Building America builder partners.
3 Results and Analysis

15
3.1 Hygrothermal Simulations Hygrothermal simulations were conducted to identify the relative impact of a multitude of boundary conditions, building material properties, and topologies that impact the moisture durability of the wall assembly.
The first series of simulations demonstrate thevariations of the MC of a thin exterior and interior slice of the OSB sheathing with a 0.1, 1, 10, and 50 perm WRB with 0 in. of exterior insulation and 1 in. of exterior insulation, using only latex paint as vapor control (see Figure 3 to Figure 6). These figures demonstrate the the annual fluctuation of MCs. From these plots, we may observe that the addition of insulation drastically reduces the MC, particularly on the interior side of the OSB (outward flowing moisture during the winter months). The resultant sheathing MC in this analysis is from vapor diffusion only and does not account for possible air leakage condensation. The labelling system is first characterized by the cladding type: the thickness of exterior insulation; the permeability of the WRB; and finally, a letter indicating any additional properties (i.e. P for polyethylene sheet, K for kraft paper, V for vented). An example of a wall assembly with brick cladding, with 2 in. of exterior insulation, a 10 perm WRB, and Kraft faced batt insulation would be: Brick-2-10-K.
Figure 3. Exterior side MC of structural sheathing with no exterior insulation in Chicago.

16
Figure 4. Interior side MC of structural sheathing with no exterior insulation in Chicago.
Figure 5. Exterior side of structural sheathing MC with 1 in. of exterior insulation.

17
Figure 6. Interior side of structural sheathing MC with 1 in. of exterior insulation.
The figures show that even 1 in. of exterior insulation significantly reduces the MC of the OSB sheathing on both the exterior and interior sides of the OSB (Figure 5 and Figure 6 vs Figure 3 and Figure 4). When the yearly average MC of the OSB sheathing (both interior and exterior slices) for wall assemblies with 0 in., 1 in., and 2 in. of exterior insulation is plotted against the vapor permeance of the WRB, Figure 7 and Figure 8 are produced. The minimum value of the curves on these plots indicates the optimal range for the vapor permeance of the WRBs. The most important factor to observe is that adding exterior insulation benefits the wall insulation more significantly than optimizing the vapor permeance of the WRB (with some slight exceptions at high vapor permeances).

18
Figure 7. Average exterior side sheathing MC for 0 in., 1 in., 2 in., and 4 in. of exterior insulation at various WRB permeances.
Figure 8. Average interior side sheathing MC for 0 in., 1 in., 2 in., and 4 in. of exterior insulation at various WRB permeances.

19
The yearly average numbers all fall well below the 19% MC, a moisture level that is considered safe by many industry experts. Investigating the peak MCs may, however, reveal any potentially dangerous MC levels in the sheathing. Similarly, plotting the peak MC versus the vapor permeance of the WRBs, for both exterior and interior thin slices of the OSB and at varying levels of insulation, produces Figure 9 and Figure 10.
Figure 9. Peak exterior side sheathing MC for 0 in., 1 in., 2 in., and 4 in. of exterior insulation at
various WRB permeances.

20
Figure 10. Peak interior side sheathing MC for 0 in., 1 in., 2 in., and 4 in. of exterior insulation at
various WRB permeances.
Figure 7 to Figure 10 demonstrate the yearly average and peak MC experienced over the entire year of the OSB for both the interior and exterior faces. Any peak MC exceeding 28% indicates that the sheathing may be at risk. From these plots, it can be seen that the best method to decrease sheathing MC is the use of exterior insulation. The permeance of the WRB becomes secondary, with the exception of highly vapor permeable WRBs. It can also be seen that a pattern emerges with the exterior insulation: it performs better with more vapor tight wall assemblies. Vapor-permeable WRBs enable interior moisture to penetrate through the insulation during inward driven moisture events. Higher amounts of exterior insulation result in increased sheathing temperatures. It is hypothesized that this minimizes the effects of solar drying on occasions when the cladding is not saturated by keeping the sheathing closer to interior conditions.
By identifying critical wall assemblies where the peak MC of the sheathing occurs at dangerous moisture levels, further analysis can be conducted to identify the number of hours that are experienced at such levels. The following biodegradation risk plots were produced by determining the number of hours at which the MC exceeds 20%, 24%, and 28% MC for temperature ranges between 5°C to 40°C. These plots function as an hourly histogram with a 5°C range. The more hours that the wall experiences above 28% MC, the higher the risk. The number of hours below 20% do not pose a concern to the sheathing and are thus not counted.
A relative impact on the potential for moisture damage can be conducted by comparing the number of hours that the sheathing experiences over a year for each different proposed WRB and insulation thickness variable. With these simulations, only four such critical wall assemblies were identified. For the exterior side of the sheathing: 0 in.-50 perms, and 1 in.-50 perms. For the

21
interior side of the sheathing: 0 in.-50 perm, and 0in. ”-0.1 perm. These may be found from Figure 11 to Figure 14, respectively.
Figure 11. Biodegradation risk plot for the exterior side of the sheathing, with 0 in. exterior insulation and 50 Perm WRB.
Figure 12. Biodegradation risk plot for the exterior side of the sheathing, with 1 in. of exterior
insulation and 50 Perm WRB.

22
Figure 13. Biodegradation risk plot for interior side of the sheathing, with 0 in. of exterior
insulation and 50 Perm WRB.
Figure 14. Biodegradation risk plot for interior side of the sheathing, with 0 in. of exterior
insulation and 0.1 Perm WRB.
Table 9 summarizes the number of hours that the OSB experiences above 28% MC at temperatures between 5°C and 40°C. On the interior side, the peak MC never exceeded 28% MC

23
with wall assemblies with even 1 in.exterior insulation. For assemblies with exterior insulation, only highly permeable WRBs result in any duration exhibiting prolonged elevated MC.
Table 9. Hours above 28% MC for Identified Wall Assemblies.
Wall Assembly Location Hours above 28% MC 0”-50 perm Exterior 379 1”-50 perm Exterior 42 1”-10 perm Exterior 0 0”-0.1 perm Interior 37 0”-50perm Interior 250 1”-50 perm Interior 0
Consequently, the results from these simulations suggest that the addition of at least 1 in. of vapor permeable R-4 exterior insulation in the Chicago climate is sufficient to minimize decay mechanisms. This is particularly the case on the interior of the OSB. The exception is that highly permeable WRBs may still result in high MC on the exterior surface of the OSB, even with 1 in. of vapor-permeable exterior insulation. However, the duration that the OSB experiences at risk of decay with 1 in. of exterior insulation is still significantly less than with no exterior insulation.

24
Variations on a Theme: Interior Vapor Control As shown inthe biodegradation risk plots above, the use of exterior insulation aids in the control of the MC of the OSB sheathing. However, restricting the outward flow of moisture could also be controlled to minimize elevated MC. The following plots were produced with the use of interior vapor control. The vapor control strategies were the use of polyethylene sheet and Kraft paper. These simulations were conducted with no cladding ventilation, but still comply with the IRC. Vinyl wall coverings (VWC) provide outward vapor control, but significantly inhibit inward vapor control. Furthermore, they are not a common method of intentional vapor control in wall assemblies and featured more frequently on commercial construction. Consequently, VWC will be considered separately.
Figure 15. Average exterior side sheathing MC for 1 in., 1 in.+ Poly, and 1 in.+ Kraft at various
WRB permeances.

25
Figure 16. Peak exterior side sheathing MC for 1 in., 1 in.+ Poly, and 1in.+ Kraft at various WRB
permeances.
Figure 17. Average interior side sheathing MC for 1 in., 1 in.+ Poly, and 1 in.+ Kraft at various WRB
permeances.

26
Figure 18. Peak interior side sheathing MC for 1 in., 1 in.+ Poly, and 1 in.+ Kraft at various WRB
permeances
When additional interior vapor control is considered (beyond latex paint), the sheathing MC increases noticeably at high WRB permeances. In very vapor-permeable WRBs (i.e. 50 perms), the increase is significant. The use of polyethylene sheet or Kraft paper effectively traps the moisture within the wall cavity. The vapor pressure gradient across the wall assembly when the brick is heated by the sun is very high, thus forcing water past the WRB and OSB and into the wall assembly. However, once the cladding temperature decreases and drying takes place, there is insufficient driving potential for that moisture to fully leave the system. The addition of interior vapor control restricted any capacity for the moisture to dry to the interior. Consequently, the moisture gets trapped within the wall cavity and results in dangerously high MC To quantify the severity of the MC, a histogram was created, as seen in Figure 19 to Figure 22. The critical points identified from the MC plots are 1 in. of exterior insulation with 50 perm WRB, both with polyethylene sheet and Kraft paper.

27
Figure 19. Biodegradation risk plot for exterior side of the sheathing, with 1 in. of exterior
insulation and 50 Perm WRB and polyethylene sheet interior vapor control.
Figure 20. Biodegradation risk plot for interior side of the sheathing, with 1 in. of exterior
insulation and 50 Perm WRB and polyethylene sheet interior vapor control.

28
Figure 21. Biodegradation risk plot for exterior side of the sheathing, with 1 in. of exterior
insulation and 50 Perm WRB and Kraft interior vapor control.
Figure 22. Biodegradation risk plot for interior side of the sheathing, with 1 in. of exterior
insulation and 50 Perm WRB and Kraft interior vapor control.
The results from the use of interior vapor control layers are summarized in Table 10

29
Table 10. Hours above 28% MC for Identified Wall Assemblies with Interior Vapor Control.
Wall Assembly Location Hours above 28% MC 1”-50 perm w/ Polyethylene Exterior 1312 1”-50 perm w/ Polyethylene Interior 1627 1”-50 perm w/ Kraft Exterior 1229 1”-50 perm w/ Kraft Interior 1202
The results from simulations for the interior vapor control strategies suggest that it actually increases the risk to the structural sheathing and that it may do more harm to the structural sheathing than good. The numbers of hours above 28% MC with vapor control far exceed the number of hours that preclude any form of vapor control. Consequently, the data suggests that increased levels of exterior insulation are a better outward vapor control strategy than the use of interior vapor retarding materials. The city selected for the VWC models was St. Louis, as it has a climate that clearly demonstrates the effects of elevated summer humidity while also achieving cooler temperatures in the winter. The same wall was modeled as in Chicago with the exception that a VWC was inserted on the interior layer. The RH on the outside layer of the GWB was monitored throughout the duration of the testing and a 7-day and 30-day running average was calculated. Prolonged durations of RH in excess of 80% may result in mold growth, as per ASHRAE 160-09. Figure 23 demonstrates that with VWC, the GWB will likely experience some form of mold growth.
Figure 23. Relative humidity adjacent to paper-faced GWB, iIncluding 7-day and 30-day running
average.

30
According to ASHRAE 160, the use of VWC in a mixed climate will result in Criterion 1 failure, with borderline failure of Criterion 2. VWC is not an effective use for outward vapor control and possess significant risk to the GWB in the wall assembly. Variations on a Theme- Plywood Structural Sheathing Plywood sheathing is a common building material to encounter in retrofit projects. It is more vapor permeable than OSB, particularly at higher relative humidities, and thus will allow a greater amount of moisture to pass through during periods of elevated moisture within the wall cavity. Consequently, it is important to model the recommendations from the simulations with plywood, to ensure that the conclusions still result in safe moisture levels in the sheathing.
Table 11. Peak and Yearly Average MC for Plywood Sheathing.
Wall Assembly Location Yearly Average MC (%) Peak MC (%) 1” MFI - 0.1 perm WRB Exterior 10.9 17.9
Interior 11.1 19.3 1” MFI -1 perm WRB Exterior 12.1 17.3
Interior 11.6 19.7 1” MFI -10 perm WRB Exterior 14.2 15.7
Interior 12.9 18.8 1” MFI -50 perm WRB Exterior 17.4 23.6
Interior 13.9 18.2 From Table 11, it can be seen that the peak MC with 1 in. of exterior insulation never exceeds 23.6% MC. This is contrasted by a peak of 29.3% MC for OSB. Thus, the increased permeability of the plywood enables the wall assembly to dry to a greater extent than OSB.
Table 12. Peak and Average Moisture for Plywood Sheathing with Polyethylene Sheet.
Wall Assembly Location Yearly Average MC (%) Peak MC (%) 1” MFI -0.1 perm WRB Exterior 15.1 17.0
Interior 14.7 16.8 1” MFI -1 perm WRB Exterior 17.2 19.5
Interior 17.0 20.5 1” MFI -10 perm WRB Exterior 20.8 28.1
Interior 26.0 48.8 1” MFI -50 perm WRB Exterior 21.9 28.9
Interior 34.1 55.5 The addition of polyethylene sheet in combination with plywood sheathing results in extremely high MC with 50 perm WRBs. However, in simulating this model with a non-absorptive cladding, the peak MC only achieves 21.5% MC. Thus, the elevated MC is a result of the reservoir cladding.
3.1.1 Climatic Effects The previous series of simulations was only conducted in a Chicago climate. To verify that the conclusions obtained from the previous testing equally apply to the other climate zones, additional simulations were run for the representative cities for each such climate zone.

31
Table 13. List of Cities and Associated Climate Zones.
City DOE Climate Zone
HDD-65°F (18.3°C)
CDD-65°F (18.3°C)
International Falls, MN
7 10487 (5826) 248 (138)
Chicago, IL 5A 6311 (3506) 842 (468) St. Louis, MO 4 4504 (2502) 1631 (906) Seattle, WA 4C 4729 (2627) 176 (98) Atlanta, GA 3 2990 (1661) 1667 (926) Miami, FL 1A 130 (72) 4459 (2477)
Plots of peak and yearly average MC on the interior and exterior sliver of OSB sheathing were produced for each of these cities. These are shown in Figure 24 to Figure 27.
Figure 24. Peak exterior side sheathing MC for listed cities with 1 in. of MFI exterior insulation at various WRB permeances.

32
Figure 25. Average exterior side sheathing MC for listed cities with 1 in. of exterior insulation at
various WRB permeances.
Figure 26. Peak interior side sheathing MC for listed cities with 1 in. of exterior insulation at
various WRB permeances.

33
Figure 27. Average interior side sheathing MC for listed cities with 1 in. of exterior insulation at various WRB permeances.
From these plots, it can be seen that 1 in. of additional exterior insulation maintains the MC well below dangerous levels in nearly every climate zone. The exception is very vapor-permeable WRBs, primarily in climate zone 1. The results of these simulations suggest that the addition of at least 1 in. of exterior insulation significantly helps improve the moisture durability of the wall assembly. However, highly vapor-permeable WRBs should be avoided when used with reservoir claddings and mineral fiber insulation (MFI) on the exterior. Consequently, WRBs below 10 perms and at least 1 in. of exterior insulation are recommended when used in combination with reservoir claddings in nearly every climate zone. Certain climate zones, such as 6 to 8, require additional exterior insulation. In summation, vapor-impermeable WRBs may be utilized only when at least 1 in. of exterior insulation is used in climate zones 1 through 5. A minimum of 2 in. (greater than R7.5) of exterior insulation should be used in climate zones 6 and 7. Climate zone 8 was not modeled in these simulations. 3.2 Energy and Cost Analysis The BEopt analysis consists of an average production Building America home with standard layout and form, average mechanical equipment, ENERGY STAR appliances, and average airtightness modeled in Chicago, Phoenix, Duluth, and Miami.
BEopt is a software created to optimize annual energy costs to an annualized capital cost. However, as this research project deals specifically with moisture, this parameter is difficult to model. The only conclusive method to attempt to categorize the effects on moisture damage on

34
the structure is to approach the structure from a life cycle analysis—determine the return period prior to rehabilitation of the structure as caused by moisture damage. Unfortunately, insufficient data exists on the estimated impacts of prolonged moisture exposure to wall assemblies to the duration of the building. A range of factors impact whether or not a building that has suffered moisture damage undergoes rehabilitation. Small leaks over a long duration do not frequently present noticeable symptoms of damage. Further, it is difficult to identify the distribution of damage in the existing building stock and to assess the cost for rehabilitation. In an attempt to categorize this phenomenon, BSC provided an estimate based on prior experience. However, the results from BEopt should only be considered under the assumptions discussed above.
Figure 28 and Figure 29 show the results from the BEopt simulations.
Figure 28. BEopt energy use for Chicago, Illinois.
Figure 29. BEopt results for Chicago, Illinois.
The results of the BEopt modelling show that in Chicago, the optimized level of exterior insulation is 1.5 in. of mineral board insulation. Every single modelled city also found that 1.5 in.

35
of exterior continuous mineral board insulation was optimal. Data relating to the BEopt outputs may be found in Appendix B.
4 Summary
To comply with initiatives to increase the energy efficiency of homes of the existing building stock in the United States, additional insulation and increased airtightness must be included as part of the renovation strategy. Many cost-effective approaches exist that result in increased insulation levels and improved airtightness. To achieve superior insulation levels, additional insulation must be either added to the interior or to the exterior of the existing wall. As the addition of exterior insulation is costly, only select circumstances warrant its inclusion: a severely deteriorated cladding that requires replacement, or an owner that desires to significantly improve the R-value of his building. One such material that could be utilized as exterior insulation is mineral board insulation.
There are concerns on the use of the moisture durability of wall assemblies with vapor-permeable exterior insulation, such as mineral fiber, in retrofit applications with existing walls that also possess vapor-permeable cavity insulation. Due to the vapor-permeable nature of the insulations in use, inward driven moisture poses a problem to wall assemblies under certain circumstance.s When used in combination with a reservoir cladding, that has been inundated by rain and then exposed to sunlight, inward driven moisture may penetrate through the exterior fiber insulation, through the WRB, and into the wall cavity assembly. The natural solution to eliminate inward driven moisture is to utilize an impermeable WRB to inhibit the inward flowing moisture. The complication arises when, in colder climates, outward flowing moisture is similarly inhibited by the same impermeable WRB. This results in elevated MC accumulated in the sheathing. The solution is to select an appropriate permeance of the WRB that sufficiently throttles inward moisture, but that does not inhibit outward drying of the wall assembly, should it get wet. This must also be considered in combination with the addition of the exterior insulation.
To identify the ideal range of permeance and exterior insulation, BSC conducted a series of hygrothermal simulations, addressing variables such as amount of exterior insulation, the vapor permeance of the WRB, different sheathing materials, and interior vapor control layers. The experiment was conducted to answer research questions that still persist in this area. The following questions and answers address this research.
What insulating sheathings are available for retrofit applications, what are their material characteristics as they relate to thermal resistance and vapor permeance, and what kind of cladding attachments can be used?
A range of insulating sheathings are available for retrofit applications. As the definition for this project entails vapor-permeable insulations, the IRC defines “vapor-permeable” as being greater than 5 perms. Mineral board and glass insulations fall within this category. They typically have an R-value in the range of R4 per inch and ome in rigid board format. These products are usually woven recycled slag or glass that is spun and adhered to form rigid boards. It typically possesses negligible vapor diffusion resistance (greater than 40 perms). However, as this material is vapor permeable, uncertainty exists over the moisture management of walls which utilized this product.

36
The insulating sheathing may be attached to the structure with a range of attachment mechanisms, from furring strips, to cap-nails.
What are the characteristics of existing assemblies? (Note: we will characterize the two most common assemblies that are likely to be retrofit in the cold and hot climate zones). What range of cladding types are common for existing assemblies?
The existing assemblies, as defined within this research project, typically consist of 2×4 framing spaced 16 in. on center, with R9 to R13 permeable cavity insulation, typically a fibre glass or cellulose type insulation. The structural sheathing may consist of either OSB or plywood. This is more typical of building stock from the 1980s and 1990s, but may also be from earlier buildings that have gone through previous rehabilitation efforts.
The cladding may range from vinyl or aluminum siding, to wood or fiber cement board siding, to brick and stucco, depending on local construction preferences. The concerns identified in this report are primarily due to inward driven moisture, which necessitates a reservoir style cladding. Consequently, this report is focused more on the use of brick or stucco cladding, but the conclusions may be extrapolated to non-moisture storing claddings as well.
What types of interior vapor control layers are common and what are the permeances of these?
Typical interior vapor control layers likely consist of either Kraft facers on the batt insulation (0.47 perm), polyethylene sheet (0.07perm), or latex paint (10 perm). Vinyl wall coverings (0.01perm) are sometimes also used, but are much less common.
What is the airtightness of these assemblies?
The airtightness of these existing assemblies depends greatly on previous rehabilitation or retrofit history. A range of values,from 6ACH50 and up may be found. Further research, including field blower door testing on existing building stock, is required to properly answer this question.
What are the likely retrofit solutions and what guidelines should be established for the airtightness, water control, thermal performance and vapor permeance?
Based on the scope of this project, the wall assemblies are already insulated and the intended retrofit cladding is of a reservoir type. The thermal performance should strive to achieve the relevant building code standards, including considerations for thermal bridging. The vapor permeance values are outlined within this report. The airtightness and water control require specific details that should be discussed in future measure guidelines.
What are the recommended solutions?
The content of this research assumes that reservoir claddings are exposed to the rain. The most severe wall orientation was identified to determine the worst case scenario with regards to inward driven moisture. Reservoir claddings that are protected from precipitation do not pose any greater threat to the moisture durability of the wall than non-absorptive types of cladding.

37
With the above caveats, BSC recommends using only WRBs that have a permeance of less than 10 perms, with at least 1 in. of MFI exterior insulation in climate zones 1 through 6, when used in combination with reservoir claddings that are exposed to precipitation.
The team found that WRBs with vapor permeances above 10 perms increase the MC of the structural sheathing. The use of vapor control layers within the wall, such as Kraft or polyethylene sheet on the interior, increase the risk for moisture damage within the wall by effectively trapping moisture within the wall. Consequently, BSC recommends using latex paint to inhibit outward flowing moisture in combination with exterior insulation to reduce any moisture damage potential.

38
References
ASHRAE Standard 160. (2009), Criteria for Moisture-Control Design Analysis in Buildings. Atlanta, American Society of Heating, Refrigerating, and Air-Conditioning Engineers, Inc.
ASHRAE (2009), Handbook of Fundamentals, Atlanta, American Society of Heating Refrigerating, and Air-Conditioning Engineers, Inc
Carmeliet, J., Dérome, D. (2012). Temperature driven inward vapor diffusion under constant and cyclic loading in small-scale wall assemblies: Part 1: experimental investigation/Part 2: heat-moisture transport simulations. Building and Environment 47, pp. 161-169.
Dérome, D., Saneinejad, S. (2010). Inward vapor diffusion due to high temperature gradients in experimentally tested large-scale wall assemblies. Building and Environment 45, pp. 2790-2797.
Dérome, D., Karagiozis, A., Carmeliet, J. (2010), The Nature, Significance and Control of Solar-Driven Water Vapor Diffusion in Wall Systems – Synthesis of Research Project, ASHRAE Research Project RP-1235.
Grin, A. (2008). “Evaluation of High Performance Residential Housing Technology”. University of Waterloo, Canada. Chapter 5 pages 77 – 89.
Pressnail K., J. Timusk, L. Kan, B. Doug, and V.Kan. (2003). In search of a wall for all seasons: controlling sun-driven moisture, Proceeding of the 95th Conference on Building Science and Technology, Vancouver, B.C.
Quirouette, R.L. (1985), The Difference between a Vapour Barrier and an Air Barrier, Building Practice Note No. 54, Division of Building Research, National Research Council of Canada; Ottawa, Ontario
Reed Construction Data (2011). RSMeans CostWorks 2011, 15th Annual Edition. Norwell, MA. Retrieved May 17, 2011. Straube, J.F. and E.F.P. Burnett. (1995). Moisture migration in screened wall systems, Proceedings of BETEC/ASHRAE/DOE Thermal Performance of Building Envelopes VI, pp. 177-188.
Straube, J.F., Smegal, J.E. (2009). Building American Special Research Project: High-R Walls Case Study Analysis, Research Report – 0903, revised June 8, 2011.
TenWolde, A., and H.T. Mei. (1985). Moisture movement in walls in a warm humid climate. Proceeding of ASHRAE/DOE/BTECC Thermal Performance of the Exterior Enevelopes of Buildings III, pp. 570-582. Atlanta: American Society of Heating, Refrigeration, and Air-Conditoning Engineers, Inc.
Wilson, A.G. (1960). Condensation Between Panes of Double Windows. Canadian Building Digest-5, Division of Building Research, National Research Council of Canada, Ottawa, Ontario

39
Wilson, A.G. (1961), Air Leakage in Buildings, Canadian Building Digest-23, Division of Building Research, National Research Council of Canada, Ottawa, Ontario
Wilson, A.G. (1965). Condensation in insulated masonry walls in the summer. Proceedings of RILEM/CIB Symposium, Helsinki DBR Tech Paper 226.

40
Appendix A – WUFI Material Properties
Would be helpful here to have a short introduction explaining the information contained in this appendix.
This appendix includes the material properties used in the hygrothermal simulations. These properties characterize the thermal and moisture behavior of the materials in the assembly. Material properties included are bulk density, porosity, heat capacity, thermal conductivity, water vapor diffusion resistance factor, reference water content, free water saturation content, and the liquid transport function. For materials that exhibit dependence on external or internal input (i.e. ambient relative humidity or moisture content), graphs are included to describe the relationship.

41

42

43

44

45

46

47

48

49

50

51

52
Appendix B – BEOpt Output Graphs
Ditto for this section. I did find the note in the report about this information being related to the BEopt outputs.
This appendix includes the output graphs from BEOpt. These optimization simulations identify the ideal level of insulation when analyzed from capital cost to operation and maintenance savings perspective over the building’s predetermined lifecycle. The plots for climate zones 1A (Miami, FL), 3 (Atlanta, GA), 4C (Seattle, WA), 4 (St. Louis, MO), 5A (Chicago, IL), and 7 (International Falls, MN). The plots demonstrate the relationship of operation and maintenance cost to the level of insulation. A decreasing trend exists in all models, but depending on the climate, the optimal level of insulation changes.

53
Chicago, Illinois

54
Phoenix, Arizona

55
Miami, Florida

56
Seattle, Washington

57
Duluth, Minnesota

DOE/GO-102013-3910 ▪ August 2013
Printed with a renewable-source ink on paper containing at least 50% wastepaper, including 10% post-consumer waste.
buildingamerica.gov

BA-1313: Moisture Durability with Vapor Permeable Insulating Sheathing
Direct all correspondence to: Building Science Corporation, 30 Forest Street, Somerville, MA 02143.
Limits of Liability and Disclaimer of Warranty:
Building Science documents are intended for professionals. The author and the publisher of this article have used their best efforts to provide accurate and authoritative information in regard to the subject matter covered. The author and publisher make no warranty of any kind, expressed or implied, with regard to the information contained in this article.
The information presented in this article must be used with care by professionals who understand the implications of what they are doing. If professional advice or other expert assistance is required, the services of a competent professional shall be sought. The author and publisher shall not be liable in the event of incidental or consequential damages in connection with, or arising from, the use of the information contained within this Building Science document.
About this Report
This report was prepared with the cooperation of the U.S. Department of Energy’s Building America Program.