Moisture Content and the CBR Method of Designonlinepubs.trb.org/Onlinepubs/sr/sr40/sr40-022.pdfTHE...
30
Moisture Content and the CBR Method of Design F. L. D. WOOLTORTON, Planning Engineer, Roads Branch, Ministry of Works, Nairobi, Kenya Colony · Introductory Remarks by the Chairman The essence of science is generalization or, as Poincare says, to give the same name to different things. The essence of engi- neering is to use science, experience and constructive genius toward an economical solution of a specific problem. While there will never be a substitute for constructive genius, considerations of economy move us to expand science in such a way that it will cover more and more of the area for which experience is required at the present time. In road construction, experience still holds a large sway in the adequate understanding of soil and other con- struction materials and of the effect of climate on the performance and service life of material structures. One of the outstanding pioneers in expanding science into the area that is still essentially dominated by empiricism is Colonel Wooltorton, who has a large and intensive experience as a road builder in various climates. In his long and distinguished career, Colonel Wooltorton has al- ways endeavored to understand scientifically the complex phenomena encountered by him and others and to coordinate them into a logical system as a first and necessary step toward a true science of ra- tional road construction applicable to all climatic regions. In his present contribution, Colonel Wooltorton makes available to us his conclusions on the relationship between the moisture economy in soils and the proper use of the CBR method of design based on long experience and much good thinking. THE CBR TEST e THE CBR test involves the compaction of a sample, in a manner specified by one of several standardized techniques, at a predetermined or ascertained moisture content and to a predetermined or ascertained density; and the penetration of the sample, in its existing state or after soaking, by a plunger at a given rate to give a specified de- formation under a measured load. The value measured, for use in design, is the load or the resistance of the plwiger to penetration. It may be considered as an indication of the strength of the material in the form of its resistance, under the conditions of test, to shear deformation or plastic flow. The measured load is expressed as a per- centage of the resistance obtained from a like penetration of a standard material and is referred to as the California Bearing Ratio. The required pavement thickness is determined from this CBR percentage by a method which is essentially empirical. The bearing ratio value is entered into an ap- propriate loading curve to give the required thickness. Originally there was only one curve which became known as the curve for "light traffic" or the 7, 000 lb wheel load curve. With accumulated experience a second curve, for "medium heavy traffic," or for a 12,000-lb wheel load, was added (22, 23). These took the form of the more modern variations shown in Figure 1. - - THE DEVELOPMENT OF THE TEST The test was devised by the California Division of Highways in or about 1929 for the original purpose of comparing base and subbase course · materials and only later for the evaluation of subgrades, but it was not until 1940, when the U.S. Corps of Engineers adopted the test as the most convenient one for use in connection with its wartime air- field construction program, that the method was intensively developed. 268
Transcript of Moisture Content and the CBR Method of Designonlinepubs.trb.org/Onlinepubs/sr/sr40/sr40-022.pdfTHE...

Moisture Content and the CBR Method of Design F. L. D. WOOLTORTON, Planning Engineer, Roads Branch, Ministry of Works, Nairobi, Kenya Colony ·
Introductory Remarks by the Chairman
The essence of science is generalization or, as Poincare says, to give the same name to different things. The essence of engineering is to use science, experience and constructive genius toward an economical solution of a specific problem. While there will never be a substitute for constructive genius, considerations of economy move us to expand science in such a way that it will cover more and more of the area for which experience is required at the present time. In road construction, experience still holds a large sway in the adequate understanding of soil and other construction materials and of the effect of climate on the performance and service life of material structures. One of the outstanding pioneers in expanding science into the area that is still essentially dominated by empiricism is Colonel Wooltorton, who has a large and intensive experience as a road builder in various climates. In his long and distinguished career, Colonel Wooltorton has always endeavored to understand scientifically the complex phenomena encountered by him and others and to coordinate them into a logical system as a first and necessary step toward a true science of rational road construction applicable to all climatic regions. In his present contribution, Colonel Wooltorton makes available to us his conclusions on the relationship between the moisture economy in soils and the proper use of the CBR method of design based on long experience and much good thinking.
THE CBR TEST
e THE CBR test involves the compaction of a sample, in a manner specified by one of several standardized techniques, at a predetermined or ascertained moisture content and to a predetermined or ascertained density; and the penetration of the sample, in its existing state or after soaking, by a plunger at a given rate to give a specified deformation under a measured load. The value measured, for use in design, is the load or the resistance of the plwiger to penetration. It may be considered as an indication of the strength of the material in the form of its resistance, under the conditions of test, to shear deformation or plastic flow. The measured load is expressed as a percentage of the resistance obtained from a like penetration of a standard material and is referred to as the California Bearing Ratio.
The required pavement thickness is determined from this CBR percentage by a method which is essentially empirical. The bearing ratio value is entered into an appropriate loading curve to give the required thickness.
Originally there was only one curve which became known as the curve for "light traffic" or the 7, 000 lb wheel load curve. With accumulated experience a second curve, for "medium heavy traffic," or for a 12,000-lb wheel load, was added (22, 23).
These took the form of the more modern variations shown in Figure 1. - -
THE DEVELOPMENT OF THE TEST
The test was devised by the California Division of Highways in or about 1929 for the original purpose of comparing base and subbase course· materials and only later for the evaluation of subgrades, but it was not until 1940, when the U.S. Corps of Engineers adopted the test as the most convenient one for use in connection with its wartime airfield construction program, that the method was intensively developed.
268

An extensive program of investigations was put in hand with a view to extrapolating the design curves from the 12,000-lb wheel load to very much higher limits and to check the validity of the curves so obtained by experiment.
As a result of the embracing laboratory and field work undertaken, more is known about this system of testing and method of design than of any other approach. From this research sprung much of the present-day knowledge of the design problem and of the many and involved properties of soil under strain.
As far back as 1946, there appeared, in very different parts of the world (South Africa and Texas), two most remarkable research papers on the various relationships encountered in the bearing" value method of design.
The two authors, Kleyn (South Africa) and McDowell (Texas), had adopted the same line of thought and had come to substantially the same conclusions. Their works were, in a most remarkable way, complementary for jointly they covered a very wide range of soil materials thus enabling in conjunction with similar data from elsewhere, for example, Kenya, the
269
100 ----------~----~ I
so~.-----------'------~
so ~: ---1-4\.\-----------'------1 so ~; --'.__,__ ______ ---'-------"
; 40 ~, -+-+\.\-----'-,---------~
I 4,000-lb wheel load 301---+4-1.\---_._ _ ___ _,_ ____ -I
I 20~' ~---1t-\.\-\--'-~~~~~~~~----"
1 9,000-1 b wheel load
a: 15 i-----1.---4.......,.__._ ____ --+---------! ID u
I 12,000-lb wheel load
10 ~------\--\-!.-->~-----+---------!
9 ~. ----\-~~------1----~ e ~• ___ ___,,.........,.......,.....,._ __ ---1------1
7 f------++--'t-+-'<-----+------~
& f------\t---T-"c-'~--+-------1
3 f------+----'..,_ _ _,,__-'4------""---- --I
' ' ' ' ' ' ' ' ' ' ' 2 4 & e 10 12 14 1& 1e 20 22 24 2s
Pavement Thickness, in.
Figure l. CBR-pavement thickness curves for various wheel loads.
deduction of general rules of the behavior of compacted soil under strain. Their data were presented by·plotting on a family of density-moisture content curves,
for various compaction efforts, the iso-lines for such properties as bearing value (after soaking), expansion, air-voids content. The techniques were based on compaction by the impact method and an absorption procedure involving capillary rise. Kleyn (10) used the CBR value as an indication of stability whereas McDowell (14) used the results of the Texas Modified Bearing Value Punch Test. -
The combined results of their work with deductions therefrom supported by modern research, carried out for the most part after 1950, are referred to later in this paper.
THE CBR CORRELATION CURVES
The design curves are observed correlationships between CBR values and pavement thicknesses.
Their implication is that if a field or an "in place" CBR value is determined for a base or a not too highly swelling (27) subgrade soil in or under an established, aged and provenly durable pavement (high quality base and wearing course) so designed as to be free from frost action (27), then, for average conditions, the thickness of the pavement above, necessary for achieving such permanency, will generally be indicated by the appropriate curve. And that is all.
The method assumes that a waterproofed, durable and permanent type of pavement is required and that the design and construction of each course will be planned accordingly; but note that the CBR concerned is the ultimate in-place CBR for the undisturbed lJase or subgrade soil, at some moisture content generally unknown at the time of design and existing in a structural state controlled not only by the way in which the layer was compacted but by the chemical and physical structure developed with time. If climatic conditions are such that the moisture content always fluctuates then the appropriate moisture content will be the maximum occurring under the ultimate range of fluctuation.

270
The success achieved in using this method of design depends entirely upon adapting a successful correlation between testing requirements and the ultimate conditions of the prototype.
Testing procedure must be standardized and strictly controlled and the data required and obtained must be planned and interpreted with discretion and considerable acumen.
It is evident that ii the conditions governing the penetration test are in any way varied; then the value of the CBR will change and a different thickness will be obtained from the design curves. It is therefore essential that the accepted test specifications should be rigidly adhered to until such time as locally gained knowledge can be collected to justify the validity of any variation contemplated.
Nevertheless the aim must always be to develop a technique which will more and more nearly simulate the structural and controlling moisture content conditions of the subgrade to be eventually reached in the field. When this is achieved it will be possible to introduce a constant factor of safety into the design calculations.
THE DESIGN PROBLEM
The design correlationship, as given by the CBR curves, is thickness versus inplace CBR after a number of years.
The problem is how to arrive at this ultimate CBR value keeping in mind that the :.va.~ W.uot ~l.:;v t~ .;;tii,bl~ wh.::n .l:i.n:1i: openeci i.o iraiiic.
The ultimate in-place CBR, or stability, depends on (a) the method of compaction, (b) the ultimate density, (c) the ultimate maximum or equilibrium moisture, and (d) any structural effects developed in the soil with time.
METHOD OF COMPACTION
Under the original California test method of obtaining design data, compaction was achieved under a static load of 2,000 psi 1 but subgrade experience eventually indicated that the stability of the material compacted in this manner sometimes differed considerably from the stability of the soil after compaction to the same density in the field.
In the meantime and as a result of this procedure of compacting by the static method, the belief grew that stability always increased with increase in density where this is now known to have limitations as can be deduced directly or indirectly from reference (12). -In an endeavor to rectify this discrepancy, between the stabilities attained in the
laboratory and in the field, other forms of compacting in the laboratory were investigated by the U.S. Corps of Engineers. This resulted in a modified form of the AASHO compaction test or compaction by impact (1942); more recently this has been replaced, in some laboratories, by compaction by kneading action. There is not a great deal of difference in the stability or moduli of deformation of samples compacted by these two latter methods to the same density at the same moisture content though the results of kneading action compaction have been found to be closer to those attained in the field (26). Both compaction by impact and by kneading action give far more realistic properties, as evidenced by triaxial and shear test data, than static compaction, when compared with the stabilities obtained after compaction by sheepsfoot rollers and rubbertired rollers. Compaction involving kneading action is believed to produce a soil structure or particle shape and arrangement most nearly simulating those achieved during construction and thus most likely to produce comparable shear strength. .
The CBR' s obtained for samples prepared by static compaction may be very different from those obtained by the other methods of compaction and they may be very misleading if used as a basis for design.
There is some evidence that the unit pressure exerted during compaction in the field also has some effect on stability.
1 This pressure was selected as that then believed to give densities most comparable with those found under old pavements.

-u ~
"" iii c ... 0
"" .. 0
STABILITY AS DETERMINED BY LABORA. TORY TESTING OF SAMPLES COMPACTED BY IMPACT OR KNEADING ACTION (12)
Soaked Samples
An analysis of published stability data, for acceptable strains, bas shown:
271
1. For constant molding moisture content, an increase in the density to which a low to medium plastic soil (P.l. from 0 to about 12-15) is compacted is accompanied by an increase in bearing value for densities up to a value corresponding to an air void content which decreases with decrease in the moisture content of compaction after which the bearing value ceases to increase so rapidly and may decrease appreciably. This is illustrated by Figures 2 and 3.
120
\
5% Air Voids\
10% Air Voids--i
Modified Compaction Curve
5
A
10
P.I.= 8 (Loam)
Passing No. 40 = 94%
Passing No. 200 = 58%
--- lso- CBR Lines
- - - - lso- Expansion Lines
- - - lso-Air Content Lines
'\
'
Zero Air Voids
ans ion
~0.1., Expansion
',l 10., Air Voids
15 Molding Moisture ContentL ,., dry weight
Figure 2. Iso-CBR lines for various conditions of compaction after four ~ soald.llg; a.f'ter (!2_) •

272
100 90 80 70 60
50
a: Cil
40 (.)
30
20
15
10
Maximum
1-----+---------1----- CBR for c ompacl ion ---" 1
al 1% dry of op!imum -----.--i......-----t---"---1 f-----f---- -------;---- (modified l
110 115 120 Dry Oensi!y, pct
mois!ure con I en!
Proc!ar ap!imum mo is!ure con!en!
125 130
Figure 3. Variation in CBR with moisture content of compaction (data from Fig. 2).
For materials possessing a plastic index in excess of about 12-15, the lines of isobearing value change their pattern (see No, 2 below) a..11d the tendency cf the bearing value to decrease, for densities in excess of a critical value, seems to fade out as the P. I. increases (see Fig. 4).
2. The maximum bearing value for low to medium plastic soils 2 occurs, for any given compactive effort, at a moisture content of about 3 to 1 percent dry of optimum; while for medium to highly plastic soils the maximum bearing value moves to the wet side of optimum, at a P. I. of 12-15, where the deviation from optimum increases with increasing P.1:, and the effect is more pronounced for modified than for standard Proctor compaction (see Figs. 2 and 4).
3. For equal percentage saturation, bearing values increase with density for materials whose P. I. varies from zero to about 15.
Unsoaked Samples of Silty Clay and Sandy Clay Compacted by Kneading Action
1. For constant moisture content of molding, an increase in density caused an increase in stability depending on the moisture content and the range of densities involved (25) (see Fig. 6). -2. For a constant degree of saturation an increase in the density was accompanied
by an increase in stability (25) (see Fig. 6).
DENSITY MAY BE CRITICAL
Density may thus be a critical factor in design. A reference to Figure 3 shows, that for the particular medium-plastic soil concerned, an increase in density from 126 to 128 pcf for a sample compacted at modified optimum moisture content the CBR drops from 65 to 50.
When designing for a density, the value required must be sufficient to eliminate the possibility of appreciable consolidation, must be sufficiently high to achieve an economic value of the stability, should in conjunction with its moisture content give a condition of near minimum volume change, should be economically attainable. with the equipment available and must not be so high as to lead to the possibility of a decrease in stability
3 Some soils containing halloysite or fine material of volcanic origin appear to be exceptions in that while the iso-CBR lines are of the form associated with soils having a P. I. of less than 15, their P. I.' s are of the order of 30-35. The explanation may be in the moisture fraction representing the inter-planar water of halloysite or the vesicular moisture of porous volcanic material which are not indicative of plasticity.

-u Cl.
>-.. c .. 0 >-
0
273
accompanying any future increment of densification under traffic or by over-compaction during construction.
Though many high-swelling soil subgrades may lose density with time, if over-compacted, the more general run of materials utilized in good construction would appear either to remain at a near constant (dry) density or evidence a slight increase in (dry) density.
They could remain at constant density because of the constancy of the subgrade moisture content or, if that moisture content increases, by virtue of the grading and plasticity properties of the material or possibly because the superimposed pavement loading was sufficient to suppress and prevent volume change. The slight increase in dry density would most probably be a result of additional compaction under traffic. It could, perhaps, be caused by "thixotropic set" or particle orientation under stress.
If, while using such a soil as illustrated in Figure 2, construction control is such that there is a danger of over-compaction or if there is a possibility of some increase in density under traffic, it would appear advisable to compact at a moisture content slightly dry of optimum.
ULTIMATE MOISTURE CONTENT
Whether it will ever be feasible always to determine with close accuracy the equilibrium or maximum moisture content within the equilibrium range of moisture contents likely to occur in the subgrade, or in any other layer, under all conditions of internal and external climate cannot yet be foretold. It is, however, known that certain research organizations are actively engaged on this problem.
80
20 22
Zero Air Voids
I 2% Expansion
Proctor Compaction Curve
24 26 28 30 32 34 36
P. l. = 62 (Black Turf) Passing No. 40 • 90% Passing No. 200• 82%
--Compaction Curves -- lso-CBR Lines ----Isa-Expansion Lines -·-lso-Air Voids Lines
.__..._Zero Air Voids
1'--1 % E~pan ion
2% Expansion
38 40 42 44 46 48 50
Molding Moisture Content, % dry weight
Figure 4. Iso-CBR lines for various conditions or compaction a:rter rour days soaking; after (10).

274
70
Ory Density, pcf .
80 90 100
5,.. Air Voids --1 ~Maximum Density 8 1--~~~~r-~~~--+~~+-~-+----:~·~~~+-~~~---'~~~~--1~~~~---I
/ I
if
7 1--~~~--jr-~~~--+~~-1--~~·~~~~~+-~~~--1~~~~--1~~~~-1
1..- CSR-Density Curve for Compaction at Optimum Moisture
6 ..... Content
I
/ Optimum Moisture Content
v ~ 5 r--~~~~+--~~---:1~9--..---+~-----= ....... ,--~~~-+~~~~-+-~~~~-+-~~~-----
~ 5% Air Voids / / / / '--.......~i.--.i- CSR-Moisture Content Curve
4 r-----+-v-r--+-/ ~-+-~~~~-+----I
3 / ...._____r--._ ../ L Possible minimum value in the field
2 / after development of structure
--r--._ ----
34 36 38 40 42 44 46 Moisture Content, "• dry weight
Figure 5. CBR-moisture content and density curves f'or Proctor compaction (data f'ran Fig . 4).
For certain conditions, as of a high water table, such a forecast is possible, though perhaps laborious, by means of the pF or suction pressure approach (3a) but this method has not yet been proved applicable when the water table is below a depth of about 10 rt.
For other conditions, as for a low water table, there are a number of approximate methods, some of which, in view of the heterogeneous nature of soils, may be found to give a sufficiently accurate answer for predictive purposes no more deviating from the truth than that for any other soil test data. They may, in fact, give far more reliable predictive data than at present surmised if used in the right way and under the right conditions.
Consider the plastic limit guide evolved out of experience. Assume that the soil is not submitted to slaking forces or is able to resist such forces. It appears to be generally accepted that, no matter to how high a relative density a highly plastic soil subgrade is compacted, it will, in time, swell until it ultimately reaches a (dry) density corresponding very closely to Proctor maximum density, thit is, for the purpose of obtaining a correlationship between the maximum moisture content and the plastic limit, one should ensure that the material was compacted to Proctor maximum density or bas reached a value approaching that density.
For compaction under a given compactive effort, the greater the moisture content of compaction the less the moisture which can be absorbed after compaction and this value reaches a minimum when the moisture content of compaction slightly exceeds the optimum moisture content for that effort.
For more average subgrade soils, the amount of moisture which can be absorbed is, in the absence of any slaking, controlled by the air-voids content at the time of compaction. In more general terms, this air-voids content is, for Proctor compaction,

about 4 Ya percent as an over-all maximum. This 4 7'2 percent air-voids content could possibly permit of an over-all maximum absorption of about 3% percent of moisture. On this basis, the maximum moistUre content possible would be of the order of (0. M. C. plus 4) percent. This is illustrated in a statistical way by the average curves which appeared in "Engineering and Construction Control of Embankments" published in the Proceedings of the American Road Builders Association in 1941.
In the same set of curves the Plastic Limit and Optimum Moisture Content are connected, in an average way, by a relationship which may be expressed for the range P. I. = 28 to 6 as:
0. M.C. = (1.17 P. L. - 8)
so that the maximum moisture content might be expected to be of the order of:
(1. 17 P. L. - 4) percent
A similar expression is deducible from Marwick' s points (18a) for British soils.
Expressed as a percentage of the Plastic Limit:
Max. Possible Moisture Content P. L.
4 (1.17 - P. L_) 100
for which when
=
275
Sandy - Clay 120 t---+---+---t---t--l--+-- P ( ~ 13 oopro• . ,_____;
I ! ;
100 ~--'--":'-~-~--'---'--~~--~ 8 10 12 14 16 18 20 22
Moisture Cont1nt, % dry wtiQht
8 10 12 14 16 18 20 22
Moisture Content, '% dry wei9ht
a: ~ ~ t----+---t-- ~"'--t-+---:::1-"o:::;:,-..,.L+--+-----i
30 1-----1--Y:--!--;..c;.._+--_...,.__...,,'--+--l-- ---1
2o l----+--.,1..£:::f:::_..j.~'i:z:;t:z~--+--+-....:..:...___j
o...._ _ _.__..___.___,__...____,____,_ _ _,__,_ _ ___, 104 I06 108 110 11 2 11 4 11 6 118 120
Dr, Donsity, pct
Figure 6. Variation in CBR with compaction effort and molding moisture content
for unsoaked samples; after (25).
P. L. = 16 : maximum moisture content= 92 percent P. L. and
P. L. = 30 : maximum moisture content= 104 percent P. L.
and these are values of the order found by Kersten (9a). If the material were originally compacted at Proctor 0. M. C. to a densicy -of less
than Proctor maximum then the amount of moisture the material could absorb would be greater than considered above.
It would thus appear that in a statistical way the maximum moisture content of the subgrade might be expected to reach ultimately a moisture content which could be represented by the approximate range 92 to 104 percent of the plastic limit with values in excess of 104 percent for certain types of materials and when compaction was less than 100 percent Proctor maximum.
For P. L. of 16, the range would be 14 to 16 percent and for a P. L. of 30 the range would be 27 to 30 percent.
Though for constant density, the CBR, can vary very considerably over a range of 2 to 3 percent of moisture content one wonders whether in soil work a much greater accuracy in testing and during construction is indeed possible.
The real difficulty in interpreting such data lies in being able to estimate the time interval which will elapse before the maximum moisture content is reached should construction be carried out at a lower value. If it is four days or four years, the value of the maximum moisture content is of great importance but should it take forty years to accrue then it becomes of less importance in these returning days of lower standards of construction followed by some of the backward areas being developed in the face of inadequate funds.

276
Though any firm correlationship between the maximum moisture content and the plastic limit would be most informative, the relationship does not appear to be on such a rational basis as the field moisture equivalent or even the saturation percentage relationship both of which appear to mean something understandable.
An interesting sidelight on the F. M. E. correlationship arose during the study of data for a believed halloysite subgrade soil. It was noted that 0. 75 x F. M. E. represented a moisture content 9 percent lower than the modified optimum moisture content or one occurring well off the chart of equi-C BR lines for the moisture content range lying between the compaction curves for modified and Proctor compaction. Such moisture content did not appear to be likely equal to the maximum site moisture content under a pavement.
It was then noted that two of the data available applied to the subgrade under an old gravel road. In this area the rainfall was 80 in. and rain occurred throughout most of the year. The data were actually taken for a rainy period. The measured site moisture contents for those tests were 27 percent and 29 percent only.
The plastic limit was 35 and the Proctor optimum 45 percent. The field densities were 95 percent and 111 percent of Proctor maximum and the F. M. E. was 43.
ULTIMATE MOISTURE CONTENT AND THE SUCTION PRESSURE METHOD OF DETERMINATION
The .suction-pres:!iu.i·e metilou of uelel'lulning the equilibrium moisture content or the maximum moisture content within the equilibrium range of moisture contents likely to occu1~ in ariy layer ui a road structure under an impermeable pavement of infinite dimensions has been developed in England. The method has been described by Croney (3a) and elsewhere. The principles behind this method and the implications of the conclusions reached in its study are not, however, clear at all. The following approach is believed to present an understanding of the principles involved and the conclusions to be reached from such an approach.
Let the total free energy of moisture at a point within a soil profile at equilibrium moisture content and at constant temperature be represented by Afs
Then Afs = Af<Ts + Afps + Afos + AfFs
Where Af <Ts
A fps
Afos
and AfFs
=
=
=
=
free energy due to surface tension and radius of curvature of the air-water interface, free energy due to hydrostatic pressure of moisture adjacent to soil particle surface caused by adsorption forces as well as by any pressure transmitted from external sources, free energy due to the osmotic pressure developed by any dissolved material, free energy due to water by virtue of its position in the particle adsorptive force field as well as in the earth's gravitational field.
If "X" and "Y" are two clay particles each surrounded by an ;.. - ..-"' b adsorbed moisture sheath, as shown dotted, and "a" and "b" are CJ"' • '\ points in this system in which "a" is below the meniscus of the / (.,._....--a capillary ring moisture but without the adsorptive force fields, / ..... ..::::·~ and "b" is within the adsorbed water surrounding particle "X", ' _ _, ~' then, assuming equilibrium conditions, the moisture is pure ~ LJ--_ 1
\ _.,,, water and there is no osmotic pressure, energy conditions give: - - -
1. For point "a" lying outside the particle force field the energy due to the hydrostatic pressure in the moisture by virtue of its position in the particle adsorption field and that due to the position of the particle in the adsorption field disappear.
Under such conditions:
A fs = Af <Ts +A fps (external forces) + Af Fs (gravity field) = 0 (1) or
= -(gph + Pw)

277
where Pw = effective superload pressure due to weight of the moist soil over,
and h = height of the point above the free water surface or resultant suction pressure = gravity potential - pressure potential or
where s u
p and a.
= =
= =
s = u - a.P (2)
suction pressure and is negative, gravity potential which may be negative or positive depending on position of the point relative to the ground water level, superimposed vertical loading, a fraction varying between 0 and 1 depending upon the effectiveness of intergranular contact.
2. For point "b" lying inside the particle force field the same general energy relationship holds, that is:
(3)
but ~fFs + ~fps now refers to the energies associated with both the gravity and particle force fields.
In British publications the gravity potential appears to be referred to as "the porewater pressure as determined by the position of the point relative to the water table."
The interpretation appears to imply that, if the water table is 100 ft below a point in the so.il profile at moisture equilibrium then the pore-water pressure, or pressure deficiency, across the capillary meniscus (if there is one) would be as high as 43 psi and the radius of the meniscus would oe as low as O. 00002 in.
It seems doubtful, however, if capillary water can exist as water in such fine soil pores and it would appear that for such a low water table, frequently exceeded in the tropics, the equilibrium moisture content may well be controlled, as far as the lifetime of a road is concerned, more by adsorbed moisture than by capillary moisture as such. Further, it seems very likely that temperature gradients may, on occasion, influence such equilibrium values to a marked degree to give maximum and minimum equilibrium values of a perhaps cliff erent order.
If the pavement is permeable and of limited width there will be further modifications for considerations.
The suction pressure approach to moisture distribution appears to lead to the possibility of confusion arising between the energy with which moisture may be held at a point with the energy available at the point to hold moisture. The difference is, of course, to be represented by the time interval necessary for the distribution of vapor flow to bring about that distribution suggested by energy conditions.
Though it may be convenient to consider moisture as attracted by suction forces, there is no obvious reason to believe that such forces are necessarily responsible for attracting moisture to a point or for controlling the amount of moisture at a point under a pavement when the water table is low.
The energy available to hold water at a point in a profile is made up of the following two components:
Energy associated with the particle force field or the adsorptive energy
plus
The capillary energy available at the point to hold moisture when it arrives as may be
modified by any swelling pressure or any super-load.
The first component has a maximum value as long as the relative humidity is not appreciably less than 100 percent or for suction pressures numerically less than that corresponding to a pF of about 4. O; while the second depends on the shape of the particles, that is, plate or rod-like or spherical, and the density to which the material is

278
compacted. Where the first component can be represented by a constant, the second is a variable depending upon the geometry of the resulting capillary and pore-space system.
These energies do not so much attract moisture in the sense that they can cause moisture to move over appreciable distances but are energies available to hold moisture when that moisture is ready at hand for adsorption.
The energy available to hold water is thus a constant, subject to a constant temperature, for any particular system and the maximum amount of water which can be held is controlled by that amount of energy.
According to the British approach, it appears that the energy of absorption can be considered to be represented by a particular case of the general formula for the energy of moisture held under conditions of equilibrium, that is, as represented by Eqs. 1 and 2 rather than by Eq. 3 irrespective of the fact that capillary moisture may not exist in the tropics.
The actual energy available for surface adsorption is the hydration energy plus the hydration plus any osmotic energy which limits the amount of moisture which can be adsorbed. (4)
The capillary energy available to retain water is controlled by a statistical treatment of such systems as:
------'\ l@>#-0740,
..,,....- -- - ..........
1 ... ~- · ..._ __ -where the amount of capillary moisture possible is controlled by radii r 1 and ra and · where, in a subgrade soil there would not appear to be necessarily any connection between such radii and the depth of the water table for some appreciable time.
The height to which capillary moisture can rise above the water table is controlled by the maximum tension which can be withstood by water films but water cannot, apparently, sustain a tension exceeding about 1,000 cm {pF 3) or about 34 ft.
More generally, coarse capillary water ceases to exist when the pF is of the order of 1. 5 and fine capillary moisture when the pF is about 2. 5. There appears to be no evidence that capillary moisture can rise to a height of 100 ft or more to supply capillary moisture under a pavement though, of course, moisture may move to such heights by film and vapor movement to give the same ultimate equilibrium moisture content but this takes a much longer time.
It would, therefore, appear that, for deep water tables, the maximum amount of moisture at any point under a pavement of infinite dimensions is controlled for some appreciable time wholly by the surface energy of the particles and there is no capillary water under conditions of equilibrium at constant temperature.
Moisture movement, at such heights, is in the vapor phase by convection, etc. The gravitational energy of such moisture, is, however, still expressible in terms of:
4f = -gph
but the free energy equation is that represented by condition three and the amount of moisture, for some very appreciable time, appears to be limited to relationship four.
It would therefore seem that the equilibrium moisture content under a pavement of infinite extent is likely to be in the region of one determined by a pF of about 4 when the water table is very low.
Road pavements are not, however, infinite in width and other phenomena influence the moisture distribution in a transverse direction.
The suction theory presupposes that the pavement is not only impermeable and infinite in extent but that, as a consequence of its extent, the moisture content under the pavement is uninfluenced by horizontal capillary movement, evaporation and the effects of plant transpiration.
Horizontal moisture movement is unfortunately not always negligible in the tropics though its effect ~s generally found to tail off from a maximum at the pavement edge to

279
a negligible amount at the road center where suctions of pF = 3. 7 have been recorded (ex. 29).
Whereas evaporation and transpiration are important in respect of edge movement and the cracking of the edge strips, horizontal capillarity and permeability of the surface are of the greatest importance as regards pavement thickness.
For the subgrade in the vicinity of the pavement edge, it would be expected that the ma.xi.mum moisture content would be determinable by the action of the natural forces operating in such an area, where free water was likely to be available, rather than by the depth of the water table.
A soil will, after being fully saturated, drain out, that is, from its coarser capillaries, to a moisture content known as the Field Moisture Capacity, depending in value upon its density and certain other factors, where this moisture content, for a soil in the field, corresponds to that represented by a pF of about 3. 0 to 3. 2. It is a moisture content which is retained by a soil under a Viscous resistance to flow till removed by plant root action.
Most soils reach the F. M. C. in from two to three days after · rain while others, as some red soils, reach it within 22i hours even when compacted. Moderately silty soils, however, do not possess a F. M. C. and continue to drain for several months.
The effect of compaction on the value of the F. M. C. is to reduce the volume of the coarser capillaries and to increase that of the finer capillaries whereby the modified F. M. C. would be expected to be increased. In other words, definitions and geometry suggest that the value of the F. M. C. for a compacted soil approaches the moisture content represented by the Centrifuge Moisture Equivalent assuming that constant is determinable. The value of the C. M. E. for the compacted soil would then be that corresponding to a pF of about 2. 7. It would, by definition, also be approximately equal to the F. M. E. for that particular density if such a test were possible for the compacted soil in mind where the F. M. E. really implies the presence of excess moisture or some super saturation.
It is therefore to be expected that the maximum moisture content under a pavement, not less than 20 ft in w~dth, would vary between that corresponding to a pF of the order of 4 at the center to 2. 7 at the edges with possible short periods after heavy and prolonged rain when the moisture content would exceed such an edge value.
It is interesting to consider, in a speculative way, the maximum moisture content likely to occur under a pavement in terms of the guide that such a value will not exceed about 75 percent of the F. M. E. when the soil is resistant to any slaking forces which may occur under cycles of alternate wetting and drying.
Three quarters of the F. M. E., for a powdered soil, would then be expected to be representable by three quarters of the suction pressure corresponding to the F. M. E. There appears to be no published correlationship between F. M. E. and suction pressure but on the basis of definition it is essential that the F. M. E. shall have a lower limit of moisture content which can be represented by the F. M. C. or equivalent to a pF of 3. In general, the moisture content would be expected to be higher than given by this pF. Seventy-five percent of this suction pressure gives a pF of about 2. 8 or a moisture content a little drier than given by the C. M. E.
It is for consideration whether in the absence of sufficient data, there is any great reason to believe that equilibrium or maximum moisture contents under a pavement are likely to be represented by some constant pF value. As the energy with which moisture is held may depend very much on the adsorptive forces, when the water table is low, it would be expected that such limits will depend in some way on the nature of the clay minerals and the replaceable bases and thus be variables depending upon the chemistry of the soil.
It is also for note that the above discussion emphasizes the value of incorporating membranes into a road structure when such membranes are carried through the road shoulders.
To turn to test data, if the CBR is determined immediately the sample has been removed from soaking, then the bearing value obtained corresponds to that for a supersaturated sample, that is, for one which is at a moisture content representable by the F. M. E. of the sample at its particular density. Under such a moisture condition

280
the effect of pore water pressure during testing is likely to be of extreme importance. For such moisture contents, the CBR value would be expected to be very low. This suggests that the drainage period adopted between soaking and testing for CBR is of importance and that for low trafficked roads, under favorable climatic and soil conditions, the period might be increased beyond the more standard interval of 15 min. with economic advantage-realizing that for relatively short periods the pavement edges might be overloaded.
The ultimate moisture saturation percentage has been found to vary, in the 4-day soaking test, from about 75 percent to about 95 percent depending upon the soil type, the moisture content at the time of compaction and certain other factors (24) which should include the density to which the soil is compacted. -
The amount of moisture absorbed during the soaking test decreases with increase in relative density though the percentage saturation increases.
Field observations have indicated there is little, if any, connection between rainfall and subgrade moisture content when the bitumen surfacing is impermeable; though there is a very distinct trend for the percentage saturation to vary with climate and rainfall (24).
Whether or not the moisture content will increase or decrease with time depends not only upon the moisture content at the time of compaction but upon the moisture content at the time the pavement is sealed which may be a very different value and which may have to be taken into account in the design.
t~cvcrt.hclc:;G L11crc ia a ·very definite tend.ency for moisture c0nt&?nt~ iri ~11hgr~fipq to increase, regardless of the depth of ground water level, though with some subgrade soils t.i'ie process may, because of t..i11c ch~ructeristics cf t..11.e soil types, be very slow.
The limited information available (24) suggests:
1. The maximum or ultimate degree of saturation is generally within the laboratory determined range of 75 to 95 percent. 3
2. The degree of saturation for plastic subgrades tends to vary with rainfall. 3. The degree of saturation tends to be lower in areas of low rainfall (arid and
semi-arid regions) than in more humid areas (this assumes that there is no permanent or temporary high water table).
4. The degree of saturation is well below the above range for well graded and drained granular soils. Le Clerc (12a) has specifically drawn attention to the necessity of covering a compacted swelling subgrade, constructed in a stage construction job, with sufficient, perhaps temporary, surfacing to endeavor to prevent moisture absorption and permanent loss in density.
THE EFFECT OF ABSORPTION, AS OCCURS DURING THE SWELL TEST, ON DENSITY AND CBR
Tests show that cohesionless soils (P. I. less than 2) and well graded feebly plastic soils (P. I. of 2 - 6) do not swell appreciably during the 4-day soaking test in which they are contained in a 6-in. diameter CBR mold, and subject to a test surcharge of 10 lb.
Some temporary loss in density will occur in the field during freezing but this is generally recouped under traffic after the thaw.
In general, soaking has no effect on the CBR of cohesionless soils but may have an appreciable effect on the CBR of feebly plastic soils.
When the plastic index exceeds a value of about 6, absorption is accompanied, during the swelling test, by volume change where the magnitude of this change increases as the plastic index increases.
The saturation of finely grained soils, in the field, followed by freezing results in a loss of density.
In general terms, test swell appears to be a minimum on the dry side of modified optimum moisture content for material of low plasticity changing to the wet side of
3 The higher limit applies to fine grained soils. Note that the ultimate CBR is not generally determined by a moisture content corresponding to 100 percent saturation.

281
Proctor optimum moisture content when the plastic index exceeds a value of about 12 to 15 though the limit for pumice and halloysite soils might be greater.
For any specific soil and a constant moisture content for compaction, the swelling for high relative densities apparently decreases with increasing ·density for materials compacted under a low compactive effort but may increase with density for the same material compacted under a high compactive effort. In this phenomenon, the relationship between the surcharge weight and the swelling pressure for a given void content presumably plays a part.
But whether the swelling decreases or increases with increasing relative compaction, the volume change of a highly plastic soil, is, for high relative compaction, much greater for modified compaction than for Proctor compaction even when, for high swelling clays, the surcharge weight is as heavy as 30 lb. The difference may be of the order of 200 to 400 percent.
The result of this absorption and swelling is that a sample compacted to 100 percent modified AASHO maximum density may drop in (dry) density after soaking to 95 percent relative density or to even a lower value. As would be expected, the CBR decreases in the same way though contrary, perhaps, to general belief this does not necessarily apply to plastic soils compacted under the Proctor compaction effort and soaked for only four days.
The loss in density, which occurs when highly plastic soils absorb moisture under an appreciable. surcharge has led to the commonly accepted fact that high swelling subgrade soils cannot usually be compacted to modified maximum density and held at that density. This means that there is apparently no point in compacting them to a density very much in excess of Proctor maximum or, from the point of view of attaining a condition of near minimum swell, of compacting them at a moisture content very different from Proctor optimum. This objection would not, of course, necessarily hold for the material used in the lower layers of high embankments and subjected to considerable surcharge.
One should not forget that the stability of all soils is a function of the molding moisture content and that it may, in fact, be more economic to compact a medium swelling soil under a high compactive effort to take advantage of a somewhat higher CBR after soaking.
Low swelling materials should be compacted under a high compactive effort and, as a general rule, it may be assumed that this is possible with comparative ease.
Many of the early writers as Porter (22), Kleyn (10) and McDowell (14) advocated the use of a bituminous membrane (often under a blanket course) over the subgrade to prevent infiltrating water reaching an expansive subgrade or the damaging of the sub"". grade from the efforts of alternate drying and wetting. The principle seems to have been introduced by Porter (22) and gene.rally developed by Texas. More recently it has been used in England (18}to protect an exposed subgrade from the effects of rain and in Kenya to protect theshoulder subgrades of an embankment constructed in high swelling Black Cotton soil from the effects of infiltrating water.
SOIL STRUCTURE
With many, though not all, fine grained soils there is a marked tendency for them to develop, through chemical and physico-chemical processes, a "structure" er skeleton reinforcement markedly increasing their stability.
This factor features in the results of measuring in-place stability. It may mean that an undisturbed CBR is considerably greater than that for the disturbed soils at the same moisture content and density.
There is, however, one important thing to remember about soil structures. Some of them are but temporary, that is, while they would influence in-place CBR' s measured for material in cut their effect would permanently disappear as soon as the soil was disturbed as it would be when the same soil was used in fill.
DENSITY AND MOISTURE CONTENT
Two factors therefore emerge: (a) Possible considerable loss of stability may re-

282
sult from overcompaction whether it occurs initially, during construction, or whether it occurs as an increase under traffic with time. This loss may be rendered more severe by any small increase in moisture content.
From the control during construction point of view, the stability of materials of low plasticity is usually very sensitive to the magnitude of the moisture content at the time of molding or during construction. A careless compaction at a moisture content of 2 percent wet (or dry) of the most suitable value may reduce the stability to but a small fraction of the design value.
(b) The ultimate moisture content has to be estimated with discretion to avoid designing on the basis of unsoaked data, when this would be inapplicable in fact, and to avoid designing for the saturation condition when saturation is never likely to occur.
A test sample is normally considered to become saturated after it has been soaked for 4 days but it is known that high swelling soils may go on absorbing moisture for periods of up to 6 months or more (10, 21). Whether this additional absorption and swelling is accompanied by an increase in the percentage saturation does not appear to have been recorded.
On the other hand, it is also believed, if not known that for all soils in all parts of the world the drier the climate the less the moisture the material is likely to absorb in the absence of a high water table.
CAUSE OF INSTABILITY ARISING OUT OF OVERCOMPACTION
It is pertinent to question why no such loss of stability has been recorded as occurring when the oreoared samnle is comnacted bv the method of ~t~ti"- f'.omm1f'.tion where-- - .. .. ... - ~ ---- ---- ---- -- -- ------- ------------ -·---- -as it is known to have occurred in the field and when samples are compacted by impact and kneading action.
Expressed somewhat differently "for a given initial water content, a reduction in void ratio through a process of consolidation results in a higher compressive strength than that which results if the same reduction in void ratio is achieved through a process of compaction" (13).
Static compaction fS achieved under pressures considerably greater than those occurring under compaction equipment and the horizontal squeezing movement in the material which occurs under compaction in a roadbed is absent. In consequence, densities achieved in the static compaction test are obtained under more rigid conditions productive of high interparticle forces. In the field, the same density is achieved by a pushing-into-place action under lower pressures so that the high frictional resistance arising between particles under static compaction to high densities is absent when the same density is obtained under compaction equipment.
Dynamic compaction to high densities may affect stability in two ways. It may do so by reducing the mass strength of the particles through damage to the particle system and it may do so by detrimentally affecting the strength of the soil-water system.
Dynamic compaction may damage the particles as such; and it may likely produce a compacted mass of inferior stability by virtue of a more random system of volumes of particle orientation and the existence of shear planes, produced within the mass by the compaction process, in the vi.cinity of which the density may be considerably below the average (2).
As regards the soil-water system, it would appear reasonable to suppose that dynamic compaction results, by its molding effect, in a pore water system less favorable to moisture and air movement than occurs under static compaction. The air itself is also conceivably under appreciable pressure. It would then follow that in the region of high relative densities a condition is reached in the process of compaction where the water and air is unable to redistribute itself as would be necessary to avoid pore pressure effects and a "quick" condition eventuates under stress with a loss in stability. This detrimental condition is believed to arise particularly with silts and silty sands which would otherwise lend themselves to easy compaction to high relative densities.
Whether this phenomenon is also responsible for the higher swell pressure determined for samples of materials prepared by static compaction and saturated by exudation than when prepared by kneading compaction (26) is not known.

283
Compaction by kneading action involves forces more comparable with those occurring during construction and permits some of that lateral movement occurring under compaction equipment. It is thus considered to encourage the formation of a mechanical structure and stability most nearly simulating that produced in the field.
FACTOR OF SAFETY
All engineering design essentially embraces the use of a factor-of-safety which in road design procedure is frequently considered should be of the order of 1. 75. Where does that factor appear in permanent design? Is it a constant to be relied upon?
By the very nature of the CBR pavement thickness correlation curves, there is a hidden factor-of-safety but that factor of safety will not apply to design unless the ultimate CBR minimum is at least equal to the value used in design.
To cover the effect of all the imponderables a factor of safety must be introduced · somewhere into the design procedure. Unfortunately, however, it cannot yet be specifically introduced as such in design and its actual value is very variable. It may not exist at all. There is some doubt whether the CBR curves do, in fact, give reliable pavement thicknesses for all highly plastic subgrade materials (20).
On the credit side there are the following factors: -
1. In the absence of a high water table, the maximum moisture content reached in more normal subgrade material is likely to be less than that occurring after 4 days soaking.
2. The maximum moisture content reached is likely to be appreciably less in an arid or semi-arid region than it is in a more humid region.
3. For any specific moisture content of compaction, the in-place CBR may be very much greater than that for a test sample compacted at the same moisture content and reaching the same ultimate moisture content and density, because of accumulated structure.
On the debit side there are:
1. Some high swelling clays may absorb appreciably more moisture than deter-mined by the 4-day soaking test.
2. Some high swelling clays do not develop a structural aid to stability. 3. Permeable surface courses encourage high subgrade moisture contents. 4. There is, as yet, no full understanding of how stress is distriruted through road
making materials and how this distribution varies with material type. .Recent work in the U.S.A. (6a) suggests that the variation in flexible pavement thickness, required to produce a given stress in the subgrade, may be as much as 60 percent of the minimum thickness required as a result of using different materials in the construction of the pavement.
STABILITY IN RELATION TO STRAIN
One of the most important fields of study, in the endeavor to introduce realism into the CBR method of design, has been discussed by Seed and Monismith (25) with reference to the strains produced by stress in wtsoaked samples of a soil material and with emphasis on the meaning which should be attached to such expressions as "failure," "excessive" or "detrimental deformation under stress."
Some authorities consider that failure or excessive deformation occurs under a stress sufficient to cause a strain in excess of 10 percent. Others would appear to believe that such a permissible strain limit is too high and that the limit should be placed at 5 percent. Thinking in terms of permissible pavement distortion would appear to suggest a preference for such a lower limit.
Seed investigated the effect on the stability of a silty-clay soil by placing a limitation on the permissible strains of 1 percent (modulus of deformation), 10 percent and 20 percent and found that:
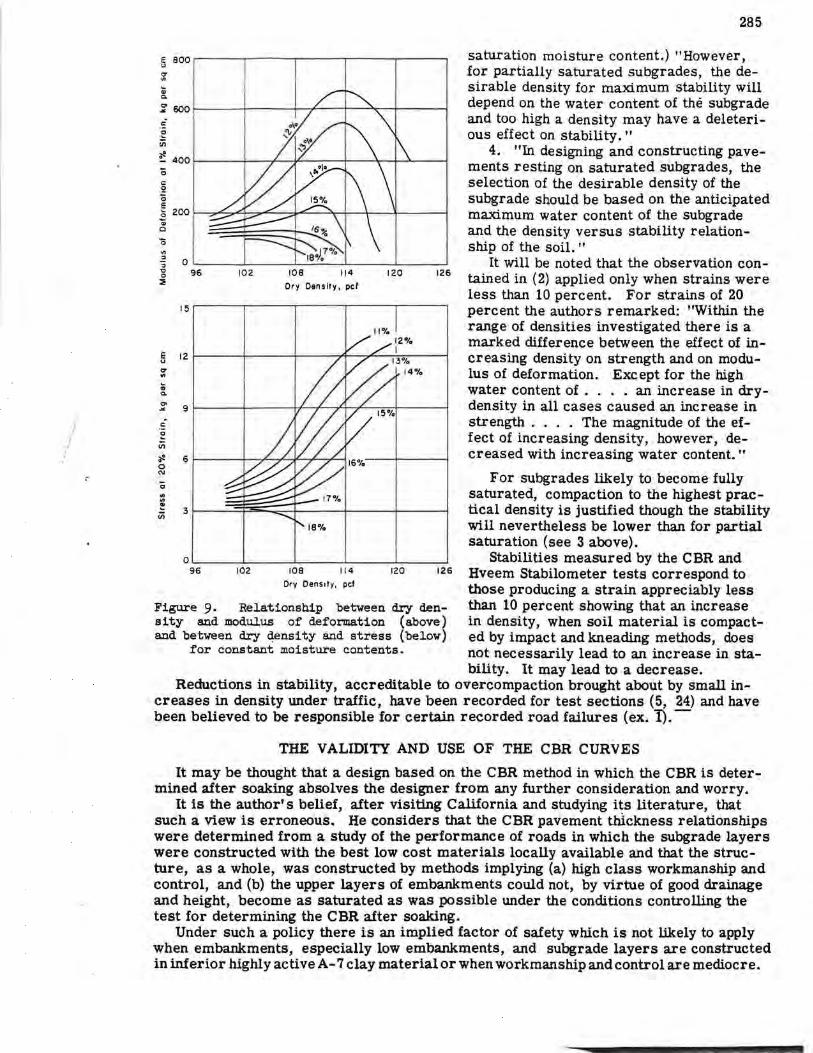
1. The form of the stress curves for families of density-moisture content curves changed with changes in permissible strain from 1 to 2lf percent (see Figs. 7, 8 and 9).

284
126
118
-<J a. ,.. .,, 110 c .. 0 ,.. ...
0
102
94 .__ __ __._....:...._---1. _ __ __,_ ____ _.
8 12 16 20 Moisture Content, % dry weight
Figure 7. After (25).
24
2. The stress-strain relationship for soil material compacted by sheepsfoot arn.l .rubue.t· U.t·eu rollers were ctifterent from those obtained after compaction by the static, impact and kneading methods. They were most closely represented by the results obtained after compaction by kneading action though the results given by impact and kneading tecflniques did not differ very greatly.
3. It was noted that if the form of failure, when tested by the triaxial compression test, was by defined shearing for moisture contents on the dry side of optimum for any given compactive effort but that at about optimum moisture content and at higher moisture contents the samples bulged considerably while continuing to support increasing load, then failure could be considered to occur under a stress sufficient to cause about 10 or 20 percent strain in the test sample.
1,000 .------.----...,.-----.------, e <J
r:T
"' ~ 800 1----->......-1------+-- ---+-----I O' ~
c ·;; ... -(fl 600
~ 0 c .S! 0 400 E ... ~ GI 0
0 200 ..
:J
:J ~ 0 ~
0
140 e <J
r:T
"' ~
100 O' ~
c:
~ iii 60 oJ!. 0 (\j
0
B
8 12 16 20 24 Moisture Content, %
A
o ..._ __ __,, ___ __._ ___ _._ ___ ~
8 12 16 20 24
Moisture Content, %
Figure 8. Relationship between moisture content, dry density, and stress.
The results of the research described showed that, for the particular soils tested and for samples prepared by impact compaction and by kneading action and tested without soaking:
1. "The relationship between density and stability depends on the criterion used to define stability the greater the permissible strain before a sample is considered unstable, the greater is the possibility that an increase in density will cause an increase in stability." ·
2. "For samples of two soils, a silty clay and a sandy clay, compacted by kneading action, an increase in density at a given water content caused an increase or a decrease in stability (for strains less than 10 percent) depending on the water content and the range of densities involved; however, at a constant degree of saturation, an increase in density always caused an increase in stability. "
3. "For saturated subgrade conditions, the higher the density of the subgrade the greater will be its stability." (Note: This presumably refers to samples prepared at
E 000 ~--~--.,....---.,....---.,....------. u
~ -., Q.
c:
~ u;
~ 400 >----+-~'---->L-----+--\--+-'--------I c c: .2 c E 5 200 f--~~1'-=~----:::~:.__,__+--l--~-----l Qi 0
0
"' :l
"5 " 0 ::;;
0 96
15
102 108 114 120 126 Dry Density, pcf
11 %
E 12 >----+---+------.'l-~-==-----1 u
er "' -CD Q.
:;; 9 r-----+-----++--+---7"-t---:>--,-:-=:-t-------1
c:
~ 0 N
285
saturation moisture content.) "However, for partially saturated subgrades, the desirable density for maximum stability will depend on the water content of the subgrade and too high a density may have a deleterious effect on stability."
4. "In designing and constructing pavements resting on saturated subgrades, the selection of the desirable density of the subgrade should be based on the anticipated maximum water content of the subgrade and the density versus stability relationship of the soil. "
It will be noted that the observation contained in (2) applied only when strains were less than 10 percent. For strains of 20 percent the authors remarked: "Within the range of densities investigated there is a marked difference between the effect of increasing density on strength and on modulus of deformation. Except for the high water content of .... an increase in drydensity in all cases caused an increase in strength . . . . The magnitude of the effect of increasing density, however, decreased with increasing water content."
For subgrades likely to become fully saturated, compaction to the highest practical density is justified though the stability will nevertheless be lower than for partial saturation (see 3 above).
o _____ .__ __ .__ _ ____..__ _ ___. __ ___. Stabilities measured by the C BR and 96 102 100 11 4 120 12 5 Hveem Stabilometer tests correspond to
Dry Density, pct those producing a strain appreciably less Figure 9. Relationship between dry density and modul.us of deformation (above) and between dry qensity and stress (below)
for constant moisture contents.
than 10 percent showing that an increase in density, when soil material is compacted by impact and kneading methods, does not necessarily lead to an increase in sta-bility. It may lead to a decrease.
Reductions in stability, accreditable to overcompaction brought about by small increases in density under traffic, have been recorded for test sections (5, 24) and have been believed to be responsible for certain recorded road failures (ex. 1).-
THE VALIDITY AND USE OF THE CBR CURVES
It may be thought that a design based on the CBR method in which the CBR is determined after soaking absolves the designer from any further consideration and worry.
It is the author's belief, after visiting California and studying its literature, that such a view is erroneous. He considers that the CBR pavement thickness relationships were determined from a study of the performance of roads in which the subgrade layers were constructed with the best low cost materials locally available and that the structure, as a whole, was constructed by methods implying (a) high class workmanship and control, and (b) the upper layers of embankments could not, by virtue of good drainage and height, become as saturated as was possible under the conditions controlling the test for determining the CBR after soaking.
Under such a policy there is an implied factor of safety which is not likely to apply when embankments, especially low embankments, and subgrade layers are constructed in inferior highly active A-7 clay material or when workmanship and control are mediocre.

286
This belief would appear to be supported by Porter's comment (22) that the thicknesses given by the curves apply only for average conditions and are based on a tire pressure of 60 psi; these thicknesses should be increased or decreased up to ± 20 percent depending on (a) tire pressure, (b) quality of base course material, (c) characteristics of imported fill, (d) ground water level and drainage conditions, (e) possible effects of frost action, and (f) frequency of loading.
To this list of provisos should be added (g) the maximum legal wheel-load which is not necessarily the constant it is assumed to be, and (h) the nature and thickness of the surface course (18).
The effects ofvariations in tire pressure and in maximum legal wheel-load are obvious.
The quality of the base course and subbase course (that is, "imported fill") matereials and the nature and thickness of the surface course are important for they affect the spread of wheel loads and hence the active pressure on the subgrade and other layers. The curves assume that all road making materials spread the load in the same way. A low grade subbase material may not in fact spread the load sufficiently for the thickness given by the curves to be adequate.
As a result of research projects sponsored by the Civil Aeronautics Administration and the Navy Bureau of Yards and Docks (6a), it has been found that the quality of the material used in pavement construction materially affects the distribution of stress on the subgrade due to applied loading and that the comparative effects of various materials can be predicted qualitatively from the triaxial test data.
On the basis of designing to suit the sate loading capacity ot the subgrad~, it was found, for a particular subgrade for which the transmitted stress had to be limited to 12 psi, that when a static load of i5,000 lb was applied to the surface by a tire inflated to 100 psi, the thickness of various pavement materials required was in the following order:
Crushed limestone" base, 1% in. down and well graded Crushed slag base, 1 % in. down deficient in minus 200 material Normal gravel, partially crushed 1 in. down and reasonably
well graded 8-in. normal gravel base and sand subbase Clay-gravel base
16 in. 17% in.
21 in. 24 in. 26 in.
(The cost does not necessarily follow the same order. In the particular instance quoted, the cheapest section was the 24-in. depth of normal gravel base and sand subbase.)
The CBR of the "soft" subgrade was not given but may be estimated as at about 5 and calling for a pavement thickness of about 18% in.
This is an important sidelight on the importance to be attached to the meaning of "average conditions." It supports Porter's contention that the thickness, as determined from CBR curves, may be reduced, under favorable conditions, by up to 20 percent and it illustrates the belief of others that the necessity, under unfavorable conditions, of increasing such a thickness by up to 20 percent is an inadequate representation of fact.
In this particular instance, the increase, supposedly mainly necessary as a result of variations from the average of conditions (a) and (b), amounts to as much as 40 percent where the variation from the mean is approximately 24 percent.
Assuming the distribution of stress follows a straight line relationship, then the angle of stress distribution under the applied loading, as measured from the vertic3.l, can be estimated for the materials used as:
Crushed limestone Crushed slag Normal gravel
38 deg. 36t'a deg. 30Ya deg.
8-in. normal gravel base and sand subbase
Clay-gravel 27t'a deg.
26 deg.
" Limestone is possibly of ideal hardness as regards keying and load distribution under normally used consolidation plant.
287
According to Maclean ( 17) the thickness of a· layer required to transmit a given loading to a layer below, insuch a way that the shear stresses in the lower layer are maintained at a given value, decreases as the modulus of elasticity of the transmitting layer increases.
The characteristics of imported fill, ground water level and drainage conditions control the relationship between the maximum moisture content developing within the subgrade layer and that existing at the time the C BR is determined. They help to control the factor of safety.
Deep frost action leads, during the subsequent thaw, to saturation or even supersaturation of the subgrade and hence may lead to a lower stability than that indicated by test data.
Of the above factors the frequency of loading is, in general, the most important and is, in fact, now possibly considered as of greater importance than was appreciated at the time of Porter's paper. ·
The greater the intensity of traffic complying with the weight limitations laid down by statute, the greater, in fact, is the equivalent wheel load for which the pavement should be designed.
It is thus clear that the interpretation of the CBR curves is not so simple and that the thicknesses obtained from them are more in the way of a guide to be modified by the designer in the light of his experience and knowledge.
METHODS OF DETERMINING THE CBR VALUE TO BE USED IN PAVEMENT DESIGN
In the earlier days of design by the CBR method, the bearing value selected for use was that obtained for a sample compacted at optimum moisture content to maximum density by the process of static compaction under a pressure of 2,000 psi and then, more commonly, soaked for 4 days. The required pavement thickness over the layer for which the sample was representative, was then obtained from the appropriate light traffic (7,000) or medium heavy traffic (12,000-lb wheel load) correlation curve. Some minor adjustment to the thickness required over a subgrade was permitted under specific circumstances depending largely upon the experience and judgment of the designer for magnitude and justification.
The method of static compaction was then replaced by that of impact or kneading and the CBR more frequently determined was that for compaction at optimum moisture content to a density corresponding to modified AASHO maximum density after soaking though the majority of laboratories later adopting this method of design followed the Proctor technique.
Although the bearing values for subgrade soils were obtained for a sample compacted to 100 percent maximum density, specifications would appear to have seldom required compaction in the field to such a density though compaction at near optimum moisture content was considered essential.
But after a while it was realized that the value of the CBR determined in this way was not necessarily the most suitable value as regards stability and economy or in respect of volume change and subsequent distortion. It was also appreciated that the density used for determining the CBR had ~ be reproduced in the field.
A number of alternative methods of obtaining a suitable CBR value have thus been developed.
Some of the methods used for determining an acceptable value of the CBR are given below.
Granular Soils in Base, Subbase, or Subgrade (35 Percent or Less Passing No. 200 Sieve; P. I. Less Than 12 to 15)
Method 1. An elaborate approach, recommended for use until such time as the general characteristics of the material are known, is to plot the iso-CBR lines for soaked specimens on a family of compaction curves (using 6-in. diameter samples in the compaction test which can then be used for the penetration test to determine the CBR) and then to select, from such a plot a moisture content and density for compac-
288
tion which will give the maximum CBR or an economic value of the CBR to be used in design where the criteria for selection of moisture content and density must be such that they are obtainable with comparative ease with the equipment and other resources available. Such a plot is illustrated by Figure 2.
Method 2. As the above method is laborious and as it is known that granular materials can usually be easily compacted to high relative density to give a high CBR value after soaking, it is generally abbreviated to determine a CBR relationship with density for a constant compaction moisture content equal to modified optimum moisture content or to one slightly dry of modified optimum moisture content 5 to enable the maxi.mum CBR attainable to be used in design if so desired.
The CBR value most commonly used in design is that obtained from this relationship for a relative compaction of 95 percent maximum density though, with the exception of certain cohesionless soils that do not readily compact to higher densities, there is, in general, no reason why higher relative densities should not be specified.
The relationship is illustrated by Figure 3. It is unwise to adopt this method without having previously determined the typical
curves given by Method 1 because it is not always possible to recognize soils acting as granular soils on the basis of mechanical analysis alone.
Silt-Clay Soils (35 Percent or More Passing No. 200 Sieve; P. I. Greater Than 12 to 20)
The procedure is somewhat different for the non-granular and ~ohP.sivP m:;itPrial~ of the silt-clay group for with such materials the magnitude and effect of swell has also to be considered.
Most methods are but developments of Porter's realization that design must be based on the density and moisture content ultimately pertaining in the established road, that is, after both properties have reached equilibrium or an equilibrium cycle under field conditions.
Middlebrooks (19) was somewhat more specific: "The proper moisture content and unit weight for compaction control of a soil with a marked expansion characteristic are not necessarily the optimum moisture content and unit weight determined by compaction control tests but have been found to be equal to the moisture content and unit weight of an expanded sample after the soil is compacted and saturated. "
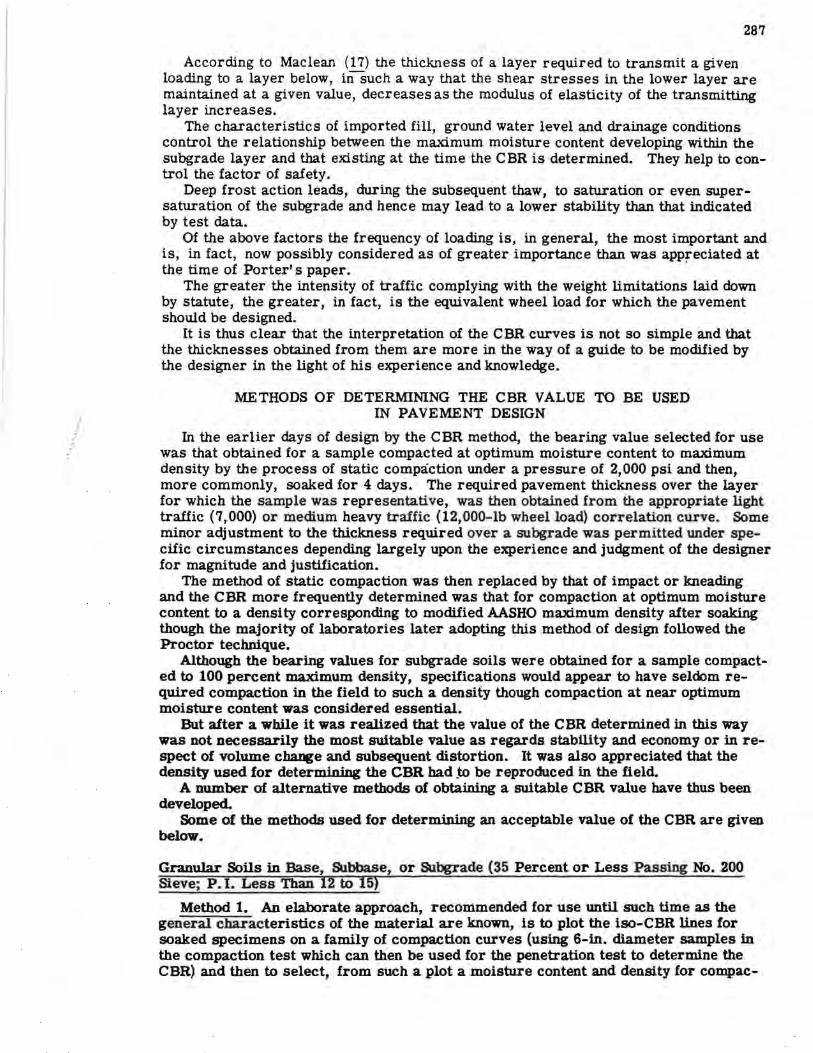
Hveem (7), using a different testing technique for stability, carried this approach to its logicii. conclusion and developed a method of design in which, using a suitable method of compaction and varying moisture contents for compaction, he ascertained the thickness of pavement required for both reasons of stability and overcoming the effects of swelling pressure. The moisture content which gave the same thickness of pavement for both stability and overcoming the swelling pressure gave him the moisture content for compaction.
The data used are illustrated by Figure 10. It is known that fine cohesive soils compacted under a high compactive effort will
not generally retain their density of compaction in the presence of moisture even when appreciably surcharged. They will absorb moisture and swell and in so doing their stability will drop to a low value. As has been previously discussed, this does not apply to all highly plastic soils though it probably does to the majority of such materials and especially to average clay soils.
For such materials, the maximum CBR (after soaking) and the minimum swell occur when they are compacted to maximum density at a moisture content close to Proctor optimum though in view of the low CBR values pertaining and the flatness of the CBR curve the moisture content of compaction may be varied quite appreciably without having very much effect on the thickness of pavement required.
It is this outlook which controls the general form of the test methods used for such materials. Though the methods to be described are attractive, it is not at all clear
5 Any saving in water to be added to a soil is particularly welcomed in tropical areas. (As a matter of convenience it is advisable to saturate thoroughly some pumice soils and leave overnight before compacting.)

that they carry for highly plastic materials the factor-of-safety to be expected from the methods more common to granular soils.
Method 3. This method, based very directly on the above observations, has been advocated by Kleyn (11).
Six-inch diameter samples are used
50
Clay Silt P. l = 13
45 ---------------~ -40=95%
-200=88%
Compact ive effort 40 1---- +------+--+-- slightly greater than
for standard AASHO
289
for obtaining the Proctor compaction ~ ~ curve. They are then soaked and used ~ 35 1----+----+--1--+----+:>,£---; a
0 > for determining a CBR-moisture content "' !
curve. The maximum CBR so obtained a: :l is used in design and a somewhat wider ~ 30 1---- -+------+---+--+-- ---r----1 ~ tolerance in the moisture content for com- >
paction than is allowed with better materials is permitted during construction.
The plot obtair ~d is illustrated by Figure 5.
Kleyn based this approach on a commonly held belief that the sensitivity of saturated samples to molding is believed to be sometimes more a function of the test procedure than of the material tested. This contention, though common, and apparently supported by the results of triaxial testing is certainly not held by all authorities many of whom place great stress on the importance of moisture control.
Method 4. Provided construction can be arranged to take place during a relatively dry period and that drainage conditions will be good the C BR values may be determined for unsoaked samples.
This method involves estimating-from local knowledge or other research-the
~ .. a; E 0
"' = .. JI
"' ~ 25 1----+----+------'1-1----+---~ ~
0 ;;;
.. .. .. c ...
~ u ~ ~
~ 1 5 1--___..,,..'--+-----+-_,,,.-~-----t----1 ~ ... .~ .t: ~
Note: Tnt drier the compacted sail, the greater the swelling pressure
o.__ __ ...__ _ _ -'----'-- --'---- -' 12 14 16 18 20 22
Molding Moisture Content, % dry weight
Figure 10. After (1).
ultimate or maximum moisture content likely to occur eventually in the subgrade layer. Design is then based on the CBR obtained by penetrating unsoaked samples molded
at such a moisture content and compacted to a density corresponding to 5 percent airvoids content. Construction, of course, provides for compaction at that moisture content and to the density determined as described.
The above method has been suggested by Maclean ( 18) presumably for silt-clay soils.
Note on Subgrade Layer
The subgrade layer is the layer of material lying immediately below the subgrade and extending to include the depth affected by climate and stress caused by traffic. It varies in thickness from about 6 to 24 in. depending upon the climate and the nature and volume of traffic. The moisture content for compaction and the desired density will depend upon the considerations discussed above.
In general, the subgrade layer will be Constructed in the same material as used for the embankment below. It will differ from the embankment in the additional care in control over the moisture content of compaction and possibly in the density to be achieved. The thickness will be determined from considerations of stability and climate. In areas of deep frost penetration it may be necessary to import a material more resistant to frost action than that used in the embankment proper.

290
DETERMINATION OF CBR FOR SPECIAL PURPOSES
Subgrade in Cut
When subgrade is in cut, it is common to determine the CBR for the unsoaked and undisturbed condition provided the subgrade is unlikely to be damaged by construction traffic and is unlikely to dry out or be damaged by weathering before being covered by a base or subbase course.
If there is any likelihood of the subgrade becoming saturated by rain before it can be adequately covered then this method is no longer valid and design must be based on CBR' s obtained after soaking.
Depending upon the results of testing, it may be more economic to scarify to a depth of about 7 in. and recompact to some satisfactory density giving a higher CBR value.
Embankments
The reasons for compacting embankments, below the subgrade layer, are to prevent detrimental settlement and to aid in providing stable slopes through the inherent stability of the compacted material.
According to Maclean (18), little settlement is likely to occur in embankments if the density achieved duringconstruction is such that the air content does not exceed 10 percent.
The minimum densities required depend on (6): the soil type, the height of embankment, tne aesign slopes, and the condition of exposure.
Minimum values recommended by the Highway Research Board (6) to satisfy these requirements are given in Table 1. -
Close moisture control is not usually required during compaction. The amount of necessary moisture content control will be determined by the desire
to (a) avoid a condition of low stability, (b) avoid an uneven and drainage impeding layer surface caused by rutting, (c) obtain the greatest resistance to water-absorption when the sides of the embankment are likely to be subjected to wetting by flooding, and
TABLE 1
RECOMMENDED MINIMUM REQUIREMENTS FOR COMPACTION OF EMBANKMENTS
Condition 1 Condition 2
Class (not subject to inundation) (subject to periods of inundation)
of Compaction Compaction Soil Height of Fill Slope (% AASHO Height of Fill Slope (% AASHO
(ft) max. den.) (ft) max. den.)
A-1 Not critical 1%:1 95+ Not critical 2:1 95 A-3 Not critical 1%:1 100+ Not critical 2:1 100+ A-2-4 Less than 50 2:1 95+ Less than 10 3:1 95 A-2-5 Less than 50 2:1 95+ 10-50 3 :1 95-100 A-4 Less than 50 2:1 95+ Less than 50 3:1 95-100 A-5 Less than 50 2:1 95+ Less than 50 3 :1 95-100 A-6 Less than 50 2:1 90-95(a) Less than 50 3 :1 95-100 A-7 Less than 50 2:1 90-95(a) Less than 50 3:1 95-100
Remarks: Recommendations for Condition 2 depend upon height of fills. Higher fills of the order of 35 to 50 ft should be compacted to 100 percent at least for part of fills subject to periods of inundation. Unusual soils which have low resistance to shear deformation should be analyzed by soil-mechanics methods to determine permissable slopes and minimum compacted densities. (a) The lower values of minimum requirements will hold only for low fills of the order of 10 to 15 ft or less and for roads not subject to inundation not carrying large volumes of very heavy loads.

291
·"-ill thus depend, to some extent, on the natural moisture content of the material as <' xcavated and on the nature of the equipment available for compaction.
Ii flooding is likely, then the material should be compacted at a moisture content as ::ear optimum as is feasible.
If flooding will not occur and (a) the material is excavated and compacted dry of ,1ptimum, then no moisture control is necessary though naturally the soil must be wet t'nough to be compacted economically, (b) the material is excavated wet of optimum then it should be allowed to dry out to a moisture content of between optimum and 3 percent wet of optimum where the higher limit applies to the more plastic materials.
The more uniform the moisture content of compaction, the less likelihood there will be of surface distortion. For designing a pavement to be constructed over an ex!sting embankment built on a stage construction basis, the CBR is frequently determined for the unsoaked condition.
S'ubgrade Investigations
During investigations into the strength of an existing subgrade which has been down for some years, the CBR is generally determined for unsaturated undisturbed samples.
It may be noted that undisturbed time-cured cohesive samples generally absorb but little extra moisture and only then with difficulty. They tend to give higher CBR values than those determined by the more normal test involving compaction at site moisture content to site density. The difference between the two values may, however, be low for clay soils and tends to increase with decreasing plasticity. For low plasticity material, the value for the undisturbed sample may be of the order of twice that determined for a sample after compaction to modified maximum density and soaking.
Determination of Pavement Thickness in a Stage Construction Project
If it is desired to determine the pavement thickness required for the bituminization of a graveled road and if it is not desired to recompact the existing surface course or its subgrade but to use the existing surface course as a subbase, then it must be remembered that it is possible that the existing subgrade is not at its maximum moisture content. As part of a planned stage construction project, it is likely that the moisture content of the subgrade layer at the time of its compaction and the density to which it was compacted are known but the CBR corresponding to such data can only be used in pavement design if it is known that the subgrade was covered after compaction by a surface course of a thickness corresponding to the surcharge to be expected from the completed bituminized pavement thickness, that this surcharge was maintained and that this (temporary) surcharge was applied before the moisture content of the subgrade had an opportunity of increasing as under the action of appreciable rain.
If initial data are unavailable or unreliable for the reasons enumerated above, then the CBR to be used in the pavement design may be estimated from samples made up to reproduce site moisture contents and densities and then saturated for four days or after they have been brought up to some other desired moisture content based on local observations before penetration. This method may give only an approximation of the CBR value sought as any hysteresis, due to wetting and drying cycles which have occurred since construction, would imply that the wetting curve for the undisturbed subgrade would not follow that applicable during the test. Nevertheless, if the CBR be determined for the saturated condition any error is likely to be small. The CBR so obtained may be checked against that obtained for an undisturbed sample after soaking or being brought up to some other desired moisture content.
Failure Investigations
The determination of the CBR for use in checking the design of a road already bituminized, as might arise during the investigation into the causes of a pavement failure, presents a problem as the moisture content at the time of compaction and the density to which the subgrade layer was compacted would often be unknown.
Certain assumptions are necessary and one commonly made is that the subgrade

292
layer has reached its maximum moisture content and this is likely to be so in the instance of a failure.
To reconstitute a sample in the laboratory to duplicate site conditions of moisture content and relative compaction at the time of the investigations may or may not give an approximation of the site CBR-much depends upon the properties of the soil.
The most satisfying method of estimating the CBR is by penetrating an undisturbed sample or by means of the site CBR test. ·
Variation in Specifications Arising Out of Some Construction Difficulty
Experience shows that it is sometimes necessary to design the pavement thickness for construction at optimum moisture content to some fraction of the maximum density or even to some fraction of the maximum density at a moisture content other than the optimum favored by the Materials Laboratory. The applicable CBR for use in design will not, of course, be that determined for compaction to maximum density at the favored optimum moisture content. In both instances the CBR attainable during construction may be greater or less than that ascertained by standard test and in the latter instance the difference between the laboratory determined and the site attained CBR' s may be considerable.
The chart of iso-CBR lines referred to under Method 1 will give the design CBR for the density 6 reached after compaction at any moisture content of compaction within the range of mni stnrP f'nntPnti:i r-nvPrPn l:'iy th~ o:h?.rt.
NOTE ON SELECTION OF A SUITABLE COl\.1P.A~CTICN
As has been seen the density required is predetermined by considerations of settlement, strength and volume change, where the density required expressed in pounds per cubic foot will vary with the grading of the material used. This density cannot always be safely estimated, in the absence of test data, in terms of a relative compaction or a percentage of the maximum density determined under some standard method of compaction.
McDowell (15) and Burmister (3) have called attention to the unreality of such terms as relative compaction which is based on the "fallacy that zero percent compaction can represent a unit weight of zero for any soil."
The use of such expressions, as occurs in some specifications may cause overcompaction of clays and undercompaction of granular soils.
When full testing for suitab,le density is impossible, for the want of time, McDowell has recommended as a guide:
1. For clay soils: Compact to a maximum density as determined by 58 + ~~ where values of 5 to 10 lower are acceptable. 0 ·
2. For granular base materials: Compact to a minimum density of 58 + 3. ~ where DL = loose density of the material as determined for clean sands and granular materials by rodded unit weight test (ASTM Designation C 29-42) and for other soils by determining the dry weight per cubic foot of the soil shrinkage pat (molded at liquid limit) and correcting for any plus No. 40 material which, under field conditions, will be floating soil.
8 It may be noted that it is not, in general, possible to compact a soil at the design optimum moisture content to a density appreciably greater than the relevant maximum density and that the difference possible decreases as the compactive effort increases. This is despite site data purporting to show this having been achieved. What actually happens is that either the compaction was attained at a moisture content less than the specified optimum or the density measured was that applicable after the compacted material had been allowed to dry out and shrinkage has occurred. If the densities are measured after some drying out has occurred, it is impossible to say, from the data more normally available, whether the specifications have been met or not.

· ..
EFFECT OF CLAY MINERAL AND REPLACEABLE BASES ON DENSITY AND STABILITY
293
The maximum density and stability of a finely graded soil depend upon the nature and amount of the clay mineral or minerals present and upon homoionic variations of those minerals but the manner in which these variations occur is as yet unknown in general terms.
Data presented by Lambe and Martin (12b) and in many of Winterkorn' s papers suggest that the effect of ionic modifications oCa highly active Clay mineral on the maximum density and stability may be considerable.
DETERMINATION OF PAVEMENT THICKNESS FROM THE CBR CURVES
The CBR-pavement thickness correlation curves are used in a number of ways varying from the hit-and-miss method of selecting a 7,000-lb, a 9,000-lb, or a 12,000-lb wheel load curve, according to the judgment of the designer, to the elaborate methods used in Wyoming (24a) and Colorado (12c).
In the former state, factors are given for rainfall, water table depth, frost action, drainage and repetitions of one-way traffic over 20 years expressed in equivalent 5,000-lb wheel loads. The sum of the values given to the factors determines the appropriate CBR curve for use.
In the latter state, factors are assigned for frost penetration, moisture conditions and commercial tr'affic in vehicles per day. The sum of the assigned values gives the CBR curve for use in design.
Similar considerations feature in the Michigan method (18b, 18c) and that adopted by the County Roads Board of Victoria, Australia since 1945 (28). -
Of the many ways of using the CBR curves, as adopted mdifferent parts of the world, a method envisaged in the original California procedure is emerging as the most acceptable method for those areas where frost action is not of prime importance. It is based on a straightforward corre.lationship between pavement thickness and CBR value through the medium of the volume of commercial traffic. It is justified by the known fact that commercial traffic is considerably more damaging to a bitumen surfaced road than private passenger traffic and that commercial traffic generally uses the same traffic lane when there is more than one traffic lane in each direction.
As has been noted, California used, in the days when the state utilized the CBR method of design, two correlation curves-one for "light traffic" and one for "mediumheavy traffic." Steel based his Group Index method of design on "light," "medium" and "heavy" traffic volumes. Missouri (4) adopted this approach and developed it to provide for various ranges of commercial traffic volumes using the road each day. England (18) has since advocated the use of a similar set of curves.
Thevalidity of this approach follows as a logical deduction from American wartime experience in the construction of landing grounds.
The American Corps of Engineers developed the CBR design method for the purpose of applying it to runway construction but they soon appreciated that it would be thoroughly uneconomic to use the design thickness given by that method for runways only likely to be used for a few months or even days. They therefore collected data and plotted the percentage of design thickness re-quired against "coverages" necessary to cause subgrade failure (16), see Figure 11. -
Runways are designed to carry the heaviest loads using them and the life of a runway so designed corresponds to approximately 5,000 coverages where 5,000 coverages corresponds to some 150,000 passages by such vehicles.
The maximum legal wheel load in England and the U. S. A. may be taken to be 9,000 lb, and the 9,000-lb wheel load
.. 120 .. • c 100 .... .!:! ~ eo c ·i! 60 • 0 0 40
"a' 20
_./' ~
_,...,,. ~
~ ..--
,...
10 20 50 100 200 500 1,000 2,000 5,000 Coverages
Figure ll.. After (16).
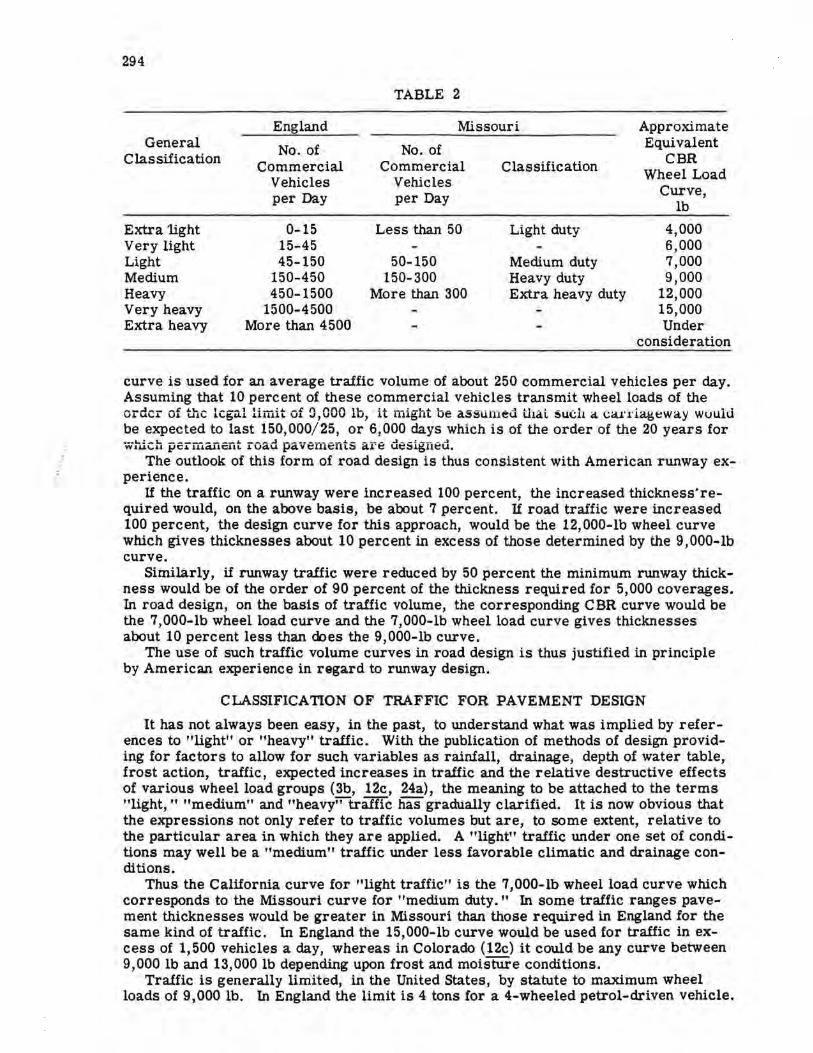
294
TABLE 2
England Missouri Approximate General No. of No. of Equivalent
Classification Commercial Commercial Classification CBR
Vehicles Vehicles Wheel Load
per Day per Day Curve, lb
Extra 'light 0-15 Less than 50 Light duty 4,000 Very light 15-45 6,000 Light 45-150 50-150 Medium duty 7,000 Medium 150-450 150-300 Heavy duty 9,000 Heavy 450-1500 More than 300 Extra heavy duty 12,000 Very heavy 1500-4500 15,000 Extra heavy More than 4 500 Under
consideration
curve is used for an average traffic volume of about 250 commercial vehicles per day. Assuming that 10 percent of these commercial vehicles transmit wheel loads of the order of t.'lc legal limit of !l,000 lb, it might be assumed U1al ~uci1 a cai·.l'iagt:!way would be expected to last 150,000/25, or 6,000 days which is of the order of the 20 years for which permaI1ent rnad pavements a:re designed.
The outlook of this form of road design is thus consistent with American runway experience.
If the traffic on a runway were increased 100 percent, the increased thickness·required would, on the above basis, be about 7 percent. If road traffic were increased 100 percent, the design curve for this approach, would be the 12, 000-lb wheel curve which gives thicknesses about 10 percent in excess of those determined by the 9,000-lb curve.
Similarly, if runway traffic were reduced by 50 percent the minimum runway thickness would be of the order of 90 percent of the thickness required for 5,000 coverages. In road design, on the basis of traffic volume, the corresponding CBR curve would be the 7,000-lb wheel load curve and the 7,000-lb wheel load curve gives thicknesses about 10 percent less than does the 9,000-lb curve.
The use of such traffic volume curves in road design is thus justified in principle by American experience in regard to runway design.
CLASSIFICATION OF TRAFFIC FOR PAVEMENT DESIGN
It has not always been easy, in the past, to understand what was implied by references to "light" or "heavy" traffic. With the publication of methods of design providing for factors to allow for such variables as rainfall, drainage, depth of water table, frost action, traffic, expected increases in traffic and the relative destructive effects of various wheel load groups (3b, 12c, 24a), the meaning to be attached to the terms "light," "medium" and "heavyj'j""""traffic has gradually clarified. It is now obvious that the expressions not only refer to traffic volumes but are, to some extent, relative to the particular area in which they are applied. A "light" traffic under one set of conditions may well be a "medium" traffic under less favorable climatic and drainage conditions.
Thus the California curve for "light traffic" is the 7,000-lb wheel load curve which corresponds to the Missouri curve for "medium duty." In some traffic ranges pavement thicknesses would be greater in Missouri than those required in England for the same kind of traffic. In England the 15,000-lb curve would be used for traffic in excess of 1,500 vehicles a day, whereas in Colorado (12c) it could be any curve between 9,000 lb and 13,000 lb depending upon frost and moisture conditions.
Traffic is generally limited, in the United States, by statute to maximum wheel loads of 9,000 lb. In England the limit is 4 tons for a 4-wheeled petrol-driven vehicle.

295
For the purpose of designing the thickness of the road structure, only those wheel loads in excess of 4,500 lb are normally considered in the U.S. A. when designing on the traffic volume basis. In England, the tendency is to include in the traffic count all buses and commercial vehicles excluding only light delivery vans and 3-wheelers though sometimes the design traffic is specified as of those vehicles per day exceeding 3 tons in loaded weight ( 3c).
The intensity of such traffic is obtained by a traffic count of such vehicles or is estimated from a percentage of the total traffic count. Percentages used vary from the more normal 10 to 15 percent of the total traffic in well developed areas to 25 percent as used in Colorado (12c). In undeveloped areas, as in the Commonwealth, it may reach as high a figure as 80 percent.
The number so obtained is then increased by a percentage of development expected to occur during a period of commonly 20 years and the average of the two values is taken for use in design. It may well be that in a fully developed area, there will be no appreciable increase in traffic and that no adjustment of the present traffic count is necessary.
To convert traffic data into equivalent 5,000-lb wheel loads, when that basis is used for determining pavement thicknesses, various factors are introduced including one for a correction for the average number of axles per vehicle.
On the above basis for measuring traffic volumes and using the British classification breakdown, traffic may be classified as regards effect.
Table 2 gives the Missouri classification for comparison together with the corresponding CBR curves used in design in both England and Missouri for the appropriate traffic volume ranges quoted.
REFERENCES
1. American Road Builders Association, "Compaction of Soils." Tech. Bul. No. 120, p. 23 (1947).
2. Barber, E. S., Discussion on "Reduction in Soil Strength with Increase in Density." Proc. Amer. Soc. of Civ. Eng., 79 ( 1953).
3. Burmister, D. M., "The Importance and Practical Use of Relative Density in Soil Mechanics." 48, Proc. of Amer. Soc. of Testing Materials.
3a. Croney, D., "The Movement and Distribution of Water in Soils." Geotechnique (March 1952).
3b. California Highways and Public Roads (March 1942). 3c. Corps of Engineers, Dept. of the Army (U.S.A.), "Symposium on Asphalt Pav
ing Mixtures." Research Report No. 7-B, Highway Research Board, "Laboratory Study of Asphalt Paving Mixtures," W. K. Boyd (1949).
4. Davis, W. C., and Jones, W. G., "Flexible-Pavement Design by the Group Index Method." Highway Research Board, Research Report 16-B (1954).
5. Griffith, J.M., "Wheel Load Tests, Marietta, Ga." Symposium "Development of C. B. R. Flexible Pavement Design Method for Airfields," Trans. Amer. Soc. of Civ. Eng. 115 (1950).
6. Highway Research Board, "Compaction of Embankments." Bulletin 58 (1952). 6a. Herner, R. C., "Effect of Base-Course Quality on Load Transmission through
Flexible Pavements." Proc. High. Res. Board, 34 (1955). 7. Hveem, F. N., and Carmany, R. M., "The Factors Underlying the Rational De
sign of Pavements." Proc. of High. Res.· Board, 28 (1948). 8. Jervis, W. H., and Eustis; J.B., "Accepted Procedure for the C. B. R. Test."
Symposium "Development of C. B. R. Flexible Pavement Design Method for Airfields," Trans. of Amer. Soc. of Civ. Eng., 115 (1950).
9. Johnson, A. W., "Practical Density Limits for Highway Subgrades and Bases." Amer. Road Builders' Assoc., Tech. Bul. No. 203 (1954).
9a. Kersten, M. S., "Survey of Subgrade Moisture Conditions." Proc. of High. Res. Board, 24 (1944).
10. Kleyn, S. A. , "Methods of Soil Testing as Applied to the Design of Road Foundations." Proc. of South African Soc. of Civ. Eng., 44 (1946).

296
11. Kleyn, S. A., "Possible Developments in Pavement Foundation Design." Proc. of First Southern African Regional Conf. on Soil Mechanics and Foundation Engineering, Trans. of the South African Inst. of Civil Engineers (Sept. 1955).
12. Kleyn, S. A., "Method of Soil Testing as Applied to the Design of Road Foundations." Proc. of South African Soc. of Civ. Eng., 44 (1946).
McDowell, C., "Progress Report on Development and Use of Strength Tests for Subgrade Soils and Flexible Base Materials." Proc. of High. Res. Board, 26 (1946).
American Road Builders' Assoc. , "Compaction of Soils." Tech. Bui. No. 120 (1947).
Symposium, "Development of C. B. R. Flexible Pavement Design Method for Airfields." Trans. of Amer. Soc. of Civ. Eng., 115 (1950).
Redus, J. F., and Foster, C.R., "Moisture Conditions under Flexible Pavements." Symposium, "Frost Action in Soils," Special Report No. 2, High. Res. Board (1951).
Foster, C.R., "Reduction in Soil Strength with Increase in Density." Proc. of Amer. Soc. of Civ. Eng., 79 (1953).
Johnson, A. W., "Practical Density Limits for Highway Subgrades and Bases." Amer. Road Builders' Assoc., Tech. Bui. No. 203 (1954).
Seed, H.B. , and Monismith, C. L. , "Relationship between Density and Stability of Subgrade Soils." High. Res. Board Bul. '93 (1954).
Seed, H.B., Lundgren, R., and Chan, C. K., "Effect of Compaction Method on Stability and Swell Pressure of Soils." High. Res. Board BuC 93 (1954),
12a. Leclerc, R. V., "How to Handle Swelling Soils." 7th Northwest Conf. on Road Building at More Hall, Univ. of Washington ·(Feb. 18, 1954).
12b. Lambe, T. W., and Martin, R. T., "Composition and Engineering Properties of Soil." Proc. High. Res. Board, 32-35 (1953-1956).
12c. Livingstone, R. E., "Design of Flexible Bases." Proc. of High. Res. Board, 27 (1947).
13. Leonards, G. A., "Strength Characteristics of Compacted Clays." Proc. Amer. Soc. of Civ. Eng., 79 (1953).
14. McDowell, C., "Progress Report on Development and Use of Strength Tests for Subgrade Soils and Flexible Base Materials." Proc. of High. Res. Board, 26 (1946).
15. McDowell, C., "Selection of Densities for Subgrades and Flexible-Base Materials." High. Res. Board Bul. 93 (1954).
16. McFadden et al., "Development of C. B. R. Flexible Pavement Design Method for Airfields." Symposium, Trans .. of Amer. Soc. of Civ. Eng., 115 (1950).
17. Maclean, D. J. , "Considerations Affecting the Design and Construction of Stabilised-Soil Road Bases. " Inst. of Highway Engineering Jour. , Vol. Ill, 9 ( 19 55).
18. Maclean, D. J., "The Application of Soil Mechanics to Roads and Engineering Foundations." Jour. of Inst. of Municipal Engineers, 81 (1955).
18a. Markwick, A. H. D. , "The Basic Principles of Soil Compaction and Their Application." Road Paper No. 16, Inst. of Civ. Eng. (Nov. 1944). .
18b. McLaughlin, W.W., and Stokstad, 0. L., "Design of Flexible Bases in Michigan." Proc. of High. Res. Board, 26 (1946).
18c. Michigan State Highway Dept., "Field Manual of Soil Engineering." (Feb. 1946).
19. Middlebrooks, T.A., and Bertram, G.E., "Soil Tests for Designs of Runway Pavements." Proc. of High. Res. Board, 2~! (1942). -
20. National Road Board, "A Triaxial Shear Investigation for Some Soils." Pretol-ia, South Africa (1946). .
21. National Road Board, "Observations on the Effect of Soaking Time on the C. B. R.' s of Some Soils." Pretoria, South Africa ( 1946).
22. Porter, 0. J., "The Preparation of Subgrades." Proc. of High. Res. Board, 18 (1938).
"Foundations for Flexible Pavements. n Proc. of High. Res. Board, 22 ( 1942).
23. Porter, 0. J., "Development of the Original Method for Highway Design." Symposium, "Development of C. B. R. Flexible Pavement Design Method for Airfields, "

"
•,•
. ·
.. ·· .. :::··
\.
297
Trans. of Amer. Soc. of Civ. Eng., 115 (1950). 24. Redus, F. J., and Foster, C.R., "Moisture Conditions under Flexible Airfield
Pavements." Symposium, "Frost Action in Soils," Special Report No. 2, High. Res. Board (1951).
24a. Russell, I.E., and Olinger, D. J., "Wyoming Method of Flexible Pavement Design." Proc. of High. Res. Board, 27 (1947).
25. Seed, H.B., and Monismith, C. L., "Relationship between Density and Stability of Subgrade Soils." High. Res. Board Bul. 93 (1954).
26. Seed, H. B. , Lundgren, R. , and Chan, C. K. , "Effect of Compaction Method on Stability and Swell Pressure of Soils." High. Res. Board Bul. 93 (1954).
27. Turnbull, W. J. , "Appraisal of the C. B. R. Method, " Symposium, "Development of C. B. R. Flexible Pavement Design Method for Airfields," Trans. of Amer. Soc. of Civ. Eng., 115 (1950).
28. Victoria County Roads Board, Chief Engineer's Report, Melbourne, Australia (1945).
29. Darwin, D. V., "Roads in Victoria." Roads and Road Construction, Vol. 35, Nos. 417 and 418 (Sept. and Oct. 1957) .