Mohammed A. Noman Ali K. Kamrani Haitham A. Mahmoud
22
Mohammed A. Noman Adel AL-Shayea Emad Abouel Nasr Husam Kaid Abdulrahman Al-Ahmari Ali K. Kamrani Haitham A. Mahmoud https://doi.org/10.21278/TOF.451021920 ISSN 1333-1124 eISSN 1849-1391 A MODEL FOR MAINTENANCE PLANNING AND PROCESS QUALITY CONTROL OPTIMIZATION BASED ON EWMA AND CUSUM CONTROL CHARTS Summary The performance of a production system is highly dependent on the smooth operation of various equipment and processes. Thus, reducing failures of the equipment and processes in a cost-effective manner improves overall performance; this is often achieved by carrying out maintenance and quality control policies. In this study, an integrated optimization method that addresses both maintenance strategies and quality control practices is proposed using an exponentially weighted moving average (EWMA) chart, in which both corrective and preventive maintenance policies are considered. The integrated model has been proposed to find optimal decision variables of both the process quality decision parameters and the optimal interval of preventive maintenance (i.e., Ns, Hs, L, λ, and ெ ) to result in overall optimal expected hourly total system costs. A case study is then utilized to investigate the impact of cost criteria on the proposed integrated model and to compare the proposed model with a model using the cumulative sum (CUSUM) control chart. The improved model outputs indicate that there is a reduction of 34.6% in the total expected costs compared with those of the other model using the CUSUM chart. Finally, an analysis of sensitivity to present the effectiveness of the model parameters and the main variables in the overall costs of the system is provided. Key words: optimization model, maintenance planning, process quality control, EWMA chart, CUSUM chart 1. Introduction The output of any given production system heavily depends on the failure-free equipment producing products with no defects. Thus, decreasing equipment failures improves the overall performance; this goal can be achieved by carrying out maintenance and quality control policies. Reducing the machine breakdowns or failures leads to enhanced product quality and reduces production costs; this can be achieved by employing appropriate preventive maintenance (PM) strategies. Similarly, quality control programs have been designed to identify process abnormalities; however, both PM and quality control methods increase costs, including the costs of downtime, maintenance, replacement, sampling, and inspection. Traditionally, researchers have independently focused on improving these TRANSACTIONS OF FAMENA XLV-1 (2021) 95
Transcript of Mohammed A. Noman Ali K. Kamrani Haitham A. Mahmoud
Mohammed A. Noman Adel AL-Shayea Emad Abouel Nasr Husam Kaid Abdulrahman Al-Ahmari Ali K. Kamrani Haitham A. Mahmoud
https://doi.org/10.21278/TOF.451021920 ISSN 1333-1124
eISSN 1849-1391
A MODEL FOR MAINTENANCE PLANNING AND PROCESS QUALITY CONTROL OPTIMIZATION BASED ON EWMA AND CUSUM CONTROL CHARTS
Summary
The performance of a production system is highly dependent on the smooth operation of various equipment and processes. Thus, reducing failures of the equipment and processes in a cost-effective manner improves overall performance; this is often achieved by carrying out maintenance and quality control policies. In this study, an integrated optimization method that addresses both maintenance strategies and quality control practices is proposed using an exponentially weighted moving average (EWMA) chart, in which both corrective and preventive maintenance policies are considered. The integrated model has been proposed to find optimal decision variables of both the process quality decision parameters and the optimal interval of preventive maintenance (i.e., Ns, Hs, L, λ, and 𝑡 ) to result in overall optimal expected hourly total system costs. A case study is then utilized to investigate the impact of cost criteria on the proposed integrated model and to compare the proposed model with a model using the cumulative sum (CUSUM) control chart. The improved model outputs indicate that there is a reduction of 34.6% in the total expected costs compared with those of the other model using the CUSUM chart. Finally, an analysis of sensitivity to present the effectiveness of the model parameters and the main variables in the overall costs of the system is provided.
Key words: optimization model, maintenance planning, process quality control, EWMA chart, CUSUM chart
1. Introduction The output of any given production system heavily depends on the failure-free
equipment producing products with no defects. Thus, decreasing equipment failures improves the overall performance; this goal can be achieved by carrying out maintenance and quality control policies. Reducing the machine breakdowns or failures leads to enhanced product quality and reduces production costs; this can be achieved by employing appropriate preventive maintenance (PM) strategies. Similarly, quality control programs have been designed to identify process abnormalities; however, both PM and quality control methods increase costs, including the costs of downtime, maintenance, replacement, sampling, and inspection. Traditionally, researchers have independently focused on improving these
TRANSACTIONS OF FAMENA XLV-1 (2021) 95
M.A. Noman, A. AL-Shayea, E.A. Nasr, A Model for Maintenance Planning and H. Kaid, A. Al-Ahmari, Process Quality Control Optimization Based on A. K. Kamrani, H.A. Mahmoud EWMA and CUSUM Control Charts
activities. However, they showed a correlation between equipment maintenance and equipment performance or process quality. Maintenance procedures increase the life of equipment, thus improving process quality [1]. Therefore, both maintenance and process quality strategies are taken into consideration in order to improve throughput of a production system. Recent studies have shown that research interest focused on common considerations.
This study provides an integrated approach to determine the expected optimal total costs, corrective and preventive maintenance, PM process, process failure, sampling, and inspection pass as well as jointly optimize the maintenance procedure and parametric quality control charts. In many PM models, the system assumes a match between the two situations, i.e., the new and the old state, during each PM action. When the failure mode in the system changes, the system is maintained in a preventive way. One method of designing a model is to consider incomplete maintenance. After each action of the new PM, the system is as bad as the old one. Each specific PM program should reduce the failure rate and improve the service life of the equipment. When the PM system model is designed with incomplete maintainability, it is assumed that every PM process will change the failure behaviour of the equipment. Therefore, this will affect the control strategy. In addition to incomplete maintenance, exponentially weighted moving average (EWMA) chart has been recently used [2].
PM procedures are implemented to measure the change of a quality control variable with product characteristic deviation. Therefore, implementing PM procedures can improve the product quality by reducing the deviation of a target value. The purpose of this study is to develop a common model that would involve maintenance strategy, quality control, and common optimization simultaneously. This study primarily provides a generalized model for improving maintenance procedures and process control strategies as well as the classification methods of equipment and process faults. In the proposed chart, the direct execution of a corrective maintenance (CM) action indicates a complete failure of a component. Furthermore, to determine the actual operational status, the control chart is used in the control and evaluation process. A CM action is then executed to restore the control state when a part of the machine fault with degraded quality is detected. The proposed method should thus present two main advantages: i) elimination of the quality costs related to an out-of-control operation due to either machine degradation or external reasons, and ii) improved reliability of a machine by protecting it against failures.
2. Literature Review
2.1 Analysis of published papers In this section, prior studies related to the incorporation of maintenance and quality
control systems and related observations are summarized. Researchers interested in maintenance-related literature and design of quality control charts should refer to studies [3-10]. Ben-Daya and Duffuaa [11] stressed the importance of the incorporation of the process quality control in PM. Rahim [12] incorporated PM time and X control chart to monitor a system’s increase in failure rate with produced units to determine optimal design parameters. Rahim [13], Ben-Daya [14], and Ben-Daya and Rahim [15] aimed to decrease the increasing hazard rate because of process deterioration during the in-control period by integrating a PM action and X control chart. Cassady [16] studied the incorporation of an X-chart and a PM action based on age of equipment. Yeung [17] and Cassady [16] developed a model for maintenance and quality simultaneously using an X-chart for process monitoring in a production system and they determined optimal decision variables of the control chart and the optimal maintenance interval for corrective and condition-based maintenance. Readers interested in more details on these integrated models should refer to Ben-Daya and Rahim’s [18] overview of integrated models combining production processes, quality control methods, and maintenance procedures.
96 TRANSACTIONS OF FAMENA XLV-1 (2021)
A Model for Maintenance Planning and M.A. Noman, A. AL-Shayea, E.A. Nasr, Process Quality Control Optimization Based on H. Kaid, A. Al-Ahmari, EWMA and CUSUM Control Charts A. K. Kamrani, H.A. Mahmoud
Common maintenance of mechanical equipment and product quality control in different times and under limited visibility and degraded production systems have been studied in the Markovian group [19]. Lindermand [20] provided a general analysis model to determine how to coordinate SPC and planned maintenance procedures to reduce the total costs. To make the best use of PM procedures, two quality-related economic models were then introduced by Panagiotidou and Tagaras [21]; moreover, Panagiotidou and Tagaras [22] developed an economic model to maximize ideal and incomplete maintenance procedures, e.g., two operating conditions of equipment such as in-control and out-of-control states and in SPC. Chiu and Huang [23] proposed a model to design an optimal PM control chart using a fixed sampling interval and risk increase rate. In addition, they believe that after PM, the production system will become a good new state. By combining the economic design and maintenance management of the control chart, Zhou and Zhu [24] established a comprehensive cost optimization model using a network search method. Here, the comprehensive cost optimization model was analyzed to identify the optimal value of variables, including sample size (Ns) and sample frequency (Hs), and they displayed the corresponding standard deviation of the control chart (L) and control coefficient (𝜆) to reduce the total costs per unit time. Recently, the studies of Panagiotidou and Nenes [25] proposed a controller design chart that adopts Shewhart’s development model, which combines the maintenance procedure and quality control strategy. Pandey et al. [26] provided an integrated approach to improve operational policy maintenance, shop scheduling, quality control, production scheduling, and production system control.
This integrated maintenance and quality control model uses a PM parametric control chart to provide an optimal time interval and reduce the total costs of the system, as well as to carry out an optimal PM interval and identify an optimal payment order in the production process, which reduces penalty costs because of the schedule delay [27]. Pandey et al. [26] also proposed a compact model to optimize PM intervals and a parameterized control chart using a compact Taguchi loss function to reduce the total costs per unit time. Liu et al. [28] studied identical series systems of two units and developed economical designs suitable for the system’s X control chart and used five continuous phases of the Markov chain approach to describe the identical series systems, thus determining improved control plan parameters using an economic design to reduce maintenance costs. Manafizadeh and Javan [29] advanced a model to optimize maintenance planning, monitor the quality of the operation and schedule production. The model uses a cumulative sum (CUSUM) chart to control and improve the quality of the process and to reduce production defects. Yen et al. [30] developed an integrated mathematical approach to control the statistical process and maintenance decisions, reduce the expected costs and improve the decision variable selection using a genetic algorithm. Divya et al. [31] provided an incorporated approach to shared PM procedures and process quality control strategy using CUSUM control chart parameters. Their model was then used to identify an optimal value of five resolution variables, (Ns, Hs, 𝜆, tPM, and resolution break (L)), thus reducing the projected total costs of the system. Lu et al. [32] proposed a reliability model integrating quality improvement policy into PM using a decision-making approach that merged the quality loss into the total costs to determine an optimal schedule of PM actions.
2.2 Open problems in related studies The following open problems have been observed in the studies on this subject: 1. Integrated models have not been able to account for the downtime due to a failure or
improper performance of equipment which required maintenance action. They have instead only focused on practical quality problems.
2. Most of the maintenance models from the literature interested in comprehensive PM or preventive replacement policies deal with restoring the equipment to a good-as-new state.
TRANSACTIONS OF FAMENA XLV-1 (2021) 97
M.A. Noman, A. AL-Shayea, E.A. Nasr, A Model for Maintenance Planning and H. Kaid, A. Al-Ahmari, Process Quality Control Optimization Based on A. K. Kamrani, H.A. Mahmoud EWMA and CUSUM Control Charts
3. There currently exists no clear way to determine an optimal number of observations in internal and external control systems in a process quality control model.
4. As regards the loss of product quality caused by the failure of equipment, which leads to the scrapping of products, any costs should include manufacturing costs, time loss, repair costs, replacement and product rejection costs; this has not yet been incorporated in any model.
5. In any production system, when the production rejection costs are high, CM costs exceed PM costs, thus reducing the PM period. This aspect has largely been ignored in prior models to improve maintenance.
Therefore, this study aims to develop an integrated optimization method that addresses both maintenance strategies and quality control practices. For this purpose, CM and PM processes, process failures, sampling rates, and inspection passes are determined while optimizing the expected total costs. Thus, the developed model will offer improved maintenance procedures, process control strategies, and classification methods for equipment and process faults. Furthermore, the proposed method should present two main advantages: i) the operation quality costs of external equipment is out of control due to external reasons, and ii) an improved reliability of the machine, resulting in fewer breakdowns.
3. Proposed methodology The proposed integrated model addresses both PM and process quality using the process
quality method proposed by Divya et al. [31] and an EWMA control chart. The proposed integrated model is then used to identify optimal values of five decision variables (i.e., 𝑁𝑠, Hs, L, 𝜆, and tPM) that yield optimal expected hourly total system’s costs. Single machine component is considered and monitored to study the effectiveness of the EWMA chart. It is assumed that the mechanical system failures follow a two-parameter Weibull distribution with a characteristic life and shape parameter 𝜂 and 𝛽, respectively. The machine was also assumed to operate six days a week for 7 working hours in three shifts daily.
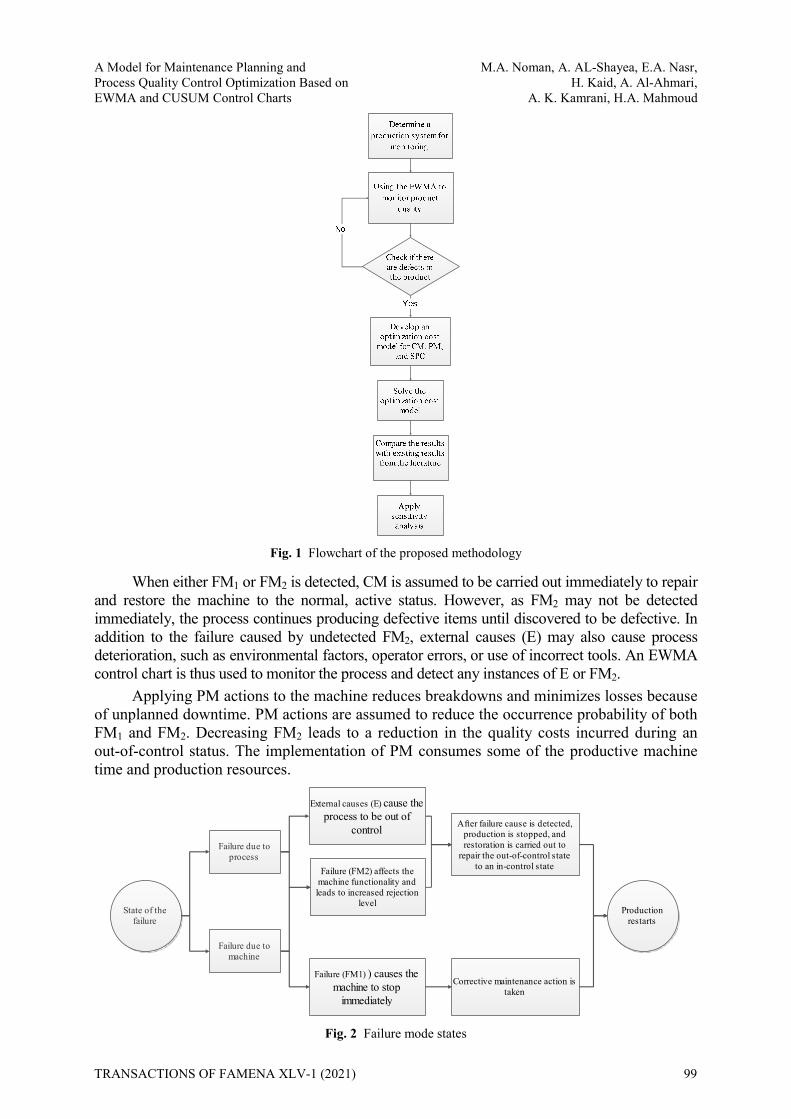
The proposed methodology for maintenance planning and quality control policies is summarized in the following five steps that are also presented in the flow chart, Fig. 1.
1. First, a production system of single product (i.e., a single component in a single machine) is selected for monitoring. The monitored production system must be in an in-control state before the monitoring process can begin.
2. The selected product is then monitored for quality loss or any machine failure that causes a shift in the process mean. The EWMA control chart is used to monitor one property critical to quality (CTQ).
3. An integrated model is then built to include CM, PM, and SPC models. 4. The integrated model is then solved using the Global Optimization Toolbox in
MATLAB. The results provided by using the CUSUM method and the developed EWMA control chart are then compared.
5. Finally, a sensitivity analysis of each of the five decision variables is performed to determine their acceptable ranges and to demonstrate how they affect the total expected system costs.
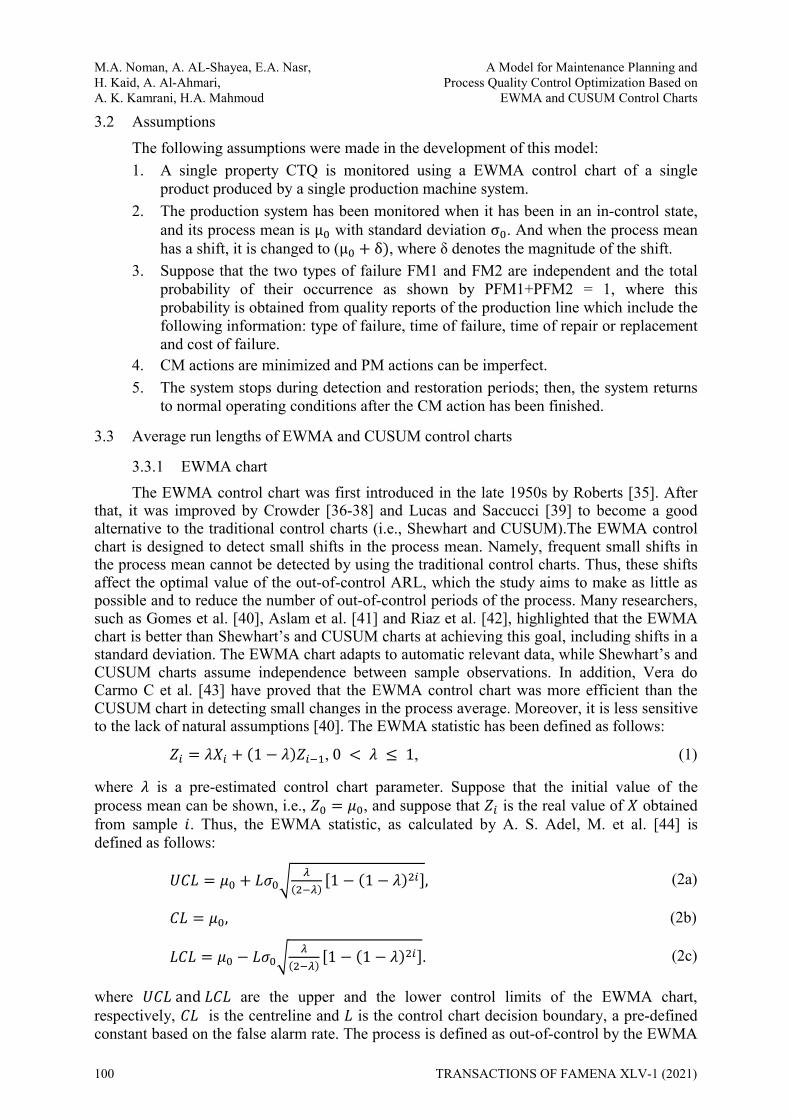
3.1 Model description Two machine failure types were considered, as summarized in Fig. 2: a direct machine
breakdown, or failure mode 1 (FM1), and a shift in the process mean, resulting in a reduction in the process quality, or failure mode 2 (FM2). Here failure is defined as any event that occurs because of machine downtime or during machine runtime when higher rejections are produced. FM2 represents a partial failure that causes poor machine performance without total failure (i.e., FM1) [33, 34].
98 TRANSACTIONS OF FAMENA XLV-1 (2021)
A Model for Maintenance Planning and M.A. Noman, A. AL-Shayea, E.A. Nasr, Process Quality Control Optimization Based on H. Kaid, A. Al-Ahmari, EWMA and CUSUM Control Charts A. K. Kamrani, H.A. Mahmoud
Fig. 1 Flowchart of the proposed methodology
When either FM1 or FM2 is detected, CM is assumed to be carried out immediately to repair and restore the machine to the normal, active status. However, as FM2 may not be detected immediately, the process continues producing defective items until discovered to be defective. In addition to the failure caused by undetected FM2, external causes (E) may also cause process deterioration, such as environmental factors, operator errors, or use of incorrect tools. An EWMA control chart is thus used to monitor the process and detect any instances of E or FM2.
Applying PM actions to the machine reduces breakdowns and minimizes losses because of unplanned downtime. PM actions are assumed to reduce the occurrence probability of both FM1 and FM2. Decreasing FM2 leads to a reduction in the quality costs incurred during an out-of-control status. The implementation of PM consumes some of the productive machine time and production resources.
Fig. 2 Failure mode states
Failure due to process
State of thefailure
Failure due to machine
Production restarts
Failure (FM2) affects the machine functionality and leads to increased rejection
level
External causes (E) cause the process to be out of
control After failure cause is detected, production is stopped, and restoration is carried out to
repair the out-of-control state to an in-control state
Failure (FM1) ) causes the machine to stop
immediately
Corrective maintenance action is taken
TRANSACTIONS OF FAMENA XLV-1 (2021) 99
M.A. Noman, A. AL-Shayea, E.A. Nasr, A Model for Maintenance Planning and H. Kaid, A. Al-Ahmari, Process Quality Control Optimization Based on A. K. Kamrani, H.A. Mahmoud EWMA and CUSUM Control Charts
3.2 Assumptions The following assumptions were made in the development of this model: 1. A single property CTQ is monitored using a EWMA control chart of a single
product produced by a single production machine system. 2. The production system has been monitored when it has been in an in-control state,
and its process mean is μ with standard deviation σ . And when the process mean has a shift, it is changed to (μ + δ), where δ denotes the magnitude of the shift.
3. Suppose that the two types of failure FM1 and FM2 are independent and the total probability of their occurrence as shown by PFM1+PFM2 = 1, where this probability is obtained from quality reports of the production line which include the following information: type of failure, time of failure, time of repair or replacement and cost of failure.
4. CM actions are minimized and PM actions can be imperfect. 5. The system stops during detection and restoration periods; then, the system returns
to normal operating conditions after the CM action has been finished.
3.3 Average run lengths of EWMA and CUSUM control charts
3.3.1 EWMA chart The EWMA control chart was first introduced in the late 1950s by Roberts [35]. After
that, it was improved by Crowder [36-38] and Lucas and Saccucci [39] to become a good alternative to the traditional control charts (i.e., Shewhart and CUSUM).The EWMA control chart is designed to detect small shifts in the process mean. Namely, frequent small shifts in the process mean cannot be detected by using the traditional control charts. Thus, these shifts affect the optimal value of the out-of-control ARL, which the study aims to make as little as possible and to reduce the number of out-of-control periods of the process. Many researchers, such as Gomes et al. [40], Aslam et al. [41] and Riaz et al. [42], highlighted that the EWMA chart is better than Shewhart’s and CUSUM charts at achieving this goal, including shifts in a standard deviation. The EWMA chart adapts to automatic relevant data, while Shewhart’s and CUSUM charts assume independence between sample observations. In addition, Vera do Carmo C et al. [43] have proved that the EWMA control chart was more efficient than the CUSUM chart in detecting small changes in the process average. Moreover, it is less sensitive to the lack of natural assumptions [40]. The EWMA statistic has been defined as follows: 𝑍 = 𝜆𝑋 + (1 − 𝜆)𝑍 , 0 < 𝜆 ≤ 1, (1)
where 𝜆 is a pre-estimated control chart parameter. Suppose that the initial value of the process mean can be shown, i.e., 𝑍 = 𝜇 , and suppose that 𝑍 is the real value of 𝑋 obtained from sample 𝑖. Thus, the EWMA statistic, as calculated by A. S. Adel, M. et al. [44] is defined as follows: 𝑈𝐶𝐿 = 𝜇 + 𝐿𝜎 ( ) 1 − (1 − 𝜆) , (2a)𝐶𝐿 = 𝜇 , (2b)𝐿𝐶𝐿 = 𝜇 − 𝐿𝜎 ( ) 1 − (1 − 𝜆) . (2c)
where 𝑈𝐶𝐿 and 𝐿𝐶𝐿 are the upper and the lower control limits of the EWMA chart, respectively, 𝐶𝐿 is the centreline and 𝐿 is the control chart decision boundary, a pre-defined constant based on the false alarm rate. The process is defined as out-of-control by the EWMA
100 TRANSACTIONS OF FAMENA XLV-1 (2021)
A Model for Maintenance Planning and M.A. Noman, A. AL-Shayea, E.A. Nasr, Process Quality Control Optimization Based on H. Kaid, A. Al-Ahmari, EWMA and CUSUM Control Charts A. K. Kamrani, H.A. Mahmoud
control chart when 𝑍 plots without specific control limits. For large samples, 1 − (1 − 𝜆) tends to 1; therefore, the upper and the lower control limits can be simplified as follows: 𝑈𝐶𝐿 = 𝜇 + 𝐿𝜎 ( ) and 𝐿𝐶𝐿 = 𝜇 − 𝐿𝜎 ( ).
The parameters 𝜆 and 𝐿 are then used to identify the average out-of-control run length, 𝐴𝑅𝐿 , which is the average number of observation units taken when the process mean has shifted from 𝜇 to (𝜇 + 𝛿); the magnitude shift 𝛿 occurs because of any external cause or machine degradation. The average in-control run length, 𝐴𝑅𝐿 , is then computed as follows [45]: 𝐴𝑅𝐿 (𝑎, 𝑏) = ( )√ ( )√ . (3)
Here, subgroup size n is independent and has been obtained from subgroups 𝑋 , , 𝑋 , , … , 𝑋 , at period 𝑖 = 1,2, . . . 𝑛, and has a distribution of 𝑋 , ~𝑁(𝜇 +𝑎𝜎 , 𝑏𝜎 ), where 𝑖 = 1,2, … , and 1 ≤ 𝑗 ≤ 𝑛. When a = 0 or b = 1, the process is in an in-control state. When the process is in an out-of-control state, the mean 𝜇 will be changed, 𝑎 ≠ 0, the standard deviation 𝜎 will be changed and 𝑏 ≠ 1.
Where 𝑦 = 3/√𝑛, corresponding to a false alarm rate 𝛼 = 0.002, 𝐹𝑁(·) is the cumulative distribution function of the standard normal distribution. Zhang et al. [45] suggested that the optimal 𝐴𝑅𝐿 = 370. Several computed 𝐴𝑅𝐿 depend on the pre-specified optimal value of 𝐴𝑅𝐿 as 370 [2]. Srivastava and Wu [46] proposed an optimal value of 𝜆 which minimizes 𝐴𝑅𝐿 for given 𝐴𝑅𝐿 . The optimum 𝜆 is given by [44] as follows: 𝜆 ≈ 2𝑐∗𝛿𝑏 − log(𝑏), (4)
where 𝑐∗ = 0.5117 and 𝑏 = 2log 2 . 𝑐∗𝛿 𝑇 . (4a)
The width of control limit 𝐿 is estimated as follows: 𝐿 ≈ 𝑏 − log(𝑏) . − 𝜆 . (5)
Thus, the optimal value of 𝐴𝑅𝐿 can be obtained approximated as follows: 𝐴𝑅𝐿 ≈ 1𝛿 (1.2277𝐿 − 2.835 + 9.740𝐿 ) + 12 (1 − 𝜆). (6)
3.3.2 CUSUM chart The CUSUM chart is another control chart used for monitoring a process mean based
on samples taken from the process at certain times (e.g., hours, shifts, days, weeks, or months). The conventional CUSUM chart was designed by Bagshaw and Johnson [47] and Moustakides [48] to minimize the out-of-control 𝐴𝑅𝐿 for a mean shift while maintaining a given in-control 𝐴𝑅𝐿 . The CUSUM performance can be measured using the average run length (i.e., 𝐴𝑅𝐿 ), which is the average number of samples required to signal an out-of-control case or produce a false alarm. 𝐴𝑅𝐿 is commonly used as an index of the effectiveness of the control chart, whereas the in-control 𝐴𝑅𝐿 is used as an index of the false alarm rate. Therefore, the economic design of CUSUM charts depends on the value the of average run lengths. For the given CUSUM chart, samples of the size n are taken from a normal distribution N (μ, σ2), using a reference value of k and a decision interval of h. When the
TRANSACTIONS OF FAMENA XLV-1 (2021) 101
M.A. Noman, A. AL-Shayea, E.A. Nasr, A Model for Maintenance Planning and H. Kaid, A. Al-Ahmari, Process Quality Control Optimization Based on A. K. Kamrani, H.A. Mahmoud EWMA and CUSUM Control Charts
decision interval is exceeded, the production should be stopped and an assignable cause should be found. Thus, the CUSUM statistic, as calculated by Divya et al. [31], is defined as follows: 𝑀 = 𝑚𝑎𝑥 0, 𝑥 − (𝜇 + 𝑘) + 𝑀 , (7a) 𝑀 = 𝑚𝑎𝑥 0, (𝜇 − 𝑘) − 𝑥 + 𝑀 , (7b)
where 𝑀 and 𝑀 are the upper and lower control limits of the CUSUM chart, respectively. ARLs for the CUSUM chart are calculated here using Alwan’s [49] modification of Woodall and Adams’ [50] method, as by Divya et al. [31], as: 𝐴𝑅𝐿 = ( ∆ ) ∆∆ , (8)
where ∆ = 𝛿 − 𝑘, and 𝑏 = ℎ + 1.1661, where ℎ is the critical threshold associated with the CUSUM. Therefore, when the process is in an in-control state, δ = 0, as in Divya et al. [31]. The in-control ARL can thus be calculated as: 𝐴𝑅𝐿 = ( )
. (9)
If the process moves to an out-of-control state, ∆ = 𝛿 − 𝑘, and the optimal value of the out-of-control ARL can be calculated as: 𝐴𝑅𝐿 = ( ) ( )( ) . (10)
4. Cost model To illustrate the impacts and benefits of the proposed method using the EWMA control
chart to integrate PM and SPC, a set of cost models was developed to capture the cost plan and quality control policies related to and affected by the production process. These costs include corrective and PM costs and process failure costs during the evaluation period.
4.1 Expected cost model: corrective and preventive maintenance Information required to model the costs associated with CM and PM include: 1) time
for implementing the maintenance procedures and any possible logistical delays due to required materials or labour; 2) costs of materials, labour, downtime, and other maintenance-related activities; 3) required degree of equipment restoration (i.e., as good as new, as bad as old, or imperfect), expressed using a restoration factor and determined by an expert planner [51]; and 4) probability of equipment failure based on historical data.
4.1.1 CM policy All costs attributed to the failure mode detection during the given time period, including
downtime costs incurred during machine reparation and restoration, have been calculated. Costs of labour and materials are required for proper formulation of this model. Thus, the CM costs are expressed as follows: 𝐸 𝐶 = (𝑀𝑇𝑇𝑅 ) × 𝑃𝑅 × 𝐶 + 𝐿𝐶 + 𝐶 × 𝑃 × 𝑁 , (11)
where 𝑀𝑇𝑇𝑅 is the mean CM time incurred following FM1 (h), 𝑃𝑅 denotes the production rate, 𝐶 denotes the lost production cost, 𝐿𝐶 denotes the labour costs, and 𝐶 denotes the fixed costs of the CM action. This model includes costs such as costs for material, lubricant oil, and maintenance equipment. When the maintenance includes only the replacement of a
102 TRANSACTIONS OF FAMENA XLV-1 (2021)
A Model for Maintenance Planning and M.A. Noman, A. AL-Shayea, E.A. Nasr, Process Quality Control Optimization Based on H. Kaid, A. Al-Ahmari, EWMA and CUSUM Control Charts A. K. Kamrani, H.A. Mahmoud
component, the CM costs are considered equal to the component replacement cost number of CM actions, 𝑁 . Here, 𝑁 is a function of the PM interval (𝑡 ) and restoration factors and is determined using a regression model of η and β values during the evaluation period, as proposed by Divya et al. [31] and shown in (12). 𝑁 = 0.0437 ∗ 𝑡 . . (12)
4.1.2 PM policy Incomplete PM costs include the cost of downtime because of the repair and restoration
of a part in a single machine, as well as the costs of labour and required materials. PM costs are thus expressed as follows: 𝐸 𝐶 = (𝑀𝑇𝑇𝑅 ) × 𝑃𝑅 × 𝐶 + 𝐿𝐶 + 𝐶 × . (13)
4.2 Expected cost model: process quality 𝐸 𝑇𝐶𝑄
This section discusses mathematical equations that are intended to calculate both the production process cycle time and the expected process failure costs.
4.2.1 Production process cycle time E T
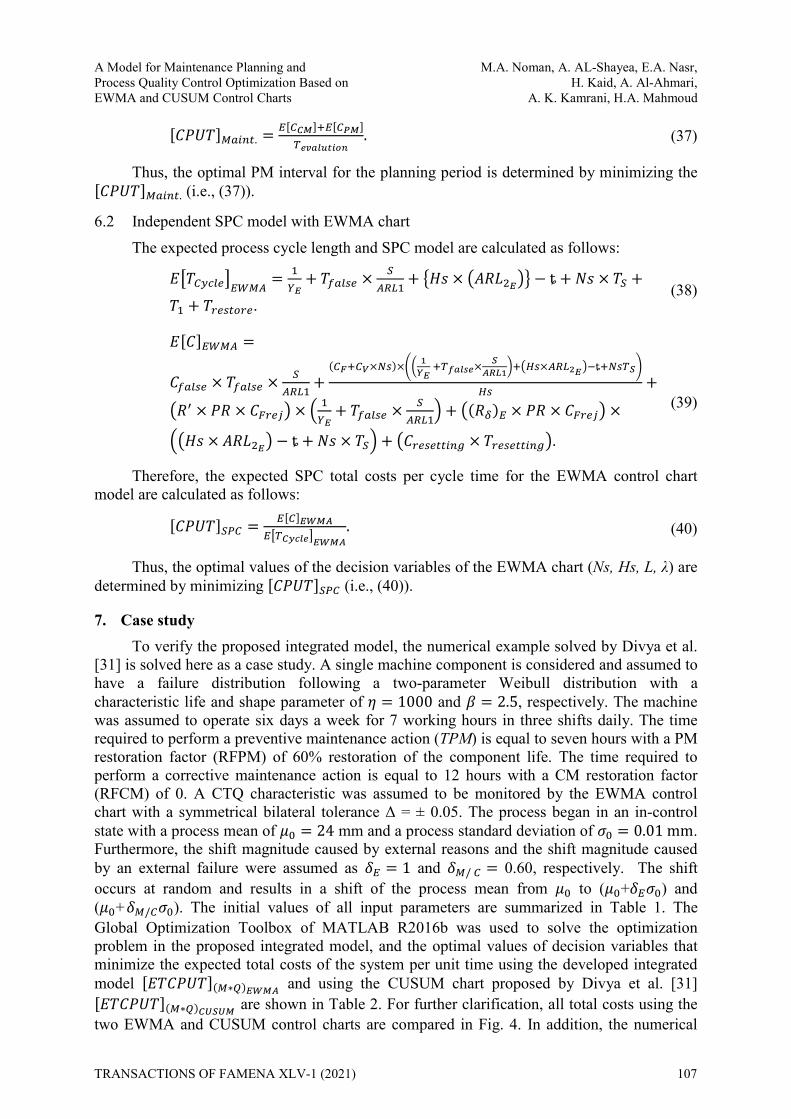
The cycle time of the production process is determined by the expected run cycle length, which controls the time between the series periods. This cycle includes, as presented in detail in Fig. 3, the in-control and out-of-control time as well as the time required to re-adjust the process or restore the machine.
4.2.1.1 Expected in-control time 𝐸 𝑇 The in-control time is expressed using a negative exponential distribution with a mean
of 1/𝑌 and includes the mean time to failure and the expected time to inspect false alarms 𝐸 𝑇 . It is expressed as in Lorenzen and Vance’s [52] model as follows: 𝐸 𝑇 = 1/𝑌 + 𝐸 𝑇 , (14)
where 𝐸 𝑇 = 𝑇 × , (15)
where 𝐴𝑅𝐿 indicates the average number of samples before an out-of-control state or false alarm have appeared, 𝑇 indicates the expected time of a false alarm search, and 𝑆 refers to average samples taken when the process is in an in-control state with a process failure rate 𝑌. These average samples are then calculated by Lorenzen and Vance [52] as follows: 𝑆 = (𝑒 × ) (1 − 𝑒 × ).⁄ (16)
Two types of process failures were assumed: 𝑌 because of an external cause, and 𝑌 because of machine degradation. Thus, 𝑌 = 𝑌 + 𝑌 , where 𝑌 = , (17)
𝑌 = × ( ). (18)
TRANSACTIONS OF FAMENA XLV-1 (2021) 103
M.A. Noman, A. AL-Shayea, E.A. Nasr, A Model for Maintenance Planning and H. Kaid, A. Al-Ahmari, Process Quality Control Optimization Based on A. K. Kamrani, H.A. Mahmoud EWMA and CUSUM Control Charts
4.2.1.2 Expected out-of-control time E T The expected out-of-control time can be derived from five events, as indicated by
Duncan [3]: 1. The time between the appearance of a customizable cause and the next sample
observation, calculated as follows: 𝐻𝑠 × 𝐴𝑅𝐿 / × + 𝐴𝑅𝐿 × , (19)
where 𝐴𝑅𝐿 / and 𝐴𝑅𝐿 indicate the average run length during an out-of-control state when caused by a machine failure and external cause, respectively;
2. The time observed through the out-of-control state of a process (ȶ), calculated as by Duncan [3] as: ȶ = 𝐻𝑠/2;
3. The time spent performing sample analysis, calculated as follows: 𝑁𝑠 × 𝑇 , (20)
where 𝑁𝑠 is the sample size and 𝑇 indicates the time to take and plot a sample;
4. The time it takes to validate an assignable cause, denoted by 𝑇 ; and 5. The time required to reset the process or restore the machine if the failure is
attributed to FM2, calculated as follows: 𝑇 × + 𝑀𝑇𝑇𝑅 × , (21)
where 𝑇 is the time needed to reset the process when the failure occurred due to external reasons.
Thus, the following equation expresses the period that was needed to calculate the expected out-of-control time: 𝐸 𝑇 = 𝐻𝑠 × 𝐴𝑅𝐿 / × + 𝐴𝑅𝐿 × − ȶ + (𝑁𝑠 × 𝑇 ) +𝑇 + 𝑇 × + 𝑀𝑇𝑇𝑅 × . (22)
The production process cycle time is then calculated as the sum of the expected in-control and out-of-control time in (14) and (22), respectively, as: 𝐸 𝑇 = + 𝑇 × + 𝐻𝑠 × 𝐴𝑅𝐿 / × + 𝐴𝑅𝐿 × − ȶ +(𝑁𝑠 × 𝑇 ) + 𝑇 + 𝑇 × + 𝑀𝑇𝑇𝑅 × .
(23)
4.2.2 Expected cost model of process failure E C
The expected process costs include the costs incurred during the in-control and out-of-control states and involve the costs related to the number of produced defective items, to sampling, downtime, cause and effect analysis, and system restoration.
4.2.2.1 When operating in an in-control state This part includes the following costs: 1) costs of a false alarm, 𝐶 , 2) sampling
expected costs per cycle, 3) costs of nonconforming units, and 4) costs of exploring and repairing cause(s) of failure.
Thus, the expected costs for false alarm are given as follows:
104 TRANSACTIONS OF FAMENA XLV-1 (2021)
A Model for Maintenance Planning and M.A. Noman, A. AL-Shayea, E.A. Nasr, Process Quality Control Optimization Based on H. Kaid, A. Al-Ahmari, EWMA and CUSUM Control Charts A. K. Kamrani, H.A. Mahmoud
𝐸 𝐶 = 𝐶 × 𝑇 × . (24)
Hence, the sampling expected costs per cycle can be calculated as a sum of both sample fixed and variable costs, as: 𝐸 𝐶 = (𝐶 + 𝐶 × 𝑁𝑠) × + 𝑇 × + 𝐻𝑠 ×
/ × × ȶ ( × ),
(25)
where 𝐶 refers to the sample fixed costs and 𝐶 refers to the sample variable costs. Due to nonconforming units produced when the process is an in-control state, this leads
to more costs that can be expressed as follows: 𝐸 𝐶 = 𝑅 × 𝑃𝑅 × 𝐶 × + 𝑇 × . (26)
The expected costs associated with exploring and repairing a true alarm due to a customizable reason because of external failure are as follows: 𝐸 𝐶 = 𝐶 × 𝑇 × . (27)
4.2.2.2 Operation in an out-of-control state When there is a malfunction in the machine that leads to the process being in the out-of-
control state, the rejection costs can be calculated as follows: 𝐸 𝐶 / = (𝑅 ) / × 𝑃𝑅 × 𝐶 × 𝐻𝑠 × 𝐴𝑅𝐿 / ×+ 𝐴𝑅𝐿 × − ȶ + 𝑁𝑠 × 𝑇 × , (28)
where (𝑅 ) / indicates the probability of production nonconforming items when machine failure has occurred. Also, if the process is in an out-of-control state due to an external cause the rejection costs can be calculated as follows: 𝐸 𝐶 = (𝑅 ) × 𝑃𝑅 × 𝐶 × 𝐻𝑠 ×𝐴𝑅𝐿 / × + 𝐴𝑅𝐿 × − ȶ + 𝑁𝑠 × 𝑇 × ,
(29)
where (𝑅 ) is the probability of producing nonconforming units when failure has occurred because of external reasons. The proportion of nonconforming units 𝑅 because of the shift 𝛿 was calculated by Montgomery [53] as 𝑅 = 1 − 𝐹(3 − 𝛿) − 𝐹(−3 − 𝛿), where 𝐹 represents the standard normal cumulative distribution function.
The expected corrective costs associated with exploring and diagnosing a valid alarm due to failure mode are expressed as follows: 𝐸 𝐶 = (𝑀𝑇𝑇𝑅 ) × 𝑃𝑅 × 𝐶 + 𝐿𝐶 + 𝐶 × . (30)
Thus, by combining the mathematical equations from (24) to (30), the expected costs of process failure per cycle can be expressed as follows:
TRANSACTIONS OF FAMENA XLV-1 (2021) 105
M.A. Noman, A. AL-Shayea, E.A. Nasr, A Model for Maintenance Planning and H. Kaid, A. Al-Ahmari, Process Quality Control Optimization Based on A. K. Kamrani, H.A. Mahmoud EWMA and CUSUM Control Charts 𝐸 𝐶 = 𝐸 𝐶 + 𝐸 𝐶 + 𝐸 𝐶 +𝐸 𝐶 + 𝐸 𝐶 / + 𝐸 𝐶 + 𝐸 𝐶 .
(31)
Therefore, all costs related to process quality during the evaluation period are calculated as follows: 𝐸 𝑇𝐶𝑄 = 𝐸 𝐶 × 𝑁, (32)
where 𝑁 = . (33)
5. Optimal cost model per unit time 𝐄𝐓𝐂𝐏𝐔𝐓 (𝐌∗𝐐)𝐄𝐖𝐌𝐀
Assuming that the production run begins in an in-control state, as presented in detail in Section 4, the model is optimized as follows: 𝑀𝑖𝑛𝑖𝑚𝑖𝑧𝑒 𝐸𝑇𝐶𝑃𝑈𝑇 ( ∗ ) = . (34)
The economic objective function involves minimizing 𝐸𝑇𝐶𝑃𝑈𝑇 ( ∗ ) and can be determined by solving the optimal value of the five selected decision variables (𝑁𝑠, 𝐻𝑠, 𝐿, 𝜆, and 𝑡𝑃𝑀). The model constraints are as follows:
Subject to: 𝑁𝑠 ≤ 𝑁𝑠 ≤ 𝑁𝑠 𝐻𝑠 ≤ 𝐻𝑠 ≤ 𝐻𝑠 𝐿 ≤ 𝐿 ≤ 𝐿 𝜆 ≤ 𝜆 ≤ 𝜆 𝑡 ≤ 𝑡 ≤ 𝑡 𝑁𝑠; 𝐻𝑠; 𝐿; 𝑡 ≥ 0 0 < 𝜆 ≤ 1
6. Cost model methodology of independent models To examine effectiveness of the proposed model using an EWMA chart, two
independent models were implemented and are discussed in the following subsections.
6.1 Independent maintenance model Here, only planned maintenance actions are considered; the probability of quality
degradation because of a machine failure is not considered. This CM model is expressed as follows: 𝐸 𝐶 = 𝑀𝑇𝑇𝑅 × 𝑃𝑅 × 𝐶 + 𝐿𝐶 + 𝐶 × 𝑁 . (35)
The PM model is expressed as follows: 𝐸 𝐶 = 𝑀𝑇𝑇𝑅 × 𝑃𝑅 × 𝐶 + 𝐿𝐶 + 𝐶 × . (36)
Therefore, the expected maintenance costs can be calculated as stand-alone for the planning period as follows:
106 TRANSACTIONS OF FAMENA XLV-1 (2021)
A Model for Maintenance Planning and M.A. Noman, A. AL-Shayea, E.A. Nasr, Process Quality Control Optimization Based on H. Kaid, A. Al-Ahmari, EWMA and CUSUM Control Charts A. K. Kamrani, H.A. Mahmoud
𝐶𝑃𝑈𝑇 . = . (37)
Thus, the optimal PM interval for the planning period is determined by minimizing the 𝐶𝑃𝑈𝑇 . (i.e., (37)).
6.2 Independent SPC model with EWMA chart The expected process cycle length and SPC model are calculated as follows: 𝐸 𝑇 = + 𝑇 × + 𝐻𝑠 × 𝐴𝑅𝐿 − ȶ + 𝑁𝑠 × 𝑇 +𝑇 + 𝑇 .
(38)
𝐸 𝐶 =𝐶 × 𝑇 × + ( × )× × × ȶ +𝑅 × 𝑃𝑅 × 𝐶 × + 𝑇 × + (𝑅 ) × 𝑃𝑅 × 𝐶 ×𝐻𝑠 × 𝐴𝑅𝐿 − ȶ + 𝑁𝑠 × 𝑇 + 𝐶 × 𝑇 .
(39)
Therefore, the expected SPC total costs per cycle time for the EWMA control chart model are calculated as follows: 𝐶𝑃𝑈𝑇 = . (40)
Thus, the optimal values of the decision variables of the EWMA chart (Ns, Hs, L, λ) are determined by minimizing 𝐶𝑃𝑈𝑇 (i.e., (40)).
7. Case study To verify the proposed integrated model, the numerical example solved by Divya et al.
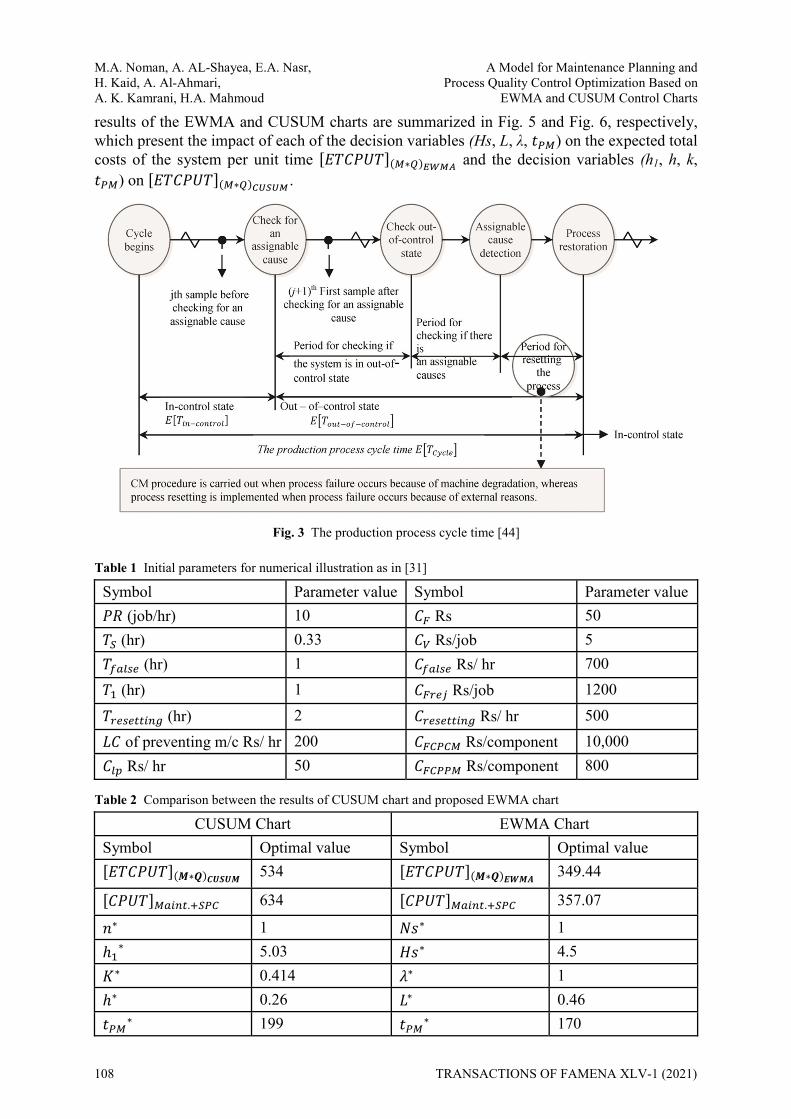
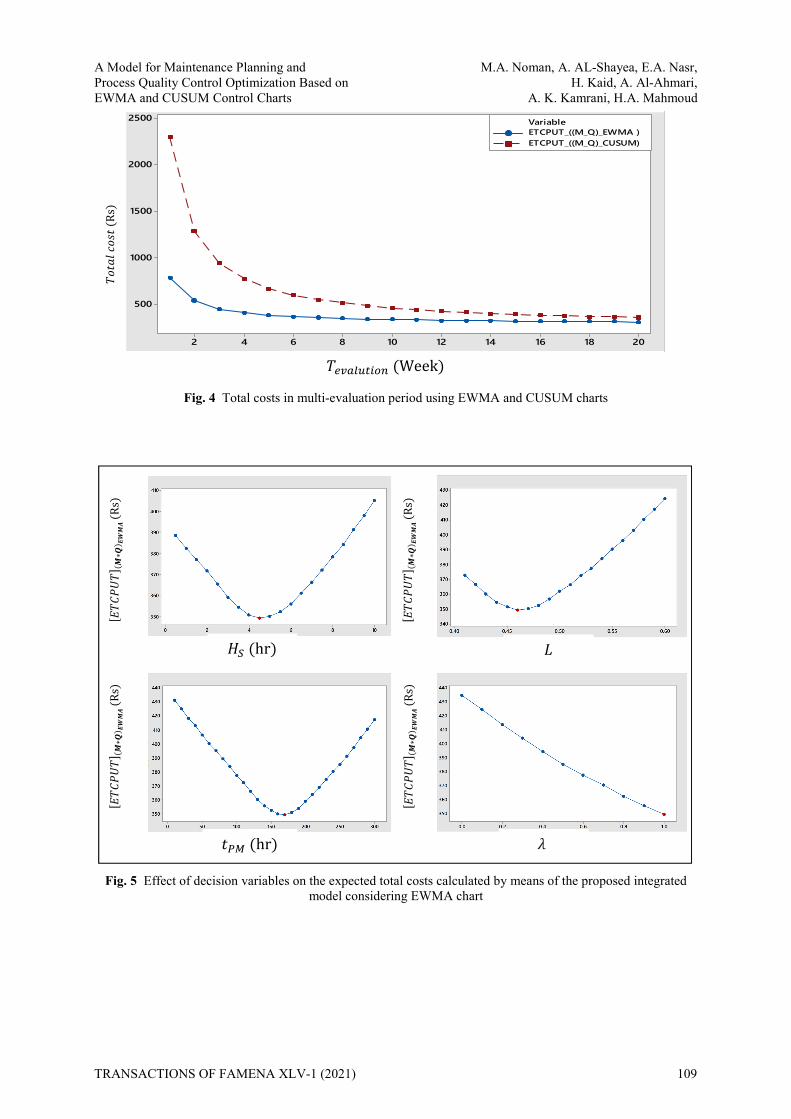
[31] is solved here as a case study. A single machine component is considered and assumed to have a failure distribution following a two-parameter Weibull distribution with a characteristic life and shape parameter of 𝜂 = 1000 and 𝛽 = 2.5, respectively. The machine was assumed to operate six days a week for 7 working hours in three shifts daily. The time required to perform a preventive maintenance action (TPM) is equal to seven hours with a PM restoration factor (RFPM) of 60% restoration of the component life. The time required to perform a corrective maintenance action is equal to 12 hours with a CM restoration factor (RFCM) of 0. A CTQ characteristic was assumed to be monitored by the EWMA control chart with a symmetrical bilateral tolerance Δ = ± 0.05. The process began in an in-control state with a process mean of 𝜇 = 24 mm and a process standard deviation of 𝜎 = 0.01 mm. Furthermore, the shift magnitude caused by external reasons and the shift magnitude caused by an external failure were assumed as 𝛿 = 1 and 𝛿 / = 0.60, respectively. The shift occurs at random and results in a shift of the process mean from 𝜇 to (𝜇 +𝛿 𝜎 ) and (𝜇 +𝛿 / 𝜎 ). The initial values of all input parameters are summarized in Table 1. The Global Optimization Toolbox of MATLAB R2016b was used to solve the optimization problem in the proposed integrated model, and the optimal values of decision variables that minimize the expected total costs of the system per unit time using the developed integrated model 𝐸𝑇𝐶𝑃𝑈𝑇 ( ∗ ) and using the CUSUM chart proposed by Divya et al. [31] 𝐸𝑇𝐶𝑃𝑈𝑇 ( ∗ ) are shown in Table 2. For further clarification, all total costs using the two EWMA and CUSUM control charts are compared in Fig. 4. In addition, the numerical
TRANSACTIONS OF FAMENA XLV-1 (2021) 107
M.A. Noman, A. AL-Shayea, E.A. Nasr, A Model for Maintenance Planning and H. Kaid, A. Al-Ahmari, Process Quality Control Optimization Based on A. K. Kamrani, H.A. Mahmoud EWMA and CUSUM Control Charts
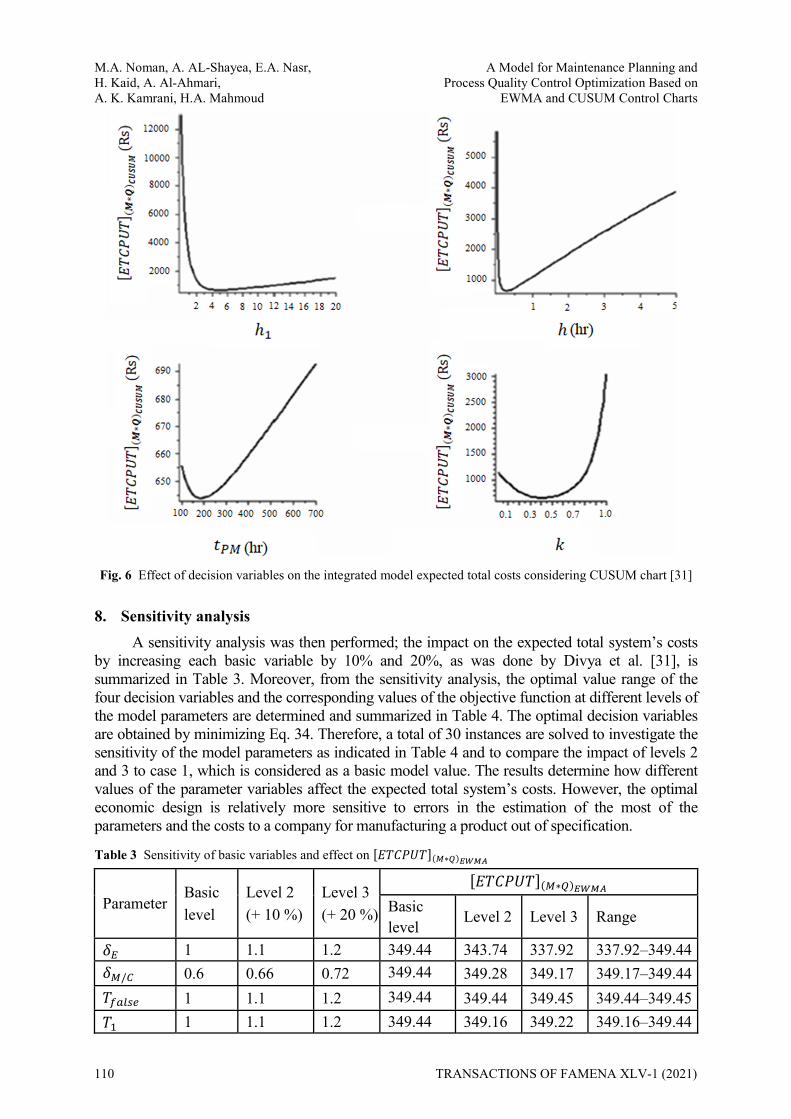
results of the EWMA and CUSUM charts are summarized in Fig. 5 and Fig. 6, respectively, which present the impact of each of the decision variables (Hs, L, λ, 𝑡 ) on the expected total costs of the system per unit time 𝐸𝑇𝐶𝑃𝑈𝑇 ( ∗ ) and the decision variables (h1, h, k, 𝑡 ) on 𝐸𝑇𝐶𝑃𝑈𝑇 ( ∗ ) .
Fig. 3 The production process cycle time [44]
Table 1 Initial parameters for numerical illustration as in [31]
Symbol Parameter value Symbol Parameter value 𝑃𝑅 (job/hr) 10 𝐶 Rs 50 𝑇 (hr) 0.33 𝐶 Rs/job 5 𝑇 (hr) 1 𝐶 Rs/ hr 700 𝑇 (hr) 1 𝐶 Rs/job 1200 𝑇 (hr) 2 𝐶 Rs/ hr 500 𝐿𝐶 of preventing m/c Rs/ hr 200 𝐶 Rs/component 10,000 𝐶 Rs/ hr 50 𝐶 Rs/component 800
Table 2 Comparison between the results of CUSUM chart and proposed EWMA chart
CUSUM Chart EWMA Chart Symbol Optimal value Symbol Optimal value 𝐸𝑇𝐶𝑃𝑈𝑇 (𝑴∗𝑸)𝑪𝑼𝑺𝑼𝑴 534 𝐸𝑇𝐶𝑃𝑈𝑇 (𝑴∗𝑸)𝑬𝑾𝑴𝑨 349.44 𝐶𝑃𝑈𝑇 . 634 𝐶𝑃𝑈𝑇 . 357.07 𝑛∗ 1 𝑁𝑠∗ 1 ℎ ∗ 5.03 𝐻𝑠∗ 4.5 𝐾∗ 0.414 𝜆∗ 1 ℎ∗ 0.26 𝐿∗ 0.46 𝑡 ∗ 199 𝑡 ∗ 170
108 TRANSACTIONS OF FAMENA XLV-1 (2021)
A Model for Maintenance Planning and M.A. Noman, A. AL-Shayea, E.A. Nasr, Process Quality Control Optimization Based on H. Kaid, A. Al-Ahmari, EWMA and CUSUM Control Charts A. K. Kamrani, H.A. Mahmoud
Fig. 4 Total costs in multi-evaluation period using EWMA and CUSUM charts
Fig. 5 Effect of decision variables on the expected total costs calculated by means of the proposed integrated
model considering EWMA chart
2018161412108642
2500
2000
1500
1000
500
ETCPUT_((M_Q)_EWMA )ETCPUT_((M_Q)_CUSUM)
Variable
𝐸𝑇𝐶𝑃𝑈𝑇 ( 𝑴∗𝑸)
𝑬𝑾𝑴𝑨 (Rs)
𝐸𝑇𝐶𝑃𝑈𝑇 ( 𝑴∗𝑸)
𝑬𝑾𝑴𝑨 (Rs)
𝐸𝑇𝐶𝑃𝑈𝑇 ( 𝑴∗𝑸)
𝑬𝑾𝑴𝑨 (Rs)
𝐸𝑇𝐶𝑃𝑈𝑇 ( 𝑴∗𝑸)
𝑬𝑾𝑴𝑨 (Rs)
𝐻 (hr) 𝐿
𝑡 (hr) 𝜆
𝑇𝑜𝑡𝑎𝑙 𝑐𝑜𝑠𝑡 (Rs
)
𝑇 (Week)
TRANSACTIONS OF FAMENA XLV-1 (2021) 109
M.A. Noman, A. AL-Shayea, E.A. Nasr, A Model for Maintenance Planning and H. Kaid, A. Al-Ahmari, Process Quality Control Optimization Based on A. K. Kamrani, H.A. Mahmoud EWMA and CUSUM Control Charts
Fig. 6 Effect of decision variables on the integrated model expected total costs considering CUSUM chart [31]
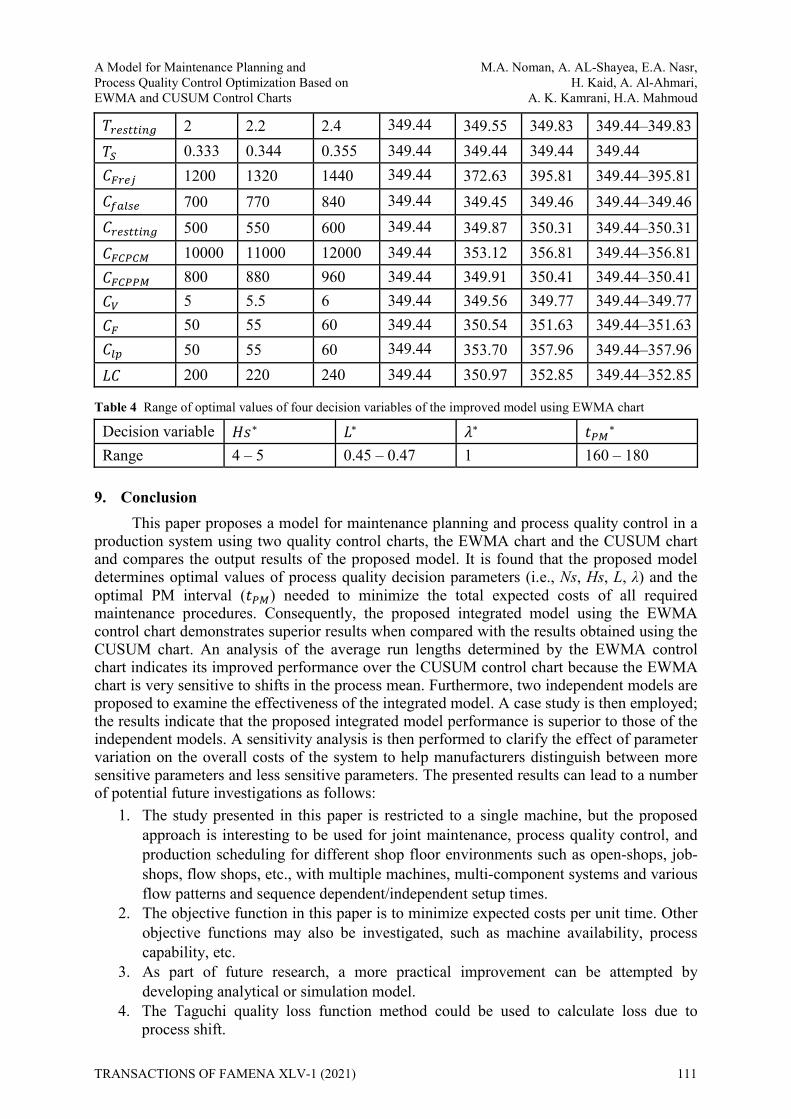
8. Sensitivity analysis A sensitivity analysis was then performed; the impact on the expected total system’s costs
by increasing each basic variable by 10% and 20%, as was done by Divya et al. [31], is summarized in Table 3. Moreover, from the sensitivity analysis, the optimal value range of the four decision variables and the corresponding values of the objective function at different levels of the model parameters are determined and summarized in Table 4. The optimal decision variables are obtained by minimizing Eq. 34. Therefore, a total of 30 instances are solved to investigate the sensitivity of the model parameters as indicated in Table 4 and to compare the impact of levels 2 and 3 to case 1, which is considered as a basic model value. The results determine how different values of the parameter variables affect the expected total system’s costs. However, the optimal economic design is relatively more sensitive to errors in the estimation of the most of the parameters and the costs to a company for manufacturing a product out of specification.
Table 3 Sensitivity of basic variables and effect on 𝐸𝑇𝐶𝑃𝑈𝑇 ( ∗ )
Parameter Basic level
Level 2 (+ 10 %)
Level 3 (+ 20 %)
𝐸𝑇𝐶𝑃𝑈𝑇 ( ∗ ) Basic level Level 2 Level 3 Range 𝛿 1 1.1 1.2 349.44 343.74 337.92 337.92–349.44𝛿 / 0.6 0.66 0.72 349.44 349.28 349.17 349.17–349.44𝑇 1 1.1 1.2 349.44 349.44 349.45 349.44–349.45𝑇 1 1.1 1.2 349.44 349.16 349.22 349.16–349.44
110 TRANSACTIONS OF FAMENA XLV-1 (2021)
A Model for Maintenance Planning and M.A. Noman, A. AL-Shayea, E.A. Nasr, Process Quality Control Optimization Based on H. Kaid, A. Al-Ahmari, EWMA and CUSUM Control Charts A. K. Kamrani, H.A. Mahmoud
𝑇 2 2.2 2.4 349.44 349.55 349.83 349.44–349.83𝑇 0.333 0.344 0.355 349.44 349.44 349.44 349.44 𝐶 1200 1320 1440 349.44 372.63 395.81 349.44–395.81𝐶 700 770 840 349.44 349.45 349.46 349.44–349.46𝐶 500 550 600 349.44 349.87 350.31 349.44–350.31𝐶 10000 11000 12000 349.44 353.12 356.81 349.44–356.81𝐶 800 880 960 349.44 349.91 350.41 349.44–350.41𝐶 5 5.5 6 349.44 349.56 349.77 349.44–349.77𝐶 50 55 60 349.44 350.54 351.63 349.44–351.63𝐶 50 55 60 349.44 353.70 357.96 349.44–357.96𝐿𝐶 200 220 240 349.44 350.97 352.85 349.44–352.85
Table 4 Range of optimal values of four decision variables of the improved model using EWMA chart
Decision variable 𝐻𝑠∗ 𝐿∗ 𝜆∗ 𝑡 ∗ Range 4 – 5 0.45 – 0.47 1 160 – 180
9. Conclusion This paper proposes a model for maintenance planning and process quality control in a
production system using two quality control charts, the EWMA chart and the CUSUM chart and compares the output results of the proposed model. It is found that the proposed model determines optimal values of process quality decision parameters (i.e., Ns, Hs, L, λ) and the optimal PM interval (𝑡 ) needed to minimize the total expected costs of all required maintenance procedures. Consequently, the proposed integrated model using the EWMA control chart demonstrates superior results when compared with the results obtained using the CUSUM chart. An analysis of the average run lengths determined by the EWMA control chart indicates its improved performance over the CUSUM control chart because the EWMA chart is very sensitive to shifts in the process mean. Furthermore, two independent models are proposed to examine the effectiveness of the integrated model. A case study is then employed; the results indicate that the proposed integrated model performance is superior to those of the independent models. A sensitivity analysis is then performed to clarify the effect of parameter variation on the overall costs of the system to help manufacturers distinguish between more sensitive parameters and less sensitive parameters. The presented results can lead to a number of potential future investigations as follows:
1. The study presented in this paper is restricted to a single machine, but the proposed approach is interesting to be used for joint maintenance, process quality control, and production scheduling for different shop floor environments such as open-shops, job-shops, flow shops, etc., with multiple machines, multi-component systems and various flow patterns and sequence dependent/independent setup times.
2. The objective function in this paper is to minimize expected costs per unit time. Other objective functions may also be investigated, such as machine availability, process capability, etc.
3. As part of future research, a more practical improvement can be attempted by developing analytical or simulation model.
4. The Taguchi quality loss function method could be used to calculate loss due to process shift.
TRANSACTIONS OF FAMENA XLV-1 (2021) 111
M.A. Noman, A. AL-Shayea, E.A. Nasr, A Model for Maintenance Planning and H. Kaid, A. Al-Ahmari, Process Quality Control Optimization Based on A. K. Kamrani, H.A. Mahmoud EWMA and CUSUM Control Charts
Acknowledgments This project was funded by the National Plan for Science, Technology and Innovation
(MAARIFAH), King Abdulaziz City for Science and Technology, Kingdom of Saudi Arabia, award number (14-ELE69-02-R).
Notations 𝑇 : evaluation period 𝐶 : costs occurring due to a false alarm inspection 𝑃𝑅: production rate 𝜇 : process mean in an in-control system 𝜎 : process standard deviation in an in-control system 𝑅 : nonconforming units 𝐶 : rejection costs in an out-of-control system due to process failure (𝑅 ) : nonconforming item probability in an out-of-control system that occur because of an exterior effect 𝛿 : shift magnitude that occurs because of an exterior effect (𝑅 ) / : probability of production of nonconforming items when machine failure has occurred 𝛿 / : shift magnitude that occurs because of machine failure 𝑇 : time obtained by taking one sample and charting it 𝑇 : observed via time required for finding an assignable cause 𝑇 : time spent for searching a false alarm 𝐶 : fixed costs of a sample 𝐶 : variable costs of a sample 𝐶 : costs of resetting 𝑇 : time needed for resetting a process to a normal state (𝑀𝑇𝑇𝑅 ) : mean time required to repair a failure of FM1 type (𝑀𝑇𝑇𝑅 ) : mean time required to repair a failure of FM2 type 𝑀𝑇𝑇𝑅 : mean repair time required for a corrective action 𝑀𝑇𝑇𝑅 : mean repair time required for a preventive action 𝑀𝑇𝐵𝐹 : mean time between the failures of the process 𝐶 : costs of lost production 𝐿𝐶: costs of maintenance personnel 𝐶 : CM fixed costs 𝐶 : PM fixed costs 𝑃 : probability of a type 1 failure (FM1) 𝑃 : probability of type 2 failure (FM2) 𝑌 : failure due to an external cause 𝑌 : failure that occurs because of machine degradation ȶ: average time elapsed from the last sample before the assignable cause has been found to the occurrence of the assignable cause when integrating maintenance and quality control 𝑁𝑠: sample size 𝐻𝑠: sample frequency 𝐿: decision boundary of the control chart 𝜆: smoothing parameter of the control chart
112 TRANSACTIONS OF FAMENA XLV-1 (2021)
A Model for Maintenance Planning and M.A. Noman, A. AL-Shayea, E.A. Nasr, Process Quality Control Optimization Based on H. Kaid, A. Al-Ahmari, EWMA and CUSUM Control Charts A. K. Kamrani, H.A. Mahmoud
𝑡 : preventive maintenance interval ℎ: sample interval ℎ : decision interval 𝑘: control limit coefficient 𝐴𝑅𝐿 : average run length in an in-control system 𝐴𝑅𝐿 : average run length in an out-of-control system that occurs because of an exterior effect 𝐴𝑅𝐿 / : average run length in an out-of-control system that occurs because of a machine failure 𝑌: process failure rate 𝑁 : number of failures 𝑁 : Number of PM actions 𝐸 𝐶 : process failure costs 𝐸 𝐶 : false alarm costs 𝐸 𝐶 : sampling costs 𝐸 𝐶 : expected costs of nonconforming units due to an in-control system 𝐸 𝐶 : resetting the expected costs 𝐸 𝐶 / : expected costs of rejection when a machine failure has occurred 𝐸 𝐶 : expected costs of rejection when a failure due to an external reason has occurred 𝐸 𝐶 : CM costs incurred because of failure mode (FM1) 𝐸 𝑇𝐶𝑄 : quality loss costs in an out-of-control system incurring because of the process failure 𝐸𝑇𝐶𝑃𝑈𝑇 ( ∗ ) : total costs incurred in an out-of-control system of both maintenance and quality strategies using EWMA control chart 𝐸𝑇𝐶𝑃𝑈𝑇 ( ∗ ) : total costs incurred in an out-of-control system of both maintenance and quality strategies using CUSUM control chart 𝐶𝑃𝑈𝑇 .: total maintenance costs 𝐶𝑃𝑈𝑇 : total costs of statistical process control (SPC) REFERENCES [1] D. Pandey, M. S. Kulkarni, and P. Vrat, "Joint consideration of production scheduling, maintenance and
quality policies: a review and conceptual framework," International Journal of Advanced Operations Management, vol. 2, pp. 1-24, 2010. https://doi.org/10.1504/ijaom.2010.034583
[2] P. S. Hariba and S. D. Tukaram, "Economic design of a nonparametric EWMA control chart for location," Production, vol. 26, pp. 698-706, 2016. https://doi.org/10.1590/0103-6513.209916
[3] A. J. Duncan, "The economic design of X charts used to maintain current control of a process," Journal of the American Statistical Association, vol. 51, pp. 228-242, 1956. https://doi.org/10.2307/2281343
[4] S. M. Alexander, M. A. Dillman, J. S. Usher, and B. Damodaran, "Economic design of control charts using the Taguchi loss function," Computers & industrial engineering, vol. 28, pp. 671-679, 1995. https://doi.org/10.1016/0360-8352(94)00219-d
[5] A. Hassan, M. Shariff Nabi Baksh, and A. M. Shaharoun, "Issues in quality engineering research," International Journal of Quality & Reliability Management, vol. 17, pp. 858-875, 2000. https://doi.org/10.1108/02656710010325093
[6] D. Sherwin, "A review of overall models for maintenance management," Journal of quality in maintenance engineering, vol. 6, pp. 138-164, 2000. https://doi.org/10.1108/13552510010341171
TRANSACTIONS OF FAMENA XLV-1 (2021) 113
M.A. Noman, A. AL-Shayea, E.A. Nasr, A Model for Maintenance Planning and H. Kaid, A. Al-Ahmari, Process Quality Control Optimization Based on A. K. Kamrani, H.A. Mahmoud EWMA and CUSUM Control Charts [7] H. Wang, "A survey of maintenance policies of deteriorating systems," European journal of operational
research, vol. 139, pp. 469-489, 2002. https://doi.org/10.1016/s0377-2217(01)00197-7 [8] A. Garg and S. Deshmukh, "Maintenance management: literature review and directions," Journal of
Quality in Maintenance Engineering, vol. 12, pp. 205-238, 2006. https://doi.org/10.1108/13552510610685075
[9] A. Schiffauerova and V. Thomson, "A review of research on cost of quality models and best practices," International Journal of Quality & Reliability Management, vol. 23, pp. 647-669, 2006. https://doi.org/10.1108/02656710610672470
[10] G. Nenes and G. Tagaras, "The economically designed two-sided Bayesian control chart," European Journal of Operational Research, vol. 183, pp. 263-277, 2007. https://doi.org/10.1016/j.ejor.2006.09.074
[11] M. Ben-Daya and S. Duffuaa, "Maintenance and quality: the missing link," Journal of quality in maintenance engineering, vol. 1, pp. 20-26, 1995. https://doi.org/10.1108/13552519510083110
[12] M. Rahim, "Economic design of x control charts assuming Weibull in-control times," Journal of Quality Technology, vol. 25, pp. 296-299, 1993. https://doi.org/10.1080/00224065.1993.11979475
[13] M. Rahim, "Joint determination of production quantity, inspection schedule, and control chart design," IiE Transactions, vol. 26, pp. 2-11, 1994. https://doi.org/10.1080/07408179408966632
[14] M. Ben-Daya, "Integrated production maintenance and quality model for imperfect processes," IiE Transactions, vol. 31, pp. 491-501, 1999. https://doi.org/10.1080/07408179908969852
[15] M. Ben-Daya and M. Rahim, "Effect of maintenance on the economic design of x-control chart," European Journal of Operational Research, vol. 120, pp. 131-143, 2000. https://doi.org/10.1016/s0377-2217(98)00379-8
[16] C. R. Cassady, R. O. Bowden, L. Liew, and E. A. Pohl, "Combining preventive maintenance and statistical process control: a preliminary investigation," IiE Transactions, vol. 32, pp. 471-478, 2000. https://doi.org/10.1080/07408170008963924
[17] T. G. Yeung, C. R. Cassady, and K. Schneider, "Simultaneous optimization of [Xbar] control chart and age-based preventive maintenance policies under an economic objective," IIE transactions, vol. 40, pp. 147-159, 2007. https://doi.org/10.1080/07408170701592515
[18] M. Ben-Daya and M. Rahim, "Integrated production, quality & maintenance models: an overview," in Integrated Models in Production Planning, Inventory, Quality, and Maintenance, ed: Springer, 2001, pp. 3-28. https://doi.org/10.1007/978-1-4615-1635-4_1
[19] Y. Kuo, "Optimal adaptive control policy for joint machine maintenance and product quality control," European Journal of Operational Research, vol. 171, pp. 586-597, 2006. https://doi.org/10.1016/j.ejor.2004.09.022
[20] K. Linderman, K. E. McKone-Sweet, and J. C. Anderson, "An integrated systems approach to process control and maintenance," European Journal of Operational Research, vol. 164, pp. 324-340, 2005. https://doi.org/10.1016/j.ejor.2003.11.026
[21] S. Panagiotidou and G. Tagaras, "Optimal preventive maintenance for equipment with two quality states and general failure time distributions," European Journal of Operational Research, vol. 180, pp. 329-353, 2007. https://doi.org/10.1016/j.ejor.2006.04.014
[22] S. Panagiotidou and G. Tagaras, "Evaluation of maintenance policies for equipment subject to quality shifts and failures," International Journal of Production Research, vol. 46, pp. 5761-5779, 2008. https://doi.org/10.1080/00207540601182260
[23] H.-N. Chiu and B.-S. Huang, "The economic design of x-control charts under a preventive maintenance policy," International Journal of Quality & Reliability Management, vol. 13, pp. 61-71, 1996. https://doi.org/10.1108/02656719610108323
[24] W.-H. Zhou and G.-L. Zhu, "Economic design of integrated model of control chart and maintenance management," Mathematical and computer Modelling, vol. 47, pp. 1389-1395, 2008. https://doi.org/10.1016/j.mcm.2007.09.008
[25] S. Panagiotidou and G. Nenes, "An economically designed, integrated quality and maintenance model using an adaptive Shewhart chart," Reliability Engineering & System Safety, vol. 94, pp. 732-741, 2009. https://doi.org/10.1016/j.ress.2008.07.003
[26] D. Pandey, M. S. Kulkarni, and P. Vrat, "A methodology for joint optimization for maintenance planning, process quality and production scheduling," Computers & Industrial Engineering, vol. 61, pp. 1098-1106, 2011. https://doi.org/10.1016/j.cie.2011.06.023
114 TRANSACTIONS OF FAMENA XLV-1 (2021)
A Model for Maintenance Planning and M.A. Noman, A. AL-Shayea, E.A. Nasr, Process Quality Control Optimization Based on H. Kaid, A. Al-Ahmari, EWMA and CUSUM Control Charts A. K. Kamrani, H.A. Mahmoud
[27] D. Pandey, M. S. Kulkarni, and P. Vrat, "A methodology for simultaneous optimisation of design parameters for the preventive maintenance and quality policy incorporating Taguchi loss function," International Journal of Production Research, vol. 50, pp. 2030-2045, 2012. https://doi.org/10.1080/00207543.2011.561882
[28] L. Liu, M. Yu, Y. Ma, and Y. Tu, "Economic and economic-statistical designs of an control chart for two-unit series systems with condition-based maintenance," European Journal of Operational Research, vol. 226, pp. 491-499, 2013. https://doi.org/10.1016/j.ejor.2012.11.031
[29] N. Manavizadeh and E. A. Javan, "A New Approach in Joint Optimization of Maintenance Planning, Process Quality and Production Scheduling," International Journal, vol. 3, 2014.
[30] H. Yin, G. Zhang, H. Zhu, Y. Deng, and F. He, "An integrated model of statistical process control and maintenance based on the delayed monitoring," Reliability Engineering & System Safety, vol. 133, pp. 323-333, 2015. https://doi.org/10.1016/j.ress.2014.09.020
[31] D. Shrivastava, M. S. Kulkarni, and P. Vrat, "Integrated design of preventive maintenance and quality control policy parameters with CUSUM chart," International Journal of Advanced Manufacturing Technology, vol. 82, pp. 2101-2112, 2016. https://doi.org/10.1007/s00170-015-7502-7
[32] B. Lu, X. Zhou, and Y. Li, "Joint modeling of preventive maintenance and quality improvement for deteriorating single-machine manufacturing systems," Computers and Industrial Engineering, vol. 91, pp. 188-196, 2016. https://doi.org/10.1016/j.cie.2015.11.019
[33] J. J. Black and O. Mejabi, "Simulation of complex manufacturing equipment reliability using object oriented methods," Reliability Engineering & System Safety, vol. 48, pp. 11-18, 1995. https://doi.org/10.1016/0951-8320(95)00008-p
[34] B. K. Lad and M. Kulkarni, "Integrated reliability and optimal maintenance schedule design: a life cycle cost based approach," International Journal of Product Lifecycle Management, vol. 3, pp. 78-90, 2008. https://doi.org/10.1504/ijplm.2008.019971
[35] S. Roberts, "Control chart tests based on geometric moving averages," Technometrics, vol. 1, pp. 239-250, 1959. https://doi.org/10.1080/00401706.1959.10489860
[36] S. V. Crowder, "A simple method for studying run–length distributions of exponentially weighted moving average charts," Technometrics, vol. 29, pp. 401-407, 1987. https://doi.org/10.2307/1269450
[37] S. V. Crowder, "Average run lengths of exponentially weighted moving average control charts," Journal of Quality Technology, vol. 19, pp. 161-164, 1987. https://doi.org/10.1080/00224065.1987.11979055
[38] S. V. Crowder, "Design of exponentially weighted moving average charts," Journal of Quality Technology, vol. 21, pp. 155-162, 1989. https://doi.org/10.1080/00224065.1989.11979164
[39] J. M. Lucas and M. S. Saccucci, "Exponentially weighted moving average control charts: properties and enhancements," Technometrics, vol. 32, pp. 1-12, 1990. https://doi.org/10.1080/00401706.1990.10484583
[40] I. C. Gomes, S. A. Mingoti, and C. D. L. Oliveira, "A novel experience in the use of control charts for the detection of nosocomial infection outbreaks," Clinics, vol. 66, pp. 1681-1689, 2011. https://doi.org/10.1590/s1807-59322011001000004
[41] M. Aslam, M. Azam, and C.-H. Jun, "A new control chart for exponential distributed life using EWMA," Transactions of the Institute of Measurement and Control, vol. 37, pp. 205-210, 2015. https://doi.org/10.1177/0142331214537293
[42] QUA Khaliq, M. Riaz and S. Ahmad, "On designing a new Tukey-EWMA control chart for process monitoring," The International Journal of Advanced Manufacturing Technology, vol. 82, pp. 1-23, 2016. https://doi.org/10.1007/s00170-015-7289-6
[43] C. Vera do Carmo, L. F. D. Lopes, A. M. J. C. Souza, and I. Engineering, "Comparative study of the performance of the CuSum and EWMA control charts," vol. 46, pp. 707-724, 2004. https://doi.org/10.1016/j.cie.2004.05.025
[44] A.-S. Adel, M. A. Noman, E. A. Nasr, H. Kaid, A. K. Kamrani, and A. M. El-Tamimi, "New Integrated Model for Maintenance Planning and Quality Control Policy for Multi-Component System using an EWMA Chart," IEEE Access, 2019. https://doi.org/10.1109/access.2019.2950815
[45] L. Zhang, G. Chen, and P. Castagliola, "On t and EWMA t charts for monitoring changes in the process mean," Quality and Reliability Engineering International, vol. 25, pp. 933-945, 2009. https://doi.org/10.1002/qre.1012
[46] M. Srivastava and Y. Wu, "Evaluatiok of optimum weights and average run lenghts in ewma control charts," Communications in Statistics-Theory and Methods, vol. 26, pp. 1253-1267, 1997. https://doi.org/10.1080/03610929708831980
TRANSACTIONS OF FAMENA XLV-1 (2021) 115
M.A. Noman, A. AL-Shayea, E.A. Nasr, A Model for Maintenance Planning and H. Kaid, A. Al-Ahmari, Process Quality Control Optimization Based on A. K. Kamrani, H.A. Mahmoud EWMA and CUSUM Control Charts [47] M. Bagshaw and R. A. J. J. o. t. R. S. S. S. B. Johnson, "The influence of reference values and estimated
variance on the ARL of CUSUM tests," vol. 37, pp. 413-420, 1975. https://doi.org/10.1111/j.2517-6161.1975.tb01555.x
[48] George V. Moustakides. "Optimal Stopping Times for Detecting Changes in Distributions." Ann. Statist. 14 (4) 1379 - 1387, December, 1986. https://doi.org/10.1214/aos/1176350164
[49] L.C. Alwan, “Designing an effective exponential cusum chart without the use of nomographs,” Communications in Statistics - Theory and Methods, 29:12, 2879-2893, 2000. https://doi.org/10.1080/03610920008832642
[50] W. H. Woodall and B. M. J. Q. E. Adams, "The statistical design of CUSUM charts," Quality Engineering, 5:4, 559-570, 1993. https://doi.org/10.1080/08982119308918998
[51] B. K. Lad and M. S. Kulkarni, "A parameter estimation method for machine tool reliability analysis using expert judgement," International Journal of Data Analysis Techniques and Strategies, vol. 2, pp. 155-169, 2010. https://doi.org/10.1504/ijdats.2010.032455
[52] T. J. Lorenzen and L. C. Vance, "The economic design of control charts: a unified approach," Technometrics, vol. 28, pp. 3-10, 1986. https://doi.org/10.1080/00401706.1986.10488092
[53] D. C. Montgomery, Introduction to statistical quality control: John Wiley & Sons (New York), 2009.
Submitted: 17.8.2020 Accepted: 19.11.2020
Mohammed A. Noman* Industrial Engineering Department, College of Engineering, King Saud University, P. O. Box 800, Riyadh 11421, Saudi Arabia. Department of Industrial and Manufacturing Systems Engineering, College of Engineering & IT, Taiz University, Taiz 6803, Yemen. Adel AL-Shayea Husam Kaid Abdulrahman Al-Ahmari Industrial Engineering Department, College of Engineering, King Saud University, P. O. Box 800, Riyadh 11421, Saudi Arabia. Emad Abouel Nasr Haitham A. Mahmoud Industrial Engineering Department, College of Engineering, King Saud University, P. O. Box 800, Riyadh 11421, Saudi Arabia. Faculty of Engineering, Mechanical Engineering Department, Helwan University, Cairo 11732, Egypt. Ali K. Kamrani Industrial Engineering Department, College of Engineering, University of Houston, 213 Engineering Building 2, Houston, TX 77204 4008, USA. Corresponding author *[email protected]
116 TRANSACTIONS OF FAMENA XLV-1 (2021)