MOFAD Commission The State of Fisheries in Ghana Science ...
31
MOFAD Fisheries Commission The State of Fisheries in Ghana Science and Fisheries Management Najih Lazar Senior Fisheries Advisor
Transcript of MOFAD Commission The State of Fisheries in Ghana Science ...

MOFAD
Fisheries
Commission
The State of Fisheries in Ghana
Science and Fisheries Management
Najih Lazar
Senior Fisheries Advisor

USAID/Sustainable Fisheries Management Project (2015-2019) GOAL:
• To rebuild marine fisheries stocks and increase production through effective fisheries
management strategies and adoption of responsible fishing practices
• To contribute to the Government of Ghana’s fisheries policies and development
objectives, and USAID Feed the Future Initiative
• Build research and education capacity of University of Cape Coast

IMPLEMENTATION:
• The Coastal Resources Center (CRC)
• Graduate School of Oceanography
• University of Rhode Island
• leads a team of partners in Ghana (HM, FoN, SNV, CW, DAA, SS,
DQ, SSG)

Animal Source Food (ASF) from fishSource: http://www.fishingfuture.org/ Briefing paper 6
Africa has some of the highest per capita consumption of fish in the World
In Africa, highest in West Africa
Animal Source Food (ASF) from fishSource: http://www.fishingfuture.org/ Briefing paper 6
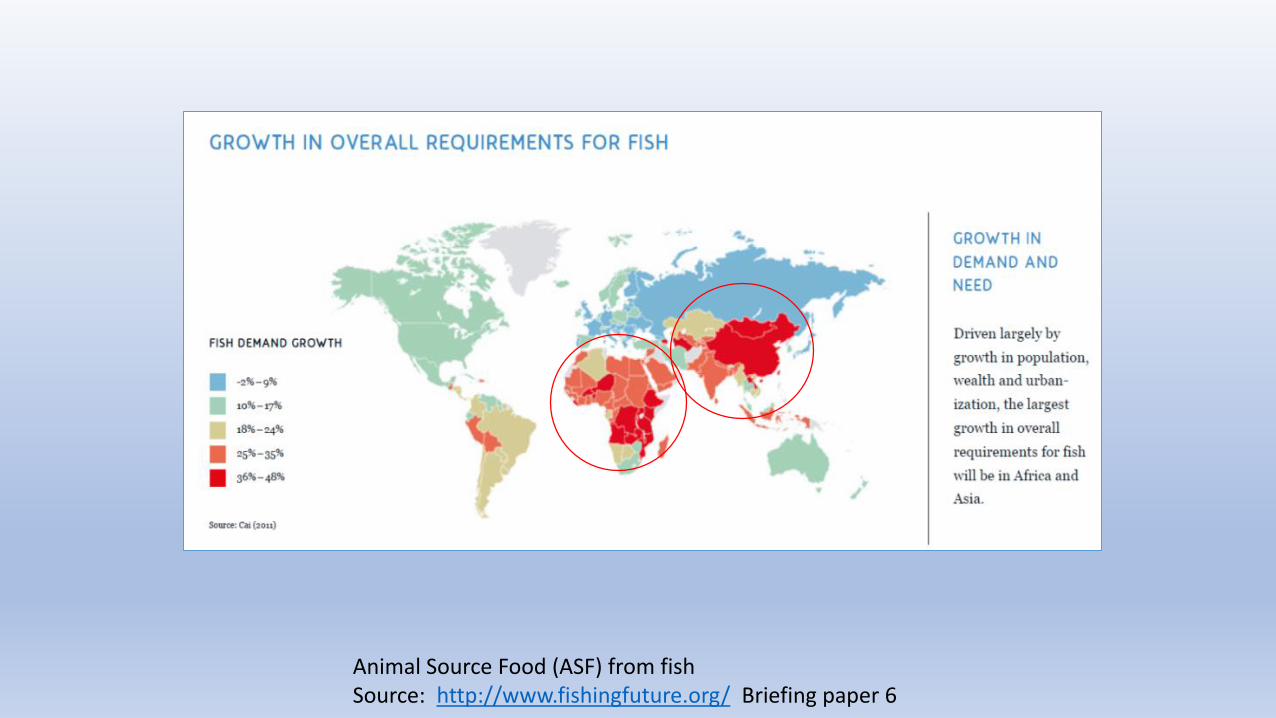
Nutritional Value of Small Pelagic Fishes
Table 1. The nutrient content of fish and other foods (per 100g)*
Fat
Group
Scientific name /common name (local name/common name) Protein (g)
Total lipid (fat; g)
Total saturated fat
(g) Total PUFA
(g) EPA (g) DHA (g) Ca (mg) Fe (mg) Zn (mg) Vitamin A
(RAE) † Notes (per 100g)
Large freshwater fish and prawn
Carp 17.83 5.60 1.08 1.431 0.238 0.114 41 1.24 1.48 9 Raw, edible Catfish 15.60 7.59 1.77 1.568 0.067 0.207 9 0.50 0.74 15 Farmed, raw, edible Tilapia 20.80 1.70 0.77 0.476 0.007 0.113 10 0.56 0.33 0 Raw, edible
Marine fish Anchovy 20.35 4.84 1.28 1.637 0.538 0.911 147 3.25 1.72 15 Raw, edible, European Herring 16.39 9.04 2.04 2.423 0.969 0.689 83 1.12 0.99 32 Raw, edible, Pacific Mackerel 18.60 13.89 3.26 3.350 0.898 1.401 12 1.63 0.63 50 Raw, edible Milkfish 20.53 6.73 1.67 1.840 51 0.32 0.82 30 Raw, edible,
Philippines Sardine 24.60 11.45 1.53 5.148 0.470 0.509 382 2.92 1.31 33 Canned in oil, drained
solids with bone
Other animal-sourced foods
Beef ground 14.30 30.00 11.29 0.696 24 1.64 3.57 0 Raw, ground, 70% lean meat 30% fat
Chicken breast 14.70 15.75 3.26 3.340 19 1.11 0.78 0 Breast tender, uncooked raw
Plant-sourced foods
Cassava 1.40 0.28 0.28 0.048 16 0.27 0.34 1 Raw
Rice 2.69 0.28 0.28 0.323 10 1.20 0.49 0 White, long-grained, regular, cooked
Kidney beans 8.67 0.09 0.09 0.278 35 2.22 0.86 0 Mature, cooked
High content >15.00 >2.000 >0.400 >0.400 >100 >3.00 >3.50 >500
RAE, retinol activity equivalents. Bold indicates high content values
Adapted from: Kawarazuka and Béné, 2011. Public health nutrition, 14(11), 1927-1938.

MOFAD
Fisheries
Commission
• The marine fisheries sector is the most important source of local fish
production, delivering more than 80% of the total supply
• Over 300 different species of commercially important fish are caught from
marine sources in Ghana
• Most marine fish supply is from artisanal fishery and the most important
marine resources are small pelagics (sardinella, anchovy and mackerel)
• Gross value is over $300 million/year and the total revenues over $1 billion
• Export value over $100 million/year
• Direct jobs >200,000 and indirect jobs over 2 million
• Average consumption 23-26 kgs/capita
• A way of life for coastal communities
MARINE FISHERIES PROFILE OF GHANA

MOFAD
Fisheries
Commission
0
50000
100000
150000
200000
250000
300000
350000
19
86
19
87
19
88
19
89
19
90
19
91
19
92
19
93
19
94
19
95
19
96
19
97
19
98
19
99
20
00
20
01
20
02
20
03
20
04
20
05
20
06
20
07
20
08
20
09
20
10
20
11
20
12
20
13
20
14
20
15
Artisanal Semi-Industrial Trawlers Tuna

MOFAD
Fisheries
Commission
Fisheries Resource Indicator (CPUE)
0
5
10
15
20
25
30
35
40
19
86
19
88
19
90
19
92
19
94
19
96
19
98
20
00
20
02
20
04
20
06
20
08
20
10
20
12
20
14
CP
UE
(Kgs
/Day
)
YEAR
Catch per unit of effort (CPUE)
Artisanal
0
10
20
30
40
50
19
86
19
88
19
90
19
92
19
94
19
96
19
98
20
00
20
02
20
04
20
06
20
08
20
10
20
12
20
14
CP
UE
(Kgs
/Day
)
YEAR
Catch per unit of effort (CPUE)
Semi-Industrial
0
100
200
300
400
500
600
19
86
19
88
19
90
19
92
19
94
19
96
19
98
20
00
20
02
20
04
20
06
20
08
20
10
20
12
20
14
CP
UE
(Kgs
/Day
)
YEAR
Catch per unit of effort (CPUE)
Trawlers
0
500
1000
1500
2000
2500
19
86
19
88
19
90
19
92
19
94
19
96
19
98
20
00
20
02
20
04
20
06
20
08
20
10
20
12
20
14
CP
UE
(Kgs
/Day
)
YEAR
Catch per unit of effort (CPUE)
Tuna

MOFAD
Fisheries
Commission
State of the fish stocks in Ghana (FAO)
• The Marine fisheries resources of Ghana over the last decade have been
fluctuating showing general decline in catches, revenues and mean size
of fish.
• This is an indication of heavy exploitation at all fisheries (F/Fmsy=1.46
and B/Bmsy=0.72)
• Some targeted stocks are severely overfished (Sardinella, Sea breams,
Groupers/Snappers and Cephalopods)
• Others are at full exploitation level (chub mackerel, skipjacks and
carrangids F/Fmsy=1.0)
• There are no stocks that are under-exploited
MOFAD
Fisheries
Commission
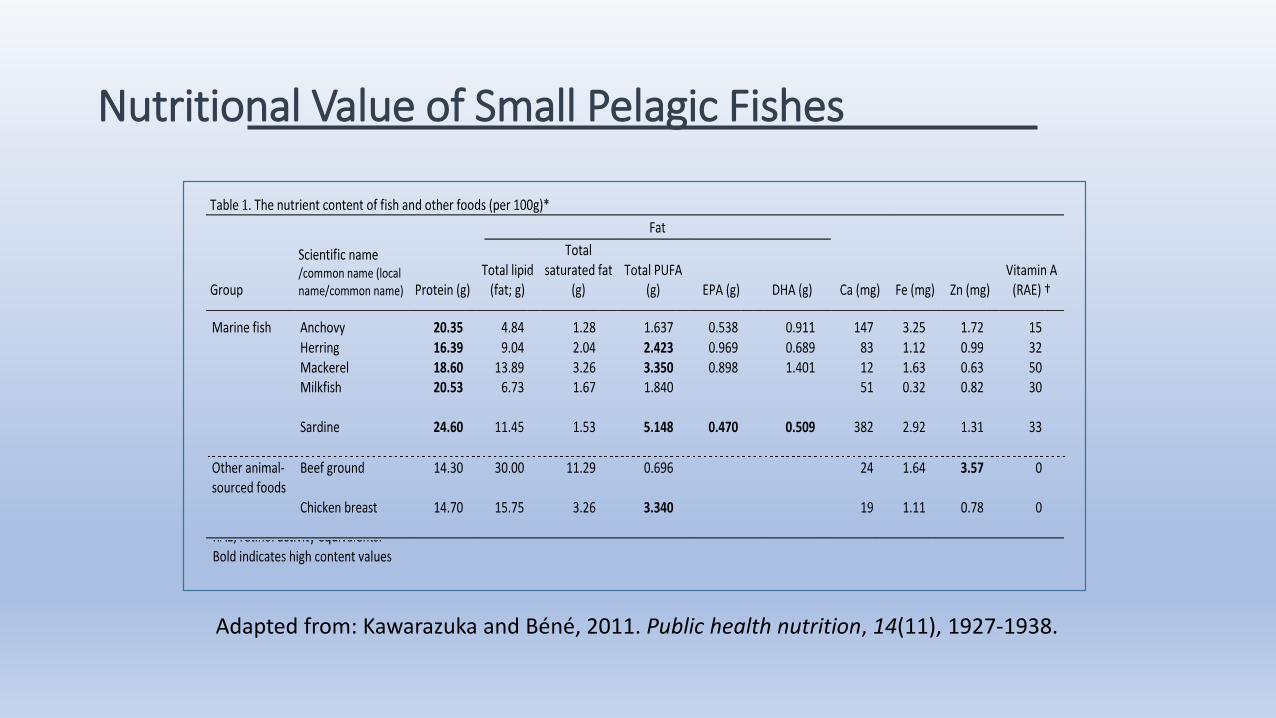
Status of “small” pelagics stocks
STWG
Sardinella aurita(Eban, Kankama)
Engraulis encrasicolus(Amoni, Abobi)
Sardinella maderensis(Antebo, Adruku)
Scomber japonicas(Saman, Awokongula)

MOFAD
Fisheries
Commission
Sardinellas Biology and Stock distribution:
• Can be fished from Morocco to South Africa on the Atlantic Ocean of Africa.
• Strong seasonal migratory species
• Move in schools of fish from inshore to edge of shelf.
• Prefers clear saline water with a minimum temperature below 24°C.
• Juveniles tend to stay in nursery areas inshore.
• They join adult stocks offshore when they mature.
• Feeds mainly on zooplankton, especially copepods

MOFAD
Fisheries
Commission
Landings trends

MOFAD
Fisheries
Commission
-
2,000
4,000
6,000
8,000
10,000
12,000
14,000
16,000
19
80
19
81
19
82
19
83
19
84
19
85
19
86
19
87
19
88
19
89
19
90
19
91
19
92
19
93
19
94
19
95
19
96
19
97
19
98
19
99
20
00
20
01
20
02
20
03
20
04
20
05
20
06
20
07
20
08
20
09
20
10
20
11
20
12
20
13
20
14
Nu
mb
er o
f C
ano
esNumber of Canoes in the artisanal fishery
Effort trends

MOFAD
Fisheries
Commission
Small pelagic fishery is seasonal

MOFAD
Fisheries
Commission
Biomass trends (tons)

MOFAD
Fisheries
Commission
Fishing efficiency (rate of fishing F)

Were are we ? Rebuilding targets
1997
2014
Fishery status showing overfishing and stocks overfished
1980
Tota
l we
igh
t o
f fi
sh in
th
e o
cean
Fishing mortality rate
MOFAD
Fisheries
Commission
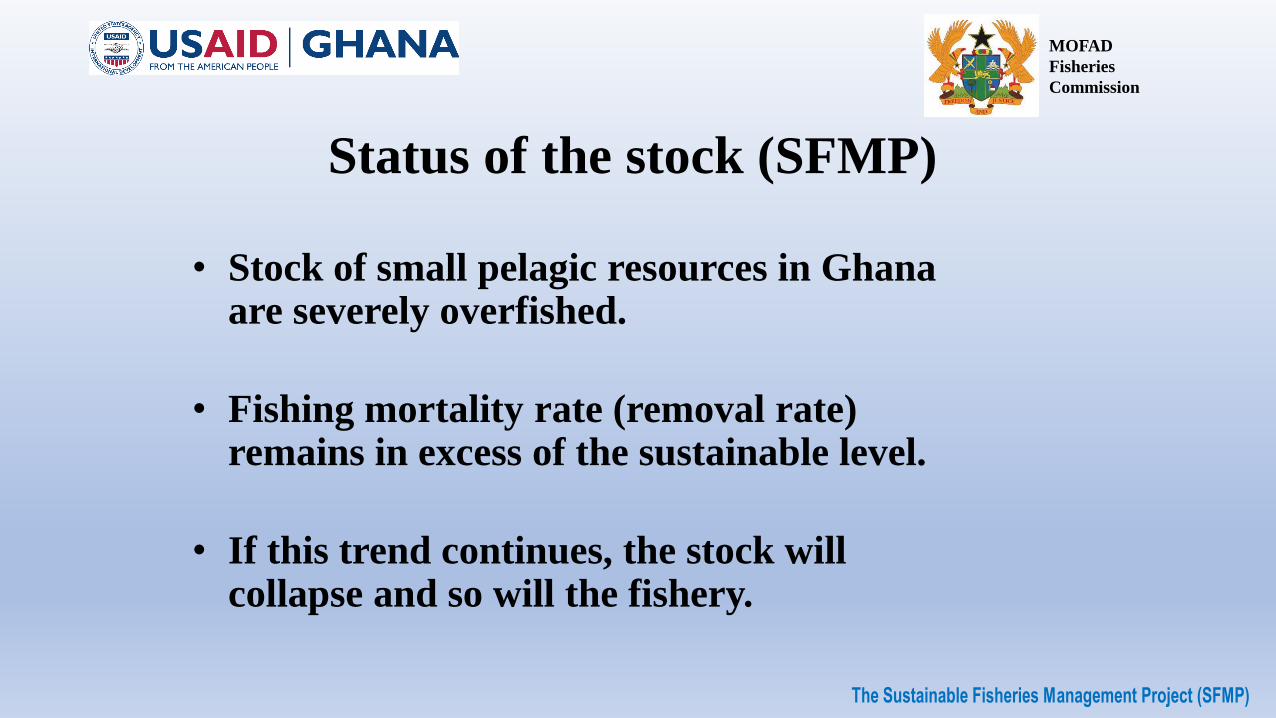
• Stock of small pelagic resources in Ghana are severely overfished.
• Fishing mortality rate (removal rate) remains in excess of the sustainable level.
• If this trend continues, the stock will collapse and so will the fishery.
Status of the stock (SFMP)

MOFAD
Fisheries
Commission
MAN MADE ACTIVITIES
• OPEN ACCESS CAUSED OVERCAPACITY (5000 – 12,000 canoes in 20 years) and
OVEREFISHING (average net increased and input of large foreign trawlers)
• LACK OF ADEQUATE ENFORCEMENT CAUSED USE OF ILLEGAL
METHODS AND GEARS (small mesh, light fishing, Seiko, dynamite, chemicals…etc)
• LACK OF ADEQUATE INFRASTUCTURE CAUSED WASTEFUL FISHING
PRACTICES LEADING TO POST HARVEST LOSSES
ENVIRONMNETAL FACTORS
• UPWELLINGS AND UNEXPECPTED INTERACTIONS
• CLIMATE CHANGE
Causes of overexploitation

MOFAD
Fisheries
Commission
CONSEQUENCES
- Loss of revenues and jobs
- Increased Poverty
- Loss of food security
- Loss of healthy ecosystem

MOFAD
Fisheries
Commission
We can reverse this trend by implementing the National
Fisheries Management Plan
(MoFAD 2015-2019)
The implementation should be guided by:
• Maximum Sustainable Yield
• Effort control
• Legislation
• Improved fisheries information
• Improved law enforcement

MOFAD
Fisheries
Commission
What is the Maximum Sustainable Yield ?
Maximum growth rate
Under no harvest a wild population will grow exponentially then slow down until it reaches an equilibrium

MOFAD
Fisheries
Commission
0
100
200
300
400
500
600
700
800
900
1000
0 100 200 300 400 500 600 700 800 900 1000
Yie
ld (
x 1
00
0 t
on
s)
Fishing Effort (Exp: Number of vessels or number of days fished...etc)
Maximum Sustainable Yield (MSY)
An International management target
MSY
Emsy
fMSY
MSY
9095Revenues
Fishing Effort
Current fishing effort12930
Cost
Subsidy
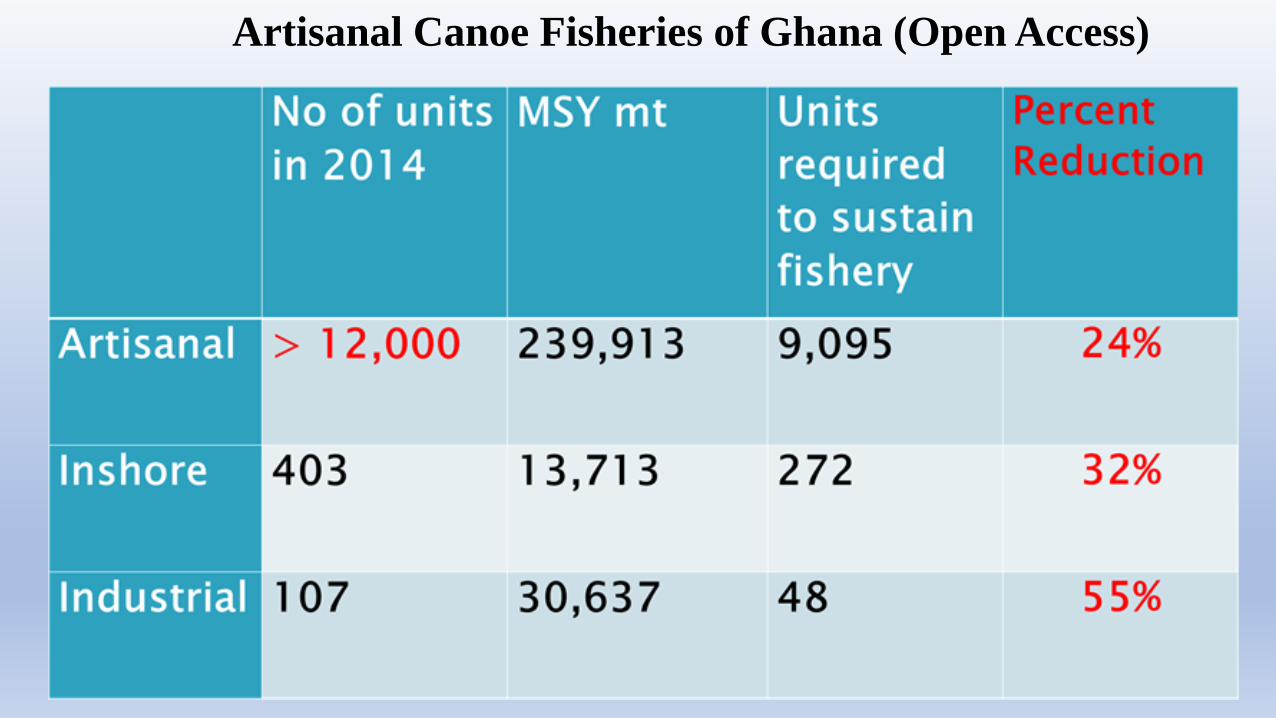
Artisanal Canoe Fisheries of Ghana (Open Access)

MOFAD
Fisheries
Commission
- Implement the laws governing licensing
provisions of the Fisheries Act
- Moratorium on new licenses for artisanal
fisheries (no more canoes)
- Reduce fishing effort for industrial
trawlers by 50%
- Improve fisheries data collection system
- Implement closed season for all fisheries
Effort control

MOFAD
Fisheries
Commission
Legislation that Influence Fisheries
• Fisheries Act 625 (2002)
• Fisheries Regulations L.I. 1968 (2010)
• Fisheries Amendment Act 880 (2014)
• National Environmental Act 490 (1994)
• Endangered species Act (Wildlife & Forestry 571)

MOFAD
Fisheries
Commission
Improved information system
• Scientific and Technical Working Group needs to be
formalized
• Fisheries Scientific and Survey Division needs more
staff and more capacity
• Decentralize flow of fisheries information
• Training and capacity building

MOFAD
Fisheries
Commission
Improved Law enforcement
• Training and capacity building
• Logistical support
• Coordination with FEU
• Improve transparency

SUMMARY
• Fisheries sector is a significant socio-economic driver
• Many fish stocks are overfished
• NFMP (2015-2019) was approved and needs full force implementation
• Science-based fisheries management needs to guide implementation
• Improve legal framework and strengthen science and monitoring institutions
• Invest in post-harvest techniques, infrastructure and market strategies

MOFAD
Fisheries
Commission
Thank you