Module14 Standardized Tests - University of South Florida · This#module#should# ... Poten
32
In this module we will cover standardized tests. 1
Transcript of Module14 Standardized Tests - University of South Florida · This#module#should# ... Poten

In this module we will cover standardized tests.
1

This module should give you the opportunity to integrate everything we’ve covered previously into our primary focuses: the use of standardized tests and the interpreta<on of standardized test scores.
You will learn the purposes of standardized tests, the types of standardized tests, the evalua<on or selec<on of standardized tests, the interpreta<on of standardized tests.
2

All of the skills we’ve addressed so far: item analysis, validity, reliability, standard error of measurement, and summarizing test scores, are important for professional educators who are using standardized tests.
Professional educators need to be able to iden<fy when a given standardized test is appropriate for par<cular students and need to be able to interpret score reports and make use of the informa<on they provide for individual students or across groups of students.
3

What is a standardized test? To answer this ques<on, we can compare standardized tests with teacher-‐made tests.
For standardized tests the general content is appropriate to all students. Both the quality of items and the reliability are generally high. The administra<on and scoring procedures are standardized. Scores can be compared to the norm group.
For teacher-‐made tests the content is specific to what is addressed in the local curriculum. Both the quality of the items and the reliability are unknown. The administra<on and scoring procedures are teacher-‐driven. Scores can be compared to local contexts in limita<on.
4

Several purposes for using standardized tests include “quality control and public accountability,” “curriculum and program evalua<ons,” and “individual student assessment and diagnosis.”
For the purpose of quality control and public accountability, standardized tests can show how well the school or district is doing, rela<ve to others.
For the purpose of curricular and program evalua<on, standardized tests help us find out where the curriculum’s rela<ve strengths and weaknesses are or if the new program altered scores.
For the purpose of individual student assessment and diagnosis, standardized tests provide informa<on regarding how a par<cular student is performing.
5

There are several types of standardized tests: past achievement tests, poten<al achievement tests, and personality tests and predic<ve achievement tests.
6

Achievement tests may include (1) “achievement baQery tests”, such as the Comprehensive Test of Basic Skills (or CTBS), the Metropolitan Achievement Tests (MAT), and the Iowa Tests of Basic Skills (ITBS).
Single-‐subject achievement tests such as Nelson-‐Denny Reading Test. And diagnos<c tests such as the California Diagnos<c Math Test (or CDMT) and the California Diagnos<c Reading Test (or CDRT).
7

Poten<al achievement standardized tests are academic ap<tude tests. They can be administered either individually or to a whole group.
Individually administered ap<tude tests include the Wechsler Intelligence Scale for Children (or WISC-‐III) and the Stanford-‐Binet Intelligence Scale.
Group-‐administered ap<tude tests include the Cogni<ve Abili<es Tests (or CogAt) and the O<s-‐Lennon School Ability Tests.
8
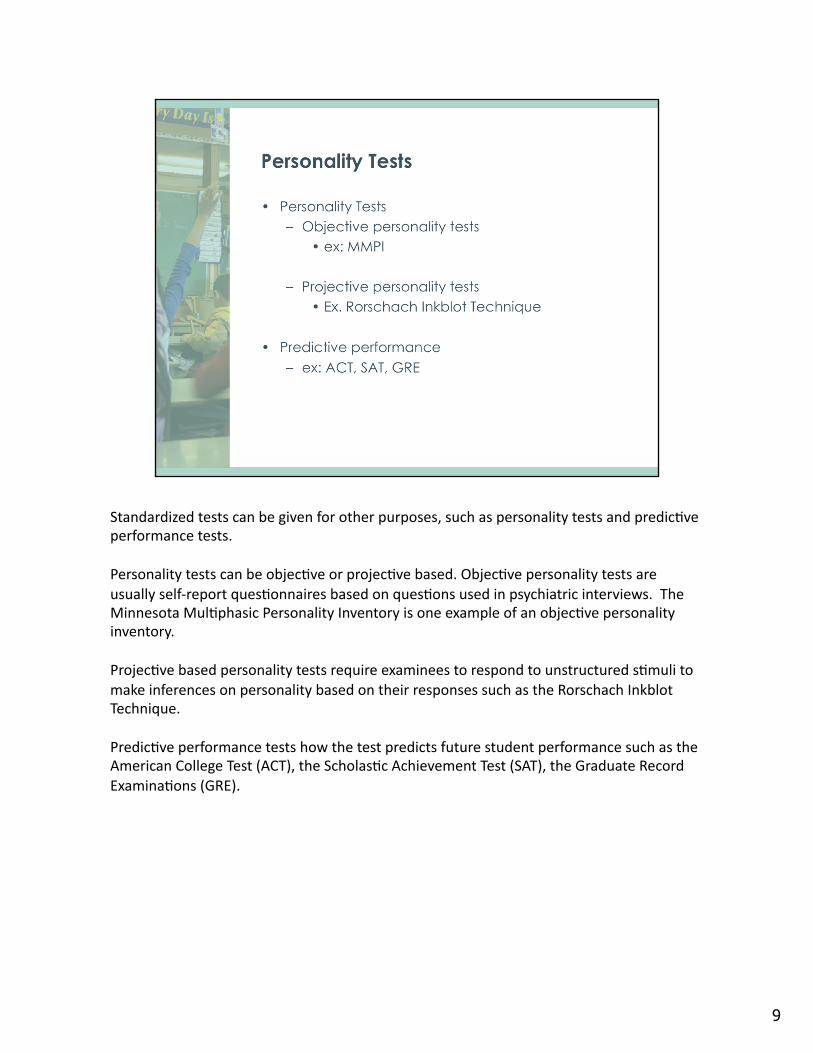
Standardized tests can be given for other purposes, such as personality tests and predic<ve performance tests.
Personality tests can be objec<ve or projec<ve based. Objec<ve personality tests are usually self-‐report ques<onnaires based on ques<ons used in psychiatric interviews. The Minnesota Mul<phasic Personality Inventory is one example of an objec<ve personality inventory.
Projec<ve based personality tests require examinees to respond to unstructured s<muli to make inferences on personality based on their responses such as the Rorschach Inkblot Technique.
Predic<ve performance tests how the test predicts future student performance such as the American College Test (ACT), the Scholas<c Achievement Test (SAT), the Graduate Record Examina<ons (GRE).
9

To evaluate and select a standardized test, the following criteria can be considered: validity, reliability and accuracy, costs, administra<ve issues including <me and ease, and the norm group.
10

Early in the development of a standardized test, the test is administered to a norming group (or norm sample).
This sample should have been carefully selected to be representa(ve of the targeted popula<on of future examinees of the test.
The performance of this norm group on the test is then used as the basis of comparison for later test-‐takers.
11

The norm group answers the ques<on – “Compared to who?”
The group should be relevant, representa<ve, and recent.
12

Here is an example of a norm group descrip<on that would be found in a standardized tests manual. The sample was derived from 13,000 students in grades K-‐12 where the ages ranged from 5-‐19. The sample was stra<fied according to gender, parental income, parental educa<on, ethnicity, and geographic region. For instance, the numbers of males and females did not differ by more than 50 in each grade.
13

This is a breakdown of the sta<s<cs used for each category. The percentages of the norm group for each category reflect the popula<on’s percentage within each category. This ensures that our norm group is relevant and representa<ve.
14

Along with na<onal norms tables, addi<onal norm tables can be used to increase the interpretability of the test scores, such as specialized norms tables and local norms tables.
Specialized norms tables are established for specialized students such as English as a second language (or ESL) or low socioeconomic status students.
When a class, school, or district is substan<ally different from the norma<ve sample, local norms may enable beQer use of test results. Local norms tables are constructed by including all students in the local school or district.
15

Now we interpret results from a standardized test. Assuming that the test is of good quality such as good validity and high reliability and appropriate for the examinee, that is, suitable norm group, we then can ask “what do the test scores tell us?
16

Results from standardized tests may be reported in several ways, such as percen<le rank scores (or PR), standard scores, stanines, grade equivalent scores (or GE), and age equivalent scores (AE).
17

Percen<le rank scores provide informa<on about the percent of the norm group below a par<cular score. They are very useful norma<ve informa<on. For example, a percen<le rank of 62 means that the individual’s score was higher than 62% of the people who took the test
Conversely, 62% of those taking the test received the score lower than this individual
18

There are two things regarding percen<le ranks that are worth no<ng.
The first thing is that percen<le rank scores should not be confused with percent correct scores. For instance, a percen<le rank of 62 does not mean the student answered only 62% of the items correct.
The other thing is that the difference between percen<le ranks may not equal difference in achievement. For instance, in a class of 100 students, the difference in achievement scores between the 2nd percen<le and 5th percen<le is substan<al, whereas the difference between the 47th and 50th is negligible, assuming a normal distribu<on. This is because the percen<le ranks are more spread out in the tails of the distribu<on and in the center of a distribu<on the percen<le ranks are compressed.
19

Like percen<le ranks, standard scores are another form of standardized test score reports that compare a student’s score to that of other students at the same grade level. The z-‐score is one of standard scores and is the basis of all standard scores. In other words, all other types of standard scores are derived from the z score scale and can be converted back to it. Standard scores such as z scores can be interpreted in “standard devia<on units” so that the problem of equal differences between percen<le ranks not represen<ng equal difference in achievement scores can be overcome through the use of standard scores. The distribu<on of the z scores has a mean of 0 and a standard devia<on of 1.
20

There are many other standard scores such as T-‐scores, the SAT and GRE scores, or the Stanford-‐ Binet scores. These score scales are based on z-‐scores, but each has its own mean and standard devia<on. For instance, the T-‐score has a mean of 50 and a standard devia<on of 10. Both SAT and GRE scores have a mean of 500 and a standard devia<on of 100. The Stanford-‐Binet score has a mean of 100 and a standard devia<on of 16.
21

Here is a special type of standard scores called “Stanines.”
Using Stanines, students’ individual scores are not reported, rather, a student is said to be in a given stanine level such as “in the 2nd stanine” or “in the 9th stanine.”
Stanines have a mean of 5 and a standard devia<on of 2. Each stanine has one-‐half standard devia<on.
There are 9 rela<vely coarse stanine levels which are oken collapsed into 3 categories. Stanines 1 to 3 represent “below average,” Stanines 4 to 6 represent “average,” and Stanines 7 to 9 are “above average.”
22

Stanines are ranges or bands within which fixed percentages of students’ scores fall. They are determined by dividing the normal curve into nine por<ons. Here are the nine stanine levels and the percentage of students within each stanine. As you can see, the top 4% students are classified into “Stanine 9” and the lowest 4% students are in “Stanine 1.”
23

There are advantages and disadvantages of using stanines. A major advantage is that classifica<on into these levels may lead to less over-‐interpreta<on than single scores. However, a disadvantage is that the extreme stanines (such as stanine 1 and stanine 9) are very dispersed.
24

There are two score types that are not based on the normal distribu<on.
Rather, scores are reported in terms of expected growth or development over <me.
They are grade equivalent (or GE) scores and age equivalent (or AE) scores.
Grade equivalent scores indicate the average score for a student in a par<cular grade level at a par<cular <me of the school year.
For instance, average score for beginning 3rd graders is the grade equivalent score of 3.0. The grade equivalent score of 6.4 represents the average score for 4th month of 6th grade.
Age equivalent scores are very similar to the grade equivalent scores. Age equivalent scores are reported as average performance for students of a given age. For instance, the age equivalent (or AE) score of 8.6 represents average performance for students at age of 8 years and 6 months.
25

There are several cau<ons for use of both of these scores.
The first is that a test is usually only administered to the target group, and “plus/minus” one level (either grade or age).
Any score reported beyond that level for example, 2 grades below, 3 years above is an es(mate, with limited interpre<ve meaning. That is, much higher or lower grade (or age) equivalents than average represent only rela<ve degrees of performance. They do not mean that students are ready only for “2 grades below” work or for “3 years above” work. They also say nothing about specific skills mastered or about deficiencies.
26

Most standardized test publishers collect data about how a norm group of examinees performed on their test.
The performance of this norm group is then used to provide you with informa<on about how your students performed, rela<ve to this earlier group.
For this reason, who was in the norm group is very important.
For the test reports to be most useful to you, the norm group should ideally be composed of students who are similar to your students in many categories.
27

In some cases, an achievement test is co-‐normed with a test of ap<tude.
To establish a co-‐norms table, a na<onal sample of representa<ve examinees may be selected for norming an achievement test baQery. The students in the norm group are then administered the achievement tests, and in addi<on, they are administered a test of ap<tude or poten<al as well.
Then, the co-‐norms table that includes subject-‐specific achievement scores along with test scores on ability or ap<tude can be formed. Once this has been done, future test-‐takers who take both the achievement test and the ap<tude test can then be considered in terms of any possible ap<tude-‐achievement discrepancy. In other words, a student’s performance (or achievement) may be interpreted rela<ve to his or her poten<al (or ap<tude) .
28

Using the co-‐norms table, a student’s achievement (such as in math) can be compared to his or her ap(tude for math, as compared to how students in the co-‐norming group did on these two exams.
This kind of informa<on can be useful for the teacher to interpret a student’s performance and to determine who needs more help.
In other words, according to the co-‐norm table students may be rated as underachieving rela<ve to their ap<tude; achieving at their expected level; or even overachieving rela<ve to their ap<tude.
29
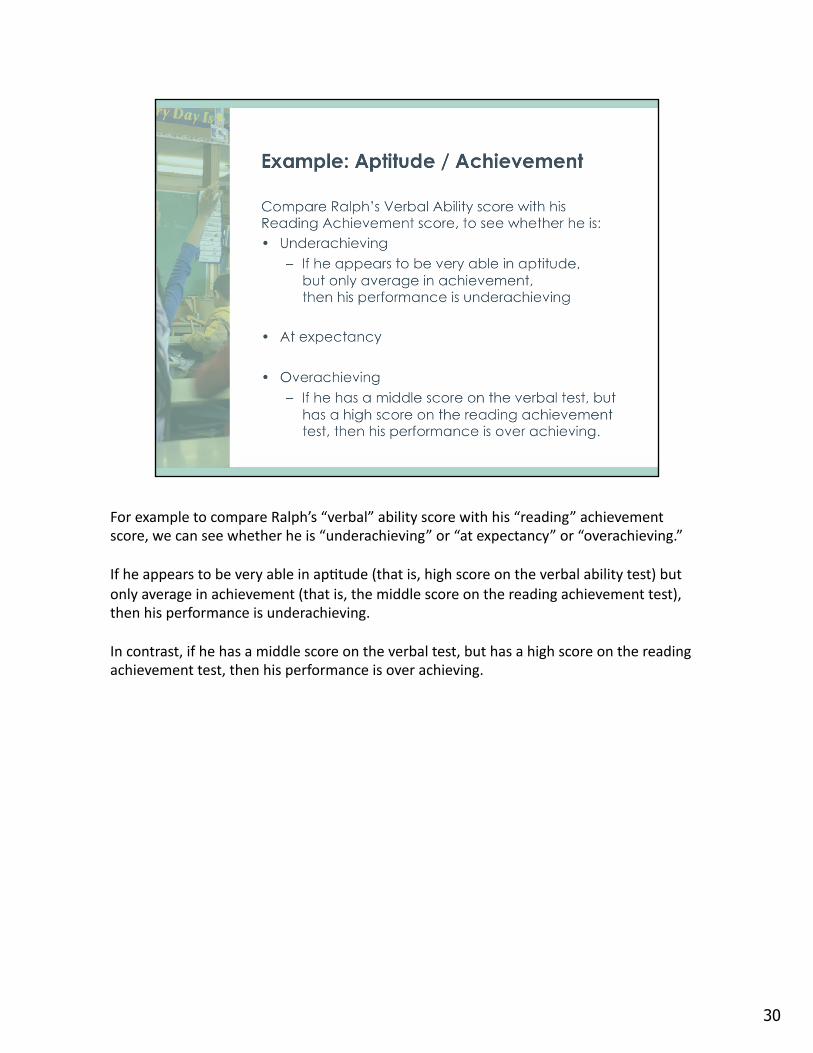
For example to compare Ralph’s “verbal” ability score with his “reading” achievement score, we can see whether he is “underachieving” or “at expectancy” or “overachieving.”
If he appears to be very able in ap<tude (that is, high score on the verbal ability test) but only average in achievement (that is, the middle score on the reading achievement test), then his performance is underachieving.
In contrast, if he has a middle score on the verbal test, but has a high score on the reading achievement test, then his performance is over achieving.
30
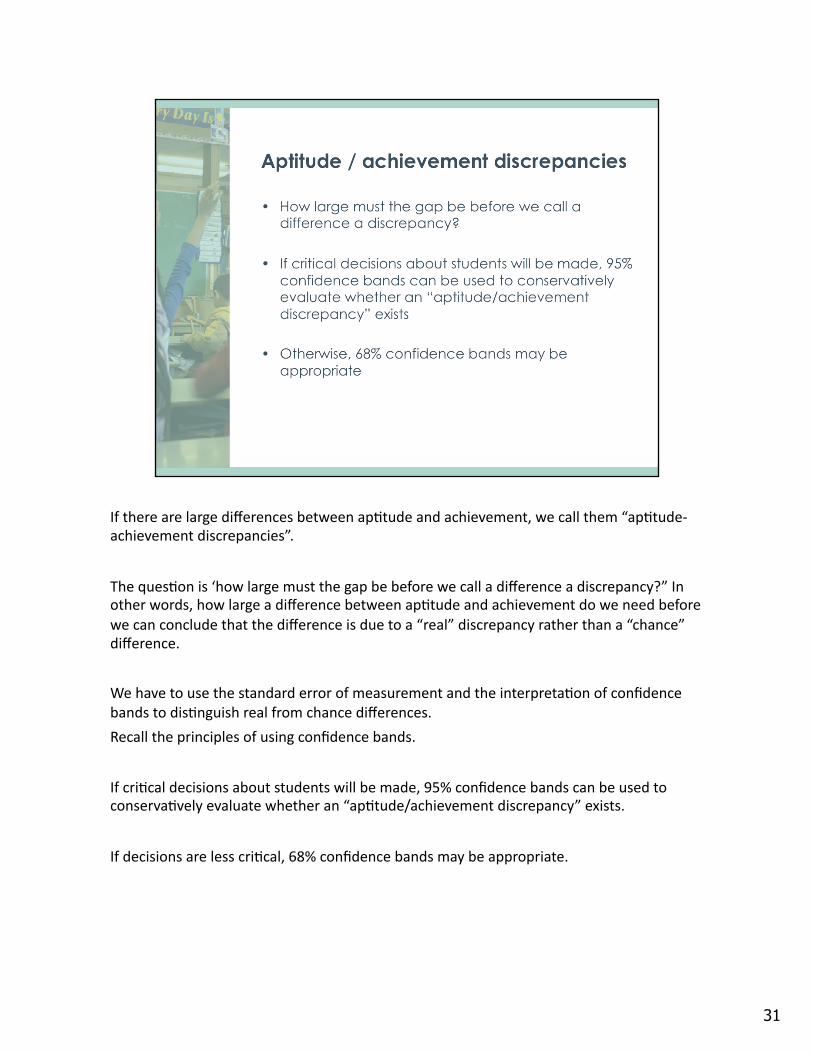
If there are large differences between ap<tude and achievement, we call them “ap<tude-‐achievement discrepancies”.
The ques<on is ‘how large must the gap be before we call a difference a discrepancy?” In other words, how large a difference between ap<tude and achievement do we need before we can conclude that the difference is due to a “real” discrepancy rather than a “chance” difference.
We have to use the standard error of measurement and the interpreta<on of confidence bands to dis<nguish real from chance differences.
Recall the principles of using confidence bands.
If cri<cal decisions about students will be made, 95% confidence bands can be used to conserva<vely evaluate whether an “ap<tude/achievement discrepancy” exists.
If decisions are less cri<cal, 68% confidence bands may be appropriate.
31

Many types of score reports are generated for individuals and groups.
Individual score reports include press-‐on labels, criterion-‐referenced skill analysis, norm-‐referenced score profiles. A press-‐on label is helpful in comparing a student’s performance to that of others na<onwide, and in comparing performance from year to year. But it tells us nothing about specific skills. Refer to Figure 18.10 in 8th edi<on and Figure 19.10 in 9th edi<on.
A criterion referenced skills analysis is a detailed skill mastery report, such as Iowa Test of Basic Skills (or ITBS). Refer to Figure 18.11 in 8th edi<on and Figure 19.11 in 9th edi<on for more informa<on.
Detailed Criterion-‐referenced skills analysis reports may include norm-‐referenced profiles, also called individual performance profiles. Norm-‐referenced profiles such as percen<le ranks for subtest an skills can be ease interpreta<on. Refer to Figure 18.12 in 8th edi<on and Figure 19.12 in 9th edi<on for more informa<on.
Group performance reports include summaries regarding the test scores of skills and content areas for classes, schools, and districts.
32