Module 9: Energy Efficiency in Building Thermal Systems
51
Module 9: Energy Efficiency in Building Electrical Systems Building Energy Auditing Course Page 9.1 Module 9: Energy Efficiency in Building Thermal Systems 9.1 Energy Efficiency in the Building Envelope (Source: Energy Management in Buildings, Module 3, SIEMP) 9.1.1 Heating and Cooling Loads and the Building Envelope The building envelope comprises walls, floors and roof, as well as windows and doors. It is the building envelope that separates the varying conditions outside the building from the conditions inside the building. To do this, the envelope must control the flow of heat energy, air movement, moisture penetration, and solar heat. In addition to protecting the building occupants from the prevailing outdoor elements, the conditions inside the building must be maintained within a range that is conducive to the occupant’s comfort, health and safety. To this end, the building systems must control the space temperature, relative humidity, air movement, air quality, and lighting levels within acceptable limits. To maintain required conditions inside the building space, the building systems must overcome the energy loads that are imposed by the climatic conditions outside the building and also, energy loads that are imposed by factors inside the building itself. The building systems must consume purchased energy, usually electricity but also fossil fuels, to offset these external and internal energy loads. As illustrated in Figure 9.1, the building is subjected to both internal and external energy loads. Three of the external loads—transmission, ventilation and infiltration— are primarily a function of the difference between indoor and outdoor temperature. Since the outdoor temperature will vary, these loads may be either a heat loss (requiring heating energy to compensate) or a heat gain (requiring cooling energy to Learning Objectives After completing this module, you will be able to Assess the heating and cooling load of a building; Identify and assess energy efficiency opportunities for building envelope; HVAC systems including boilers, steam and hot water distribution systems, air distribution systems; and the application of building control systems. Figure 9.1: Typical Energy Loads
Transcript of Module 9: Energy Efficiency in Building Thermal Systems
Module 9: Energy Efficiency in Building Electrical Systems
Building Energy Auditing Course Page 9.1
Module 9: Energy Efficiency in Building Thermal Systems
9.1 Energy Efficiency in the Building Envelope (Source: Energy Management in Buildings, Module 3, SIEMP)
9.1.1 Heating and Cooling Loads and the Building Envelope
The building envelope comprises walls, floors and roof, as well as windows and doors. It is the building envelope that separates the varying conditions outside the building from the conditions inside the building. To do this, the envelope must control the flow of heat energy, air movement, moisture penetration, and solar heat. In addition to protecting the building occupants from the prevailing outdoor elements, the conditions inside the building must be maintained within a range that is conducive to the occupant’s comfort, health and safety. To this end, the building systems must control the space temperature, relative humidity, air movement, air quality, and lighting levels within acceptable limits. To maintain required conditions inside the building space, the building systems must overcome the energy loads that are imposed by the climatic conditions outside the building and also, energy loads that are imposed by factors inside the building itself. The building systems must consume purchased energy, usually electricity but also fossil fuels, to offset these external and internal energy loads.
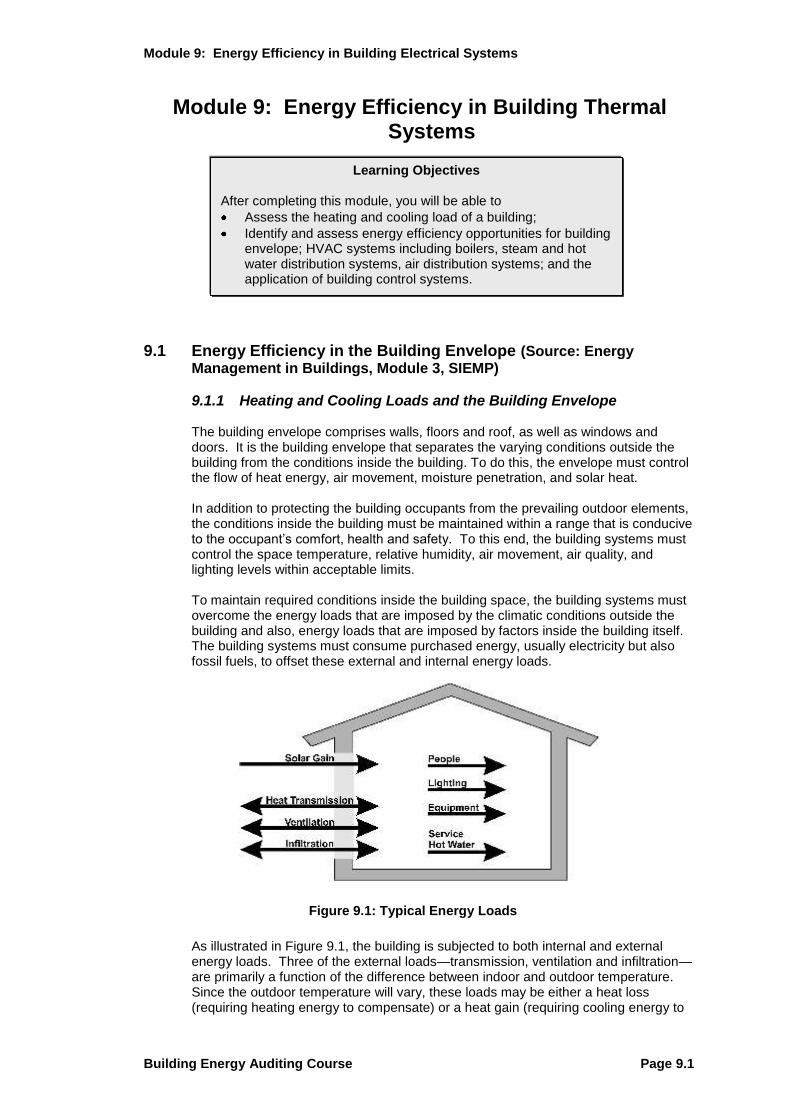
As illustrated in Figure 9.1, the building is subjected to both internal and external energy loads. Three of the external loads—transmission, ventilation and infiltration—are primarily a function of the difference between indoor and outdoor temperature. Since the outdoor temperature will vary, these loads may be either a heat loss (requiring heating energy to compensate) or a heat gain (requiring cooling energy to
Learning Objectives After completing this module, you will be able to
Assess the heating and cooling load of a building;
Identify and assess energy efficiency opportunities for building envelope; HVAC systems including boilers, steam and hot water distribution systems, air distribution systems; and the application of building control systems.
Figure 9.1: Typical Energy Loads
Module 9: Energy Efficiency in Building Thermal Systems
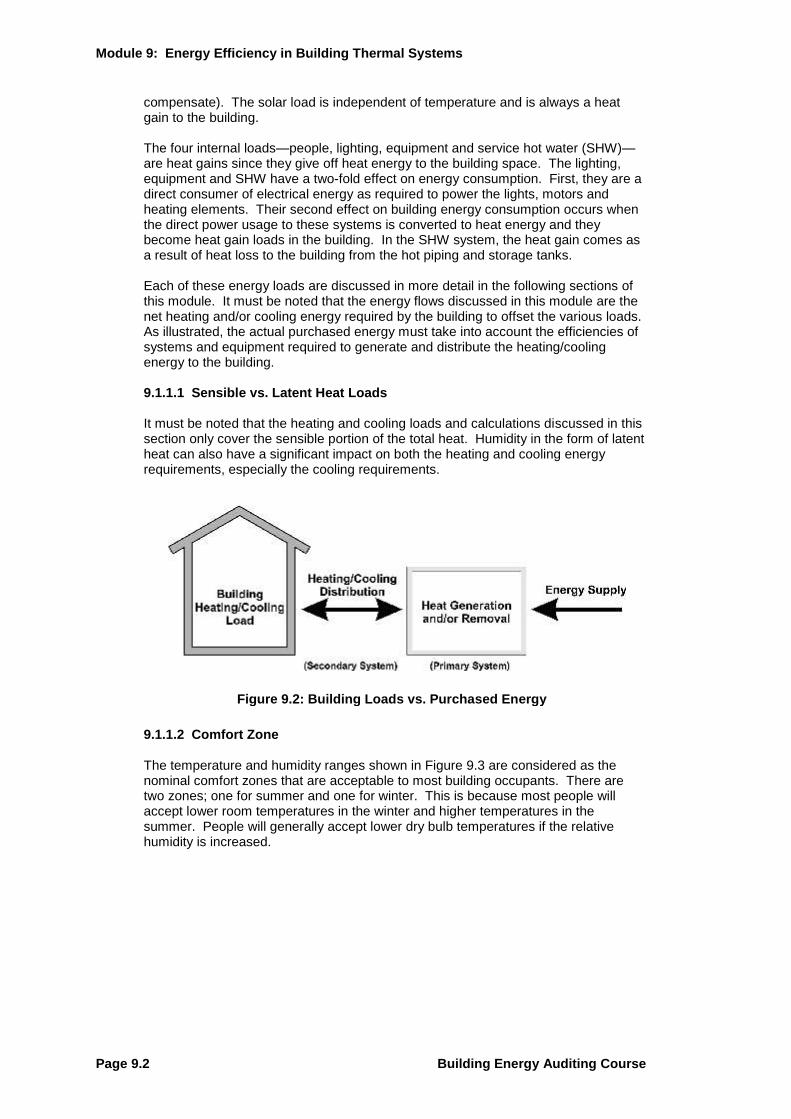
Page 9.2 Building Energy Auditing Course
compensate). The solar load is independent of temperature and is always a heat gain to the building. The four internal loads—people, lighting, equipment and service hot water (SHW)—are heat gains since they give off heat energy to the building space. The lighting, equipment and SHW have a two-fold effect on energy consumption. First, they are a direct consumer of electrical energy as required to power the lights, motors and heating elements. Their second effect on building energy consumption occurs when the direct power usage to these systems is converted to heat energy and they become heat gain loads in the building. In the SHW system, the heat gain comes as a result of heat loss to the building from the hot piping and storage tanks. Each of these energy loads are discussed in more detail in the following sections of this module. It must be noted that the energy flows discussed in this module are the net heating and/or cooling energy required by the building to offset the various loads. As illustrated, the actual purchased energy must take into account the efficiencies of systems and equipment required to generate and distribute the heating/cooling energy to the building. 9.1.1.1 Sensible vs. Latent Heat Loads It must be noted that the heating and cooling loads and calculations discussed in this section only cover the sensible portion of the total heat. Humidity in the form of latent heat can also have a significant impact on both the heating and cooling energy requirements, especially the cooling requirements.
9.1.1.2 Comfort Zone The temperature and humidity ranges shown in Figure 9.3 are considered as the nominal comfort zones that are acceptable to most building occupants. There are two zones; one for summer and one for winter. This is because most people will accept lower room temperatures in the winter and higher temperatures in the summer. People will generally accept lower dry bulb temperatures if the relative humidity is increased.
Figure 9.2: Building Loads vs. Purchased Energy

Module 9: Energy Efficiency in Building Electrical Systems
Building Energy Auditing Course Page 9.3
9.1.2 Heat Transmission
The transmission of heat energy through the solid components of the building envelope is caused by the difference in temperature between the indoor and outdoor temperatures. The materials used in the building envelope can have a significant impact on the amount of energy required to maintain a suitable environment within the building space. Building walls composed primarily of glass and steel are a major source of heat loss in the winter and heat gain in the summer. Walls consisting of masonry, insulation and cladding, have substantially more thickness and much higher insulating capabilities.
9.1.2.1 Heat Losses and Heat Gains Materials of different properties have different thermal conductivities of energy, and are compared on the basis of U-values and R-values. The thermal transmittance (U-value) identifies the ability of a material to conduct thermal energy. For example, aluminium has a higher U-value than wood and, therefore, a greater thermal conductivity capability. Rigid insulation has a higher R-value than glass and, therefore, a greater thermal resistance or insulating capability. U-values and R-values are used in heat loss and heat gain calculations. The R-value is the corresponding rate of thermal resistance.
Heat Loss Heat loss through the building envelope during winter months occurs by heat transmission through the building envelope (ventilation and infiltration loads also
Figure 9.3: Comfort Zone
Module 9: Energy Efficiency in Building Thermal Systems
Page 9.4 Building Energy Auditing Course
cause heat loss but are discussed in following sections of this chapter). Heating energy is required to compensate for this loss. Other heat sources are often present to reduce the overall heating energy. Heat gains from people, lighting and process equipment often make a significant contribution. As we saw in Module 2, heat transmission through the building envelope occurs in three ways: ! Conduction is the heat flow through a solid material from the warmer to the
cooler side of the envelope. This occurs through walls, roof/ceiling and floor slabs.
! Convection is the heat transfer caused by the motion of heated air from a
warmer to a cooler surface. This occurs around windows and doors. ! Radiation is the transfer of heat by electromagnetic waves from a warmer to
a cooler surface. It is transferred directly and is not affected by the temperature of the surrounding air.
Heat Gain Energy for cooling is required because of heat gain. Significant gain occurs from the transmission of energy through the building envelope and from internal building processes (e.g. equipment, lighting and body heat loss). These gains, which may occur throughout the year, are discussed in following sections of this chapter. The objective of energy management is to save energy cost by reducing the energy required for cooling, while maintaining an environment suitable for both processes and occupants.
9.1.2.2 Transmission Loss/Gain Calculations
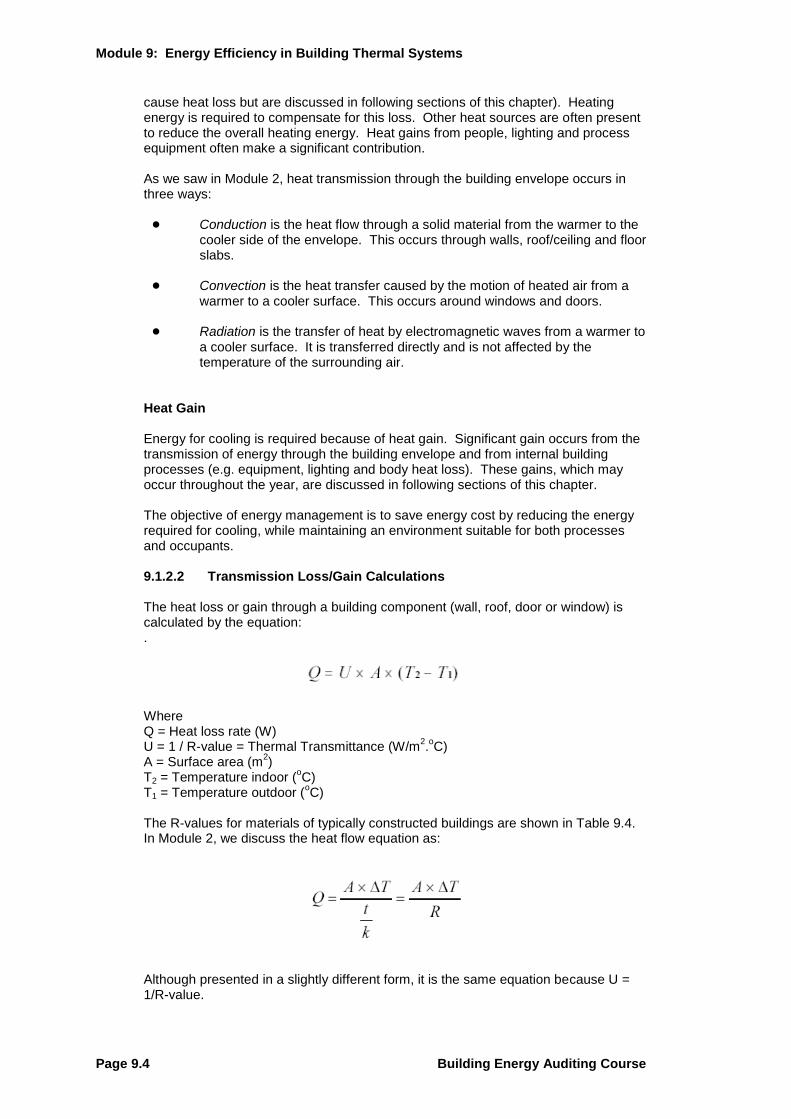
The heat loss or gain through a building component (wall, roof, door or window) is calculated by the equation: .
Where Q = Heat loss rate (W) U = 1 / R-value = Thermal Transmittance (W/m
2.oC)
A = Surface area (m2)
T2 = Temperature indoor (oC)
T1 = Temperature outdoor (oC)
The R-values for materials of typically constructed buildings are shown in Table 9.4. In Module 2, we discuss the heat flow equation as:
Although presented in a slightly different form, it is the same equation because U = 1/R-value.
Module 9: Energy Efficiency in Building Electrical Systems
Building Energy Auditing Course Page 9.5
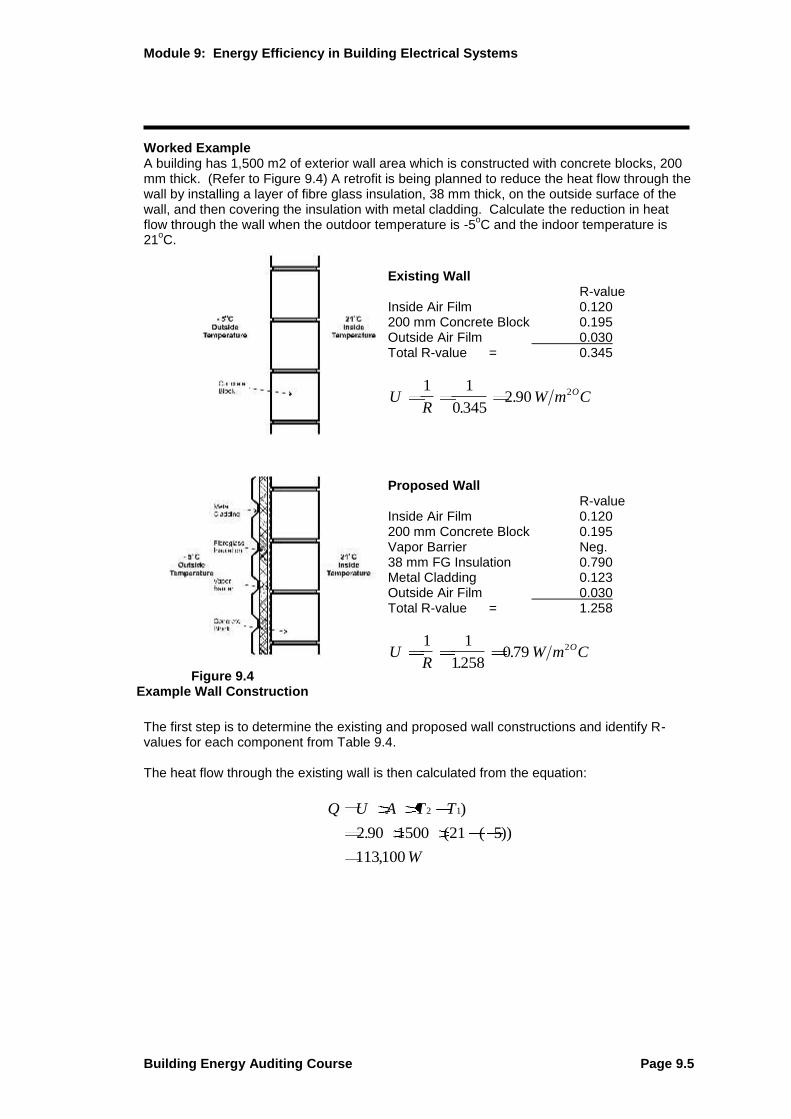
Worked Example A building has 1,500 m2 of exterior wall area which is constructed with concrete blocks, 200 mm thick. (Refer to Figure 9.4) A retrofit is being planned to reduce the heat flow through the wall by installing a layer of fibre glass insulation, 38 mm thick, on the outside surface of the wall, and then covering the insulation with metal cladding. Calculate the reduction in heat flow through the wall when the outdoor temperature is -5
oC and the indoor temperature is
21oC.
The first step is to determine the existing and proposed wall constructions and identify R-values for each component from Table 9.4.
The heat flow through the existing wall is then calculated from the equation:
Q U A T T
W
2 1
2 90 1500 21 5
113100
)
. ( ( ))
,
Figure 9.4 Example Wall Construction
Existing Wall R-value
Inside Air Film 0.120 200 mm Concrete Block 0.195 Outside Air Film 0.030 Total R-value = 0.345
UR
W m CO1 1
0 3452 90 2
..
Proposed Wall R-value Inside Air Film 0.120 200 mm Concrete Block 0.195 Vapor Barrier Neg. 38 mm FG Insulation 0.790 Metal Cladding 0.123 Outside Air Film 0.030 Total R-value = 1.258
UR
W m CO1 1
12580 79 2
..
Q U A T T
W
2 1
2 90 1500 21 5
113100
)
. ( ( ))
,
Module 9: Energy Efficiency in Building Thermal Systems
Page 9.6 Building Energy Auditing Course
The heat flow through the proposed wall is then calculated in the same way:
The reduction in heat flow obtained by this wall improvement will be:
113,100 W – 30,810 W = 82,290 W Note that this value is an energy flow, and not an energy consumption that occurs over a period of time (Wh or kWh). Furthermore, this heat flow is for a specific temperature difference between the indoor and outdoor conditions.
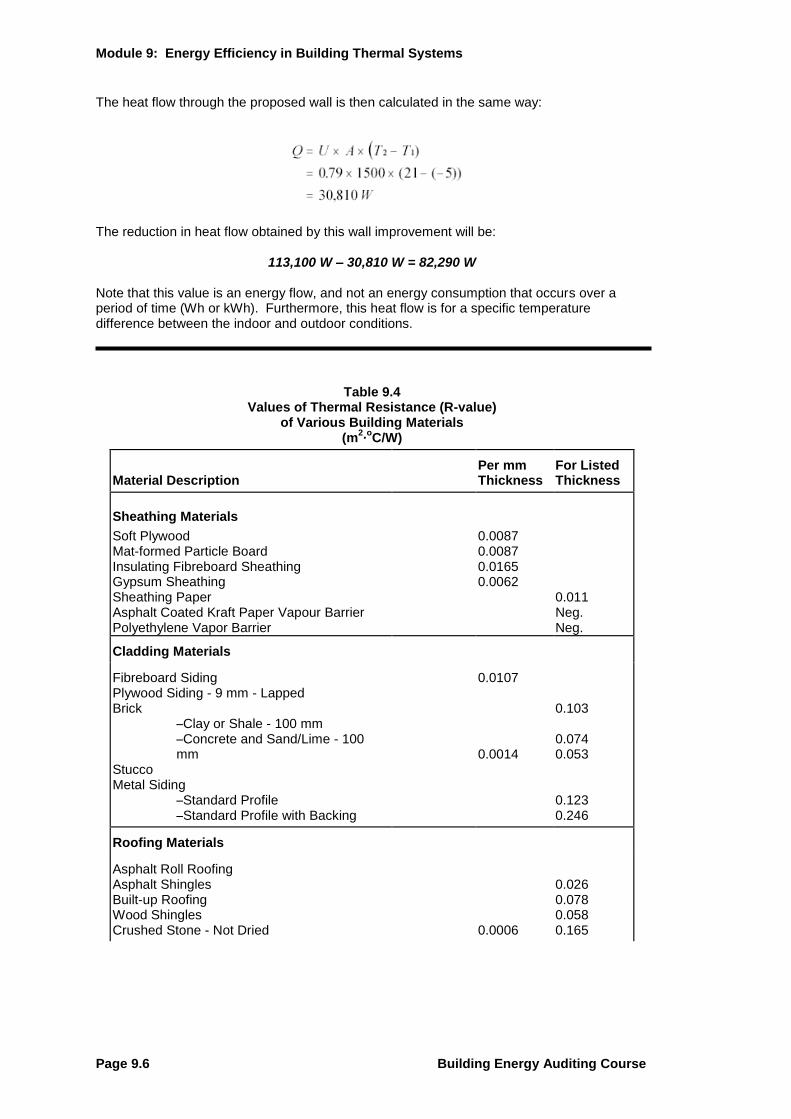
Table 9.4 Values of Thermal Resistance (R-value)
of Various Building Materials (m
2·oC/W)
Material Description Per mm Thickness
For Listed Thickness
Sheathing Materials
Soft Plywood Mat-formed Particle Board Insulating Fibreboard Sheathing Gypsum Sheathing Sheathing Paper Asphalt Coated Kraft Paper Vapour Barrier Polyethylene Vapor Barrier
0.0087 0.0087 0.0165 0.0062
0.011 Neg. Neg.
Cladding Materials
Fibreboard Siding Plywood Siding - 9 mm - Lapped Brick
SClay or Shale - 100 mm SConcrete and Sand/Lime - 100 mm
Stucco Metal Siding
SStandard Profile SStandard Profile with Backing
0.0107 0.0014
0.103 0.074 0.053 0.123 0.246
Roofing Materials
Asphalt Roll Roofing Asphalt Shingles Built-up Roofing Wood Shingles Crushed Stone - Not Dried
0.0006
0.026 0.078 0.058 0.165
Module 9: Energy Efficiency in Building Electrical Systems
Building Energy Auditing Course Page 9.7
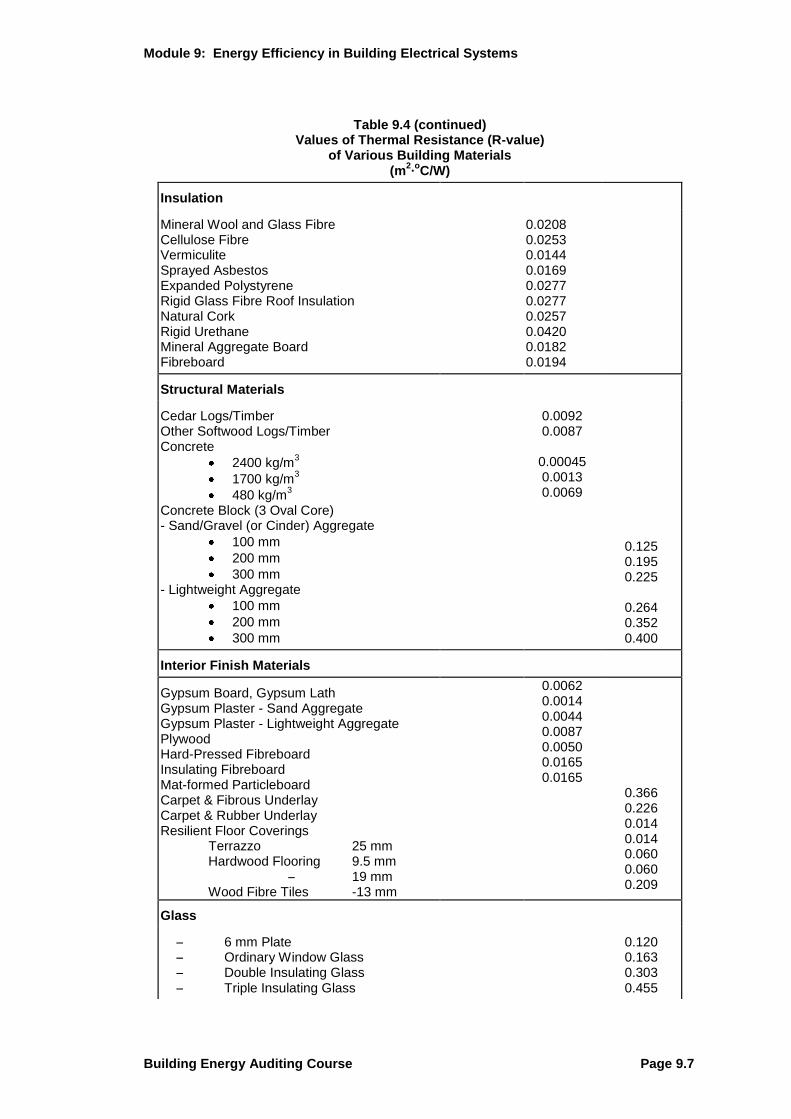
Table 9.4 (continued) Values of Thermal Resistance (R-value)
of Various Building Materials (m
2·oC/W)
Insulation
Mineral Wool and Glass Fibre Cellulose Fibre Vermiculite Sprayed Asbestos Expanded Polystyrene Rigid Glass Fibre Roof Insulation Natural Cork Rigid Urethane Mineral Aggregate Board Fibreboard
0.0208 0.0253 0.0144 0.0169 0.0277 0.0277 0.0257 0.0420 0.0182 0.0194
Structural Materials
Cedar Logs/Timber Other Softwood Logs/Timber Concrete
2400 kg/m3
1700 kg/m3
480 kg/m3
Concrete Block (3 Oval Core) - Sand/Gravel (or Cinder) Aggregate
100 mm
200 mm
300 mm - Lightweight Aggregate
100 mm
200 mm
300 mm
0.0092 0.0087
0.00045 0.0013 0.0069
0.125 0.195 0.225
0.264 0.352 0.400
Interior Finish Materials
Gypsum Board, Gypsum Lath Gypsum Plaster - Sand Aggregate Gypsum Plaster - Lightweight Aggregate Plywood Hard-Pressed Fibreboard Insulating Fibreboard Mat-formed Particleboard Carpet & Fibrous Underlay Carpet & Rubber Underlay Resilient Floor Coverings
Terrazzo 25 mm Hardwood Flooring 9.5 mm
S 19 mm Wood Fibre Tiles -13 mm
0.0062 0.0014 0.0044 0.0087 0.0050 0.0165 0.0165
0.366 0.226 0.014 0.014 0.060 0.060 0.209
Glass
S 6 mm Plate S Ordinary Window Glass S Double Insulating Glass S Triple Insulating Glass
0.120 0.163 0.303 0.455
Module 9: Energy Efficiency in Building Thermal Systems
Page 9.8 Building Energy Auditing Course
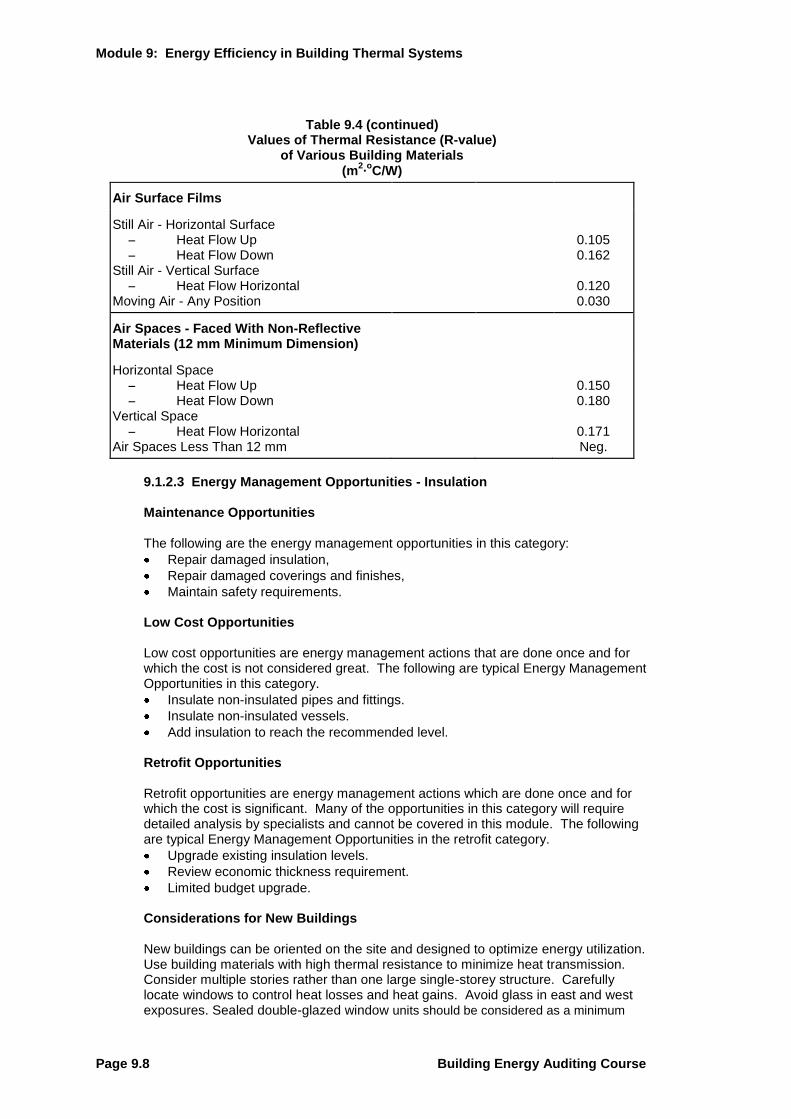
Table 9.4 (continued) Values of Thermal Resistance (R-value)
of Various Building Materials (m
2·oC/W)
Air Surface Films
Still Air - Horizontal Surface S Heat Flow Up S Heat Flow Down
Still Air - Vertical Surface S Heat Flow Horizontal
Moving Air - Any Position
0.105 0.162
0.120 0.030
Air Spaces - Faced With Non-Reflective Materials (12 mm Minimum Dimension)
Horizontal Space S Heat Flow Up S Heat Flow Down
Vertical Space S Heat Flow Horizontal
Air Spaces Less Than 12 mm
0.150 0.180
0.171 Neg.
9.1.2.3 Energy Management Opportunities - Insulation
Maintenance Opportunities
The following are the energy management opportunities in this category:
Repair damaged insulation,
Repair damaged coverings and finishes,
Maintain safety requirements.
Low Cost Opportunities
Low cost opportunities are energy management actions that are done once and for which the cost is not considered great. The following are typical Energy Management Opportunities in this category.
Insulate non-insulated pipes and fittings.
Insulate non-insulated vessels.
Add insulation to reach the recommended level.
Retrofit Opportunities
Retrofit opportunities are energy management actions which are done once and for which the cost is significant. Many of the opportunities in this category will require detailed analysis by specialists and cannot be covered in this module. The following are typical Energy Management Opportunities in the retrofit category.
Upgrade existing insulation levels.
Review economic thickness requirement.
Limited budget upgrade.
Considerations for New Buildings New buildings can be oriented on the site and designed to optimize energy utilization. Use building materials with high thermal resistance to minimize heat transmission. Consider multiple stories rather than one large single-storey structure. Carefully locate windows to control heat losses and heat gains. Avoid glass in east and west exposures. Sealed double-glazed window units should be considered as a minimum
Module 9: Energy Efficiency in Building Electrical Systems
Building Energy Auditing Course Page 9.9
design criteria for most locations. Consider shading devices. Locate people away from exterior doors. Place corridors along outside walls that are cool in winter and warm in summer.
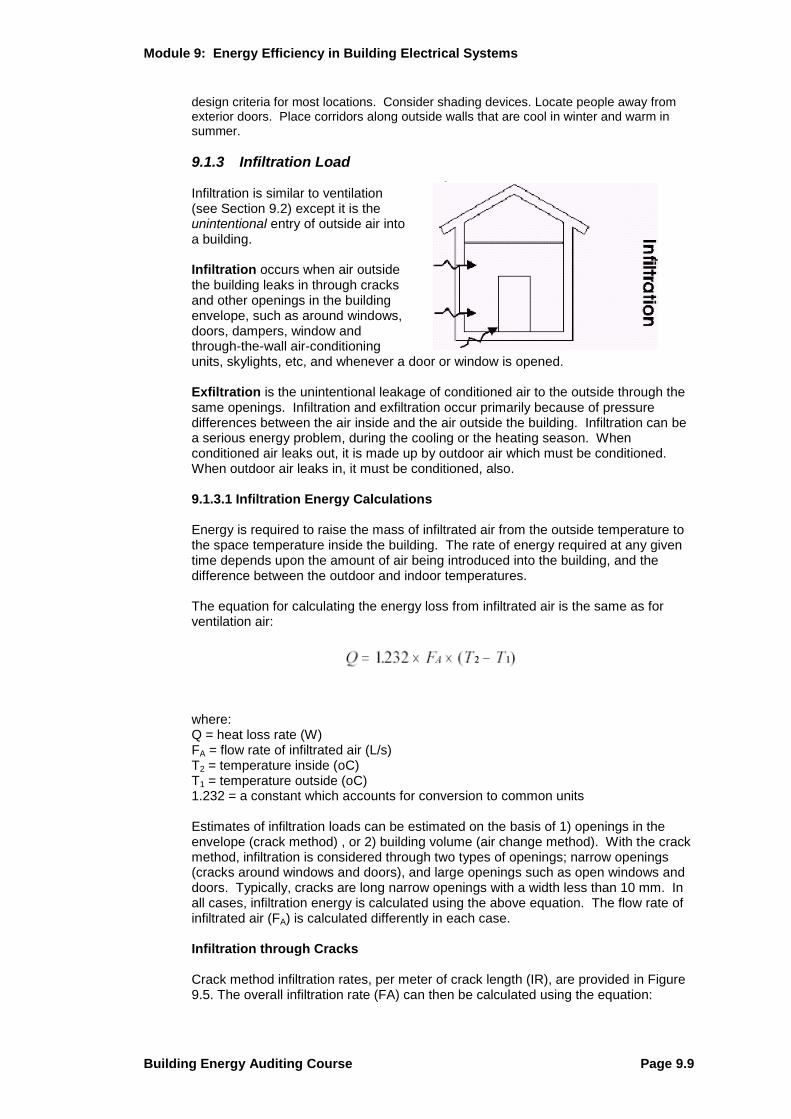
9.1.3 Infiltration Load Infiltration is similar to ventilation (see Section 9.2) except it is the unintentional entry of outside air into a building. Infiltration occurs when air outside the building leaks in through cracks and other openings in the building envelope, such as around windows, doors, dampers, window and through-the-wall air-conditioning units, skylights, etc, and whenever a door or window is opened. Exfiltration is the unintentional leakage of conditioned air to the outside through the same openings. Infiltration and exfiltration occur primarily because of pressure differences between the air inside and the air outside the building. Infiltration can be a serious energy problem, during the cooling or the heating season. When conditioned air leaks out, it is made up by outdoor air which must be conditioned. When outdoor air leaks in, it must be conditioned, also. 9.1.3.1 Infiltration Energy Calculations Energy is required to raise the mass of infiltrated air from the outside temperature to the space temperature inside the building. The rate of energy required at any given time depends upon the amount of air being introduced into the building, and the difference between the outdoor and indoor temperatures. The equation for calculating the energy loss from infiltrated air is the same as for ventilation air:
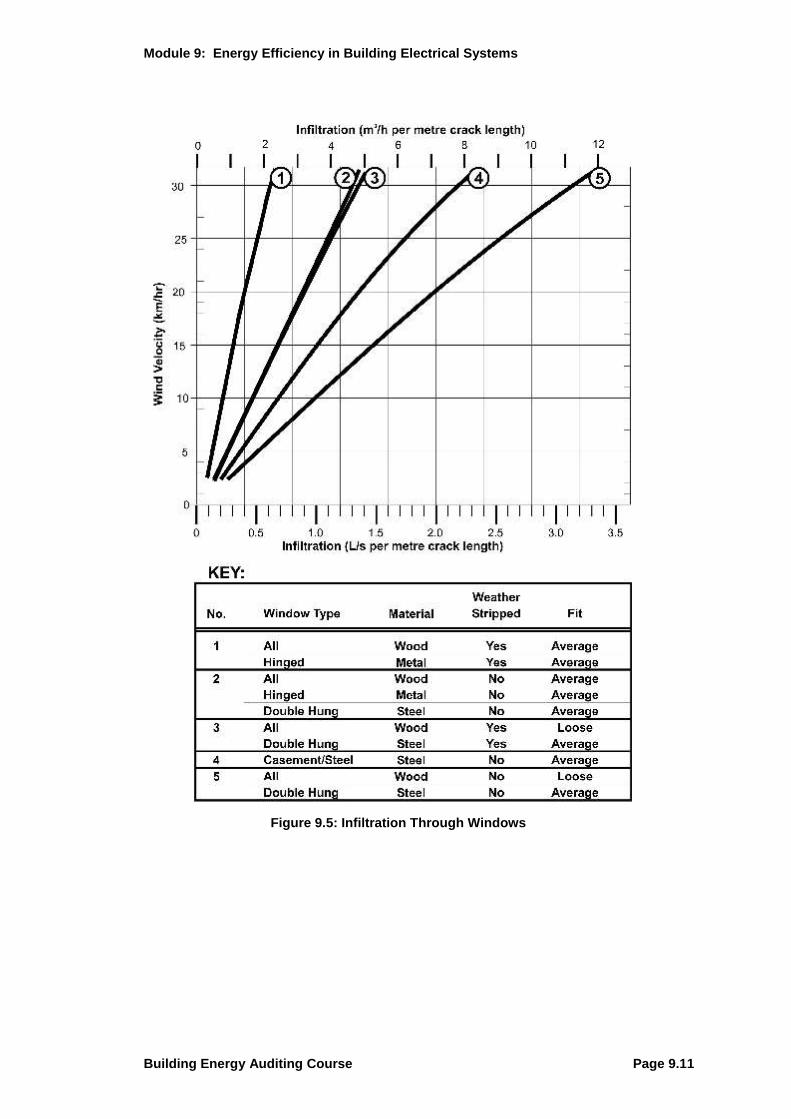
where: Q = heat loss rate (W) FA = flow rate of infiltrated air (L/s) T2 = temperature inside (oC) T1 = temperature outside (oC) 1.232 = a constant which accounts for conversion to common units Estimates of infiltration loads can be estimated on the basis of 1) openings in the envelope (crack method) , or 2) building volume (air change method). With the crack method, infiltration is considered through two types of openings; narrow openings (cracks around windows and doors), and large openings such as open windows and doors. Typically, cracks are long narrow openings with a width less than 10 mm. In all cases, infiltration energy is calculated using the above equation. The flow rate of infiltrated air (FA) is calculated differently in each case. Infiltration through Cracks Crack method infiltration rates, per meter of crack length (IR), are provided in Figure 9.5. The overall infiltration rate (FA) can then be calculated using the equation:
Module 9: Energy Efficiency in Building Thermal Systems
Page 9.10 Building Energy Auditing Course
where: FA = Flow rate of infiltrated air (L/s) IR = Rate of infiltration (L/s.m) L = Length of crack (m)
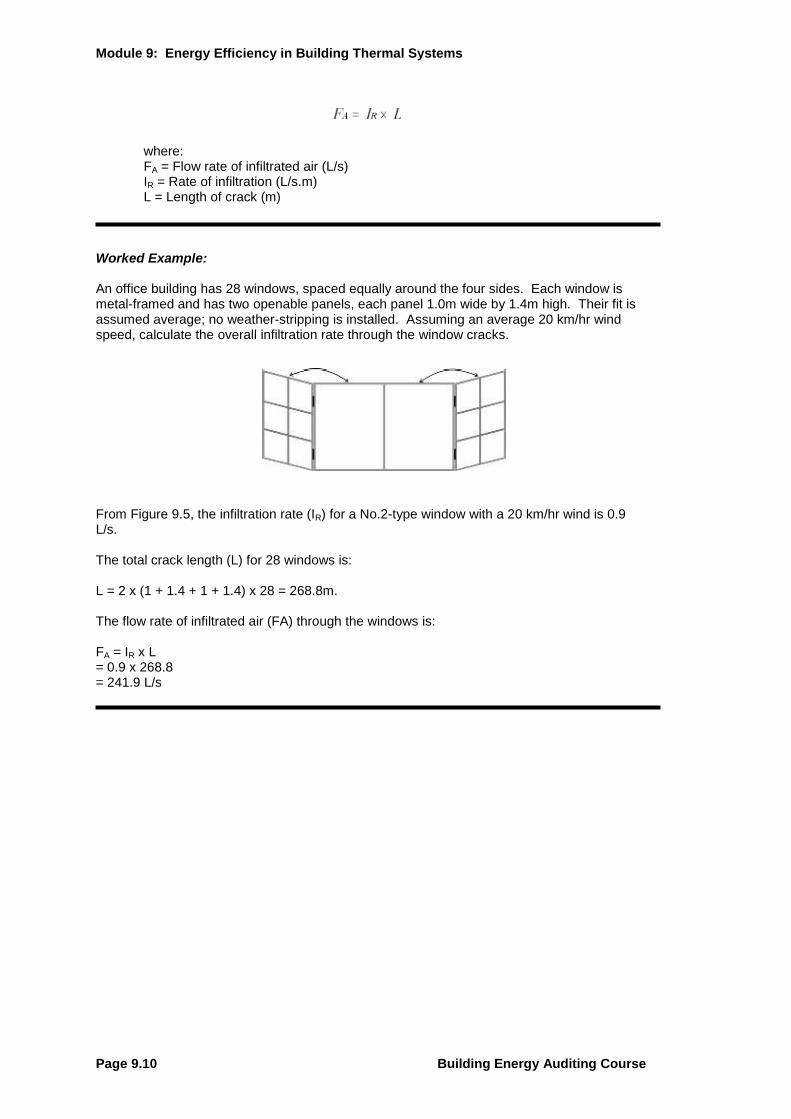
Worked Example: An office building has 28 windows, spaced equally around the four sides. Each window is metal-framed and has two openable panels, each panel 1.0m wide by 1.4m high. Their fit is assumed average; no weather-stripping is installed. Assuming an average 20 km/hr wind speed, calculate the overall infiltration rate through the window cracks.
From Figure 9.5, the infiltration rate (IR) for a No.2-type window with a 20 km/hr wind is 0.9 L/s. The total crack length (L) for 28 windows is: L = 2 x (1 + 1.4 + 1 + 1.4) x 28 = 268.8m. The flow rate of infiltrated air (FA) through the windows is: FA = IR x L = 0.9 x 268.8 = 241.9 L/s
Module 9: Energy Efficiency in Building Electrical Systems
Building Energy Auditing Course Page 9.11
Figure 9.5: Infiltration Through Windows
Module 9: Energy Efficiency in Building Thermal Systems
Page 9.12 Building Energy Auditing Course
Infiltration Through Large Openings The infiltration (FA) resulting from wind blowing through a large opening is calculated by the following equation:
FA = E0 x A x V/2 x 1000 where: FA = Infiltration rate (L/s) EO = Effectiveness of opening expressed as a unitless factor (0.60 maximum for perpendicular winds, and 0.25 minimum for diagonal winds. (Assume an average value of 0.40 for worked examples) A = Area of opening (m
2)
V = Average seasonal wind velocity (m/s). The velocity is divided by two to account for the actual effect of the wind on infiltration. When the velocity is unknown, assume a value of 1.7 m/s (6 km/hr). The equation then becomes:
FA = E0 x A x V/2 x 1000 = 0.4 x A x 1.7 x 1000 = 680 x A The interval the door is open must also be considered when calculating annual energy loss. The ―fraction of operational time‖ (OT) can be calculated as:
OT = t/168 where: OT = fraction of operational time expressed as a decimal 168 = total hours available per week t = length of time door or area is open per week (hrs)
Worked Example An overhead door, 3m x 4m, is open 4 hours/day, 5 days/week. Calculate the overall infiltration rate for the door.
Infiltration by Air Change Method With the air change method, the first step is to calculate the room volume, or the effective room volume if the room is more than 5 metres in depth. The next step is to select the appropriate air change value from Table 9.5, based on the room exposure. The infiltration air flow is then calculated as follows:
where: FA = flow rate of infiltrated air (L/s) V = room volume (m3) AC = air changes per hour (no units)
FA At
680168
680 4 34 5
168
971
( )( )
.4 L s
FV AC
A
36.
Module 9: Energy Efficiency in Building Electrical Systems
Building Energy Auditing Course Page 9.13
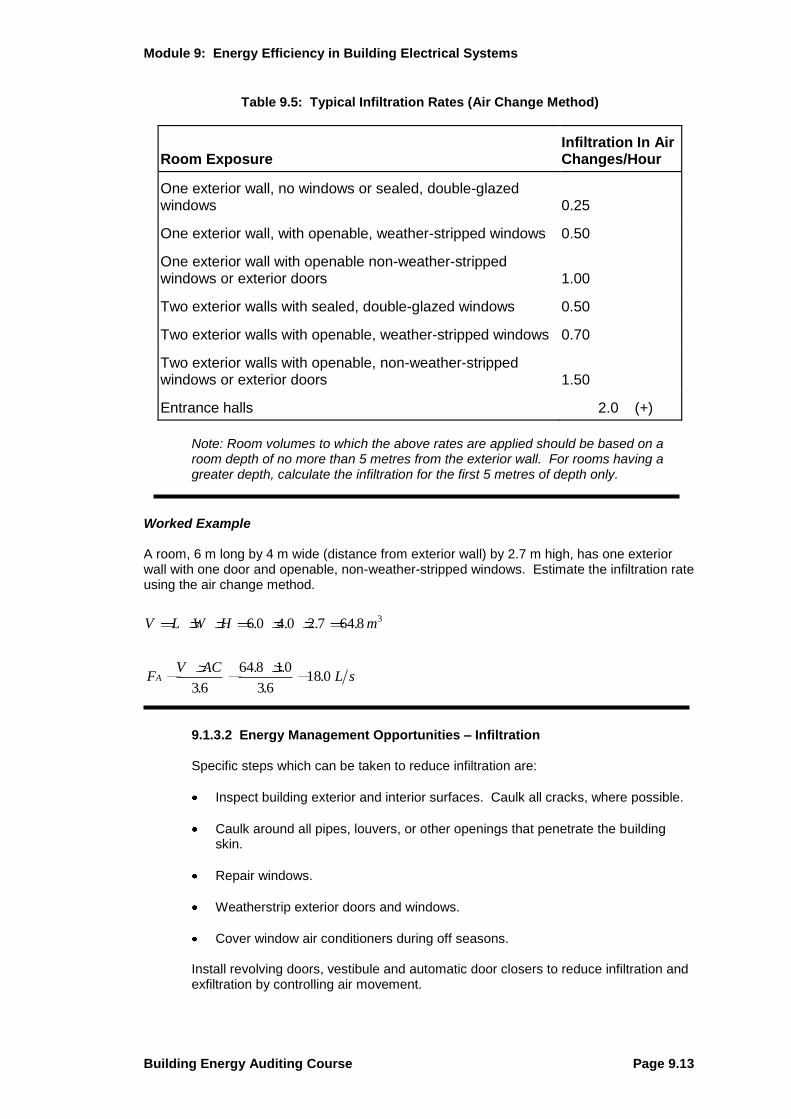
Table 9.5: Typical Infiltration Rates (Air Change Method)
Room Exposure Infiltration In Air Changes/Hour
One exterior wall, no windows or sealed, double-glazed windows 0.25
One exterior wall, with openable, weather-stripped windows 0.50
One exterior wall with openable non-weather-stripped windows or exterior doors 1.00
Two exterior walls with sealed, double-glazed windows 0.50
Two exterior walls with openable, weather-stripped windows 0.70
Two exterior walls with openable, non-weather-stripped windows or exterior doors 1.50
Entrance halls 2.0 (+)
Note: Room volumes to which the above rates are applied should be based on a room depth of no more than 5 metres from the exterior wall. For rooms having a greater depth, calculate the infiltration for the first 5 metres of depth only.
Worked Example A room, 6 m long by 4 m wide (distance from exterior wall) by 2.7 m high, has one exterior wall with one door and openable, non-weather-stripped windows. Estimate the infiltration rate using the air change method.
9.1.3.2 Energy Management Opportunities – Infiltration Specific steps which can be taken to reduce infiltration are:
Inspect building exterior and interior surfaces. Caulk all cracks, where possible.
Caulk around all pipes, louvers, or other openings that penetrate the building skin.
Repair windows.
Weatherstrip exterior doors and windows.
Cover window air conditioners during off seasons. Install revolving doors, vestibule and automatic door closers to reduce infiltration and exfiltration by controlling air movement.
V L W H m
FV AC
L sA
6 0 4 0 2 7 64 8
36
64 8 10
3618 0
3. . . .
.
. .
..
Module 9: Energy Efficiency in Building Thermal Systems
Page 9.14 Building Energy Auditing Course
9.1.4 Radiative (Solar) Heat Load The sun radiates energy known as solar heat. The solar heat is approximately 1,370 W/m
2 at the outside edge of the
earth’s atmosphere, but much less at the earth’s surface because a large part of this energy is scattered, reflected back into space, or absorbed by the atmosphere. The scattered, or diffuse radiation is nothing more than the reflection from dust particles, water vapour and ozone in the atmosphere. The solar heat that comes directly through the atmosphere is called direct radiation. Heat energy is supplied to a building when the solar radiation enters the enclosure through windows or other glass openings. The solar heat gain that enters a building through ordinary glass depends upon:
its location on the earth’s surface (latitude),
time of day,
time of year,
facing direction of the window glass. Direct radiation occurs only when the window is in the direct rays of the sun. The diffuse radiation component results in heat gain to the building space even when the window is not facing the sun. Ordinary single-thickness glass absorbs approximately 6% of the solar heat and the remainder is either reflected or transmitted. The amount that is reflected or transmitted depends upon the angle of incidence, which is the angle between the perpendicular to the window and the sun’s rays. At low angles of incidence, about 86% of the solar heat is transmitted. Less heat is transmitted as the angle increases. For example, when the angle of incidence is 80 only 42% of the solar heat is
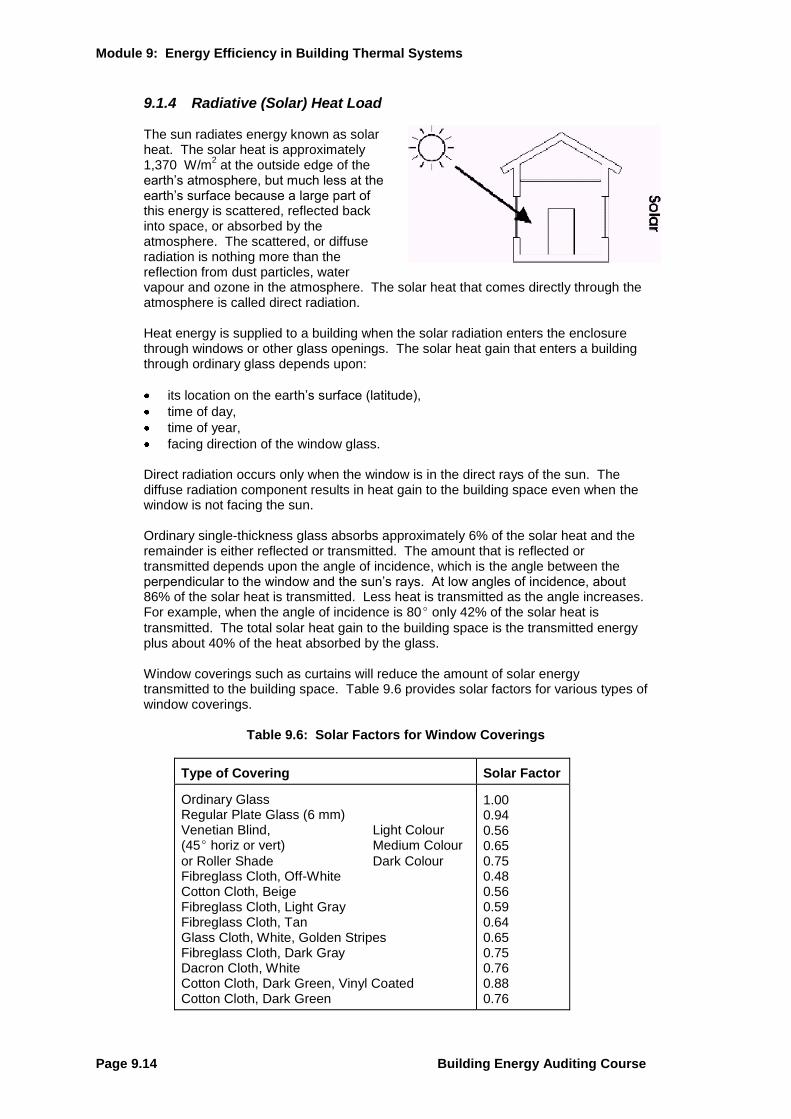
transmitted. The total solar heat gain to the building space is the transmitted energy plus about 40% of the heat absorbed by the glass. Window coverings such as curtains will reduce the amount of solar energy transmitted to the building space. Table 9.6 provides solar factors for various types of window coverings.
Table 9.6: Solar Factors for Window Coverings
Type of Covering Solar Factor
Ordinary Glass Regular Plate Glass (6 mm) Venetian Blind, Light Colour (45 horiz or vert) Medium Colour
or Roller Shade Dark Colour Fibreglass Cloth, Off-White Cotton Cloth, Beige Fibreglass Cloth, Light Gray Fibreglass Cloth, Tan Glass Cloth, White, Golden Stripes Fibreglass Cloth, Dark Gray Dacron Cloth, White Cotton Cloth, Dark Green, Vinyl Coated Cotton Cloth, Dark Green
1.00 0.94 0.56 0.65 0.75 0.48 0.56 0.59 0.64 0.65 0.75 0.76 0.88 0.76
Module 9: Energy Efficiency in Building Electrical Systems
Building Energy Auditing Course Page 9.15
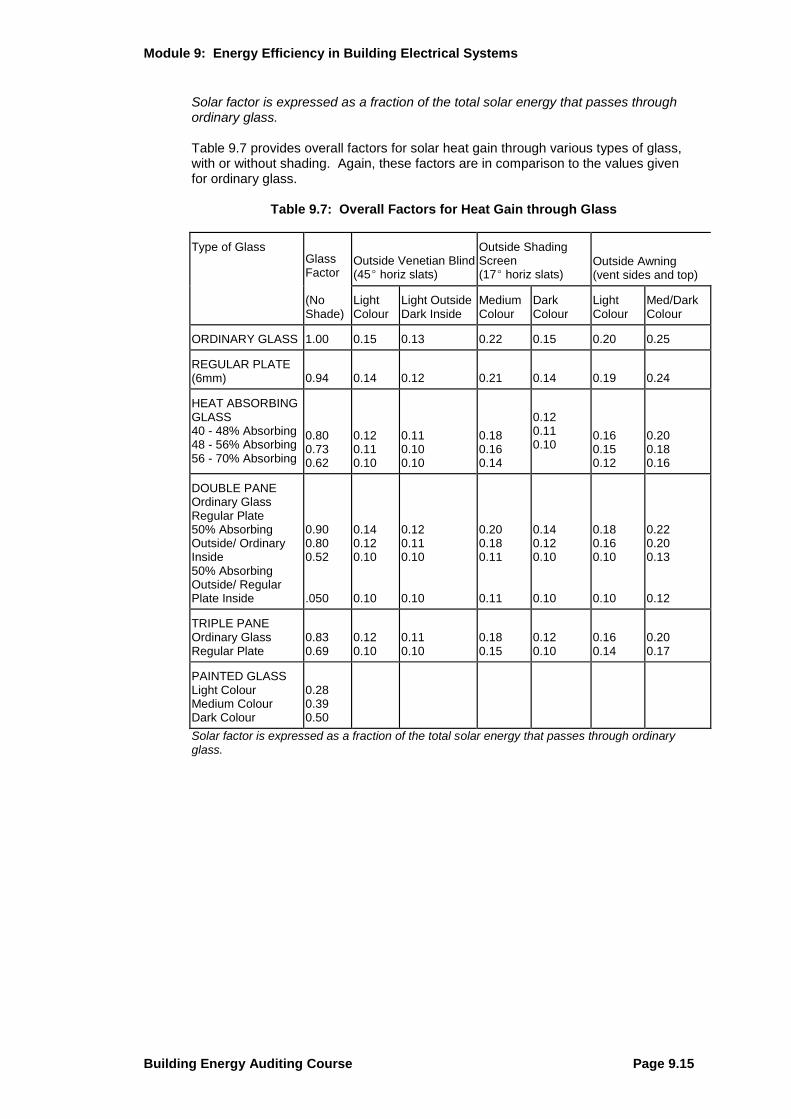
Solar factor is expressed as a fraction of the total solar energy that passes through ordinary glass. Table 9.7 provides overall factors for solar heat gain through various types of glass, with or without shading. Again, these factors are in comparison to the values given for ordinary glass.
Table 9.7: Overall Factors for Heat Gain through Glass
Type of Glass Glass Factor (No Shade)
Outside Venetian Blind (45 horiz slats)
Outside Shading Screen (17 horiz slats)
Outside Awning (vent sides and top)
Light Colour
Light Outside Dark Inside
Medium Colour
Dark Colour
Light Colour
Med/Dark Colour
ORDINARY GLASS 1.00 0.15 0.13 0.22 0.15 0.20 0.25
REGULAR PLATE (6mm) 0.94 0.14 0.12 0.21 0.14 0.19 0.24
HEAT ABSORBING GLASS 40 - 48% Absorbing 48 - 56% Absorbing 56 - 70% Absorbing
0.80 0.73 0.62
0.12 0.11 0.10
0.11 0.10 0.10
0.18 0.16 0.14
0.12 0.11 0.10
0.16 0.15 0.12
0.20 0.18 0.16
DOUBLE PANE Ordinary Glass Regular Plate 50% Absorbing Outside/ Ordinary Inside 50% Absorbing Outside/ Regular Plate Inside
0.90 0.80 0.52 .050
0.14 0.12 0.10 0.10
0.12 0.11 0.10 0.10
0.20 0.18 0.11 0.11
0.14 0.12 0.10 0.10
0.18 0.16 0.10 0.10
0.22 0.20 0.13 0.12
TRIPLE PANE Ordinary Glass Regular Plate
0.83 0.69
0.12 0.10
0.11 0.10
0.18 0.15
0.12 0.10
0.16 0.14
0.20 0.17
PAINTED GLASS Light Colour Medium Colour Dark Colour
0.28 0.39 0.50
Solar factor is expressed as a fraction of the total solar energy that passes through ordinary glass.
Module 9: Energy Efficiency in Building Thermal Systems
Page 9.16 Building Energy Auditing Course
9.1.4.1 Energy Management Opportunities – Radiative Load Solar heat gain introduces heat energy to the building space. During warm periods when air conditioning is required to maintain an acceptable temperature within the building, the introduction of solar heat provides an additional cooling load which must be removed from the building. Thus, a reduction in solar heat gain will reduce the building’s energy usage.
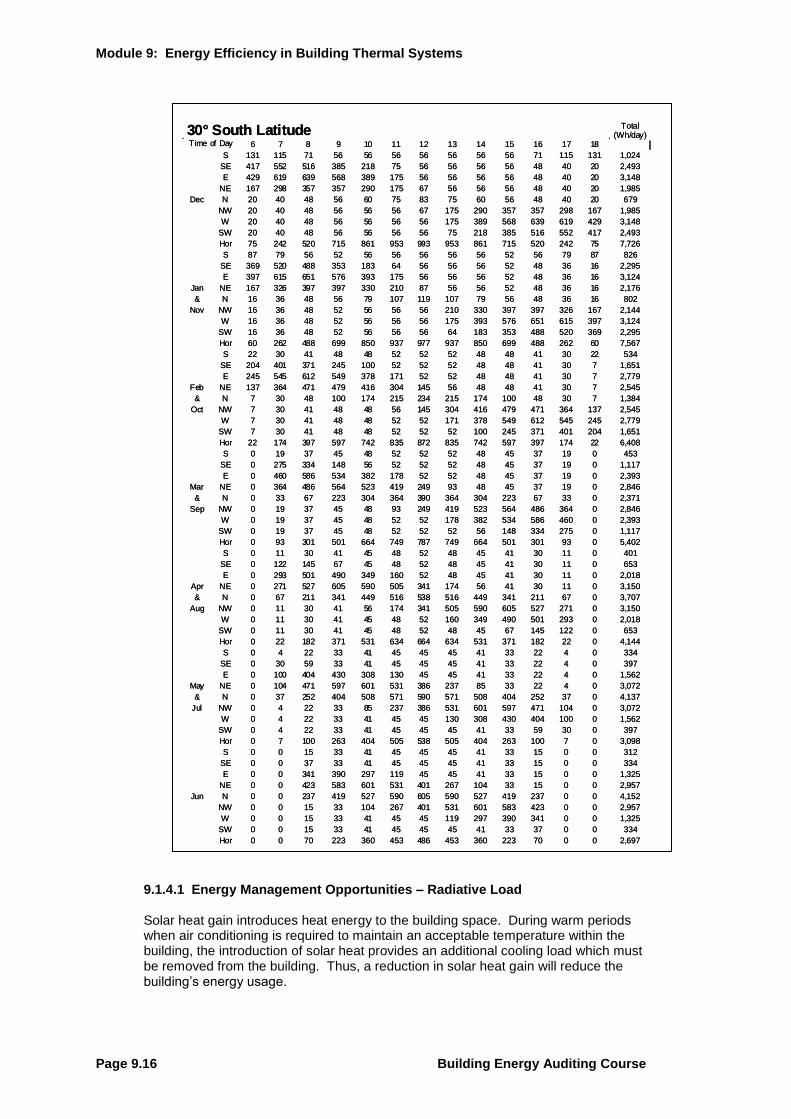
Figure 3.11: Solar Heat Gain (W/m2)
30° South Latitude Total(Wh/day)
Time of Day 6 7 8 9 10 11 12 13 14 15 16 17 18
S 131 115 71 56 56 56 56 56 56 56 71 115 131 1,024
SE 417 552 516 385 218 75 56 56 56 56 48 40 20 2,493
E 429 619 639 568 389 175 56 56 56 56 48 40 20 3,148
NE 167 298 357 357 290 175 67 56 56 56 48 40 20 1,985
Dec N 20 40 48 56 60 75 83 75 60 56 48 40 20 679
NW 20 40 48 56 56 56 67 175 290 357 357 298 167 1,985
W 20 40 48 56 56 56 56 175 389 568 639 619 429 3,148
SW 20 40 48 56 56 56 56 75 218 385 516 552 417 2,493
Hor 75 242 520 715 861 953 993 953 861 715 520 242 75 7,726
S 87 79 56 52 56 56 56 56 56 52 56 79 87 826
SE 369 520 488 353 183 64 56 56 56 52 48 36 16 2,295
E 397 615 651 576 393 175 56 56 56 52 48 36 16 3,124
Jan NE 167 326 397 397 330 210 87 56 56 52 48 36 16 2,176
& N 16 36 48 56 79 107 119 107 79 56 48 36 16 802
Nov NW 16 36 48 52 56 56 56 210 330 397 397 326 167 2,144
W 16 36 48 52 56 56 56 175 393 576 651 615 397 3,124
SW 16 36 48 52 56 56 56 64 183 353 488 520 369 2,295
Hor 60 262 488 699 850 937 977 937 850 699 488 262 60 7,567
S 22 30 41 48 48 52 52 52 48 48 41 30 22 534
SE 204 401 371 245 100 52 52 52 48 48 41 30 7 1,651
E 245 545 612 549 378 171 52 52 48 48 41 30 7 2,779
Feb NE 137 364 471 479 416 304 145 56 48 48 41 30 7 2,545
& N 7 30 48 100 174 215 234 215 174 100 48 30 7 1,384
Oct NW 7 30 41 48 48 56 145 304 416 479 471 364 137 2,545
W 7 30 41 48 48 52 52 171 378 549 612 545 245 2,779
SW 7 30 41 48 48 52 52 52 100 245 371 401 204 1,651
Hor 22 174 397 597 742 835 872 835 742 597 397 174 22 6,408
S 0 19 37 45 48 52 52 52 48 45 37 19 0 453
SE 0 275 334 148 56 52 52 52 48 45 37 19 0 1,117
E 0 460 586 534 382 178 52 52 48 45 37 19 0 2,393
Mar NE 0 364 486 564 523 419 249 93 48 45 37 19 0 2,846
& N 0 33 67 223 304 364 390 364 304 223 67 33 0 2,371
Sep NW 0 19 37 45 48 93 249 419 523 564 486 364 0 2,846
W 0 19 37 45 48 52 52 178 382 534 586 460 0 2,393
SW 0 19 37 45 48 52 52 52 56 148 334 275 0 1,117
Hor 0 93 301 501 664 749 787 749 664 501 301 93 0 5,402
S 0 11 30 41 45 48 52 48 45 41 30 11 0 401
SE 0 122 145 67 45 48 52 48 45 41 30 11 0 653
E 0 293 501 490 349 160 52 48 45 41 30 11 0 2,018
Apr NE 0 271 527 605 590 505 341 174 56 41 30 11 0 3,150
& N 0 67 211 341 449 516 538 516 449 341 211 67 0 3,707
Aug NW 0 11 30 41 56 174 341 505 590 605 527 271 0 3,150
W 0 11 30 41 45 48 52 160 349 490 501 293 0 2,018
SW 0 11 30 41 45 48 52 48 45 67 145 122 0 653
Hor 0 22 182 371 531 634 664 634 531 371 182 22 0 4,144
S 0 4 22 33 41 45 45 45 41 33 22 4 0 334
SE 0 30 59 33 41 45 45 45 41 33 22 4 0 397
E 0 100 404 430 308 130 45 45 41 33 22 4 0 1,562
May NE 0 104 471 597 601 531 386 237 85 33 22 4 0 3,072
& N 0 37 252 404 508 571 590 571 508 404 252 37 0 4,137
Jul NW 0 4 22 33 85 237 386 531 601 597 471 104 0 3,072
W 0 4 22 33 41 45 45 130 308 430 404 100 0 1,562
SW 0 4 22 33 41 45 45 45 41 33 59 30 0 397
Hor 0 7 100 263 404 505 538 505 404 263 100 7 0 3,098
S 0 0 15 33 41 45 45 45 41 33 15 0 0 312
SE 0 0 37 33 41 45 45 45 41 33 15 0 0 334
E 0 0 341 390 297 119 45 45 41 33 15 0 0 1,325
NE 0 0 423 583 601 531 401 267 104 33 15 0 0 2,957
Jun N 0 0 237 419 527 590 605 590 527 419 237 0 0 4,152
NW 0 0 15 33 104 267 401 531 601 583 423 0 0 2,957
W 0 0 15 33 41 45 45 119 297 390 341 0 0 1,325
SW 0 0 15 33 41 45 45 45 41 33 37 0 0 334
Hor 0 0 70 223 360 453 486 453 360 223 70 0 0 2,697
Table 4.8: Solar Gain Table
Module 9: Energy Efficiency in Building Electrical Systems
Building Energy Auditing Course Page 9.17
Solar heat gain can also be a benefit. During cool periods when heating is required in the building, the introduction of solar heat gain will reduce the building’s overall heating requirement. Thus, solar heat gain will reduce the building’s energy usage. As a rule of thumb for the Southern Africa region, however, the cost of the additional cooling load during warm periods generally outweighs the cost benefit of a reduced heating load during winter cold periods. Thus consideration is usually given to opportunities that will reduce solar heat gain. Glass area, glass type, glass orientation, and building overhangs (shading) are all elements that can be employed to minimize solar heat gain. These are key factors that should be considered at the building design stage. Once the building has been built, however, typical measures in these areas are often difficult and costly to implement. They are not usually cost effective. In existing building structures, measures to reduce solar heat gain are usually limited to the installation of shading such as awnings or screens, or window coverings such as curtains or blinds.
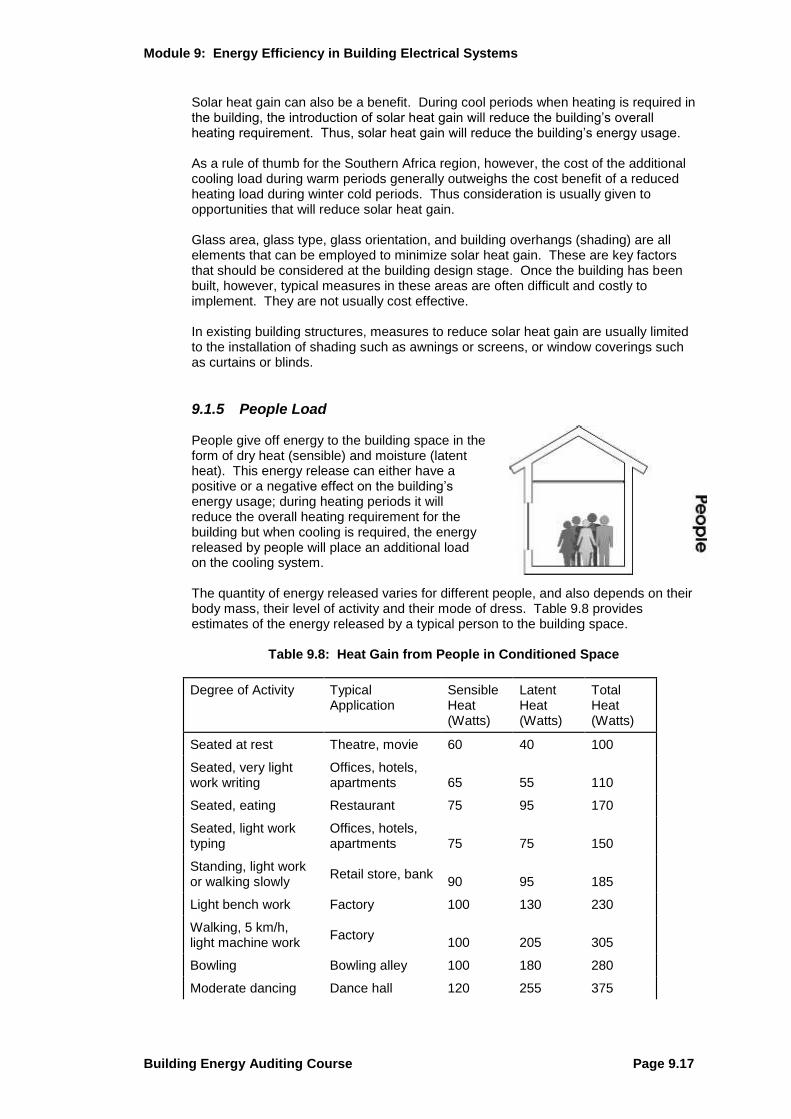
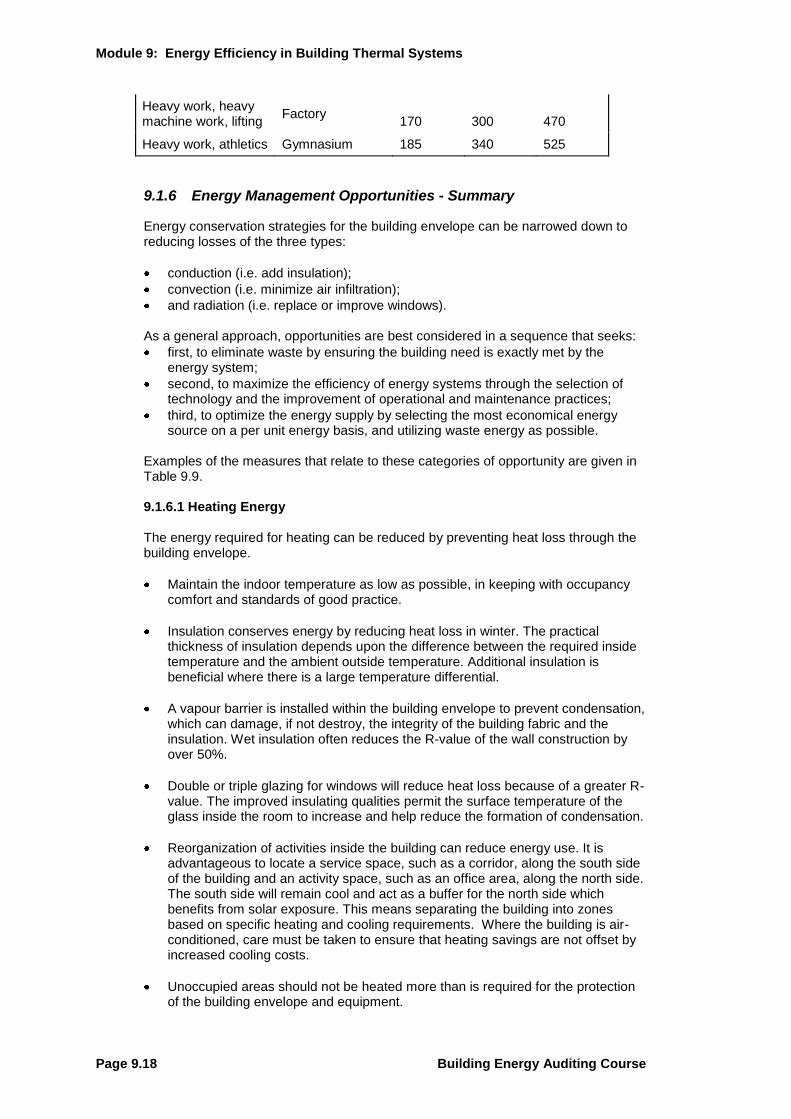
9.1.5 People Load People give off energy to the building space in the form of dry heat (sensible) and moisture (latent heat). This energy release can either have a positive or a negative effect on the building’s energy usage; during heating periods it will reduce the overall heating requirement for the building but when cooling is required, the energy released by people will place an additional load on the cooling system. The quantity of energy released varies for different people, and also depends on their body mass, their level of activity and their mode of dress. Table 9.8 provides estimates of the energy released by a typical person to the building space.
Table 9.8: Heat Gain from People in Conditioned Space
Degree of Activity Typical Application
Sensible Heat (Watts)
Latent Heat (Watts)
Total Heat (Watts)
Seated at rest Theatre, movie 60 40 100
Seated, very light work writing
Offices, hotels, apartments 65 55 110
Seated, eating Restaurant 75 95 170
Seated, light work typing
Offices, hotels, apartments 75 75 150
Standing, light work or walking slowly
Retail store, bank 90 95 185
Light bench work Factory 100 130 230
Walking, 5 km/h, light machine work
Factory 100 205 305
Bowling Bowling alley 100 180 280
Moderate dancing Dance hall 120 255 375
Module 9: Energy Efficiency in Building Thermal Systems
Page 9.18 Building Energy Auditing Course
Heavy work, heavy machine work, lifting
Factory 170 300 470
Heavy work, athletics Gymnasium 185 340 525
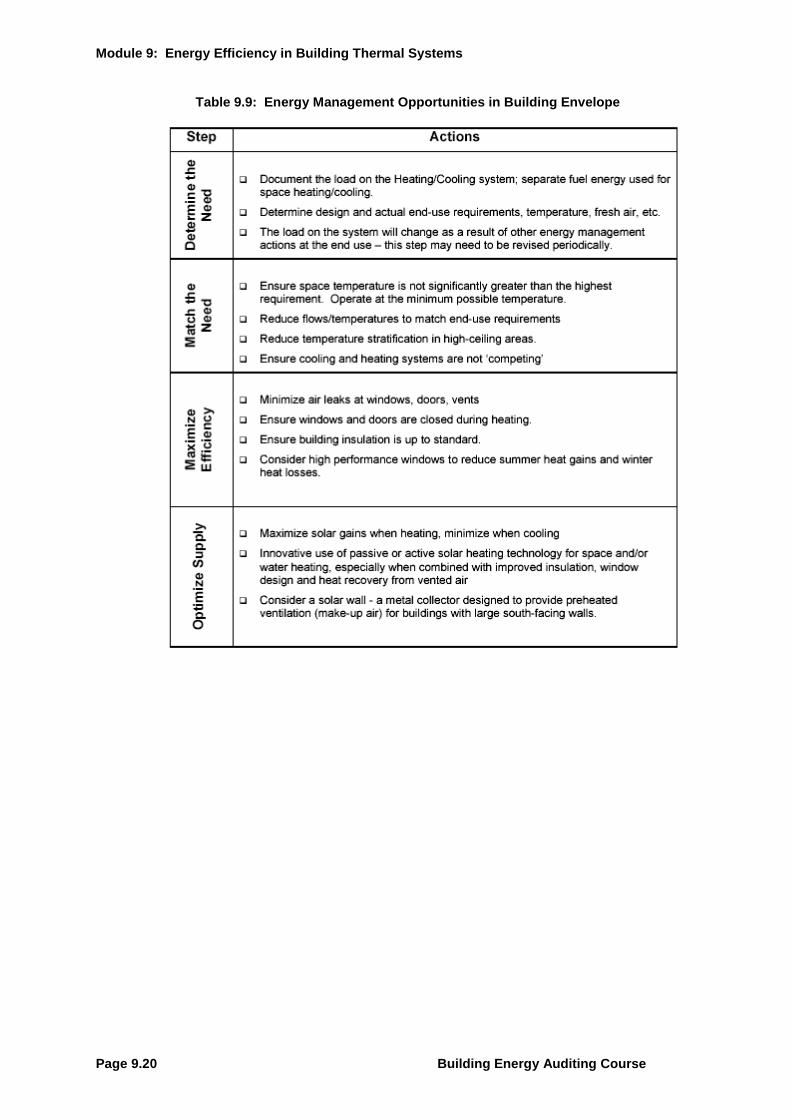
9.1.6 Energy Management Opportunities - Summary
Energy conservation strategies for the building envelope can be narrowed down to reducing losses of the three types:
conduction (i.e. add insulation);
convection (i.e. minimize air infiltration);
and radiation (i.e. replace or improve windows). As a general approach, opportunities are best considered in a sequence that seeks:
first, to eliminate waste by ensuring the building need is exactly met by the energy system;
second, to maximize the efficiency of energy systems through the selection of technology and the improvement of operational and maintenance practices;
third, to optimize the energy supply by selecting the most economical energy source on a per unit energy basis, and utilizing waste energy as possible.
Examples of the measures that relate to these categories of opportunity are given in Table 9.9. 9.1.6.1 Heating Energy The energy required for heating can be reduced by preventing heat loss through the building envelope.
Maintain the indoor temperature as low as possible, in keeping with occupancy comfort and standards of good practice.
Insulation conserves energy by reducing heat loss in winter. The practical thickness of insulation depends upon the difference between the required inside temperature and the ambient outside temperature. Additional insulation is beneficial where there is a large temperature differential.
A vapour barrier is installed within the building envelope to prevent condensation, which can damage, if not destroy, the integrity of the building fabric and the insulation. Wet insulation often reduces the R-value of the wall construction by over 50%.
Double or triple glazing for windows will reduce heat loss because of a greater R-value. The improved insulating qualities permit the surface temperature of the glass inside the room to increase and help reduce the formation of condensation.
Reorganization of activities inside the building can reduce energy use. It is advantageous to locate a service space, such as a corridor, along the south side of the building and an activity space, such as an office area, along the north side. The south side will remain cool and act as a buffer for the north side which benefits from solar exposure. This means separating the building into zones based on specific heating and cooling requirements. Where the building is air-conditioned, care must be taken to ensure that heating savings are not offset by increased cooling costs.
Unoccupied areas should not be heated more than is required for the protection of the building envelope and equipment.
Module 9: Energy Efficiency in Building Electrical Systems
Building Energy Auditing Course Page 9.19
9.1.6.2 Cooling Energy The energy required for cooling will be reduced by preventing heat transmission gain through the building envelope. Many of the measures that reduce heat loss will also reduce heat gain.
Maintain the indoor temperature as high as possible, in keeping with occupancy comfort and standards of good practice.
Insulation conserves energy by reducing heat gain in summer.
Double or triple glazing for windows will reduce heat gain because of a greater R-value, and by a reduction in solar gain.
Reorganization of activities inside the building can reduce heat gain. However, the desired configuration is opposite that required for reducing heat loss. To minimize heat gain, the corridors should be located along the north face and the conditioned spaces along the south face.
Unoccupied areas should not be cooled unless required to maintain temperature for a specific process in the building.
Module 9: Energy Efficiency in Building Thermal Systems
Page 9.20 Building Energy Auditing Course
Table 9.9: Energy Management Opportunities in Building Envelope
Module 9: Energy Efficiency in Building Electrical Systems
Building Energy Auditing Course Page 9.21
9.2 Heating, ventilating and air conditioning systems
9.2.1 Overview of HVAC
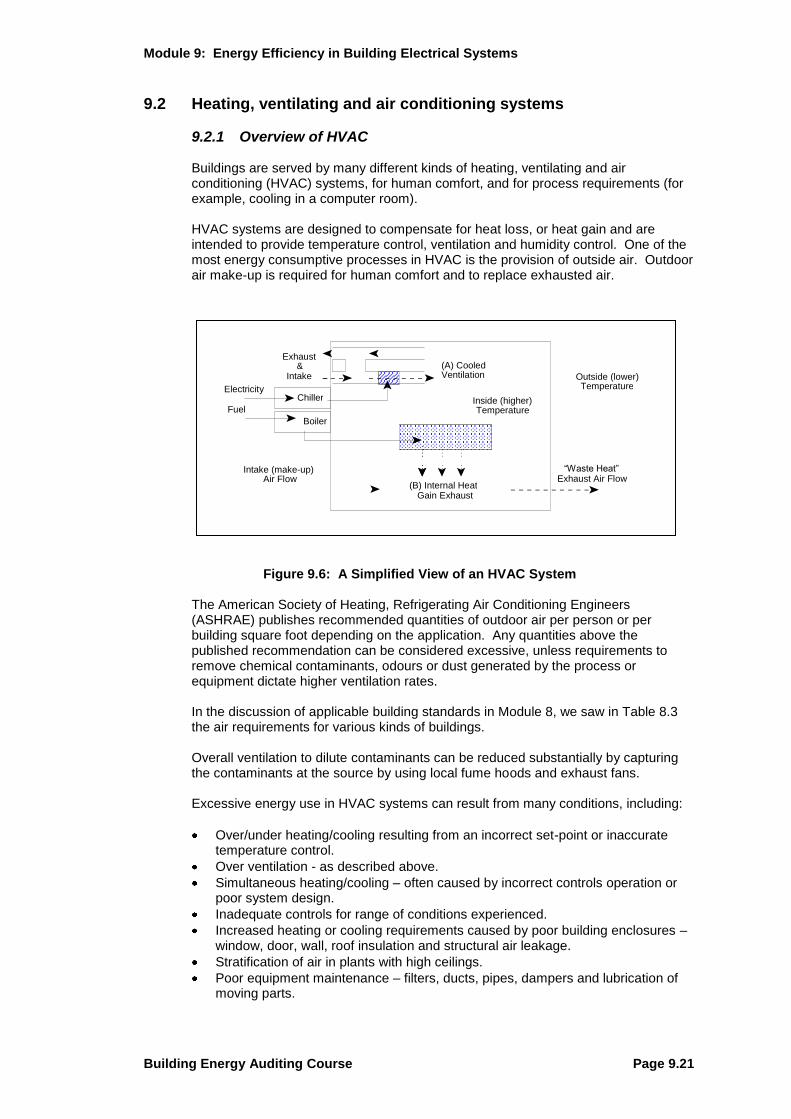
Buildings are served by many different kinds of heating, ventilating and air conditioning (HVAC) systems, for human comfort, and for process requirements (for example, cooling in a computer room). HVAC systems are designed to compensate for heat loss, or heat gain and are intended to provide temperature control, ventilation and humidity control. One of the most energy consumptive processes in HVAC is the provision of outside air. Outdoor air make-up is required for human comfort and to replace exhausted air.
Figure 9.6: A Simplified View of an HVAC System
The American Society of Heating, Refrigerating Air Conditioning Engineers (ASHRAE) publishes recommended quantities of outdoor air per person or per building square foot depending on the application. Any quantities above the published recommendation can be considered excessive, unless requirements to remove chemical contaminants, odours or dust generated by the process or equipment dictate higher ventilation rates. In the discussion of applicable building standards in Module 8, we saw in Table 8.3 the air requirements for various kinds of buildings. Overall ventilation to dilute contaminants can be reduced substantially by capturing the contaminants at the source by using local fume hoods and exhaust fans. Excessive energy use in HVAC systems can result from many conditions, including:
Over/under heating/cooling resulting from an incorrect set-point or inaccurate temperature control.
Over ventilation - as described above.
Simultaneous heating/cooling – often caused by incorrect controls operation or poor system design.
Inadequate controls for range of conditions experienced.
Increased heating or cooling requirements caused by poor building enclosures – window, door, wall, roof insulation and structural air leakage.
Stratification of air in plants with high ceilings.
Poor equipment maintenance – filters, ducts, pipes, dampers and lubrication of moving parts.
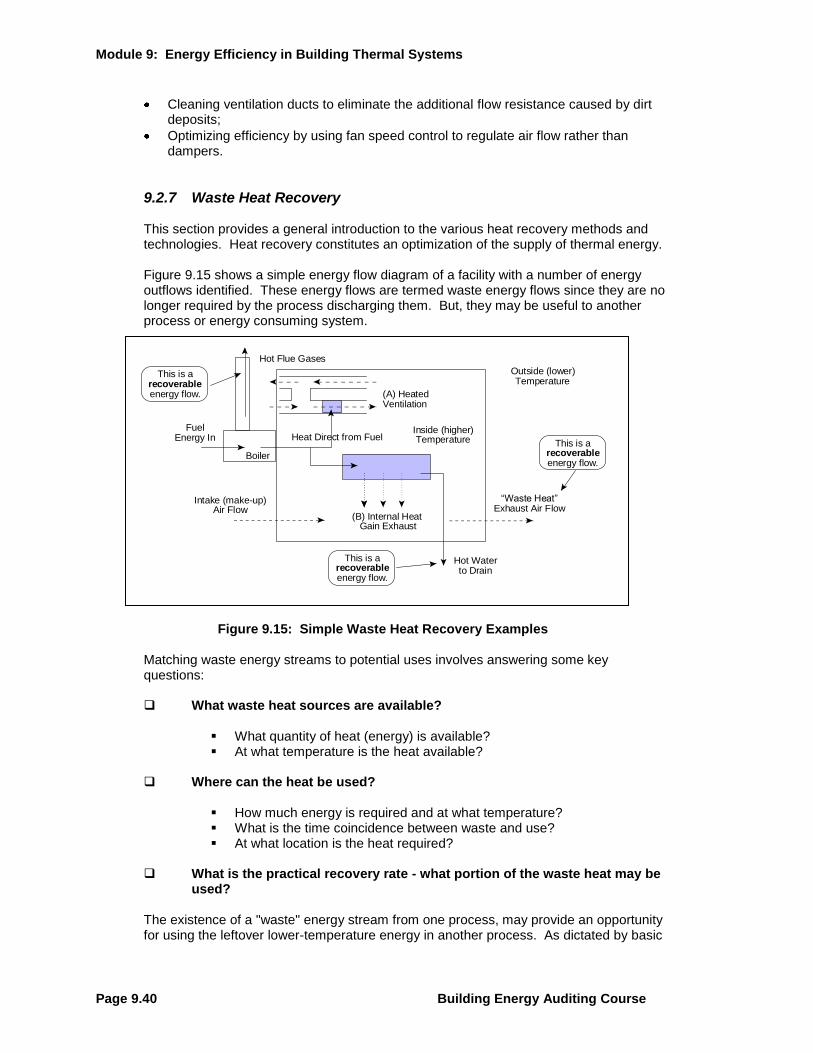
Intake (make-up) Air Flow
―Waste Heat‖ Exhaust Air Flow
Outside (lower) Temperature
Inside (higher) Temperature
(B) Internal Heat Gain Exhaust
(A) Cooled Ventilation
Exhaust &
Intake
Boiler Fuel
Chiller Electricity
Module 9: Energy Efficiency in Building Thermal Systems
Page 9.22 Building Energy Auditing Course
Poor control of process effluents at source such heat, fumes, dust and humidity – which increase the HVAC system loads.
Incorrect system type or sizing
Lack of coordination in central control. In many ways HVAC is an end-use with a requirement met by many of the systems discussed in previous sections including boilers, motors, refrigeration for air conditioning, fans and pumps. Consequently, many of the opportunities in these systems are found by matching the need more closely. Often the inability of an HVAC system to meet the space conditioning needs of the occupants and process is a clue to the existence of savings opportunities. Start with an evaluation of how well your system performs. 9.2.1.1 Energy Management Opportunities by Matching the Requirement Does the system meet the needs in all building areas? What are the
deficiencies?
Are contaminants from other building areas properly contained? What are the temperature requirements of the conditioned space? What are the ventilation requirements of the conditioned space? Was the existing system designed to meet these needs? What is the accuracy of temperature and humidity control? Are more accurate controls available? Does the HVAC load vary daily and seasonally? Does the system have capacity control to accommodate these swings? 9.2.1.2 Energy Management Opportunities by Maximizing the Efficiency Is there a preventative maintenance program for the HVAC systems?
Are controls calibrated regularly?
Was the existing system designed for the present purpose or conditions?
Are there more efficient systems for our application?
9.2.1.3 Checklist of Opportunity The following is a checklist, by function, from end-use to delivery of savings opportunities associated with HVAC Ventilation/Exhaust Systems Shut down ventilation/exhaust systems when not required.
Avoid unnecessary cooling (or heating if required). Maintain dampers to reduce outside air leakage when not required.
Leaking dampers will increase cooling (and heating) loads by introducing excessive outside air.
Module 9: Energy Efficiency in Building Electrical Systems
Building Energy Auditing Course Page 9.23
Use correct ventilation/exhaust rates for application/occupancy.
Control ventilation based upon requirement - temperature, contaminant or possibly an occupancy sensor.
Balance air flows for appropriate zero, positive or negative pressure. This will also help to avoid cross contamination of air between the various process areas.
Zone ventilated areas and sequence air flow based on contaminant levels. From lowest to highest contaminant levels. Conditioned air may be re-used.
Utilize direct air make-up with heat recovery for critical contaminant extraction.
Control contaminants at source to reduce the cost of extraction.
Utilize systems to destratify ceiling air. In heated spaces hot air will tend to accumulate at ceiling level. If heating is required – energy costs may be reduced by returning heat to floor level.
Minimize the Use of Local Exhaust
Many buildings have local exhaust hoods, typically in food service areas and laboratories. Large open hoods exhaust substantial quantities of air to maintain a satisfactory capture velocity. The air which is exhausted must be made up by outside air which must be conditioned. Unnecessary use of an exhaust hood may cause substantial waste. Correcting the problem can provide substantial savings.
Space Conditioning Control temperature and humidity according to comfort zone.
Only cool (or if required heat) spaces to the level required for the activity of occupants and the season.
Minimize solar gains Often large roof areas present significant cooling loads due to solar gains. Windows can have a similar effect. Control of radiative heat gains with films and reflective treatment may be advantageous.
Raise thermostats during unoccupied hours during the cooling season.
Avoid cooling spaces when unoccupied. Likewise if heat is required – setback temperatures when unoccupied to avoid unnecessary heating.
Adjust space temperatures in unoccupied or storage areas
This can be done to minimize cooling or heating required.
Ensure automatic controls are operating correctly and are calibrated regularly. Errors of 1 to 2
oC can make a significant difference to the cost of cooling
Use enthalpy control on HVAC systems.
Enthalpy controls select between mechanical air conditioning and outside air depending upon temperatures and humidity to minimize cooling costs.
Use Filters to Remove Odors Depending on the application involved and local codes, use filters to remove odors if ventilation is currently being used for that purpose. Activated carbon power the ventilation fan.
Module 9: Energy Efficiency in Building Thermal Systems
Page 9.24 Building Energy Auditing Course
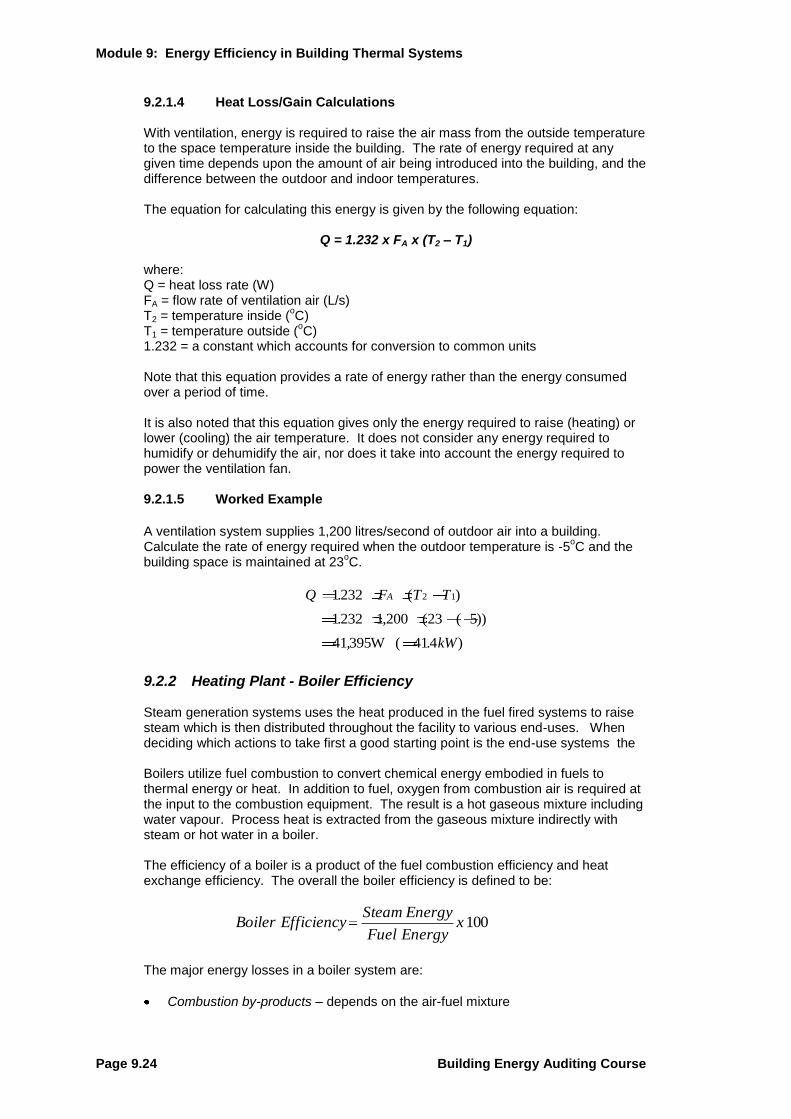
9.2.1.4 Heat Loss/Gain Calculations
With ventilation, energy is required to raise the air mass from the outside temperature to the space temperature inside the building. The rate of energy required at any given time depends upon the amount of air being introduced into the building, and the difference between the outdoor and indoor temperatures. The equation for calculating this energy is given by the following equation:
Q = 1.232 x FA x (T2 – T1)
where: Q = heat loss rate (W) FA = flow rate of ventilation air (L/s) T2 = temperature inside (
oC)
T1 = temperature outside (oC)
1.232 = a constant which accounts for conversion to common units
Note that this equation provides a rate of energy rather than the energy consumed over a period of time. It is also noted that this equation gives only the energy required to raise (heating) or lower (cooling) the air temperature. It does not consider any energy required to humidify or dehumidify the air, nor does it take into account the energy required to power the ventilation fan.
9.2.1.5 Worked Example
A ventilation system supplies 1,200 litres/second of outdoor air into a building. Calculate the rate of energy required when the outdoor temperature is -5
oC and the
building space is maintained at 23oC.
Q F T T
, kW
A1232
1232 1 200 23 5
41395 414
2 1. ( )
. , ( ( ))
. )W (
9.2.2 Heating Plant - Boiler Efficiency
Steam generation systems uses the heat produced in the fuel fired systems to raise steam which is then distributed throughout the facility to various end-uses. When deciding which actions to take first a good starting point is the end-use systems the Boilers utilize fuel combustion to convert chemical energy embodied in fuels to thermal energy or heat. In addition to fuel, oxygen from combustion air is required at the input to the combustion equipment. The result is a hot gaseous mixture including water vapour. Process heat is extracted from the gaseous mixture indirectly with steam or hot water in a boiler.
The efficiency of a boiler is a product of the fuel combustion efficiency and heat exchange efficiency. The overall the boiler efficiency is defined to be:
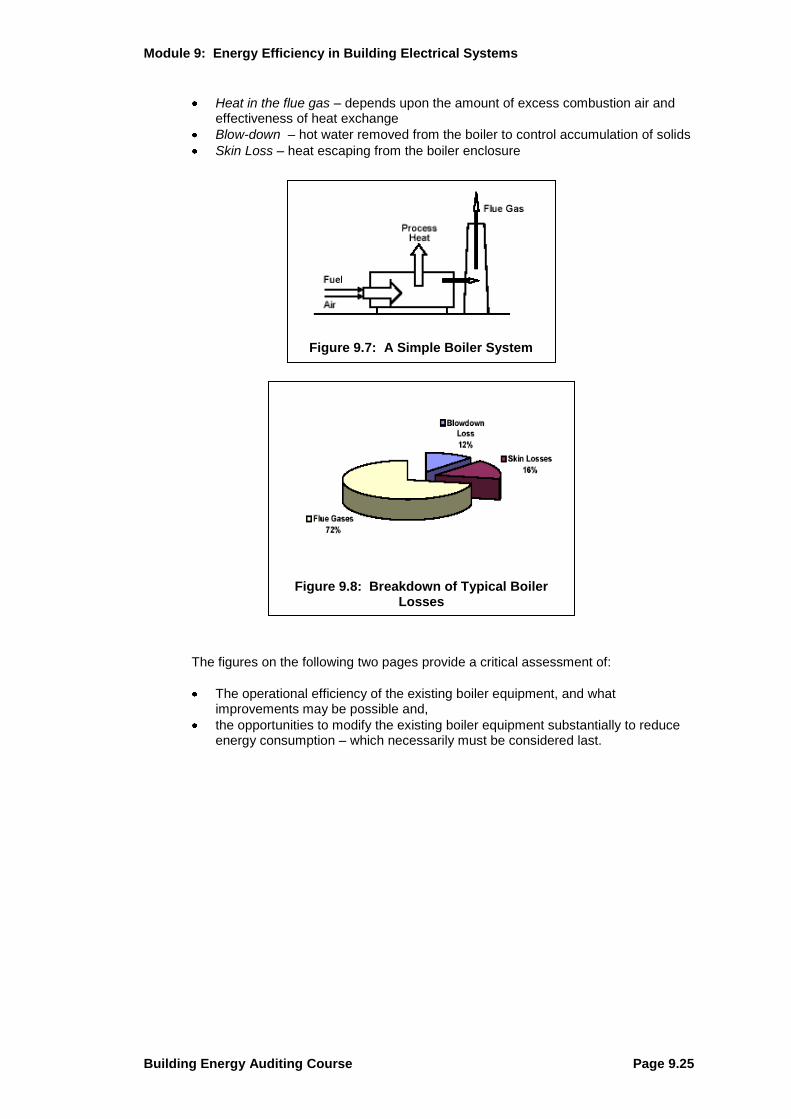
The major energy losses in a boiler system are:
Combustion by-products – depends on the air-fuel mixture
100xEnergyFuel
EnergySteamEfficiencyBoiler
Q F T T
, kW
A1232
1232 1 200 23 5
41395 414
2 1. ( )
. , ( ( ))
. )W (
Module 9: Energy Efficiency in Building Electrical Systems
Building Energy Auditing Course Page 9.25
Heat in the flue gas – depends upon the amount of excess combustion air and effectiveness of heat exchange
Blow-down – hot water removed from the boiler to control accumulation of solids
Skin Loss – heat escaping from the boiler enclosure
The figures on the following two pages provide a critical assessment of:
The operational efficiency of the existing boiler equipment, and what improvements may be possible and,
the opportunities to modify the existing boiler equipment substantially to reduce energy consumption – which necessarily must be considered last.
Figure 9.7: A Simple Boiler System
Figure 9.8: Breakdown of Typical Boiler Losses
Module 9: Energy Efficiency in Building Thermal Systems
Page 9.26 Building Energy Auditing Course
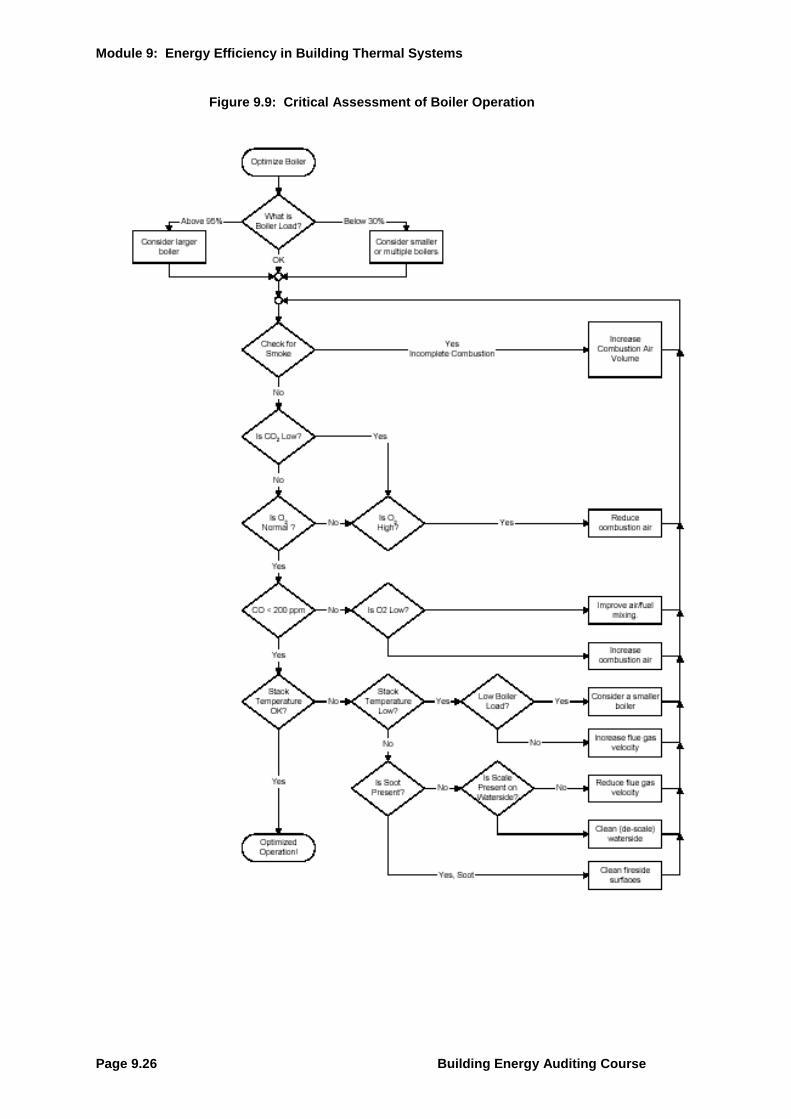
Figure 9.9: Critical Assessment of Boiler Operation
Module 9: Energy Efficiency in Building Electrical Systems
Building Energy Auditing Course Page 9.27
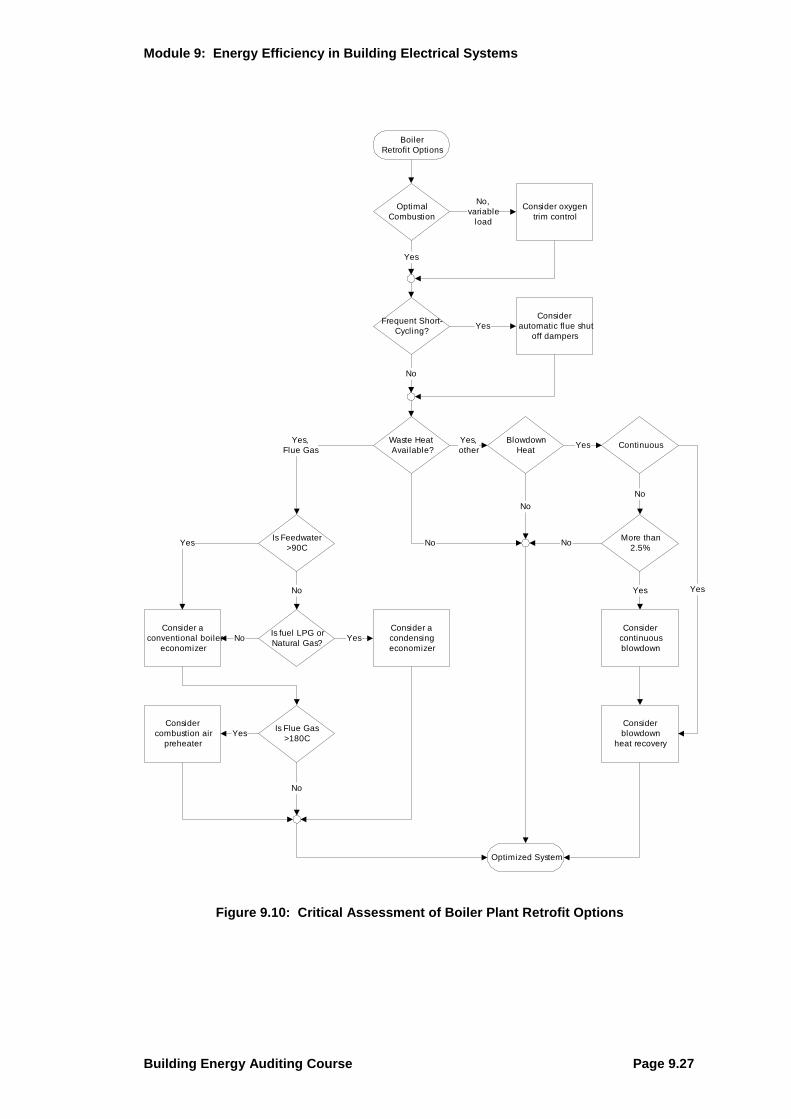
Figure 9.10: Critical Assessment of Boiler Plant Retrofit Options
Boiler
Retrofit Options
Optimal
Combustion
Consider oxygen
trim control
Frequent Short-
Cycling?
Consider
automatic flue shut
off dampers
Waste Heat
Available?
Blowdown
HeatContinuous
Is Feedwater
>90C
Is fuel LPG or
Natural Gas?
Consider a
conventional boiler
economizer
Consider a
condensing
economizer
Is Flue Gas
>180C
Consider
combustion air
preheater
Consider
continuous
blowdown
More than
2.5%
Consider
blowdown
heat recovery
No,
variable
load
Yes
Yes,
Flue Gas
Yes
No
No Yes
Yes
Yes,
otherYes
YesYes
No
Optimized System
No
No
No
No
Yes
No
Module 9: Energy Efficiency in Building Thermal Systems
Page 9.28 Building Energy Auditing Course
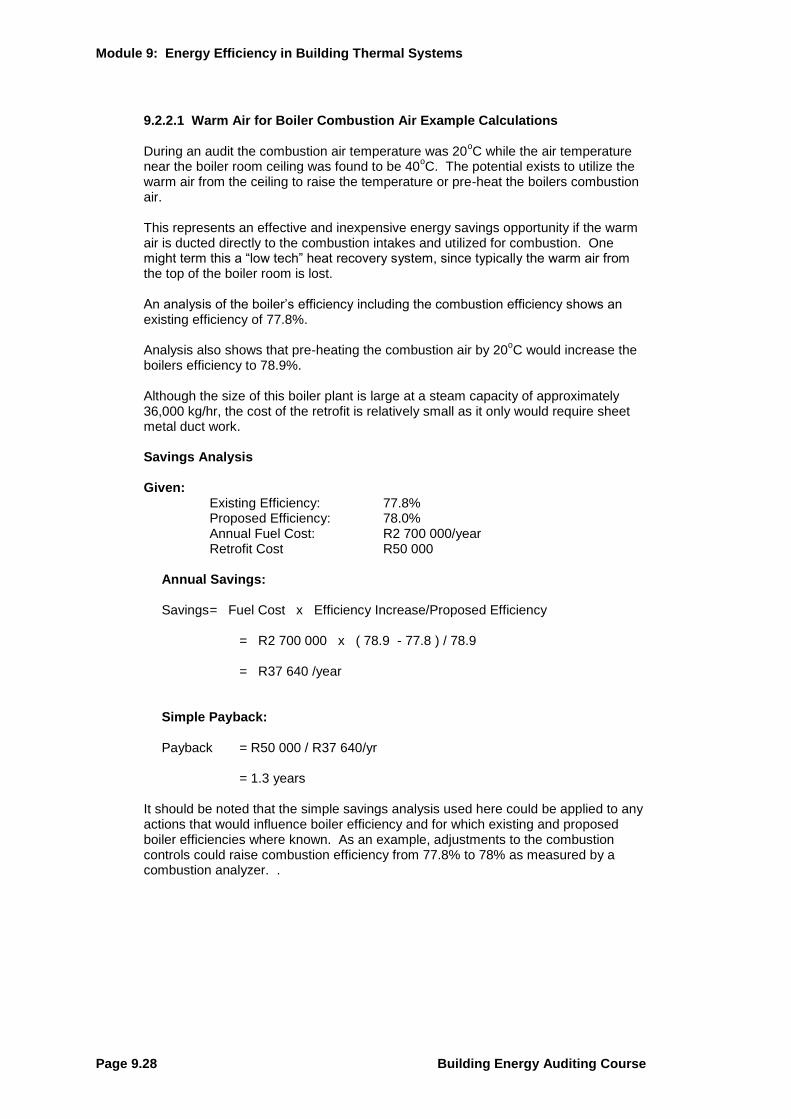
9.2.2.1 Warm Air for Boiler Combustion Air Example Calculations
During an audit the combustion air temperature was 20
oC while the air temperature
near the boiler room ceiling was found to be 40oC. The potential exists to utilize the
warm air from the ceiling to raise the temperature or pre-heat the boilers combustion air. This represents an effective and inexpensive energy savings opportunity if the warm air is ducted directly to the combustion intakes and utilized for combustion. One might term this a ―low tech‖ heat recovery system, since typically the warm air from the top of the boiler room is lost. An analysis of the boiler’s efficiency including the combustion efficiency shows an existing efficiency of 77.8%. Analysis also shows that pre-heating the combustion air by 20
oC would increase the
boilers efficiency to 78.9%. Although the size of this boiler plant is large at a steam capacity of approximately 36,000 kg/hr, the cost of the retrofit is relatively small as it only would require sheet metal duct work.
Savings Analysis Given:
Existing Efficiency: 77.8% Proposed Efficiency: 78.0% Annual Fuel Cost: R2 700 000/year Retrofit Cost R50 000
Annual Savings:
Savings = Fuel Cost x Efficiency Increase/Proposed Efficiency
= R2 700 000 x ( 78.9 - 77.8 ) / 78.9
= R37 640 /year
Simple Payback: Payback = R50 000 / R37 640/yr
= 1.3 years
It should be noted that the simple savings analysis used here could be applied to any actions that would influence boiler efficiency and for which existing and proposed boiler efficiencies where known. As an example, adjustments to the combustion controls could raise combustion efficiency from 77.8% to 78% as measured by a combustion analyzer. .
Module 9: Energy Efficiency in Building Electrical Systems
Building Energy Auditing Course Page 9.29
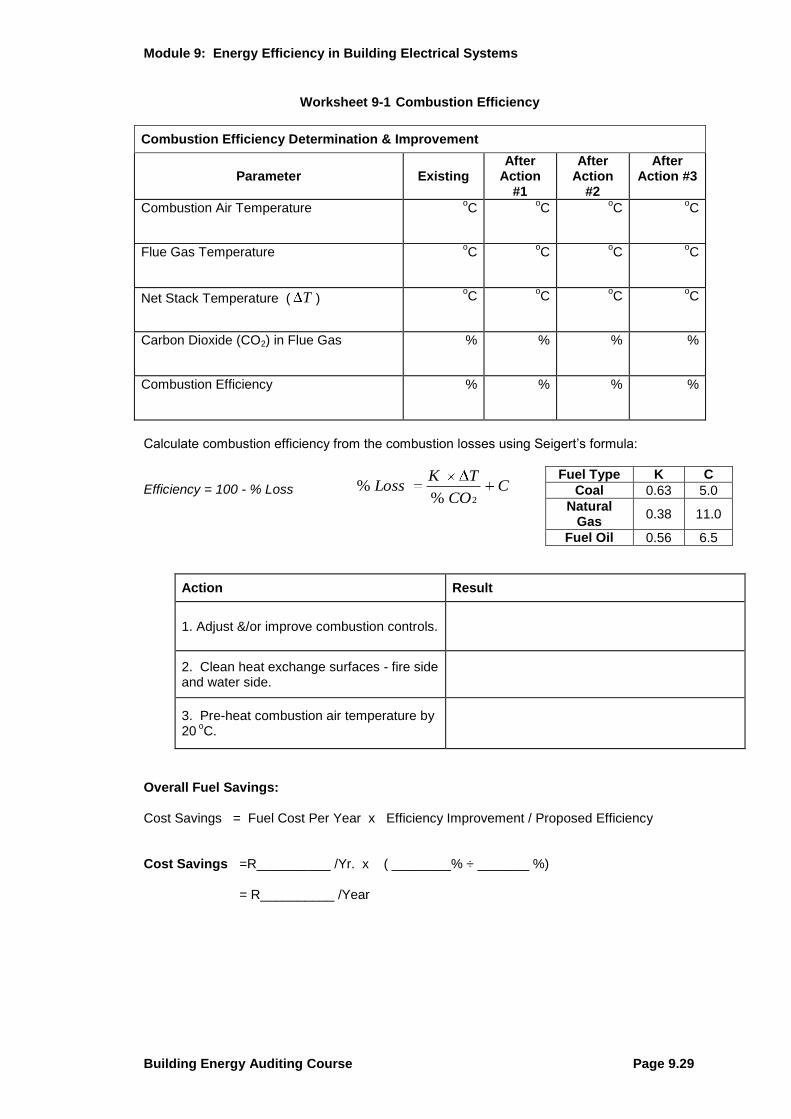
CCO
TKLoss
2%%
Worksheet 9-1 Combustion Efficiency
Combustion Efficiency Determination & Improvement
Parameter
Existing
After Action
#1
After Action
#2
After Action #3
Combustion Air Temperature
oC
oC
oC
oC
Flue Gas Temperature
oC
oC
oC
oC
Net Stack Temperature ( T )
oC
oC
oC
oC
Carbon Dioxide (CO2) in Flue Gas
% % % %
Combustion Efficiency
% % % %
Calculate combustion efficiency from the combustion losses using Seigert’s formula: Efficiency = 100 - % Loss
Action Result
1. Adjust &/or improve combustion controls.
2. Clean heat exchange surfaces - fire side and water side.
3. Pre-heat combustion air temperature by 20
oC.
Overall Fuel Savings: Cost Savings = Fuel Cost Per Year x Efficiency Improvement / Proposed Efficiency
Cost Savings =R__________ /Yr. x ( ________% ÷ _______ %)
= R__________ /Year
Fuel Type K C
Coal 0.63 5.0
Natural Gas
0.38 11.0
Fuel Oil 0.56 6.5

Module 9: Energy Efficiency in Building Electrical Systems
Building Energy Auditing Course Page 9.31
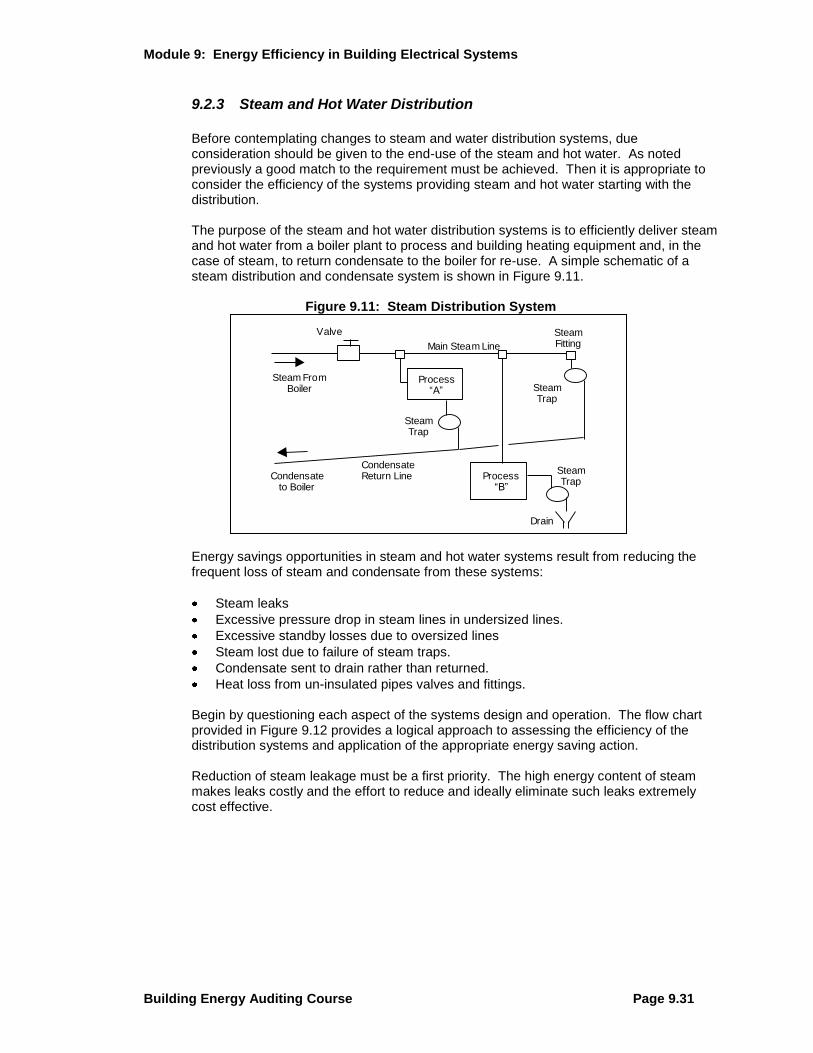
9.2.3 Steam and Hot Water Distribution
Before contemplating changes to steam and water distribution systems, due consideration should be given to the end-use of the steam and hot water. As noted previously a good match to the requirement must be achieved. Then it is appropriate to consider the efficiency of the systems providing steam and hot water starting with the distribution. The purpose of the steam and hot water distribution systems is to efficiently deliver steam and hot water from a boiler plant to process and building heating equipment and, in the case of steam, to return condensate to the boiler for re-use. A simple schematic of a steam distribution and condensate system is shown in Figure 9.11.
Figure 9.11: Steam Distribution System
Energy savings opportunities in steam and hot water systems result from reducing the frequent loss of steam and condensate from these systems:
Steam leaks
Excessive pressure drop in steam lines in undersized lines.
Excessive standby losses due to oversized lines
Steam lost due to failure of steam traps.
Condensate sent to drain rather than returned.
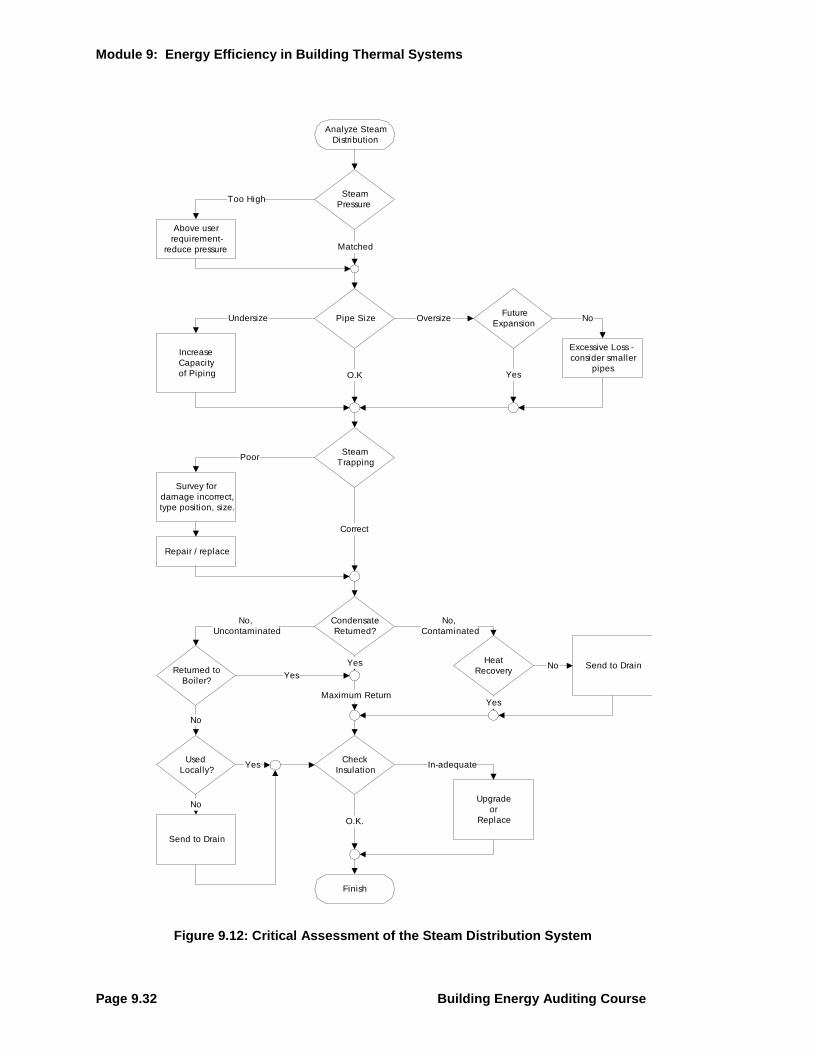
Heat loss from un-insulated pipes valves and fittings. Begin by questioning each aspect of the systems design and operation. The flow chart provided in Figure 9.12 provides a logical approach to assessing the efficiency of the distribution systems and application of the appropriate energy saving action. Reduction of steam leakage must be a first priority. The high energy content of steam makes leaks costly and the effort to reduce and ideally eliminate such leaks extremely cost effective.
Process ―A‖
Process ―B‖
Steam Trap
Steam Trap
Steam Trap
Main Steam Line
Condensate Return Line
Steam From Boiler
Condensate to Boiler
Drain
Valve Steam Fitting
Module 9: Energy Efficiency in Building Thermal Systems
Page 9.32 Building Energy Auditing Course
Figure 9.12: Critical Assessment of the Steam Distribution System
Analyze Steam
Distribution
Steam
Pressure
Pipe Size
Above user
requirement-
reduce pressure
Increase
Capacity
of Piping
Steam
Trapping
Future
Expansion
Excessive Loss -
consider smaller
pipes
Survey for
damage incorrect,
type position, size.
Repair / replace
Condensate
Returned?
Check
Insulation
Heat
RecoverySend to Drain
Upgrade
or
Replace
Finish
Returned to
Boiler?
Used
Locally?
Too High
Undersize
Poor
Correct
No,
Uncontaminated
Matched
O.K
Oversize No
Yes
No
Yes
Yes
No,
Contaminated
Maximum Return
No
Yes
Yes
No
In-adequate
O.K.
Send to Drain
Module 9: Energy Efficiency in Building Electrical Systems
Building Energy Auditing Course Page 9.33
9.2.3.1 Condensate Return Savings
The steam distribution system in a large heating plant only returned about 70% of the total steam condensate to the boiler plant. The average steam consumption was 45,000 kg of steam per hour. Thus the make-up water requirement was on the order of 13,500 litres per hour. This represented a significant heat and water loss in hot condensate and increased water treatment costs. A survey of the equipment revealed that almost 1/3 of the condensate being sent to drain was not contaminated and could be re-used in the boiler. An additional 4,000 litres per hour could be returned to the boiler. Thermal energy savings could be calculated from the energy in the water sent to drain. Savings Analysis Given: Condensate : 4,000 litres/hr Condensate Temperature: 95
oC
Mains Water Temperature 10 oC
Boiler Efficiency: 82.0% Fuel Energy Cost: R41.45/GJ Annual Savings: Energy = M x (TCondensate – TMains) x C Where M = 4,000 litres/hr x 1 kg/litre x 6000 hrs/year = 72,000,000 kg/year C = 4.2 kJ/kg
oC
Energy = 72,000,000 kg/year x (95 – 10) C x 4.2 kJ/kg
oC
= 8, 600,000,000 kJ /year or 8,600 GJ/year Cost Savings = Fuel Energy Cost x (Energy ÷ Boiler Efficiency) = R41.45/GJ x (8,600 GJ ÷ 0.82) = R434 719/ year As can be noted, the cost of lost condensate is not insignificant. In addition to the energy savings, there could be water and sewerage charges depending upon the source of mains water and chemical savings due to reduced water treatment.
9.2.4 Cooling plant – Refrigeration Systems
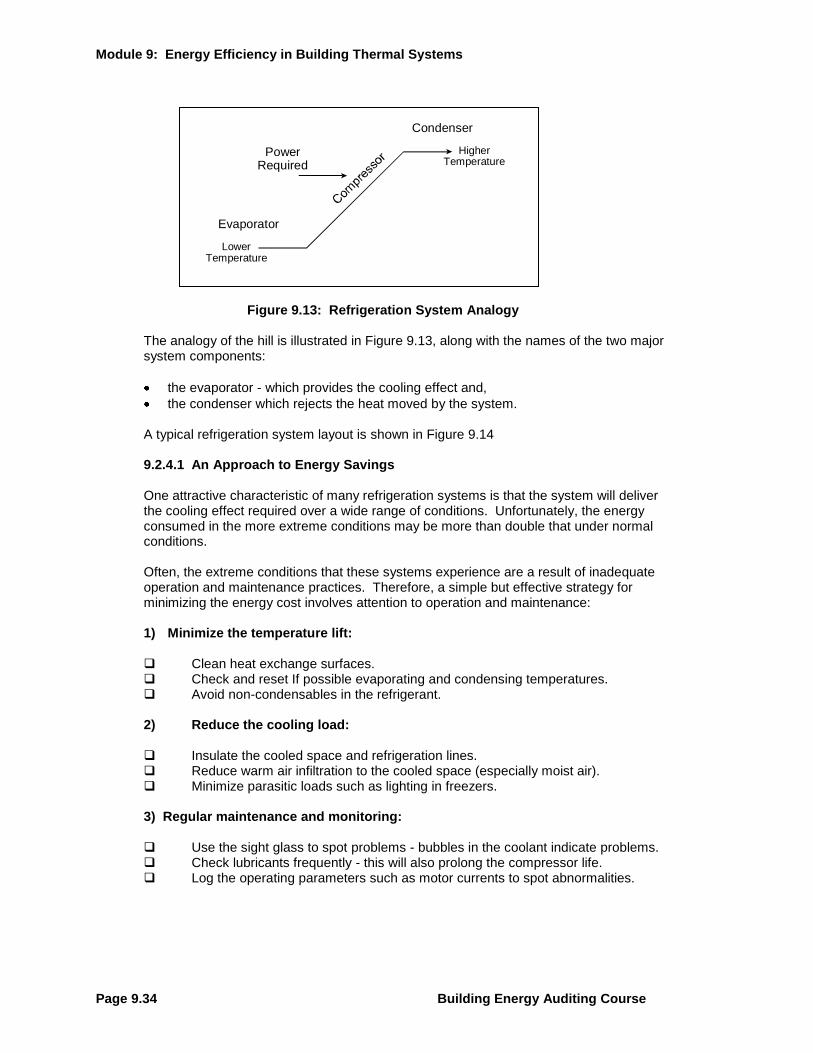
The purpose of a refrigeration or air conditioning system is to move heat from a cooler space to a warmer space. In very simple terms these systems move heat against its natural direction of flow. If you think of heat as flowing naturally ―downhill‖ from warm to cold then you can picture a refrigeration system moving heat ―uphill‖. The energy required to move the heat uphill, from colder to warmer depends upon two things: the temperature difference from cold to warm (similar to the height of the hill), and the amount of heat the system has to move ( the cooling load).
Module 9: Energy Efficiency in Building Thermal Systems
Page 9.34 Building Energy Auditing Course
Figure 9.13: Refrigeration System Analogy
The analogy of the hill is illustrated in Figure 9.13, along with the names of the two major system components:
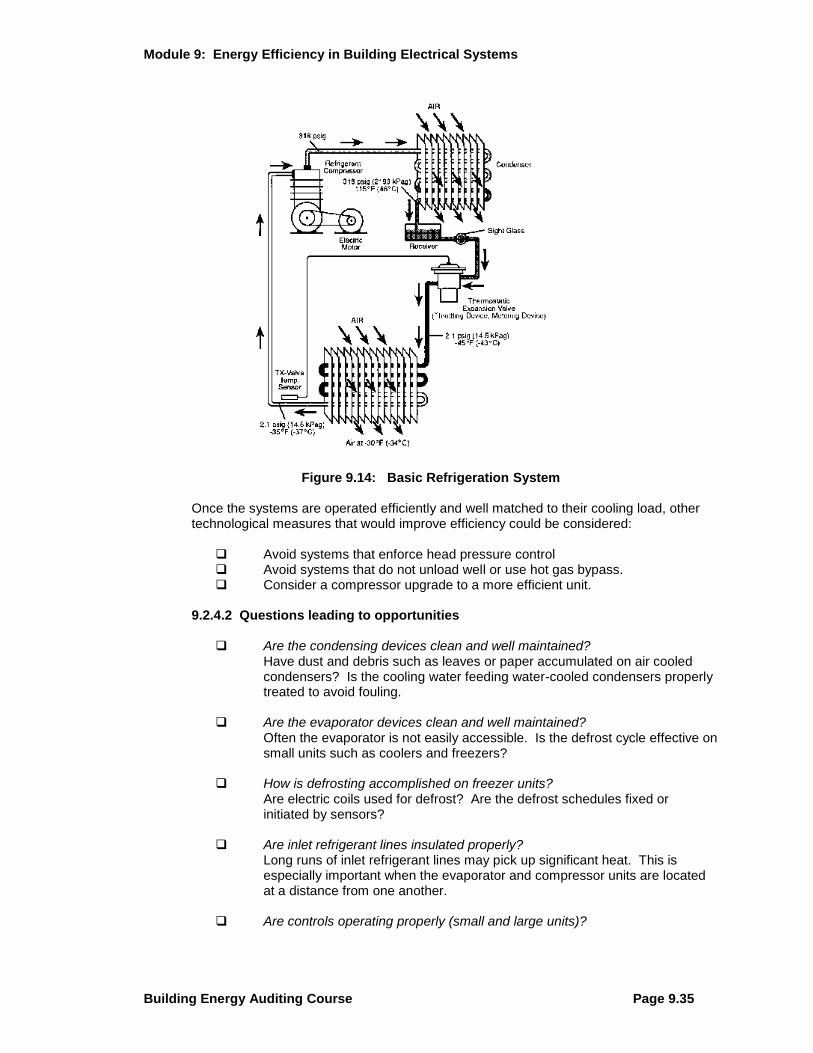
the evaporator - which provides the cooling effect and,
the condenser which rejects the heat moved by the system. A typical refrigeration system layout is shown in Figure 9.14 9.2.4.1 An Approach to Energy Savings One attractive characteristic of many refrigeration systems is that the system will deliver the cooling effect required over a wide range of conditions. Unfortunately, the energy consumed in the more extreme conditions may be more than double that under normal conditions. Often, the extreme conditions that these systems experience are a result of inadequate operation and maintenance practices. Therefore, a simple but effective strategy for minimizing the energy cost involves attention to operation and maintenance:
1) Minimize the temperature lift: Clean heat exchange surfaces. Check and reset If possible evaporating and condensing temperatures. Avoid non-condensables in the refrigerant. 2) Reduce the cooling load:
Insulate the cooled space and refrigeration lines. Reduce warm air infiltration to the cooled space (especially moist air). Minimize parasitic loads such as lighting in freezers.
3) Regular maintenance and monitoring:
Use the sight glass to spot problems - bubbles in the coolant indicate problems. Check lubricants frequently - this will also prolong the compressor life. Log the operating parameters such as motor currents to spot abnormalities.
PowerRequired
HigherTemperature
LowerTemperature
Condenser
Evaporator
Module 9: Energy Efficiency in Building Electrical Systems
Building Energy Auditing Course Page 9.35
Figure 9.14: Basic Refrigeration System
Once the systems are operated efficiently and well matched to their cooling load, other technological measures that would improve efficiency could be considered:
Avoid systems that enforce head pressure control Avoid systems that do not unload well or use hot gas bypass. Consider a compressor upgrade to a more efficient unit.
9.2.4.2 Questions leading to opportunities
Are the condensing devices clean and well maintained? Have dust and debris such as leaves or paper accumulated on air cooled condensers? Is the cooling water feeding water-cooled condensers properly treated to avoid fouling.
Are the evaporator devices clean and well maintained?
Often the evaporator is not easily accessible. Is the defrost cycle effective on small units such as coolers and freezers?
How is defrosting accomplished on freezer units?
Are electric coils used for defrost? Are the defrost schedules fixed or initiated by sensors?
Are inlet refrigerant lines insulated properly?
Long runs of inlet refrigerant lines may pick up significant heat. This is especially important when the evaporator and compressor units are located at a distance from one another.
Are controls operating properly (small and large units)?
Module 9: Energy Efficiency in Building Thermal Systems
Page 9.36 Building Energy Auditing Course
If the equipment is not maintained regularly, controls may easily be out of adjustment.
Is there a regular maintenance program for your refrigeration systems?
Check regularly for refrigerant leaks, purge non-condensable gases, check filters, oil etc.
Do condensers and cooling towers have adequate cool air? In rooftop units, do the air intakes draw hot air directly off the roof? In the case of retail food refrigeration, is the temperature of the compressor room correct?
Does simultaneous heating and cooling occur?
This is usually not as obvious as it might appear to be. It may be more likely in the case of smaller, independent systems, but it can occur when controls on larger systems do not operate properly. Also, it may take place in different areas of a building. Can the excess heat from one area be used in another area?
Can evaporator temperature be increased?
. Can condenser temperature be reduced? Are the compressor crankcase heaters off during the warmer months of the
year?
The following questions should be addressed to a refrigeration expert regarding the operation of the systems in the facility.
Is the refrigeration unit appropriate to the load?
Is a freezer unit being used to provide cooling only? Is the capacity of a refrigeration system much greater than the load? If the system cycles off-on-off frequently, this may be the case. A lightly loaded unit will not operate as efficiently as a properly loaded unit.
How do the refrigeration systems handle part load conditions?
Staged multiple compressors are more efficient than single large ones at part loads. Do your reciprocating compressors have unloaders? Is hot gas by-pass used to artificially load the system at part loads? (Try to avoid)
Has the heat load within refrigerated spaces been minimized?
Are cooled spaces well-insulated and air-tight? Is the lighting load in cooled spaces efficient? (avoid incandescent) Are lights on continuously or longer than necessary?
Can thermal storage avoid peak demand caused by refrigeration systems?
This may not be as exotic as it sounds. For example, a food processing facility with a large amount of frozen product, has built-in thermal storage. Even without refrigeration, the product may stay below acceptable temperatures for a period of time long enough to allow peak demand control.
9.2.4.3 Selected Savings Opportunities
Use conservative practices at point of use
Sometimes the most attractive savings opportunities may be realized through the optimization of the ultimate end-use of the energy. For example, minimizing the
Module 9: Energy Efficiency in Building Electrical Systems
Building Energy Auditing Course Page 9.37
amount of heat that reaches the ice (otherwise called the cooling load) leads to reduced operation of the refrigeration plant. These types of opportunities are often found by considering all the factors that influence the amount of electricity used.
Adjust control set points.
Proper control maintenance is essential in operating refrigeration systems optimally. Situations may exist where the existing controls are not appropriate or not capable of controlling the systems properly. The symptom of this may be as simple as a thermostat that fails to effectively control comfort levels in an occupied space.
Raise evaporator temperature (suction pressure)
The amount of power demanded by a refrigeration compressor is determined by the difference between the evaporator and condenser temperature (or pressure). Therefore, if the system requiring cooling can tolerate a small increase in temperature at the evaporator, an opportunity to reduce compressor power may exist. In order to determine if such a change is possible, and will not damage the compressor, you should consult a refrigeration expert. Since compressors are finely tuned systems, caution should always be exercised when considering adjustments to operating conditions.
Lower condensing temperature (discharge pressure)
The amount of power demanded by a refrigeration compressor is determined by the difference between the evaporator and condenser temperature (or pressure). Therefore, if the compressor can tolerate a small reduction in temperature at the condenser, an opportunity to reduce compressor power may exist. In order to determine if such a change is possible, and will not damage the compressor, you should consult a refrigeration expert. Since compressors are finely tuned systems, caution should always be exercised when considering adjustments to operating conditions.
Clean heat exchange surfaces
If the heat exchanging surfaces of the evaporator in a refrigeration system of any size are not clean, the evaporator is forced to operate at a lower temperature than necessary increasing compressor power. If the heat exchanging surfaces of the condenser in a refrigeration system of any size are not clean, the condenser is forced to operate at a higher temperature than necessary increasing compressor power. In small systems using air, dust and other contaminants accumulate, while in large liquid systems regular maintenance is required to avoid excessive fouling of exchange surfaces.
Provide cooler air to the condensers
Rooftop cooling units containing compressors and condensers generally draw air from close to the rooftop. Cooler air may be available, as close as 4 to 5 feet high off the roof. Cooler air may allow the compressors to operate more efficiently.
Minimize Head Pressure Control (HPC)
With HPC condensing temperature is not allowed to drop with outdoor cooler conditions. Without HPC the system takes advantage of cooler condensing conditions (winter). May require an electronic or balance port expansion valve or, in some cases controls may be simply reset. Savings of 20-40% of operating power/energy. Check with your refrigeration expert before proceeding!
Module 9: Energy Efficiency in Building Thermal Systems
Page 9.38 Building Energy Auditing Course
Capacity Control
Avoid Hot Gas Bypass since it places an artificial load on the system during times of low refrigeration requirement, rather than reducing the system capacity. A bypassed system can consume 25-40% of full power while doing very little useful refrigeration. Unload compressor(s). Sequence Off-Line / Stage Units - this will require a control system. Consider Variable Speed Drives
Defrost Management
Electric heat or hot gas may be used. Check the method of initiation (timed vs. need) and the method of termination (timed vs. need). Reduce or eliminate the need for defrosting; raise the evaporator temperature above 32F - no frost. This strategy can give double savings: it eliminates the heat required for defrost and reduces the cooling required to move the ―defrost heat‖ out of the refrigerated space. Check with your refrigeration expert before proceeding!
9.2.5 Cooling Plant – Chillers
Mechanical refrigeration, as discussed in the previous section, is not the only way, and may not be the most common way, to cool buildings in South Africa. Various configurations of chillers together in some cases with cooling towers, are also used, and typically these offer significant opportunities for energy reduction through technological or operational changes.
For those who wish a review of the principles of chillers, an on-line discussion of is available at http://tristate.apogee.net/cool/cxc.asp.
For example, absorption chillers use a heat-driven concentration difference in a refrigerant solution to move refrigerant vapors (usually water) from an evaporator (where energy is absorbed from the building) to the condenser (where energy is discharged to the outside environment). The high concentration side of the cycle absorbs refrigerant vapors (which, of course, dilutes that material). Heat is then used to drive off these refrigerant vapors thereby increasing the concentration again. Lithium bromide is the most common absorbent used in commercial cooling equipment, with water used as the refrigerant. Smaller absorption chillers sometimes use water as the absorbent and ammonia as the refrigerant. The absorption chiller must operate at very low pressures (about l/l00th of normal atmospheric pressure) for the water to vaporize at a cold enough temperature (e.g., at ~ 40°C) to produce 7°C chilled water. Maintenance considerations with absorption chillers include the various mechanical components, heat transfer components, and controls. All three areas need to be assessed to determine the opportunities for efficiency improvements. 9.2.5.1 Chiller Efficiency (Source: http://tristate.apogee.net/cool/cfsc.asp) Older chillers can be quite inefficient. In fact, some chiller replacements will pay back quite quickly just due to significantly reduced operating cost at the higher efficiency of the new unit. For analysis purposes, chillers are typically compared on the basis of their ARI Standard Rating - Water cooled, using 7°C leaving chilled water and 30°C inlet condenser water. All chillers require electric power to operate their auxiliaries (solution, refrigerant, and lube pumps, controls, and so on). These energy costs must be included in the economic comparison, as well as the cost of water required for the cooling tower. The chilled water
Module 9: Energy Efficiency in Building Electrical Systems
Building Energy Auditing Course Page 9.39
pump consumption of electricity is common to all chillers, so this power input can be either included or omitted since it almost never affects the outcome of the analysis.
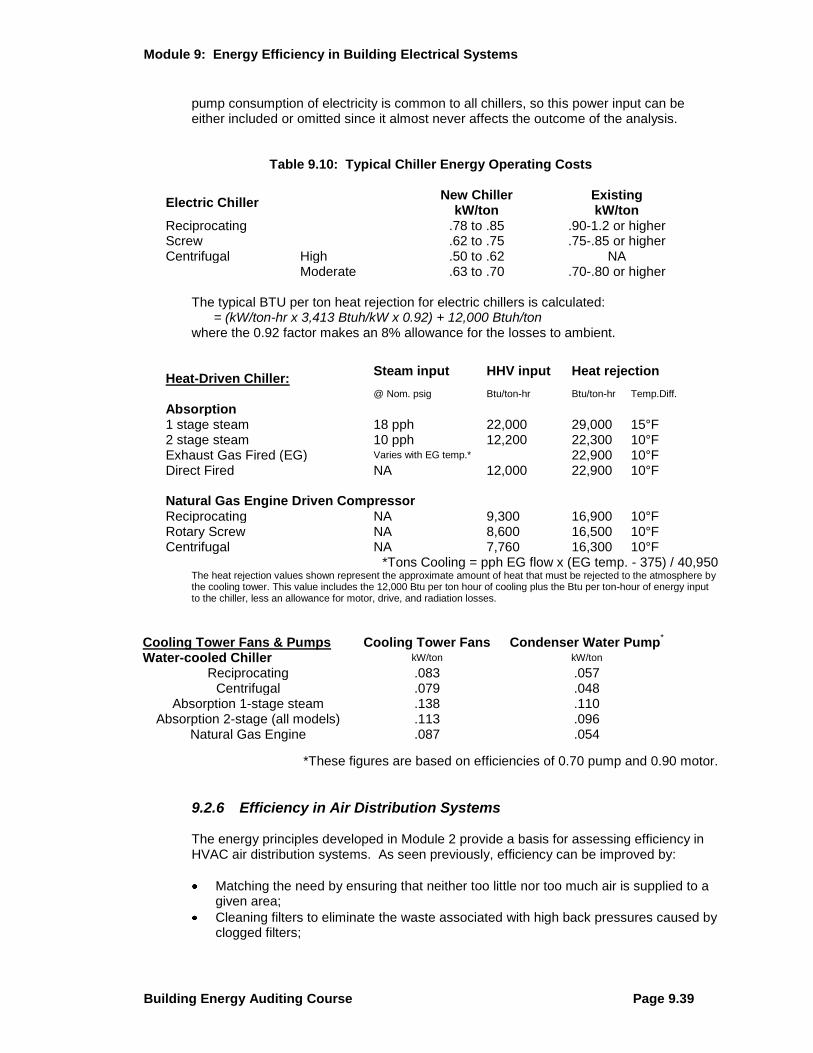
Table 9.10: Typical Chiller Energy Operating Costs
Electric Chiller New Chiller
kW/ton Existing kW/ton
Reciprocating .78 to .85 .90-1.2 or higher Screw .62 to .75 .75-.85 or higher Centrifugal High .50 to .62 NA
Moderate .63 to .70 .70-.80 or higher
The typical BTU per ton heat rejection for electric chillers is calculated: = (kW/ton-hr x 3,413 Btuh/kW x 0.92) + 12,000 Btuh/ton where the 0.92 factor makes an 8% allowance for the losses to ambient.
Heat-Driven Chiller:
Steam input HHV input Heat rejection
@ Nom. psig Btu/ton-hr Btu/ton-hr Temp.Diff.
Absorption
1 stage steam 18 pph 22,000 29,000 15°F
2 stage steam 10 pph 12,200 22,300 10°F
Exhaust Gas Fired (EG) Varies with EG temp.* 22,900 10°F
Direct Fired NA 12,000 22,900 10°F
Natural Gas Engine Driven Compressor Reciprocating NA 9,300 16,900 10°F
Rotary Screw NA 8,600 16,500 10°F
Centrifugal NA 7,760 16,300 10°F
*Tons Cooling = pph EG flow x (EG temp. - 375) / 40,950 The heat rejection values shown represent the approximate amount of heat that must be rejected to the atmosphere by the cooling tower. This value includes the 12,000 Btu per ton hour of cooling plus the Btu per ton-hour of energy input to the chiller, less an allowance for motor, drive, and radiation losses.
Cooling Tower Fans & Pumps Cooling Tower Fans Condenser Water Pump*
Water-cooled Chiller kW/ton kW/ton
Reciprocating .083 .057 Centrifugal .079 .048
Absorption 1-stage steam .138 .110 Absorption 2-stage (all models) .113 .096
Natural Gas Engine .087 .054
*These figures are based on efficiencies of 0.70 pump and 0.90 motor.
9.2.6 Efficiency in Air Distribution Systems
The energy principles developed in Module 2 provide a basis for assessing efficiency in HVAC air distribution systems. As seen previously, efficiency can be improved by:
Matching the need by ensuring that neither too little nor too much air is supplied to a given area;
Cleaning filters to eliminate the waste associated with high back pressures caused by clogged filters;
Module 9: Energy Efficiency in Building Thermal Systems
Page 9.40 Building Energy Auditing Course
Cleaning ventilation ducts to eliminate the additional flow resistance caused by dirt deposits;
Optimizing efficiency by using fan speed control to regulate air flow rather than dampers.
9.2.7 Waste Heat Recovery
This section provides a general introduction to the various heat recovery methods and technologies. Heat recovery constitutes an optimization of the supply of thermal energy. Figure 9.15 shows a simple energy flow diagram of a facility with a number of energy outflows identified. These energy flows are termed waste energy flows since they are no longer required by the process discharging them. But, they may be useful to another process or energy consuming system.
Figure 9.15: Simple Waste Heat Recovery Examples
Matching waste energy streams to potential uses involves answering some key questions: What waste heat sources are available?
What quantity of heat (energy) is available? At what temperature is the heat available?
Where can the heat be used?
How much energy is required and at what temperature? What is the time coincidence between waste and use? At what location is the heat required?
What is the practical recovery rate - what portion of the waste heat may be
used? The existence of a "waste" energy stream from one process, may provide an opportunity for using the leftover lower-temperature energy in another process. As dictated by basic
Intake (make-up)Air Flow
Outside (lower)Temperature
Inside (higher)Temperature
(B) Internal Heat Gain Exhaust
Heat Direct from Fuel
(A) HeatedVentilation
Boiler
This is arecoverableenergy flow.
―Waste Heat‖Exhaust Air Flow
Hot Flue Gases
Hot Waterto Drain
This is arecoverableenergy flow.
This is arecoverableenergy flow.
FuelEnergy In
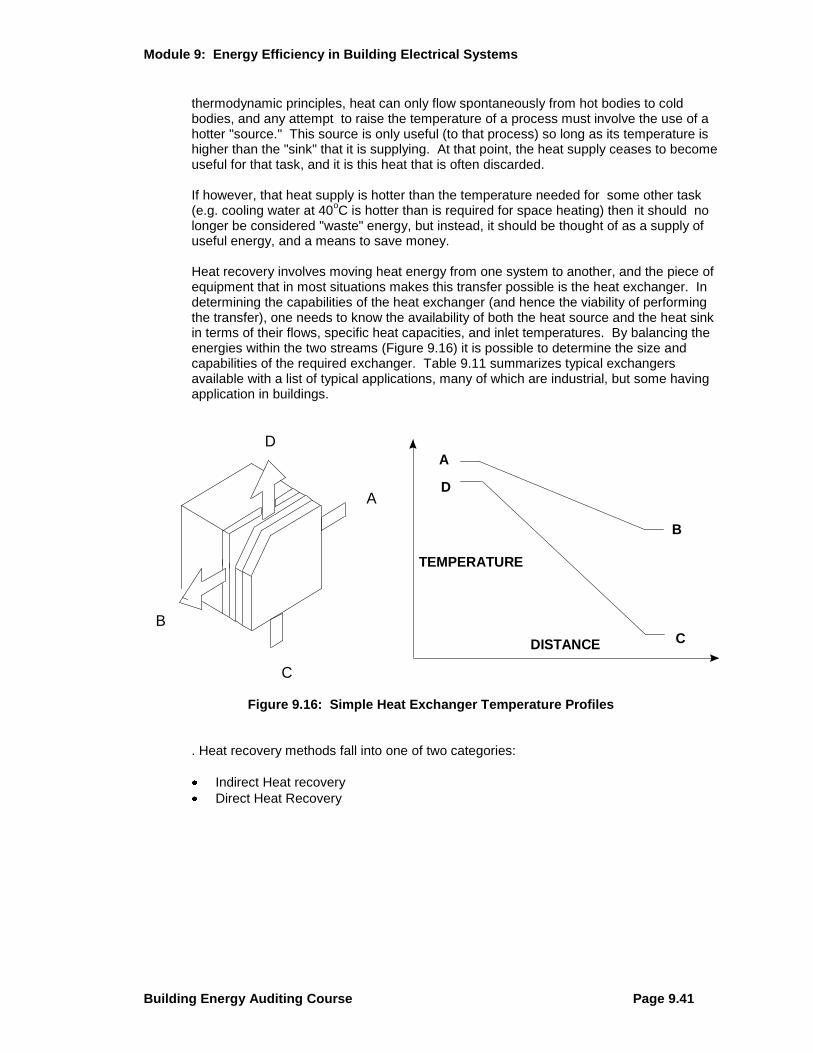
Module 9: Energy Efficiency in Building Electrical Systems
Building Energy Auditing Course Page 9.41
thermodynamic principles, heat can only flow spontaneously from hot bodies to cold bodies, and any attempt to raise the temperature of a process must involve the use of a hotter "source." This source is only useful (to that process) so long as its temperature is higher than the "sink" that it is supplying. At that point, the heat supply ceases to become useful for that task, and it is this heat that is often discarded. If however, that heat supply is hotter than the temperature needed for some other task (e.g. cooling water at 40
oC is hotter than is required for space heating) then it should no
longer be considered "waste" energy, but instead, it should be thought of as a supply of useful energy, and a means to save money. Heat recovery involves moving heat energy from one system to another, and the piece of equipment that in most situations makes this transfer possible is the heat exchanger. In determining the capabilities of the heat exchanger (and hence the viability of performing the transfer), one needs to know the availability of both the heat source and the heat sink in terms of their flows, specific heat capacities, and inlet temperatures. By balancing the energies within the two streams (Figure 9.16) it is possible to determine the size and capabilities of the required exchanger. Table 9.11 summarizes typical exchangers available with a list of typical applications, many of which are industrial, but some having application in buildings.
Figure 9.16: Simple Heat Exchanger Temperature Profiles
. Heat recovery methods fall into one of two categories:
Indirect Heat recovery
Direct Heat Recovery
A
B
C
D
TEMPERATURE
DISTANCE
D
C
B
A
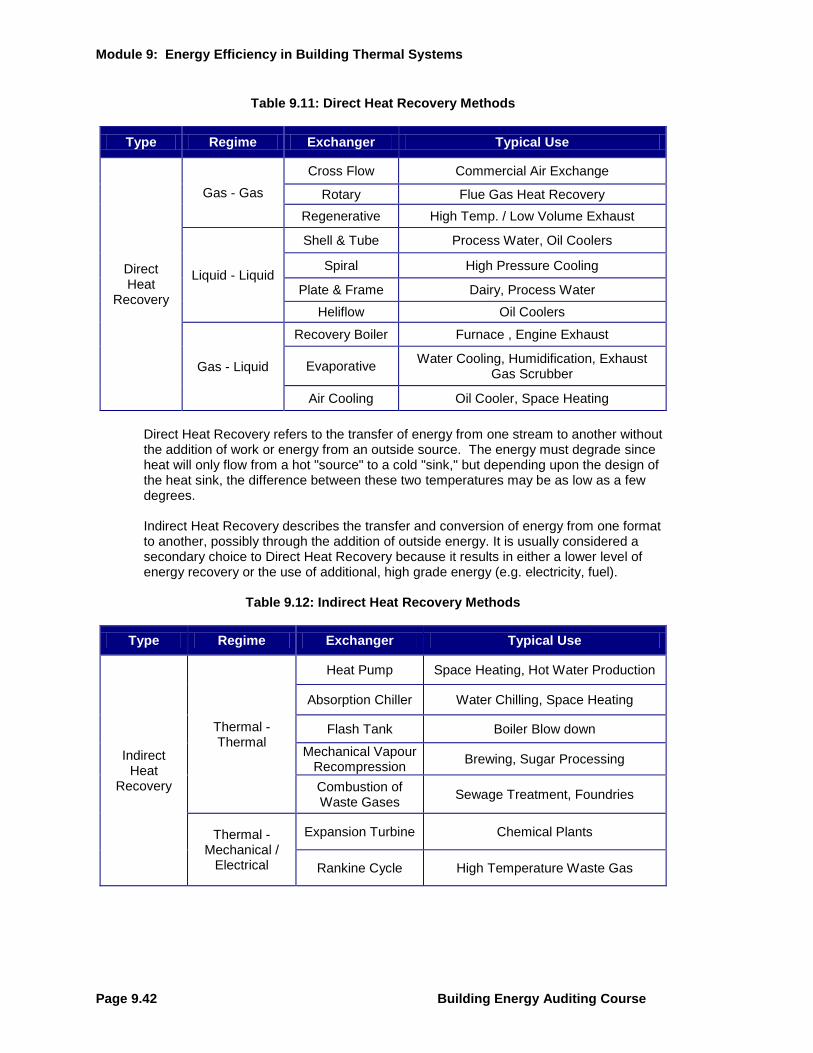
Module 9: Energy Efficiency in Building Thermal Systems
Page 9.42 Building Energy Auditing Course
Table 9.11: Direct Heat Recovery Methods
Type Regime Exchanger Typical Use
Direct Heat
Recovery
Gas - Gas
Cross Flow Commercial Air Exchange
Rotary Flue Gas Heat Recovery
Regenerative High Temp. / Low Volume Exhaust
Liquid - Liquid
Shell & Tube Process Water, Oil Coolers
Spiral High Pressure Cooling
Plate & Frame Dairy, Process Water
Heliflow Oil Coolers
Gas - Liquid
Recovery Boiler Furnace , Engine Exhaust
Evaporative Water Cooling, Humidification, Exhaust
Gas Scrubber
Air Cooling Oil Cooler, Space Heating
Direct Heat Recovery refers to the transfer of energy from one stream to another without the addition of work or energy from an outside source. The energy must degrade since heat will only flow from a hot "source" to a cold "sink," but depending upon the design of the heat sink, the difference between these two temperatures may be as low as a few degrees. Indirect Heat Recovery describes the transfer and conversion of energy from one format to another, possibly through the addition of outside energy. It is usually considered a secondary choice to Direct Heat Recovery because it results in either a lower level of energy recovery or the use of additional, high grade energy (e.g. electricity, fuel).
Table 9.12: Indirect Heat Recovery Methods
Type Regime Exchanger Typical Use
Indirect Heat
Recovery
Thermal - Thermal
Heat Pump Space Heating, Hot Water Production
Absorption Chiller Water Chilling, Space Heating
Flash Tank Boiler Blow down
Mechanical Vapour Recompression
Brewing, Sugar Processing
Combustion of Waste Gases
Sewage Treatment, Foundries
Thermal - Mechanical /
Electrical
Expansion Turbine Chemical Plants
Rankine Cycle High Temperature Waste Gas
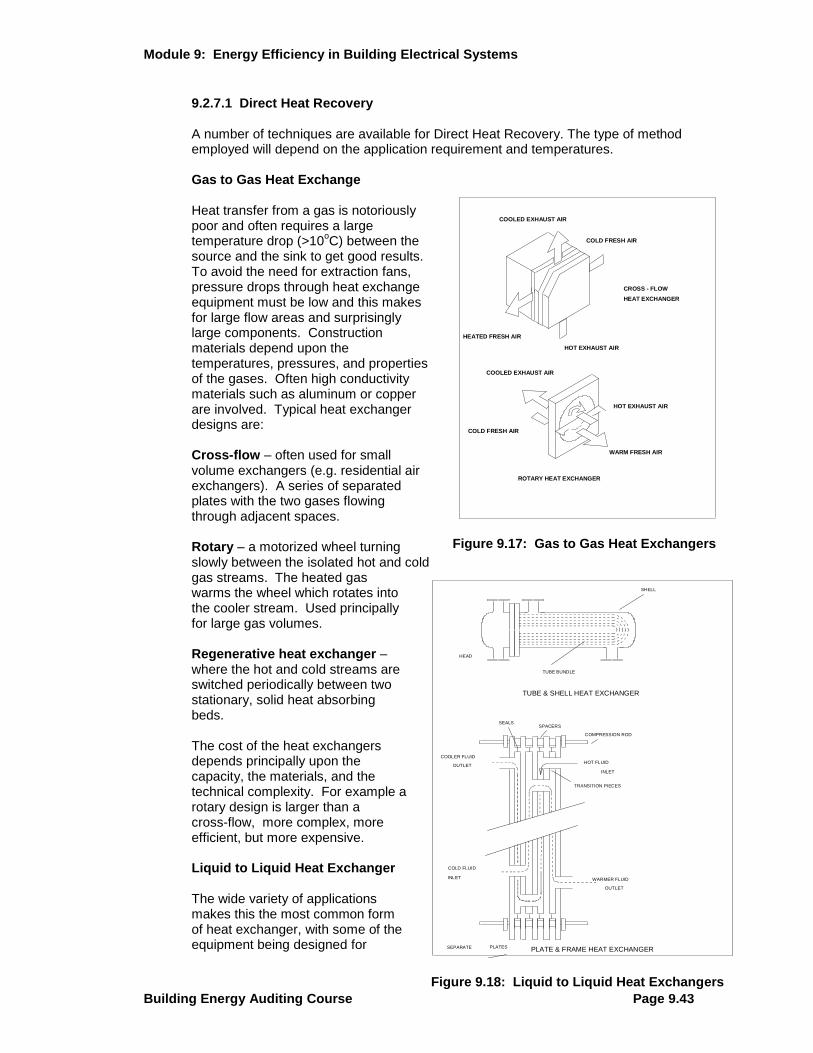
Module 9: Energy Efficiency in Building Electrical Systems
Building Energy Auditing Course Page 9.43
9.2.7.1 Direct Heat Recovery A number of techniques are available for Direct Heat Recovery. The type of method employed will depend on the application requirement and temperatures.
Gas to Gas Heat Exchange
Heat transfer from a gas is notoriously poor and often requires a large temperature drop (>10
oC) between the
source and the sink to get good results. To avoid the need for extraction fans, pressure drops through heat exchange equipment must be low and this makes for large flow areas and surprisingly large components. Construction materials depend upon the temperatures, pressures, and properties of the gases. Often high conductivity materials such as aluminum or copper are involved. Typical heat exchanger designs are: Cross-flow – often used for small volume exchangers (e.g. residential air exchangers). A series of separated plates with the two gases flowing through adjacent spaces.
Rotary – a motorized wheel turning slowly between the isolated hot and cold gas streams. The heated gas warms the wheel which rotates into the cooler stream. Used principally for large gas volumes.
Regenerative heat exchanger – where the hot and cold streams are switched periodically between two stationary, solid heat absorbing beds. The cost of the heat exchangers depends principally upon the capacity, the materials, and the technical complexity. For example a rotary design is larger than a cross-flow, more complex, more efficient, but more expensive. Liquid to Liquid Heat Exchanger The wide variety of applications makes this the most common form of heat exchanger, with some of the equipment being designed for
HOT EXHAUST AIR
COOLED EXHAUST AIR
COLD FRESH AIR
HEATED FRESH AIR
CROSS - FLOW
HEAT EXCHANGER
HOT EXHAUST AIR
COOLED EXHAUST AIR
COLD FRESH AIR
WARM FRESH AIR
ROTARY HEAT EXCHANGER
Figure 9.17: Gas to Gas Heat Exchangers
HEAD
SHELL
TUBE BUNDLE
TUBE & SHELL HEAT EXCHANGER
HOT FLUID
COLD FLUID
INLET
OUTLET
WARMER FLUID
COOLER FLUID
PLATES PLATE & FRAME HEAT EXCHANGER
INLET
OUTLET
SEALS
TRANSITION PIECES
COMPRESSION ROD
SPACERS
SEPARATE
Figure 9.18: Liquid to Liquid Heat Exchangers
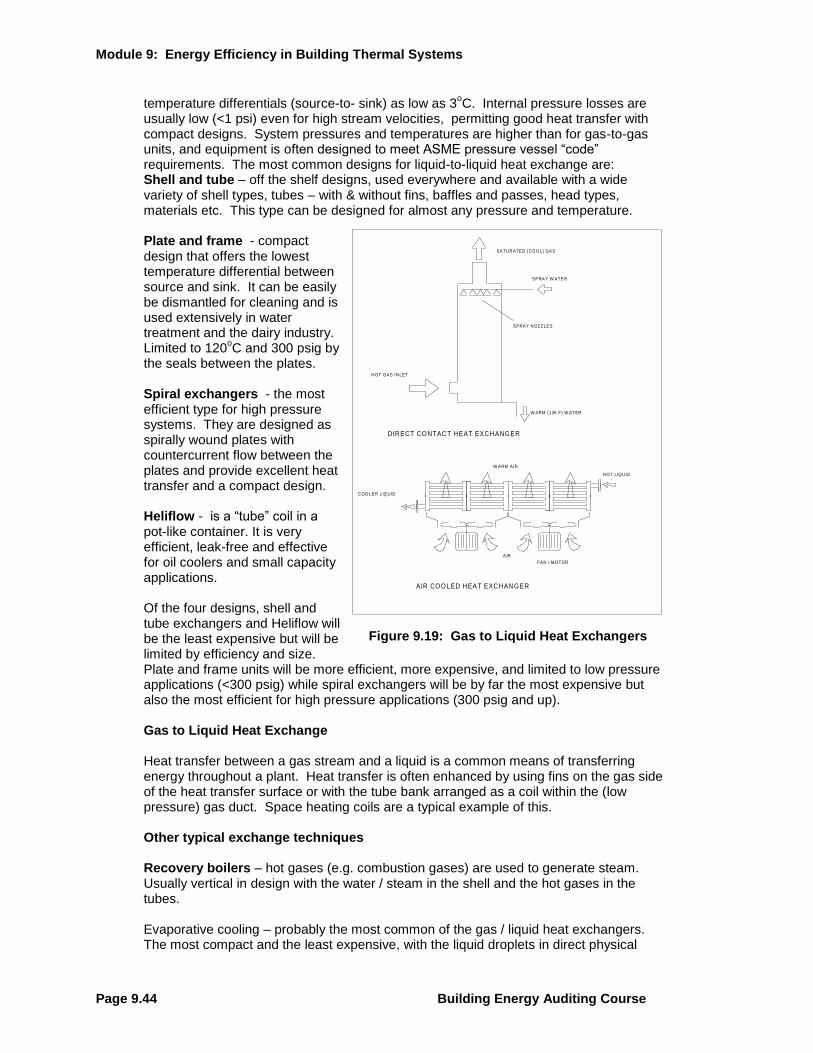
Module 9: Energy Efficiency in Building Thermal Systems
Page 9.44 Building Energy Auditing Course
temperature differentials (source-to- sink) as low as 3oC. Internal pressure losses are
usually low (<1 psi) even for high stream velocities, permitting good heat transfer with compact designs. System pressures and temperatures are higher than for gas-to-gas units, and equipment is often designed to meet ASME pressure vessel ―code‖ requirements. The most common designs for liquid-to-liquid heat exchange are: Shell and tube – off the shelf designs, used everywhere and available with a wide variety of shell types, tubes – with & without fins, baffles and passes, head types, materials etc. This type can be designed for almost any pressure and temperature.
Plate and frame - compact design that offers the lowest temperature differential between source and sink. It can be easily be dismantled for cleaning and is used extensively in water treatment and the dairy industry. Limited to 120
oC and 300 psig by
the seals between the plates.
Spiral exchangers - the most efficient type for high pressure systems. They are designed as spirally wound plates with countercurrent flow between the plates and provide excellent heat transfer and a compact design. Heliflow - is a ―tube‖ coil in a pot-like container. It is very efficient, leak-free and effective for oil coolers and small capacity applications. Of the four designs, shell and tube exchangers and Heliflow will be the least expensive but will be limited by efficiency and size. Plate and frame units will be more efficient, more expensive, and limited to low pressure applications (<300 psig) while spiral exchangers will be by far the most expensive but also the most efficient for high pressure applications (300 psig and up).
Gas to Liquid Heat Exchange
Heat transfer between a gas stream and a liquid is a common means of transferring energy throughout a plant. Heat transfer is often enhanced by using fins on the gas side of the heat transfer surface or with the tube bank arranged as a coil within the (low pressure) gas duct. Space heating coils are a typical example of this.
Other typical exchange techniques
Recovery boilers – hot gases (e.g. combustion gases) are used to generate steam. Usually vertical in design with the water / steam in the shell and the hot gases in the tubes. Evaporative cooling – probably the most common of the gas / liquid heat exchangers. The most compact and the least expensive, with the liquid droplets in direct physical
H OT GAS IN LET
SPRAY W ATER
SPRAY N OZZLES
W ARM (136 F) W ATER
SATU R ATED (CO O L) GAS
DIR ECT CONTAC T H EAT EXCH ANGER
AIR
FAN / MO TOR
W ARM AIR
H OT LIQ UID
C OO LER LIQ UID
AIR COOLED HEA T EXC HAN GER
Figure 9.19: Gas to Liquid Heat Exchangers
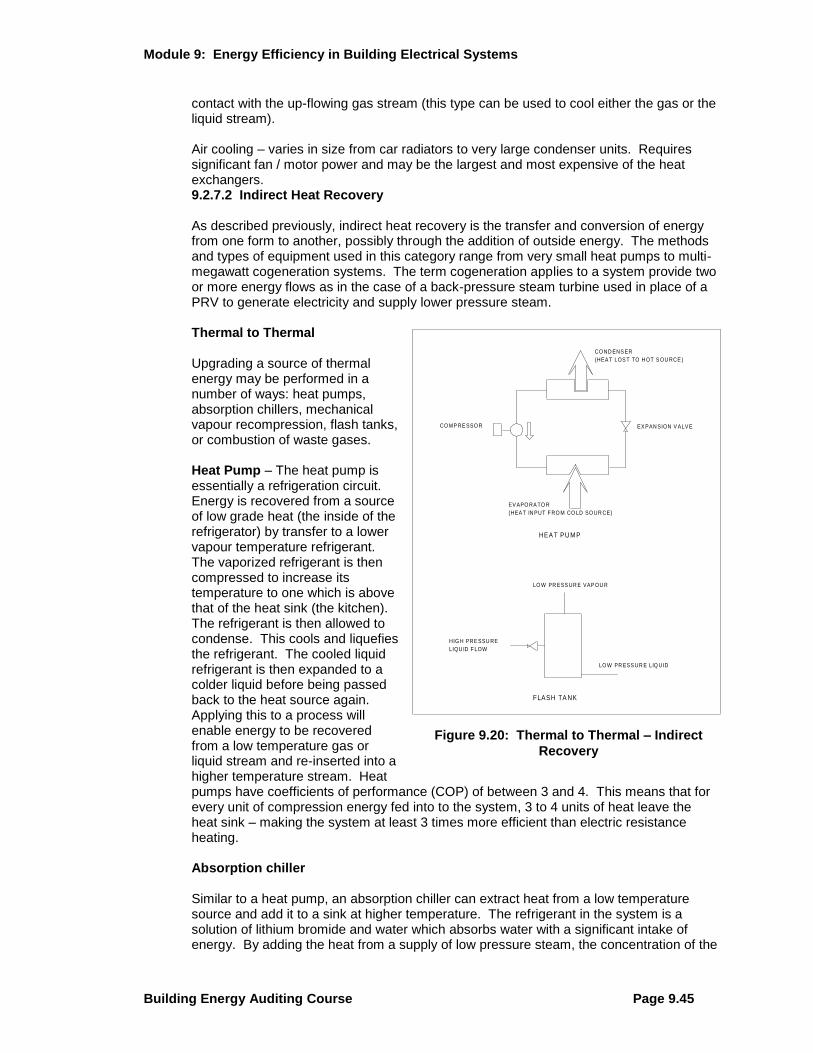
Module 9: Energy Efficiency in Building Electrical Systems
Building Energy Auditing Course Page 9.45
contact with the up-flowing gas stream (this type can be used to cool either the gas or the liquid stream).
Air cooling – varies in size from car radiators to very large condenser units. Requires significant fan / motor power and may be the largest and most expensive of the heat exchangers. 9.2.7.2 Indirect Heat Recovery
As described previously, indirect heat recovery is the transfer and conversion of energy from one form to another, possibly through the addition of outside energy. The methods and types of equipment used in this category range from very small heat pumps to multi-megawatt cogeneration systems. The term cogeneration applies to a system provide two or more energy flows as in the case of a back-pressure steam turbine used in place of a PRV to generate electricity and supply lower pressure steam.
Thermal to Thermal
Upgrading a source of thermal energy may be performed in a number of ways: heat pumps, absorption chillers, mechanical vapour recompression, flash tanks, or combustion of waste gases. Heat Pump – The heat pump is essentially a refrigeration circuit. Energy is recovered from a source of low grade heat (the inside of the refrigerator) by transfer to a lower vapour temperature refrigerant. The vaporized refrigerant is then compressed to increase its temperature to one which is above that of the heat sink (the kitchen). The refrigerant is then allowed to condense. This cools and liquefies the refrigerant. The cooled liquid refrigerant is then expanded to a colder liquid before being passed back to the heat source again. Applying this to a process will enable energy to be recovered from a low temperature gas or liquid stream and re-inserted into a higher temperature stream. Heat pumps have coefficients of performance (COP) of between 3 and 4. This means that for every unit of compression energy fed into to the system, 3 to 4 units of heat leave the heat sink – making the system at least 3 times more efficient than electric resistance heating.
Absorption chiller Similar to a heat pump, an absorption chiller can extract heat from a low temperature source and add it to a sink at higher temperature. The refrigerant in the system is a solution of lithium bromide and water which absorbs water with a significant intake of energy. By adding the heat from a supply of low pressure steam, the concentration of the
EV APO RA TO R
(HEA T IN PUT F RO M CO LD SO UR CE)
CO ND ENS ER
(HEA T LOS T TO H OT S OU RCE )
CO MP RE SSO R EX PAN SION V ALV E
HEA T PU M P
HIG H PRE SSU RE
LIQU ID F LOW
LO W PR ESS UR E VAP OU R
LO W PR ESS UR E LIQ UID
FLASH TA NK
Figure 9.20: Thermal to Thermal – Indirect
Recovery
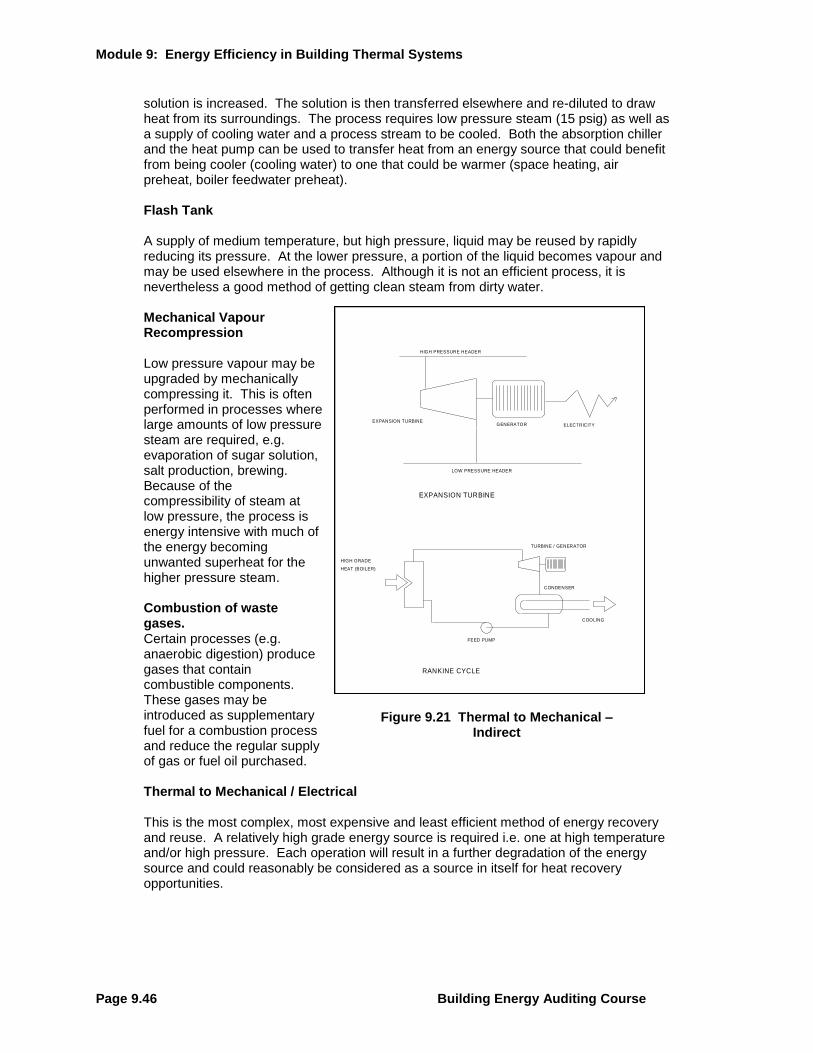
Module 9: Energy Efficiency in Building Thermal Systems
Page 9.46 Building Energy Auditing Course
solution is increased. The solution is then transferred elsewhere and re-diluted to draw heat from its surroundings. The process requires low pressure steam (15 psig) as well as a supply of cooling water and a process stream to be cooled. Both the absorption chiller and the heat pump can be used to transfer heat from an energy source that could benefit from being cooler (cooling water) to one that could be warmer (space heating, air preheat, boiler feedwater preheat). Flash Tank A supply of medium temperature, but high pressure, liquid may be reused by rapidly reducing its pressure. At the lower pressure, a portion of the liquid becomes vapour and may be used elsewhere in the process. Although it is not an efficient process, it is nevertheless a good method of getting clean steam from dirty water. Mechanical Vapour Recompression Low pressure vapour may be upgraded by mechanically compressing it. This is often performed in processes where large amounts of low pressure steam are required, e.g. evaporation of sugar solution, salt production, brewing. Because of the compressibility of steam at low pressure, the process is energy intensive with much of the energy becoming unwanted superheat for the higher pressure steam. Combustion of waste gases. Certain processes (e.g. anaerobic digestion) produce gases that contain combustible components. These gases may be introduced as supplementary fuel for a combustion process and reduce the regular supply of gas or fuel oil purchased.
Thermal to Mechanical / Electrical This is the most complex, most expensive and least efficient method of energy recovery and reuse. A relatively high grade energy source is required i.e. one at high temperature and/or high pressure. Each operation will result in a further degradation of the energy source and could reasonably be considered as a source in itself for heat recovery opportunities.
HIGH PRESSURE HEADER
LOW PRESSURE HEADER
EXPANSION TURBINEGENERATOR ELECTRICITY
EXPANSION TURBINE
HIGH GRADE
HEAT (BOILER)
TURBINE / GENERATOR
CONDENSER
COOLING
FEED PUMP
RANKINE CYCLE
Figure 9.21 Thermal to Mechanical – Indirect
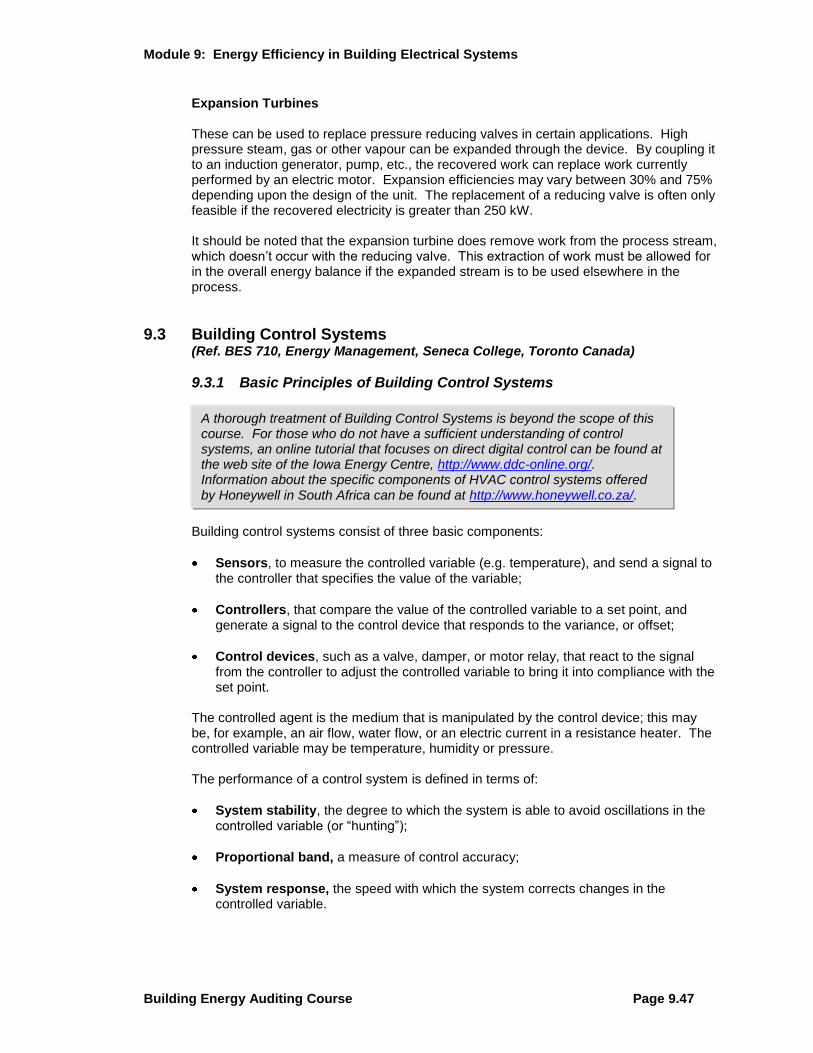
Module 9: Energy Efficiency in Building Electrical Systems
Building Energy Auditing Course Page 9.47
Expansion Turbines These can be used to replace pressure reducing valves in certain applications. High pressure steam, gas or other vapour can be expanded through the device. By coupling it to an induction generator, pump, etc., the recovered work can replace work currently performed by an electric motor. Expansion efficiencies may vary between 30% and 75% depending upon the design of the unit. The replacement of a reducing valve is often only feasible if the recovered electricity is greater than 250 kW. It should be noted that the expansion turbine does remove work from the process stream, which doesn’t occur with the reducing valve. This extraction of work must be allowed for in the overall energy balance if the expanded stream is to be used elsewhere in the process.
9.3 Building Control Systems (Ref. BES 710, Energy Management, Seneca College, Toronto Canada)
9.3.1 Basic Principles of Building Control Systems
Building control systems consist of three basic components:
Sensors, to measure the controlled variable (e.g. temperature), and send a signal to the controller that specifies the value of the variable;
Controllers, that compare the value of the controlled variable to a set point, and generate a signal to the control device that responds to the variance, or offset;
Control devices, such as a valve, damper, or motor relay, that react to the signal from the controller to adjust the controlled variable to bring it into compliance with the set point.
The controlled agent is the medium that is manipulated by the control device; this may be, for example, an air flow, water flow, or an electric current in a resistance heater. The controlled variable may be temperature, humidity or pressure. The performance of a control system is defined in terms of:
System stability, the degree to which the system is able to avoid oscillations in the controlled variable (or ―hunting‖);
Proportional band, a measure of control accuracy;
System response, the speed with which the system corrects changes in the controlled variable.
A thorough treatment of Building Control Systems is beyond the scope of this course. For those who do not have a sufficient understanding of control systems, an online tutorial that focuses on direct digital control can be found at the web site of the Iowa Energy Centre, http://www.ddc-online.org/. Information about the specific components of HVAC control systems offered by Honeywell in South Africa can be found at http://www.honeywell.co.za/.
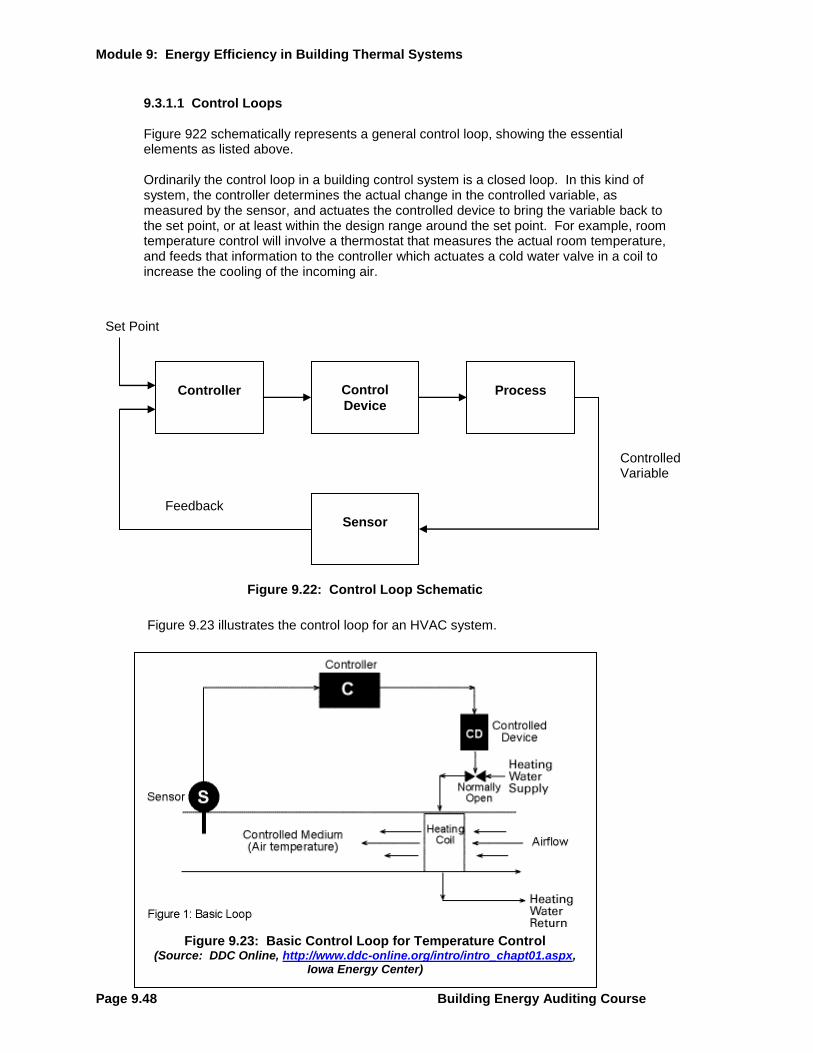
Module 9: Energy Efficiency in Building Thermal Systems
Page 9.48 Building Energy Auditing Course
9.3.1.1 Control Loops Figure 922 schematically represents a general control loop, showing the essential elements as listed above. Ordinarily the control loop in a building control system is a closed loop. In this kind of system, the controller determines the actual change in the controlled variable, as measured by the sensor, and actuates the controlled device to bring the variable back to the set point, or at least within the design range around the set point. For example, room temperature control will involve a thermostat that measures the actual room temperature, and feeds that information to the controller which actuates a cold water valve in a coil to increase the cooling of the incoming air.
Figure 9.23 illustrates the control loop for an HVAC system.
Controller
Sensor
Control
Device
Process
Set Point
Feedback
Controlled Variable
Figure 9.22: Control Loop Schematic
Figure 9.23: Basic Control Loop for Temperature Control
(Source: DDC Online, http://www.ddc-online.org/intro/intro_chapt01.aspx, Iowa Energy Center)
Module 9: Energy Efficiency in Building Electrical Systems
Building Energy Auditing Course Page 9.49
9.3.1.2 Control Actions The controlled device typically has either two-position action (i.e. on or off, open or closed), or proportional action (full range of position between the two extremes, in proportion to the offset of the measured variable from the set point). There are various algorithms that define the action of the controller in response to offset and time. 9.3.1.3 Components in HVAC Control Systems The following elaborates on the system components listed above:
Sensors
Two-position sensors include o Flow switches o Electric thermostats o Pressure switches o Relays which may be either pneumatic (i.e. powered by compressed air) or electric; they are used to turn on/off two-position devices, open/close two-position dampers in air distribution systems, or enable/disable specific types of control. Analog sensors provide a variable output depending on the conditions monitored. They also may be pneumatic or electric, and are used to sense temperature, pressure, humidity, flow and other specific variables. In DDC systems, the sensor provides information in digital form by means of an electronic communication system (a LAN). These sensors are used with any of the variables listed above, but obviously within an electronic DDC system.
Controllers
Controllers take the sensor signal, compare it with the set point, and regulate an output signal to the controlled device to cause control action. The types of controllers are:
o Electric/electronic controllers: for two-position control in which the controller output may be simply an electrical contact; or for proportional control in which the output is a continuous signal that positions an electrical actuator or control device; or for DDC in which the logic in a microprocessor translates sensor input into an appropriate output signal on the basis of a design algorithm.
o Pneumatic receiver/controllers: for proportional control in combination with
sensors that generate a variable air pressure output.
o Thermostats: these are a combination of sensor and controller, having set points, differentials and ranges, and providing a signal directly to some controlled device, such as a water valve in a duct coil; they may be electric or pneumatic, have proportional or two-position output and various other characteristics.
Control Devices
Control devices or actuators may be electric, pneumatic or system-powered. Examples include:
Module 9: Energy Efficiency in Building Thermal Systems
Page 9.50 Building Energy Auditing Course
o Solenoid: this device consists of a magnetic coil that operates a moving plunger, usually for two-position operation.
o Electric motor: the motor is used to operate a valve stem through a gear linkage
to increase or decrease flow.
o Pneumatic operator: this is a flexible diaphragm or bellows attached to a valve stem so that an increase in air pressure moves the valve stem and in so doing compresses a spring that opposes the movement; reduction of the air pressure enables the spring to move the valve stem in the opposite direction.
o Electric-hydraulic actuator: this is similar in principle to the pneumatic operator,
except that it uses an incompressible hydraulic fluid rather than compressed air as the actuating medium.
In HVAC systems, control devices are
control valves, typically controlling hot or cold water flow,
dampers, typically controlling air flow in an air handling system.
9.3.2 Efficiency from Control
The building control system is designed to conserve energy on the basis of four key principles: 1. Run equipment only when needed: for example, HVAC equipment operates only
during occupied periods, or in preparation for occupied periods; when heat is required in the building, set-back of the set point temperature reduces the internal temperature to a practical minimum. Makeup air from the outside is introduced only when the building is occupied in order to meet applicable ventilation standards (such as ASHRAE Standard 62-1981).
2. Sequence Heating and Cooling: avoiding simultaneous operation of heating and
cooling systems in the building is obviously a strategy for reducing energy waste; the design of building zones for the control system should eliminate simultaneous heating and cooling. Similarly, humidification and dehumidification should not be operating simultaneously.
3. Provide only the heating or cooling required: meeting the need is one of the
fundamental principles of energy efficiency; in the case of HVAC systems, this principle applies to proper setting and calibration of temperature control systems.
4. Supply heating and cooling from the most efficient source: optimizing the supply is
another fundamental principle of energy efficiency; in the case of HVAC, this may involve free cooling or the use of waste heat.
9.3.3 Control Applications
Building control or automation systems are used to improve building operation and comfort, increase building safety or security (as in the automatic control of lighting systems), and reduce operating costs, especially energy costs. Options for control include the following:
Module 9: Energy Efficiency in Building Electrical Systems
Building Energy Auditing Course Page 9.51
Programmed Start/Stop: this is simply a control logic that schedules the start and stop of equipment; the operating schedule optimize equipment use by allowing operation at appropriate times—for example, to avoid operation during times of peak electrical demand as part of a demand side management strategy.
Optimized Start/Stop: this control logic determines the best time to start pre-cooling or pre-heating of the building on the basis of current inside and outside conditions; the system also monitors temperatures to ensure that occupant comfort is optimized.
Duty cycling: scheduling to avoid the simultaneous operation of different sub-systems when their simultaneous operation is not required is another means of demand control.
Demand control: direct monitoring of system electrical demand and the shedding of specific loads that are not-essential is an important DSM strategy.
Temperature setback/setup: setback of temperatures during the heating season, or setup during the cooling season. when the building is unoccupied offers significant energy savings potential.
Alarms/monitoring: control software is available to initiate an alarm or specific action when a control limit has been exceeded.
Energy monitoring: building automation systems usually record and accumulate data on fuel and electricity consumption, which can be analysed with reference to key independent variables such as degree-days in order to assess building performance.
Optimized ventilation: fresh air intake and the blending of fresh air and return air can be controlled by measurement of indoor air contaminant levels (such as CO2) to reduce either the heating or cooling load.
Optimization of supply air temperature: energy consumption related to heating and cooling can be minimized by adjusting the temperature of supply air to the heating and cooling needs in the building.
Supply water optimization: in those systems where heating and cooling of the building is achieved by water coils in the supply air system, temperature control can be optimized by controlling not only the flow of water in the coil, but the temperature of the water; increasing the temperature of cooling water, for example, reduces losses that are proportional to the temperature difference between ambient and water in the water distribution system/
Chiller/boiler optimization: control can be exercised over chilled water temperature, or hot water temperature, at the source to achieve the supply water optimization described above.
Other control options: building automation systems can also achieve energy reductions through the control of:
o Interior and exterior lighting; o Domestic hot water temperature, matched to building demand; o Cistern flow optimization, to control the water flow to cistern-operated urinals to
match demand.