
Module 4: Operating Period - Electric Reliability Council ... Period Emergency Operation Conditions...
146
Module 4: Operating Period Module 4: Operating Period
-
Upload
truongtruc -
Category
Documents
-
view
221 -
download
1
Transcript of Module 4: Operating Period - Electric Reliability Council ... Period Emergency Operation Conditions...

Module 4: Operating PeriodModule 4: Operating Period

Module 4: The Operating Period
Course Modules:
Nodal Market Overview
Day-Ahead Operations
Module 1
Module 2 Day Ahead Operations
Adjustment Period
Module 2
Module 3
Operating Period
Emergency Operation Conditions
Module 4
Module 5
Performance MonitoringModule 6
Slide 2

Module Objectives
Upon completion of this module, you will be able to:
• Identify timeline & processes of Real-Time Operations
Explain Real Time Network Security Analysis &• Explain Real-Time Network Security Analysis &Security Constrained Economic Dispatch
Describe Load Frequency Control functions• Describe Load Frequency Control functions
• Explain Generation Ancillary Services deployments
• Explain Controllable Load & associated QSE responses
D ib b i R l Ti i i f ti
Slide 3
• Describe basic Real-Time pricing functions

Timeline
When does the Operating Period occur?
Slide 4

The Operating Period
1 Preparing for Real-Time Operations
2 SCED Energy Dispatch
p g p
3 Ancillary Service Deployment
4 Forced Outage Detection
5 ERCOT / Resource Communications
Slide 5
Generation Resource Settlement6

Real-Time Data Exchange
1 Preparing for Real-Time Operations
2 SCED Energy Dispatch
p g p
3 Ancillary Service Deployment
4 Forced Outage Detection
5 ERCOT / Resource Communications
Slide 6
Generation Resource Settlement6

ERCOT’s Role
ERCOT Real-Time Operations:
Matches Generation to Load• Resource OutagesResource Outages• Tracking Load• Energy Offer Curves &
Output SchedulesManages reliability of transmission system
• Transmission Outages• Weather Dynamic Ratings• Flow Constraints
Slide 7
• Flow Constraints• Voltage Control

Hourly Postings
At the beginning of each hour, ERCOT posts:posts:
• Changes in ERCOT system conditions• Updated system-wide Load Forecasts• Updated system-wide Load Forecasts• Updated Distribution factors• RMR deployments from the last hourp y• System demand, by Settlement Interval
Information is posted to the Market
Slide 8
Information System.

Impacts to QSEs
Information posted hourly to the MIS may impact QSEs in determining:determining:
• Resource offers and commitments• Capacity needs• Capacity needs• Obligation to provide MWs in Real-Time
Slide 9

Real-Time Data Exchange
Real-time data exchange between ERCOT and QSEs is required to maintain Real Time Operationsrequired to maintain Real-Time Operations.
Telemetry transmitted every 2 or 4 seconds via ICCP.
ICCPICCP
Slide 10

ATTACHMENT – ICCP Quality Codes
ICCP Quality Codes identify the source and quality of telemetry to QSEstelemetry to QSEs.
Normal SourceNormal SourceNormal SourceNormal Source
Current SourceCurrent Source
QualityQuality
N l V lN l V l
Slide 11
Normal ValueNormal Value

The AS Capacity Monitor
Inputs:AS Schedules & Responsibilities,
AS Capacity Monitor
Responsibilities, and Resource Net Power Limits
AS Capacity Monitor
Outputs:Regulation, RRS, & NSRS C it I f
Slide 12
NSRS Capacity Info

AS Capacity Output
Posted to the Market Information System:R i R C it• Responsive Reserve Capacity
• Non-Spinning Reserve Capacity • Amount of un-deployed Regulation Capacity• Amount of un-deployed Regulation Capacity
Slide 13

RT Energy Availability
Posted to the Market Information System:SCED U R• SCED Up Reserve• With Energy Offer Curves• Without Energy Offer Curves• Without Energy Offer Curves
• SCED Down Reserve• With Energy Offer Curvesgy• Without Energy Offer Curves
ERCOT uses Real-Time Energy Availability data for planning
Slide 14
Availability data for planning

Insufficient AS Capacity Scenario
Q: What happens if a Forced Outage impacts a QSE’s Ancillary Serviceimpacts a QSE’s Ancillary Service Obligations?
A:A:
AncillaryService
Slide 15
Obligation

Insufficient AS Capacity Scenario, cont’d
QSE Actions to Resolve a Reg-Up DeficitQSE Actions to Resolve a Reg-Up Deficit
Obtain from existing Resource
1
Impact
• Able to switch toanother of QSE’sanother of QSE s existing resources
• Cost change may be minimal
Slide 16

Insufficient AS Capacity Scenario, cont’d
QSE Actions to Resolve a Reg-Up DeficitQSE Actions to Resolve a Reg-Up Deficit
Obtain from other QSEs
Obtain from existing Resource
2ERCOT must approve theapprove the substitution
Impact
• Affects AS trade with QSE
• Able to switch toanother of QSE’s with QSE
• Private arrangement with another QSE determines cost
another of QSE s existing resources
• Cost change may be minimal
Slide 17

Insufficient AS Capacity Scenario, cont’d
QSE Actions to Resolve a Reg-Up Deficit
Notify ERCOT of inabilityto meet obligation
Obtain from other QSEs
Obtain from existing Resource
3
Impact
• Affects AS trade with QSE
• Able to switch toanother of QSE’s
• ERCOT chooses replacement optionwith QSE
• Private arrangement with another QSE determines cost
another of QSE s existing resources
• Cost change may be minimal
replacement option• Cost depends on
SASM
Slide 18

SCED Energy Dispatch
1 Preparing for Real-Time Operations
2 SCED Energy Dispatch
p g p
3 Ancillary Service Deployment
4 Forced Outage Detection
5 ERCOT / Resource Communications
Slide 19
Generation Resource Settlement6

Overview
OffersOffers Real-Time OperationsContingenciesContingencies
PricingPricing
ContingenciesContingencies
Real-TimeNetworkSecurityAnalysis
Topology &EquipmentTopology &Equipment
PricingPricingSecurity-
ConstrainedEconomicDispatchAnalysisEquipmentEquipment
DispatchInstructions
DispatchInstructions
Dispatch
ResourceLimit
ResourceLimit
TelemetryTelemetry
Slide 20
LimitCalculator
LimitCalculator
Forced Outage Detection
Forced Outage Detection
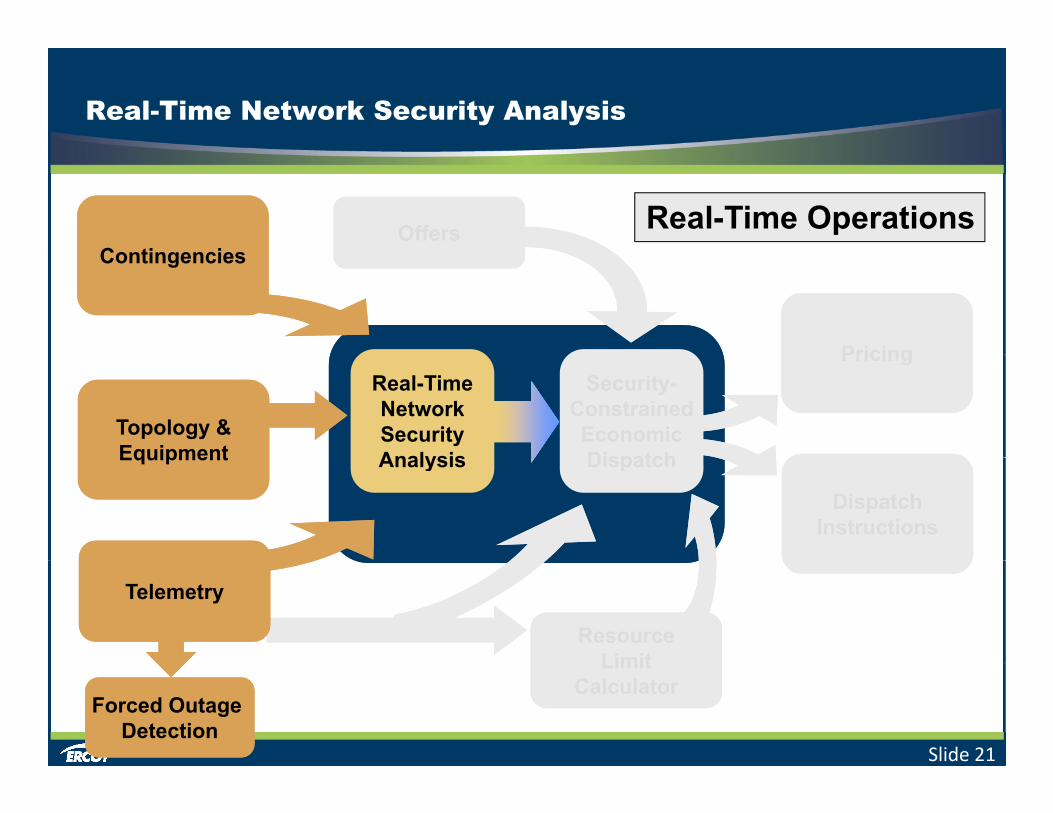
Real-Time Network Security Analysis
OffersOffers Real-Time OperationsContingenciesContingencies
PricingPricing
ContingenciesContingencies
Real-TimeNetworkSecurityAnalysis
Topology &EquipmentTopology &Equipment
PricingPricingSecurity-
ConstrainedEconomicDispatchAnalysisEquipmentEquipment
DispatchInstructions
DispatchInstructions
Dispatch
ResourceLimit
ResourceLimit
TelemetryTelemetry
Slide 21
LimitCalculator
LimitCalculator
Forced Outage Detection
Forced Outage Detection
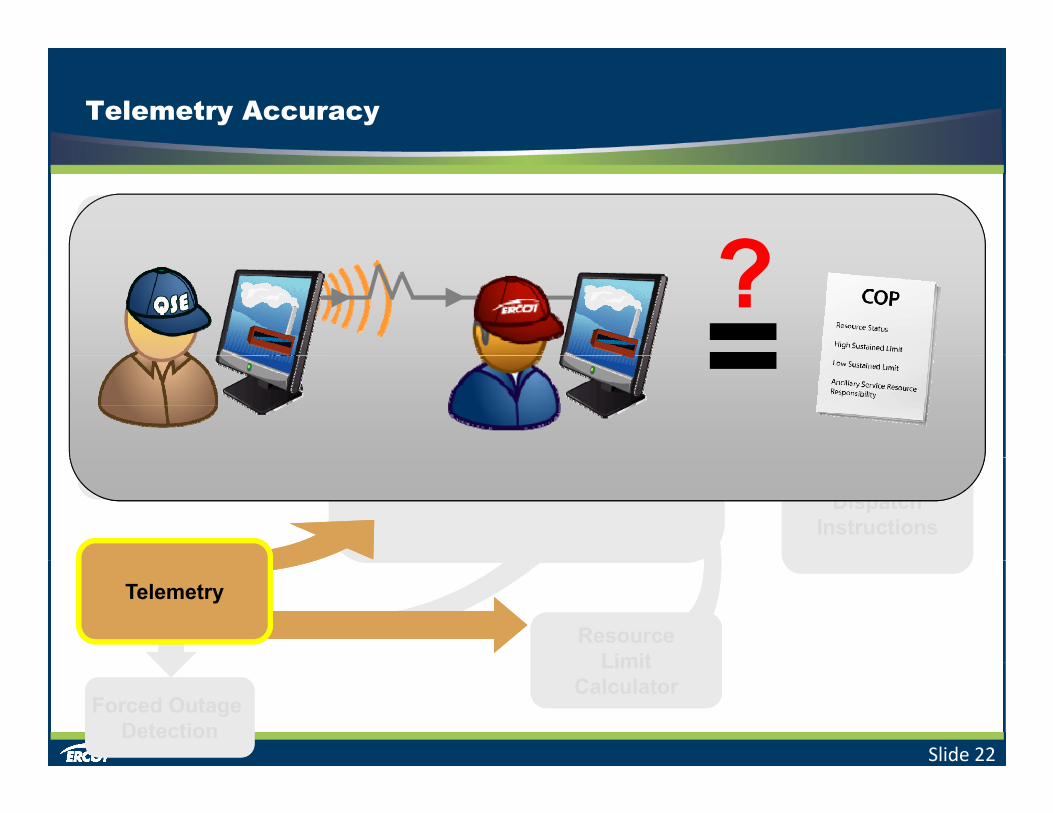
Telemetry Accuracy
OffersOffersContingenciesContingencies ?
PricingPricing
ContingenciesContingencies
=?Real-TimeNetworkSecurityAnalysis
Topology &EquipmentTopology &Equipment
PricingPricingSecurity-
ConstrainedEconomicDispatch
=AnalysisEquipmentEquipment
DispatchInstructions
DispatchInstructions
Dispatch
ResourceLimit
ResourceLimit
Telemetry
Slide 22
Forced Outage Detection
Forced Outage Detection
LimitCalculator
LimitCalculator
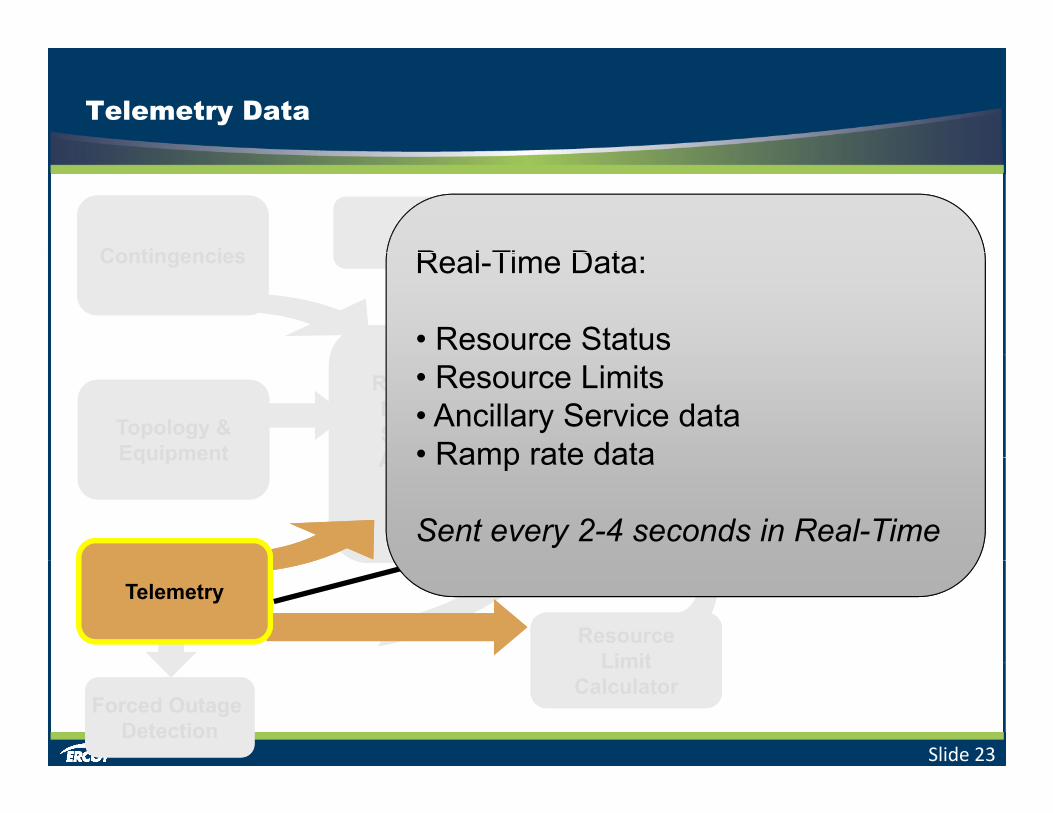
Telemetry Data
ContingenciesContingenciesOffersOffersR l Ti D tContingenciesContingencies
PricingPricing
Real-Time Data:
• Resource StatusReal-TimeNetworkSecurityAnalysis
Topology &EquipmentTopology &Equipment
PricingPricingSecurity-
ConstrainedEconomicDispatch
• Resource Limits• Ancillary Service data• Ramp rate dataAnalysisEquipmentEquipment
DispatchInstructions
DispatchInstructions
DispatchRamp rate data
Sent every 2-4 seconds in Real-Time
ResourceLimit
ResourceLimit
Telemetry
Slide 23
LimitCalculator
LimitCalculator
Forced Outage Detection
Forced Outage Detection

Constraints
OffersOffersContingenciesContingencies
PricingPricingReal-TimeNetworkSecurityAnalysis
Topology &EquipmentTopology &Equipment
PricingPricingSecurity-
ConstrainedEconomicDispatchAnalysisEquipmentEquipment
DispatchInstructions
DispatchInstructions
Dispatch
ResourceLimit
ResourceLimit
TelemetryTelemetry
Slide 24
LimitCalculator
LimitCalculator
Forced Outage Detection
Forced Outage Detection

State Estimator
OffersOffers State EstimatorContingenciesContingencies
PricingPricing
ContingenciesContingencies
Topology &EquipmentTopology &Equipment
PricingPricingSecurity-
ConstrainedEconomicDispatch
Real-TimeNetworkSecurityAnalysisEquipmentEquipment
DispatchInstructions
DispatchInstructions
DispatchAnalysis
ResourceLimit
ResourceLimit
TelemetryTelemetry
Slide 25
Forced Outage Detection
Forced Outage Detection
LimitCalculator
LimitCalculator

Topology Consistency Analyzer
OffersOffersTopology Consistency AnalyzerContingenciesContingencies
PricingPricing
ContingenciesContingencies
Real-TimeNetworkSecurityAnalysis
PricingPricingSecurity-
ConstrainedEconomicDispatch
Topology &EquipmentTopology &Equipment Analysis
DispatchInstructions
DispatchInstructions
DispatchEquipmentEquipment
ResourceLimit
ResourceLimit
TelemetryTelemetry
Slide 26
LimitCalculator
LimitCalculator
Forced Outage Detection
Forced Outage Detection

Security Constrained Economic Dispatch
Real-Time OperationsOffersOffersContingenciesContingencies
PricingPricing
ContingenciesContingencies
Real-TimeNetworkSecurityAnalysis
Topology &EquipmentTopology &Equipment
PricingPricingSecurity-
ConstrainedEconomicDispatchAnalysisEquipmentEquipment
DispatchInstructions
DispatchInstructions
Dispatch
ResourceLimit
ResourceLimit
TelemetryTelemetry
Slide 27
LimitCalculator
LimitCalculator
Forced Outage Detection
Forced Outage Detection

Resource Limit Calculator
OffersOffers Real-Time OperationsContingenciesContingencies
PricingPricing
ContingenciesContingencies
Real-TimeNetworkSecurityAnalysis
Topology &EquipmentTopology &Equipment
PricingPricingSecurity-
ConstrainedEconomicDispatchAnalysisEquipmentEquipment
DispatchInstructions
DispatchInstructions
Dispatch
ResourceLimit
TelemetryTelemetry
Slide 28
LimitCalculator
Forced Outage Detection
Forced Outage Detection

Current Telemetry
HSL
Telemetered by the QSE every
CurrentTelemetryy
few secondsTelemetry
Slide 29
LSL

The Ancillary Service Schedule
Telemetered to ERCOT in Real-Time.• Identifies current Ancillary Service commitments• Identifies current Ancillary Service commitments
• By AS Type• By Resourcey esou ce
AncillaryServiceSchedule
AncillaryServiceSchedule
AncillaryServiceAncillary
ServiceAncillaryScheduleScheduleServiceScheduleService
Schedule
Slide 30

Generation Resource Limits
HSLReg-Up,
RRS & Non-SpinHASL
RRS & Non-Spin
Derived from the Resource’s Ancillary
CurrentTelemetryResource s Ancillary
Service ScheduleTelemetry
LASLReg-Down
Slide 31
LSL

HASL
HASL = Current HSL – AS Schedule (Telemetered by
Reg-Up,RRS & Non-Spin
HSL
Schedule (Telemetered by QSE)
HASLRRS & Non-Spin
Resource Limits Calculator calculates Current
TelemetryHASL from QSE’s telemetered values
Telemetry
LASLReg-Down
Slide 32
LSL

LASL
LASL = Current LSL + AS Schedule (Telemetered by
Reg-Up,RRS & Non-Spin
HSL
Schedule (Telemetered by QSE)
HASLRRS & Non-Spin
CurrentTelemetryTelemetry
LASLReg-Down
Slide 33
LSL

Ramp Rates
SCED-Up Ramp Rate = ERCOT Registered Up Ramp
Reg-Up,RRS & Non-Spin
HSL
ERCOT-Registered Up Ramp Rate – AS Reg-Up Commitments
HASL
HDL
RRS & Non-Spin
Commitments
SCED-Down Ramp Rate =
HDL
CurrentTelemetrySCED-Down Ramp Rate =
ERCOT-Registered Down Ramp Rate – AS Reg-Down
LDL
Telemetry
p gCommitments LASL
Reg-Down
Slide 34
LSL

HDL & LDL
HDL = Current Telemetry + (Ramp Rate * 5 min )
Reg-Up,RRS & Non-Spin
HSL
(Ramp Rate * 5 min.)
HDL ≤ HASL
HASL
HDL
RRS & Non-Spin
HDL ≤ HASL
CBase Point
Region
HDL
CurrentTelemetryLDL = Current Telemetry -
(Ramp Rate * 5 min.)
g
LDL
Telemetry
LDL ≥ LASLLASL
Reg-Down
Slide 35
LSL

Impacts of Regulation
HDL
3 MW/ i 5 i 15 MW
+15 MW
3 MW/min * 5 min = 15 MW
Current
5 minutes
Current Operating
Point
Slide 36
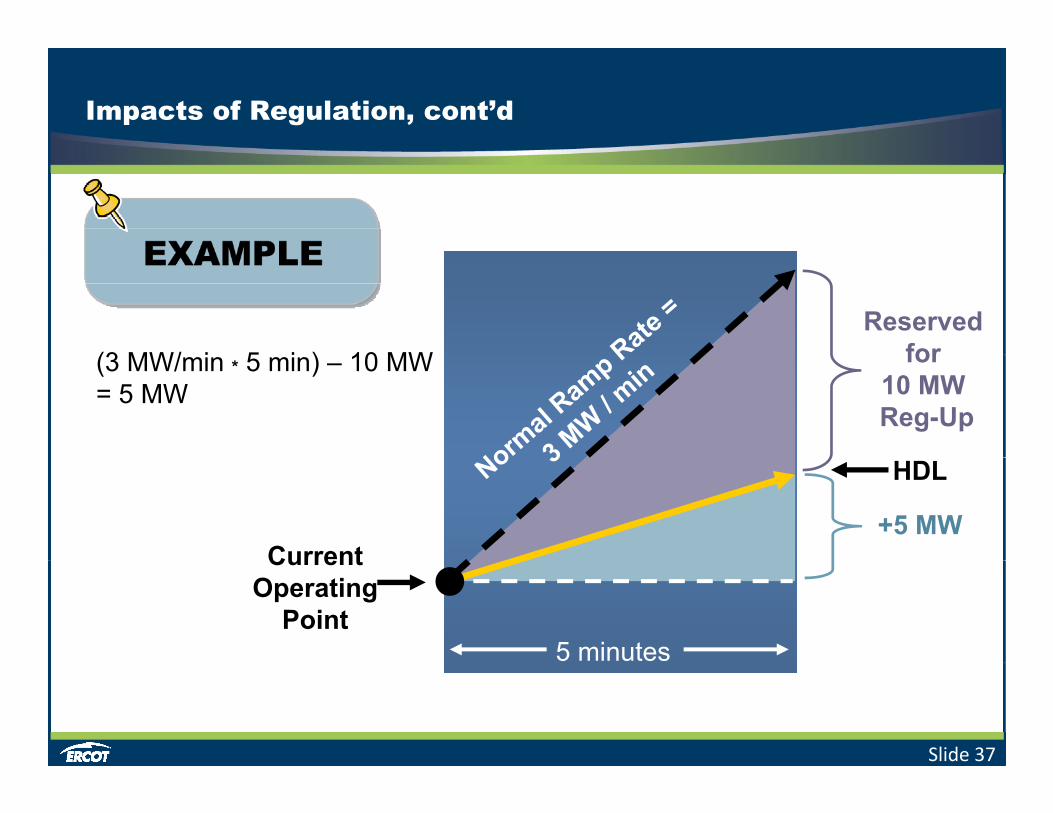
Impacts of Regulation, cont’d
Reserved for(3 MW/ i 5 i ) 10 MW for
10 MWReg-Up
(3 MW/min * 5 min) – 10 MW = 5 MW
+5 MW
HDL
Current
5 minutes
Current Operating
Point
Slide 37

Impacts of Regulation, cont’d
Reg–Up RequirementReg Up Requirementincreased to 15 Mw
What is the HDL?
Current Operating
Point5 minutes
Slide 38

Impacts of Regulation, cont’d
Reserved for 15 MW
Reg Up?
Reg-Up
Current Operating
Point5 minutes
Slide 39

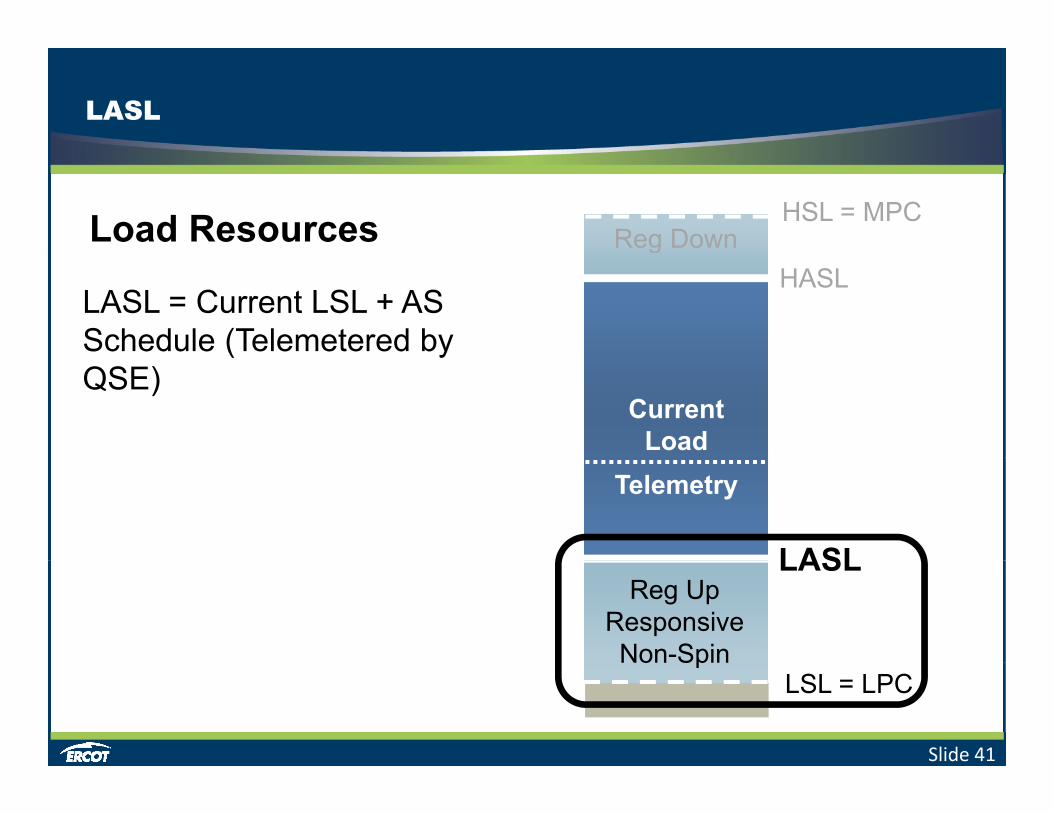
Load Resource Limits
HSL = MPCReg Down
LoadLoad Resources
HASLg
mpt
ion
Current Load
NormalLoadFluctuationDerived from the
Resource’s Ancillary ng C
onsu
mLASL
TelemetryResource s Ancillary
Service ScheduleIn
crea
sin
LASLReg Up
ResponsiveNon-Spin
Slide 40
LSL = LPCp
0
LASL
HSL = MPCReg DownLoad Resources
HASLg
LASL = Current LSL + AS Schedule (Telemetered by
Current Load
( yQSE)
LASL
Telemetry
LASLReg Up
ResponsiveNon-Spin
Slide 41
LSL = LPCp

HASL
HSL = MPCReg DownLoad Resources
HASLg
HASL = Current HSL – AS Schedule (Telemetered by
Current Load
( yQSE)
LASL
Telemetry
LASLReg Up
ResponsiveNon-Spin
Slide 42
LSL = LPCp

Load Fluctuation
HSL = MPCReg DownLoad Resources
HASLg
Normal Load fluctuation occurs between HASL &
Current Load
LASL
LASL
Telemetry
LASLReg Up
ResponsiveNon-Spin
Slide 43
LSL = LPCp

Generation Resource Example
HSL (100 MW)
G ti R
50 MW
Generation Resource
LSL (15 MW)5 minutes
Slide 44
5 minutes

Generation Resource Example, cont’d
HASL = HSL (100 MW)
HASL/LASL
50 MW
HASL/LASL = HSL/LSL ± AS Schedule
HASL = 100 MW – 0 MW = 100 MW = HSL
LASL 15 MW + 0 MW
5 minutesLASL = LSL (15 MW)
LASL = 15 MW + 0 MW = 15 MW = LSL
Slide 45
5 minutes (15 MW)

Generation Resource Example, cont’d
HASL = HSL (100 MW)
HDL (75 MW)HDL/LDL
50 MW
HDL/LDL = (Unit Ramp Rate x Interval Duration)+ Current Operating Point
LDL (25 MW)
+ Current Operating Point
HDL = (+5 MW/min x 5 min) + 50 MW = 75 MW
5 minutes
LDL (25 MW)
LASL = LSL (15 MW)
LDL = (-5 MW/min x 5 min) + 50 MW = 25 MW
Slide 46
5 minutes (15 MW)

Generation Resource Example, cont’d
HSL (100 MW)Reg-Up10 MW
50 MW
LSL (15 MW)5 minutes
Slide 47
5 minutes

Generation Resource Example, cont’d
HSL (100 MW)Reg-Up10 MW
HASL (90 MW)( )
HASL = 100 MW 10 MW
50 MW
HASL = 100 MW – 10 MW = 90 MW
5 minutesLASL = LSL (15 MW)
Slide 48
5 minutes (15 MW)

Generation Resource Example, cont’d
HSL (100 MW)Reg-Up10 MW
HASL (90 MW)( )
SCED Ramp Rate
50 MW
HDL (65 MW)SCED Ramp Rate = Unit Ramp Rate± (Regulation Up/Down÷ SCED interval)
LDL (25 MW)
SCED interval)
SCED Up Ramp Rate= 5 MW / min
(10 MW ÷ 5 i t )
5 minutes
LDL (25 MW)
LASL = LSL (15 MW)
- (10 MW ÷ 5 minutes)= 3 MW / min
HDL = (+3 MW/min x 5 min) +
Slide 49
5 minutes (15 MW)50 MW = 65 MW
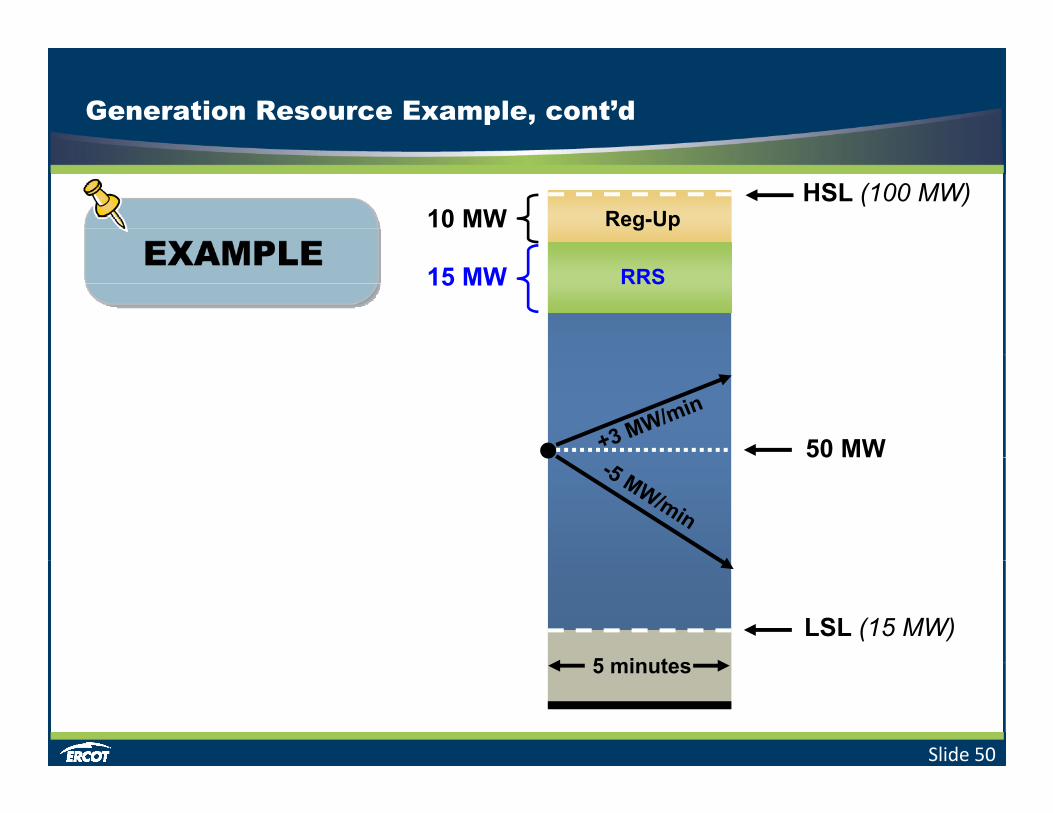
Generation Resource Example, cont’d
HSL (100 MW)Reg-Up10 MW
RRS15 MW
50 MW
5 minutes
LSL (15 MW)
Slide 50
5 minutes

Generation Resource Example, cont’d
HSL (100 MW)Reg-Up10 MW
RRS15 MWHASL (75 MW)
HASL = 100 MW 25 MW
50 MW
HASL = 100 MW – 25 MW = 75 MW
5 minutesLASL = LSL (15 MW)
Slide 51
5 minutes (15 MW)

Generation Resource Example, cont’d
HSL (100 MW)Reg-Up10 MW
SCED Ramp-Up Rate
RRS15 MWHASL (75 MW)
SCED Ramp-Up Rate= 5 MW / min- (10 MW÷ 5 minutes)
HDL (65 MW)
50 MW5 minutes)= 3 MW / min
HDL = (+3 MW/min x 5 min) LDL (25 MW)+ 50 MW = 65 MW
5 minutes
LDL (25 MW)
LASL = LSL (15 MW)
Slide 52
5 minutes (15 MW)

Generation Resource Example, cont’d
HSL (100 MW)Reg-Up10 MW
RRS15 MWHASL (75 MW)
65 MW
5 minutesLASL = LSL (15 MW)
Slide 53
5 minutes (15 MW)

Generation Resource Example, cont’d
HSL (100 MW)Reg-Up10 MW
SCED Ramp-Up Rate
RRS15 MWHASL (75 MW)HDL (80 MW?)
SCED Ramp-Up Rate= 5 MW / min- (10 MW÷ 5 minutes)
65 MW
5 minutes)= 3 MW / min
HDL = (+3 MW/min x 5 min) + 65 MW = 80 MW?
5 minutesLASL = LSL (15 MW)
Slide 54
5 minutes (15 MW)

Generation Resource Example, cont’d
HSL (100 MW)Reg-Up10 MW
Which one’s correct?
RRS15 MWHDL = HASL (75 MW)Which one’s correct?
HDL = (+3 MW/min x 5 min) + 65 MW = 80 MW?
65 MW
OR
= HASL, whichever is less.
So HDL = HASL = 75MW?
5 minutesLASL = LSL (15 MW)
Slide 55
5 minutes (15 MW)

Scenarios
Resource Load Calculator
Slide 56
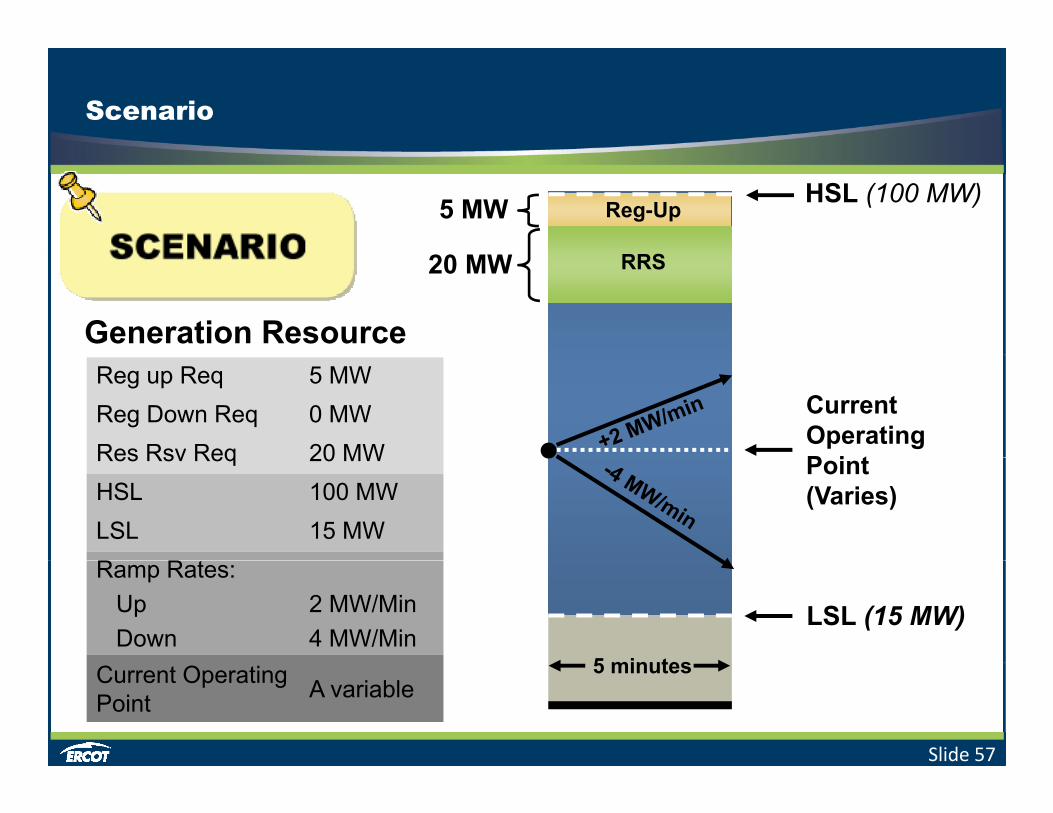
Scenario
HSL (100 MW)Reg-Up5 MW
RRS20 MW
Generation Resource
Current OperatingP i t
Reg up Req 5 MWReg Down Req 0 MWRes Rsv Req 20 MW Point
(Varies)Res Rsv Req 20 MWHSL 100 MWLSL 15 MWR R
5 minutes
LSL (15 MW)
Ramp Rates:Up 2 MW/MinDown 4 MW/Min
Slide 57
5 minutesCurrent OperatingPoint A variable

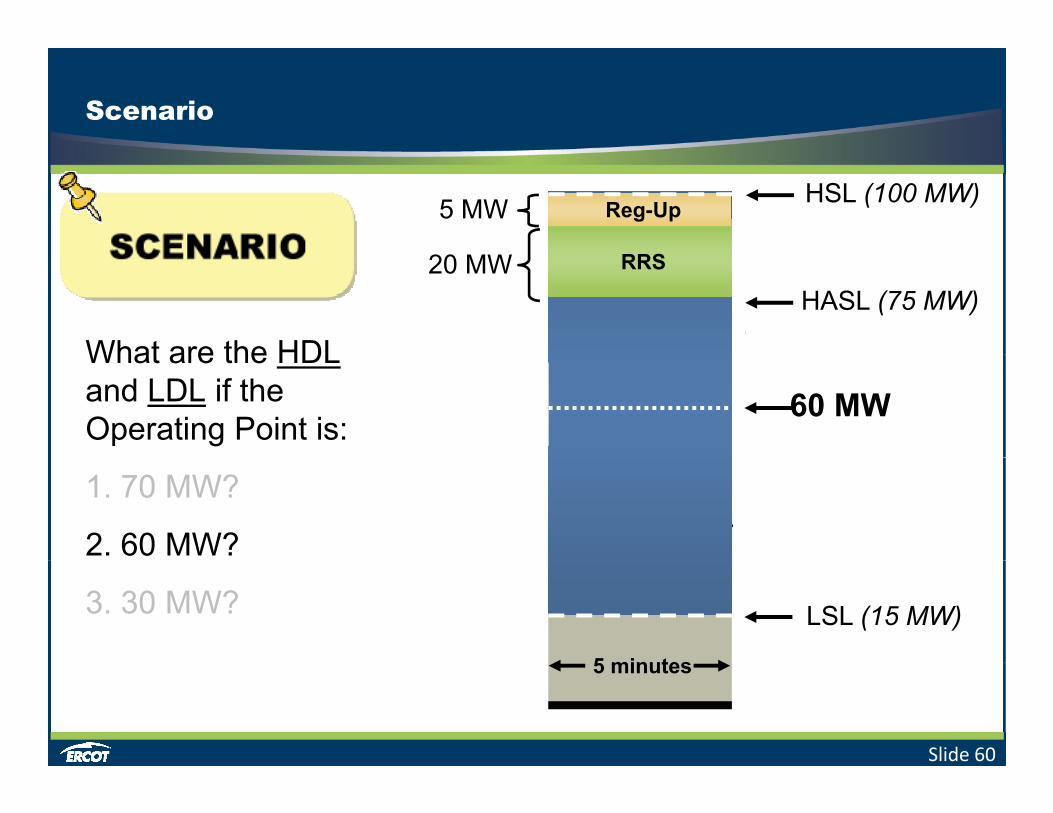
Scenario
HSL (100 MW)Reg-Up5 MW
What are the HDL
RRS20 MWHASL (75 MW)
What are the HDLand LDL if the Operating Point is: Current
Operating1. 70 MW?
2. 60 MW?
p gPoint
3. 30 MW?
5 minutes
LSL (15 MW)
Slide 58
5 minutes

Scenario
HSL (100 MW)5 MW Reg-Up
What are the HDL
HASL (75 Mw)20 MW
70 MW
80 MwRRS
HASL (75 MW)
What are the HDLand LDL if the Operating Point is:
70 MW
1. 70 MW?
2. 60 MW?
50 Mw
3. 30 MW?
5 minutes
LSL (15 MW)
Slide 59
5 minutes
Scenario
HSL (100 MW)5 MW Reg-Up
What are the HDL
20 MW RRS
70 MwHASL (75 MW)
What are the HDLand LDL if the Operating Point is:
60 MW
1. 70 MW?
2. 60 MW?40 Mw
3. 30 MW?
5 minutes
LSL (15 MW)
Slide 60
5 minutes

Scenario
HSL (100 MW)5 MW Reg-Up
What are the HDL
20 MW RRSHASL (75 MW)
What are the HDLand LDL if the Operating Point is:
40 Mw1. 70 MW?
2. 60 MW?30 MW
40 Mw
LSL (15 Mw)10 Mw
3. 30 MW? LSL (15 MW)
5 min tes
Slide 61
5 minutes
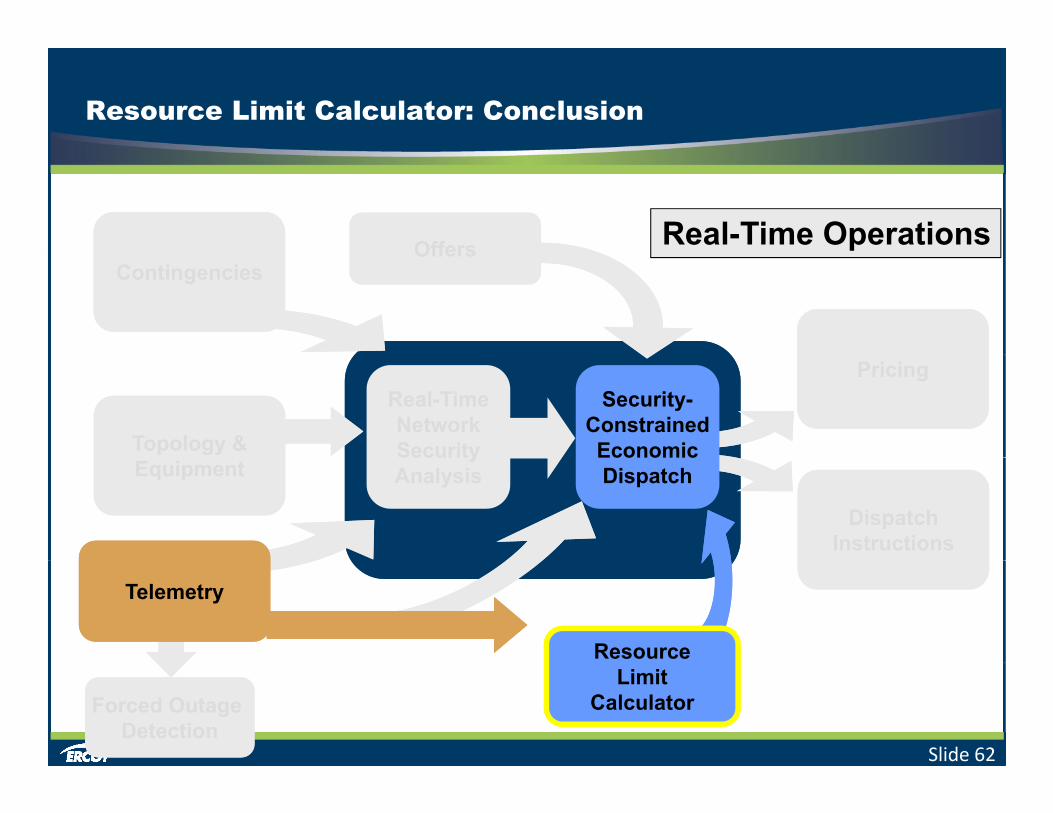
Resource Limit Calculator: Conclusion
OffersOffers Real-Time OperationsOffersOffersContingenciesContingencies
Real-TimeNetworkSecurityTopology &Topology &
PricingPricingSecurity-
ConstrainedEconomicy
AnalysisEquipmentEquipment
DispatchInstructions
DispatchInstructions
Dispatch
Resource
TelemetryTelemetry
Slide 62
LimitCalculatorForced Outage
DetectionForced Outage
Detection

Offers
ConstraintsConstraintsOffers
ConstraintsConstraints
PricingPricingReal-TimeNetworkSecurityAnalysis
Topology &EquipmentTopology &Equipment
PricingPricingSecurity-
ConstrainedEconomicDispatchAnalysisEquipmentEquipment
DispatchInstructions
DispatchInstructions
Dispatch
ResourceLimit
ResourceLimit
TelemetryTelemetry
Slide 63
Forced Outage Detection
Forced Outage Detection
LimitCalculator
LimitCalculator

Energy Offer Curves
OROR
Can be submitted any time before the Operating Hour for non-RUC-committed hours only.
Slide 64

Resource Status
Valid Resource Status Values:
• “ON” – online w EOC and w/o Regulation Serviceegu a o Se ce
• “ONREG” – online w EOC and providing Regulation Service
Slide 65

Output Schedules
Output Schedulep
MW
0 5 10 15 20 25 30minutes
• DSRs can submit Schedules any time before SCED.• Non-DSRs must submit before end of Adjustment
Slide 66
Non DSRs must submit before end of Adjustment Period.
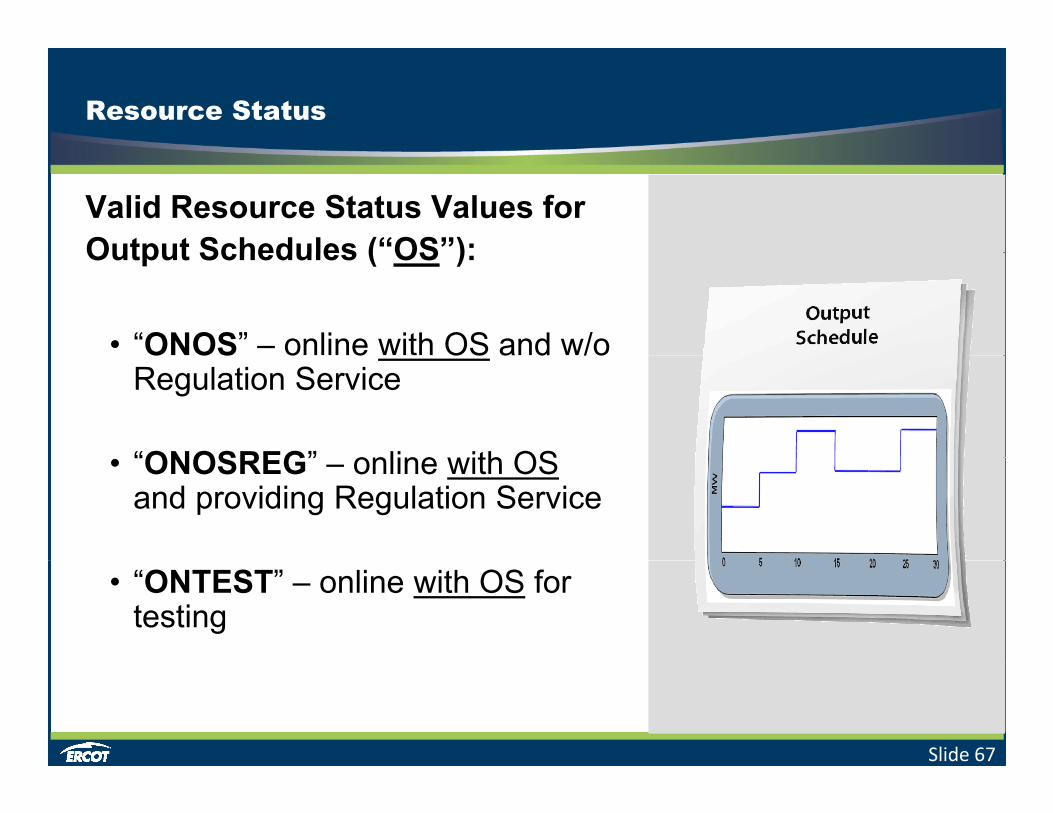
Resource Status
Valid Resource Status Values for Output Schedules (“OS”):Output Schedules ( OS ):
• “ONOS” – online with OS and w/o O OS o e OS a d /oRegulation Service
“ONOSREG” online with OS• “ONOSREG” – online with OSand providing Regulation Service
• “ONTEST” – online with OS for testing
Slide 67

Generation to be Dispatched
ConstraintsConstraintsOffersOffers
ConstraintsConstraints
PricingPricingReal-TimeNetworkSecurityAnalysis
Topology &EquipmentTopology &Equipment
PricingPricingSecurity-
ConstrainedEconomicDispatch
Real-Time OperationsReal-Time Operations
AnalysisEquipmentEquipment
DispatchInstructions
DispatchInstructions
Dispatch
ResourceLimit
ResourceLimit
TelemetryTelemetry
Slide 68
LimitCalculator
LimitCalculator
Forced Outage Detection
Forced Outage Detection

Execution
Real-Time OperationsConstraintsConstraints
OffersOffersConstraintsConstraints
PricingPricingReal-TimeNetworkSecurityAnalysis
Topology &EquipmentTopology &Equipment
PricingPricingSecurity-
ConstrainedEconomicDispatchAnalysisEquipmentEquipment
DispatchInstructions
DispatchInstructions
Dispatch
ResourceLimit
ResourceLimit
TelemetryTelemetry
Slide 69
LimitCalculator
LimitCalculator
Forced Outage Detection
Forced Outage Detection

Frequency
5 min. 5 min.5 min.
SCED ExecutionsSCED Executions
ERCOT may execute SCED more oftenERCOT may execute SCED more often than the scheduled, 5-minute interval.
Slide 70

Failure
5 min.◄ LMP = $12/MWh
5 min.LMP = $10/MWh
5 min.LMP = $12/MWh
SCED ExecutionsSCED Executions FAILUREFAILURE
Slide 71

Failure, cont’d
During SCED failure, ERCOT may• Relax constraintsRelax constraints• Issue Emergency Basepoints• Issue Verbal Instructions
SCED
More on this in Module 5 of this course
QSEs must:QSEs must:• Follow verbal & electronic instructions• In lack of any guidanceIn lack of any guidance
– hold to previous interval basepoints
Slide 72

Output
ConstraintsConstraintsOffersOffersVia LFC:
ConstraintsConstraints
PricingPricing
• Base Points
Via MIS:Real-TimeNetworkSecurityAnalysis
Topology &EquipmentTopology &Equipment
PricingPricingSecurity-
ConstrainedEconomicDispatch
Via MIS:• LMPs• SCED Shadow Prices• Active TransmissionAnalysisEquipmentEquipment
DispatchInstructions
DispatchInstructions
Dispatch• Active Transmission Constraints
• Settlement Point
TelemetryTelemetryResource
LimitResource
Limit
Prices
Slide 73
LimitCalculator
LimitCalculator

Pricing Data
ConstraintsConstraintsOffersOffers
ConstraintsConstraints
PricingReal-TimeNetworkSecurityAnalysis
Topology &EquipmentTopology &Equipment
PricingSecurity-
ConstrainedEconomicDispatch
Real-Time OperationsReal-Time Operations
AnalysisEquipmentEquipment
DispatchInstructions
DispatchInstructions
Dispatch
TelemetryTelemetryResource
LimitResource
Limit
Mockup of MIS display.
Slide 74
LimitCalculator
LimitCalculator

SCED
The Texas Two Step
SCED
SCED executes twice each cycle.• Ensures competition• Reduces Market
Power
Slide 75
Power

SCED
The Texas Two Step
SCED
Constraints are classified as:• Competitive• Non-Competitive
Slide 76

SCED
The Texas Two Step$ / MWh
Step One• Uses Energy Offer Curves
for all On-Line Generation Reference LMPfor all On-Line Generation Resources
• Observes the limits of
Reference LMP
Competitive Constraints only
• Determines “Reference LMPs”Energy Offer Curve
MWSCED
Slide 77

SCED
The Texas Two Step$ / MWh
Step Two• Observes limits of all Competitive
and Non-Competitive Constraints Reference LMPand Non-Competitive Constraints Reference LMP
Energy Offer CurveMW
SCED
Slide 78

SCED
The Texas Two Step$ / MWh
Step Two• Observes limits of all Competitive
and Non-Competitive Constraints Reference LMP
MitigatedOffer cap
and Non-Competitive Constraints
• Energy Offer Curve for on-line Resource capped at Reference
Reference LMP
ppLMP from Step 1 or Mitigated Offer Cap (whichever is greater) Energy Offer Curve
MWSCED
Slide 79

Scenarios
Texas Two Step
Slide 80

SCED
So – What curve is applied to each of the MW levels?
$ / MWh“The Energy Offer Curve for any on-line Resource is capped at the greater
$
R f LMPis capped at the greater of the Reference LMPfrom Step 1 or the Mitigated Offer Cap”
Mitigated
Reference LMP
Mitigated Offer Cap” Offer cap
Energy Offer CurveMW
Slide 81
MWSegment: a b c d

SCED
So – What curve is applied to each of
$ / MWh
the MW levels?
$
R f LMP
“The Energy Offer Curve for any on-line Resource is capped at the greater
Mitigated
Reference LMPis capped at the greater of the Reference LMPfrom Step 1 or the Mitigated Offer Cap” Offer cap
Energy Offer CurveMW
Mitigated Offer Cap”
Slide 82
MWSegment: a b c d

SCED
So – What curve is applied to each of
$ / MWh
the MW levels?
$
R f LMP
“The Energy Offer Curve for any on-line Resource is capped at the greater
Mitigated
Reference LMPis capped at the greater of the Reference LMPfrom Step 1 or the Mitigated Offer Cap” Offer cap
Energy Offer CurveMW
Mitigated Offer Cap”
Slide 83
MWSegment: a b c d

SCED
So – What curve is applied to each of
$ / MWh
the MW levels?
$
R f LMP
“The Energy Offer Curve for any on-line Resource is capped at the greater
Mitigated
Reference LMPis capped at the greater of the Reference LMPfrom Step 1 or the Mitigated Offer Cap” Offer cap
Energy Offer CurveMW
Mitigated Offer Cap”
Slide 84
MWSegment: a b c d

SCED
So – What curve is applied to each of
$ / MWh
the MW levels?
$
R f LMP
“The Energy Offer Curve for any on-line Resource is capped at the greater
Mitigated
Reference LMPis capped at the greater of the Reference LMPfrom Step 1 or the Mitigated Offer Cap” Offer cap
Energy Offer CurveMW
Mitigated Offer Cap”
Slide 85
MWSegment: a b c d

SCED
And… Why was each segment
$ / MWh
applicable?
$
R f LMP
“The Energy Offer Curve for any on-line Resource is capped at the greater
Mitigated
Reference LMPis capped at the greater of the Reference LMPfrom Step 1 or the Mitigated Offer Cap” Offer cap
Energy Offer CurveMW
Mitigated Offer Cap”
Slide 86
MWSegment: a b c d

Base Point Deviation
Security-
Over-Generation
yConstrainedEconomicDispatch
DispatchDispatch
Under-Generation
?Dispatch
InstructionsDispatch
Instructions
?
Slide 87

Ancillary Service Deployment
1 Preparing for Real-Time Operations
2 SCED Energy Dispatch
p g p
3 Ancillary Service Deployment
4 Forced Outage Detection
5 ERCOT / Resource Communications
Slide 88
Generation Resource Settlement6

Area Control Error
Measures the deviance (in MW) from System Scheduled FrequencyFrequency.
250(LFC attempts to maintain a zero average deviation.)
200150100
W)
500
-50
AC
E (M
W
ACE
+0 +5 +10 +15 +25 +20 +25 +30 +35 +40
-100-150-200
A ACE
Slide 89
+0 +5 +10 +15 +25 +20 +25 +30 +35 +40Seconds
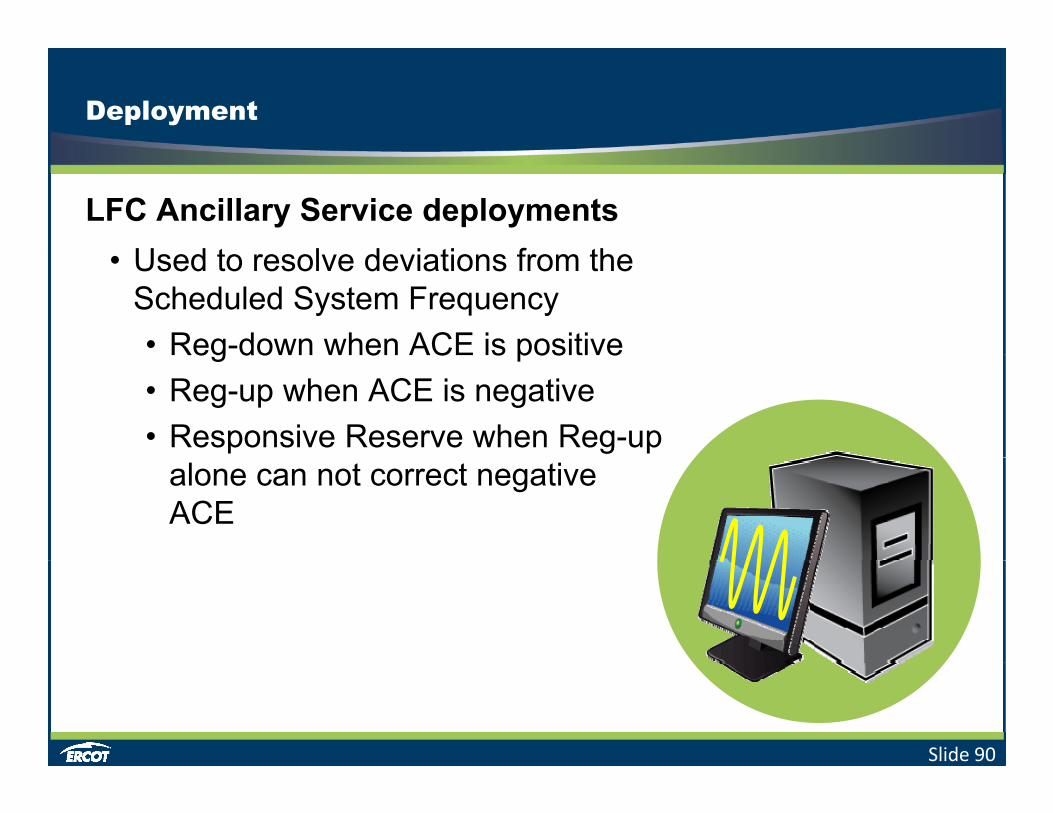
Deployment
LFC Ancillary Service deploymentsU d t l d i ti f th• Used to resolve deviations from the Scheduled System Frequency• Reg-down when ACE is positiveeg do e C s pos e• Reg-up when ACE is negative• Responsive Reserve when Reg-up
alone can not correct negativeACE
Slide 90
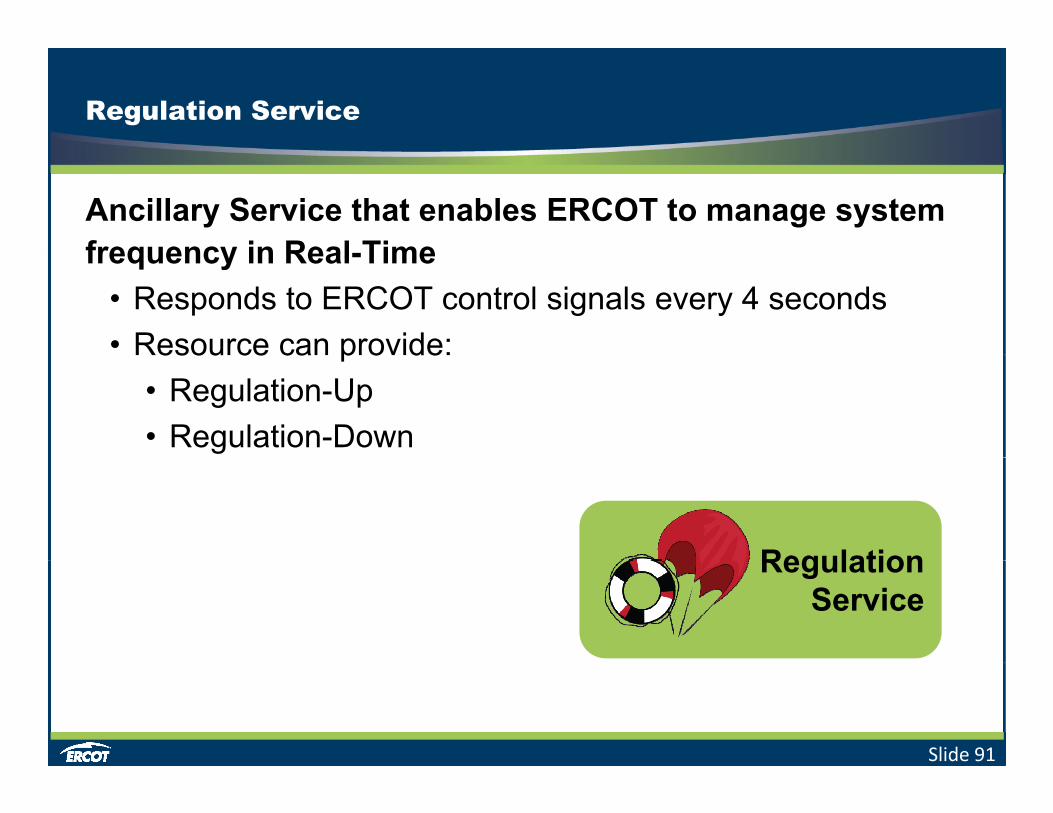
Regulation Service
Ancillary Service that enables ERCOT to manage system frequency in Real-Timefrequency in Real-Time
• Responds to ERCOT control signals every 4 seconds• Resource can provide:esou ce ca p o de
• Regulation-Up• Regulation-Down
RegulationRegulationService
Slide 91

Regulation-Up
Capacity deployed when ACE is below zeroHASL b d R U R ibilit• HASL based on Reg-Up Responsibility
• Dispatched at the QSE level• QSE determines how to allocate• QSE determines how to allocate• Affected Resources will increase generation
RegReg UpUp
=RegReg--UpUp
=Slide 92

Regulation-Down
Capacity deployed when ACE is above zeroLASL b d R D R ibilit• LASL based on Reg-Down Responsibility
• Dispatched at the QSE level• QSE determines how to allocate• QSE determines how to allocate• Affected Resources will decrease generation
==Slide 93
RegReg--DownDown
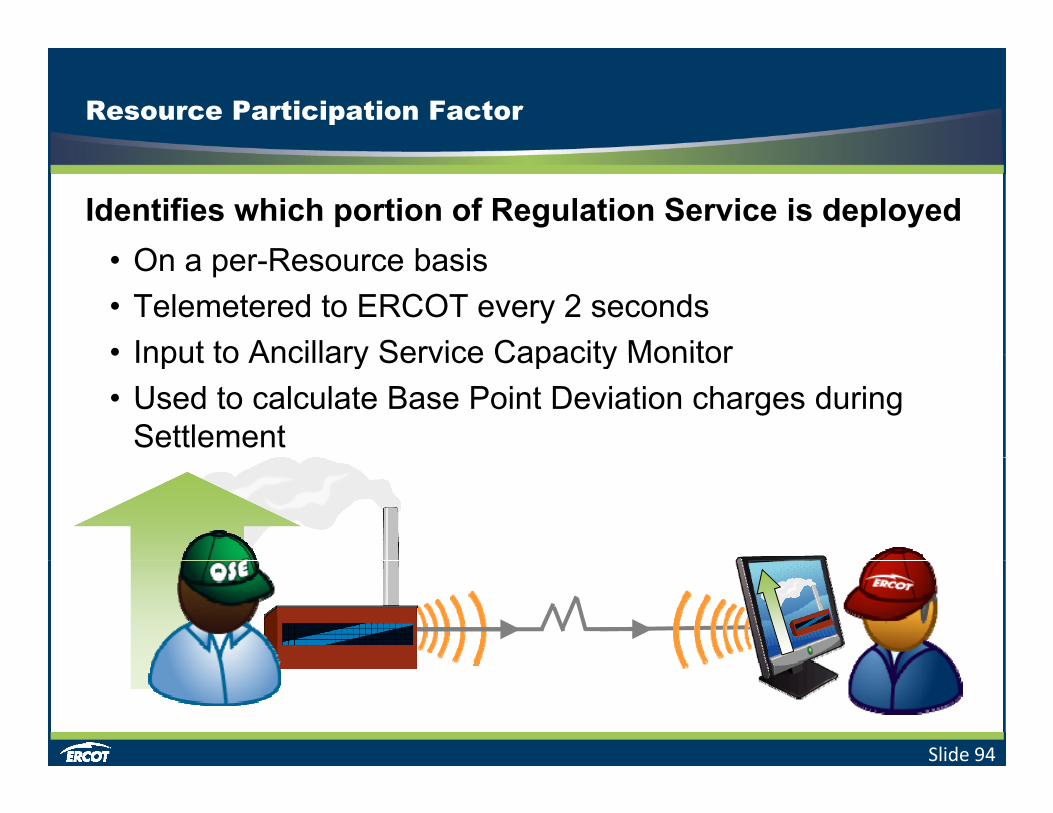
Resource Participation Factor
Identifies which portion of Regulation Service is deployedO R b i• On a per-Resource basis
• Telemetered to ERCOT every 2 seconds• Input to Ancillary Service Capacity Monitor• Input to Ancillary Service Capacity Monitor• Used to calculate Base Point Deviation charges during
Settlement
Slide 94

Example 1
60.06160
60.04
60.02
60.00224 sec. 264 sec.
Target SCED Base Point140
120
UDBP59.98
59.96
59 94MW
uenc
y
100
80
System Actual Freq.
59.94
59.92
59.90
M
Freq
u
84 sec.
Frequency Thresholds
60
40
59.88
59.86
Thresholds
0 +50 +100 +150 +200 +250 +300
20
0
Slide 95
SCED interval (w. LFC every 2-4 seconds)

Example 2
160 60.06UDBP
140
120
60.04
60.02
60.00
UDBP
Target SCED Base Point100
80
59.98
59.96
59 94MW
uenc
y
244 sec.
60
40
59.94
59.92
59.90
M
Freq
u
84 sec. 184 sec.
System Actual Freq. Frequency Thresholds
20
0
59.88
59.86
Thresholds
0 +50 +100 +150 +200 +250 +300
Slide 96
SCED interval (w. LFC every 2-4 seconds)

Responsive Reserve Service
Deployed when Reg-Up is insufficient to maintain system frequencyfrequency
• Must be deliverable 10 minutes from deployment• Ramps at Emergency Rate• Ramps at Emergency Rate• Releases additional capacity for immediate SCED
dispatch
RegReg--UpUp
• LFC will recall when frequency is acceptable
+ ResponsiveReserveService
Slide 97

Control-Block Status
QSE telemeters status when unit operators temporarily make Resource unavailable for regulationmake Resource unavailable for regulation
• Resource is removed from LFC consideration• ERCOT tracks how long the block is in place• ERCOT tracks how long the block is in place
Slide 98

Non-Spinning Reserve Service
Non-spin brings additional capacity online to:Off t i ffi i t it f di t h i th f t• Offset insufficient capacity for dispatch in the near future
• Address disturbance conditions • Minimize the prolonged use of Responsive Reserve• Minimize the prolonged use of Responsive Reserve
Non-SpinRReserveService
AS Capacity
Slide 99
AS Capacity Monitor

Deployment
ERCOT deploys Non-Spin from specific ResourcesS l t d b d i• Selected based on economics
• Each Resource deployed at 100% of Non-Spin.• Notice transmitted to QSEs via MMS• Notice transmitted to QSEs via MMS
• Amount of capacity to be deployed• Expected duration of deploymentp p y
Dispatch process depends on Resource p
type and current Status
Slide 100

Load Resource
When deployed:ERCOT t d l bl k• ERCOT must deploy as a block
• QSE must interrupt the requested energy within 30 minutes
100% ofNon-SpinR100% of
Reserved Capacity
ReserveService
Slide 101

Online Generation Resource
When deployed:ERCOT d t R ’ N S i AS S h d l• ERCOT updates Resource’s Non-Spin AS Schedule• Re-calculates HASL• Triggers SCED and dispatches new Base Points
DSR QSEs must update Output Schedule via Real-Time telemetry
• Triggers SCED and dispatches new Base Points• Updates Output Schedule
Schedule via Real Time telemetry
100% ofNon-SpinR
ONON100% of
Reserved Capacity
ReserveService
Slide 102

Recall
ERCOT recalls Non-Spin when conditions have passed
Resource Status prior to deployment
Recall Actionsy
Offline Generation QSE may ramp down to LSL and take off-line
O li G ti / N S i t d d HASL t dOnline Generation w/ Energy Offer Curve
Non-Spin restored and HASL re-computed; ramp down to new Base Point
Online Generation w/ Back out of Non-Spin incrementally at Output Schedule normal Ramp Rate
All Load Resources Must restore energy within 3 hours or replace with other non-committed Resource
Slide 103
replace with other non committed Resource
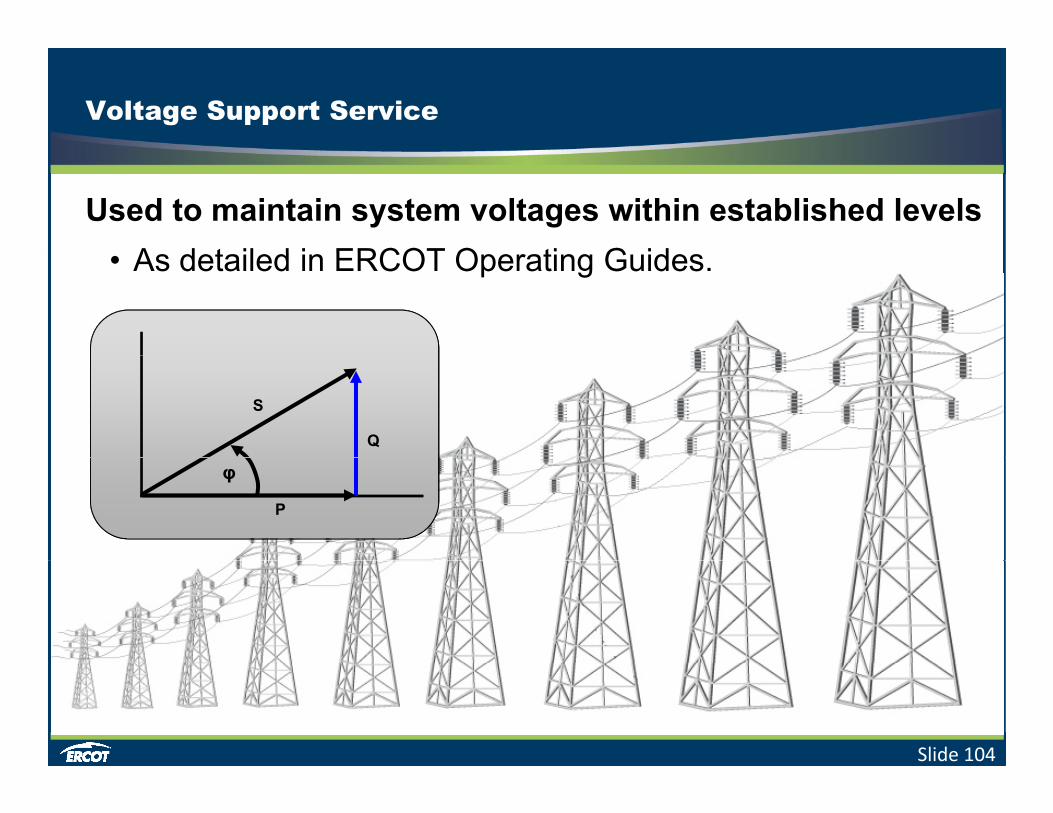
Voltage Support Service
Used to maintain system voltages within established levelsA d t il d i ERCOT O ti G id• As detailed in ERCOT Operating Guides.
S
Q
P
φ
Slide 104
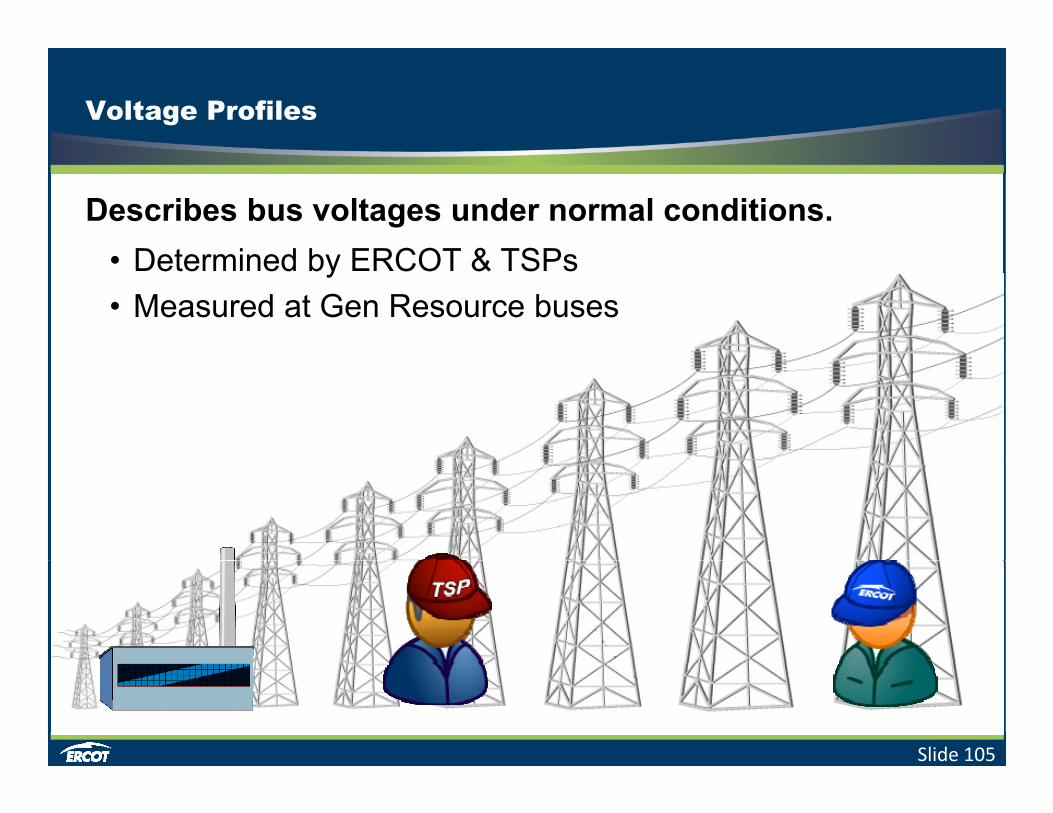
Voltage Profiles
Describes bus voltages under normal conditions.D t i d b ERCOT & TSP• Determined by ERCOT & TSPs
• Measured at Gen Resource buses
Slide 105

TSP Responsibilities
TSPs are responsible for maintaining transmission system voltages in accordance with the published voltagesystem voltages in accordance with the published voltage profiles.
• If unable to maintain voltage must alert ERCOT who can• If unable to maintain voltage, must alert ERCOT who can then dispatch a Generation Resource to address the problem.
!V
!Mw
Slide 106

QSE Responsibilities
QSEs responsible for providing VSS must:• Operate with Resource’s AVR in voltage control mode• Operate with Resource s AVR in voltage control mode• Telemeter Real and Reactive Power to ERCOT• Inform ERCOT if Resource can not meet its voltage profileInform ERCOT if Resource can not meet its voltage profile.
Posted VoltageProfile
Posted VoltageProfile
Transmission Operator Generator Site Name High Side PTI Bus No Generator Unit Base KV On-Peak Off-Peak
Slide 107
TransOp Electric Generators Inc. 12345 GenInc 1 138 144 142.5

Generation Requirements
UnitReactive
MW
ReactiveLimit
MW
rM
Var .95
power factor
Slide 108
> 20 MVA

Compensation
Unit Reactive Limit
Paid
MW
Unit Reactive Limit
Not paid
MW
r
Lost OpportunityPayment
MVa
r (if Mw restricted)
Slide 109

Ancillary Service Deployment
1 Preparing for Real-Time Operations
2 SCED Energy Dispatch
p g p
3 Ancillary Service Deployment
4 Forced Outage Detection
5 ERCOT / Resource Communications
Slide 110
Generation Resource Settlement6

Overview
Real-Time OperationsConstraintsConstraints
OffersOffersConstraintsConstraints
PricingPricingReal-TimeNetworkSecurityAnalysis
Topology &EquipmentTopology &Equipment
PricingPricingSecurity-
ConstrainedEconomicDispatchAnalysisEquipmentEquipment
DispatchInstructions
DispatchInstructions
Dispatch
ResourceLimit
ResourceLimit
TelemetryTelemetry
Slide 111
LimitCalculator
LimitCalculator
Forced Outage Detection
Forced Outage Detection

Overview
ContingenciesContingenciesOffersOffersSCADA TelemetryContingenciesContingencies
PricingPricing
SCADA Telemetry• Provides breaker status and
output of Resources • Provides status of observable
Real-TimeNetworkSecurityAnalysis
Topology &EquipmentTopology &Equipment
PricingPricingSecurity-
ConstrainedEconomicDispatch
• Provides status of observable Transmission Elements of the Network Operations Model
AnalysisEquipmentEquipment
DispatchInstructions
DispatchInstructions
Dispatch• ERCOT Operator may consult QSE or TSP regarding discrepancies
ResourceLimit
ResourceLimit
d sc epa c esTelemetry
Slide 112
LimitCalculator
LimitCalculator
Forced Outage Detection
Forced Outage Detection

Overview
ContingenciesContingenciesOffersOffersForced Outage Detection
U l i ti t t l tContingenciesContingencies
PricingPricing
• Uses logic equations to translate breaker and switch status changes into Transmission Element status
Real-TimeNetworkSecurityAnalysis
Topology &EquipmentTopology &Equipment
PricingPricingSecurity-
ConstrainedEconomicDispatch
changes
AnalysisEquipmentEquipment
DispatchInstructions
DispatchInstructions
Dispatch
ResourceLimit
ResourceLimit
TelemetryTelemetry
Slide 113
LimitCalculator
LimitCalculator
Forced Outage Detection
Forced Outage Detection
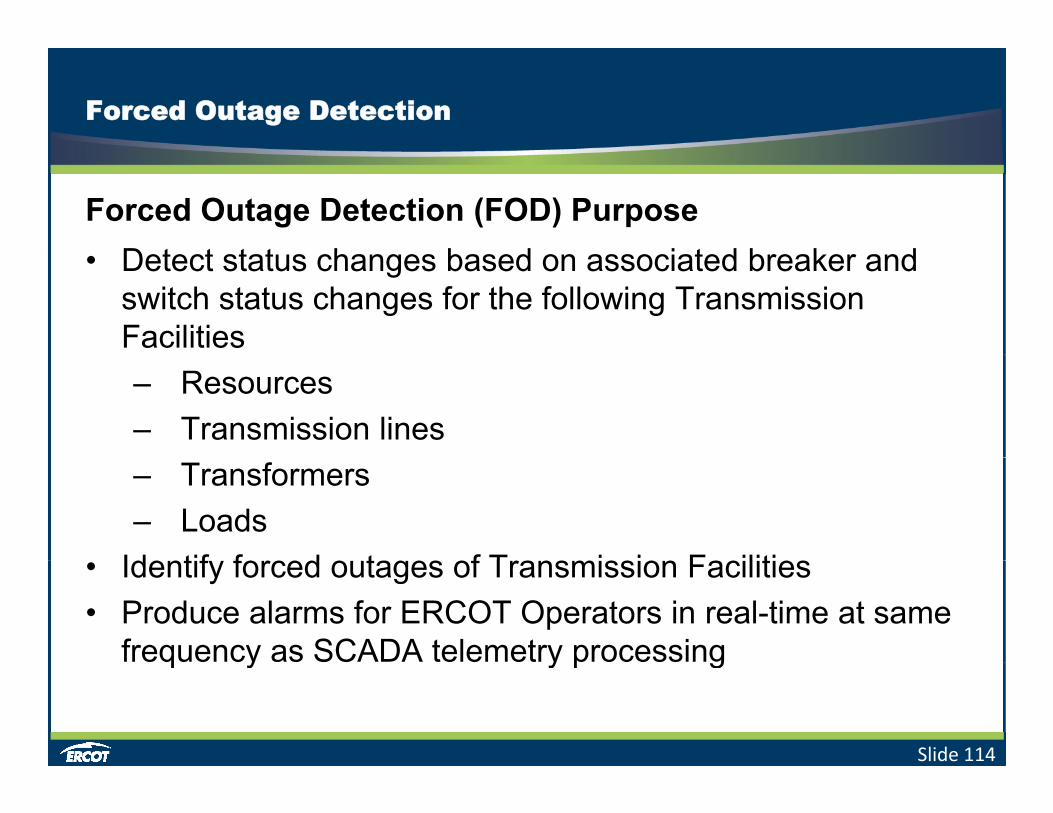
Forced Outage Detection (FOD) PurposeD t t t t h b d i t d b k d• Detect status changes based on associated breaker and switch status changes for the following Transmission Facilities– Resources – Transmission lines – Transformers– Loads
Identif forced o tages of Transmission Facilities• Identify forced outages of Transmission Facilities• Produce alarms for ERCOT Operators in real-time at same
frequency as SCADA telemetry processing
Slide 114
q y y p g
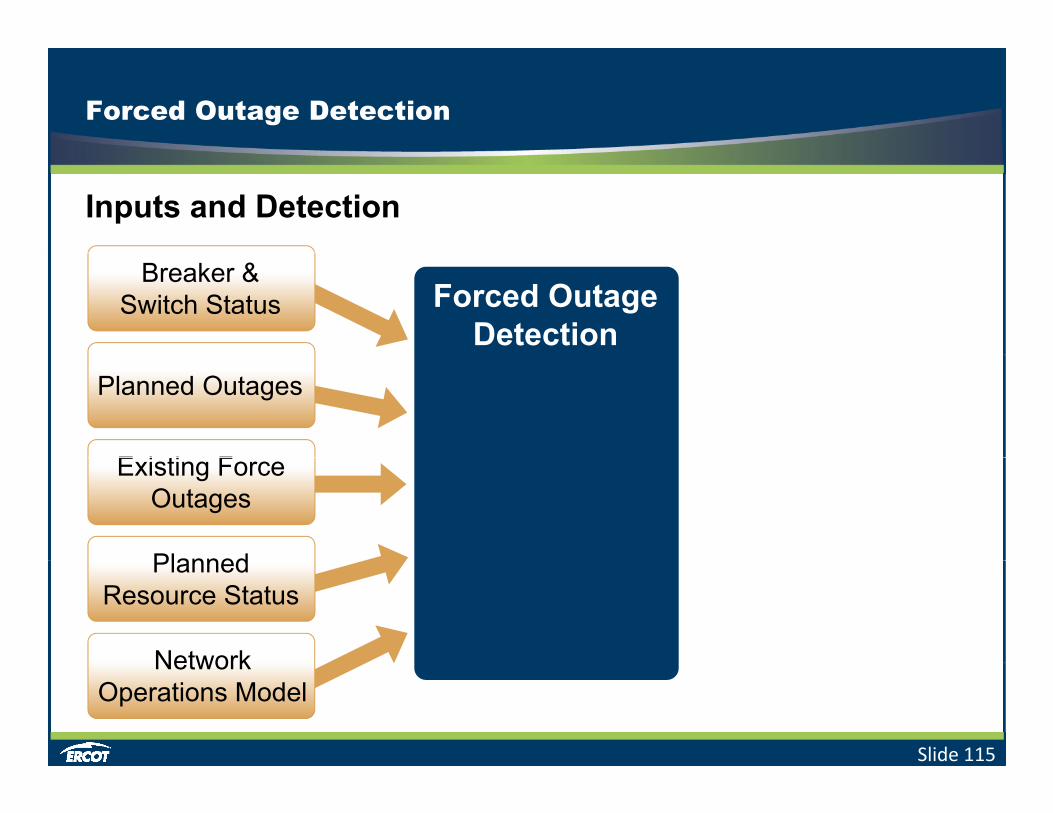
Forced Outage Detection
Inputs and Detection
Forced Outage Detection
Breaker & Switch Status
Planned Outages
E i ti F
Planned
Existing Force Outages
Planned Resource Status
Network
Slide 115
Network Operations Model
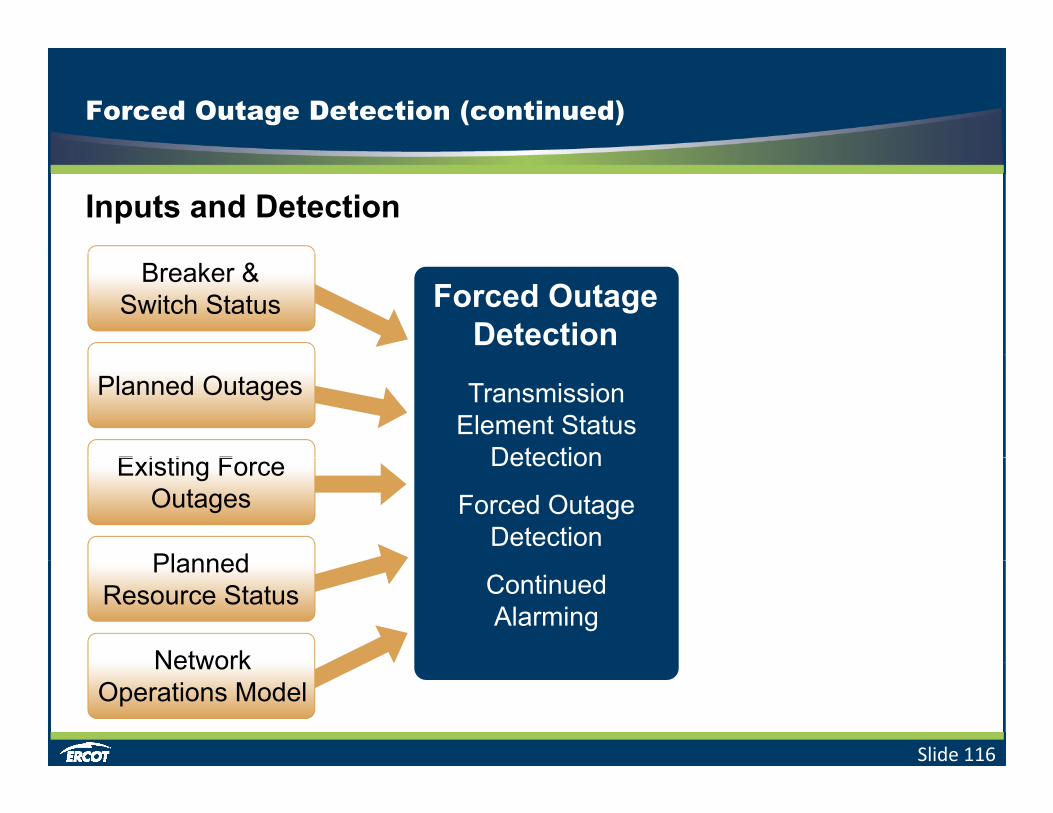
Forced Outage Detection (continued)
Inputs and Detection
Forced Outage Detection
Breaker & Switch Status
Planned Outages Transmission Element Status
DetectionE i ti F
Planned
Detection
Forced Outage Detection
Existing Force Outages
Planned Resource Status
Network
Continued Alarming
Slide 116
Network Operations Model
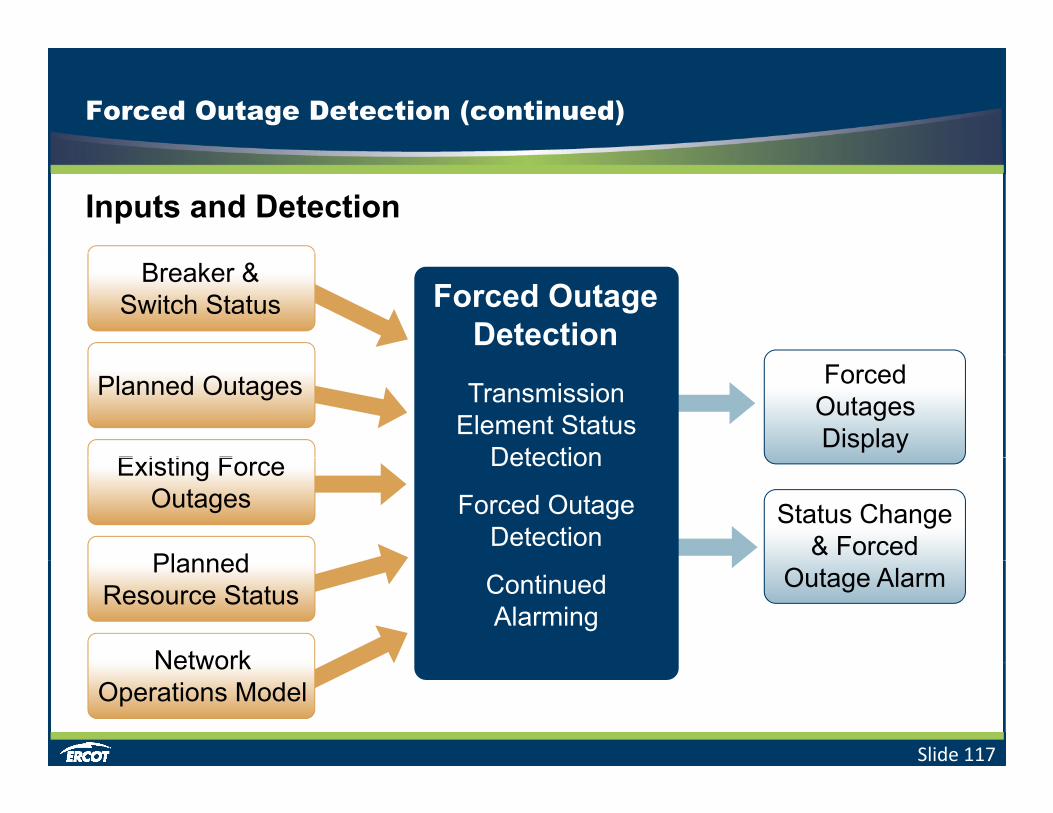
Forced Outage Detection (continued)
Inputs and Detection
Forced Outage Detection
Breaker & Switch Status
Planned Outages Forced Outages Display
Transmission Element Status
DetectionE i ti F
Planned
Status Change & Forced
Detection
Forced Outage Detection
Existing Force Outages
Planned Resource Status
Network
Outage AlarmContinued Alarming
Slide 117
Network Operations Model

Forced Outage Detection (continued)
Transmission Element DetectionIs the Load Is the Resource on-line or off-Is the Autotransformer
Load
Is the Load energized or
de-energized?
Resource
Is the Resource on-line or off-line? Does the status match the Current Operating Plan?
Is the Autotransformer energized or
de-energized?
Load
C
ResourceO
Is the Line . . .Energized?
De-energized? Line CLine BO CO C
Line AOpen at one end?
Open at both ends?C OC O
Slide 118

Forced Outage Detection (continued)
Transmission Element Detectionf
Load Resource
It depends on the combination of breaker and switch statuses.Transmission Element detection figures this out!
Load
C
ResourceO
Line CLine BO CO C
Line A
C OC O
Slide 119

Forced Outage Detection (continued)
Unplanned Outages for QSE and TSP FacilitiesERCOT Operator is alerted of unplanned outagesERCOT Operator is alerted of unplanned outages
Unavoidable Extension1
Forced Outage2
Forced Extension3
Slide 120

Forced Outage Detection (continued)
Unplanned Outages for QSE and TSP FacilitiesERCOT Operator may request that QSE or TSPERCOT Operator may request that QSE or TSP• Correct the breaker and/or switch
status indication causing the alarmstatus indication causing the alarm
• Enter an Unavoidable Extension, Forced Outage or ForcedForced Outage or Forced Extension into the Outage Scheduler
Slide 121

Forced Outage Detection (continued)
Resource Status Deviations ERCOT Operator is notified of status deviations
1
ERCOT Operator is notified of status deviations for QSE Resources
FOD detects a deviation between telemetered Resource
2
FOD detects a deviation between telemetered Resource status and FOD calculated Resource status
After a configurable time into the Operating Hour FOD2 After a configurable time into the Operating Hour, FOD detects a deviation between planned resource status from COP and FOD calculated resource status.
Slide 122

Forced Outage Detection (continued)
Resource Status Deviations (continued)
Example:
• Planned resource status from COP is “ON” and• Planned resource status from COP is ON , and
• Next hour planned status is also “ON”, and
• Resource status calculated by FOD is “OFF”
FOD shall notify the ERCOT operator of an unexpected deviation from the operating plan
Slide 123
unexpected deviation from the operating plan.

Forced Outage Detection (continued)
Resource Status Deviations (continued)ERCOT Operator may verbally request that the responsibleERCOT Operator may verbally request that the responsible QSE
• Correct the breaker and/or switch status indication causing the alarm
• Correct the deviation between COP and the FOD calculated• Correct the deviation between COP and the FOD calculated status
Slide 124

Ancillary Service Deployment
1 Preparing for Real-Time Operations
2 SCED Energy Dispatch
p g p
3 Ancillary Service Deployment
4 Forced Outage Detection
5 ERCOT / Resource Communications
Slide 125
Generation Resource Settlement6

Scenarios
Adjusting Resources
Slide 126

Adjusting Resources
Adjusting ResourcesAdjusting Resources• QSE is about to bring a Resource
On-LineOn-Line• Unit has DAM awarded energy and
ancillary services responsibilities.• COP reflects:
• Resource statuses• Limits• Resource Responsibilities
Slide 127

Adjusting Resources, cont’d
Initial values and desired end-points
Resource Parameters Starting Point Desired EndHSL 100 MW 100 MWLSL 10 MW 10 MWNormal Ramp Rate 5 MW/min 5 MW/minReg-Up AS Resource Responsibility 0 MW 10 MWReg-Down AS Resource Responsibility 0 MW 15 MWA d d E Off i th DAM 50 MWAwarded Energy Offer in the DAM 50 MWAwarded Reg-Up Offer in the DAM 10 MWAwarded Reg-Down Offer in the DAM 15 MWSCED Base Point 60 MW
Slide 128
SCED Base Point 60 MWCurrent Telemetry 60 MW

Adjusting Resources, cont’d
Parameter Values
SCED U R t
NormalR R t
Reg-Up Responsibility5 i-
SCED Up Rate
Ramp Rate 5 min
SCED Down Rate
NormalRamp Rate
Reg-Down Responsibility5 min-
Slide 129

Adjusting Resources, cont’d
Parameter Values
SCED U R t
5 MW/min10 MW5 min 3 MW/min- =
SCED Up Rate
5 min
SCED Down Rate
5 MW/min15 MW5 min
2 MW/min- =
Slide 130
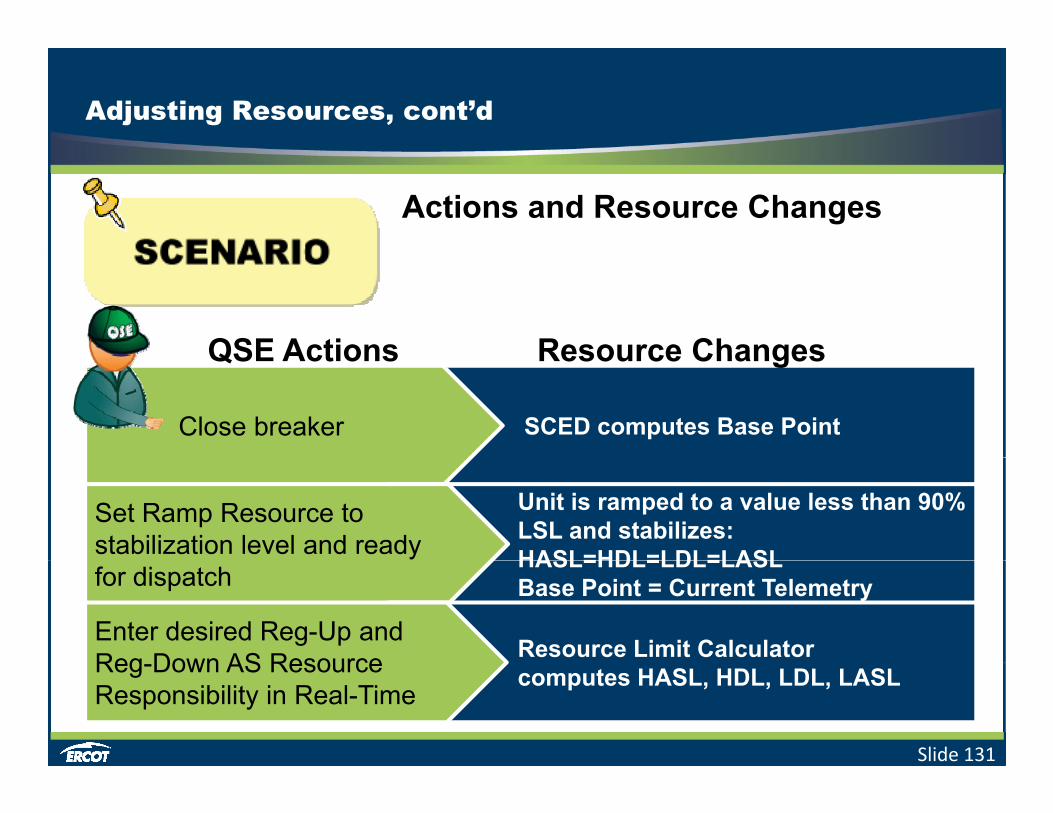
Adjusting Resources, cont’d
Actions and Resource Changes
QSE Actions Resource Changes
SCED computes Base PointClose breaker
QSE Actions Resource Changes
Unit is ramped to a value less than 90% LSL and stabilizes:HASL=HDL=LDL=LASL
Set Ramp Resource to stabilization level and ready HASL=HDL=LDL=LASL
Base Point = Current Telemetryfor dispatch
Resource Limit Calculator Enter desired Reg-Up and Reg Down AS Resource
Slide 131
computes HASL, HDL, LDL, LASLReg-Down AS Resource Responsibility in Real-Time

Adjusting Resources, cont’d
Actions and Resource Changes
QSE Actions Resource Changes
SCED computes Base PointSet Ramp Resource above 90% LSL
QSE Actions Resource Changes
Change to ONREG indicates On-Line Resource with Energy Offer Curve providing Regulation Service
Set Resource Status to ONREG
• Base Point movement restricted to Ramp Rate of Resource
Control Resource to Base Point of 60 MW;
LFC Actions
Slide 132
p• Updated Desired Base Point
provided as Reference
;Regulate around Base Point

Dispatch Communications
Dispatch CommunicationsERCOT sends electronic or verbal Dispatch instructionsERCOT sends electronic or verbal Dispatch instructions
• QSEs must:• Reply to electronic dispatch within one minute of receipt • Repeat verbal dispatch instructions back to ERCOT• Request clarification if instruction is not understood
Resources with ‘ONTEST’ Status are exempt from Dispatch Instructions.
DispatchInstructions
DispatchInstructions
Slide 133
InstructionsInstructions
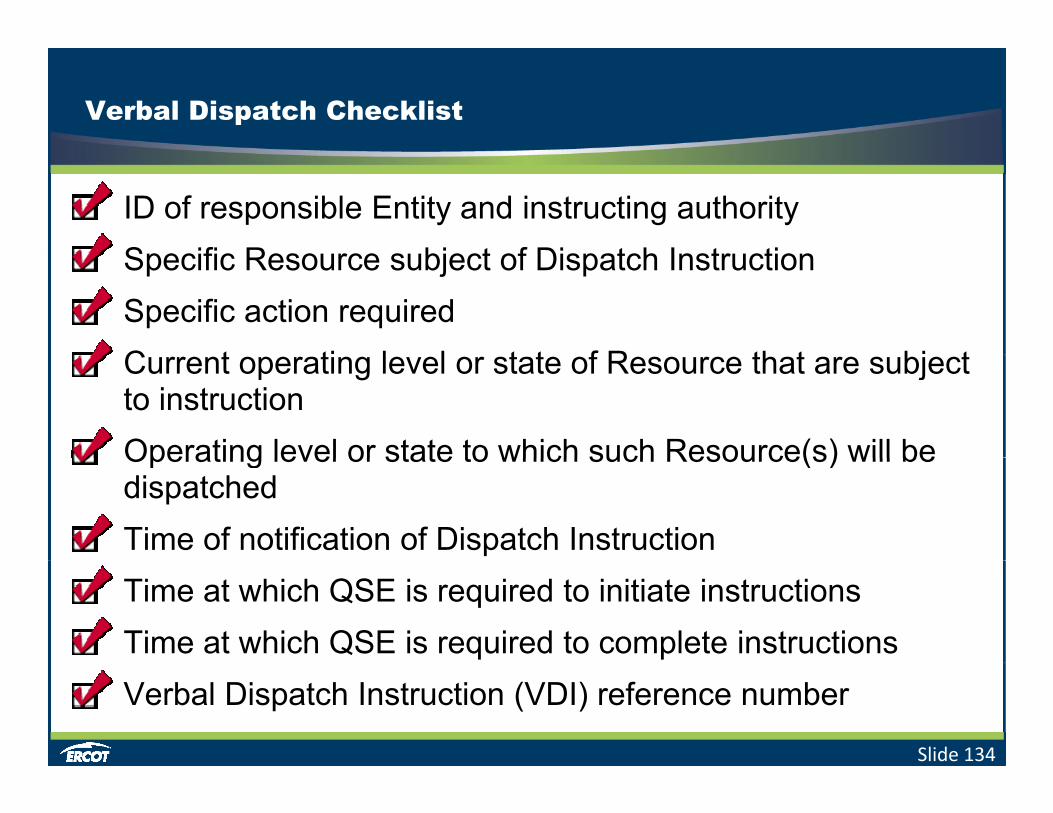
Verbal Dispatch Checklist
ID of responsible Entity and instructing authorityS ifi R bj t f Di t h I t tiSpecific Resource subject of Dispatch InstructionSpecific action requiredC t ti l l t t f R th t bj tCurrent operating level or state of Resource that are subject to instructionOperating level or state to which such Resource(s) will beOperating level or state to which such Resource(s) will be dispatchedTime of notification of Dispatch InstructionTime at which QSE is required to initiate instructions Time at which QSE is required to complete instructions
Slide 134
Verbal Dispatch Instruction (VDI) reference number

Dispatch Conflicts
QSE may contest dispatch instructions that:Ri k d th t t f t b dil h• Risk undue threat to safety, bodily harm, or equipment damage
• Are not in compliance with Protocols• Are not in compliance with Protocols• Conflict with other instructions
When contested, QSE must notify ERCOT and work to resolutionwork to resolution.
ERCOT has final decision-
Slide 135
making authority.

Non-Compliance Resolution
If ERCOT & QSE fail to agree on resolution:B th id h ld d t h ibl• Both sides should document as much as possible.
• Resolve dispute Alternative Dispute Resolution.
Slide 136
Settlement Impacts
1 Preparing for Real-Time Operations
2 SCED Energy Dispatch
p g p
3 Ancillary Service Deployment
4 Forced Outage Detection
5 ERCOT / Resource Communications
Slide 137
Generation Resource Settlement6
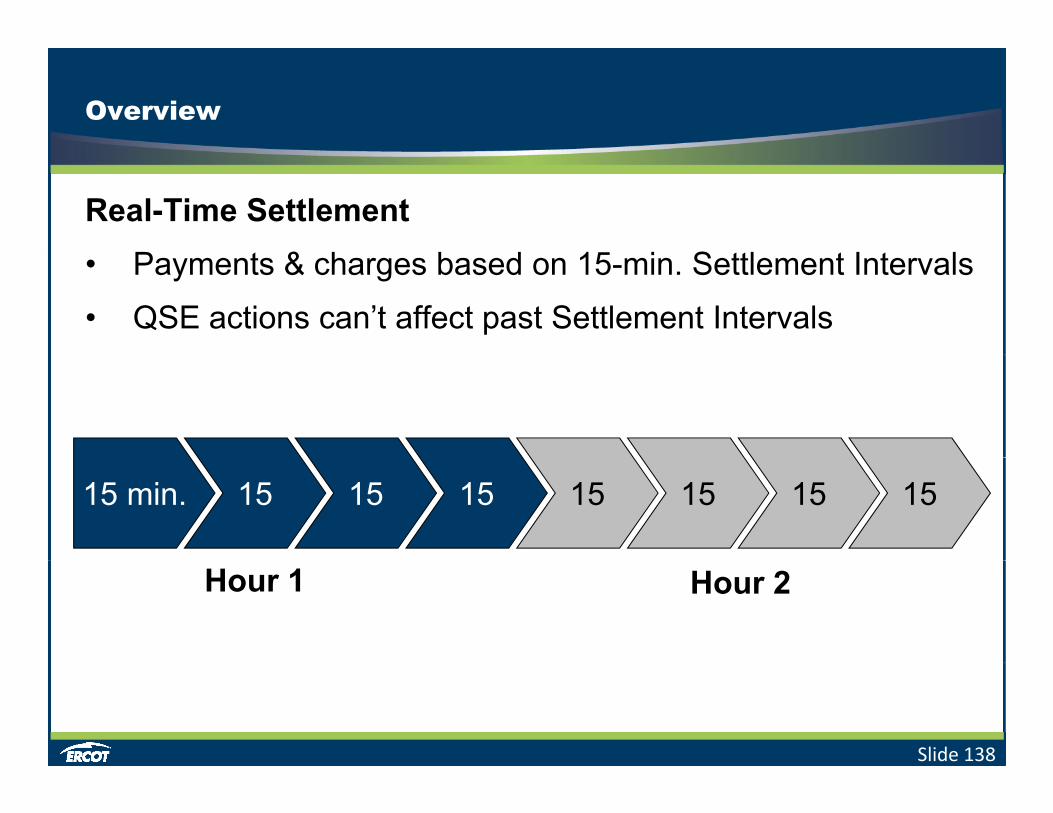
Overview
Real-Time Settlement P t & h b d 15 i S ttl t I t l• Payments & charges based on 15-min. Settlement Intervals
• QSE actions can’t affect past Settlement Intervals
15 min. 15 15 15 15 15 15 15
Hour 1 Hour 2
Slide 138

Scenarios
G ti S ttl t 60 MWGeneration Settlement 60 MW
G ti S ttl t 45 MWGeneration Settlement 45 MW
Slide 139

Generation Settlement: Scenario #1
Generation Settlement
For Hour Ending 11: {? MW
Generation Settlement
• DAM: Resource is struck for 50MW(No Ancillary Service awards)
{? MW
• Real-Time: 60MW generated for whole hour
Sold in DAM? MW
Real-TimeMetered
? MW
What is the QSE paid?
? MW
Slide 140

Generation Settlement: Scenario #1
Generation Settlement
10 MWWhat is the QSE paid?
Generation Settlement
{+10 MWWhat is the QSE paid?
DAM
{Sold in DAM
50 MW
Real-TimeMetered60 MW
• Paid 50 MW at the DAM SPP
60 MWReal-Time• Paid 60 MW at Real-Time SPP
Ch d 50 MW t R l Ti SPP
Slide 141
• Charged 50 MW at Real-Time SPP

Generation Settlement: Scenario #2
Generation Settlement
For Hour Ending 11:
Generation Settlement
• DAM: Resource is struck for 50MW(No Ancillary Service awards)
? MW}• Real-Time: 45MW generated for
whole hourSold in DAM? MW
Real-TimeMetered
? MW
What is the QSE paid?
? MW ? MW
Slide 142
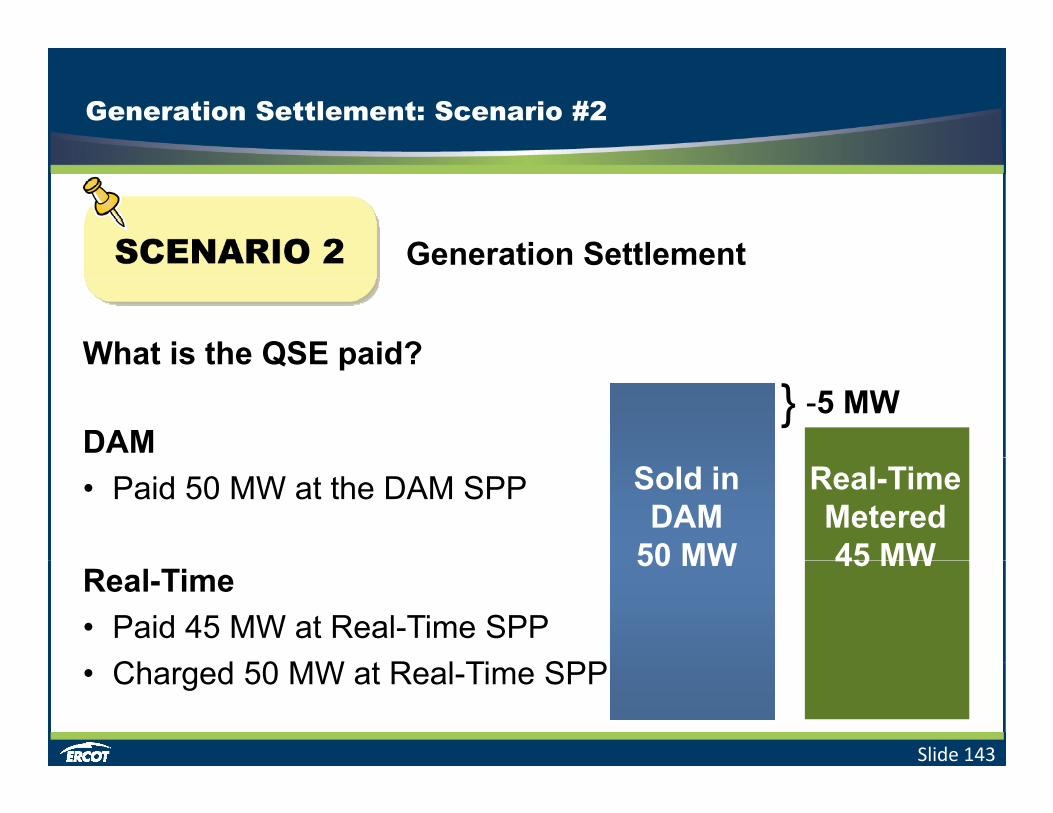
Generation Settlement: Scenario #2
Generation SettlementGeneration Settlement
What is the QSE paid?-5 MW}
What is the QSE paid?
DAMReal-TimeMetered45 MW
Sold in DAM
50 MW
• Paid 50 MW at the DAM SPP
45 MW50 MWReal-Time• Paid 45 MW at Real-Time SPP
Ch d 50 MW t R l Ti SPP
Slide 143
• Charged 50 MW at Real-Time SPP

Generation Settlement: Scenario #2
Other considerations:
• Settlement intervals?
• Different SPPs?
• Ancillary Services?
Real-TimeSold in Sold in DAM
Real-TimeMetered45 MW
DAM50 MW
DAM50 MW
Metered60 MW
Slide 144
Course Summary
You should be able to:
Identif timeline & processes of Real Time Operations• Identify timeline & processes of Real-Time Operations
• Explain Real-Time Network Security Analysis &
Security Constrained Economic Dispatch
• Describe Load Frequency Control functions
• Explain Generation Ancillary Services deployments
• Explain Controllable Load & associated QSE• Explain Controllable Load & associated QSE
responses
Slide 145
• Describe basic Real-Time pricing functions
Module ConclusionModule Conclusion