MODULE 10: ANALYSIS AND REPORTING Module Overvie · MODULE 10: ANALYSIS AND REPORTING Module...
46
MODULE 10: ANALYSIS AND REPORTING Module Overview The Analysis and Reporting features of Microsoft Dynamics ® NAV 2013 provide managers from sales, purchasing, and inventory with tools to easily budget, forecast, and analyze data. These features are designed for users who do not have a background in finance and accounting. Companies can review real-time data in analysis reports. These reports can be customized, saved under unique names, and positioned in relevant application areas to help users analyze data in preferred formats. Dimensions are data that you add (or have the program add) to entries to categorize them for analysis. They help you to quickly analyze trends and compare statistics across a range of entries. You can use a program-wide drill- down feature that works in the opposite direction, to explore the detailed transactions that make up summary figures. Companies can use the Sales and Purchase Budgets functionality to create sales and purchase budgets at multiple levels (item, customer, customer group, and vendor), and in both amounts and quantities. Users can track performance in analysis reports by calculating the difference between actual and budget figures, and can move budget figures between Microsoft Dynamics NAV and Microsoft ® Office Excel ® . The system also supports budget version control. Therefore, users can work on individual budgets at the same time. This includes budgets for identical levels, time periods, and value types. Before starting the lessons in this module, set your work date to January 23, 2014. Objectives The objectives are: • Explain how to set up and use sales and purchase analysis reports. • Show how to perform analysis by dimensions. • Explain how to create and export budgets and use them in analysis reports. 10 - 1 Microsoft Official Training Materials for Microsoft Dynamics ® Your use of this content is subject to your current services agreement
Transcript of MODULE 10: ANALYSIS AND REPORTING Module Overvie · MODULE 10: ANALYSIS AND REPORTING Module...
MODULE 10: ANALYSIS AND REPORTING
Module Overview The Analysis and Reporting features of Microsoft Dynamics® NAV 2013 provide managers from sales, purchasing, and inventory with tools to easily budget, forecast, and analyze data. These features are designed for users who do not have a background in finance and accounting.
Companies can review real-time data in analysis reports. These reports can be customized, saved under unique names, and positioned in relevant application areas to help users analyze data in preferred formats.
Dimensions are data that you add (or have the program add) to entries to categorize them for analysis. They help you to quickly analyze trends and compare statistics across a range of entries. You can use a program-wide drill-down feature that works in the opposite direction, to explore the detailed transactions that make up summary figures.
Companies can use the Sales and Purchase Budgets functionality to create sales and purchase budgets at multiple levels (item, customer, customer group, and vendor), and in both amounts and quantities. Users can track performance in analysis reports by calculating the difference between actual and budget figures, and can move budget figures between Microsoft Dynamics NAV and Microsoft®
Office Excel®. The system also supports budget version control. Therefore, users can work on individual budgets at the same time. This includes budgets for identical levels, time periods, and value types.
Before starting the lessons in this module, set your work date to January 23, 2014.
Objectives
The objectives are:
• Explain how to set up and use sales and purchase analysis reports.
• Show how to perform analysis by dimensions.
• Explain how to create and export budgets and use them in analysis reports.
10 - 1 Microsoft Official Training Materials for Microsoft Dynamics ® Your use of this content is subject to your current services agreement
Trade in Microsoft Dynamics® NAV 2013
Analysis Views and Reports Companies can use analysis reports to create customized reports that are based on posted transactions such as sales, purchases, transfers, and inventory adjustments. Inventory analysis reports can also use production order data to report on work in progress (WIP).
In a customizable report, the source data (derived from the item ledger and associated value entries), can be combined, compared, and presented in meaningful, user-defined ways, similar to a PivotTable report in Microsoft Excel.
An analysis report includes lines and columns. The lines contain the objects that you want to analyze (such as customers, vendors, and so on). The columns contain the analysis parameters that define how you want to view the objects (such as profit calculations, periodic comparisons of sales amounts and volumes, actual versus budget, and so on).
Before you create new reports, you must set up templates for the lines and columns. The reports are then defined as a combination of line and column templates.
10 - 2 Microsoft Official Training Materials for Microsoft Dynamics ® Your use of this content is subject to your current services agreement
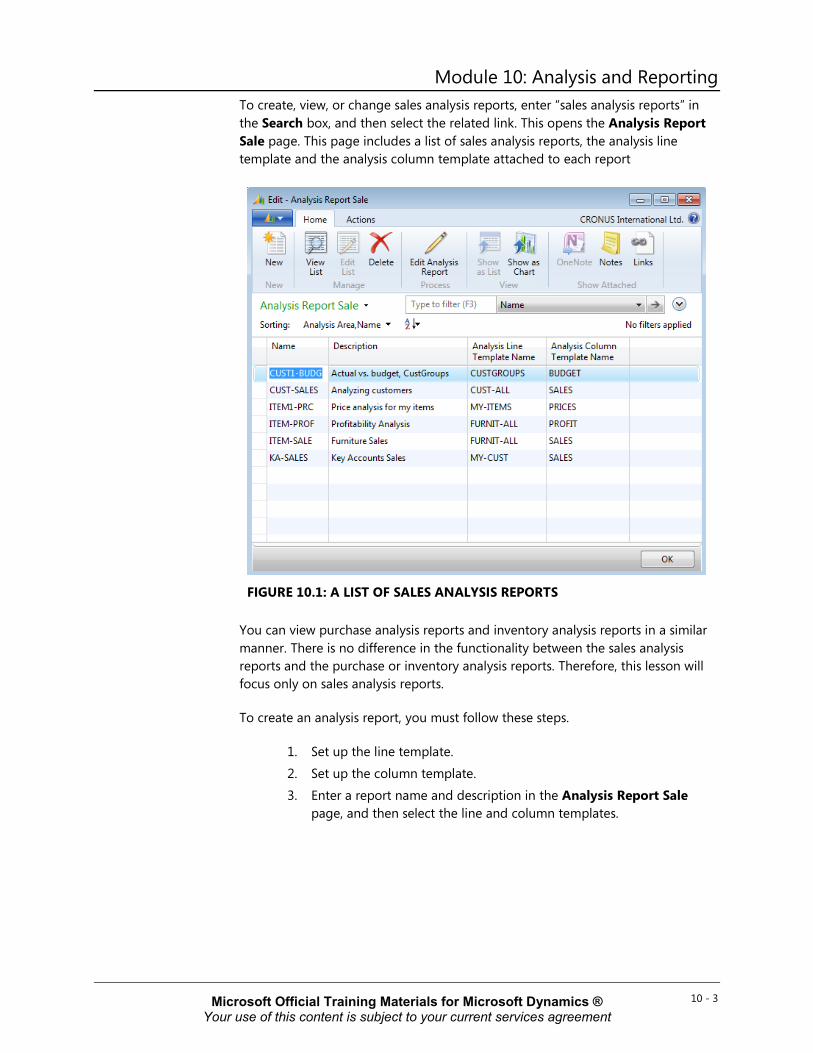
Module 10: Analysis and Reporting To create, view, or change sales analysis reports, enter “sales analysis reports” in the Search box, and then select the related link. This opens the Analysis Report Sale page. This page includes a list of sales analysis reports, the analysis line template and the analysis column template attached to each report
FIGURE 10.1: A LIST OF SALES ANALYSIS REPORTS
You can view purchase analysis reports and inventory analysis reports in a similar manner. There is no difference in the functionality between the sales analysis reports and the purchase or inventory analysis reports. Therefore, this lesson will focus only on sales analysis reports.
To create an analysis report, you must follow these steps.
1. Set up the line template. 2. Set up the column template. 3. Enter a report name and description in the Analysis Report Sale
page, and then select the line and column templates.
10 - 3 Microsoft Official Training Materials for Microsoft Dynamics ® Your use of this content is subject to your current services agreement

Trade in Microsoft Dynamics® NAV 2013 Line Templates
The lines in a report contain the objects to analyze. To set up sales line templates, enter “sales analysis line templates” in the Search box, and then select the related link. This opens the Analysis Line Template - Sales page.
FIGURE 10.2: ANALYSIS LINE TEMPLATES FOR SALES
To create an analysis line template, enter a name and description. Line templates describe a set of analysis lines that can be of the following type:
• Customers and customer groups
• Items and item groups
• Salespeople/purchasers
• Formulas
10 - 4 Microsoft Official Training Materials for Microsoft Dynamics ® Your use of this content is subject to your current services agreement
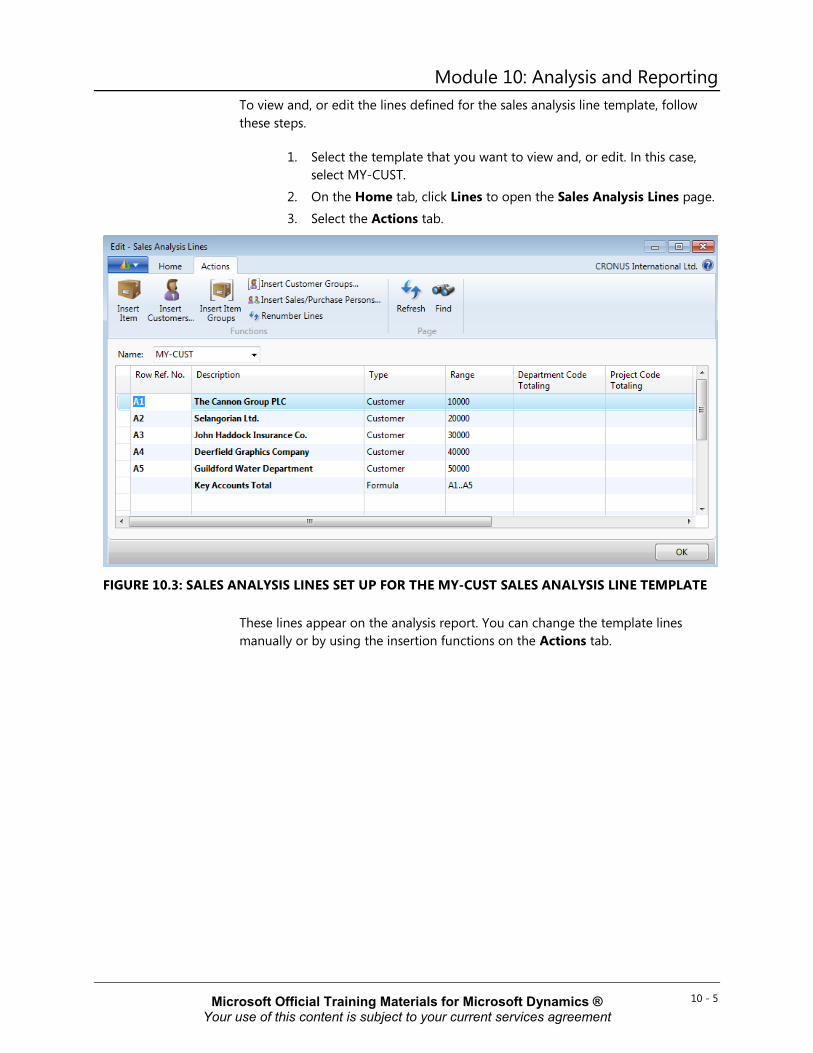
Module 10: Analysis and Reporting To view and, or edit the lines defined for the sales analysis line template, follow these steps.
1. Select the template that you want to view and, or edit. In this case, select MY-CUST.
2. On the Home tab, click Lines to open the Sales Analysis Lines page. 3. Select the Actions tab.
FIGURE 10.3: SALES ANALYSIS LINES SET UP FOR THE MY-CUST SALES ANALYSIS LINE TEMPLATE
These lines appear on the analysis report. You can change the template lines manually or by using the insertion functions on the Actions tab.
10 - 5 Microsoft Official Training Materials for Microsoft Dynamics ® Your use of this content is subject to your current services agreement
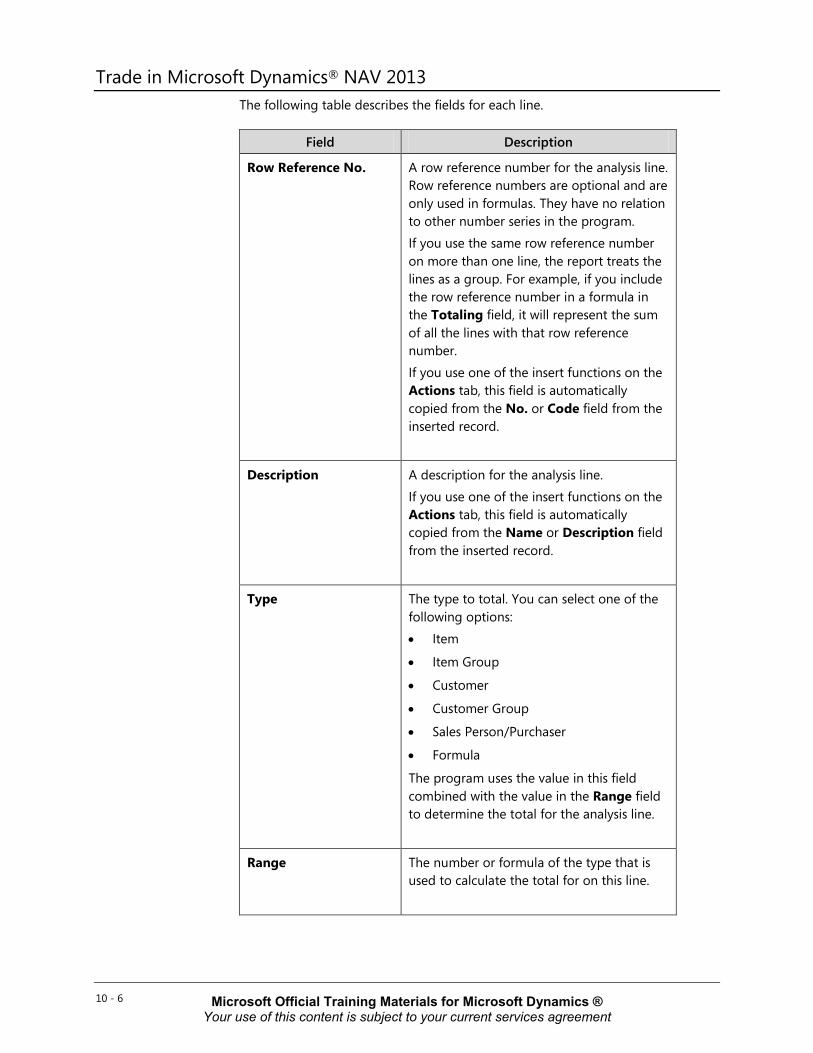
Trade in Microsoft Dynamics® NAV 2013 The following table describes the fields for each line.
Field Description
Row Reference No.
A row reference number for the analysis line. Row reference numbers are optional and are only used in formulas. They have no relation to other number series in the program. If you use the same row reference number on more than one line, the report treats the lines as a group. For example, if you include the row reference number in a formula in the Totaling field, it will represent the sum of all the lines with that row reference number. If you use one of the insert functions on the Actions tab, this field is automatically copied from the No. or Code field from the inserted record.
Description
A description for the analysis line. If you use one of the insert functions on the Actions tab, this field is automatically copied from the Name or Description field from the inserted record.
Type
The type to total. You can select one of the following options: • Item
• Item Group
• Customer
• Customer Group
• Sales Person/Purchaser
• Formula
The program uses the value in this field combined with the value in the Range field to determine the total for the analysis line.
Range
The number or formula of the type that is used to calculate the total for on this line.
10 - 6 Microsoft Official Training Materials for Microsoft Dynamics ® Your use of this content is subject to your current services agreement

Module 10: Analysis and Reporting For more information about these or other fields in the template, refer to the online Help.
Column Templates
The columns in a report contain the analysis parameters. To set up column templates, enter “sales analysis column templates” in the Search box, and then select the related link. This opens the Analysis Column Templates – Sales page.
FIGURE 10.4: ANALYSIS COLUMN TEMPLATES FOR SALES
To create a sales analysis column template, enter a name and description.
To view and, or edit the columns defined for a template, follow these steps.
1. Select the template that you want to view and, or edit. In this case, select SALES.
2. On the Home tab, click Columns to open the Analysis Columns – Sales page.
10 - 7 Microsoft Official Training Materials for Microsoft Dynamics ® Your use of this content is subject to your current services agreement

Trade in Microsoft Dynamics® NAV 2013
FIGURE 10.5: COLUMNS SET UP FOR THE SALES COLUMN TEMPLATE
The following table provides the field names and a description of the columns that are shown on the analysis report.
Field Description
Column No.
A number for the analysis column. The column numbers are optional and are used only in formulas. They have no relation to other number series in the program.
You can use the same column number on more than one line. The columns are then treated as a group. For example, if you include the column number in a formula, it will represent the sum of all the lines that share the column number.
Column Header
The column header that you want to appear on printed reports. The program prints the header on reports that include this column.
Invoiced
Specifies if you want the analysis report to be based on invoiced amounts. If you leave this field blank, the program bases the analysis report on expected amounts (shipped but not invoiced).
10 - 8 Microsoft Official Training Materials for Microsoft Dynamics ® Your use of this content is subject to your current services agreement

Module 10: Analysis and Reporting Field Description
Column Type
The column type for the analysis column. The type determines how the amounts in the column are calculated.
Ledger Entry Type
The type of ledger entries to include in the amounts in the analysis column. The options include the following: • Item Entries: The program calculates the
total from the item ledger entries or from the item value entries.
• Item Budget Entries: The program calculates the total from the item budget entries.
Formula
Contains a formula. The result of the formula appears in the column when the analysis report prints. The formula in this field can include other columns (referenced by their column number) so that the report can perform calculations on other columns.
10 - 9 Microsoft Official Training Materials for Microsoft Dynamics ® Your use of this content is subject to your current services agreement

Trade in Microsoft Dynamics® NAV 2013 Field Description
Analysis Type Code
Specifies the analysis type to apply to the column. When you select an analysis type for a column, the program automatically fills in the Item Ledger Entry Type Filter, Value Entry Type Filter, and the Value Type fields. Click the drop-down arrow in the Analysis Type Code field and then click Advanced to view the Analysis Type List page. To view, create, or change analysis type codes, click Setup on the Home tab of the Analysis Type List page, or enter “analysis types” in the Search box, and then select the related link. Both will open the Analysis Types page. Each Analysis Type Code has a default Item Ledger Entry Type Filter, Value Entry Type Filter, and Value Type that together define the values in the item and budget entries to retrieve.
Default analysis type codes for most of the relevant analyses are included in the program. To set up these default types, click Reset Default Analysis Types on the Actions tab on the Analysis Types page.
10 - 10 Microsoft Official Training Materials for Microsoft Dynamics ® Your use of this content is subject to your current services agreement

Module 10: Analysis and Reporting Field Description
Value Type
The value type that the program uses to calculate the column. The options include the following:
• (blank)
• Quantity
• Sales Amount
• Cost Amount
• Non-Inventoriable Amount
• Unit Price
• Standard Cost
• Indirect Cost
• Unit Cost
The Quantity field and the three amount fields obtain their values from the item ledger entries. The values in the three cost fields originate from the item card, and the Unit Price field derives its value from the Sales Prices table.
If you select one of the default analysis types in the Analysis Type field, the program fills in this field automatically.
For more information about these or other fields in the template, refer to the online Help.
Demonstration: Customize Analysis Report
You can use existing analysis reports to create customized reports. This demonstration shows the main fields in the analysis report and describes how to customize an existing analysis report.
Scenario: Kevin, the sales manager at CRONUS International Ltd., created a report named KA-SALES. This report provides an overview of sales turnover and profit for specific customers. Kevin has to run the report to retrieve January 2014 sales numbers, but first he must add customer 49633663, Autohaus Mielberg KG, to the report.
10 - 11 Microsoft Official Training Materials for Microsoft Dynamics ® Your use of this content is subject to your current services agreement
Trade in Microsoft Dynamics® NAV 2013 Demonstration Steps
To review the current KA-SALES analysis report for January 2014, follow these steps.
1. In the Search box, enter “sales analysis reports”, and then click the related link.
2. On the Analysis Report Sale page, select the line for the KA-SALES report and then, on the Home tab, click Edit Analysis Report.
3. On the Sales Analysis Report page for KA-SALES, expand the Matrix Options FastTab.
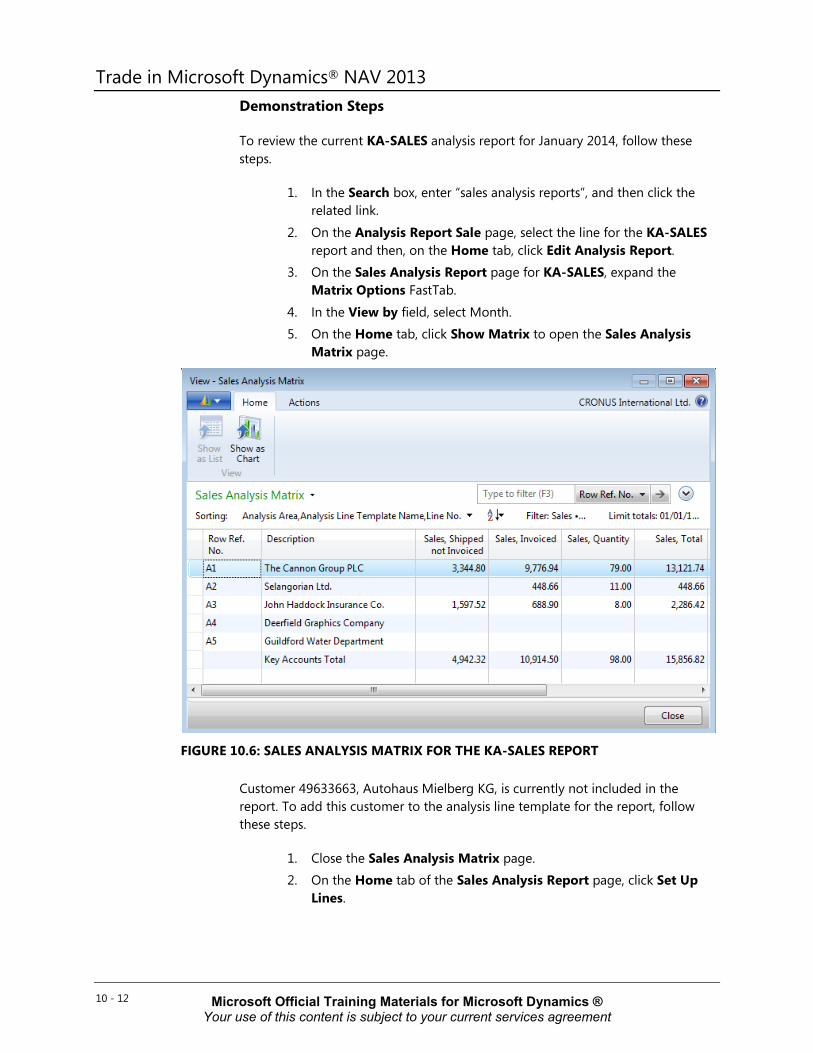
4. In the View by field, select Month. 5. On the Home tab, click Show Matrix to open the Sales Analysis
Matrix page.
FIGURE 10.6: SALES ANALYSIS MATRIX FOR THE KA-SALES REPORT
Customer 49633663, Autohaus Mielberg KG, is currently not included in the report. To add this customer to the analysis line template for the report, follow these steps.
1. Close the Sales Analysis Matrix page. 2. On the Home tab of the Sales Analysis Report page, click Set Up
Lines.
10 - 12 Microsoft Official Training Materials for Microsoft Dynamics ® Your use of this content is subject to your current services agreement

Module 10: Analysis and Reporting 3. On the Sales Analysis Lines page, select the Key Accounts Total line.
On the Actions tab, click Insert Customers.
4. Select the line for customer 49633663, and then click OK.
The program automatically enters the customer information into the report lines. This includes copying the customer number into the Row Ref. No. field.
Note: You can also manually insert rows into the Sales Analysis Lines page.
Note: Row reference numbers are optional and are used only in formulas. They are not related to other number series in the program.
To use a row reference number in a formula, the Row Ref. No. field must include at least one character that is not a number.
Because row reference numbers are used in a formula to calculate the Key Accounts Total amount, Kevin must change the information in the Sales Analysis Lines page.
To update the sales analysis lines and then review the updated KA-SALES analysis report for January 2014, follow these steps.
1. In the Row Ref. No. field for customer 49633663, type “A6”. 2. On the Key Accounts Total line, in the range field, type “A1..A6”.
FIGURE 10.7: SALES ANALYSIS LINES FOR THE KA-SALES REPORT
10 - 13 Microsoft Official Training Materials for Microsoft Dynamics ® Your use of this content is subject to your current services agreement

Trade in Microsoft Dynamics® NAV 2013 3. Click OK to close the Sales Analysis Lines page. 4. On the Sales Analysis Report page, on the Home tab, click Show
Matrix.
Customer Autohaus Mielberg KG, now appears in the report.
To view the analysis columns to determine the parameters set up to analyze this data, follow these steps.
1. Close the Sales Analysis Matrix page. 2. On the Home tab of the Sales Analysis Report page, click Set Up
Columns to open the Analysis Columns – Sales page.
FIGURE 10.8: SALES ANALYSIS COLUMNS FOR THE KA-SALES REPORT
The Column Header field shows the columns that are used to create the report. The Formula field shows how the report calculates certain values.
To view the analysis type selected for the first line, follow these steps.
1. Click the drop-down arrow in the line’s Analysis Type Code field of the first line (value of SALES-AMT), and then click Advanced.
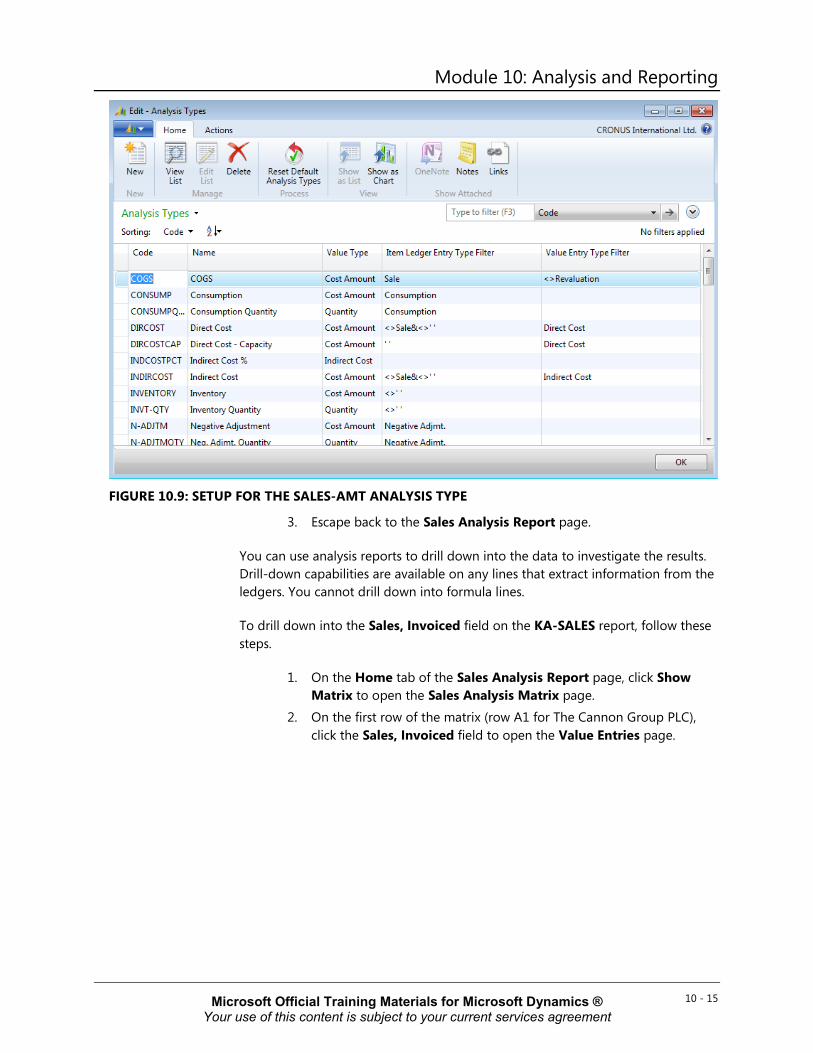
2. On the Home tab of the Analysis Type List page, click Setup to view the filters for each analysis type.
10 - 14 Microsoft Official Training Materials for Microsoft Dynamics ® Your use of this content is subject to your current services agreement
Module 10: Analysis and Reporting
FIGURE 10.9: SETUP FOR THE SALES-AMT ANALYSIS TYPE
3. Escape back to the Sales Analysis Report page.
You can use analysis reports to drill down into the data to investigate the results. Drill-down capabilities are available on any lines that extract information from the ledgers. You cannot drill down into formula lines.
To drill down into the Sales, Invoiced field on the KA-SALES report, follow these steps.
1. On the Home tab of the Sales Analysis Report page, click Show Matrix to open the Sales Analysis Matrix page.
2. On the first row of the matrix (row A1 for The Cannon Group PLC), click the Sales, Invoiced field to open the Value Entries page.
10 - 15 Microsoft Official Training Materials for Microsoft Dynamics ® Your use of this content is subject to your current services agreement
Trade in Microsoft Dynamics® NAV 2013
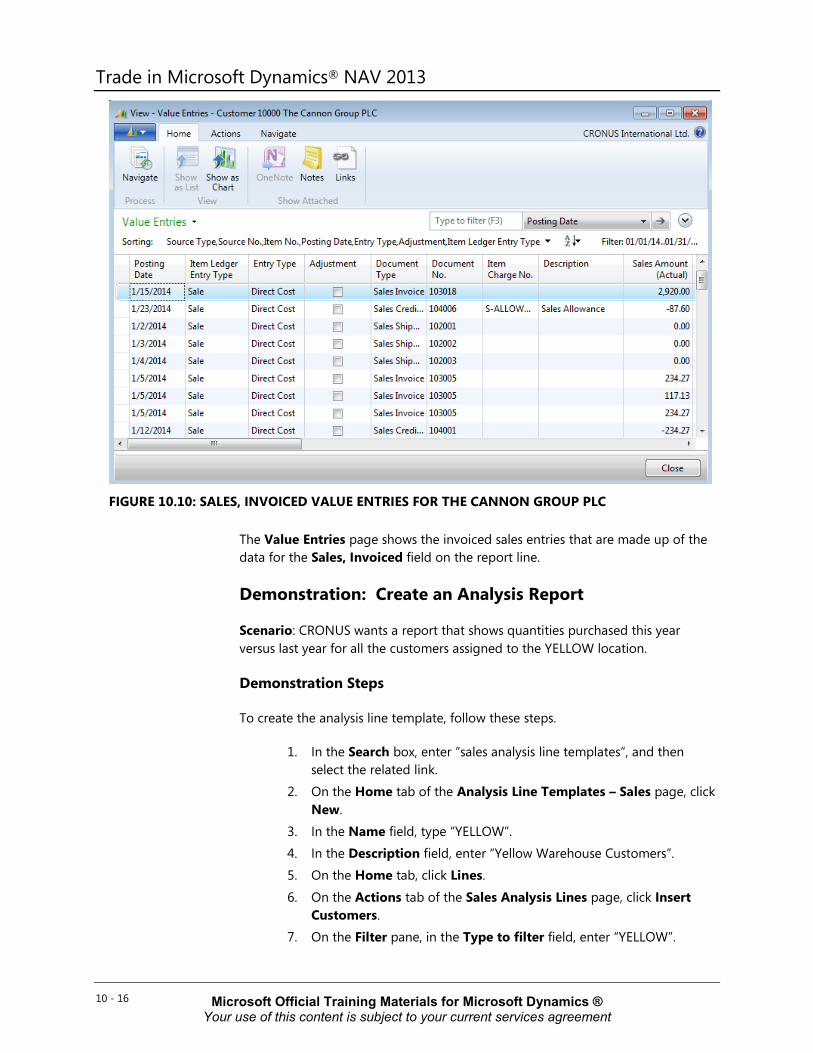
FIGURE 10.10: SALES, INVOICED VALUE ENTRIES FOR THE CANNON GROUP PLC
The Value Entries page shows the invoiced sales entries that are made up of the data for the Sales, Invoiced field on the report line.
Demonstration: Create an Analysis Report
Scenario: CRONUS wants a report that shows quantities purchased this year versus last year for all the customers assigned to the YELLOW location.
Demonstration Steps
To create the analysis line template, follow these steps.
1. In the Search box, enter “sales analysis line templates”, and then select the related link.
2. On the Home tab of the Analysis Line Templates – Sales page, click New.
3. In the Name field, type “YELLOW”. 4. In the Description field, enter “Yellow Warehouse Customers”. 5. On the Home tab, click Lines.
6. On the Actions tab of the Sales Analysis Lines page, click Insert Customers.
7. On the Filter pane, in the Type to filter field, enter “YELLOW”.
10 - 16 Microsoft Official Training Materials for Microsoft Dynamics ® Your use of this content is subject to your current services agreement

Module 10: Analysis and Reporting 8. On the drop-down menu, select Location Code, and then press Enter
or Tab.
9. Select all lines and then click OK. The customer information for all customers assigned to YELLOW location is copied to the sales analysis lines.
10. Select all lines that contain a customer and then, on the Actions tab, click Renumber Lines.
11. In the Start Row Ref. No. field, type “Y1” and then click OK. 12. Click OK to close the message. 13. In the first blank row that appears after the customer names, in the
Description field, type “Yellow Warehouse Customers, Total”. 14. In the Type field, select Formula. 15. In the Range field, type “Y1..Y34” to include all customer lines. 16. Use the Choose Columns function to move the Bold field into view.
17. On the Yellow Warehouse Customers, Total line, select the Bold check box.
FIGURE 10.11: COMPLETED SALES ANALYSIS LINES FOR THE YELLOW TEMPLATE
18. Click OK to close the Sales Analysis Lines page.
19. Click OK to close the Analysis Line Templates - Sales page.
10 - 17 Microsoft Official Training Materials for Microsoft Dynamics ® Your use of this content is subject to your current services agreement
Trade in Microsoft Dynamics® NAV 2013 To create the analysis column template and enter the first column row, follow these steps.
1. In the Search box, enter “sales analysis column templates”, and then select the related link.
2. On the Home tab of the Analysis Column Templates – Sales page, click New.
3. In the Name field, type “QUANTITY”. 4. In the Description field, type “Quantity”. 5. Make sure that the QUANTITY line is still selected. On the Home tab,
click Columns.
6. In the Column No. field, type “A1”. 7. In the Column Header field, type “Quantity Invoiced”. 8. Select the Invoiced check box. 9. Select the Show Opposite Sign check box.
10. In the Analysis Type Code field, select SALES-QTY. 11. In the Rounding Factor field, enter “1”.
To enter the next column row, follow these steps.
1. Go to the next line.
2. In the Column No. field, type “A2”. 3. In the Column Header field, type “LY: Quantity Invoiced”. 4. Select the Invoiced check box.
5. Select the Show Opposite Sign check box. 6. In the Comparison Date Formula field, type “-1Y”. 7. In the Analysis Type Code field, select SALES-QTY. 8. In the Rounding Factor field, enter “1”.
To enter the last column row and finish creating the column template, follow these steps.
1. Go to the next line. 2. In the Column No. field, type “B1”.
3. In the Column Header field, type “Change %”. 4. In the Column Type field, select Formula.
10 - 18 Microsoft Official Training Materials for Microsoft Dynamics ® Your use of this content is subject to your current services agreement
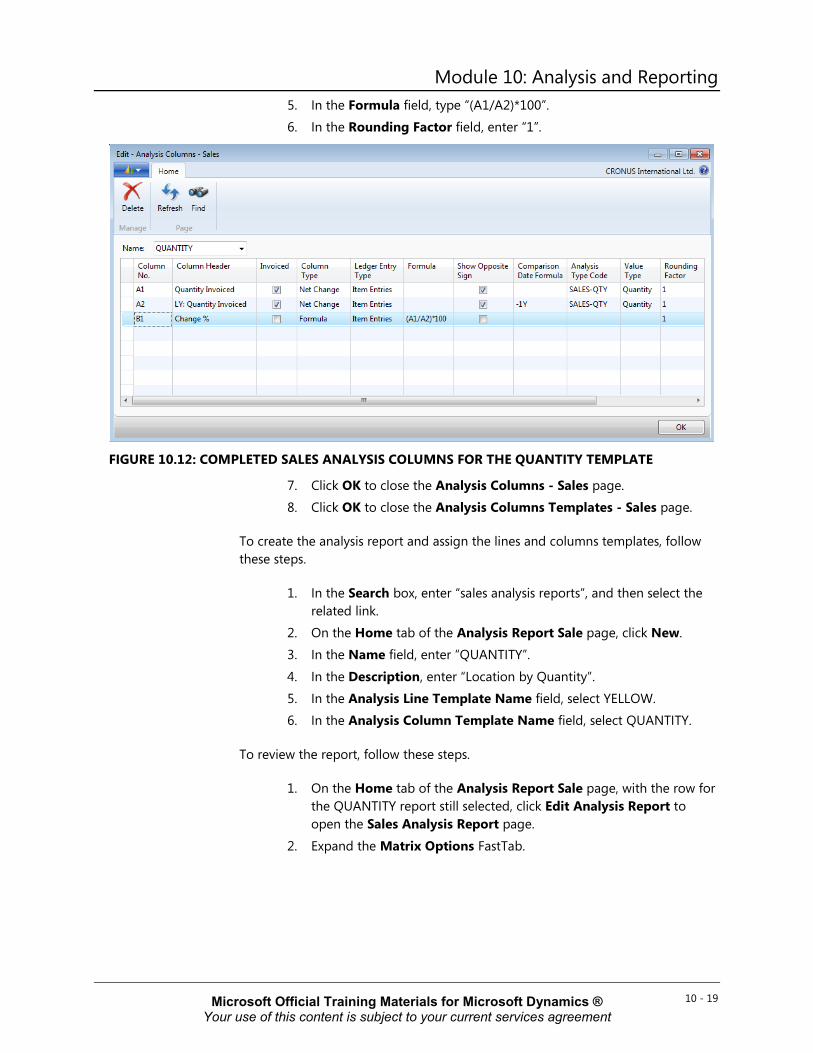
Module 10: Analysis and Reporting 5. In the Formula field, type “(A1/A2)*100”. 6. In the Rounding Factor field, enter “1”.
FIGURE 10.12: COMPLETED SALES ANALYSIS COLUMNS FOR THE QUANTITY TEMPLATE
7. Click OK to close the Analysis Columns - Sales page. 8. Click OK to close the Analysis Columns Templates - Sales page.
To create the analysis report and assign the lines and columns templates, follow these steps.
1. In the Search box, enter “sales analysis reports”, and then select the related link.
2. On the Home tab of the Analysis Report Sale page, click New. 3. In the Name field, enter “QUANTITY”.
4. In the Description, enter “Location by Quantity”. 5. In the Analysis Line Template Name field, select YELLOW. 6. In the Analysis Column Template Name field, select QUANTITY.
To review the report, follow these steps.
1. On the Home tab of the Analysis Report Sale page, with the row for the QUANTITY report still selected, click Edit Analysis Report to open the Sales Analysis Report page.
2. Expand the Matrix Options FastTab.
10 - 19 Microsoft Official Training Materials for Microsoft Dynamics ® Your use of this content is subject to your current services agreement

Trade in Microsoft Dynamics® NAV 2013 3. In the View by field, select Year. 4. On the Home tab, click Show Matrix to open the Sales Analysis
Matrix page.
FIGURE 10.13: SALES ANALYSIS MATRIX FOR THE QUANTITY REPORT
The report contains quantity statistics for the YELLOW location customers for the current and previous year.
When Kevin prints this report, he wants it to show only those customers who bought from CRONUS this or last year. To achieve this, he must change the line template.
To change the line template, follow these steps.
1. Close the Sales Analysis Matrix page.
2. On the Home tab of the Sales Analysis Report page, click Set Up Lines.
3. On each line, in the Show field, select If Any Column Not Zero. 4. Click OK to close the Sales Analysis Lines page.
Note: This change does not affect the view in the Sales Analysis Matrix page.
10 - 20 Microsoft Official Training Materials for Microsoft Dynamics ® Your use of this content is subject to your current services agreement

Module 10: Analysis and Reporting To preview the printed report, follow these steps.
1. On the Home tab, the Sales Analysis Report page, click Print. 2. Click Preview.
Only customers who bought from CRONUS this year or last year appear on the report.
Procedure: Review Customer Groups and Item Groups
When you create analysis report line templates, you cannot select customer groups, item groups, or salespeople without setting up a corresponding dimension in an analysis view card.
As explained in the Module Overview, dimensions are data that you add (or have the program add) to entries to categorize them for analysis. You can use them to quickly analyze trends and compare statistics across a range of entries.
You define customer groups and salespeople as dimensions in Sales & Receivables Setup. Before you can use product groups in an analysis view card, they must be defined as dimensions in Inventory Setup.
To review customer groups and salesperson dimensions for use in analysis reports, follow these steps.
1. In the Search box, enter “sales & receivables setup”, and then select the related link.
2. On the Dimensions FastTab of the Sales & Receivables Setup page, notice that the Customer Group Dimension Code field is set to the CUSTOMERGROUP dimension, and that the Salesperson Dimension Code field is set to the SALESPERSON dimension.
3. Click OK to close the Sales & Receivables Setup page.
To review the product groups dimension for use in analysis reports, follow these steps.
1. In the Search box, enter “inventory setup”, and then select the related link.
2. On the Dimensions FastTab of the Inventory Setup page, notice that the Item Group Dimension Code field is currently blank.
3. Click OK to close the Inventory Setup page.
After you define these dimensions in setup, you can assign each one to an analysis view.
10 - 21 Microsoft Official Training Materials for Microsoft Dynamics ® Your use of this content is subject to your current services agreement

Trade in Microsoft Dynamics® NAV 2013
Note: Advanced dimensions functionality is necessary to use groups of objects in analysis reports. Generally, the two global dimensions are used for other reporting entities and are unavailable for analysis report grouping.
Note: To run analysis reports for groups that are based on dimensions, you must associate the analysis line template with an analysis view code. If you do not do this, and you select type “Customer Group/Item Group/sales person” in the Analysis Lines setup page, the analysis report will fail.
Procedure: Review Analysis View Setup
Analysis views specify how you want to analyze the dimension information that is posted on the general ledger entries, budgets, and so on. By using analysis views, you can retrieve information about dimensions based on the criteria that you have set.
In CRONUS, an analysis view card exists for customers who have the CUSTOMERGROUP and SALESPERSON dimensions.
To review the dimensions set up in the CUSTOMERS analysis view, follow these steps.
1. In the Search box, enter “sales analysis view card”. 2. Select the line for CUSTOMERS. On the Home tab, click View to open
the Sales Analysis View Card page.
10 - 22 Microsoft Official Training Materials for Microsoft Dynamics ® Your use of this content is subject to your current services agreement

Module 10: Analysis and Reporting 3. Expand the Dimensions FastTab.
FIGURE 10.14: SALES ANALYSIS VIEW CARD FOR THE CUSTOMERS ANALYSIS VIEW
As the example shows, this analysis view is set up with CUSTOMERGROUP and SALESPERSON dimensions. You can select up to three dimensions for each analysis view. You can also set up filters on dimensions that are not included in the analysis view by clicking Filter on the Navigate tab. No additional filters are set on this analysis view.
On the General FastTab, the Update on Posting check box is clear. This means that you must manually update the analysis view to include recent posted entries. You can update this view by clicking Update on the Home tab or by running the Update Analysis Views batch job.
To update now, follow these steps.
1. On the Home tab, click Update.
2. Close the Sales Analysis View Card and Analysis View List Sales pages.
10 - 23 Microsoft Official Training Materials for Microsoft Dynamics ® Your use of this content is subject to your current services agreement
Trade in Microsoft Dynamics® NAV 2013 Demonstration: Analyze the Quantity Purchased by Customer Groups
This is a continuation of the "Create an Analysis Report" demonstration.
Scenario: Now, Kevin must change the QUANTITY report to analyze the quantity that is purchased by customer groups for this year versus last year.
Demonstration Steps
To change the existing analysis report, follow these steps.
1. In the Search box, enter “sales analysis reports”, and then select the related link.
2. On the Analysis Report Sale page, select the line for the QUANTITY report, and then click Edit Analysis Report to open the Sales Analysis Report page.
3. On the General FastTab, in the Analysis Line Template field, select CUSTGROUPS.
4. Expand the Matrix Options FastTab. In the View by field, select Year.
5. On the Home tab, click Show Matrix.
The report updates to show quantity statistics for each customer group.
View and Change the Content of Analysis Reports
You can present and even change the content of analysis view reports in many ways from the Sales Analysis Report, Purchase Analysis Report, and Inventory Analysis Report pages. The different ways include the following:
• On the Home tab, click Show Matrix. Use the advanced filter and limit totals capabilities to interactively analyze the content of the reports.
• On the Home tab, click Print to print or preview the report. Use the options on the Options FastTab of the request page to change the report output.
• On the Home tab, click Export to Excel to export the report to Microsoft Excel. Use the features in Excel to customize and present the report.
10 - 24 Microsoft Official Training Materials for Microsoft Dynamics ® Your use of this content is subject to your current services agreement

Module 10: Analysis and Reporting Demonstration: Export an Analysis Report to Microsoft Excel
This is a continuation of the "Customize Analysis Report" demonstration.
Scenario: Kevin has to demonstrate to the sales staff the January 2014 turnover for its top customers. Kevin exports the KA-SALES analysis report to Microsoft
Excel so that he can use Excel’s features to create the presentation.
Demonstration Steps
To export the KA-SALES report to Microsoft Excel, follow these steps.
1. In the Search box, enter “sales analysis reports”, and then select the related link.
2. On the Analysis Report Sale page, select the line for the KA-SALES report.
3. On the Home tab, click Edit Analysis Report to open the Sales Analysis Report page.
4. Expand the Matrix Options FastTab.
5. In the View by field, select Month. 6. On the Home tab, click Export to Excel. 7. Click OK to create a new workbook. 8. If it applies, select the relevant server access to Excel, and then click
OK.
Microsoft Excel opens with the sales analysis report information.
10 - 25 Microsoft Official Training Materials for Microsoft Dynamics ® Your use of this content is subject to your current services agreement
Trade in Microsoft Dynamics® NAV 2013
Lab 10.1: Create an Analysis Report
Scenario
CRONUS management has asked you, the sales manager, to provide a sales report that shows sales by sales representatives for January 2014. The report has the following requirements:
• It can only include sales representatives assigned the SALESPERSON dimension.
• It must be broken down by invoiced sales and those that are not yet invoiced.
• It must include a final line that shows total sales by salespeople.
• The printed report can show only those salespeople who recorded sales in the report timeframe.
As the sales manager, you must first set up an analysis view by using the SALESPERSON dimension. Call the new analysis view SALESREPS. Then you must create a new analysis lines template and add the SALESREPS analysis view to this template before you select it in an analysis report. Before you set up the analysis column template, review existing templates to check whether you can reuse or change one. The final step is to print preview the report.
High Level Steps 1. Create a new analysis view so that is has a code of SALESREPS, a name
of Sales by Sales Representatives, and a dimension filter of SALESPERSON.
2. Create a new sales analysis line template with a code of SALESPERS, a description of Salespeople, and use the SALESREPS item analysis view. Make sure that you insert all the sales and, or purchase persons in the lines, and that you renumber the lines starting with row number S1. Also, add a final row called Total Sales with the formula to include all salesperson lines and make this line bold. Finally, set each line to print only if its value is not equal to zero.
3. Open the Sales Analysis Column Templates page and review the columns for the SALES template to verify that it contains the necessary information.
4. Create a new analysis report and name it SALES with a description of Sales by Salesperson. Use the SALESPERS line template and the SALES column template.
5. Open the Sales Analysis Report page for the SALES report, set the filters to view the analysis for January 2014, and then print preview the report.
10 - 26 Microsoft Official Training Materials for Microsoft Dynamics ® Your use of this content is subject to your current services agreement
Module 10: Analysis and Reporting Detailed Steps
1. Create a new analysis view so that is has a code of SALESREPS, a name of Sales by Sales Representatives, and a dimension filter of SALESPERSON. a. In the Search box, enter “sales analysis view card”, and then select
the related link. b. On the Home tab of the Analysis View List Sales page, click
New. c. On the General FastTab of the Sales Analysis View Card – Sales
page, in the Code field type “SALESREPS”. d. In the Name field, type “Sales by Sales Representatives”. e. On the Dimensions FastTab, in the Dimension 1 Code field,
select SALESPERSON.
f. On the Home tab, click Update to update the analysis view. g. Click OK to save the analysis view and close the Sales Analysis
View Card – Sales page. h. Close the Analysis View List Sales page.
2. Create a new sales analysis line template with a code of SALESPERS, a
description of Salespeople, and use the SALESREPS item analysis view. Make sure that you insert all the sales and, or purchase persons in the lines, and that you renumber the lines starting with row number S1. Also, add a final row called Total Sales with the formula to include all salesperson lines and make this line bold. Finally, set each line to print only if its value is not equal to zero. a. In the Search box, enter “sales analysis line templates”, and then
select the related link. b. On the Home tab, click New.
c. In the Name field, type “SALESPERS”. d. In the Description field, type “Salespeople”. e. In the Item Analysis View Code field, select SALESREPS. f. On the Home tab, click Lines.
g. On the Actions tab of the Sales Analysis Lines page, click Insert Sales/Purchase Persons.
h. On the Dimension Values List page, select all lines and then click OK.
i. On Sales Analysis Lines page, select all lines, and then, on the Actions tab, click Renumber Lines.
j. In the Start Row Ref. No. field, type “S1” and then click OK.
k. Click OK to close the message. l. In the first blank row that appears after the salesperson names, in
the Description field, type “Total Sales”.
10 - 27 Microsoft Official Training Materials for Microsoft Dynamics ® Your use of this content is subject to your current services agreement

Trade in Microsoft Dynamics® NAV 2013 m. In the Type field, select Formula. n. In the Range field, type “S1..S4” to include all salesperson lines.
o Select the Bold check box.
o. On each line, change the Show field to If Any Column Not Zero. p. Click OK to close the Sales Analysis Lines page.
q. Click OK to close the Analysis Line Templates - Sales page.
3. Open the Sales Analysis Column Templates page and review the columns for the SALES template to verify that it contains the necessary information. a. In the Search box, enter “sales analysis column templates”, and
then select the related link.
b. On the Analysis Column Templates – Sales page, select the line for the SALES template.
c. On the Home tab, click Columns to open the Analysis Columns – Sales page. The analysis column template provides the needed salesperson information.
d. Click OK to close the Analysis Columns - Sales page. e. Click OK to close the Analysis Columns Templates - Sales page.
4. Create a new analysis report and name it SALES with a description of Sales by Salesperson. Use the SALESPERS line template and the SALES column template. a. In the Search box, enter “sales analysis reports”, and then select
the related link. b. On the Home tab of the Analysis Report Sale page, click New. c. In the Name field, type “SALES”. d. In the Description, type “Sales by Salesperson”.
e. In the Analysis Line Template Name field, select SALESPERS. f. In the Analysis Column Template Name field, select SALES.
5. Open the Sales Analysis Report page for the SALES report, set the filters to view the analysis for January 2014, and then print preview the report. a. On the Home tab, click Edit Analysis Report. b. Expand the Matrix Options FastTab. c. In the View by field, select Month. d. On the Home tab, click Print. e. Click Preview and review the report.
10 - 28 Microsoft Official Training Materials for Microsoft Dynamics ® Your use of this content is subject to your current services agreement

Module 10: Analysis and Reporting
Analysis by Dimensions To analyze information by using multiple dimensions, companies can use the Analysis by Dimensions page. You can use this page to view amounts that are derived from analysis views.
With analysis by dimensions, you can do the following:
• Combine dimensions
• Filter entries
• Explore data from different perspectives
• View net change or balance at date numbers
• Select time periods
You cannot print this information directly. You can instead export it to Microsoft Excel and use all the Excel tools to create presentations and print data.
To learn more about analysis views, refer to the “Analysis Views and Reports” lesson in this training material.
Demonstration: Analyze Purchase Costs by Dimensions
In this demonstration, you create a purchase analysis by dimensions to explore the analysis by dimensions features.
Scenario: Vince, the operations manager at CRONUS, must determine the cost amount of the inventory at each location. He wants to filter by purchaser and by specific business groups. This requires the following dimensions:
• Location
• PURCHASER
• BUSINESSGROUP
Demonstration Steps
To create the analysis view card, follow these steps.
1. In the Search box, enter “purchase analysis view card”, and then select the related link.
2. On the Home tab of the Analysis View List Purchase page, click New.
3. On the Purch. Analysis View Card page, in the Code field, type “PURCHASER”.
4. In the Name field, type “Purchaser”. 5. Set the Starting Date field to January 28, 2014.
10 - 29 Microsoft Official Training Materials for Microsoft Dynamics ® Your use of this content is subject to your current services agreement

Trade in Microsoft Dynamics® NAV 2013 6. Select the Include Budgets check box. 7. Expand the Dimensions FastTab.
8. In the Dimension 1 Code field, select PURCHASER. 9. In the Dimension 2 Code field, select BUSINESSGROUP. 10. On the Home tab, click Update.
FIGURE 10.15: THE PURCHASER PURCH. ANALYSIS VIEW CARD
11. Click OK to close the Purch. Analysis View Card page. 12. Close the Analysis View List Purchase page.
Note: Because the location dimension is available in the Analysis by Dimensions page, the analysis view card is set up with only the PURCHASER and BUSINESSGROUP dimensions.
To review the total quantity and total cost by location by time period, follow these steps.
1. In the Search box, enter “purchase analysis by dimensions”, and then select the related link.
2. On the Analysis View List Purchase page, click the line for PURCHASER and then, on the HOME tab, click Edit Analysis View.
10 - 30 Microsoft Official Training Materials for Microsoft Dynamics ® Your use of this content is subject to your current services agreement

Module 10: Analysis and Reporting 3. On the Purch. Analysis by Dimensions page, on the General
FastTab, in the Show as Lines field, select Location.
4. Make sure that the Show as Columns field is set to Period and the Show Value As field is set to Cost Amount.
5. On the Home tab, click Show Matrix to open the Purch. Analysis by Dim Matrix page. Notice the values in the Total Quantity and Total Cost Amount fields.
FIGURE 10.16: PURCH. ANALYSIS BY DIM MATRIX
6. Close the Purch. Analysis by Dim Matrix page.
To review the analysis by dimension by quantity instead of cost amount, follow these steps.
1. On the Purch. Analysis by Dimensions page, in the Show Value As field on the General FastTab, select Quantity.
2. On Home tab, click Show Matrix. 3. Close the Purch. Analysis by Dim Matrix page.
10 - 31 Microsoft Official Training Materials for Microsoft Dynamics ® Your use of this content is subject to your current services agreement

Trade in Microsoft Dynamics® NAV 2013 To filter these results by purchaser and business group, follow these steps.
1. On the Purch. Analysis by Dimensions page, expand the Filters FastTab.
2. In the Purchaser Filter field, enter “RL”. 3. In the BusinessGroup Filter field, select INDUSTRIAL. 4. On the Home tab, click Show Matrix.
5. Close the Purch. Analysis by Dim Matrix page.
To reverse the lines and columns shown on the Purch. Analysis by Dim Matrix page, follow these steps.
1. On the Purch. Analysis by Dimensions page on the Navigate tab, click Reverse Lines and Columns.
2. On the Home tab, click Show Matrix.
FIGURE 10.17: PURCH. ANALYSIS BY DIM MATRIX THAT HAS REVERSED LINES AND COLUMNS
10 - 32 Microsoft Official Training Materials for Microsoft Dynamics ® Your use of this content is subject to your current services agreement

Module 10: Analysis and Reporting 3. Do not close the Purch. Analysis by Dim Matrix page.
To export the analysis by dimensions report to Excel, follow these steps.
1. On the Navigate tab, click Export to Excel. 2. If it applies, select the relevant server access to Excel and then click
OK
10 - 33 Microsoft Official Training Materials for Microsoft Dynamics ® Your use of this content is subject to your current services agreement
Trade in Microsoft Dynamics® NAV 2013
Lab 10.2: Analyze Item Sales by Area As the sales manager at CRONUS, you must analyze item sales by area for the year 2014. The analysis includes item numbers 1896-S to 766BC-C.
After you review the sales amounts of item sales by area, do the following:
• View the analysis as the cost of goods sold (COGS) amount and quantity.
• Compare the sales amounts for Peter Saddow with those for John Roberts.
• Export the sales amounts by John Roberts to an Excel workbook.
Note: Look for an existing analysis view that uses the AREA and SALESPERSON dimensions.
High Level Steps 1. Open the Sales Analysis View Card page and browse through the
existing analysis views to check whether one is set up with both the AREA and SALESPERSON dimensions. If this is the case, update it.
2. Set the filters for the DEFAULT analysis view to analyze the year's item sales by area for item numbers 1896-S through 766BC-C. Also, show column names, and then review the analysis view matrix.
3. View the same item sales by area by COGS amount, and then by quantity.
4. View the item sales by area by sales amount for salesperson Peter Saddow, and then for salesperson John Roberts. Export the data for John Roberts to Excel.
Detailed Steps 1. Open the Sales Analysis View Card page and browse through the
existing analysis views to check whether one is set up with both the AREA and SALESPERSON dimensions. If this is the case, update it.
a. In the Search box, enter “sales analysis view card”, and then select the related link.
b. Browse through the existing analysis views to check whether one is set up with both the AREA and SALESPERSON dimensions. The DEFAULT analysis view contains these dimensions.
c. Select the line for the DEFAULT analysis view. d. On the Home tab, click Update.
10 - 34 Microsoft Official Training Materials for Microsoft Dynamics ® Your use of this content is subject to your current services agreement

Module 10: Analysis and Reporting 2. Set the filters for the DEFAULT analysis view to analyze the year's item
sales by area for item numbers 1896-S through 766BC-C. Also, show column names, and then review the analysis view matrix. a. With the DEFAULT analysis view selected, on the Home tab, click
Edit Analysis View. b. On the General FastTab of the Sales Analysis by Dimensions
page, set the Show as Lines field to Item. c. In the Show as Columns field, select AREA. d. Expand the Filters FastTab. e. In the Item Filter field, enter “1896-S..766BC-C”.
f. Expand the Options FastTab. g. Make sure the Show Column Name check box is NOT selected. h. Expand the Matrix Options FastTab. i. In the View by field, select Year.
j. On the Home tab, click Show Matrix. k. Close the Sales Analysis by Dim Matrix page.
3. View the same item sales by area by COGS amount, and then by
quantity. a. On the General FastTab of the Sales Analysis by Dimensions
page, in the Show Value As field, select COGS Amount.
b. On the Home tab, click Show Matrix. c. Close the Sales Analysis by Dim Matrix page. d. On the General FastTab of the Sales Analysis by Dimensions
page, in the Show Value As field, select Quantity.
e. On the Home tab, click Show Matrix. f. Close the Sales Analysis by Dim Matrix page.
4. View the item sales by area by sales amount for salesperson Peter
Saddow, and then for salesperson John Roberts. Export the data for John Roberts to Excel. a. On the General FastTab of the Sales Analysis by Dimensions
page, in the Show Value As field, select Sales Amount.
b. On the Filters FastTab, in the Salesperson Filter field, enter “PS”. c. On the Home tab, click Show Matrix. d. Close the Sales Analysis by Dim Matrix page.
10 - 35 Microsoft Official Training Materials for Microsoft Dynamics ® Your use of this content is subject to your current services agreement
Trade in Microsoft Dynamics® NAV 2013 e. On the Filters FastTab of the Sales Analysis by Dimensions
page, in the Salesperson Filter field, enter “JR”.
f. On the Home tab, click Show Matrix. g. On the Navigate tab of the Sales Analysis by Dim Matrix page,
click Export to Excel. h. If it applies, select the relevant server access to Excel and then
click OK.
Sales and Purchase Budgets Companies use sales and purchase budget functionality for planning, forecasting, and tracking against performance.
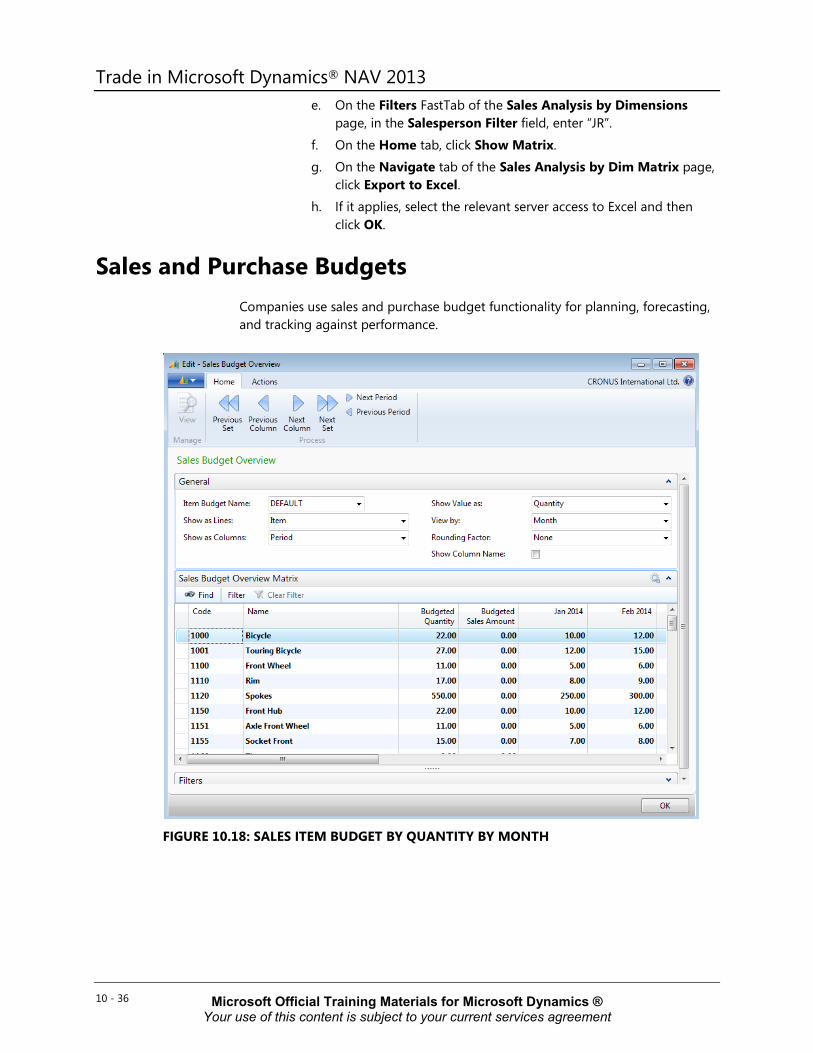
FIGURE 10.18: SALES ITEM BUDGET BY QUANTITY BY MONTH
10 - 36 Microsoft Official Training Materials for Microsoft Dynamics ® Your use of this content is subject to your current services agreement

Module 10: Analysis and Reporting In this example, a sales budget is created for items by quantity by month. Quantities entered in the month columns are totaled in the Budgeted Quantity field.
In Microsoft Dynamics NAV, budgets can be created at multiple levels (item, customer, customer group, and vendor), and for multiple time periods (day, week, month, quarter, year, accounting period). Time period entries are stored at the day level, but can be rolled up to higher levels.
Sales budgets can be specified in quantities, sales amounts, and COGS amounts, whereas purchase budgets can be specified in quantities and cost amounts. Except for some differences in the headings, the functionality in sales and purchase budgets is otherwise identical.
You can easily change budget layouts by using the fields in the General FastTab (available on both the Sales Budget Overview and Purchase Budget Overview pages).
You can filter budget data in the Filters FastTab. You can also import data from or export data to Microsoft Excel. You can also include it in analysis reports to track budgeted figures against actuals and to calculate differences.
Finally, budgets are user-defined and independent of one another. Therefore, users can work on individual budgets for the same levels, time periods, and value types.
Note: Sales and purchase budgets differ from budgets used in the Financial Management area of the program. They are completely independent of one another.
This lesson focuses on three potential tasks in the budgeting process:
• Create a budget
• Export the budget to Microsoft Excel
• Use the budget in an analysis report
10 - 37 Microsoft Official Training Materials for Microsoft Dynamics ® Your use of this content is subject to your current services agreement

Trade in Microsoft Dynamics® NAV 2013 Demonstration: Create a Purchase Budget
Scenario: Inga, the purchasing manager at CRONUS, must create a budget to forecast spending for each vendor for January through April 2014. This requires a new budget to be set up in Microsoft Dynamics NAV.
The first budget she sets up only has to include vendors 01254796 through 01905382. Therefore, she filters out all other vendors.
Demonstration Steps
To set up the purchase budget, follow these steps.
1. In the Search box, enter “purchase budgets”, and then select the related link.
2. On the Budget Names Purchase page, on the Home tab, click New. 3. In the Name field, type “PURCHASE”. 4. In the Description field, type “Purchase”. 5. In the Budget Dimension 1 Code field, select PURCHASER.
6. On the Home tab, click Edit Budget. 7. On the General FastTab of the Purchase Budget Overview page, in
the Show as Lines field, select Vendor. 8. Make sure that the Show as Columns field is set to Period.
9. Make sure that the Show Value as field is set to Cost Amount. 10. In the View by field, select Month. 11. In the Rounding Factor field, enter “1”. 12. Select the Show Column Name check box.
13. Expand the Filters FastTab. In the Date Filter field, enter “01/01/14..04/30/14”.
14. In the Vendor Filter field, enter “01254796..01905382”.
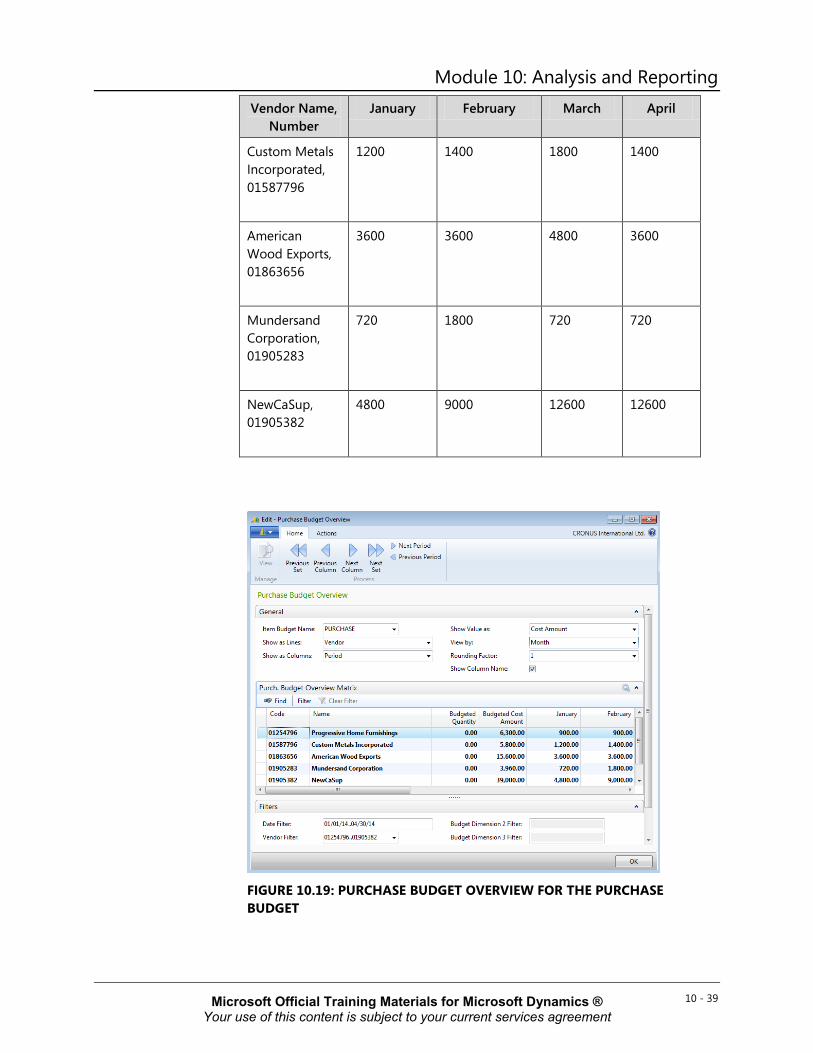
On the Purch. Budget Overview Matrix FastTab, enter the following values in the month columns.
Vendor Name, Number
January February March April
Progressive Home Furnishings 01254796
900 900 3600 900
10 - 38 Microsoft Official Training Materials for Microsoft Dynamics ® Your use of this content is subject to your current services agreement
Module 10: Analysis and Reporting Vendor Name,
Number January February March April
Custom Metals Incorporated, 01587796
1200 1400 1800 1400
American Wood Exports, 01863656
3600 3600 4800 3600
Mundersand Corporation, 01905283
720 1800 720 720
NewCaSup, 01905382
4800 9000 12600 12600
FIGURE 10.19: PURCHASE BUDGET OVERVIEW FOR THE PURCHASE BUDGET
10 - 39 Microsoft Official Training Materials for Microsoft Dynamics ® Your use of this content is subject to your current services agreement

Trade in Microsoft Dynamics® NAV 2013 Notice how entries in the month columns are totaled in the Budgeted Cost Amount field. When the Show Value As field (in the General FastTab) is set to Quantity, the values are instead totaled in the Budgeted Quantity field (in a sales budget, sales amounts are totaled in the Budgeted Sales Amount field, quantities in the Budgeted Quantity field, and COGS amount totals are not shown).
The values entered and viewed in the Purch. Budget Overview Matrix FastTab are stored in the Item Budget Entries table. To work directly with these entries, drill down into one of the column values. This opens the Item Budget Entries page. Working in this page, you can add a description for each budget entry and assign dimensions and other information as needed. For more information about the fields in the Item Budget Entries page, refer to the online Help.
Demonstration: Export Budget to Excel
You can export sales and purchase budgets in Microsoft Excel, make changes, and then import the budgets back into Microsoft Dynamics NAV. Follow the steps in the demonstration and then view the results.
Scenario: After Inga creates the purchase budget, she sends it to Vince, the operations manager, for approval.
Vince is traveling and does not have access to Microsoft Dynamics NAV. Inga exports the budget to Microsoft Excel and then sends it to him for changes. Vince wants to reduce purchases of a certain item from vendor NewCaSup. Therefore, he changes the amounts to the following:
• January: 3500
• February: 7500
• March: 10000
• April: 10000
After he makes the changes, Inga imports them into the budget in Microsoft Dynamics NAV.
Demonstration Steps
To export the budget to Microsoft Excel, follow these steps.
1. Make sure that the Purchase Budget Overview page is still open for the PURCHASE budget.
2. On the Actions tab, click Export to Excel. 3. Set the Option field to Create Workbook. 4. Click OK. 5. If it applies, select the relevant server access to Excel, and then click
OK.
10 - 40 Microsoft Official Training Materials for Microsoft Dynamics ® Your use of this content is subject to your current services agreement

Module 10: Analysis and Reporting As soon as the data finishes processing, the Microsoft Excel workbook opens. The filters set in Microsoft Dynamics NAV are visible in the Excel worksheet. By default, the program names the worksheet "Budget."
To change the budget in Excel, follow these steps.
1. Save the workbook as Purchase Budget. 2. Change the budget as indicated in the following table.
Vendor No.
January
February
March
April
01905382
3500
7500
10000
10000
3. Save and close the changed workbook. 4. On the Purchase Budget Overview page in Microsoft Dynamics
NAV, on the Actions tab, click Import from Excel to open the Import Item Budget From Excel page.
5. In the Workbook File Name field, click the AssistEdit button and browse to the Purchase Budget workbook.
6. The Worksheet Name field should automatically change to Budget. If it does not change, click the AssistEdit button and select Budget.
7. Accept all other default entries, and then click OK.
8. Click Yes to replace the existing entries and accept the message that appears.
The Microsoft Dynamics NAV budget updates with the new numbers for vendor NewCaSup.
Demonstration: Include a Budget in the Analysis Report
Use sales and purchase budgets in the analysis reports to track budgeted amounts against actuals. This demonstration shows how to use a sales budget in an analysis report.
Scenario: Kevin, the sales manager at CRONUS, must compare the company's customer sales against the company's budget figures for January 2014.
Demonstration Steps
To add budget information to the existing CUST1-BUDG report that shows actual amounts against budgeted amounts for each customer group, follow these steps.
1. In the Search box, enter “sales analysis reports”, and then click the selected link.
2. On the Analysis Report Sale page, select the CUST1-BUDG report.
10 - 41 Microsoft Official Training Materials for Microsoft Dynamics ® Your use of this content is subject to your current services agreement
Trade in Microsoft Dynamics® NAV 2013 3. On the Home tab, click Edit Analysis Report to open the Sales
Analysis Report page.
4. Expand the Matrix Options FastTab. 5. In the View by field, select Month. 6. On the Home tab, click Show Matrix to open the Sales Analysis
Matrix page.
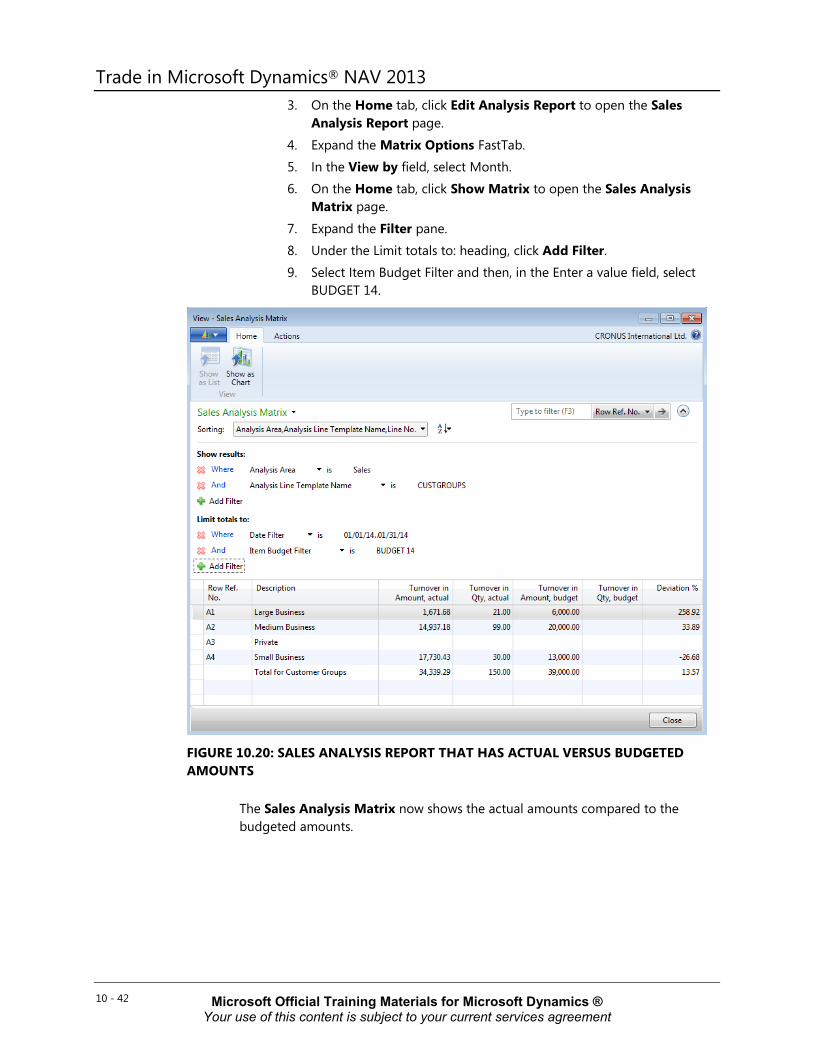
7. Expand the Filter pane. 8. Under the Limit totals to: heading, click Add Filter. 9. Select Item Budget Filter and then, in the Enter a value field, select
BUDGET 14.
FIGURE 10.20: SALES ANALYSIS REPORT THAT HAS ACTUAL VERSUS BUDGETED AMOUNTS
The Sales Analysis Matrix now shows the actual amounts compared to the budgeted amounts.
10 - 42 Microsoft Official Training Materials for Microsoft Dynamics ® Your use of this content is subject to your current services agreement
Module 10: Analysis and Reporting
Module Review Module Review and Takeaways
Companies exhaust much effort to collect accurate data. Typically, this effort results in improved analysis of the company’s performance and improvements in its business operations.
The Analysis and Reporting functionality in Microsoft Dynamics NAV is easy to use and provides high levels of integration between budgets, analysis review, reports and source data. Users do not have to have a background in Finance or Accounting to use this functionality.
With the Reporting functionality, you can do the following:
• Calculate a variance and move budget figures between Microsoft Dynamics NAV and Microsoft Excel.
• Use the budget features to create sales budgets and purchase budgets on a detailed level.
• Use budget version control to work on individual budgets at the same time.
The program makes it easy to compare analysis report data against budgets by using dimensions and dimension filters, without the need for high levels of technical training or custom programming.
Test Your Knowledge
Test your knowledge with the following questions.
1. Where must you set up customer groups, item groups, and salespeople before you use them in an Analysis View Card?
( ) Sales & Receivables Setup
( ) Purchases & Payables Setup
( ) General Ledger Setup
( ) Inventory Setup
10 - 43 Microsoft Official Training Materials for Microsoft Dynamics ® Your use of this content is subject to your current services agreement
Trade in Microsoft Dynamics® NAV 2013 2. Explain the difference between the line template and column template that is
used when you create an analysis report.
3. How do you set up a budget to enter a quantity of items to be purchased or sold?
4. List three ways that you can present analysis reports.
10 - 44 Microsoft Official Training Materials for Microsoft Dynamics ® Your use of this content is subject to your current services agreement

Module 10: Analysis and Reporting
Test Your Knowledge Solutions
Module Review and Takeaways
1. Where must you set up customer groups, item groups, and salespeople before you use them in an Analysis View Card?
(√) Sales & Receivables Setup
( ) Purchases & Payables Setup
( ) General Ledger Setup
( ) Inventory Setup
2. Explain the difference between the line template and column template that is used when you create an analysis report.
MODEL ANSWER:
Line templates define the objects to analyze in an analysis report, such as customers, vendors, customer groups, items, or formulas. Column templates define the parameters that are used to analyze the objects, such as quantities and sales and cost amounts. The defined lines are listed as rows in the report and the defined columns are listed as columns.
3. How do you set up a budget to enter a quantity of items to be purchased or sold?
MODEL ANSWER:
Set the Show Value field to Quantity on the General FastTab of the Purchase Budget Overview or Sales Budget Overview page.
4. List three ways that you can present analysis reports.
MODEL ANSWER:
Printed document, print preview from the screen, and export to Microsoft Excel.
10 - 45 Microsoft Official Training Materials for Microsoft Dynamics ® Your use of this content is subject to your current services agreement

Trade in Microsoft Dynamics® NAV 2013
10 - 46 Microsoft Official Training Materials for Microsoft Dynamics ® Your use of this content is subject to your current services agreement