Modif Genetic
24
7/26/2019 Modif Genetic http://slidepdf.com/reader/full/modif-genetic 1/24 Abstract Numerous analytical methods, both qualitative and quantitative, have been developed to determine reli- ably the presence and/or the amount of genetically modi- fied organisms (GMOs) in agricultural commodities, in raw agricultural materials and in processed and refined ingredients. In addition to the “classical” methods for DNA and protein analysis, e.g. polymerase chain reac- tion and enzyme linked immunosorbent analysis, certain types of GMO-containing matrices can be profiled by complementary chemical analysis methods such as chro- matography and near infrared spectroscopy. This review summarises the status of the most widely used GMO analysis technologies, identifies new areas of analytical investigation and discusses current needs and future challenges. Keywords Genetically modified organisms · Polymerase chain reaction · Enzyme-linked immunosorbent analysis · Chromatography · Near infrared spectroscopy Introduction Agricultural biotechnology has opened new avenues in the development of plants for the production of food, feed, fibre, forest and other products. In the few years since the first commercial introduction of a genetically modified organism (GMO), the cultivation of several transgenic crop species has grown rapidly to more than 40 million ha worldwide [1], i.e. approximately 4% of the total world acreage. GMOs can be defined as organisms in which the ge- netic material (DNA) has been altered in a way that does not occur naturally by mating or natural recombination, i.e. by being genetically modified (GM) or by recombi- nant DNA technology. The addition of foreign genes has often been used in plants to produce novel proteins that confer pest and disease tolerance and, more recently, to improve the chemical profile of the processed product, e.g. vegetable oils. In the European Union (EU) and oth- er regions, the use of this technology, the consequent re- lease of GMOs in the environment and the marketing of GMO-derived food products are strictly regulated 1 [2, 3, 4, 5, 6]. The legal provisions are different for GMOs (i.e. transgenic organisms that have replicative capacity) and for GM-containing foods. One example of such a dis- crepancy is the existence of a de minimis threshold for food labelling (see later) that does not have its counter- part, for instance in the labelling of GM grains. The so- called “threshold regulation” specifies that foodstuffs must be subject to labelling where material derived from these GMOs is present in food ingredients in a propor- tion above 1% of the food ingredients individually con- sidered [5]. That limit is set at the level of ingredients and therefore, if a final product scores positive after a screening method, its respective ingredients should be quantitatively assayed to assess if it contains less or more than 1% GMO. Detection of DNA and/or proteins might become difficult when processed and highly re- fined ingredients, such as starch, sugar or vegetable oils, E. Anklam ( ✉ ) · P. Heinze · G. Van Den Eede European Commission, Joint Research Centre, Institute for Health and Consumer Protection, Food Products and Consumer Goods Unit, I-21020 Ispra, Italy e-mail: [email protected] Tel.: +39-332-785390, Fax: +39-332-785930 H. Pijnenburg · F. Gadani Philip Morris Europe, Research and Development, CH-2003 Neuchâtel, Switzerland Eur Food Res Technol (2002) 214:3–26 DOI 10.1007/s002170100415 REVIEW Elke Anklam · Ferruccio Gadani · Petra Heinze Hans Pijnenburg · Guy Van Den Eede Analytical methods for detection and determination of genetically modified organisms in agricultural crops and plant-derived food products Received: 19 February 2001 / Revised version: 7 August 2001 / Published online: 7 November 2001 © Springer-Verlag 2001 1 EU biotechnology legislation is mainly based on Directive 2001/18/EEC on the deliberate release into the environment of GMOs [2], as well as on Regulation 258/97/EEC on novel foods and novel food ingredients [3] and Regulation 1139/98/EEC con- cerning the compulsory indication of the labelling of two GMO products [Roundup Ready soybeans and Bt-176 maize)] [4] that had been placed on the market before the Novel Foods Regulation came into force. Recently, the labelling Regulation has been amended by Regulation 49/2000/EEC setting a 1% threshold for labelling requirements [5] and by Regulation 50/2000/EEC that demands labelling of additives and flavourings derived from GMOs [6].
-
Upload
anonymous-i09xwf5pdy -
Category
Documents
-
view
241 -
download
0
Transcript of Modif Genetic
7/26/2019 Modif Genetic
http://slidepdf.com/reader/full/modif-genetic 1/24
Abstract Numerous analytical methods, both qualitativeand quantitative, have been developed to determine reli-ably the presence and/or the amount of genetically modi-
fied organisms (GMOs) in agricultural commodities, inraw agricultural materials and in processed and refinedingredients. In addition to the “classical” methods forDNA and protein analysis, e.g. polymerase chain reac-tion and enzyme linked immunosorbent analysis, certaintypes of GMO-containing matrices can be profiled bycomplementary chemical analysis methods such as chro-matography and near infrared spectroscopy. This reviewsummarises the status of the most widely used GMOanalysis technologies, identifies new areas of analyticalinvestigation and discusses current needs and futurechallenges.
Keywords Genetically modified organisms ·Polymerase chain reaction · Enzyme-linkedimmunosorbent analysis · Chromatography · Nearinfrared spectroscopy
Introduction
Agricultural biotechnology has opened new avenues inthe development of plants for the production of food,feed, fibre, forest and other products. In the few yearssince the first commercial introduction of a geneticallymodified organism (GMO), the cultivation of severaltransgenic crop species has grown rapidly to more than40 million ha worldwide [1], i.e. approximately 4% of the total world acreage.
GMOs can be defined as organisms in which the ge-netic material (DNA) has been altered in a way that doesnot occur naturally by mating or natural recombination,
i.e. by being genetically modified (GM) or by recombi-nant DNA technology. The addition of foreign genes hasoften been used in plants to produce novel proteins thatconfer pest and disease tolerance and, more recently, toimprove the chemical profile of the processed product,e.g. vegetable oils. In the European Union (EU) and oth-er regions, the use of this technology, the consequent re-lease of GMOs in the environment and the marketing of GMO-derived food products are strictly regulated1 [2, 3,4, 5, 6].
The legal provisions are different for GMOs (i.e.transgenic organisms that have replicative capacity) andfor GM-containing foods. One example of such a dis-crepancy is the existence of a de minimis threshold forfood labelling (see later) that does not have its counter-part, for instance in the labelling of GM grains. The so-called “threshold regulation” specifies that foodstuffsmust be subject to labelling where material derived fromthese GMOs is present in food ingredients in a propor-tion above 1% of the food ingredients individually con-sidered [5]. That limit is set at the level of ingredientsand therefore, if a final product scores positive after ascreening method, its respective ingredients should bequantitatively assayed to assess if it contains less ormore than 1% GMO. Detection of DNA and/or proteinsmight become difficult when processed and highly re-fined ingredients, such as starch, sugar or vegetable oils,
E. Anklam (✉) · P. Heinze · G. Van Den EedeEuropean Commission, Joint Research Centre,Institute for Health and Consumer Protection,Food Products and Consumer Goods Unit, I-21020 Ispra, Italye-mail: [email protected].: +39-332-785390, Fax: +39-332-785930
H. Pijnenburg · F. GadaniPhilip Morris Europe, Research and Development,CH-2003 Neuchâtel, Switzerland
Eur Food Res Technol (2002) 214:3–26DOI 10.1007/s002170100415
R E V I E W
Elke Anklam · Ferruccio Gadani · Petra HeinzeHans Pijnenburg · Guy Van Den Eede
Analytical methods for detection and determinationof genetically modified organisms in agricultural crops
and plant-derived food products
Received: 19 February 2001 / Revised version: 7 August 2001 / Published online: 7 November 2001© Springer-Verlag 2001
1 EU biotechnology legislation is mainly based on Directive2001/18/EEC on the deliberate release into the environment of GMOs [2], as well as on Regulation 258/97/EEC on novel foodsand novel food ingredients [3] and Regulation 1139/98/EEC con-cerning the compulsory indication of the labelling of two GMOproducts [Roundup Ready soybeans and Bt-176 maize)] [4] thathad been placed on the market before the Novel Foods Regulationcame into force. Recently, the labelling Regulation has beenamended by Regulation 49/2000/EEC setting a 1% threshold forlabelling requirements [5] and by Regulation 50/2000/EEC thatdemands labelling of additives and flavourings derived fromGMOs [6].
7/26/2019 Modif Genetic
http://slidepdf.com/reader/full/modif-genetic 2/24
are considered. A food product might even have under-gone such extensive processing that ingredients of poten-tial GMO origin are no longer detectable.
The concept of the so-called negative list has been in-troduced in the Novel Foods Regulation [3] to deal withhighly processed foods in which no traces of DNAand/or protein can be found. The argument followed isthat for those samples, no analytical methods exist todistinguish between foods derived from GMOs andfoods derived from non-GMOs and consequently, thoseshould be exempted from labelling requirement. Theconcept and content of such a negative list are currentlyunder discussion among experts [7, 8]. If such a list were
established, the listed products would no longer be sub- ject to analytical testing and monitoring.The need to monitor and verify the presence and the
amount of GMOs in agricultural crops and in productsderived thereof has generated a demand for analyticalmethods capable of detecting, identifying and quantify-ing either the DNA introduced or the protein(s) ex-pressed in transgenic plants, because these componentsare considered fundamental constituents [9, 10, 11, 12,13, 14, 15]. In addition, for certain types of GM foodsuch as vegetable oils with altered fatty acid profiles,chemical analysis, such as chromatography and near in-frared spectroscopy, may be a complementary or alterna-tive tool for GMO detection.
Other aspects that should be taken into considerationare plant breeding processes and biological variabilityand their influence on the quantification of GMOs. Oneexample is the need for a method that could distinguishbetween two independent but related GMOs and onesimple GMO in which both traits have been combined(the so-called issue of stacking genes by breeding).
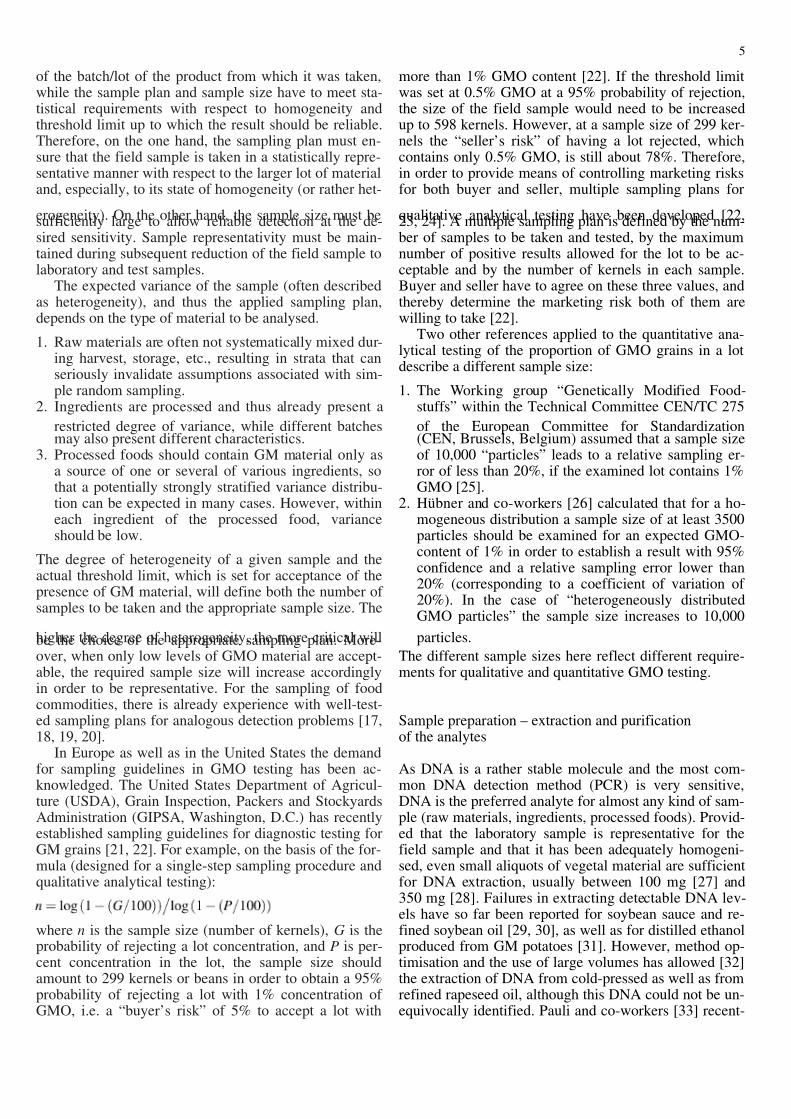
Methods to verify compliance with labelling regula-tions are mainly based on the detection of specific DNAfragments, e.g. by polymerase chain reaction (PCR) oron the detection of newly expressed proteins, e.g. by en-
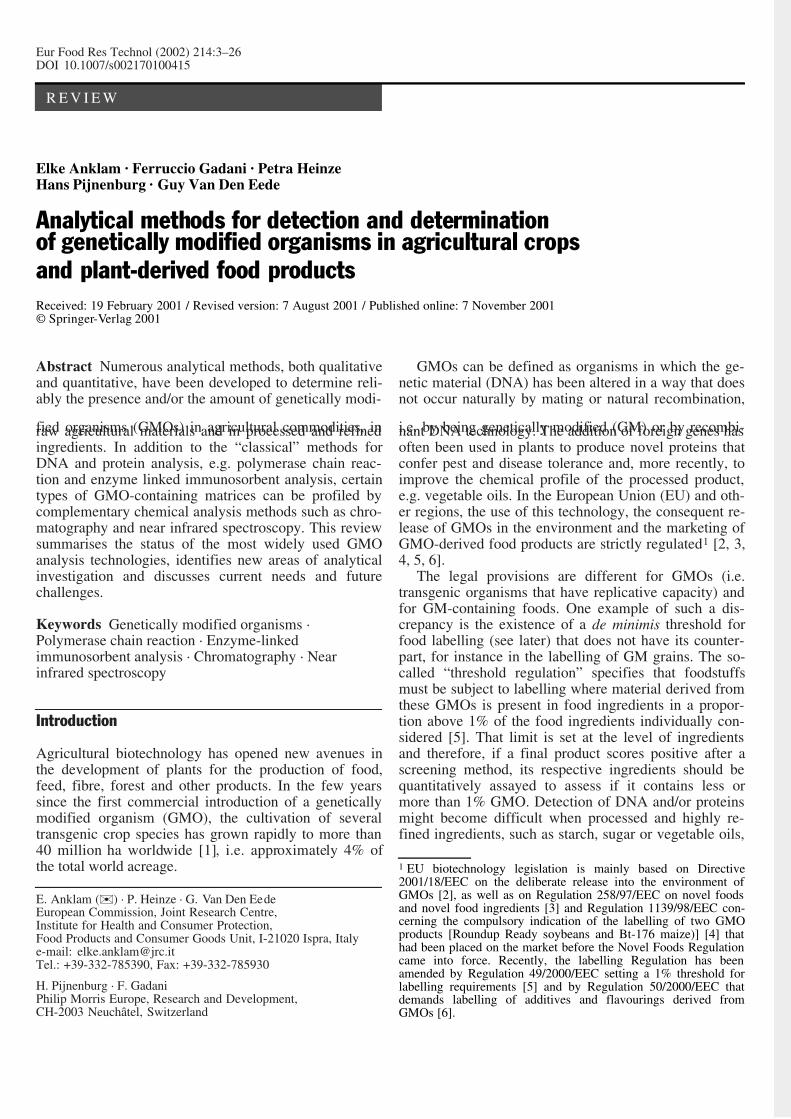
zyme-linked immunosorbent analysis (ELISA). Figure 1depicts a general outline of the different procedures toassay sampled food for the presence of GMOs.
In general this process consists of three different steps:
1. Detection (screening of GMOs) in order to gain a firstinsight into the composition of the food and agricul-tural product. Analytical methods for detection mustbe sensitive and reliable enough to obtain accurate
and precise results in all control laboratories, whichcan be achieved through inter-laboratory validation.
2. Identification to reveal how many GMOs are present,and if so, whether they are authorised within the EU(or other countries with regard to their regulations). Aprerequisite for the identification of GMOs is theavailability of detailed information on their molecularmake-up. Molecular registers that, along with the sci-entific data, contain the tools for control authorities todesign appropriate identification methods, are essen-tial to fulfill this task. The European Commission’sJoint Research Centre is in the process of setting upsuch a database, which will be used by the National
Competent Authorities.3. Quantification, in order to determine the amount of
one or more authorised GMOs in a product or seedlot, and to assess compliance with the threshold regu-lation. For this approach it is necessary to get a betterunderstanding of DNA/protein degradation duringprocessing and of the robustness of the analyticalmethods.
Although much progress has been made in the develop-ment of genetic analysis methods, such as those based onthe use of PCR, several other analytical technologies thatcan provide solutions to current technical issues in GMOanalysis, e.g. DNA chip technology and mass spectrome-try, are emerging. This review examines the different stepsthat are required for GMO analysis and summarises thestatus of most widely used GMO analysis technologies.Furthermore, it identifies new areas of analytical investi-gation and discusses current needs and future challenges.
Sampling and sample preparation
The sampling procedure determines the “representati-vity” of a result, whereas quality and quantity of analytesmay vary depending on the sample preparation. Sam-pling and sample preparation are thus crucial steps in theprocess of GMO detection [16]. The limit of detection of the analytical method as a whole is determined, not bythe most sensitive part of the procedure, but by the least.In most cases this is the sample size.
Sampling – sample size, homogeneity of the sampleand threshold limit
One of the major problems in analytical testing is thesampling procedure. A sample has to be representative
4
Fig. 1 Operational procedures for detection, identification andquantification of genetically modified organisms to comply withthe labelling regulation in the European Union
7/26/2019 Modif Genetic
http://slidepdf.com/reader/full/modif-genetic 3/24
of the batch/lot of the product from which it was taken,while the sample plan and sample size have to meet sta-tistical requirements with respect to homogeneity andthreshold limit up to which the result should be reliable.Therefore, on the one hand, the sampling plan must en-sure that the field sample is taken in a statistically repre-sentative manner with respect to the larger lot of materialand, especially, to its state of homogeneity (or rather het-
erogeneity). On the other hand, the sample size must besufficiently large to allow reliable detection at the de-sired sensitivity. Sample representativity must be main-tained during subsequent reduction of the field sample tolaboratory and test samples.
The expected variance of the sample (often describedas heterogeneity), and thus the applied sampling plan,depends on the type of material to be analysed.
1. Raw materials are often not systematically mixed dur-ing harvest, storage, etc., resulting in strata that canseriously invalidate assumptions associated with sim-ple random sampling.
2. Ingredients are processed and thus already present a
restricted degree of variance, while different batchesmay also present different characteristics.
3. Processed foods should contain GM material only asa source of one or several of various ingredients, sothat a potentially strongly stratified variance distribu-tion can be expected in many cases. However, withineach ingredient of the processed food, varianceshould be low.
The degree of heterogeneity of a given sample and theactual threshold limit, which is set for acceptance of thepresence of GM material, will define both the number of samples to be taken and the appropriate sample size. The
higher the degree of heterogeneity, the more critical willbe the choice of the appropriate sampling plan. More-over, when only low levels of GMO material are accept-able, the required sample size will increase accordinglyin order to be representative. For the sampling of foodcommodities, there is already experience with well-test-ed sampling plans for analogous detection problems [17,18, 19, 20].
In Europe as well as in the United States the demandfor sampling guidelines in GMO testing has been ac-knowledged. The United States Department of Agricul-ture (USDA), Grain Inspection, Packers and StockyardsAdministration (GIPSA, Washington, D.C.) has recentlyestablished sampling guidelines for diagnostic testing forGM grains [21, 22]. For example, on the basis of the for-mula (designed for a single-step sampling procedure andqualitative analytical testing):
where n is the sample size (number of kernels), G is theprobability of rejecting a lot concentration, and P is per-cent concentration in the lot, the sample size shouldamount to 299 kernels or beans in order to obtain a 95%probability of rejecting a lot with 1% concentration of GMO, i.e. a “buyer’s risk” of 5% to accept a lot with
more than 1% GMO content [22]. If the threshold limitwas set at 0.5% GMO at a 95% probability of rejection,the size of the field sample would need to be increasedup to 598 kernels. However, at a sample size of 299 ker-nels the “seller’s risk” of having a lot rejected, whichcontains only 0.5% GMO, is still about 78%. Therefore,in order to provide means of controlling marketing risksfor both buyer and seller, multiple sampling plans for
qualitative analytical testing have been developed [22,23, 24]. A multiple sampling plan is defined by the num-ber of samples to be taken and tested, by the maximumnumber of positive results allowed for the lot to be ac-ceptable and by the number of kernels in each sample.Buyer and seller have to agree on these three values, andthereby determine the marketing risk both of them arewilling to take [22].
Two other references applied to the quantitative ana-lytical testing of the proportion of GMO grains in a lotdescribe a different sample size:
1. The Working group “Genetically Modified Food-stuffs” within the Technical Committee CEN/TC 275
of the European Committee for Standardization(CEN, Brussels, Belgium) assumed that a sample sizeof 10,000 “particles” leads to a relative sampling er-ror of less than 20%, if the examined lot contains 1%GMO [25].
2. Hübner and co-workers [26] calculated that for a ho-mogeneous distribution a sample size of at least 3500particles should be examined for an expected GMO-content of 1% in order to establish a result with 95%confidence and a relative sampling error lower than20% (corresponding to a coefficient of variation of 20%). In the case of “heterogeneously distributedGMO particles” the sample size increases to 10,000
particles.
The different sample sizes here reflect different require-ments for qualitative and quantitative GMO testing.
Sample preparation – extraction and purificationof the analytes
As DNA is a rather stable molecule and the most com-mon DNA detection method (PCR) is very sensitive,DNA is the preferred analyte for almost any kind of sam-ple (raw materials, ingredients, processed foods). Provid-ed that the laboratory sample is representative for thefield sample and that it has been adequately homogeni-sed, even small aliquots of vegetal material are sufficientfor DNA extraction, usually between 100 mg [27] and350 mg [28]. Failures in extracting detectable DNA lev-els have so far been reported for soybean sauce and re-fined soybean oil [29, 30], as well as for distilled ethanolproduced from GM potatoes [31]. However, method op-timisation and the use of large volumes has allowed [32]the extraction of DNA from cold-pressed as well as fromrefined rapeseed oil, although this DNA could not be un-equivocally identified. Pauli and co-workers [33] recent-
5
7/26/2019 Modif Genetic
http://slidepdf.com/reader/full/modif-genetic 4/24
ly reported detection of DNA extracted from a large va-riety of food products and processing stages, although noDNA could be extracted from refined sugar and oil.
Protein detection methods require proteins with an in-tact tertiary or quaternary structure since they are basedon immunoassays, or the comparison of protein patternsin 1- or 2-dimensional gel electrophoresis. Protein detec-tion is, therefore, limited to fresh and unprocessed foods.
DNA isolation methods
The efficiency of the PCR, as with any other DNA assay,depends on DNA quality and purity. DNA quality is de-termined by its fragment length and its degree of damagedue to the exposure to heat, low pH and/or nucleases thatcause hydrolysis, depurination and/or enzymatic degra-dation. Therefore, DNA quality varies according to thematerial under examination, the degree of processing the
sample has been subjected to and the DNA extractionmethod applied. It is important to keep in mind thatDNA isolated from processed foods and certain agricul-tural materials such as cured tobacco leaf is of low quali-ty, with available target sequences being rather short, e.g.100–400 bp for soybean protein preparations and pro-cessed tomato products [12]. Thus, an appropriate choiceof primers in order to obtain short amplicons should bemade.
The purity of DNA can be severely affected by vari-ous contaminants in food matrices [34]. Contaminantsmay be substances originating from the material underexamination, e.g. polysaccharides, lipids and polyphe-nols [11, 35] or chemicals used during the DNA extrac-tion procedure, e.g. as reported for cetyltrimethylammo-nium bromide (CTAB), or hexadecyltrimethyl ammoni-um bromide, ROSE and the alkali method [28]. For ex-ample, Taq polymerase, the key enzyme used in the PCRreaction, is inhibited by polysaccharides, ethylenedi-
6
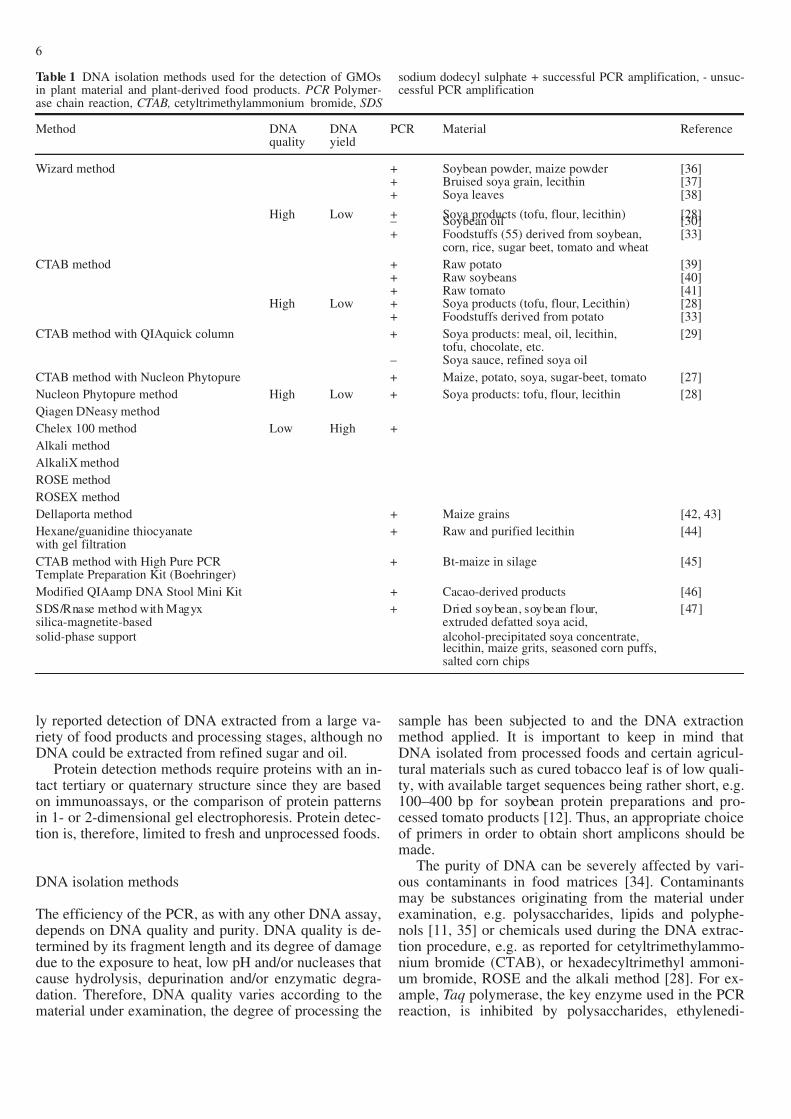
Table 1 DNA isolation methods used for the detection of GMOsin plant material and plant-derived food products. PCR Polymer-ase chain reaction, CTAB, cetyltrimethylammonium bromide, SDS
sodium dodecyl sulphate + successful PCR amplification, - unsuc-cessful PCR amplification
Method DNA DNA PCR Material Referencequality yield
Wizard method + Soybean powder, maize powder [36]+ Bruised soya grain, lecithin [37]+ Soya leaves [38]
High Low + Soya products (tofu, flour, lecithin) [28]– Soybean oil [30]+ Foodstuffs (55) derived from soybean, [33]
corn, rice, sugar beet, tomato and wheat
CTAB method + Raw potato [39]+ Raw soybeans [40]+ Raw tomato [41]
High Low + Soya products (tofu, flour, Lecithin) [28]+ Foodstuffs derived from potato [33]
CTAB method with QIAquick column + Soya products: meal, oil, lecithin, [29]tofu, chocolate, etc.
– Soya sauce, refined soya oil
CTAB method with Nucleon Phytopure + Maize, potato, soya, sugar-beet, tomato [27]
Nucleon Phytopure method High Low + Soya products: tofu, flour, lecithin [28]
Qiagen DNeasy method
Chelex 100 method Low High +
Alkali method
AlkaliX method
ROSE method
ROSEX method
Dellaporta method + Maize grains [42, 43]
Hexane/guanidine thiocyanate + Raw and purified lecithin [44]with gel filtration
CTAB method with High Pure PCR + Bt-maize in silage [45]Template Preparation Kit (Boehringer)
Modified QIAamp DNA Stool Mini Kit + Cacao-derived products [46]
SDS/Rnase method with Magyx + Dried soybean, soybean flour, [47]silica-magnetite-based extruded defatted soya acid,
solid-phase support alcohol-precipitated soya concentrate,lecithin, maize grits, seasoned corn puffs,salted corn chips
7/26/2019 Modif Genetic
http://slidepdf.com/reader/full/modif-genetic 5/24
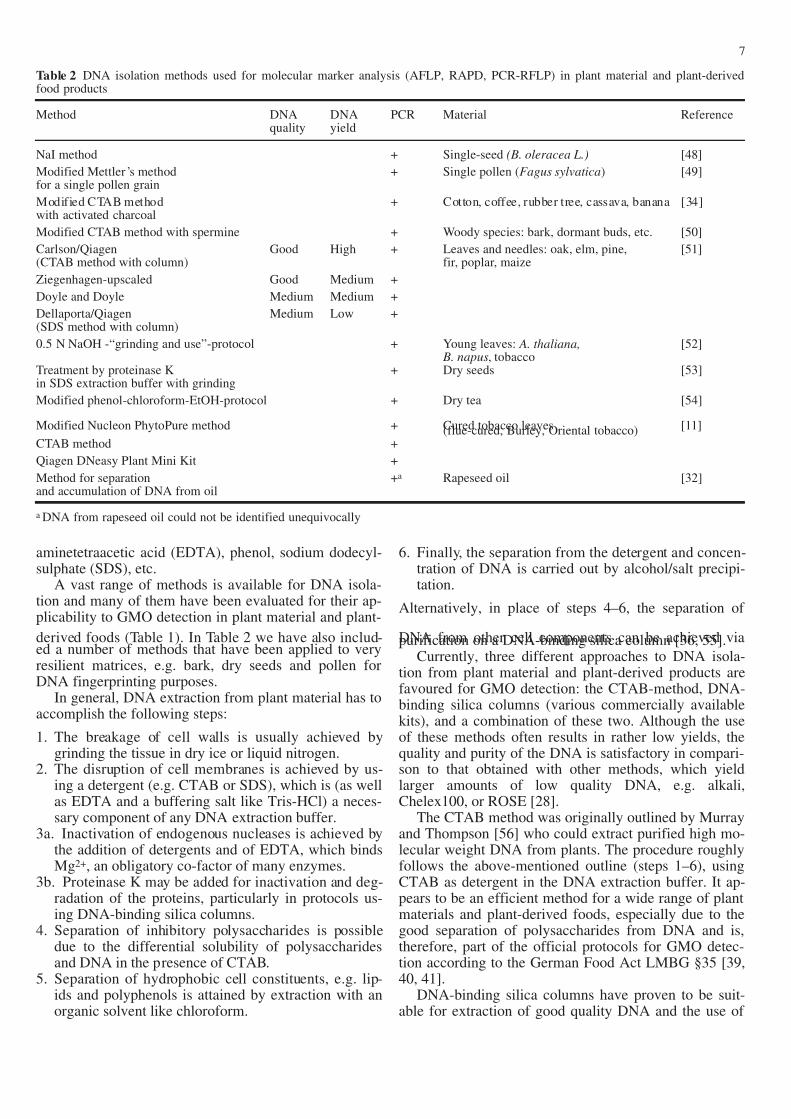
Table 2 DNA isolation methods used for molecular marker analysis (AFLP, RAPD, PCR-RFLP) in plant material and plant-derivedfood products
Method DNA DNA PCR Material Referencequality yield
NaI method + Single-seed (B. oleracea L.) [48]
Modified Mettler ’s method + Single pollen (Fagus sylvatica) [49]for a single pollen grain
Modified CTAB method + Cotton, coffee, rubber tree, cassava, banana [34]with activated charcoal
Modified CTAB method with spermine + Woody species: bark, dormant buds, etc. [50]
Carlson/Qiagen Good High + Leaves and needles: oak, elm, pine, [51](CTAB method with column) fir, poplar, maize
Ziegenhagen-upscaled Good Medium +
Doyle and Doyle Medium Medium +
Dellaporta/Qiagen Medium Low +(SDS method with column)
0.5 N NaOH -“grinding and use”-protocol + Young leaves: A. thaliana, [52] B. napus, tobacco
Treatment by proteinase K + Dry seeds [53]in SDS extraction buffer with grinding
Modified phenol-chloroform-EtOH-protocol + Dry tea [54]
Modified Nucleon PhytoPure method + Cured tobacco leaves [11](flue-cured, Burley, Oriental tobacco)CTAB method +
Qiagen DNeasy Plant Mini Kit +
Method for separation +a Rapeseed oil [32]and accumulation of DNA from oil
a DNA from rapeseed oil could not be identified unequivocally
7
aminetetraacetic acid (EDTA), phenol, sodium dodecyl-sulphate (SDS), etc.
A vast range of methods is available for DNA isola-tion and many of them have been evaluated for their ap-plicability to GMO detection in plant material and plant-
derived foods (Table 1). In Table 2 we have also includ-ed a number of methods that have been applied to veryresilient matrices, e.g. bark, dry seeds and pollen forDNA fingerprinting purposes.
In general, DNA extraction from plant material has toaccomplish the following steps:
1. The breakage of cell walls is usually achieved bygrinding the tissue in dry ice or liquid nitrogen.
2. The disruption of cell membranes is achieved by us-ing a detergent (e.g. CTAB or SDS), which is (as wellas EDTA and a buffering salt like Tris-HCl) a neces-sary component of any DNA extraction buffer.
3a. Inactivation of endogenous nucleases is achieved bythe addition of detergents and of EDTA, which bindsMg2+, an obligatory co-factor of many enzymes.
3b. Proteinase K may be added for inactivation and deg-radation of the proteins, particularly in protocols us-ing DNA-binding silica columns.
4. Separation of inhibitory polysaccharides is possibledue to the differential solubility of polysaccharidesand DNA in the presence of CTAB.
5. Separation of hydrophobic cell constituents, e.g. lip-ids and polyphenols is attained by extraction with anorganic solvent like chloroform.
6. Finally, the separation from the detergent and concen-tration of DNA is carried out by alcohol/salt precipi-tation.
Alternatively, in place of steps 4–6, the separation of
DNA from other cell components can be achieved viapurification on a DNA-binding silica column [36, 55].Currently, three different approaches to DNA isola-
tion from plant material and plant-derived products arefavoured for GMO detection: the CTAB-method, DNA-binding silica columns (various commercially availablekits), and a combination of these two. Although the useof these methods often results in rather low yields, thequality and purity of the DNA is satisfactory in compari-son to that obtained with other methods, which yieldlarger amounts of low quality DNA, e.g. alkali,Chelex100, or ROSE [28].
The CTAB method was originally outlined by Murrayand Thompson [56] who could extract purified high mo-lecular weight DNA from plants. The procedure roughlyfollows the above-mentioned outline (steps 1–6), usingCTAB as detergent in the DNA extraction buffer. It ap-pears to be an efficient method for a wide range of plantmaterials and plant-derived foods, especially due to thegood separation of polysaccharides from DNA and is,therefore, part of the official protocols for GMO detec-tion according to the German Food Act LMBG §35 [39,40, 41].
DNA-binding silica columns have proven to be suit-able for extraction of good quality DNA and the use of
7/26/2019 Modif Genetic
http://slidepdf.com/reader/full/modif-genetic 6/24
one of the commercially available kits is described in theofficial Swiss method for GMO detection [57]. However,it has been reported that polysaccharides tend to bind tosilica columns [26] thus affecting the efficiency of theseparation.
DNA analysis methods
Irrespective of a variety of potentially available methodsfor DNA analysis, only PCR in its different formats hasso far found broad application in GMO detection/analy-sis and is a generally accepted method for regulatorycompliance purposes.
PCR – principle and confirmatory assays
The PCR allows the millionfold amplification of a targetDNA fragment in a highly sensitive and specific manner.Therefore, two primers (synthetic oligonucleotides)
frame the target sequence. Each primer is complementa-ry to either one of the two strands from the doublestranded DNA target. Starting from a primer attached tothe target sequence, an enzyme (Taq-polymerase) cangenerate a complementary copy of this sequence. Thisallows the duplication of the target sequence in each re-action cycle. In consecutive reaction cycles the numberof target sequences grows exponentially according to thenumber of cycles.
Confirmation of the identity of a certain amplicon is anecessary step in the PCR analysis in order to ensure thatthe amplified DNA product actually corresponds to thechosen target sequence and is not a product of non-spe-
cific binding of the primers. Several methods are avail-able for this purpose:
1. The simplest approach is to control whether the PCRproducts have the expected size by gel electrophore-sis. However, there is a risk that an artefact of thesame size as the target sequence has been amplified.Therefore, the PCR product should at least be addi-tionally verified for its restriction endonuclease pro-file [27, 58].
2. A reliable but time consuming verification method isa Southern blot assay, whereby the amplicon is sepa-rated by gel electrophoresis, transferred onto a mem-brane and hybridised to a specific DNA probe [39, 40,41, 59].
3. Nested PCR allows discrimination between specificand non-specific amplification signals. Therefore, thePCR product is re-amplified using another primerpair, located in the inner region of the original targetsequence [29, 38].
4. The most reliable way to confirm the authenticity of aPCR product is its sequencing. The disadvantage of this approach is that only a few laboratories areequipped to carry it out for routine analysis. Hence, on-ly a few authors have reported on its use [42, 59, 60].
PCR strategies for GMO screening and identification
Any PCR-based detection strategy depends on a detailedknowledge of the transgenic DNA sequences and of themolecular structure of the GMOs in order to select theappropriate oligonucleotide primers. Besides the well-known points of consideration for the primer selection,e.g. no inverted repeats within one primer, no comple-
mentarity of one primer to the other, a GC-rich 3!end,etc., the choice will depend very much on the objectiveof the PCR analysis.
For routine screening purposes, one should focus ontarget sequences that are characteristic for the entire re-spective group to be screened. Genetic control elementssuch as the cauliflower mosaic virus (CaMV) 35S pro-moter (P-35S ) and Agrobacterium tumefaciens nos ter-minator (nos3!) are present in many GMOs currently onthe market [12]. The first GMO screening method wasoriginally introduced by Swiss and German scientists[27] and is based on the detection of P-35S and nos3!.However, in the meantime other GMOs have been ap-
proved, in which more tissue- and stage-specific as wellas non-heterologous regulatory genetic elements havebeen introduced [61]. Besides, as claimed in Directive2001/18/EEC [2], it can be expected that selection mark-ers for antibiotic resistance will be avoided in future.Additional target sequences are needed in order to guar-antee a complete screening procedure. A further aspect isthe choice of primers that allow detection of as manyvariants as possible of a GMO marker. For example,there are at least eight variants of P-35S used in GMcrops [12]. It should be stressed, however, that the detec-tion of these GMO markers is only an indication that theanalysed sample contains DNA from a GM plant, but
does not provide information on the specific trait that hasbeen engineered in the plant.For unequivocal identification, primer selection has to
be based on target sequences that are characteristic forthe individual transgenic organism, e.g. the cross-borderregion between integration site and transformed geneticelement of a specific GMO (the so-called “edge frag-ments”), or specific sequence alterations due to truncatedgene versions (i.e. cDNA, or altered codon usage). Forexample, a combination of screening and gene specificdetection methods has been used on Solanaceous cropsto detect the “universal” GMO markers P-35S and nos3!
and widely used virus resistance genes [62, 63].In a recent extensive review of GMO detection methods
applied to tobacco, the Task Force Genetically ModifiedTobacco – Detection Methods of the Cooperation Centrefor Scientific Research relative to Tobacco, Paris, France(CORESTA) [9] has reported on the successful applicationof the above-mentioned PCR strategies to different typesof dry tobacco leaves, and has highlighted both the advan-tages and drawbacks of confirmatory tests such as nestedPCR, restriction enzyme digestion of amplicons and thenucleotide sequencing of the detected genetic elements.
Generally, one should try to avoid target sequencesthat may occur as natural contaminants in the sample,
8
7/26/2019 Modif Genetic
http://slidepdf.com/reader/full/modif-genetic 7/24
9
Table 3 PCR methods in genetically modified organism (GMO) detection for maize. Scr Screening, ID identification
GMO product (company) Scr/ID Primer Amplicon Target gene or Target Referencelength genetic element sequence(bp) Reference
Bt-maize Event 176 ID cry IA(b) 184 cryIA(b) gene (from Bacillus [42](Ciba Seeds, USA, Ciba-Geigy/Novartis) thuringiensis)
bar 264 bar gene (from Streptomyceshygroscopicus)
35S-bar 365 Crossborder sequence: [65]CaMV-promoter/ bar gene
ampR 828 ampR gene (from PlasmidpUC19 from E. coli)
Control ivr1 226 exon 3 of ivr1 gene (corn- [66]specific single copy gene)
Bt-maize Event 176 ID Cry01/ 1914 cryIA(b) gene [67] [59](Ciba Seeds, USA, Ciba-Geigy/Novartis) Cry02 (from Bacillus thuringiensis)
Control TR03/ 137 18S-rDNA (highly [68]TR04 conserved sequence)
Bt-maize Event 176 ID Cry01/ 1914 cryIA(b) gene (from [69](Ciba Seeds, USA, Ciba-Geigy/Novartis) Cry02 Bacillus thuringiensis)
Cry03/ 211 Crossborder sequence: CDPK-Cry04 promoter/ cryIA(b) gene
Control Ivr1-F/ 226 exon 3 of ivr1 gene: (corn-
Ivr1-R specific single copy gene)
MaisGard MON810 maize ID mg1/mg2 401 Crossborder sequence: [70] [72](Monsanto, USA) (nested CaMV 35S promoter/ intron 1
PCR) of hsp70mg3/mg4 149 Crossborder sequence:
CaMV 35S promoter/exon 1of hsp70
Control hm1/hm2 175 HMG gene (highly [71](nested conserved sequence)PCR)
hm3/hm4 149
Bt-11 (Novartis Seeds, USA) ID IV01/ 431 Crossborder sequence: cryIA(b) [73], [80]CR01 intron 6 of adh1-1S pat [74],
gene/ cryIA(b) gene CaMV [75],CDPK [76],
PEPC [77],hsp70 [78],adh1-S1 [79]
Bt-maize Event 176 PE01/ 619 Crossborder sequence: PEPC(Ciba Seeds, USA, Ciba-Geigy/Novartis) CR01 promoter/ cryIA(b) gene
MaisGard MON810 maize HS01/ 194 Crossborder sequence:(Monsanto, USA) CR01 hsp70 intron 1/ cryIA(b) gene
LIBERTY T14 or T25 GM03/ 231 Crossborder sequence:(Hoechst Schering AgrEvo, Germany) PA01 CaMV 35S promoter/ pat gene
Bt-11-,Event 176-, MON810-, Scr CM01/02 220 CaMV 35S promoterLIBERTY-maize
Control ZE01/02 329 ze1 gene (corn-specificsingle-copy gene)
Maximizer maize ID CRY1A1/ 420 cryIA(b) gene [73] [82](Plant Genetic Systems, Ciba Seeds) (nested CRY1A2 from Bacillus thuringiensis)
PCR)CRY1A3/ 189CRY1A4
Control ZEIN1/ 485 ze1 gene (corn-specific [81](nested ZEIN2 single-copy gene)PCR)
ZEIN3/ 277ZEIN4
7/26/2019 Modif Genetic
http://slidepdf.com/reader/full/modif-genetic 8/24
i.e. DNA from plant viruses and bacteria, because of therisk of false positives. Therefore, a sample with a posi-tive signal in P-35S/nos3! screening should be analysedfor naturally occurring CaMV and A. tumefaciens infec-tion, respectively [64]. However, it should be consideredthat the host range of the CaMV is restricted to crucifer-ous plants such as oilseed rape, and that the nos3! termi-nator sequence is found only in certain strains of A. tu-mefaciens, which are pathogenic to certain crop species.As to the A. tumefaciens frequently found in soil, it isgenerally not virulent, i.e. it does not carry the Ti-plas-mid with the T-DNA and the oncogenes. Thus, the nos3!
gene and its control elements are not present in thesenaturally occurring strains.
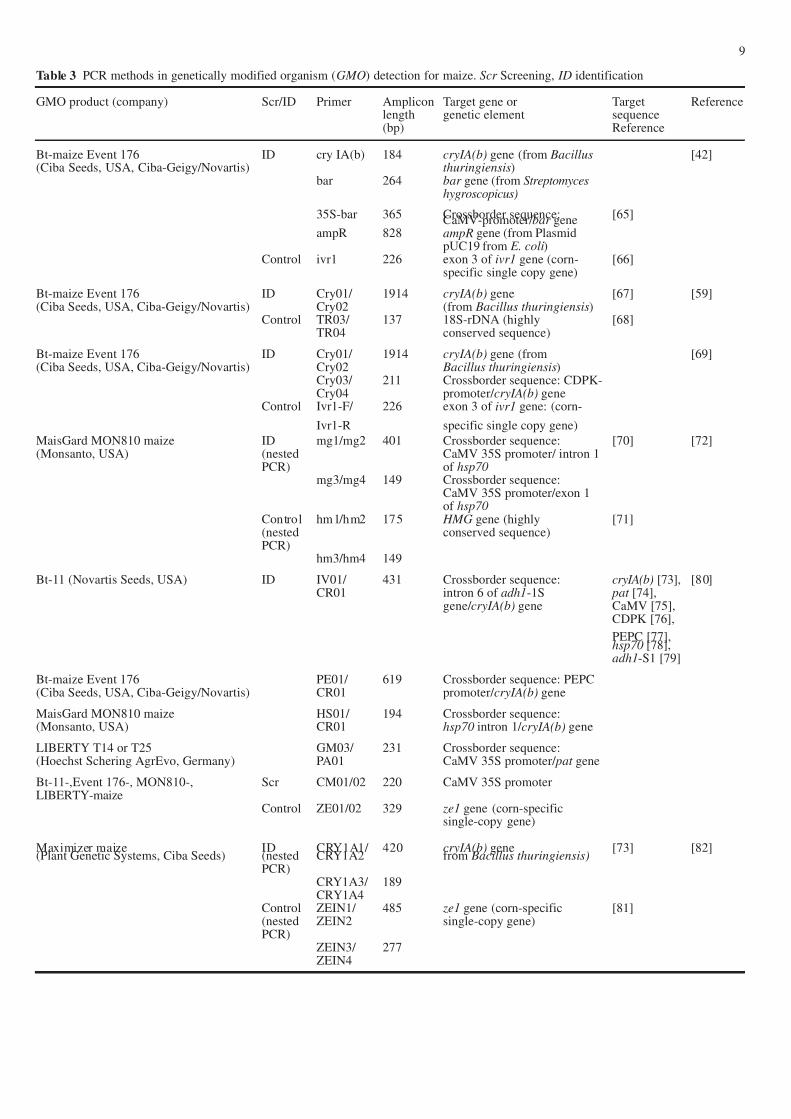
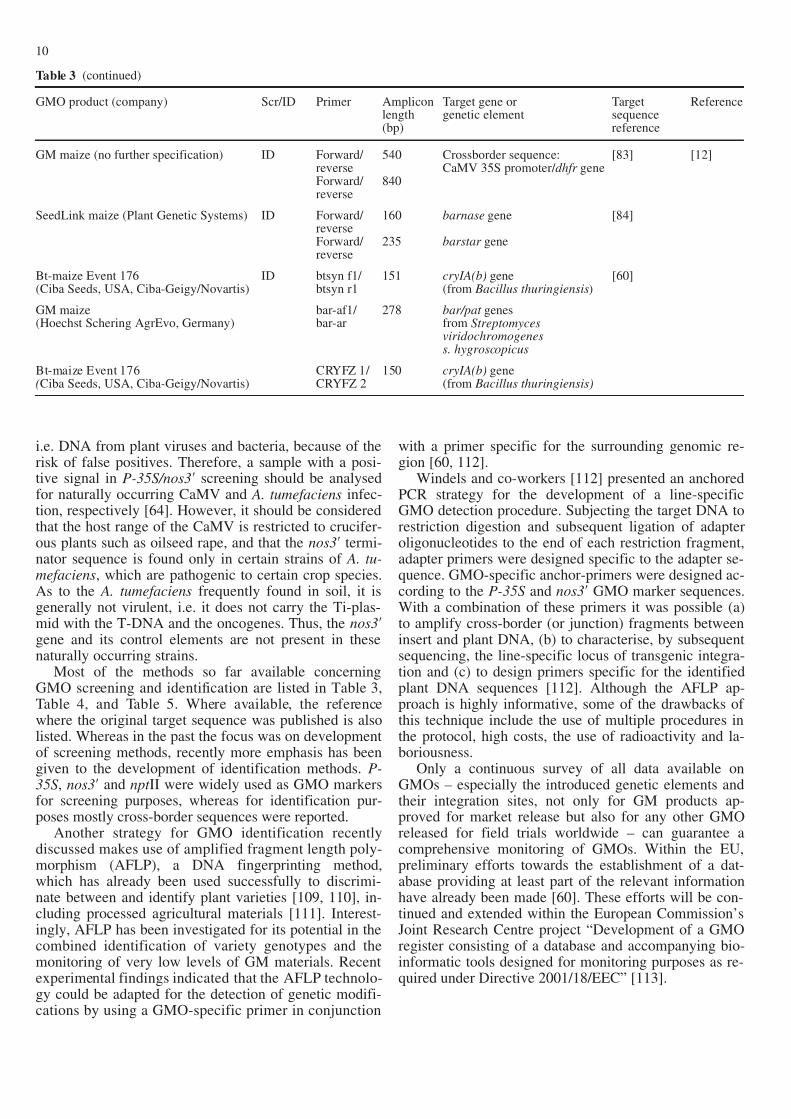
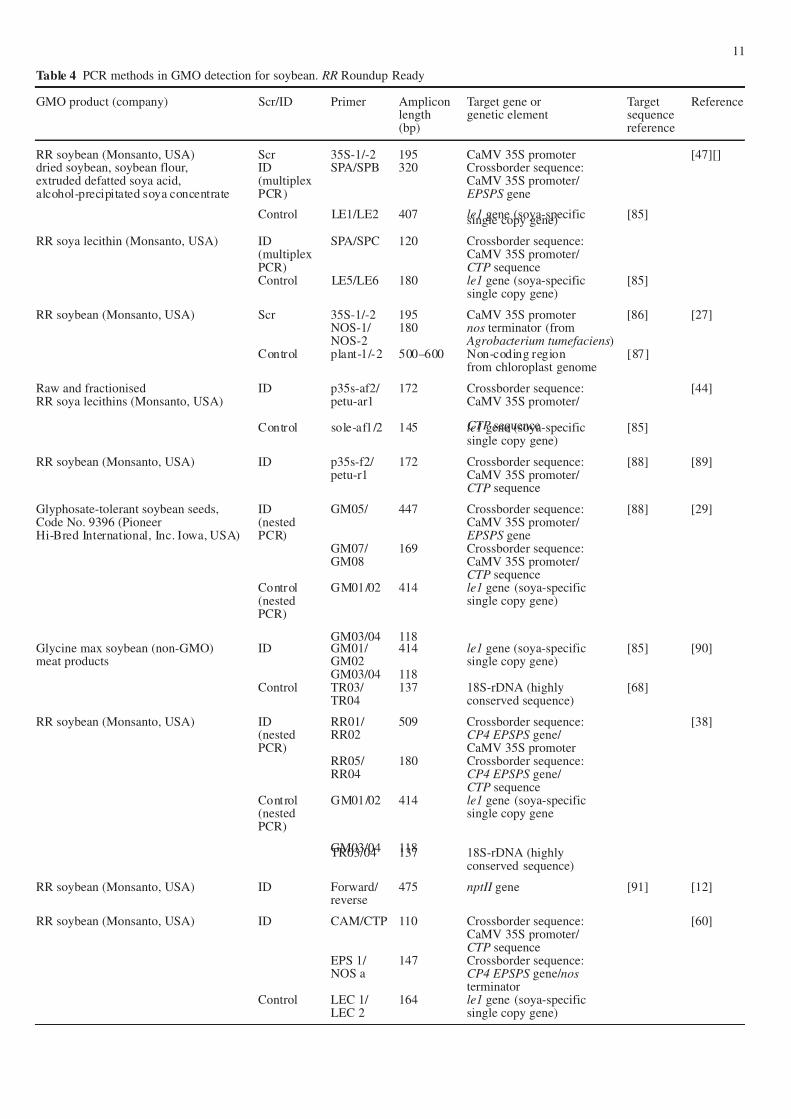
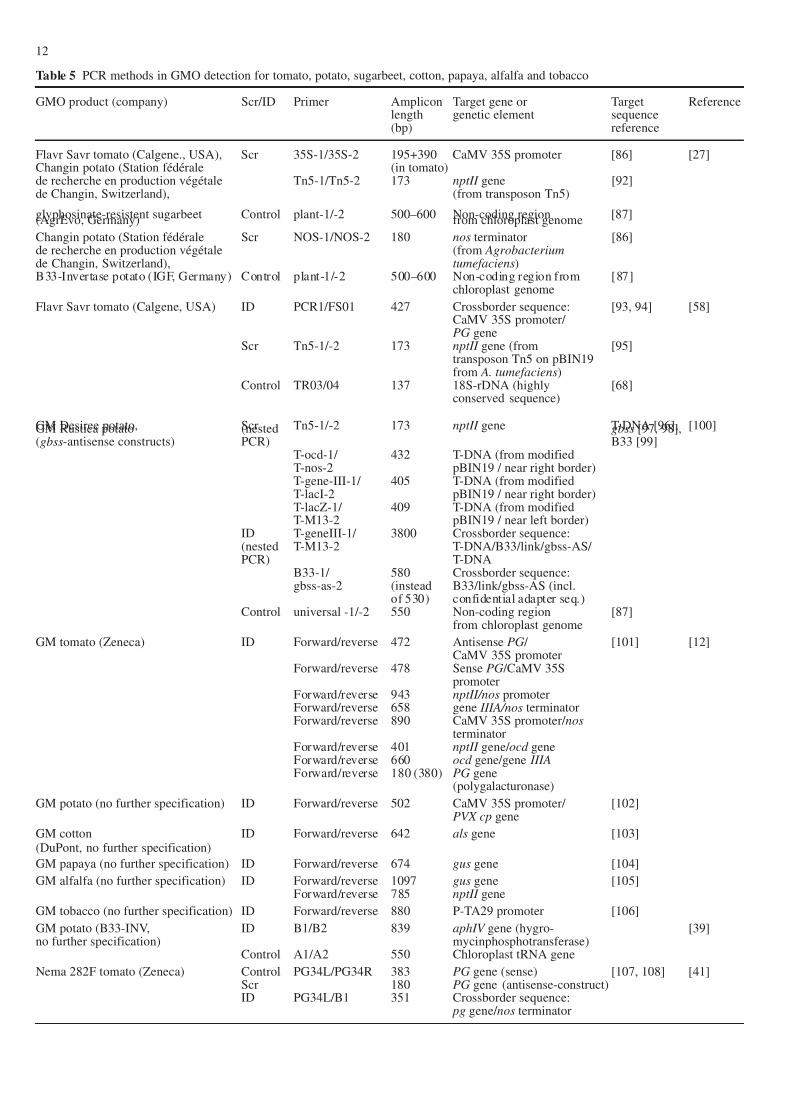
Most of the methods so far available concerningGMO screening and identification are listed in Table 3,Table 4, and Table 5. Where available, the referencewhere the original target sequence was published is alsolisted. Whereas in the past the focus was on developmentof screening methods, recently more emphasis has beengiven to the development of identification methods. P-35S , nos3! and npt II were widely used as GMO markersfor screening purposes, whereas for identification pur-poses mostly cross-border sequences were reported.
Another strategy for GMO identification recentlydiscussed makes use of amplified fragment length poly-morphism (AFLP), a DNA fingerprinting method,which has already been used successfully to discrimi-nate between and identify plant varieties [109, 110], in-cluding processed agricultural materials [111]. Interest-ingly, AFLP has been investigated for its potential in thecombined identification of variety genotypes and themonitoring of very low levels of GM materials. Recentexperimental findings indicated that the AFLP technolo-gy could be adapted for the detection of genetic modifi-cations by using a GMO-specific primer in conjunction
with a primer specific for the surrounding genomic re-gion [60, 112].
Windels and co-workers [112] presented an anchoredPCR strategy for the development of a line-specificGMO detection procedure. Subjecting the target DNA torestriction digestion and subsequent ligation of adapteroligonucleotides to the end of each restriction fragment,adapter primers were designed specific to the adapter se-quence. GMO-specific anchor-primers were designed ac-cording to the P-35S and nos3! GMO marker sequences.With a combination of these primers it was possible (a)to amplify cross-border (or junction) fragments betweeninsert and plant DNA, (b) to characterise, by subsequentsequencing, the line-specific locus of transgenic integra-tion and (c) to design primers specific for the identifiedplant DNA sequences [112]. Although the AFLP ap-proach is highly informative, some of the drawbacks of this technique include the use of multiple procedures inthe protocol, high costs, the use of radioactivity and la-boriousness.
Only a continuous survey of all data available onGMOs – especially the introduced genetic elements andtheir integration sites, not only for GM products ap-proved for market release but also for any other GMOreleased for field trials worldwide – can guarantee acomprehensive monitoring of GMOs. Within the EU,preliminary efforts towards the establishment of a dat-abase providing at least part of the relevant informationhave already been made [60]. These efforts will be con-tinued and extended within the European Commission’sJoint Research Centre project “Development of a GMOregister consisting of a database and accompanying bio-informatic tools designed for monitoring purposes as re-quired under Directive 2001/18/EEC” [113].
10
Table 3 (continued)
GMO product (company) Scr/ID Primer Amplicon Target gene or Target Referencelength genetic element sequence(bp) reference
GM maize (no further specification) ID Forward/ 540 Crossborder sequence: [83] [12]reverse CaMV 35S promoter/ dhfr geneForward/ 840reverse
SeedLink maize (Plant Genetic Systems) ID Forward/ 160 barnase gene [84]reverseForward/ 235 barstar genereverse
Bt-maize Event 176 ID btsyn f1/ 151 cryIA(b) gene [60](Ciba Seeds, USA, Ciba-Geigy/Novartis) btsyn r1 (from Bacillus thuringiensis)
GM maize bar-af1/ 278 bar/pat genes(Hoechst Schering AgrEvo, Germany) bar-ar from Streptomyces
viridochromogeness. hygroscopicus
Bt-maize Event 176 CRYFZ 1/ 150 cryIA(b) gene(Ciba Seeds, USA, Ciba-Geigy/Novartis) CRYFZ 2 (from Bacillus thuringiensis)
7/26/2019 Modif Genetic
http://slidepdf.com/reader/full/modif-genetic 9/24
11
Table 4 PCR methods in GMO detection for soybean. RR Roundup Ready
GMO product (company) Scr/ID Primer Amplicon Target gene or Target Referencelength genetic element sequence(bp) reference
RR soybean (Monsanto, USA) Scr 35S-1/-2 195 CaMV 35S promoter [47][]dried soybean, soybean flour, ID SPA/SPB 320 Crossborder sequence:extruded defatted soya acid, (multiplex CaMV 35S promoter/ alcohol-precipitated soya concentrate PCR) EPSPS gene
Control LE1/LE2 407 le1 gene (soya-specific [85]single copy gene)
RR soya lecithin (Monsanto, USA) ID SPA/SPC 120 Crossborder sequence:(multiplex CaMV 35S promoter/ PCR) CTP sequenceControl LE5/LE6 180 le1 gene (soya-specific [85]
single copy gene)
RR soybean (Monsanto, USA) Scr 35S-1/-2 195 CaMV 35S promoter [86] [27]NOS-1/ 180 nos terminator (fromNOS-2 Agrobacterium tumefaciens)
Control plant-1/-2 500–600 Non-coding region [87]from chloroplast genome
Raw and fractionised ID p35s-af2/ 172 Crossborder sequence: [44]RR soya lecithins (Monsanto, USA) petu-ar1 CaMV 35S promoter/
CTP sequenceControl sole-af1/2 145 le1 gene (soya-specific [85]single copy gene)
RR soybean (Monsanto, USA) ID p35s-f2/ 172 Crossborder sequence: [88] [89]petu-r1 CaMV 35S promoter/
CTP sequence
Glyphosate-tolerant soybean seeds, ID GM05/ 447 Crossborder sequence: [88] [29]Code No. 9396 (Pioneer (nested CaMV 35S promoter/ Hi-Bred International, Inc. Iowa, USA) PCR) EPSPS gene
GM07/ 169 Crossborder sequence:GM08 CaMV 35S promoter/
CTP sequenceControl GM01/02 414 le1 gene (soya-specific(nested single copy gene)PCR)
GM03/04 118Glycine max soybean (non-GMO) ID GM01/ 414 le1 gene (soya-specific [85] [90]meat products GM02 single copy gene)
GM03/04 118Control TR03/ 137 18S-rDNA (highly [68]
TR04 conserved sequence)
RR soybean (Monsanto, USA) ID RR01/ 509 Crossborder sequence: [38](nested RR02 CP4 EPSPS gene/ PCR) CaMV 35S promoter
RR05/ 180 Crossborder sequence:RR04 CP4 EPSPS gene/
CTP sequenceControl GM01/02 414 le1 gene (soya-specific(nested single copy genePCR)
GM03/04 118TR03/04 137 18S-rDNA (highlyconserved sequence)
RR soybean (Monsanto, USA) ID Forward/ 475 nptII gene [91] [12]reverse
RR soybean (Monsanto, USA) ID CAM/CTP 110 Crossborder sequence: [60]CaMV 35S promoter/ CTP sequence
EPS 1/ 147 Crossborder sequence:NOS a CP4 EPSPS gene/ nos
terminatorControl LEC 1/ 164 le1 gene (soya-specific
LEC 2 single copy gene)
7/26/2019 Modif Genetic
http://slidepdf.com/reader/full/modif-genetic 10/24
12
Table 5 PCR methods in GMO detection for tomato, potato, sugarbeet, cotton, papaya, alfalfa and tobacco
GMO product (company) Scr/ID Primer Amplicon Target gene or Target Referencelength genetic element sequence(bp) reference
Flavr Savr tomato (Calgene., USA), Scr 35S-1/35S-2 195+390 CaMV 35S promoter [86] [27]Changin potato (Station fédérale (in tomato)de recherche en production végétale Tn5-1/Tn5-2 173 nptII gene [92]de Changin, Switzerland), (from transposon Tn5)
glyphosinate-resistent sugarbeet Control plant-1/-2 500–600 Non-coding region [87](AgrEvo, Germany) from chloroplast genome
Changin potato (Station fédérale Scr NOS-1/NOS-2 180 nos terminator [86]de recherche en production végétale (from Agrobacteriumde Changin, Switzerland), tumefaciens)B33-Invertase potato (IGF, Germany) Control plant-1/-2 500–600 Non-coding region from [87]
chloroplast genome
Flavr Savr tomato (Calgene, USA) ID PCR1/FS01 427 Crossborder sequence: [93, 94] [58]CaMV 35S promoter/ PG gene
Scr Tn5-1/-2 173 nptII gene (from [95]transposon Tn5 on pBIN19from A. tumefaciens)
Control TR03/04 137 18S-rDNA (highly [68]conserved sequence)
GM Desiree potato, Scr Tn5-1/-2 173 nptII gene T-DNA [96], [100]GM Rustica potato (nested gbss [97, 98],(gbss-antisense constructs) PCR) B33 [99]
T-ocd-1/ 432 T-DNA (from modifiedT-nos-2 pBIN19 / near right border)T-gene-III-1/ 405 T-DNA (from modifiedT-lacI-2 pBIN19 / near right border)T-lacZ-1/ 409 T-DNA (from modifiedT-M13-2 pBIN19 / near left border)
ID T-geneIII-1/ 3800 Crossborder sequence:(nested T-M13-2 T-DNA/B33/link/gbss-AS/ PCR) T-DNA
B33-1/ 580 Crossborder sequence:gbss-as-2 (instead B33/link/gbss-AS (incl.
of 530) confidential adapter seq.)Control universal -1/-2 550 Non-coding region [87]
from chloroplast genome
GM tomato (Zeneca) ID Forward/reverse 472 Antisense PG / [101] [12]CaMV 35S promoter
Forward/reverse 478 Sense PG /CaMV 35Spromoter
Forward/reverse 943 nptII/nos promoterForward/reverse 658 gene IIIA/nos terminatorForward/reverse 890 CaMV 35S promoter/ nos
terminatorForward/reverse 401 nptII gene/ ocd geneForward/reverse 660 ocd gene/gene IIIAForward/reverse 180 (380) PG gene
(polygalacturonase)
GM potato (no further specification) ID Forward/reverse 502 CaMV 35S promoter/ [102]PVX cp gene
GM cotton ID Forward/reverse 642 als gene [103](DuPont, no further specification)
GM papaya (no further specification) ID Forward/reverse 674 gus gene [104]
GM alfalfa (no further specification) ID Forward/reverse 1097 gus gene [105]Forward/reverse 785 nptII gene
GM tobacco (no further specification) ID Forward/reverse 880 P-TA29 promoter [106]
GM potato (B33-INV, ID B1/B2 839 aphIV gene (hygro- [39]no further specification) mycinphosphotransferase)
Control A1/A2 550 Chloroplast tRNA gene
Nema 282F tomato (Zeneca) Control PG34L/PG34R 383 PG gene (sense) [107, 108] [41]Scr 180 PG gene (antisense-construct)ID PG34L/B1 351 Crossborder sequence:
pg gene/ nos terminator
7/26/2019 Modif Genetic
http://slidepdf.com/reader/full/modif-genetic 11/24
PCR methods for GMO quantification
A major drawback of conventional PCR is the lack of ac-curate quantitative information due to the influence of the amplification efficiency (E). If the reaction efficiencyfor each amplification cycle remained constant, the con-centration of DNA following PCR would be directly pro-portional to the amount of initial DNA target. Unfortu-
nately, E is not a constant parameter but varies betweendifferent reactions, as well as within one reaction, partic-ularly in the later cycles of the PCR, when products areformed at an unknown reaction rate and in a non-expo-nential fashion. In order to have maximum sensitivity,product formation is indeed measured when the amplifi-cation reaches the maximum product yield (known as the“plateau phase”), i.e. when the correlation between theproduct concentration and the number of the initial targetmolecules is very poor [9, 11, 114, 115, 116]. Thus, con-ventional PCR relies on end-point measurements, whenoften the reaction has gone beyond the exponential phasebecause of limiting reagents. Other PCR-based tech-
niques, such as quantitative competitive PCR (QC-PCR)and real-time PCR, have recently been developed, whichaddress the problems of establishing a relationship be-tween the concentration of target DNA and the amountof PCR product generated by the amplification (for a de-tailed discussion of quantitative PCR approaches, pleasesee [117]).
For relative GMO concentrations in food mixtures,the quantification of a GM marker has to be normalisedto a plant-specific reference gene [118, 119, 120]. Inpractice, accurate relative quantification might beachieved by a combination of two absolute quantifica-tion reactions: one for the GMO-specific gene and a sec-
ond for the plant reference gene. With the assumptionthat the GMO material has been submitted to the sametreatment as the non-GMO material, the measurementcan be expressed as a genome/genome (g/g) orweight/weight (w/w) percentage.
Concerning the quantification of a GMO-specificgene in a mixture, such as in quantitative GMO analysis,there is currently an intense debate over how the GMOconcentration should be expressed. At present, the argu-ment is somewhat academic, since control laboratoriesfirst measure the DNA concentration in the sample andthen for equal amounts of DNA they measure the num-ber of copies that are found for a GMO-specific se-quence and for a crop-specific sequence. The ratio of both – taking into consideration the respective number of copies per genome – gives the percentage of the GMOspresent. Opponents of this approach argue that it is verydifficult to quantify DNA. In addition, the assumptionthat the g/g ratio is equal to the DNA w/w ratio is proba-bly an oversimplification since the genome size of cropsis not a constant value. Variations of up to 25% withinindividual plant varieties have been reported [121, 122].Therefore, new methods have been developed where thequantification of the reference gene and the GM markergene are performed in the same reaction mixture (multi-
plex PCR). This approach allows the determination of the GM genome-copy/genome-copy ratio without the useof the DNA weight/concentration in the calculation. Thisratio can be considered to be equal to the GM cell/cellratio, generally equal to the GM w/w ratio [123]. How-ever, there is currently no real valid proposal to substi-tute the g/g ratio with some other, more manageableunits of measurement.
By reducing the influence of the varying amplifica-tion efficiency, the accuracy of the quantitative informa-tion obtained by PCR can be improved. The analyticalstrategies can be divided into two groups:
1. Co-amplification of target analyte with an internalstandard, which allows a correction for the decreasein reaction efficiency, such as in QC-PCR and in dou-ble QC-PCR.
2. Measurement of the PCR amplicon in an early stageof the reaction, when the efficiency is still constantand therefore the product concentration still well cor-relates with the concentration of the initial target mol-
ecules, such as in PCR-ELISA and real-time PCR.
QC-PCR involves co-amplification of unknown amountsof a specific gene target and of known amounts of an in-ternal control template in the same reaction tube by thesame primer pair. A small difference between target andcontrol sequence (<40 bp.) makes it possible to distin-guish between the two reaction products. Each sample isamplified with increasing amounts of competitor, whilekeeping the sample volume/concentration constant.Quantification is achieved by comparing the equivalencepoint at which the amplicon from the competitor givesthe same signal intensity as the target DNA on stained
agarose gels [124]. The procedure assumes that the am-plification reactions of the target sequence and the inter-nal standard (i.e. the competitor) proceed with the sameefficiency in any phase of the reaction, including the pla-teau phase.
The QC-PCR method described by Studer and co-workers [125] for the quantification of Roundup Ready(RR) soybean and Maximizer maize was successfullytested in an inter-laboratory trial with 12 European con-trol laboratories [126]. Hardegger and co-workers [127]developed a QC-PCR screening method based on thequantification of the P-35S promoter and nos3! termina-tor. However, the fact that the copy number of these ge-neric markers may vary between different GM linesneeds to be considered when this method is applied.
Wurz and co-workers [118] reported findings of theassessment of the so-called double QC-PCR, a techniquein which the concentration of soybean DNA in differentsamples is first normalized using a QC-PCR quantifica-tion of the soybean-specific lectin le1 gene. When thesame samples are submitted to a second QC-PCR for aGM marker, relative quantification can be established.However, since the generation of calibration curves israther complex and the accuracy depends on various fac-tors, Wurz and co-workers [118] only used one competi-
13
7/26/2019 Modif Genetic
http://slidepdf.com/reader/full/modif-genetic 12/24
tor concentration, equivalent to 1% GM soybean (RR).Therefore, the method could only discriminate if a sam-ple contained more or less GM material compared to thecalibration concentration of 1%. Within this determina-tion, some degree of uncertainty could not be avoided.More recently, Hupfer and co-workers [120] described adouble QC-PCR method for the quantification of Bt-maize, in which multiple competitor concentrations wereused for the quantification of the amount of transgenicDNA, as well as for the quantification of the totalamount of amplifiable maize DNA. This allowed a goodcorrelation between the actual and measured GMO con-centration, even when the amount of amplifiable DNAwas reduced by a heat treatment to less then 20% of theinitial amount. Furthermore, they showed that the reduc-tion of amplifiable DNA could not be observed by UVmeasurement, which demonstrates the need for an accu-rate quantification of both GM and endogenous plantmarker. The use of double QC PCR might reduce the in-ter-laboratory differences observed in ring trial studies.
PCR-ELISA uses the strategy of the second group andcan be quantitative when the PCR is stopped before a sig-nificant decrease in amplification efficiency occurs.ELISA has been used to quantify the relatively lowamounts of PCR products [128, 129]. Despite the fact
that relative quantification using PCR-ELISA has beenapplied in different fields [130] and that a GMO detectionkit using PCR-ELISA has been commercialised (D-Ge-nos, Angers, France), this technique has not been widelyadopted for accurate GMO quantification purposes.
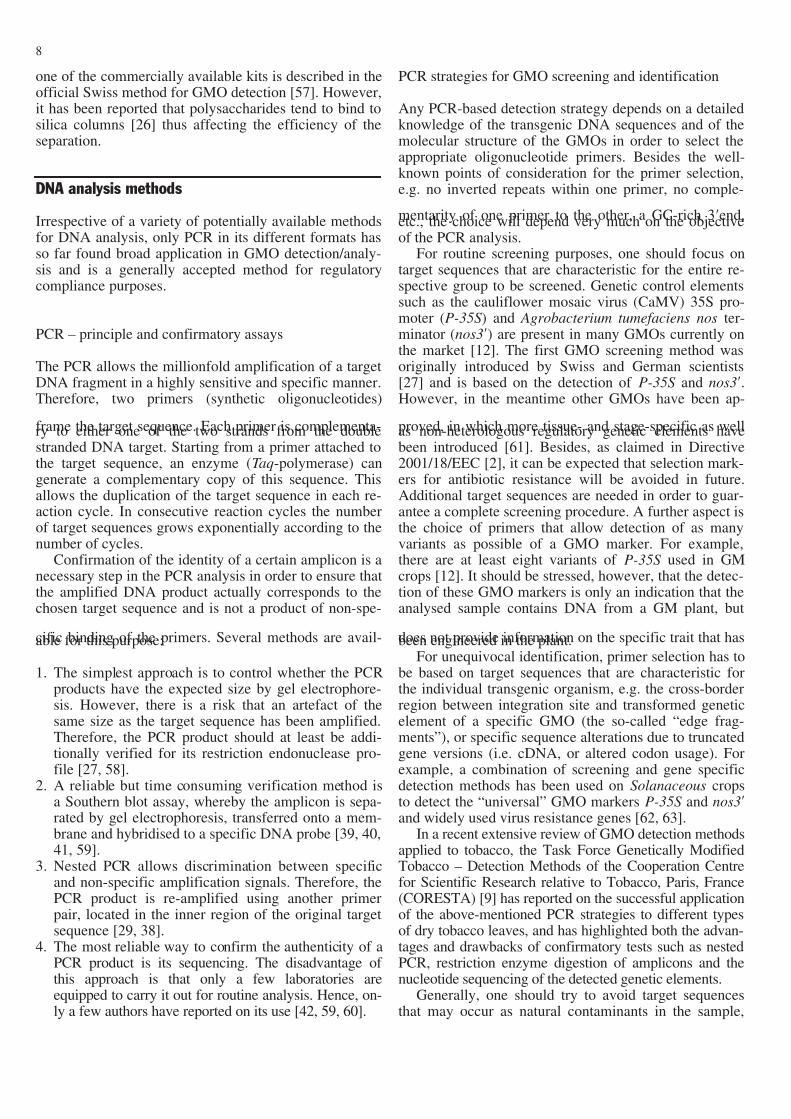
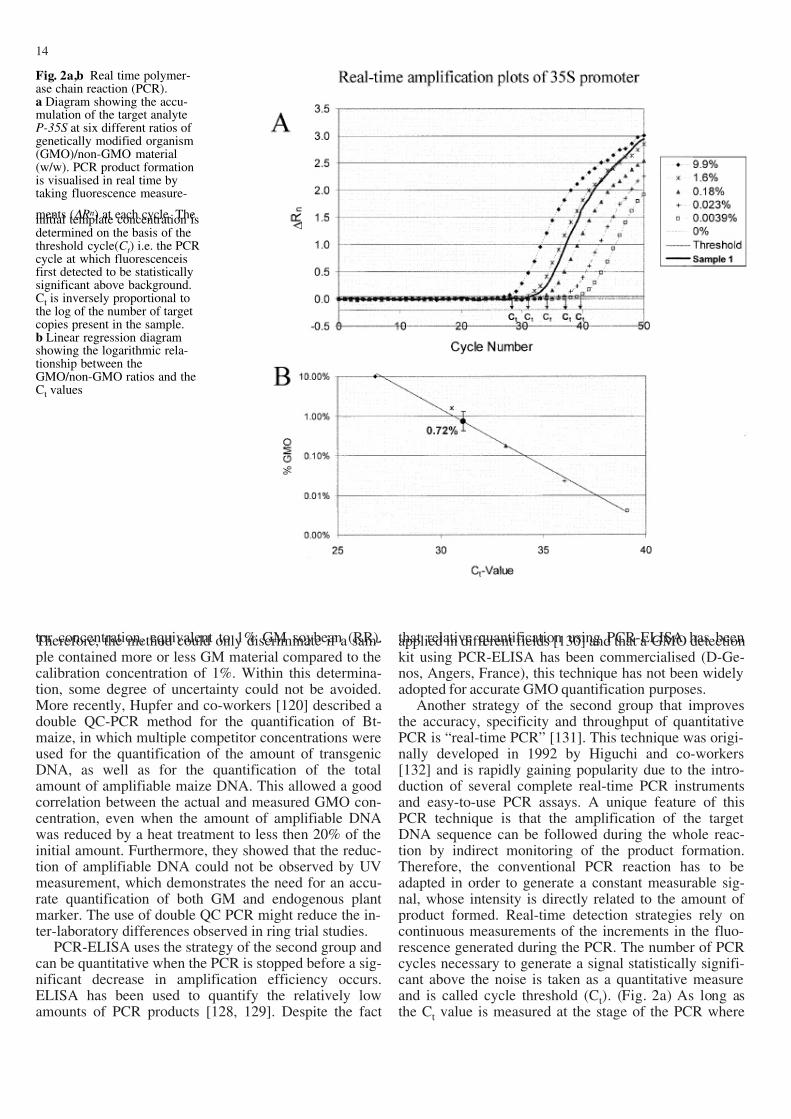
Another strategy of the second group that improvesthe accuracy, specificity and throughput of quantitativePCR is “real-time PCR” [131]. This technique was origi-nally developed in 1992 by Higuchi and co-workers[132] and is rapidly gaining popularity due to the intro-duction of several complete real-time PCR instrumentsand easy-to-use PCR assays. A unique feature of thisPCR technique is that the amplification of the targetDNA sequence can be followed during the whole reac-tion by indirect monitoring of the product formation.Therefore, the conventional PCR reaction has to beadapted in order to generate a constant measurable sig-nal, whose intensity is directly related to the amount of product formed. Real-time detection strategies rely oncontinuous measurements of the increments in the fluo-rescence generated during the PCR. The number of PCRcycles necessary to generate a signal statistically signifi-cant above the noise is taken as a quantitative measureand is called cycle threshold (Ct). (Fig. 2a) As long asthe Ct value is measured at the stage of the PCR where
14
Fig. 2a,b Real time polymer-ase chain reaction (PCR).a Diagram showing the accu-mulation of the target analyteP-35S at six different ratios of genetically modified organism(GMO)/non-GMO material(w/w). PCR product formationis visualised in real time bytaking fluorescence measure-
ments (" Rn) at each cycle. Theinitial template concentration isdetermined on the basis of thethreshold cycle(C t ) i.e. the PCRcycle at which fluorescenceisfirst detected to be statisticallysignificant above background.Ct is inversely proportional tothe log of the number of targetcopies present in the sample.b Linear regression diagramshowing the logarithmic rela-tionship between theGMO/non-GMO ratios and theCt values
7/26/2019 Modif Genetic
http://slidepdf.com/reader/full/modif-genetic 13/24
the efficiency is still constant, the Ct value is inverselyproportional to the log of the initial amount of targetmolecules (Fig. 2b).
Currently, various techniques are available for indi-rect monitoring of the PCR. For the use of real-time PCRin GMO detection it is important to distinguish betweenspecific and non-specific PCR monitoring. Specific PCR
monitoring, such as in the TaqMan assay, might reduceor eliminate the need for confirmation/validation testing,since non-specific amplification is not monitored. Fur-thermore, it might allow the simultaneous monitoring of multiple specific PCRs (the transgene and an endoge-nous reference gene) in the same reaction tube (multi-plex PCR). When non-specific PCR monitoring is used,such as with the use of SYBR Green I, confirmation/val-idation testing is still necessary to confirm that the moni-tored signal came from the target sequence. In additionto the confirmation/verification methods described be-fore, real-time PCR allows the determination of the melt-ing temperature of the reaction product, by the use of
melting curves. However, the reliability of this methodwill not exceed the reliability of size verification on anagarose gel. Obviously, simultaneous monitoring of dif-ferent reactions is not possible.
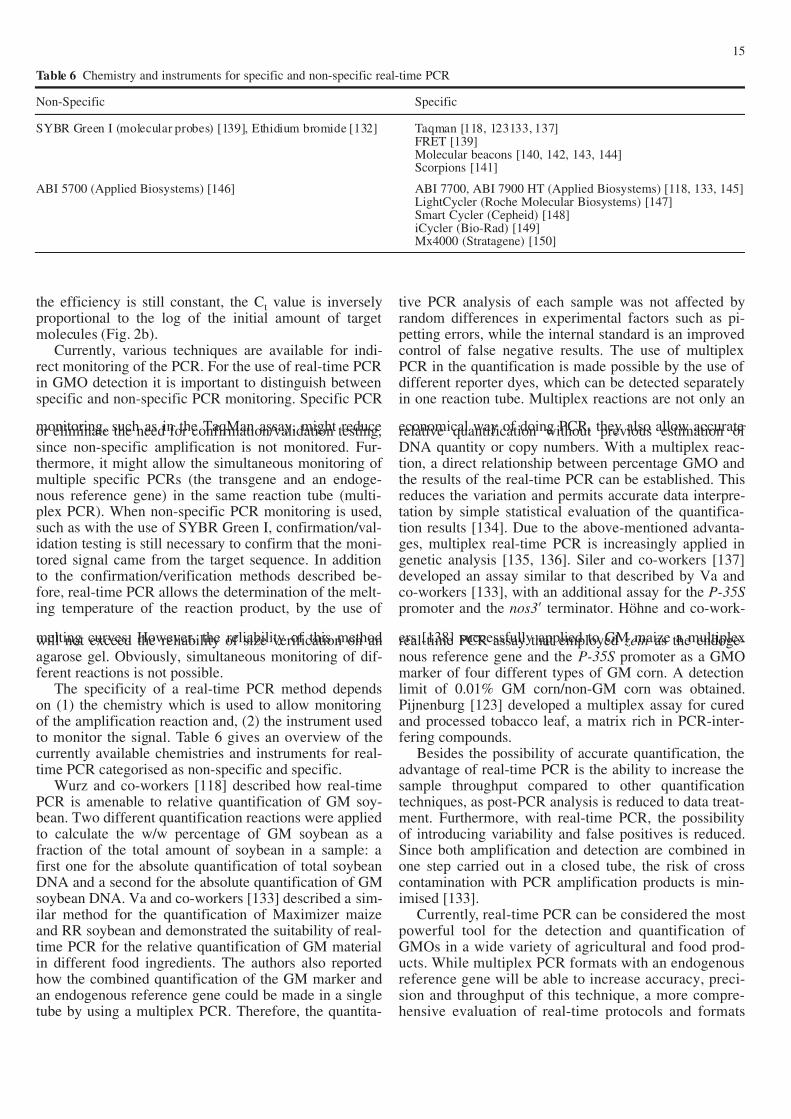
The specificity of a real-time PCR method dependson (1) the chemistry which is used to allow monitoringof the amplification reaction and, (2) the instrument usedto monitor the signal. Table 6 gives an overview of thecurrently available chemistries and instruments for real-time PCR categorised as non-specific and specific.
Wurz and co-workers [118] described how real-timePCR is amenable to relative quantification of GM soy-bean. Two different quantification reactions were appliedto calculate the w/w percentage of GM soybean as afraction of the total amount of soybean in a sample: afirst one for the absolute quantification of total soybeanDNA and a second for the absolute quantification of GMsoybean DNA. Va and co-workers [133] described a sim-ilar method for the quantification of Maximizer maizeand RR soybean and demonstrated the suitability of real-time PCR for the relative quantification of GM materialin different food ingredients. The authors also reportedhow the combined quantification of the GM marker andan endogenous reference gene could be made in a singletube by using a multiplex PCR. Therefore, the quantita-
tive PCR analysis of each sample was not affected byrandom differences in experimental factors such as pi-petting errors, while the internal standard is an improvedcontrol of false negative results. The use of multiplexPCR in the quantification is made possible by the use of different reporter dyes, which can be detected separatelyin one reaction tube. Multiplex reactions are not only an
economical way of doing PCR, they also allow accuraterelative quantification without previous estimation of DNA quantity or copy numbers. With a multiplex reac-tion, a direct relationship between percentage GMO andthe results of the real-time PCR can be established. Thisreduces the variation and permits accurate data interpre-tation by simple statistical evaluation of the quantifica-tion results [134]. Due to the above-mentioned advanta-ges, multiplex real-time PCR is increasingly applied ingenetic analysis [135, 136]. Siler and co-workers [137]developed an assay similar to that described by Va andco-workers [133], with an additional assay for the P-35S promoter and the nos3! terminator. Höhne and co-work-
ers [138] successfully applied to GM maize a multiplexreal-time PCR assay that employed zein as the endoge-nous reference gene and the P-35S promoter as a GMOmarker of four different types of GM corn. A detectionlimit of 0.01% GM corn/non-GM corn was obtained.Pijnenburg [123] developed a multiplex assay for curedand processed tobacco leaf, a matrix rich in PCR-inter-fering compounds.
Besides the possibility of accurate quantification, theadvantage of real-time PCR is the ability to increase thesample throughput compared to other quantificationtechniques, as post-PCR analysis is reduced to data treat-ment. Furthermore, with real-time PCR, the possibilityof introducing variability and false positives is reduced.Since both amplification and detection are combined inone step carried out in a closed tube, the risk of crosscontamination with PCR amplification products is min-imised [133].
Currently, real-time PCR can be considered the mostpowerful tool for the detection and quantification of GMOs in a wide variety of agricultural and food prod-ucts. While multiplex PCR formats with an endogenousreference gene will be able to increase accuracy, preci-sion and throughput of this technique, a more compre-hensive evaluation of real-time protocols and formats
15
Table 6 Chemistry and instruments for specific and non-specific real-time PCR
Non-Specific Specific
SYBR Green I (molecular probes) [139], Ethidium bromide [132] Taqman [118, 123133, 137]FRET [139]Molecular beacons [140, 142, 143, 144]Scorpions [141]
ABI 5700 (Applied Biosystems) [146] ABI 7700, ABI 7900 HT (Applied Biosystems) [118, 133, 145]LightCycler (Roche Molecular Biosystems) [147]Smart Cycler (Cepheid) [148]iCycler (Bio-Rad) [149]Mx4000 (Stratagene) [150]
7/26/2019 Modif Genetic
http://slidepdf.com/reader/full/modif-genetic 14/24
(including data treatment) needs to be performed in thenear future, possibly through inter-laboratory ring tri-als.
Validation of PCR methods
An increasing number of food control laboratories are
adopting PCR as the technology of choice for GMO de-tection. The first official methods that have been validat-ed in ring trials were published in the Swiss Food Manu-al and the German official collection of test methods inaccordance with Article 35 of the German Food Act [39,40, 41, 57]. However, international standardisation andvalidation of GMO analysis methods by harmonised andaccepted protocols is still in its early phases. Standardi-sation bodies, such as CEN, and the French Standardisat-ion Association (AFNOR Paris, France), have undertak-en activities in this area and produced preliminary guide-lines for sampling strategies and GMO detection meth-ods, respectively [25, 151].
The objective of the validation of an analytical PCRmethod is to demonstrate that the successive proceduresof sample extraction, preparation and analysis will yieldacceptable accurate, precise and reproducible results fora given analyte in a specified matrix. The process of val-idation allows the independent use of methods and re-sults, which are comparable among each other.
Depending upon the intended purpose of the analysis,i.e. qualitative (screening/identification) or quantitativeanalysis, different validation parameters have to be eval-uated [115, 152, 153, 154, 155]. For the validation of aqualitative analytical test system specificity/selectivity,sensitivity [matrix effects/inhibition, limit of detection
(LOD)], accuracy/precision [repeatability (RSDr), inter-mediate precision, reproducibility (RSDR)] and robust-ness have to be established. In addition to these parame-ters, limit of quantification (LOQ), accuracy/truenessand linearity/working range have to be evaluated for aquantitative analytical test system.
Specificity is defined as the probability of obtaining anegative result given that there is no analyte present[156]. It can be established by determining the percent-age of correct classification of a non-analyte-containingsample as GMO negative, i.e. 100% minus the false-pos-itive rate [24]. Recently, the specificity testing of amaize-specific real-time PCR system revealed that a sig-nal was obtained not only with the target analyte (maizeinvertase gene) but also with DNA from rice and millet,even though of a 50-fold lesser intensity [26].
Sensitivity is defined as the probability of obtaining apositive result given that the analyte is present [156]. Itcan be established by determining the percentage of cor-rect classification of an analyte-containing sample asGMO positive, i.e. 100% minus the false negative rate[24]. The exclusion of false negatives, e.g. an inhibitiondue to matrix effects, can be controlled by the co-ampli-fication of an internal control – additionally, two controlsshould be checked routinely: a negative control as a test
for contamination and a positive control run close to theLOD as a sensitivity test [157].
The LOD is determined by the analysis of sampleswith known concentration of analyte and by establishingthe minimum level at which the analyte can reliably bedetected. The LOD can be defined as the concentrationat which 95% of the experiments give a signal (i.e. 95%sensitivity) and may be experimentally determined by at
least three series of dilution in DNA background whereeach dilution should be analysed in eight replicates[157]. The LOD can also be described as LOD=(3.3 #):Swhere # is the standard deviation of response (e.g. fluo-rescence signal) and S is the slope of the calibrationcurve (e.g. Fig. 2) [152, 153]. The LOQ is determined byanalysis of known samples and establishes the minimumlevel at which the analyte can be quantified. It can be de-scribed as LOQ=(10 #):S [152, 153].
However, recently Kay and Van den Eede [158] havediscussed the variability of the proportions of GMOs tonon-GMOs in replicate homogenised laboratory samplesand its implications for the determination of the LOD:
the number of haploid genome copies of GM maize in a100 ng DNA sample with 0.1% GM maize content rang-es from 25 to 48 with a 94.3% probability, i.e. from0.068% to 0.131%. Therefore, in a dilution series thenumber of copies used to prepare subsequent dilutionswould heavily influence the sampling error. A way tosolve this dilemma could be (a) immediate dilutionsfrom the primary laboratory sample, (b) a statistical rele-vant number of repetitions and/or (c) larger analyticalsamples [158].
Jankiewicz and co-workers [159] carried out a semi-quantitative study of sensitivity limits of the official Ger-man PCR method §35 LMBG 23.02.22–1 [40]. Two dif-
ferent approaches for the determination of the detectionlimit were compared: the theoretical LOD determinedfrom serial dilutions of target DNA with backgroundDNA, and the practical LOD determined by examiningcertified reference material and thereby taking into ac-count the effect of the matrix during DNA isolation.Whereas the theoretical LOD was 0.005% GMO/non-GMO (w/w) corresponding to a calculated 30 copies of RR tolerant soybean haploid genome or to a calculated 9copies of Bacillus thuringiensis resistant (Bt) maize hap-loid genome, the practical LOD proved to be significant-ly (20×) higher at 0.1% GMO/non-GMO (w/w) corre-sponding to a calculated 596 copies of RR soybean hap-loid genome or to a calculated 185 copies of Bt-maizehaploid genome [159]. However, Jankiewicz and co-workers [159] did not test lower concentrations of certi-fied reference materials nor did they report any repeti-tion of their experiments.
The accuracy of an analytical system is determined byvalidation parameters related to precision, and to, in caseof a quantitative analytical test, trueness [26, 152]. Preci-sion is defined by determining the following three pa-rameters: (a) the intra-laboratory variation checked byrepetition of experiments over a short time (repeatabili-ty), (b) the intra-laboratory variation over a prolonged
16
7/26/2019 Modif Genetic
http://slidepdf.com/reader/full/modif-genetic 15/24
17
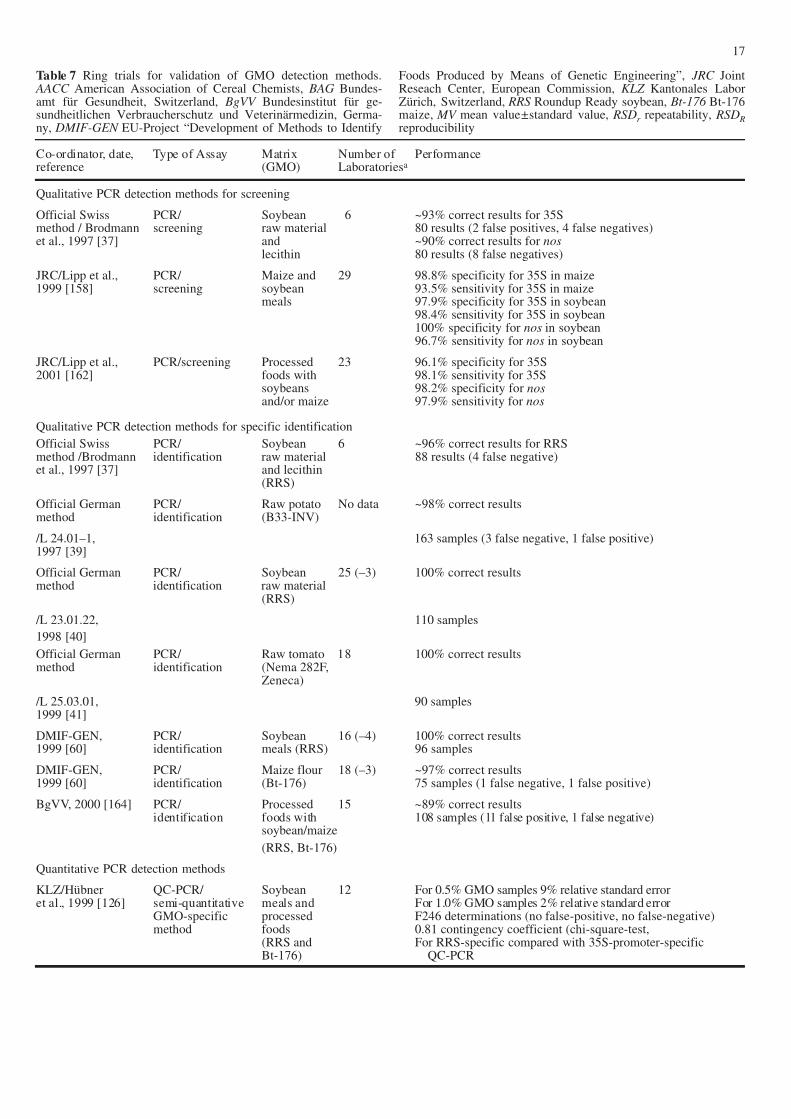
Table 7 Ring trials for validation of GMO detection methods. AACC American Association of Cereal Chemists, BAG Bundes-amt für Gesundheit, Switzerland, BgVV Bundesinstitut für ge-sundheitlichen Verbraucherschutz und Veterinärmedizin, Germa-ny, DMIF-GEN EU-Project “Development of Methods to Identify
Foods Produced by Means of Genetic Engineering”, JRC JointReseach Center, European Commission, KLZ Kantonales LaborZürich, Switzerland, RRS Roundup Ready soybean, Bt-176 Bt-176maize, MV mean value±standard value, RSDr repeatability, RSD Rreproducibility
Co-ordinator, date, Type of Assay Matrix Number of Performancereference (GMO) Laboratoriesa
Qualitative PCR detection methods for screening
Official Swiss PCR/ Soybean 6 ~93% correct results for 35Smethod / Brodmann screening raw material 80 results (2 false positives, 4 false negatives)et al., 1997 [37] and ~90% correct results for nos
lecithin 80 results (8 false negatives)
JRC/Lipp et al., PCR/ Maize and 29 98.8% specificity for 35S in maize1999 [158] screening soybean 93.5% sensitivity for 35S in maize
meals 97.9% specificity for 35S in soybean98.4% sensitivity for 35S in soybean100% specificity for nos in soybean96.7% sensitivity for nos in soybean
JRC/Lipp et al., PCR/screening Processed 23 96.1% specificity for 35S2001 [162] foods with 98.1% sensitivity for 35S
soybeans 98.2% specificity for nosand/or maize 97.9% sensitivity for nos
Qualitative PCR detection methods for specific identification
Official Swiss PCR/ Soybean 6 ~96% correct results for RRSmethod /Brodmann identification raw material 88 results (4 false negative)et al., 1997 [37] and lecithin
(RRS)
Official German PCR/ Raw potato No data ~98% correct resultsmethod identification (B33-INV)
/L 24.01–1, 163 samples (3 false negative, 1 false positive)1997 [39]
Official German PCR/ Soybean 25 (–3) 100% correct resultsmethod identification raw material
(RRS)
/L 23.01.22, 110 samples
1998 [40]
Official German PCR/ Raw tomato 18 100% correct resultsmethod identification (Nema 282F,
Zeneca)
/L 25.03.01, 90 samples1999 [41]
DMIF-GEN, PCR/ Soybean 16 (–4) 100% correct results1999 [60] identification meals (RRS) 96 samples
DMIF-GEN, PCR/ Maize flour 18 (–3) ~97% correct results1999 [60] identification (Bt-176) 75 samples (1 false negative, 1 false positive)
BgVV, 2000 [164] PCR/ Processed 15 ~89% correct resultsidentification foods with 108 samples (11 false positive, 1 false negative)
soybean/maize
(RRS, Bt-176)
Quantitative PCR detection methods
KLZ/Hübner QC-PCR/ Soybean 12 For 0.5% GMO samples 9% relative standard erroret al., 1999 [126] semi-quantitative meals and For 1.0% GMO samples 2% relative standard error
GMO-specific processed F246 determinations (no false-positive, no false-negative)method foods 0.81 contingency coefficient (chi-square-test,
(RRS and For RRS-specific compared with 35S-promoter-specificBt-176) QC-PCR
7/26/2019 Modif Genetic
http://slidepdf.com/reader/full/modif-genetic 16/24
18
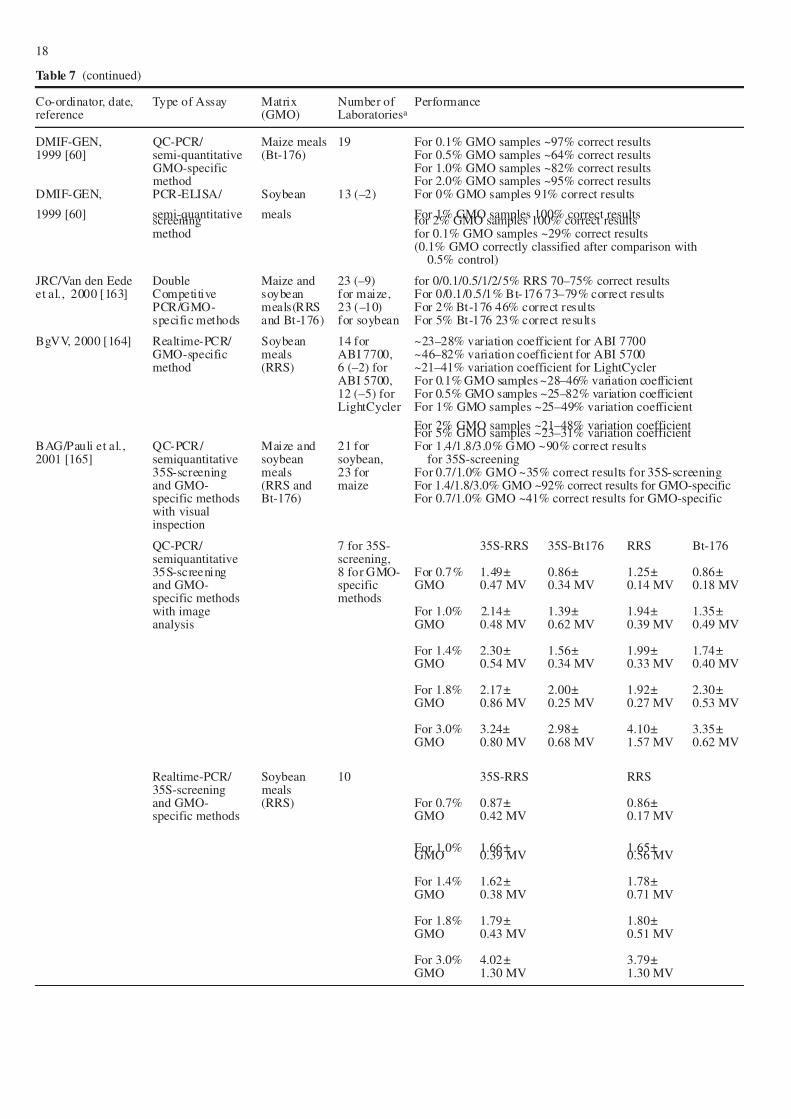
Table 7 (continued)
Co-ordinator, date, Type of Assay Matrix Number of Performancereference (GMO) Laboratoriesa
DMIF-GEN, QC-PCR/ Maize meals 19 For 0.1% GMO samples ~97% correct results1999 [60] semi-quantitative (Bt-176) For 0.5% GMO samples ~64% correct results
GMO-specific For 1.0% GMO samples ~82% correct resultsmethod For 2.0% GMO samples ~95% correct results
DMIF-GEN, PCR-ELISA/ Soybean 13 (–2) For 0% GMO samples 91% correct results
1999 [60] semi-quantitative meals For 1% GMO samples 100% correct resultsscreening for 2% GMO samples 100% correct resultsmethod for 0.1% GMO samples ~29% correct results
(0.1% GMO correctly classified after comparison with0.5% control)
JRC/Van den Eede Double Maize and 23 (–9) for 0/0.1/0.5/1/2/5% RRS 70–75% correct resultset al., 2000 [163] Competitive soybean for maize, For 0/0.1/0.5/1% Bt-176 73–79% correct results
PCR/GMO- meals(RRS 23 (–10) For 2% Bt-176 46% correct resultsspecific methods and Bt-176) for soybean For 5% Bt-176 23% correct results
BgVV, 2000 [164] Realtime-PCR/ Soybean 14 for ~23–28% variation coefficient for ABI 7700GMO-specific meals ABI 7700, ~46–82% variation coefficient for ABI 5700method (RRS) 6 (–2) for ~21–41% variation coefficient for LightCycler
ABI 5700, For 0.1% GMO samples ~28–46% variation coefficient12 (–5) for For 0.5% GMO samples ~25–82% variation coefficientLightCycler For 1% GMO samples ~25–49% variation coefficient
For 2% GMO samples ~21–48% variation coefficientFor 5% GMO samples ~23–31% variation coefficient
BAG/Pauli et al., QC-PCR/ Maize and 21 for For 1.4/1.8/3.0% GMO ~90% correct results2001 [165] semiquantitative soybean soybean, for 35S-screening
35S-screening meals 23 for For 0.7/1.0% GMO ~35% correct results for 35S-screeningand GMO- (RRS and maize For 1.4/1.8/3.0% GMO ~92% correct results for GMO-specificspecific methods Bt-176) For 0.7/1.0% GMO ~41% correct results for GMO-specificwith visualinspection
QC-PCR/ 7 for 35S- 35S-RRS 35S-Bt176 RRS Bt-176semiquantitative screening,35S-screening 8 for GMO- For 0.7% 1.49± 0.86± 1.25± 0.86±and GMO- specific GMO 0.47 MV 0.34 MV 0.14 MV 0.18 MVspecific methods methodswith image For 1.0% 2.14± 1.39± 1.94± 1.35±analysis GMO 0.48 MV 0.62 MV 0.39 MV 0.49 MV
For 1.4% 2.30± 1.56± 1.99± 1.74±GMO 0.54 MV 0.34 MV 0.33 MV 0.40 MV
For 1.8% 2.17± 2.00± 1.92± 2.30±GMO 0.86 MV 0.25 MV 0.27 MV 0.53 MV
For 3.0% 3.24± 2.98± 4.10± 3.35±GMO 0.80 MV 0.68 MV 1.57 MV 0.62 MV
Realtime-PCR/ Soybean 10 35S-RRS RRS35S-screening mealsand GMO- (RRS) For 0.7% 0.87± 0.86±specific methods GMO 0.42 MV 0.17 MV
For 1.0% 1.66± 1.65±GMO 0.39 MV 0.56 MV
For 1.4% 1.62± 1.78±GMO 0.38 MV 0.71 MV
For 1.8% 1.79± 1.80±GMO 0.43 MV 0.51 MV
For 3.0% 4.02± 3.79±GMO 1.30 MV 1.30 MV
7/26/2019 Modif Genetic
http://slidepdf.com/reader/full/modif-genetic 17/24
time period, i.e. on different days with different staff anddifferent equipment (intermediate precision) and (c) theinter-laboratory variation demonstrated in a ring trial (re-producibility). For a quantitative analytical testing therecommended data should also include standard devia-tion, relative standard deviation (coefficient of variation)for repeatability and reproducibility and the confidenceinterval. Trueness should be reported as the percentagerecovery by the assay of a known added amount of anal-yte or as the difference between the mean and the accept-ed true value of the reference material together with the
confidence intervals [26, 152].Robustness defines the stability of the method andshould be demonstrated with respect to deliberate varia-tions in method parameters (work instructions, storageconditions and stability of analytical solutions) [152].
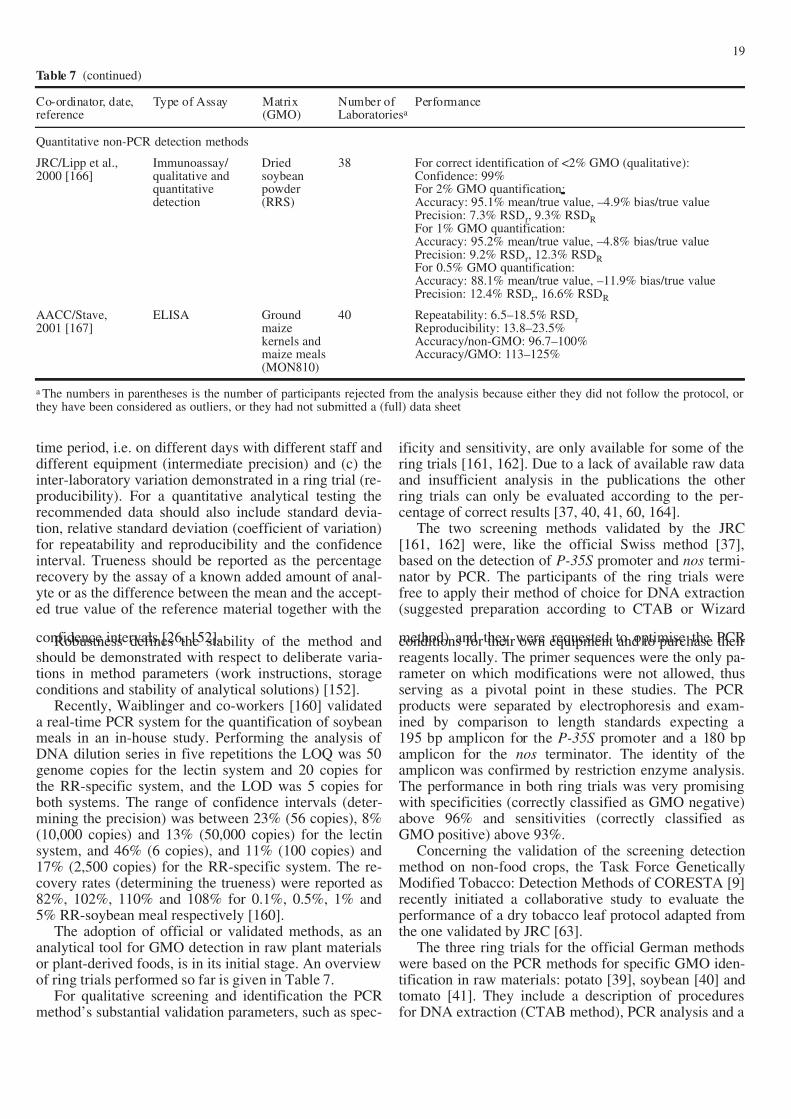
Recently, Waiblinger and co-workers [160] validateda real-time PCR system for the quantification of soybeanmeals in an in-house study. Performing the analysis of DNA dilution series in five repetitions the LOQ was 50genome copies for the lectin system and 20 copies forthe RR-specific system, and the LOD was 5 copies forboth systems. The range of confidence intervals (deter-mining the precision) was between 23% (56 copies), 8%(10,000 copies) and 13% (50,000 copies) for the lectinsystem, and 46% (6 copies), and 11% (100 copies) and17% (2,500 copies) for the RR-specific system. The re-covery rates (determining the trueness) were reported as82%, 102%, 110% and 108% for 0.1%, 0.5%, 1% and5% RR-soybean meal respectively [160].
The adoption of official or validated methods, as ananalytical tool for GMO detection in raw plant materialsor plant-derived foods, is in its initial stage. An overviewof ring trials performed so far is given in Table 7.
For qualitative screening and identification the PCRmethod’s substantial validation parameters, such as spec-
ificity and sensitivity, are only available for some of thering trials [161, 162]. Due to a lack of available raw dataand insufficient analysis in the publications the otherring trials can only be evaluated according to the per-centage of correct results [37, 40, 41, 60, 164].
The two screening methods validated by the JRC[161, 162] were, like the official Swiss method [37],based on the detection of P-35S promoter and nos termi-nator by PCR. The participants of the ring trials werefree to apply their method of choice for DNA extraction(suggested preparation according to CTAB or Wizard
method) and they were requested to optimise the PCRconditions for their own equipment and to purchase theirreagents locally. The primer sequences were the only pa-rameter on which modifications were not allowed, thusserving as a pivotal point in these studies. The PCRproducts were separated by electrophoresis and exam-ined by comparison to length standards expecting a195 bp amplicon for the P-35S promoter and a 180 bpamplicon for the nos terminator. The identity of theamplicon was confirmed by restriction enzyme analysis.The performance in both ring trials was very promisingwith specificities (correctly classified as GMO negative)above 96% and sensitivities (correctly classified asGMO positive) above 93%.
Concerning the validation of the screening detectionmethod on non-food crops, the Task Force GeneticallyModified Tobacco: Detection Methods of CORESTA [9]recently initiated a collaborative study to evaluate theperformance of a dry tobacco leaf protocol adapted fromthe one validated by JRC [63].
The three ring trials for the official German methodswere based on the PCR methods for specific GMO iden-tification in raw materials: potato [39], soybean [40] andtomato [41]. They include a description of proceduresfor DNA extraction (CTAB method), PCR analysis and a
19
Table 7 (continued)
Co-ordinator, date, Type of Assay Matrix Number of Performancereference (GMO) Laboratoriesa
Quantitative non-PCR detection methods
JRC/Lipp et al., Immunoassay/ Dried 38 For correct identification of <2% GMO (qualitative):2000 [166] qualitative and soybean Confidence: 99%
quantitative powder For 2% GMO quantification:detection (RRS) Accuracy: 95.1% mean/true value, –4.9% bias/true value
Precision: 7.3% RSDr, 9.3% RSDRFor 1% GMO quantification:Accuracy: 95.2% mean/true value, –4.8% bias/true valuePrecision: 9.2% RSDr, 12.3% RSDRFor 0.5% GMO quantification:Accuracy: 88.1% mean/true value, –11.9% bias/true valuePrecision: 12.4% RSDr, 16.6% RSDR
AACC/Stave, ELISA Ground 40 Repeatability: 6.5–18.5% RSDr2001 [167] maize Reproducibility: 13.8–23.5%
kernels and Accuracy/non-GMO: 96.7–100%maize meals Accuracy/GMO: 113–125%(MON810)
a The numbers in parentheses is the number of participants rejected from the analysis because either they did not follow the protocol, orthey have been considered as outliers, or they had not submitted a (full) data sheet
7/26/2019 Modif Genetic
http://slidepdf.com/reader/full/modif-genetic 18/24
confirmatory test. The PCR is performed with suitableprimers specific for the GMO under study and the ampli-fication capacity of the extracted DNA is checked by aninternal control. The amplicons are then examined byagarose gel electrophoresis for their correct size. Theidentity of the amplicon is confirmed by a Southern blot.The performances of ring trials performed demonstratedreliability above 97% correct results.
Ring trials on quantitative PCR methods include foursemi-quantitative QC-PCRs [60, 126, 165], one PCR-ELISA [60], one double competitive PCR [163] and tworeal-time PCRs [164, 165]. For the validation of quanti-tative detection methods, various statistical approacheswere taken in order to evaluate the performance. Addi-tionally, differences in the experimental design accompa-nied by a lack of available raw data do not permit a com-parison of performance between these ring trials.
Another two ring trials validated quantitative non-PCR methods based on an immunoassay [166] and on aCry1Ab-specific ELISA test [167]. For further detailsplease see Validation of immunoassay methods and Ta-
ble 7.GMO detection with analytical precision involves theconsideration of a number of critical parameters with re-spect to quality control. Any laboratory using such meth-ods is expected to carefully validate every single step of the analytical process in order to produce comparable re-sults. Further validation studies, especially on the quanti-tative PCR methods, must be performed.
Protein analysis methods
Immunoassay – principle and limits
The process of producing GM plants involves the intro-duction of transgenes that encode novel proteins. Anoverview on recombinant proteins expressed in plants isgiven by Steinkeliner and Korschhineck [168].
Immunological techniques have become indispens-able tools in the physiological, biochemical and molecu-lar disciplines of plant science. Their principal attractionresides in the high specificity of the immunological reac-tion, which allows accurate recognition of an antigenicsubstance even in the presence of contaminating antigensand interfering compounds. The methodology is nowroutinely used for the rapid purification, visualisationand quantification of proteins, polysaccharides and evensmall molecules (haptens) to which antibodies have beeninduced by conjugating the molecule to a large immuno-genic carrier protein. An extensive overview on variousimmunological methods for assessing protein expressionin plants is given by Dumbroff and co-workers [169].The design and development of immunoassays for detec-tion of proteins including those from novel foods is de-scribed in Brett and co-workers [170]. Moreover, in a re-cent review of GMO detection methods applied to tobac-co, the Task Force Genetically Modified Tobacco – De-tection Methods of CORESTA [9] has highlighted the
advantages and drawbacks of immunoassay methodsused for GMO detection.
One of the major drawbacks of immunochemical as-says is that their accuracy and precision can be adverselyaffected in a complex matrix, such as those found inmany processed agricultural and food products. The pos-sible causes for interference from the matrix have beenattributed to non-specific interaction with the antibody
by proteins, surfactants (saponins), or phenolic com-pounds, antibody denaturing by fatty acids and the pres-ence of endogenous phosphatases or enzyme inhibitors.Moreover, detection and measurement may be rendereddifficult by low levels of expression of transgenic pro-teins, the degradation associated with thermal treatmentsor by a poor antibody affinity of the commercially avail-able source of antibodies.
Nonetheless, several immunoassay-based methodshave so far been developed, with an increasing numberof ELISA systems with specificity for marker geneswidely used in plant genetic modification, e.g. neomycinphosphotransferase II (npt II) [171, 172, 173]. This pro-
tein has been expressed in and purified from GM cotton-seed, potato tubers and tomato. A recently modifiedELISA method also based on the detection of npt II hasbeen successfully applied to a number of independentlytransformed lines in nine plant species [174]. The en-zyme 5-pyruvylshikimate-3-phosphate synthase (EPSPS)has been demonstrated to be expressed in RR soybeans[88] for which an appropriate immunoassay method hasbeen developed [175]. Other proteins for which immuno-chemical analysis methods have been developed includeBt insecticide Cry1Ab and herbicide-tolerant phosphi-notricin acetyltransferase (PAT) proteins. However, itmust be stressed that differences can occur in the expres-
sion of the protein between crop varieties. This makesthe quantification more challenging. In addition, thereare numerous Cry proteins and one must bear in mindthat EPSPS occurs naturally among all plant species.
Various commercial ELISA kits for a variety of appli-cations are becoming available. Of interest are kits thatare reported to detect specific proteins in food crops,such as Bt Cry1Ac, Cry1C, Cry3A, Cry2A, Cry9C, CP4EPSPS, and PAT. ELISA methods offer a high degree of automation and a high throughput of samples. However,it must be stressed that the content of the newly exposedproteins is not evenly distributed in the whole plant. Forinstance, in maize the highest values were mostly ob-served in leaves and not in the grain.
Field variants of the ELISA, such as lateral flowstrips or dipstick kits, have been recently developed.They offer a semi-quantitative test of considerable prac-tical value for testing in the field with simple laboratoryset-ups [176].
Validation of immunoassay methods
As more methods based on immunoassays are in devel-opment, there is a strong need for validation in order tomake an appropriate comparison of efficiency.
20
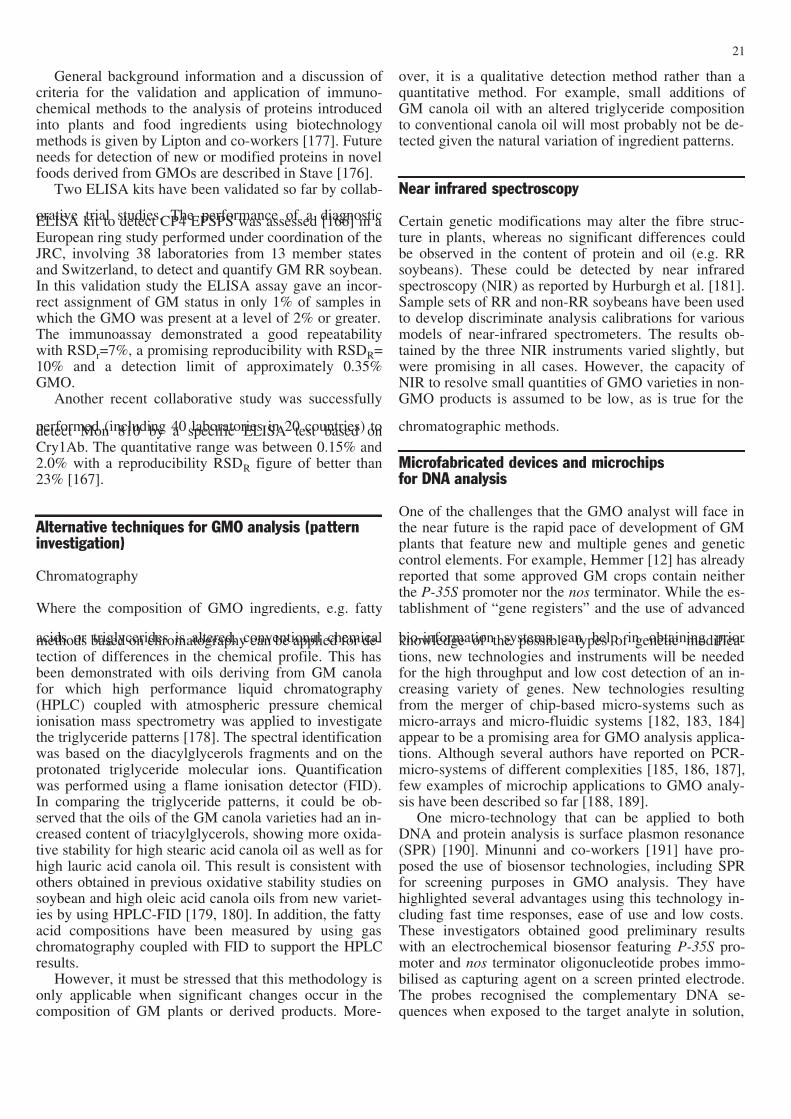
7/26/2019 Modif Genetic
http://slidepdf.com/reader/full/modif-genetic 19/24
General background information and a discussion of criteria for the validation and application of immuno-chemical methods to the analysis of proteins introducedinto plants and food ingredients using biotechnologymethods is given by Lipton and co-workers [177]. Futureneeds for detection of new or modified proteins in novelfoods derived from GMOs are described in Stave [176].
Two ELISA kits have been validated so far by collab-
orative trial studies. The performance of a diagnosticELISA kit to detect CP4 EPSPS was assessed [166] in aEuropean ring study performed under coordination of theJRC, involving 38 laboratories from 13 member statesand Switzerland, to detect and quantify GM RR soybean.In this validation study the ELISA assay gave an incor-rect assignment of GM status in only 1% of samples inwhich the GMO was present at a level of 2% or greater.The immunoassay demonstrated a good repeatabilitywith RSDr=7%, a promising reproducibility with RSDR=10% and a detection limit of approximately 0.35%GMO.
Another recent collaborative study was successfully
performed (including 40 laboratories in 20 countries) todetect Mon 810 by a specific ELISA test based onCry1Ab. The quantitative range was between 0.15% and2.0% with a reproducibility RSDR figure of better than23% [167].
Alternative techniques for GMO analysis (patterninvestigation)
Chromatography
Where the composition of GMO ingredients, e.g. fatty
acids or triglycerides is altered, conventional chemicalmethods based on chromatography can be applied for de-tection of differences in the chemical profile. This hasbeen demonstrated with oils deriving from GM canolafor which high performance liquid chromatography(HPLC) coupled with atmospheric pressure chemicalionisation mass spectrometry was applied to investigatethe triglyceride patterns [178]. The spectral identificationwas based on the diacylglycerols fragments and on theprotonated triglyceride molecular ions. Quantificationwas performed using a flame ionisation detector (FID).In comparing the triglyceride patterns, it could be ob-served that the oils of the GM canola varieties had an in-creased content of triacylglycerols, showing more oxida-tive stability for high stearic acid canola oil as well as forhigh lauric acid canola oil. This result is consistent withothers obtained in previous oxidative stability studies onsoybean and high oleic acid canola oils from new variet-ies by using HPLC-FID [179, 180]. In addition, the fattyacid compositions have been measured by using gaschromatography coupled with FID to support the HPLCresults.
However, it must be stressed that this methodology isonly applicable when significant changes occur in thecomposition of GM plants or derived products. More-
over, it is a qualitative detection method rather than aquantitative method. For example, small additions of GM canola oil with an altered triglyceride compositionto conventional canola oil will most probably not be de-tected given the natural variation of ingredient patterns.
Near infrared spectroscopy
Certain genetic modifications may alter the fibre struc-ture in plants, whereas no significant differences couldbe observed in the content of protein and oil (e.g. RRsoybeans). These could be detected by near infraredspectroscopy (NIR) as reported by Hurburgh et al. [181].Sample sets of RR and non-RR soybeans have been usedto develop discriminate analysis calibrations for variousmodels of near-infrared spectrometers. The results ob-tained by the three NIR instruments varied slightly, butwere promising in all cases. However, the capacity of NIR to resolve small quantities of GMO varieties in non-GMO products is assumed to be low, as is true for the
chromatographic methods.
Microfabricated devices and microchips for DNA analysis
One of the challenges that the GMO analyst will face inthe near future is the rapid pace of development of GMplants that feature new and multiple genes and geneticcontrol elements. For example, Hemmer [12] has alreadyreported that some approved GM crops contain neitherthe P-35S promoter nor the nos terminator. While the es-tablishment of “gene registers” and the use of advanced
bio-information systems can help in obtaining priorknowledge of the possible types of genetic modifica-tions, new technologies and instruments will be neededfor the high throughput and low cost detection of an in-creasing variety of genes. New technologies resultingfrom the merger of chip-based micro-systems such asmicro-arrays and micro-fluidic systems [182, 183, 184]appear to be a promising area for GMO analysis applica-tions. Although several authors have reported on PCR-micro-systems of different complexities [185, 186, 187],few examples of microchip applications to GMO analy-sis have been described so far [188, 189].
One micro-technology that can be applied to bothDNA and protein analysis is surface plasmon resonance(SPR) [190]. Minunni and co-workers [191] have pro-posed the use of biosensor technologies, including SPRfor screening purposes in GMO analysis. They havehighlighted several advantages using this technology in-cluding fast time responses, ease of use and low costs.These investigators obtained good preliminary resultswith an electrochemical biosensor featuring P-35S pro-moter and nos terminator oligonucleotide probes immo-bilised as capturing agent on a screen printed electrode.The probes recognised the complementary DNA se-quences when exposed to the target analyte in solution,
21
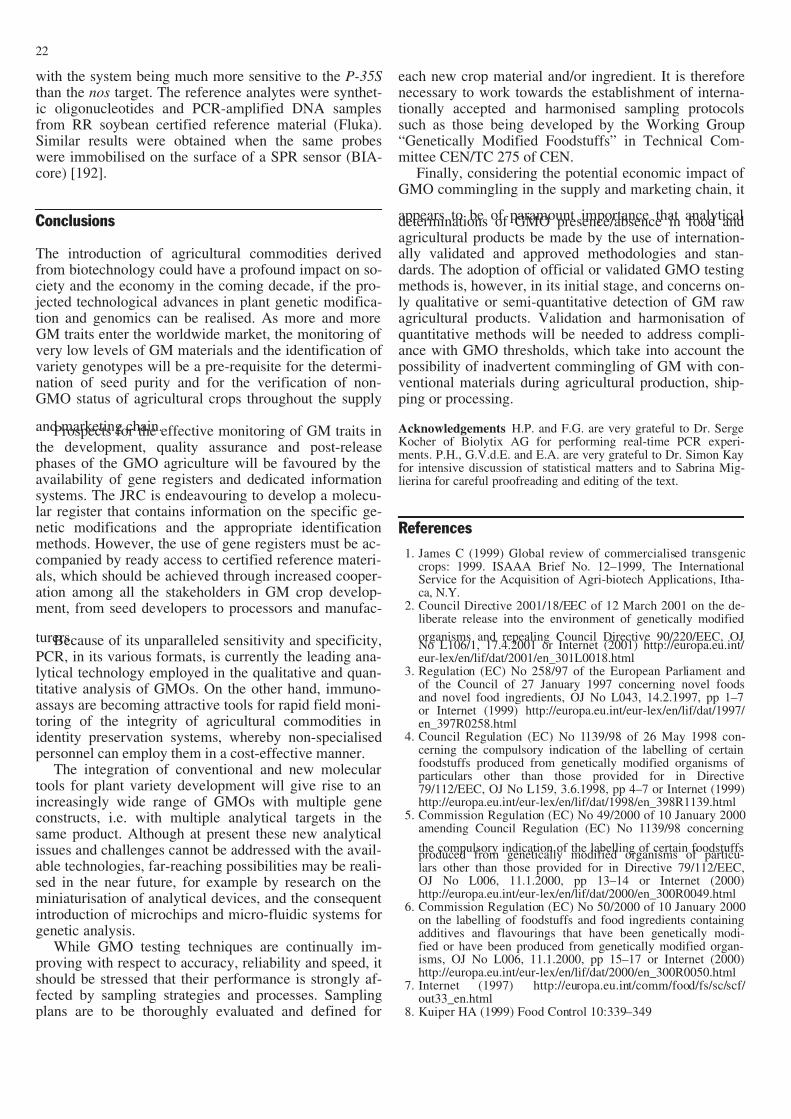
7/26/2019 Modif Genetic
http://slidepdf.com/reader/full/modif-genetic 20/24
with the system being much more sensitive to the P-35S than the nos target. The reference analytes were synthet-ic oligonucleotides and PCR-amplified DNA samplesfrom RR soybean certified reference material (Fluka).Similar results were obtained when the same probeswere immobilised on the surface of a SPR sensor (BIA-core) [192].
Conclusions
The introduction of agricultural commodities derivedfrom biotechnology could have a profound impact on so-ciety and the economy in the coming decade, if the pro- jected technological advances in plant genetic modifica-tion and genomics can be realised. As more and moreGM traits enter the worldwide market, the monitoring of very low levels of GM materials and the identification of variety genotypes will be a pre-requisite for the determi-nation of seed purity and for the verification of non-GMO status of agricultural crops throughout the supply
and marketing chain.Prospects for the effective monitoring of GM traits inthe development, quality assurance and post-releasephases of the GMO agriculture will be favoured by theavailability of gene registers and dedicated informationsystems. The JRC is endeavouring to develop a molecu-lar register that contains information on the specific ge-netic modifications and the appropriate identificationmethods. However, the use of gene registers must be ac-companied by ready access to certified reference materi-als, which should be achieved through increased cooper-ation among all the stakeholders in GM crop develop-ment, from seed developers to processors and manufac-
turers.Because of its unparalleled sensitivity and specificity,PCR, in its various formats, is currently the leading ana-lytical technology employed in the qualitative and quan-titative analysis of GMOs. On the other hand, immuno-assays are becoming attractive tools for rapid field moni-toring of the integrity of agricultural commodities inidentity preservation systems, whereby non-specialisedpersonnel can employ them in a cost-effective manner.
The integration of conventional and new moleculartools for plant variety development will give rise to anincreasingly wide range of GMOs with multiple geneconstructs, i.e. with multiple analytical targets in thesame product. Although at present these new analyticalissues and challenges cannot be addressed with the avail-able technologies, far-reaching possibilities may be reali-sed in the near future, for example by research on theminiaturisation of analytical devices, and the consequentintroduction of microchips and micro-fluidic systems forgenetic analysis.
While GMO testing techniques are continually im-proving with respect to accuracy, reliability and speed, itshould be stressed that their performance is strongly af-fected by sampling strategies and processes. Samplingplans are to be thoroughly evaluated and defined for
each new crop material and/or ingredient. It is thereforenecessary to work towards the establishment of interna-tionally accepted and harmonised sampling protocolssuch as those being developed by the Working Group“Genetically Modified Foodstuffs” in Technical Com-mittee CEN/TC 275 of CEN.
Finally, considering the potential economic impact of GMO commingling in the supply and marketing chain, it
appears to be of paramount importance that analyticaldeterminations of GMO presence/absence in food andagricultural products be made by the use of internation-ally validated and approved methodologies and stan-dards. The adoption of official or validated GMO testingmethods is, however, in its initial stage, and concerns on-ly qualitative or semi-quantitative detection of GM rawagricultural products. Validation and harmonisation of quantitative methods will be needed to address compli-ance with GMO thresholds, which take into account thepossibility of inadvertent commingling of GM with con-ventional materials during agricultural production, ship-ping or processing.
Acknowledgements H.P. and F.G. are very grateful to Dr. SergeKocher of Biolytix AG for performing real-time PCR experi-ments. P.H., G.V.d.E. and E.A. are very grateful to Dr. Simon Kayfor intensive discussion of statistical matters and to Sabrina Mig-lierina for careful proofreading and editing of the text.
References
1. James C (1999) Global review of commercialised transgeniccrops: 1999. ISAAA Brief No. 12–1999, The InternationalService for the Acquisition of Agri-biotech Applications, Itha-ca, N.Y.
2. Council Directive 2001/18/EEC of 12 March 2001 on the de-liberate release into the environment of genetically modified
organisms and repealing Council Directive 90/220/EEC, OJNo L106/1, 17.4.2001 or Internet (2001) http://europa.eu.int/ eur-lex/en/lif/dat/2001/en_301L0018.html
3. Regulation (EC) No 258/97 of the European Parliament andof the Council of 27 January 1997 concerning novel foodsand novel food ingredients, OJ No L043, 14.2.1997, pp 1–7or Internet (1999) http://europa.eu.int/eur-lex/en/lif/dat/1997/ en_397R0258.html
4. Council Regulation (EC) No 1139/98 of 26 May 1998 con-cerning the compulsory indication of the labelling of certainfoodstuffs produced from genetically modified organisms of particulars other than those provided for in Directive79/112/EEC, OJ No L159, 3.6.1998, pp 4–7 or Internet (1999)http://europa.eu.int/eur-lex/en/lif/dat/1998/en_398R1139.html
5. Commission Regulation (EC) No 49/2000 of 10 January 2000amending Council Regulation (EC) No 1139/98 concerning
the compulsory indication of the labelling of certain foodstuffsproduced from genetically modified organisms of particu-lars other than those provided for in Directive 79/112/EEC,OJ No L006, 11.1.2000, pp 13–14 or Internet (2000)http://europa.eu.int/eur-lex/en/lif/dat/2000/en_300R0049.html
6. Commission Regulation (EC) No 50/2000 of 10 January 2000on the labelling of foodstuffs and food ingredients containingadditives and flavourings that have been genetically modi-fied or have been produced from genetically modified organ-isms, OJ No L006, 11.1.2000, pp 15–17 or Internet (2000)http://europa.eu.int/eur-lex/en/lif/dat/2000/en_300R0050.html
7. Internet (1997) http://europa.eu.int/comm/food/fs/sc/scf/ out33_en.html
8. Kuiper HA (1999) Food Control 10:339–349
22
7/26/2019 Modif Genetic
http://slidepdf.com/reader/full/modif-genetic 21/24
9. Bindler G, Dorlhac de Borne F, Gadani F, Gregg E, Guo Z,Klus H, Maunders M, Mueller L, Negishi H, Pijnenburg H,Ward M, Zuber J (1999) Report of the task force geneticallymodified tobacco: detection methods. CORESTA Bulletin1999–4, Cooperation Centre for Scientific Research Relativeto Tobacco, Paris, France, pp 77–148
10. Gachet M, Martin GG, Vigneau F, Meyer G (1999) TrendsFood Sci Technol 9:380–388
11. Gadani F, Bindler G, Pijnenburg H, Rossi L, Zuber J (2000)Beitr Tabakforsch Int 19:85–96
12. Hemmer W (1997) Foods derived from genetically modifiedorganisms and detection methods. BATS-Report 2/1997,Agency for Biosafety Research and Assessment of TechnologyImpacts of the Swiss Priority Programme Biotechnology of theSwiss National Science Foundation, Basel, Switzerland
13. Lüthy J (1999) Food Control 10:359–36114. Meyer R (1999) Food Control 10:391–39915. Messens K, Theuns I, Dewettinck K, Van Bockstaele E,
Huyghebaert A, De Loose M (1999) Detection of geneticallymodified organisms in food. Meded Fac Landbouwwet Rijks-univ Gent 64/5b, Gent, Belgium
16. Parkes H (in press) J AOAC Int17. Gilbert J (1999) Food Control 10:363–36518. Berger B, von Holst C (in press) Environ Sci Pollut Res19. Whitaker TB, Springer J, Defize P, de Koe J, Coker R (1995) J
AOAC 78:1010–1018
20. United States Department of Agriculture (1995) Grain InspectionHandbook – Book I – Grain Sampling. United States Depart-ment of Agriculture (USDA) Grain Inspection Packers andStockyards Administration (GIPSA) Federal Grain InspectionService, Washington D.C. or Internet http://www.usda.gov/gipsa/ reference-library/handbooks/grain-insp/grbook1/gihbk1.html
21. Tanner S, Freese L (in press) J AOAC Int22. Internet (2001)http://www.usda.gov/gipsa/biotech/sampling-
plan1.xls23. Internet (2001)http://www.usda.gov/gipsa/reference-library/di-
recti/9181–1.pdf 24. Remund K, Dixon D, Wright D, Holden L (in press) Seed Sci25. Heissenberger A (in press) J AOAC Int26. Hübner P, Waiblinger HU, Pietsch K, Brodmann P (in press) J
AOAC Int27. Pietsch K, Waiblinger HU, Brodmann P, Wurz A (1997) Dtsch
Lebensm Rundsch 93:35–3828. Zimmermann A, Lüthy J, Pauli U (1998) Z Lebensm UntersForsch 207:81–90
29. Meyer R, Jaccaud E (1997) Detection of genetically modifiedsoya in processed food products: development and validationof PCR assay for the specific detection of glyphosate-tolerantsoybeans. In: Amado R, Battaglia R (eds) Proceedings 9th Eu-ropean Conference on Food Chemistry. Authenticity and adul-teration of food – The analytical approach, vol 1. Interlaken,Switzerland 24–26 September 1997. Nestle’, Lausanne, Swit-zerland, pp 23–28
30. Pauli U, Liniger M, Zimmermann A (1998) Z Lebensm UntersForsch 207:264–267
31. Hupfer C, Schmitz-Winnenthal J, Engel KH (1999) Lebens-mittelchemie 53:2–20
32. Hellebrand M, Nagy M, Mörsel JT (1998) Z Lebensm UntersForsch A 206:237–242
33. Pauli U, Liniger M, Zimmermann A, Schrott M (2000) MittLebensm Hyg 91:491–501
34. Vroh Bi I, Harvengt L, Chandelier A, Mergeai G, Du Jardin P(1996) Plant Breeding 115:205–206
35. Rogers SO, Bendich AO (1988) Plant Mol Biol Man A6:1–1036. Spoth B, Strauss E (1999) Promega Notes Mag 73:23–2537. Brodmann P, Eugster A, Hübner P, Meyer R, Pauli U, Vögeli
U, Lüthy J (1997) Mitt Geb Lebensm Hyg 88:722–73138. Köppel E, Stadler M, Lüthy J, Hübner P (1997) Mitt Geb
Lebensmittelunters Hyg 88:164–17539. Official Collection of Test Methods (1997) Detection of a ge-
netic modification of potatoes by amplification of the modi-fied DNA sequence using the polymerase chain reaction
(PCR) and hybridisation of the PCR product with a DNAprobe. German Federal Foodstuffs Act – Food Analysis, arti-cle 35, L 24.01–1. Beuth, Berlin Köln
40. Official Collection of Test Methods (1998) Detection of a ge-netic modification of soybeans by amplification of the modi-fied DNA sequence by means of the polymerase chain reac-tion (PCR) and hybridisation of the PCR product with a DNAprobe. German Federal Foodstuffs Act – Food Analysis, arti-cle 35, L 23.01.22–1. Beuth, Berlin Köln
41. Official Collection of Test Methods (1999) Detection of a ge-
netic modification of tomatoes by amplification of the modi-fied DNA sequence using the polymerase chain reaction(PCR) and hybridisation of the PCR product with a DNAprobe. German Federal Foodstuffs Act – Food Analysis, arti-cle 35, L 25.03.01. Beuth, Berlin Köln
42. Ehlers B, Strauch E, Goltz M, Kubsch D, Wagner H, Maidhof H, Bendiek J, Appel B, Buhk HJ (1997) Bundesgesundheits-blatt 40:118–121
43. Dellaporta S (1994) Plant DNA miniprep and microprep: ver-sions 2.1–2.3. In: Freeling M, Walbot V (eds) The maize hand-book. Springer, Berlin Heidelberg New York, pp 522–525
44. Wurz A, Rüggeberg H, Brodmann P, Waiblinger HU, PietschK (1998) Dtsch Lebensm Rundsch 94:159–161
45. Hupfer C, Mayer J, Hotzel H, Sachse K, Engel KH (1999) EurFood Res Technol 209:301–304
46. Tengel C, Schüßler P, Sprenger-Haußels M, Setzke E, Balles J
(2000) Dtsch Lebensm Rundsch 96:129–13547. Hurst CD, Knight A, Bruce IJ (1999) Mol Breeding 5:579–58648. Sakamoto K, Kusaba M, Nishio T (2000) Plant Cell Rep
19:400–40649. Krabel D, Vornam B, Herzog S (1998) Angew Bot 72:10–1350. Cheng FS, Brown SK, Weeden NF (1999) Hortscience
32:921–92251. Csaikl UM, Bastian H, Brettschneider R, Gauch S, Meir A,
Schauerte M, Scholz F, Sperisen C, Vornam B, Ziegenhagen B(1998) Plant Mol Biol Rep 16:69–86
52. Wang H, Qi M, Cutler A (1993) Nucleic Acids Res21:4153–4154
53. Hee Wan Kang, Yong Gu Cho, Ung Han Yoon, Moo YoungEun (1998) Plant Mol Biol Rep 16:90
54. Singh M, Bandana, Ahuja PS (1999) Plant Mol Biol Rep17:171–178
55. Melzak KA, Sherwood CS, Turner RFB, Haynes CA (1996) JColloid Interface Sci 181:635–64456. Murray HG, Thompson WF (1980) Nucleic Acids Res 8:
4321–432557. Schweizerisches Lebensmittelbuch (1998) Molekularbiologi-
sche Methoden. In: Bundesamt für Gesundheit (ed) Eidgenös-sische Drucksachen und Materialzentrale, Bern, Switzerland,chap 52B
58. Meyer R (1995) Z Lebensm Unters Forsch 201:583–58659. Hupfer C, Hotzel H, Sachse K, Engel KH (1997) Z Lebensm
Unters Forsch 205:442–44560. DMIF-GEN (1999) Development of methods to identify foods
produced by means of genetic engineering. EU-Project SMT4-CT96–2072. DMIF-GEN Final Report, 15 December 1999
61. Wurz A (1999) The use of screening procedures and highlyspecific PCR systems for the analysis of transgenic foods –experiences and implications for routine analyses. In: Zagon J,Broll H, Schreiber GA, Schauzu M (eds) Proceedings of theEuropean Research Project SMT4-CT96–2072: “Developmentof Methods to Identify Foods Produced by Means of GeneticEngineering”. BgVV-Heft 5/1999. Bundesinstitut für gesund-heitlichen Verbraucherschutz und Veterinärmedizin, Berlin,Germany, pp. 31–36
62. Jaccaud E, Höhne M, Meyer R (in press) J AOAC Int63. Gadani F (2000) Personal communication64. Wolf C, Scherzinger M, Wurz A, Pauli U, Hübner P, Lüthy J
(2000) Eur Food Res Technol 210:367–37265. National Center for Biotechnology Information (1994)
http://www.ncbi.nlm.nih.gov/entrez/query.fcgi?cmd=Retrieve&db=Nucleotide&list_uids=513158&dopt=GenBank
23
7/26/2019 Modif Genetic
http://slidepdf.com/reader/full/modif-genetic 22/24
66. National Center for Biotechnology Information (1995)http://www.ncbi.nlm.nih.gov/entrez/query.fcgi?cmd=Retrieve&db=Nucleotide&list_uids=1122438&dopt=GenBank
67. Koziel MG, Beland GL, Bowman C, Carozzi NB, CrenshawR, Crossland L, Dawson J, Desai N, Hill M, Kadwell S,Launis K, Lewis K, Maddox D, McPherson K, Meghji MR,Merlin E, Rhodes R, Warren GW, Wright M, Evola SV (1993)Bio/Technol 11:194–200
68. Allmann M, Candrian U, Höfelein C, Lüthy J (1993) Z LebensmUnters Forsch 196:248–251
69. Hupfer C, Hotzel H, Sachse K, Engel KH (1998) Z LebensmUnters Forsch A 206:203–20770. Monsanto (1995) Corn/IR/Lepidopteran resistant. APHIS peti-
tion No. 95–093–01p. Biotechnology Permits, USDA, APHIS,BBEP, Riverdale, Md.
71. Krech A (1997) Mais “high mobility group” Proteine: Isolie-rung und Analyse von Genkonstrukten. PhD Thesis. Albert-Ludwigs Universität, Freiburg
72. Zimmermann A, Hemmer W, Liniger M, Lüthy J, Pauli U(1998) Lebensm Wiss Technol 31:664–667
73. Koziel MG, Desai NM, Lewis KS, Kramer VC, Warren GW,Evola SV, Crossland LD, Wright MS, Merlin EJ, Launis KL,Rothstein SJ, Bowman CG, Dawson JL, Dunder EM,Pace GM, Suttie JL (1997) Synthetic DNA sequencehaving enhanced insecticidal activity in maize. US PatentNo. 5,625,136, application No. 951715, or Internet
http://164.195.100.11/netacgi/nph-Parser?Sect1=PTO2&Sect2=HITOFF&u=/netahtml/search-adv.htm&r=185&f=G&l=50&d=FT00&s1=Koziel&p=4&OS=Koziel&RS=Koziel
74. Wohlleben W, Arnold W, Broer I, Hillemann D, Strauch E,Pühler A (1988) Gene 70:25–37
75. Sanders PR, Winter JA, Barnason AR, Rogers SG, Fraley RT(1997) Nucleic Acids Res 15:1543–1558
76. Estruch JJ, Kadwell S, Merlin E, Crossland L (1994) Proc NatlAcad Sci USA 91:8837–8841
77. Hudspeth RL, Grula JW (1989) Plant Mol Biol 12:579–58978. Rochester DE, Winer JA, Shah DM (1986) EMBO J 5:451–
45879. Freeling M, Bennet DC (1985) Ann Rev Genet 19:297–32380. Matsuoka T, Kawashima Y, Akiyama H, Miura H, Goda Y,
Kusakabe Y, Isshiki K, Toyoda M, Hino A (2000) J Food HygSoc Japan 41:137–143
81. Kirihara JA, Hunsberger JP, Mahoney WC, Messing JW(1988) Mol Gen Genet 211:477–48482. Studer E, Dahinden I, Lüthy J, Hübner P (1997) Mitt Geb Le-
bensmittelunters Hyg 88:515–52583. Golovkin MV, Abrahám M, Mórcocz S, Bottka S, Fehér A,
Dudits D (1993) Plant Sci 90:41–5284. Plant Genetic Systems (1995) Corn / AP/HT/Male ster-
ile/Phosphinotricin tolerant. APHIS petition No. 95–228–01p.Biotechnology Permits, USDA, APHIS, BBEP, Riverdale, Md.
85. Vodkin LO, Rhodes PR, Goldberg RB (1983) Cell 34:1023–1031
86. Kay RA, Chan M, Daly M, McPherson J (1987) Science236:1299–1302
87. Taberlet P, Gielly L, Pautou G, Bouvet J (1991) Plant Mol Biol17:1105–1109
88. Padgette SR, Kolacz KH, Delannay X, Re DB, LaVallee BJ,Tinius CN, Rhodes WK, Otero YI, Barry GF, Eichholz DA,Peschke VM, Nida LD, Taylor NB, Kishore GM (1995) CropSci 35:1451–1461
89. Wurz A, Willmund R (1997) Identification of transgenic gly-phosate-resistant soybeans. In: Schreiber GA, Bögl KW (eds)Foods produced by means of genetic engineering. 2nd StatusReport. BgVV-Heft 1/1997, Bundesinstitut für gesundheitli-chen Verbraucherschutz und Veterinärmedizin, Berlin, Germa-ny, pp 115–117
90. Meyer R, Chardonnens F, Hübner P, Lüthy J (1996) Z LebensmUnters Forsch 203:339–344
91. Monsanto (1993) Soybean / HT/Glyphosate tolerant, APHISpetition No. 93–258–01p. Biotechnology Permits, USDA,APHIS, BBEP, Riverdale, Md.
92. Beck E, Ludwig G, Auerswald EA, Reiss B, Schaller H(1982) Gene 19:327–336
93. Sheehy RE, Kramer M, Hiatt WR (1988) Proc Natl Acad SciUSA 85:8805–8809
94. Smith CJS, Watson CF, Ray J, Bird CR, Morris PC, SchuchW, Grierson D (1988) Nature 334:724–726
95. Padegimas L, Shullga OA, Skryabin KG (1993) Mol Biol27:583–585
96. An G (1995) Binary Ti plasmid vectors. In: Gartland KMA,Davey MR (eds) Agrobacterium protocols, vol 44. In: Walker
JM (series ed) Methods in molecular biology. Humana, To-towa, NJ, pp 47–4897. Kuipers GJ, Vreem JTM, Meyer H, Jacobsen E, Feenstra WJ,
Visser RGF (1992) Euphytica 59:83–9198. Hergersberg M (1988) Molekulare Analyse des waxy Gens
aus Solanum tubersorum und Expression von waxy antisenseRNA in transgenen Kartoffen. PhD Thesis. University of Co-logne, Germany
99. Rocha-Sosa M, Sonnewald U, Frommer W, Stratmann M,Schell J, Willmitzer L (1989) EMBO J 8:23–29
100. Hassan-Hauser C, Mayer W, Hörtner H (1998) Z LebensmUnters Forsch A 206:83–87
101. Zeneca (1995) Potato / IR/Colorado potato beetle resistant.APHIS petition No. 95–290–01p. Biotechnology Permits,USDA, APHIS, BBEP, Riverdale, Md.
102. Jongedijk E, de Schutter AAJM, Stolte T, van den Elzen
PJM, Cornelissen BJC (1992) Bio/Technol 10:422–429103. DuPont (1995) Cotton / HT/Sulfonylurea tolerant. APHIS pe-tition No. 95–256–01p. Biotechnology Permits, USDA,APHIS, BBEP, Riverdale, Md.
104. Yang JS, Yu TA, Cheng YH, Yeh SD (1996) Plant Cell Rep15:459–464
105. Blake NK, Ditterline RL, Stout RG (1991) Crop Sci31:1686–1688
106. Kriete G, Perlick AM, Pühler A, Broer I (1996) VortrPflanzenzüchtg 32:157-159
107. Gierson E, Tucker GA, Keen J, Ray J, Bird CR, Schuch W(1986) Nucleic Acids Res 14:8595–8603
108. Smith CJS, Watson CF, Bird CR, Ray J, Schuch W, GiersonD (1990) Mol Gen Genet 224:477–481
109. Cooke R (1999) Sci Technol 27:669–680110. Preston LR, Harker N, Holton T, Morell MK (1999) Plant
Var Seeds 12:191–205111. Rossi L, Bindler G, Pijnenburg H, Isaac P, Giraud-Henry I,Mahe M, Orvain C, Gadani F (in press) Potential of molecu-lar marker analysis for variety identification in processed to-bacco ( Nicotiana tabacum L.)
112. Windels P, Theuns I, Dendauw J, Depicker A, Van BockstaeleE, M de Loose (1999) Development of a line specific GMOdetection method: a case study. Meded Fac LandbouwwetRijksuniv. Gent, 64/5b, Gent, Belgium
113. Van den Eede G (2000) Personal communication114. Köhler T, Laßner D, Rost AK, Thamm B, Pustowoit B,
Remke H (1996) Quantitation of mRNA by DNA polymerasechain reaction – non-radioactive PCR methods. Springer,Berlin Heidelberg New York
115. Raeymaekers L (1993) Anal Biochem 214:582–585116. Rasmussen RP (1994) Rapid Cyclist 2:1–5117. Ferré F (1998) Key issues, challenges, and future opportuni-
ties in gene quantification. In: Ferré F (ed) Gene quantifica-tion. Advanced biomedical technologies. Birkhäuser, Boston,pp 1–16
118. Wurz A, Bluth A, Zeltz P, Pfeifer P, Willmund R (1999) FoodControl 10:385–389
119. Hübner P, Studer E, Häfliger D, Stadler M, Wolf C, Looser C(1999) Accred Qual Assur 4:292–298
120. Hupfer C, Hotzel H, Sachse K, Moreano F, Engel KH (2000)Eur Food Res Technol 212:95–99
121. Laurie DA, Bennett MD (1985) Heredity 55:307–313122. Royal Botanic Gardens (2000) http://www.rbgkew.org.uk/cval/
homepage.html123. Pijnenburg H (2001) Personal communication
24
7/26/2019 Modif Genetic
http://slidepdf.com/reader/full/modif-genetic 23/24
124. Gilliland G, Perrin S, Blanchard K, Bunn HF (1990) ProcNatl Acad Sci USA 87:2725–2729
125. Studer E, Rhyner C, Lüthy J, Hübner P (1998) Z LebensmUnters Forsch 207:207–213
126. Hübner P, Studer E, Lüthy J (1999) Nature Biotechnol 17:1137–1138
127. Hardegger M, Brodmann P, Hermann A (1999) Eur Food ResTechnol 209:83–87
128. González I, García T, Fernández A, Sanz B, Hernández PE,Marín R (1999) J Appl Microbiol 66:231–236
129. Landgraf A, Reckmann B, Pingoud A (1991) Anal Biochem198:86–91130. Taoufik Y, Froger D, Benoliel S, Wallon C, Dussaix E,
Delfraissy JF, Lantz O (1998) Eur Cytokine Netw 9:197–204
131. Heid CA, Stevens J, Livak KJ, Williams PM (1996) GenomeRes 6:986–994
132. Higuchi R, Dollinger G, Walsh PS, Griffith R (1992) Bio/ Technol 10:413–417
133. Va M, Pijnenburg H, Gendre F, Brignon P (1999) J AgricFood Chem 47:5261–5266
134. Pijnenburg H (1998) Relative quantification calculationmethods.In: Wicky R (ed) First Swiss Sequence DetectionSystems User Meeting. Wengen, Switzerland 3–4 December1998. Applied Biosystems, Switzerland
135. Johnson MR, Wang K, Smith JB, Heslin MJ, Diasio RB
(2000) Anal Biochem 278:175–184136. von Ahsen N, Oellerich M, Schütz E (2000) Clin Chem46:156–161
137. Siler D, Minnick N, Dvorak N, Moore L, Isaac P, Crystele C,Malandro MS (2000) Quantitative detection of transgenes ingenetically modified plants by real-time PCR.In: Heller SR(ed) Plant & Animal Genome VIII conference. San Diego,Calif. 9–12 January 2000. NIST, USA
138. Höhne M, Rosa C, Meyer R (in press) J AOAC Int139. Wittwer CT, Herrmann MG, Moss AA, Rasmussen RP
(1997) BioTechniques 22:130–131, 134–138140. Tyagi S, Kramer FR (1996) Nature Biotechnol 14:303–308141. Whitecomb D, Theaker J, Guy SP, Brown T, Little S (1999)
Nature Biotechnol 17:804–807142. McKillip J, Drake M (2000) J Food Prot 63:855–859143. Leone G, van Schijndel H, van Gemen B, Kramer FR,
Schoen CD (1998) Nucleic Acids Res 26:2150–2155144. Cayouette M, Sucharczuk A, Moores J, Tyagi S, Kramer FR(1999) Strategies Newsletter Special Issue “Sentinel Molecu-lar Beacons” 12:85–88
145. Applied Biosystems (2001) http://www.appliedbiosystems.com/ products/productdetail.cfm?id=641&submit.x=11&submit.y=10
146. Applied Biosystems (2001) http://www.appliedbiosystems.com/ molecularbiology/about/pcr/sds/5700_sds/
147. Roche (2001)http://biochem.roche.com/lightcycler/index.htm148. P.E. Corporation (2001)http://www.smartcycler.com/ 149. Bio-Rad (2001)http://www.bio-rad.com/iCycler/ 150. Stratagene (2001) http://www.stratagene.com/q_pcr/Mx4000.asp151. AFNOR (2000) Foodstuffs – Detection and quantification
of genetically modified vegetal organisms and derived prod-ucts – Part 1 – Guidelines and requirements. AssociationFrançaise de Normalisation, Paris, France
152. European Agency for the Evaluation of Medical Products(1995) Guideline CPMP/ICH/281/95: Validation of Ana-lytical Procedures: Methodology. Internet (2001) http:// www.emea.eu.int/pdfs/human/ich/028195en.pdf
153. European Agency for the Evaluation of Medical Products(1995) Guideline CPMP/ICH/381/95: Validation of Analyti-cal Methods: Definitions and Terminology. Internet (2001)http://www.emea.eu.int/pdfs/human/ich/038195en.pdf
154. Anklam E (1999) Anal Chim Acta 393:177–179155. Köppel-Overkamp R (2000) Personal communication156. Forthofer RN, Sul Lee E (1995) Introduction to bio-statistics:
a guide to design, analysis and discovery. Academic Press,San Diego London
157. Paul Ehrlich Institut (1999) Anforderungen an Validierungbzw. Routinebetrieb der HCV-NAT im Blutspendewesen. In-ternet (2001)http://www.pei.de/massnahm/valid.html
158. Kay S, Van den Eede G (2001) Nature Biotechnol 19(5): 405159. Jankiewicz A, Broll H, Zagon J (1999) Eur Food Res Tech-
nol 209:77–82160. Waiblinger HU, Gutmann M, Hädrich J, Pietsch K (2001)
Dtsche Lebensm Rundsch 97:121–125161. Lipp M, Brodmann P, Pietsch K, Pauwels J, Anklam E
(1999) J AOAC Int 82:923–928
162. Lipp M, Bluth A, Eyquem F, Kruse L, Schimmel H, van denEede G, Anklam E (2001) Eur Food Res Technol 212:497–504
163. Van den Eede G, Lipp M, Eyquem F, Anklam E (2000) Vali-dation of a double competitive polymerase chain reactionmethod for the quantification of GMOs in raw materials.EUR 19676 EN, European Commission Joint Research Cen-tre, Institute for Health and Consumer Protection, Food Prod-ucts and Consumer Goods Unit, Ispra, Italy
164. Internet (2001)http://europa.eu.int/comm/food/fs/biotech/bio-tech05_en.pdf
165. Pauli U, Liniger M, Schrott M, Schouwey B, Hübner P,Brodmann P, Eugster A (2001) Mitt Geb LebensmitteluntersHyg 92:145–158
166. Lipp M, Anklam E (2000) J AOAC Int 83:919–927167. Stave JW (in press) J AOAC Int
168. Steinkeliner H, Korschhineck I (1998) Detection of recombi-nant viral coat protein in transgenic plants. In: CunninghamC, Porter AJR (eds) Methods in biotechnology. Recombinantproteins from plants, vol. 3. Humana, Totowa, New Jersey,pp 65–75
169. Dumbroff EB, Gepstein S (1993) Immunological methods forassessing protein expression in plants. In: Glick BR, Thomp-son JE (eds) Methods in plant molecular biology and biotech-nology. CRC, Washington New York London, pp 207–223
170. Brett GM, Chamber SJ, Huang L, Morgan MRA (1999) FoodControl 10:401–406
171. Fuchs RL, Heeren RA, Gustafson ME, Rogan GJ, BartnickiDE, Leimgruber RM, Finn RF, Hershman A, Berberich SA(1993) Biotechnology 11:1537–1542
172. Rogan GJ, Ream JE, Berberich SA, Fuchs RL (1992) J AgricFood Chem 40:1453–1458
173. Wood DC, Vu LV, Kimack NM, Glennon JR, Ream JE, Nick-son TE (1995) J Agric Food Chem 43:1105–1109174. McKenzie MJ, Mett V, Jameson PE (2000) Plant Cell Rep
19:286–289175. Rogan GJ, Dudin YA, Lee TC, Magin KM, Astwood JD,
Bhatka NS, Leach JN, Sanders PR, Fuchs RL (1999) FoodControl 10:407–414
176. Stave J (1999) Food Control 10:367–374177. Lipton CR, Dautlick JX, Grothaus GD, Hunst PL, Magin
KM, Mihaliak CA, Rubio FM, Stave JW (2000) Food AgricImmunol 12:153–164
178. Byrdwell WC, Neff WE (1996) J Liq Chromatogr RelatTechnol 19:2203–2225
179. Neff WE, Selke E, Mounts TL, Rinsch WM, Frankel EN,Zeitoun MAM (1992) J Am Oil Chem Soc 69:111–118
180. Neff WE, Mounts TL, Rinsch WM, Konishi H, El-AgaimyMA (1994) J Am Oil Chem Soc 71:1101–1109
181. Hurburgh CR, Rippke GR, Heithoff C, Roussel SA, HardyCL (2000) Detection of genetically modified grains by near-infrared spectroscopy. Proceedings PITTCON 2000 – Sci-ence for the 21st Century, #1431. New Orleans, La. 12–17March 2000 or Internet (2000)http://pittcon24857.omnibook-sonline.com/
182. Sanders GWH, Manz A (2000) Trends Anal Chem 19:364–378
183. Lemieux B, Aharoni A, Schena M (1998) Mol Breeding 4:277–289
184. Souteyrand E (1999) Analusis 27:639–646185. Khandurina J, McKnight TE, Jacobson SC, Waters LC, Foote
RS, Ramsey JM (2000) Anal Chem 72:2995–3000
25
7/26/2019 Modif Genetic
http://slidepdf.com/reader/full/modif-genetic 24/24
186. Ibrahim SM, Lofts RS, Jahrling PB, Hencal EA, Weedn VW,Northrup MA, Belgrader P (1998) Anal Chem 70:2013–2017
187. Waters LC, Jacobson SC, Kroutchinina N, Khandurina J,Foote RS, Ramsey JM (1998) Anal Chem 70:5172–5176
188. Moehrle M, Krech A, Winterhalter T, Zeltz P (in press) JAOAC Int
189. Kok EJ, Aarts HJM, Van Hoef AMA, Kuiper HA (in press) JAOAC Int
190. Rich RL, Myszka DG (2000) Curr Opinion Biotechnol11:54–61
191. Minunni M, Mascini M, Motti C, Dainese E, Di Matteo A,Chen B, Cozzani I (in press) Ital J of Biochem,
192. Minunni M, Tombelli S, Chiti G, Mascini M (2000) Biosen-sor approach for genetically modified organisms (GMO) de-tection. Euroanalysis XI, 11th Edition of the European Con-ference on Analytical Chemistry, Lisboa, Portugal 3–9 Sep-tember 2000
26