Modernising public administration and economic growth - ECB
34
1 Modernising public administration and economic growth Miguel St. Aubyn 1 , [email protected] ISEG/UTL - Technical University of Lisbon, Department of Economics; UECE – Research Unit on Complexity in Economics, R. Miguel Lupi 20, P-1249-078 Lisbon, Portugal. Paper presented at the European Central Bank Public Finance Workshop: "Challenges for government spending in the EU", Frankfurt, 6 December 2007 Abstract The links between public administration modernisation, efficiency of public spending, governance and growth are examined for a sample of 38 developed countries (the OECD plus EU countries). Efficiency and governance are shown to be correlated. Also, different measures of governance are significantly correlated to labour productivity. Results suggest that some governance features are more important for growth, namely, the law and order (including judicial system and control of corruption) and regulation quality. JEL: H10, 040, 057 Keywords: governance, public administration, growth 1 This paper was originally commisioned by the Portuguese Ministry of Finance and presented to the workshop “Modernising Public Administration and its Impact on Competitiveness” organised by the Portuguese Presidency and the European Commission, Lisbon, 6th July 2007. This is work in progress and all comments are welcome. The author thanks Álvaro Aguiar and Álvaro Pina for their useful suggestions.
Transcript of Modernising public administration and economic growth - ECB

1
Modernising public administration and economic growth
Miguel St. Aubyn1, [email protected]
ISEG/UTL - Technical University of Lisbon, Department of Economics;
UECE – Research Unit on Complexity in Economics,
R. Miguel Lupi 20, P-1249-078 Lisbon, Portugal.
Paper presented at the
European Central Bank Public Finance Workshop:
"Challenges for government spending in the EU",
Frankfurt, 6 December 2007
Abstract
The links between public administration modernisation, efficiency of public spending, governance and growth are examined for a sample of 38 developed countries (the OECD plus EU countries). Efficiency and governance are shown to be correlated. Also, different measures of governance are significantly correlated to labour productivity. Results suggest that some governance features are more important for growth, namely, the law and order (including judicial system and control of corruption) and regulation quality. JEL: H10, 040, 057 Keywords: governance, public administration, growth
1This paper was originally commisioned by the Portuguese Ministry of Finance and presented to the workshop “Modernising Public Administration and its Impact on Competitiveness” organised by the Portuguese Presidency and the European Commission, Lisbon, 6th July 2007. This is work in progress and all comments are welcome. The author thanks Álvaro Aguiar and Álvaro Pina for their useful suggestions.

2
Modernising public administration and economic growth
1. Introduction .............................................................................................................. 3 2. Public administration modernisation and efficiency................................................... 5
2.1 Methodological issues ......................................................................................... 5 2.2 Some results on education ................................................................................... 6 2.3 Some results on health......................................................................................... 7 2.4 Efficiency and governance .................................................................................. 9
3. Government, governance and growth in developed countries ................................. 10 3.1 The data ............................................................................................................ 10 3.2 Regression results with World Economic Forum indexes .................................. 15 3.3 Governance and cluster analysis with World Economic Forum data .................. 17 3.4 Governance regression results with World Economic Forum based data............ 22 3.5 Governance regression results with World Bank based data............................... 23
4. Conclusions ............................................................................................................ 25 References .................................................................................................................. 26 Appendix .................................................................................................................... 28

3
1. Introduction
A strand of recent economic literature has emphasised the importance of institutions and
governance as a deep determinant for growth. In one influential paper, Olson, Sarna and
Swamy (2000) claim that differences in "governance" can explain why some developing
countries grow rapidly, taking advantage of catching up opportunities, while others lag
behind. In these authors assessment, the quality of governance explains in a
straightforward manner and in empirical terms, something that neither standard
endogenous or exogenous growth models do - why a (small) number of developing
countries converge towards higher income levels and therefore display high growth
rates.
In this literature strand, "governance" is measurable and reflects the quality of
institutions and economic policies. For example, Olson, Sarna and Swamy (2000) have
used the ICRG (International Country Risk Guide) as a source, and governance is
measured by the risk of expropriation, the risk of repudiation of contracts, and by three
variables reflecting administrative effectiveness and the rule of law - the quality of
bureaucracy, the level of corruption and the "degree to which the citizens of a country
are wiling to accept the authority of established institutions to make and implement laws
and adjudicate disputes" (p. 348).
Acemoglu, Johnson and Robinson (2001) is another important reference in the
literature, both in methodological terms and for results attained. The authors provide
empirical evidence favouring the idea that current institutions have a strong influence on
current economic performance of countries with a colonial past. These institutions,
measured by the average protection against expropriation risk, are shaped by the way
settlement occurred in the past, "extractive states" being opposed to "neo-Europe"
colonies. The authors note that the findings of positive and significant correlation
between institutions (or "governance") and economic performance are not a sufficient
condition for causality from the former to the latter. Reverse causation could be at work
- it could be the case that countries afford better institutions as they become richer. The
reverse causation problem is circumvented in econometric terms by resorting to

4
instrumental variables - the "European settler mortality" is used as an instrument, as it is
correlated to institutions but not directly to current GDP per head.
Kaufmann and Kraay (2002) examine the reverse causality effect. Using the World
Bank world-wide governance indicators, they conclude that the positive correlation
between the quality of governance and per capita incomes reflects a strong positive
causation from better governance to higher per capita income and a weak and even
negative causal link from income to governance.
In this paper we are particularly concerned with the links between public administration
modernisation and economic growth in developed countries. In our view, public
administration modernisation is related to two important outcomes - more efficiency in
providing services, and better governance. As previously stated, the link between better
governance and economic growth has been established in the recent literature2. From
our point of view, there are also good reasons to suppose that efficiency in providing
services from the part of the public administration is also positively related to growth.
As explained in more detail in the next section, efficiency measurement in public
provision is based on a comparison between inputs and outputs. More efficiency is
achieved when either more output is provided using the same inputs, or fewer inputs are
used in providing given outputs. Some outputs provided by public administrations are
very likely to impinge positively on productivity and growth. This is the case of
education, research and development, or the legal system. Moreover, even when
efficiency is achieved by reducing inputs used, resources are being liberated for other
uses, and crowding in may occur inducing more investment and growth.
This paper is organised as follows. In the next section, some previous results on
efficiency in public provision of health and education are presented, and some evidence
of a link between efficiency and governance is discussed. Section 3 covers the
empirical results linking governance and labour productivity in developed countries. We
present some new results using different governance indicators, using data from the
2 Other references include Gradstein (2004), Rivera-Batiz (2002) and Wodon (2005).

5
World Economic Forum and from the World Bank. Section 4 concludes. An appendix
contains several tables with data.
2. Public administration modernisation and efficiency
2.1 Methodological issues
Afonso and St. Aubyn (2006a, 2006b) measure efficiency in education and health
provision using a two stage DEA (data envelopment analysis).
Figure 1 illustrates the basic idea behind a two-stage approach. In a simplified one
output and one input DEA problem, A, B and C are found to be efficient and are
represented on the production possibilities frontier, while D is an inefficient decision
making unit (a country).
Figure 1 Efficiency measurement with data envelopment analysis
The output score for country D equals (d1+d2)/d1, and is higher than one, denoting
inefficiency. However, country D inefficiency may be partly ascribed to a “harsh
environment” – a number of perturbing environmental factors may imply that country D
produces less than the theoretical maximum, even if discretionary inputs are efficiently

6
used. In our example, and if the environment for country D was more favourable (e. g.
similar to the sample average), then we would have observed Dc. In other words,
country D would have produced more and would be nearer the production possibility.
The environment corrected output score would be (d1c+d2c)/d1c, lower than (d1+d2)/d1,
and closer to unity.
In Afonso and St. Aubyn (2006a, 2006b), inputs and outputs are chosen for both
6education and health, and non-discretionary (or “environment”) inputs are considered.
Results for education and health are briefly presented in the next section.
2.2 Some results on education
Table 1 summarises variables used in equation efficiency measurement. Two
discretionary inputs were considered – teachers per 100 students and hours per year in
school. Output is measured by student results in the international OECD assessment
program known as PISA. Parents’ education attainment and GDP per capita are the non-
discretionary or environment factors.
Table 1
Summary statistics on education data (25 countries)
Mean
Standard deviation
Minimum Maximum
PISA (2003) 490.5
41.4
374.6 (IND)
545.9 (FI)
Teachers per 100 students (2000-02)
7.7
1.7
5.1 (KOR)
11.5 (PT)
Hours per year in school (2000-02)
946.5
121.2
740.9 (SW)
1274.0 (IND)
Parent education attainment (2001-02)
65.0
24.4
19.0 (THA)
94.0 (JP)
GDP per capita, PPP USD (2003)
22267.1
9327.9
3364.5 (IND)
37063.4 (NO)
Note: FI – Finland; IND – Indonesia; JP – Japan; KOR – Korea; NO – Norway; PT – Portugal; THA – Thailand. Source: Afonso and St. Aubyn (2006a).
Table 2 displays output efficiency scores before correction and after correcting for the
influence of environment factors. A richer country score where parents are highly
educated is corrected upwards (as for Norway). The contrary happens to poorer
countries where educational attainment is lower (as in Indonesia).

7
Table 2
Education - corrected output efficiency scores
Bias corrected
scores (1)
GDP correction
(2)
Education attainment correction
(3)
Fully corrected
scores (4)=(1)+(2)+(3)
Rank
Australia 1.047 0.037 -0.007 1.077 3 Austria 1.104 0.040 0.030 1.174 22 Belgium 1.063 0.033 -0.001 1.095 7 Czech Republic 1.083 -0.041 0.046 1.087 6 Denmark 1.108 0.048 0.028 1.184 23 Finland 1.037 0.027 0.035 1.100 8 France 1.082 0.028 0.005 1.115 14 Germany 1.104 0.029 0.037 1.170 21 Greece 1.191 -0.015 -0.010 1.167 20 Hungary 1.115 -0.058 0.024 1.082 4 Indonesia 1.528 -0.257 -0.075 1.196 24 Ireland 1.094 0.068 -0.002 1.159 19 Italy 1.160 0.026 -0.028 1.159 18 Japan 1.044 0.032 0.052 1.127 17 Korea 1.075 -0.030 0.023 1.068 2 Netherlands 1.066 0.038 0.009 1.112 13 New Zealand 1.068 -0.007 0.026 1.087 5 Norway 1.131 0.069 0.046 1.246 25 Portugal 1.172 -0.026 -0.080 1.067 1 Slovak Republic 1.131 -0.068 0.045 1.108 10 Spain 1.140 0.000 -0.035 1.105 9 Sweden 1.052 0.024 0.039 1.116 15 Thailand 1.348 -0.146 -0.082 1.120 16 Turkey 1.343 -0.162 -0.072 1.109 12 Uruguay 1.296 -0.134 -0.053 1.109 11 Average 1.143 -0.018 0.000 1.126 Source: Afonso and St. Aubyn (2006a).
2.3 Some results on health
In what health is concerned, the output is measured by three variables; life expectancy,
the infant mortality rate and potential years of life lost. The number of doctors, nurses,
hospital beds and magnetic resonance imaging units are the considered inputs. Data on
outputs and inputs is summarised in table 3.

8
Table 3
Summary statistics on health data
Mean
Standard deviation
Minimum Maximum
Life expectancy (in years) 1/ 77.5
2.8
68.4 (TUR)
81.5 (JAP)
Infant mortality rate (deaths per 1000 live births) 2/
4.5
6.5
2.4 (ICE)
36.3 (TUR)
Potential years of life lost (All causes - <70 year,/100 000) 2/
4083
981.2
2917 (JAP)
7056 (HU)
Practising physicians, density per 1000 population 2/
2.8
0.8
1.4 (TUR)
4.4 (GRC)
Practising nurses, density per 1000 population 2/
8.0
3.4
1.6 (KOR)
14.7 (IRE)
Acute care beds, density per 1000 population 2/
4.2
1.8
1.0 (MEX)
9.1 (JAP)
MRI units, per million population 2/
6.8
6.4
0.2 (MEX)
32.3 (JAP)
Notes: 1/ Average for 2000 and 2003. 2/ Average for 2000-2003. TUR – Turkey; JAP – Japan; ICE – Iceland; HU – Hungary; GCR – Greece; KOR – Korea; IRE – Ireland; MEX – Mexico. Source: Afonso and St. Aubyn (2006b).
People health is determined not only by the quality of the health car system, but also by
important behavioural variables. Efficiency scores were therefore corrected considering
the incidence of tobacco consumption and obesity. GDP per head and education
attainment were also included in non-discretionary inputs. Health output efficiency
scores and their correction are presented in table 4.

9
Table 4
Health - Corrected output efficiency scores
Bias corrected
scores (1)
GDP correction
(2)
Education correction
(3)
Obesity correction
(4)
Tobacco correction
(5)
Fully corrected
scores (6)=(1)+(2)+ (3)+(4)+(5)
Rank
Australia 1.141 0.440 0.840 -1.447 1.657 2.630 15 Canada 1.489 0.564 1.129 -0.062 2.491 5.611 19 Czech Republic 1.637 -1.159 -0.960 -0.156 0.376 1.000 1 Denmark 1.416 0.669 -0.827 0.836 -0.785 1.309 9 Finland 1.066 0.252 -0.071 0.219 0.942 2.407 13 France 1.158 0.260 -0.716 0.855 -0.487 1.069 8 Germany 1.318 0.289 -0.471 0.200 0.317 1.652 12 Hungary 4.564 -1.497 -0.294 -0.904 -2.513 1.000 1 Italy 1.175 0.232 -1.272 1.023 0.346 1.505 11 Japan 1.063 0.344 0.973 2.015 -1.470 2.926 16 Korea 1.129 -0.921 0.707 2.015 -1.500 1.430 10 Luxembourg 1.427 2.588 -1.227 -0.829 -2.274 1.000 1 Poland 2.049 -2.130 -0.716 0.481 -0.666 1.000 1 Slovak Republic 2.757 -1.718 -1.183 -1.578 0.317 1.000 1 Spain 1.057 -0.313 0.306 0.163 -0.815 1.000 1 Sweden 1.043 0.191 0.240 0.799 2.342 4.614 18 Switzerland 1.205 0.538 0.084 1.173 -0.428 2.572 14 United Kingdom 1.188 0.237 0.573 -1.690 -0.190 1.000 1 United States 1.055 1.134 2.885 -3.113 2.342 4.302 17 Average 1.523 0.000 0.000 0.000 0.000 2.054
Note: the fully corrected scores do not always add up to the indicated sum since for the cases were the result was below one we truncated it to the unity.
Source: Afonso and St. Aubyn (2006b).
2.4 Efficiency and governance
Efficiency scores from the first stage DEA are highly correlated to output per head, and
this correlation shows up in second stage regressions that allow for the GDP correction
included in tables 3 and 4. In table 5 we present results from the simple regression of
(uncorrected) efficiency scores in one of the governance indicators to be used in section
3 (the principal component of World Bank indicators).

10
The correlation of education scores and governance is highly significant. In what
concerns health, the relationship seems to be less clear-cut.
Table 5
Regression results – efficiency and governance Intercept PC(WB) Number of
countries
Adj. R2
Coefficient
1.119
-0.0198
t-stat 96.872 -3.749 22
Education equation
Prob. 0.000 0.001
0.383
Coefficient 1.584 -0.078
t-stat 8.498 -1.821 19
Health equation
Prob. 0.000 0.086
0.114
Note: PC(WB), principal component of World Bank governance indicators. Interpretation of these results is not straightforward. On the one hand, governance is
correlated to income per head, and income per head is one discretionary input shown to
be significant by Afonso and St. Aubyn (2006a, 2006b). On the other hand, one could
sensibly expect that countries with better governance can also be countries where
provision of health and education is more efficient. Disentangling these two causal links
seems to be an interesting avenue for further research.
3. Government, governance and growth in developed countries
3.1 The data
We want to empirically assess whether there is a statistically significant link between so
called "institutional" or "governance related" variables and the economic performance
of a nation, reflected in labour or total factor productivity.
Our sample of countries includes all European Union and OECD countries, if data was
available. Labour productivity was computed as a percentage of the US in purchasing
power parity terms, using raw data from the AMECO database, updated in the spring of
2007. Total factor productivity was also estimated using the same database and

11
assuming an aggregate Cobb-Douglas production function with a capital share equal to
1/33. An average from 2000 to 2006 was taken in order to smooth cyclical differences.
Figure 2
Labour productivity relative to the US
0.0%
20.0%
40.0%
60.0%
80.0%
100.0%
120.0%
BG RO TR MX LV LT EE PL SK CZ PT HU KO SI CY MT EL JP ES IS CH DE NZ DK SE CA UK NL FI AU IT AT FR IE BE US NO LU
As can be seen from figure 2, almost all countries considered have lower labour
productivity than the US, the exceptions being Norway and Luxembourg. The sample
includes 38 countries. 16 of them exhibit a relative labour productivity figure smaller
than two thirds. Incidentally, all new EU members are included in this set.
3 Computation details are available from the author on request.

12
Figure 3
Total productivity and labour productivity relative to the US
average 2000-2006
0.0000
0.2000
0.4000
0.6000
0.8000
1.0000
1.2000
1.4000
PT EL JP ES CH NZ DK SE CA UK NL FI AU IT AT FR IE BE US NO LU
total productivity
labour productivity
Total factor productivity can only be computed if capital stock figures are available.
This limited this series to 21 countries only. Figure 3 compares relative total factor
productivity to labour productivity. Figures are strikingly similar, so that we decided to
use the labour productivity series instead, as the number of countries covered is much
larger.
The World Economic Forum publishes regularly a Global Competitiveness Report,
which includes a Global Competitiveness Index (GCI)4. This index construction is
described in detail by Sala-i-Martin and Artadi (2004). Here, we provide the essential
features, as it will be used extensively in the next sections.
The GCI covers 125 countries or economies. An Executive Opinion Survey and hard
data from several sources allows the quantification of 134 factors, which are listed in
the appendix (table A.4). In almost all these factors, each country is given a figure
between 1 (low competitiveness) and 7 (high competitiveness)5. These factors are
organised within nine pillars:
4 Porter, Schwab, Lopez-Claros and Sala-i-Martin (2006) contain all data referred here as the “World Economic Forum data.” See also table A.3 in the appendix. 5 In cases where figures are in a different scale, a conversion algorithm to the 1-7 scale is applied.

13
- institutions,
- infrastructure,
- macroeconomy,
- health and primary education,
- higher education and training,
- market efficiency,
- technological readiness,
- business sophistication,
- and innovation.
Institutions, infrastructure, the macroeconomy and health and primary education are
subsumed in the basic requirements subindex. Higher education and training, market
efficiency and technological readiness constitute the efficiency enhancers subindex
while the business sophistication and innovation pillars form the base of the innovation
and sophistication factors subindex.
Figure 4
Global Competitiveness Index in 2006
0.00
1.00
2.00
3.00
4.00
5.00
6.00
BG RO TR MX PL EL CY IT HU LT MT SK LV PT SI CZ ES EE KO NZ LU IE BE AU FR AT CA IS NO UK NL DE JP US DK SE FI CH
The three subindexes make up the global index, which is plotted in figure 4 for our
sample of 38 countries. By construction, no country could achieve more than 7 or less
than 1. As one could expect, our sample includes a good number of very high
achievers. Among the 20 best achievers in the complete list of 125 economies, only

14
three (Singapore, Hong Kong and Taiwan) are not included in our sample. However, the
sample also includes countries that are ranked in the second half of the world table, as is
the case of Romania (68th) or Bulgaria (75th).
Figure 5
Global Competitiveness Index: the thee sub-indexes
0.00
1.00
2.00
3.00
4.00
5.00
6.00
7.00
BG RO TR MX PL EL CY IT HU LT MT SK LV PT SI CZ ES EE KO NZ LU IE BE AU FR AT CA IS NO UK NL DE JP US DK SE FI CH
BR - Basic requirements
EE - Efficiency enhancers
IF - Innovation factors
The three subindexes are graphed in figure 5. Visual inspection allows one to grasp that
even if high achievers in one subindex tend to be high achievers in another subindex,
there is also significant unevenness.
Kaufmann, Kray and Mastruzzi (2006), from the World Bank, present worldwide
governance indicators for 213 economies. Based on hundreds of variables from several
sources, six indicators are listed for six different dimensions of governance: voice and
accountability, political stability and absence of violence, government effectiveness,
regulatory quality, rule of law, and control of corruption. There is a time series of
indicators from 1996 to 2005.
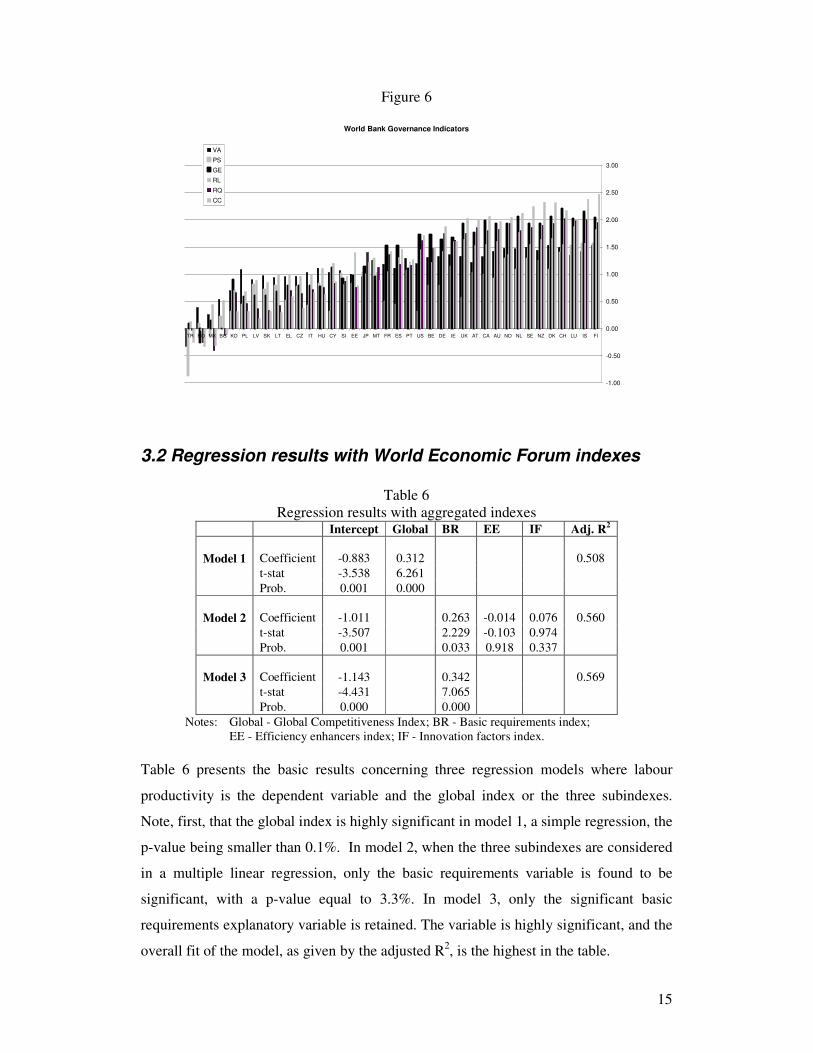
Figure 6 displays the World Bank indicators for our sample of 38 countries, ordered by
the principal component of the six sub-indicators, after taking the average from 2000 to
20056. As one could probably expect, top and worse performers are more or less the
same as when one inspects the World Economic Forum data.
6 The principal component series can be found in table A.3 (appendix).
15
Figure 6
World Bank Governance Indicators
-1.00
-0.50
0.00
0.50
1.00
1.50
2.00
2.50
3.00
TR RO MX BG KO PL LV SK LT EL CZ IT HU CY SI EE JP MT FR ES PT US BE DE IE UK AT CA AU NO NL SE NZ DK CH LU IS FI
VA
PS
GE
RL
RQ
CC
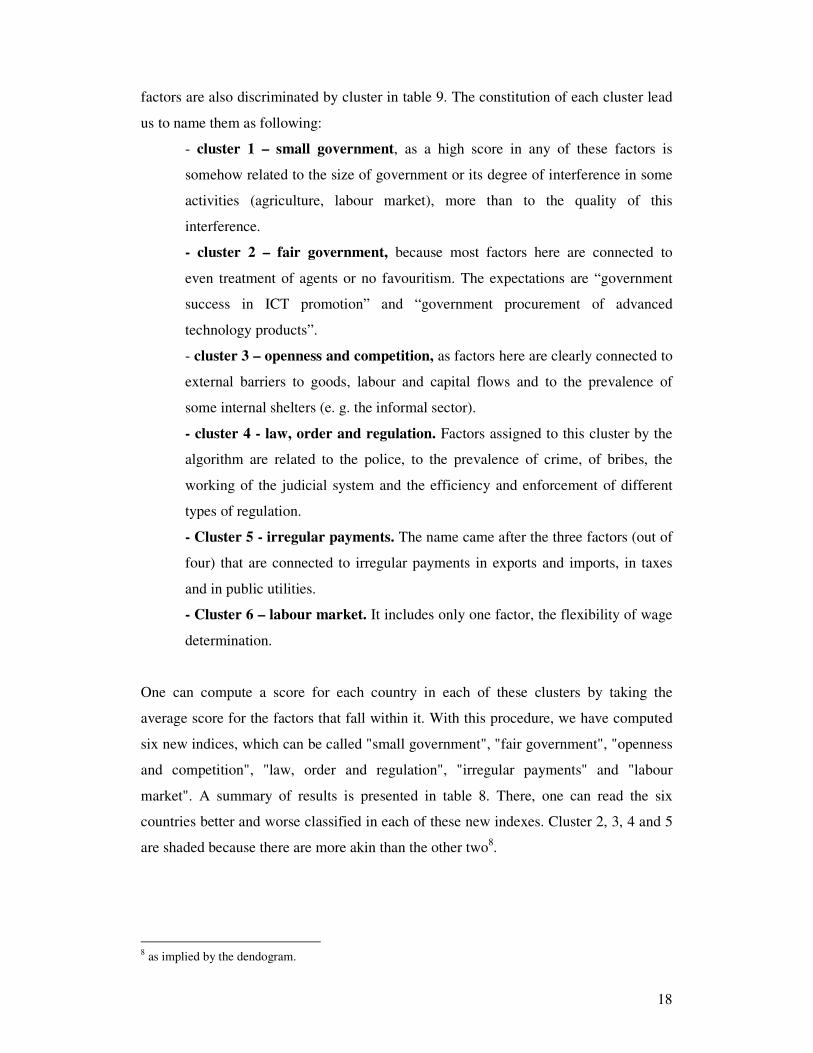
3.2 Regression results with World Economic Forum indexes
Table 6
Regression results with aggregated indexes Intercept Global BR EE IF Adj. R
2
Coefficient
-0.883
0.312
t-stat -3.538 6.261
Model 1
Prob. 0.001 0.000
0.508
Coefficient -1.011 0.263 -0.014 0.076 t-stat -3.507 2.229 -0.103 0.974
Model 2
Prob. 0.001 0.033 0.918 0.337
0.560
Coefficient -1.143 0.342 t-stat -4.431 7.065
Model 3
Prob. 0.000 0.000
0.569
Notes: Global - Global Competitiveness Index; BR - Basic requirements index; EE - Efficiency enhancers index; IF - Innovation factors index. Table 6 presents the basic results concerning three regression models where labour
productivity is the dependent variable and the global index or the three subindexes.
Note, first, that the global index is highly significant in model 1, a simple regression, the
p-value being smaller than 0.1%. In model 2, when the three subindexes are considered
in a multiple linear regression, only the basic requirements variable is found to be
significant, with a p-value equal to 3.3%. In model 3, only the significant basic
requirements explanatory variable is retained. The variable is highly significant, and the
overall fit of the model, as given by the adjusted R2, is the highest in the table.

16
Figure 7
The three basic requirement pillars
0.00
1.00
2.00
3.00
4.00
5.00
6.00
7.00
BG
RO
TR
MX
PL
EL
CY IT
HU LT
MT
SK
LV
PT SI
CZ
ES
EE
KO
NZ
LU IE BE
AU
FR
AT
CA IS
NO
UK
NL
DE
JP
US
DK
SE FI
CH
Ins - Institutions
Inf - Infrastructure
Ma - Macroeconomy
Recall that the basic requirements subindex is based on four pillars - institutions,
infrastructure, the macroconomy and health and primary education. The three first of
those pillars are plotted in figure 7. Note that some Nordic countries, like Finland,
Iceland and Denmark excel in what institutions are concerned, while others like
Germany, Switzerland and France take the lead when one considers infrastructures.
In a regression model where these three pillars are correlated to labour productivity, the
macroeconomy variable does not show up as significant (see model 4, in table 7). A
better specification is retained in model 5, where only institutions and infrastructure are
included. This last variable is slightly more significant than the latter (a p-value of 2.1%
compared to 7.0%).
Table 7
Regression results with basic requirements Intercept Ins Inf Ma Adj. R
2
Coefficient -0.380 0.103 0.114 -0.002 t-stat -1.603 1.800 2.375 -0.029
Model 4
Prob. 0.118 0.081 0.023 0.977
0.558
Coefficient -0.385 0.102 0.114 t-stat -2.523 1.867 2.419
Model 5
Prob. 0.016 0.070 0.021
0.571
Notes: Ins - Institutions index; Inf - Infrastructure index; Ma - Macroeconomy index.

17
3.3 Governance and cluster analysis with World Economic Forum data
A careful examination of all 134 factors considered for the Global Competitiveness
Index led us to select a subset of 48 which we considered to be more directly related to
the governance concept (see table A.4 for the full list of indicators). In a somewhat
impressionistic mode, we considered that a factor like "the impact of legal contributions
to political parties on public policy" than, for example, "financial market
sophistication". These 48 factors are listed in table 9.
Pair wise examination of these 48 factors lead us to realize that cross-country
correlations were considerable. In order to both reduce data dimension for further
empirical uses and to provide a possibly interesting classification of factors on its own
right, we performed cluster analysis across factors.
Cluster analysis proceeds by sequentially associating similar cases into groups or
clusters. Each case is characterised by a vector with specific values for variables. There
are several methods for measuring similarity and for clustering cases. Here, we have
used the Euclidean distance to the group average. In our application, each factor is a
case, and each country is a variable7. In intuitive terms, two factors will be classified in
the same cluster if country scores for each country in those factors are similar.
Figure 8 is a dendogram resulting from cluster analysis. Cases are depicted in the
vertical axe and distance horizontally. The algorithm proceeds by successive
associations or linkages, where each cluster is represented by a horizontal dash and each
association by a vertical one. Cases start all in a different cluster, i.e. in the beginning
there are as many clusters as factors. In the end, all cases are associated in the same
cluster. The number of clusters is therefore somehow arbitrary and dependent on the
degree of dissimilarity within each cluster the researcher wants to tolerate.
Here, visual inspection of the dendogram leads us to consider six clusters, and the
factors that belong to each of them are inside the same rectangle in figure 8. These
7 Note that we could have clustered countries instead. In that case, each country would be a case and each factor would be a variable. The reader interested in cluster analysis techniques may refer to Everitt, Landau and Leese (2001).
18
factors are also discriminated by cluster in table 9. The constitution of each cluster lead
us to name them as following:
- cluster 1 – small government, as a high score in any of these factors is
somehow related to the size of government or its degree of interference in some
activities (agriculture, labour market), more than to the quality of this
interference.
- cluster 2 – fair government, because most factors here are connected to
even treatment of agents or no favouritism. The expectations are “government
success in ICT promotion” and “government procurement of advanced
technology products”.
- cluster 3 – openness and competition, as factors here are clearly connected to
external barriers to goods, labour and capital flows and to the prevalence of
some internal shelters (e. g. the informal sector).
- cluster 4 - law, order and regulation. Factors assigned to this cluster by the
algorithm are related to the police, to the prevalence of crime, of bribes, the
working of the judicial system and the efficiency and enforcement of different
types of regulation.
- Cluster 5 - irregular payments. The name came after the three factors (out of
four) that are connected to irregular payments in exports and imports, in taxes
and in public utilities.
- Cluster 6 – labour market. It includes only one factor, the flexibility of wage
determination.
One can compute a score for each country in each of these clusters by taking the
average score for the factors that fall within it. With this procedure, we have computed
six new indices, which can be called "small government", "fair government", "openness
and competition", "law, order and regulation", "irregular payments" and "labour
market". A summary of results is presented in table 8. There, one can read the six
countries better and worse classified in each of these new indexes. Cluster 2, 3, 4 and 5
are shaded because there are more akin than the other two8.
8 as implied by the dendogram.

19
Table 8 Top six and bottom six countries in each governance cluster
Cluster 1 "small government"
Cluster 2 "fair government"
Cluster 3 "openness and competition"
Cluster 4 "law, order and regulation"
Cluster 5 "irregular payments"
Cluster 6 "labour market"
Top six countries
IS, EE, CH, LU, SK, IE
DK, FI, IS, CH, NL, LU
FI, IE, UK, LU, DK, SE
DK, FI, DE, IS, NO, NZ
DK, NZ, FI, NO, SE, IS
EE, JP, SK, LT, LV, UK
Bottom six countries
SE, BG, SI, FR, BE, IT
LT, CZ, MX, IT, RO, BG
CY, RO, TR, IT, PL, BG
IT, LT, MX, PL, RO, BG
MX, EL, KO, TR, RO, PL
IT, SE, EL, DE, FI, AT
Note that Finland and Denmark come out at the top positions in clusters 2 to 5. Romania
appears at the bottom position in the same clusters. A country like Sweden is at the
bottom position in what concerns "small government", or "labour market", and at the
same time achieves top scores in "openness and competition” and "irregular payments".

20
Figure 8 Dendogram
Cluster analysis applied to governance factors (Euclidean distance to group average)

21
Table 9 Cluster composition
Governance sub-indexes included:
Cluster 1
"small government"
1.07 - regulation 6.01 - agriculture policy costs 6.03 - taxation 6.12 - hiring and firing
Cluster 2
"fair government"
1.03 - public trust of politicians 1.05 - favouritism in decisions of government officials 1.16 - effectiveness of law-making bodies 1.19 - impact of legal contributions to parties on public policy 6.25 - distortive effect of taxes 7.10 - government success in ICT promotion 9.04 - government procurement of advanced technology products
Cluster 3
"openness and
competition"
1.13 - efficacy of corp boards 6.09 - trade barriers 6.10 - foreign ownership restrictions 6.24 - red tape 6.30 - informal sector 6.31 - ease of hiring foreign labor 7.03 - laws relating to ICT 7.09 - govt. prioritization of ICT 7.14 - rules on FDI
Cluster 4
"law, order and
regulation"
1.01 - property rights 1.02 – diversion public funds 1.04 – judicial independence 1.09 – reliability of police 1.10 - crime and violence 1.11 - org. crime 1.12 – ethical behavior firms 1.14 – protection minority shareholders 1.15 - auditing and accounting 1.17 – quality of information on policies and regulation 1.18 – illegal donations to parties 1.25 - irregular public contracts 1.26 - irregular judicial decisions 1.27 - bribes 1.28 - corruption 1.29 - nepotism 6.23 - local equity market access 6.26 - demanding regulatory standards 6.02 - efficiency legal framework 6.07 - antitrust policy 9.07 - intellectual property protection 10.01 - stringent environment regulations 10.02 - clear and stable regulations
Cluster 5
"irregular payments"
1.21 – press freedom 1.22 – irreg payments in exp and imp 1.23 – irreg payments in public utilities 1.24 – irregular payments in tax
Cluster 6
"labour market"
6.13 - Flexibility wage determination

22
3.4 Governance regression results with World Economic Forum based data
In the same manner as with other indexes, we have performed regressions of labour
productivity on these new indexes.
Model 6 in table 10 is a multiple regression where all clusters are used as explanatory
variables. The most significant one is cluster 4, "law, order and regulation", with a p-
value equal to 2.5 percent and a positive coefficient.
In model 7, we have included a principal components (PC) index. This is simply the
first principal component of all 48 governance factors. PC is therefore a linear
combination of the 48 factors that has the highest possible correlation to each of them9.
Model 7 also includes the infrastructure pillar, which proved to be significant in other
models as well. The PC variable displays a p-value equal to 7.9 percent, slightly above
the traditional 5 percent cutting point.
Finally, model 8, which displays the highest R2, take in cluster 4, the "law, order and
regulation" index, as an explanatory variable, together with the infrastructure pillar. The
"law, order and regulation" index is significant below 5 percent, and the infrastructure
p-value is now great than 10 percent (11.2 percent).
Table 10
Regression results with governance indexes Intercept Cl. 1 Cl. 2 Cl. 3 Cl. 4 Cl. 5 Cl. 6 PC Inf Adj. R2
Coeff. -0.134 0.027 -0.174 0.044 0.359 -0.071 -0.053
t-stat -0.332 0.418 -1.334 0.344 2.360 -0.735 -1.732
Model 6
Prob. 0.742 0.679 0.192 0.733 0.025 0.468 0.093
0.578
Coeff. 0.116
0.019 0.111
t-stat 0.468 1.810 2.240
Model 7
Prob. 0.643 0.079 0.032
0.569
Coeff. -0.435 0.128
0.088
t-stat -2.740 2.112 1.630
Model 8
Prob. 0.010 0.042 0.112
0.582
Notes: Cl1, ..., Cl. 6 - Cluster 1, ..., Cluster 6 index. PC - Principal components index. Inf - Infrastructure index.
9 The interested reader may refer to Flury and Riedwyl (1988) for more on principal components analysis techniques.
23
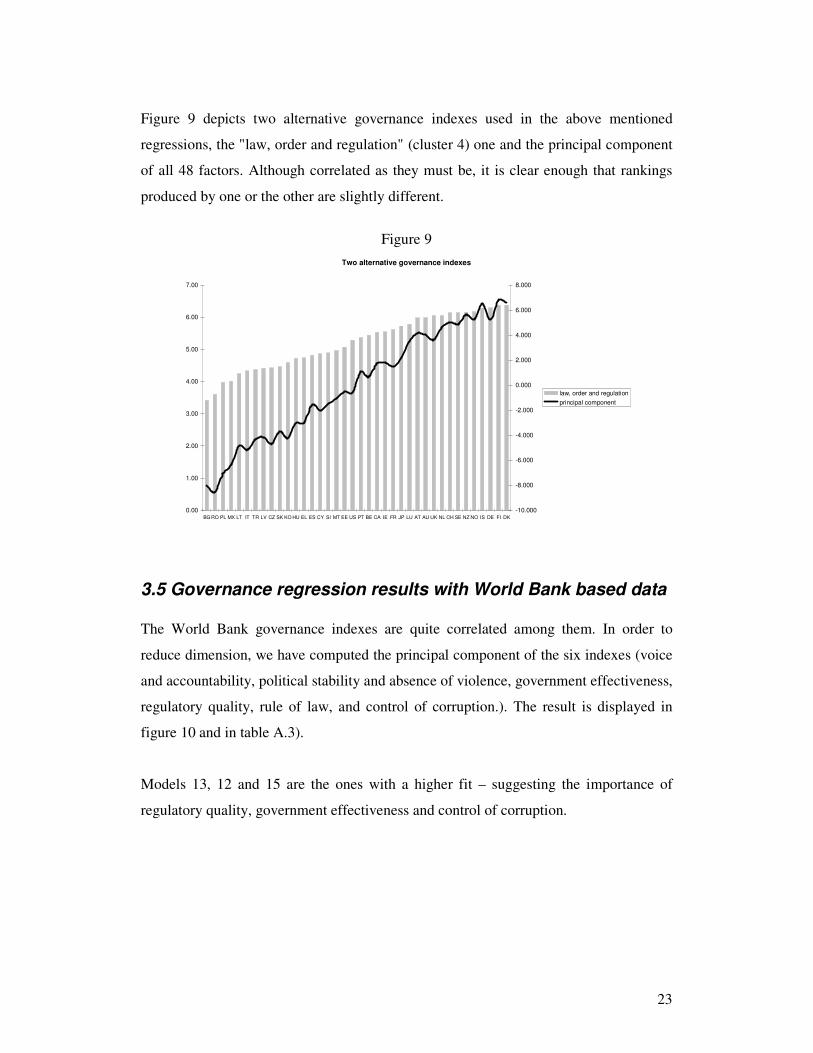
Figure 9 depicts two alternative governance indexes used in the above mentioned
regressions, the "law, order and regulation" (cluster 4) one and the principal component
of all 48 factors. Although correlated as they must be, it is clear enough that rankings
produced by one or the other are slightly different.
Figure 9
Two alternative governance indexes
0.00
1.00
2.00
3.00
4.00
5.00
6.00
7.00
BG RO PL MX LT IT TR LV CZ SK KO HU EL ES CY SI MT EE US PT BE CA IE FR JP LU AT AU UK NL CH SE NZ NO IS DE FI DK
-10.000
-8.000
-6.000
-4.000
-2.000
0.000
2.000
4.000
6.000
8.000
law, order and regulation
principal component
3.5 Governance regression results with World Bank based data
The World Bank governance indexes are quite correlated among them. In order to
reduce dimension, we have computed the principal component of the six indexes (voice
and accountability, political stability and absence of violence, government effectiveness,
regulatory quality, rule of law, and control of corruption.). The result is displayed in
figure 10 and in table A.3).
Models 13, 12 and 15 are the ones with a higher fit – suggesting the importance of
regulatory quality, government effectiveness and control of corruption.

24
Figure 10
World Bank governance indexes
principal component
-6.00
-5.00
-4.00
-3.00
-2.00
-1.00
0.00
1.00
2.00
3.00
4.00
TR RO MX BG KO PL LV SK LT EL CZ IT HU CY SI EE JP MT FR ES PT US BE DE IE UK AT CA AU NO NL SE NZ DK CH LU IS FI
Table 11 Regression results with World Bank governance indexes
Intercept PC VA PS GE RQ RL CC Adj. R2
Coeff. 0.671 0.084
t-stat 29.058 8.279
Model 9
Prob. 0.000 0.000 0.646
Coeff. 0.176 0.176
t-stat 2.129 6.320
Model 10
Prob. 0.040 0.000
0.513
Coeff. 0.466 0.259
t-stat 7.463 3.877 0.275
Model 11
Prob. 0.000 0.000
Coeff. 0.295 0.294
t-stat 6.609 9.529
Model 12
Prob. 0.000 0.000
0.708
Coeff. 0.342
0.284
t-stat 8.865 10.006 0.728
Model 13
Prob. 0.000 0.000
Coeff. 0.195
0.401 t-stat 2.779 7.238 0.581
Model 14
Prob. 0.009 0.000
Coeff. 0.398
0.223 t-stat 10.128 8.481 0.657
Model 15
Prob. 0.000 0.000 PC - Principal component, VA -voice and accountability, PS - political stability and absence of violence, GE - government effectiveness, RQ - regulatory quality, RL - rule of law, CC - control of corruption

25
4. Conclusions
Results presented in this paper suggest there is an important relationship between
governance measures and labour productivity levels in more advanced economies (the
“EU plus OECD countries”). This correlation is present for different governance
measures. Namely, it is found both using the World Economic Forum and the World
Bank governance indicators.
Using data from previous studies on the efficiency of spending on education and health,
results presented here also suggest there is a relationship between efficiency and
governance. Countries where spending is more efficient, i. e. where outputs are higher
for given resources used, are countries with better governance indicators.
Disaggregating of World Economic Forum and World Bank data, and using cluster
analysis across indicators, suggests that some governance features are more important
for growth, like the law and order (including judicial system and control of corruption)
and regulation systems. Successful countries seem to be characterized not so much by
small government but much more by good quality governance.
Prospects for further work include:
i) more research on the links between efficiency, governance and income levels,
disentangling two possible causal links (from efficiency to governance and income or
from governance and income to efficiency).
ii) more research on the causal links between governance and growth, probably
resorting to instrumental variables.
ii) the performance of robustness tests, namely by including more conditioning
variables on the regressions (e. g. education or human capital)

26
References Acemoglu, D., J. Robinson and S. Johnson (2001). "The Colonial Origins of Comparative Development: An Empirical Investigation". American Economic Review, 91, December., pp. 1369-1401. Afonso, A. and M. St. Aubyn (2005). "Non-parametric approaches to education and health efficiency in OECD countries," Journal of Applied Economics, vol. 8(2), pp. 227-246, November. Afonso, A. and M. St. Aubyn (2006a). "Cross-country efficiency of secondary education provision: A semi-parametric analysis with non-discretionary inputs," Economic Modelling, 23(3), pp. 476-491, May. Afonso, A. and M. St. Aubyn (2006b). "Relative Efficiency of Health Provision: a DEA Approach with Non-discretionary Inputs," Working Papers 2006/33, Department of Economics, ISEG, Technical University of Lisbon. Gradstein, M. (2004). "Governance and growth," Journal of Development Economics, 73(2), pp. 505-518, April. Heichel, S., J. Pape and T. Sommerer (2005). “Is there convergence in convergence research? An overview of empirical studies on policy convergence,” Journal of European Public Policy, 12(5), 817. Jayasuriya, R. and Q. Wodon (2005). "Measuring and Explaining the Impact of Productive Efficiency on Economic Development," World Bank Economic Review, Oxford University Press, vol. 19(1), pp. 121-140. Kaufmann, D. and A. Kraay (2002). “Growth Without Governance”. Economia, 3(1), Fall. Kaufmann, D., A. Kraay and M. Mastruzzi (2004). “Governance Matters III: Governance Indicators for 1996, 1998, 2000, and 2002”, World Bank Economic Review. 18, pp. 253-287. Kaufmann, D., Kraay, A. and M. Mastruzzi (2006). Governance Matters V: Aggregate and Individual Governance Indicators for 1996–2005, World Bank Policy Research Working Paper 4012, September. Everitt, b. S. Landau and M. Leese (2001). Cluster Analysis, 4th edition, Arnold. Flury and Riedwyl (1988). Multivariate Statistics: A Practical Approach. Chapman and Hall, New York. Messick, R. (1999). "Judicial Reform and Economic Development: A Survey of the Issues". World Bank Research Observer, vol. 14(1), pp. 117-36, February.

27
Nicoletti, G. and S. Scarpetta (2003). “Regulation, productivity and growth: OECD evidence,” Economic Policy, 18 (36), 9–72. Olson Jr., M., N. Sarna and A. Swamy (2000). "Governance and growth: A simple hypothesis explaining cross-country differences in productivity growth", Public Choice, 102, pp. 341-264. Rivera-Batiz, F. (2002). "Democracy, Governance, and Economic Growth: Theory and Evidence," Review of Development Economics, vol. 6(2), pp. 225-47, June. Sala-i-Martin, X. and E. Artadi (2004). "The Global Competitiveness Index", in The Global Competitiveness Report 2004-2005, World Economic Forum, Palgrave. Porter, M., K. Schwab, A. Lopez-Claros and X. Sala-i-Martin (eds.) (2006). The Global Competitiveness Report 2006-2007, World Economic Forum, Palgrave.

28
Appendix
Table A.1 Country codes
country code country code
Australia AU Latvia LV Austria AT Lithuania LT Belgium BE Luxembourg LU Bulgaria BG Malta MT Canada CA Mexico MX Cyprus CY Netherlands NL Czech Republic CZ New Zealand NZ Denmark DK Norway NO Estonia EE Poland PL Finland FI Portugal PT France FR Romania RO Germany DE Slovak Republic SK Greece EL Slovenia SI Hungary HU Spain ES Iceland IS Sweden SE Ireland IE Switzerland CH Italy IT Turkey TR Japan JP United Kingdom UK Korea, Rep KO United States US

29
Table A.2 Labour productivity relative to the US
country labour productivity country labour productivity
AT 0.8663 JP 0.7129 AU 0.8224 KO 0.5369 BE 0.9671 LT 0.3679 BG 0.2359 LU 1.1900 CA 0.8009 LV 0.3249 CH 0.7546 MT 0.6425 CY 0.6004 MX 0.3125 CZ 0.4742 NL 0.8085 DE 0.7690 NO 1.0240 DK 0.7811 NZ 0.7807 EE 0.3875 PL 0.4281 EL 0.7123 PT 0.5055 ES 0.7362 RO 0.2582 FI 0.8186 SE 0.7873 FR 0.9004 SI 0.5612 HU 0.5139 SK 0.4566 IE 0.9571 TR 0.2903 IS 0.7493 UK 0.8054 IT 0.8452 US 1.0000

30
Table A.3 Some governance and institutions data
World Economic Forum based data World bank based data
country Global index Institutions pillar "law, order and
regulation"
Governance
principal component
principal
component
AT 5.32 5.45 5.98 4.152 1.69 AU 5.29 5.51 5.99 4.011 1.94 BE 5.27 4.85 5.44 0.645 0.84 BG 4.00 3.07 3.41 -7.995 -3.77 CA 5.37 5.01 5.53 1.716 1.90 CH 5.81 5.73 6.14 5.012 2.69 CY 4.36 4.52 4.86 -2.028 -0.86 CZ 4.74 3.84 4.43 -4.706 -1.37 DE 5.58 5.69 6.29 5.209 1.32 DK 5.70 5.98 6.37 6.581 2.54 EE 5.12 4.70 5.07 -0.545 -0.52 EL 4.33 4.36 4.73 -3.018 -1.41 ES 4.77 4.37 4.82 -1.586 0.15 FI 5.76 6.05 6.37 6.774 3.11 FR 5.31 4.91 5.61 1.459 0.11 HU 4.52 4.18 4.72 -3.052 -0.87 IE 5.21 5.15 5.54 1.790 1.59 IS 5.40 5.98 6.27 6.487 2.82 IT 4.46 3.66 4.33 -5.178 -1.35 JP 5.60 4.97 5.72 2.205 -0.09 KO 5.13 4.18 4.59 -4.234 -2.17 LT 4.53 3.86 4.24 -4.838 -1.59 LU 5.16 5.45 5.78 3.510 2.73 LV 4.57 4.07 4.41 -4.172 -1.84 MT 4.54 4.59 4.96 -1.061 0.02 MX 4.18 3.68 4.01 -6.352 -4.58 NL 5.56 5.60 6.05 4.571 2.40 NO 5.42 5.71 6.17 5.255 2.16 NZ 5.15 5.95 6.16 5.626 2.45 PL 4.30 3.62 3.97 -7.112 -1.99 PT 4.60 4.83 5.36 1.046 0.36 RO 4.03 3.40 3.60 -8.548 -4.87 SE 5.74 5.51 6.14 4.870 2.40 SI 4.64 4.27 4.89 -1.498 -0.73 SK 4.55 4.03 4.46 -3.710 -1.82 TR 4.14 4.05 4.37 -4.336 -5.76 UK 5.54 5.38 6.04 3.612 1.61 US 5.61 4.84 5.28 -0.561 0.77
Source: Kaufmann, D., Kraay, A. and M. Mastruzzi (2006) Porter, M., K. Schwab, A. Lopez-Claros and X. Sala-i-Martin (eds.) (2006). Computations by the author (see main text for details).

31
Table A.4 List of World Economic Forum Indicators (2006-2007)
Basic Indicators
0.01 Total GDP (hard data) 0.02 Total population (hard data) 0.03 GDP per capita )PPP) (hard data)
Section I: Institutions
1.01 Property rights 1.02 Diversion of public funds 1.03 Public trust of politicians 1.04 Judicial independence 1.05 Favoritism in decisions of government officials 1.06 Wastefulness of government spending 1.07 Burden of government regulation 1.08 Business costs of terrorism 1.09 Reliability of police services 1.10 Business costs of crime and violence 1.11 Organized crime 1.12 Ethical behavior of firms 1.13 Efficacy of corporate boards 1.14 Protection of minority shareholders' interests 1.15 Strength of auditing and accounting standards 1.16 Effectiveness of law-making bodies 1.17 Quality of information regarding changes in policies and regulation 1.18 Pervasiveness of illegal donations to political parties 1.19 Impact of legal contributions to political parties on public policy 1.20 Centralization of economic policymaking 1.21 Freedom of the press 1.22 Irregular payments in exports and imports 1.23 Irregular payments in public utilities 1.24 Irregular payments in tax collection 1.25 Irregular payments in public contracts 1.26 Irregular payments in judicial decisions 1.27 Bribes for influencing laws, policies, regulations, or decrees 1.28 Business costs of corruption 1.29 Impact of nepotism
Section II: Infrastructure
2.01 Overall infrastructure quality 2.02 Railroad infrastructure development
32
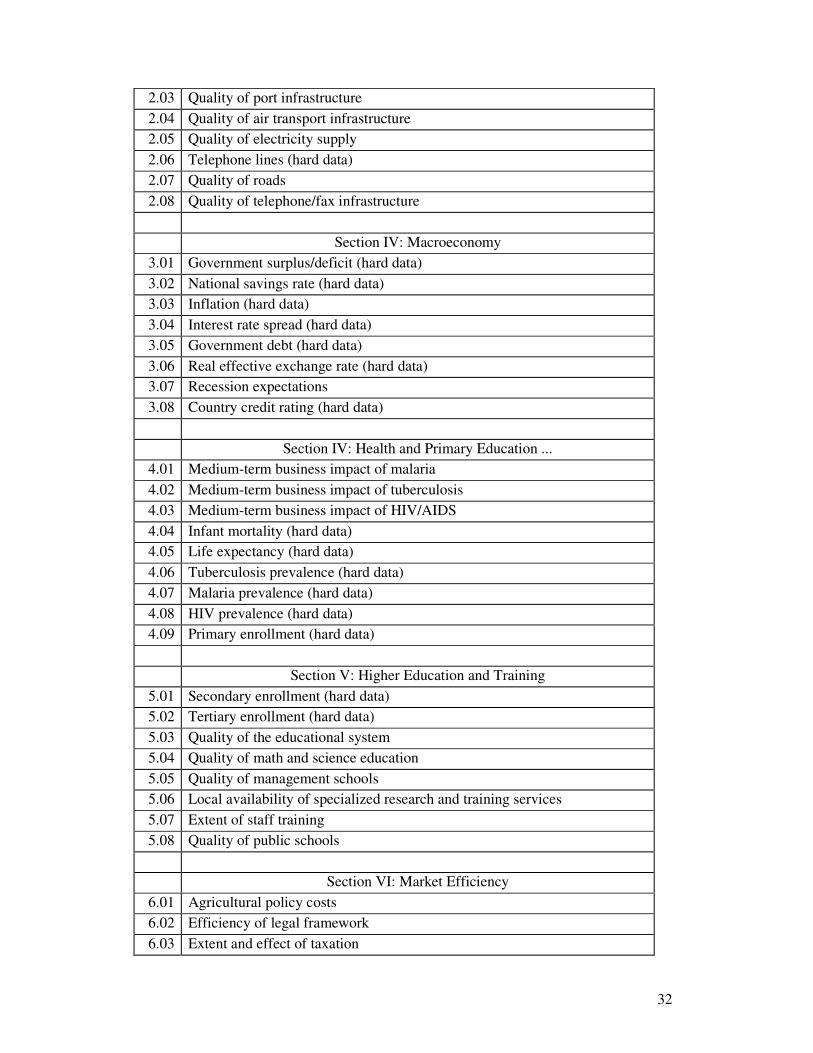
2.03 Quality of port infrastructure 2.04 Quality of air transport infrastructure 2.05 Quality of electricity supply 2.06 Telephone lines (hard data) 2.07 Quality of roads 2.08 Quality of telephone/fax infrastructure
Section IV: Macroeconomy
3.01 Government surplus/deficit (hard data) 3.02 National savings rate (hard data) 3.03 Inflation (hard data) 3.04 Interest rate spread (hard data) 3.05 Government debt (hard data) 3.06 Real effective exchange rate (hard data) 3.07 Recession expectations 3.08 Country credit rating (hard data)
Section IV: Health and Primary Education ...
4.01 Medium-term business impact of malaria 4.02 Medium-term business impact of tuberculosis 4.03 Medium-term business impact of HIV/AIDS 4.04 Infant mortality (hard data) 4.05 Life expectancy (hard data) 4.06 Tuberculosis prevalence (hard data) 4.07 Malaria prevalence (hard data) 4.08 HIV prevalence (hard data) 4.09 Primary enrollment (hard data)
Section V: Higher Education and Training
5.01 Secondary enrollment (hard data) 5.02 Tertiary enrollment (hard data) 5.03 Quality of the educational system 5.04 Quality of math and science education 5.05 Quality of management schools 5.06 Local availability of specialized research and training services 5.07 Extent of staff training 5.08 Quality of public schools
Section VI: Market Efficiency
6.01 Agricultural policy costs 6.02 Efficiency of legal framework 6.03 Extent and effect of taxation

33
6.04 Number of procedures required to start a business (hard data) 6.05 Time required to start a business (hard data) 6.06 Intensity of local competition 6.07 Effectiveness of antitrust policy 6.08 Imports (hard data) 6.09 Prevalence of trade barriers 6.10 Foreign ownership restrictions 6.11 Exports (hard data) 6.12 Hiring and firing practices 6.13 Flexibility of wage determination 6.14 Cooperation in labor-employer relations 6.15 Reliance on professional management 6.16 Pay and productivity 6.17 Brain drain 6.18 Private sector employment of women 6.19 Financial market sophistication 6.20 Ease of access to loans 6.21 Venture capital availability 6.22 Soundness of banks _ - 6.23 Local equity market access 6.24 Extent of bureaucratic red tape 6.25 Distortive effect of taxes and subsidies on competition 6.26 Presence of demanding regulatory standards 6.27 Extent of market dominance 6.28 Extent of regional sales 6.29 Breadth of international markets 6.30 Informal sector 6.31 Ease of hiring foreign labor 6.32 Recent access to credit
Section VII: Technological Readiness
7.01 Technological readiness 7.02 Firm-level technology absorption 7.03 Laws relating to ICT 7.04 FDI and technology transfer 7.05 Cellular telephones (hard data) 7.06 Internet users (hard data) 7.07 Personal computers (hard data) 7.08 Prevalence of foreign technology licensing 7.09 Government prioritization of ICT 7.10 Government success in ICT promotion 7.11 Quality of competition in the ISP sector

34
7.12 Extent of business Internet use 7.13 Internet access in schools 7.14 Impact of rules on FDI 7.15 Internet hosts (hard data)
Section VIII: Business Sophistication 8.01 Local supplier quantity 8.02 Local supplier quality 8.03 Production process sophistication 8.04 Extent of marketing 8.05 Control of international distribution 8.06 Willingness to delegate authority 8.07 Nature of competitive advantage 8.08 Value chain presence 8.09 Buyer sophistication 8.10 Local availability of process machinery 8.11 Degree of customer orientation 8.12 Extent of incentive compensation
Section IX: Innovation
9.01 Quality of scientific research institutions 9.02 Company spending on research and development 9.03 University/industry research collaboration 9.04 Government procurement of advanced technology products 9.05 Availability of scientists and engineers 9.06 Utility patents (hard data) 9.07 Intellectual property protection 9.08 Capacity for innovation
Section X: Environment 10.01 Stringency of environmental regulations 10.02 Clarity and stability of regulations 10.03 Protection of ecosystems by business 10.04 Impact of lack of clean air or clean water on business operations and
decisions 10.05 Impact of natural disasters on business operations and decisions