Modern Software Productivity Measurement: The Pragmatic Guide
31
By Dr. Bill Curtis, Senior Vice President and Chief Scientist, CAST
-
Upload
cast -
Category
Technology
-
view
821 -
download
0
Transcript of Modern Software Productivity Measurement: The Pragmatic Guide
By Dr. Bill Curtis, Senior Vice President and Chief Scientist, CAST
Modern Software Productivity Measurement: The Pragmatic Guide
ContentsExecutive Summary .........................................................................................................................................11. Software Productivity Defined .....................................................................................................................2
1.1 Release Productivity ................................................................................................................................21.2 Quality-adjusted Productivity .................................................................................................................2
2. Objectives for Software Productivity Analysis ..............................................................................................32.1 Productivity Improvement ......................................................................................................................42.2 Estimation ..............................................................................................................................................42.3 Benchmarking .........................................................................................................................................42.4 Vendor Management ...............................................................................................................................4
3. Component Measures for Productivity Analysis ..........................................................................................53.1 Size Measures ..........................................................................................................................................63.2 Effort Measures .......................................................................................................................................83.3 Quality Measures ..................................................................................................................................103.4 Application Demographics ....................................................................................................................11
4. Quality-adjusted Productivity ....................................................................................................................124.1 Carry-forward Defects...........................................................................................................................124.2 Quality Adjustment Factors ..................................................................................................................144.3 Quality-adjusted Productivity Formula Example ...................................................................................15
5. Best Practices to Conduct a Productivity Analysis Program .......................................................................175.1 Establish executive leadership ................................................................................................................175.2 Form measurement group .....................................................................................................................185.3 Automate data collection .......................................................................................................................195.4 Seek measure consensus ........................................................................................................................195.5 Check data validity ...............................................................................................................................195.6 Enforce data management .....................................................................................................................195.7 Inspect data distributions ......................................................................................................................205.8 Segment applications ............................................................................................................................205.9 Iterate analyses ......................................................................................................................................215.10 Pre-brief results ...................................................................................................................................215.11 Structure final results...........................................................................................................................21
6. Productivity Measurement Objectives .......................................................................................................226.1 Challenges in Developing Productivity Baselines ...................................................................................226.2 Productivity Improvement ....................................................................................................................246.3 Estimation ............................................................................................................................................256.4 Benchmarking .......................................................................................................................................266.5 Vendor Management .............................................................................................................................26
7. Summary ...................................................................................................................................................278. References .................................................................................................................................................28About the Author ..........................................................................................................................................29
Modern Software Productivity Measurement: The Pragmatic Guide
There are four primary objectives for analyzing the productivity of software development and maintenance: improvement, estimation, benchmarking, and vendor management. For each of these objectives, the common thread is that they all require measurement. This guide describes several approaches for measuring software productivity and provides recommendations for incorporating them into software productivity analysis and impro-vement initiatives.
Classic productivity measures compare the amount of product created to the resources required to create it. However, software productivity must be measured as more than just output divided by input, since productivity typically decreases over multiple releases as the quality of software architectures and code degrades with continued enhancements, modifications, and the injection of new defects. To account for these factors, we will describe a method for adjusting productivity scores with quality results to gain greater visibility into the impact that quality of the current release has on the productivity of future releases.
Effective productivity analysis requires at least four categories of measures: the two pri-mary measures of size and effort, and two adjustment factors involving quality and demo-graphics that reveal the impact of quality and demographic differences on productivity rates. For instance, productivity baselines can be constructed for different demographic categories that provide profound insight into the full range of development and main-tenance activities in the organization. We also discuss four statistical pitfalls to avoid in developing useful productivity baselines.
After identifying the various measures and their associated methods, we present 11 best practices that can be integrated into a productivity measurement and analysis process—beginning with the need to establish executive leadership, proceeding through the de-finition, collection, and analysis of measures, and culminating in presenting the results and benchmarks back to application project owners and executive management. This process achieves the most benefit when it is integrated into a comprehensive productivity improvement program.
Four recommendations for implementing measurement-driven improvement programs are also presented. We conclude by discussing the best methods to achieve each of the four primary objectives in productivity measurement and analysis.
Executive Summary
1
2
Modern Software Productivity Measurement: The Pragmatic Guide
1.1 Release Productivity
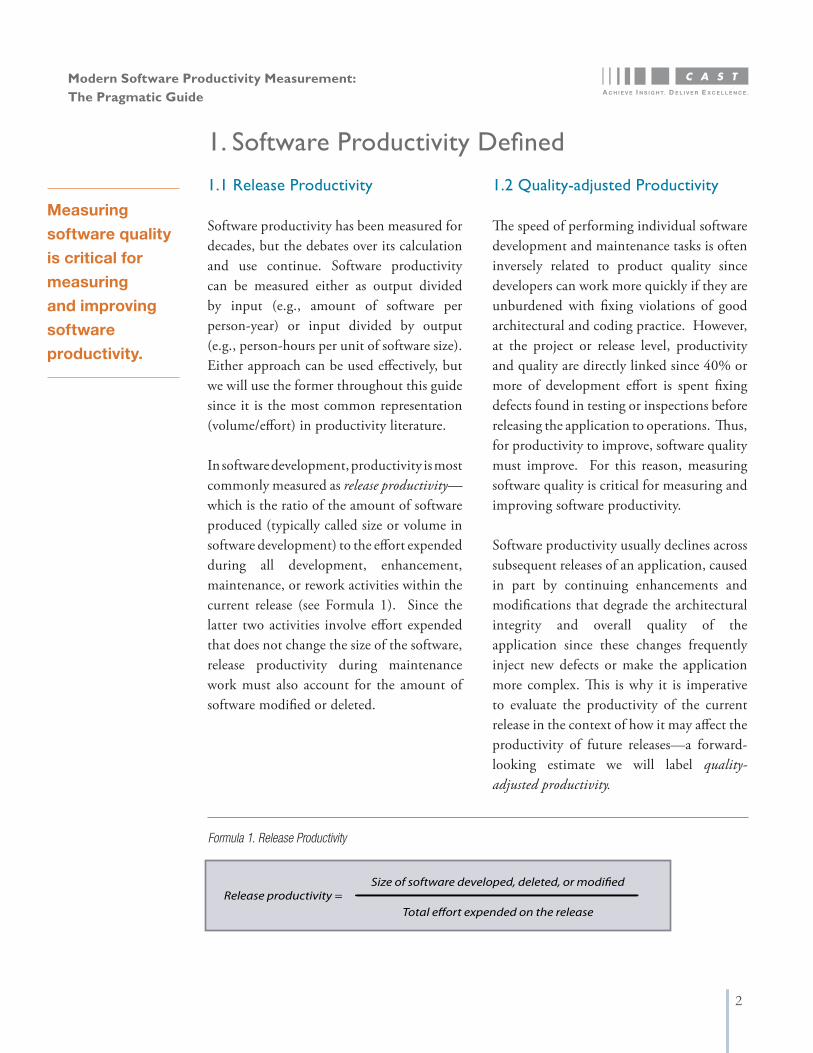
Software productivity has been measured for decades, but the debates over its calculation and use continue. Software productivity can be measured either as output divided by input (e.g., amount of software per person-year) or input divided by output (e.g., person-hours per unit of software size). Either approach can be used effectively, but we will use the former throughout this guide since it is the most common representation (volume/effort) in productivity literature.
In software development, productivity is most commonly measured as release productivity—which is the ratio of the amount of software produced (typically called size or volume in software development) to the effort expended during all development, enhancement, maintenance, or rework activities within the current release (see Formula 1). Since the latter two activities involve effort expended that does not change the size of the software, release productivity during maintenance work must also account for the amount of software modified or deleted.
1.2 Quality-adjusted Productivity
The speed of performing individual software development and maintenance tasks is often inversely related to product quality since developers can work more quickly if they are unburdened with fixing violations of good architectural and coding practice. However, at the project or release level, productivity and quality are directly linked since 40% or more of development effort is spent fixing defects found in testing or inspections before releasing the application to operations. Thus, for productivity to improve, software quality must improve. For this reason, measuring software quality is critical for measuring and improving software productivity.
Software productivity usually declines across subsequent releases of an application, caused in part by continuing enhancements and modifications that degrade the architectural integrity and overall quality of the application since these changes frequently inject new defects or make the application more complex. This is why it is imperative to evaluate the productivity of the current release in the context of how it may affect the productivity of future releases—a forward-looking estimate we will label quality-adjusted productivity.
Measuring
software quality
is critical for
measuring
and improving
software
productivity.
1. Software Productivity Defined
Release productivity =
Size of software developed, deleted, or modi�ed
Total e�ort expended on the release
Formula 1. Release Productivity
3
Modern Software Productivity Measurement: The Pragmatic Guide
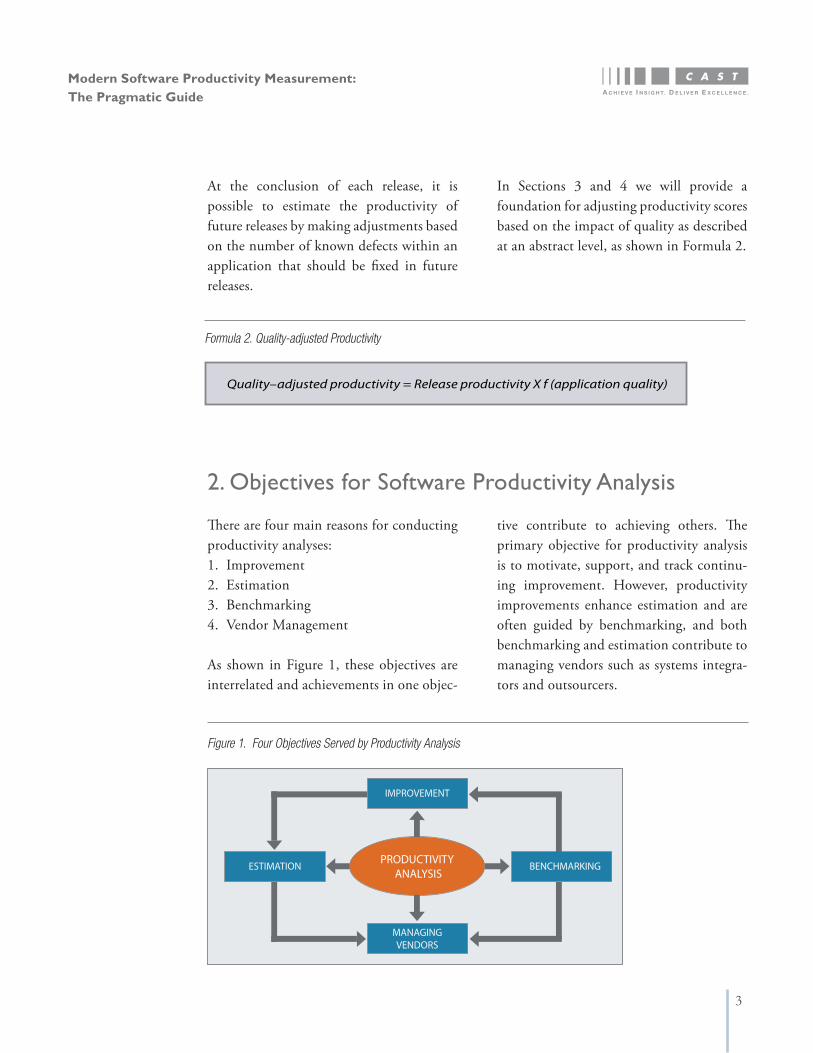
At the conclusion of each release, it is possible to estimate the productivity of future releases by making adjustments based on the number of known defects within an application that should be fixed in future releases.
There are four main reasons for conducting productivity analyses:1. Improvement2. Estimation3. Benchmarking4. Vendor Management
As shown in Figure 1, these objectives are interrelated and achievements in one objec-
In Sections 3 and 4 we will provide a foundation for adjusting productivity scores based on the impact of quality as described at an abstract level, as shown in Formula 2.
tive contribute to achieving others. The primary objective for productivity analysis is to motivate, support, and track continu-ing improvement. However, productivity improvements enhance estimation and are often guided by benchmarking, and both benchmarking and estimation contribute to managing vendors such as systems integra-tors and outsourcers.
Formula 2. Quality-adjusted Productivity
Quality–adjusted productivity = Release productivity X f (application quality)
2. Objectives for Software Productivity Analysis
Figure 1. Four Objectives Served by Productivity Analysis
ESTIMATION
IMPROVEMENT
BENCHMARKING
MANAGINGVENDORS
PRODUCTIVITY ANALYSIS
4
Modern Software Productivity Measurement: The Pragmatic Guide
2.3 Benchmarking
Benchmarks are established to understand how a project or organization compares to similar entities to support decisions about competitive positioning, investment levels, or improvement objectives. Unless data from external organizations are truly comparable, the most valid use of benchmarking is among internal projects to identify factors controlling productivity and assess progress against improvement targets.
2.4 Vendor Management
Productivity data can be used in the vendor selection process if the data are considered reliable. In contracts, productivity targets are often included to either ensure the vendor sustains the expected value from outsourcing or motivate the vendor to make continual improvements that increase the value of the relationship over the course of the contract.
2.1 Productivity Improvement
As W. Edwards Deming stated, productivity data provide “profound knowledge1” of an organization’s software development capability. When analyzed and used properly, productivity data can provide a roadmap for improving both the productivity and quality of application development and maintenance by understanding quantitatively what factors cause variation in performance, and then controlling or improving them. The primary purpose of comparing productivity results among projects is to identify the factors that have the greatest impact, both positively and negatively, on productivity and then determine how to address them. Using productivity data to reward or punish development teams must be done carefully since it can have unintended results and can lead to gaming of the measures.
2.2 Estimation
Most cost estimating models such as COCOMO2 begin with a productivity relationship between size and effort, such as Effort = α Sizeβ. This relationship is then adjusted using factors that affect productivity such as team skill, project complexity, process maturity, etc., which is needed to improve project estimation.
Productivity
data can provide
a roadmap for
improving both
the productivity
and quality of
application
development and
maintenance.
5
Modern Software Productivity Measurement: The Pragmatic Guide
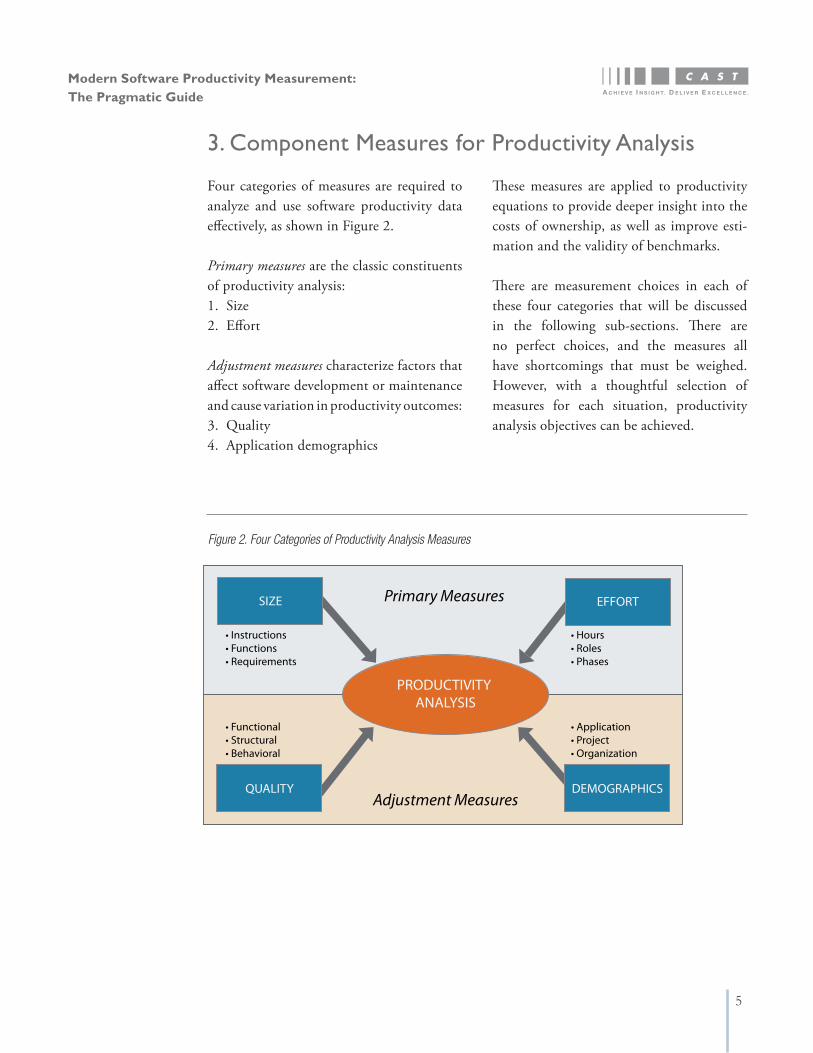
Four categories of measures are required to analyze and use software productivity data effectively, as shown in Figure 2.
Primary measures are the classic constituents of productivity analysis:1. Size2. Effort
Adjustment measures characterize factors that affect software development or maintenance and cause variation in productivity outcomes:3. Quality4. Application demographics
These measures are applied to productivity equations to provide deeper insight into the costs of ownership, as well as improve esti-mation and the validity of benchmarks.
There are measurement choices in each of these four categories that will be discussed in the following sub-sections. There are no perfect choices, and the measures all have shortcomings that must be weighed. However, with a thoughtful selection of measures for each situation, productivity analysis objectives can be achieved.
Figure 2. Four Categories of Productivity Analysis Measures
3. Component Measures for Productivity Analysis
Figure 2. Four Categories of Productivity Analysis Measures
PRODUCTIVITY ANALYSIS
Primary Measures
Adjustment Measures
• Instructions• Functions• Requirements
• Functional• Structural• Behavioral
• Hours• Roles• Phases
• Application• Project• Organization
SIZE EFFORT
QUALITY DEMOGRAPHICS

6
Modern Software Productivity Measurement: The Pragmatic Guide
3.1 Size Measures
Although there are many ways to measure software size, the three most common sources for size measurement over the past four decades have been:1. User-based requirements measures (Use- case or Story Points)2. Computer instructions (Lines of code)3. Functions (Function Points)
3.1.1 User-based requirements measures: Use-case Points or Story Points are the most commonly used size measures derived from user-based expressions of application require-ments, but are not adequate for productivity analysis at their current state of development. Use-case Points have not been standardized and are not in wide use. Story Points have become popular in the agile community for estimating the number of stories that can be undertaken with a fixed level of effort during a short sprint or time-boxed release. However, Story Points are an inconsistent measure because of the subjective element in their counting. This inconsistency occurs even across development teams in the same organization. Regardless of their appeal, more standardization is necessary before requirements-based measures can provide a good size measure for productivity analysis.
3.1.2 Computer instructions: Counting the number of computer instructions, or lines of code, has been the most frequently used size measure since the beginning of software de-
velopment. Unfortunately, there are many variations for counting lines of code and no agreement on a standard counting method. Capers Jones3 demonstrated that line of code counts can vary by a factor of 10 de-pending on how a line of code is defined—physical lines, logical lines, delimiters, blank lines, data declarations, etc. More troubling, the best programs often contain fewer lines of code and take slightly longer to build to ensure their quality is higher. Consequently, although the effort required for developing small, tight, well-constructed programs is of-ten greater, their cost of ownership is usually lower. When productivity is averaged across measures taken from a lifetime of releases for small, well-constructed programs it is typi-cally higher than the average productivity of larger, poorly constructed programs.
3.1.3. Functions: Developed by Allen Albrecht4 at IBM in the late 1970s, Function Points have become a popular alternative to lines of code measures because they relate to the functionality that a business application provides to its users. Albrecht first measured the inputs, outputs, and inquires to an application along with the internal and external files with which they transacted. He then entered these base measures into an algorithm that combined them into a measure of business functionality.
7
Modern Software Productivity Measurement: The Pragmatic Guide
As the popularity of Function Points grew, other functional measures were developed such as NESMA, MARK II, and COSMIC. However, a large ecosystem has developed around Albrecht’s original formulation with a professional association, the International Function Point User Group (IFPUG), which publishes formal counting guidelines5 and licenses professional counters. As a result, Albrecht’s original definition of Function Points is the most frequently used version globally, and it will be used in discussing productivity through the remainder of this guide. Function Point Analysis6 provides an excellent and thorough introduction to the
definition and use of Function Points.
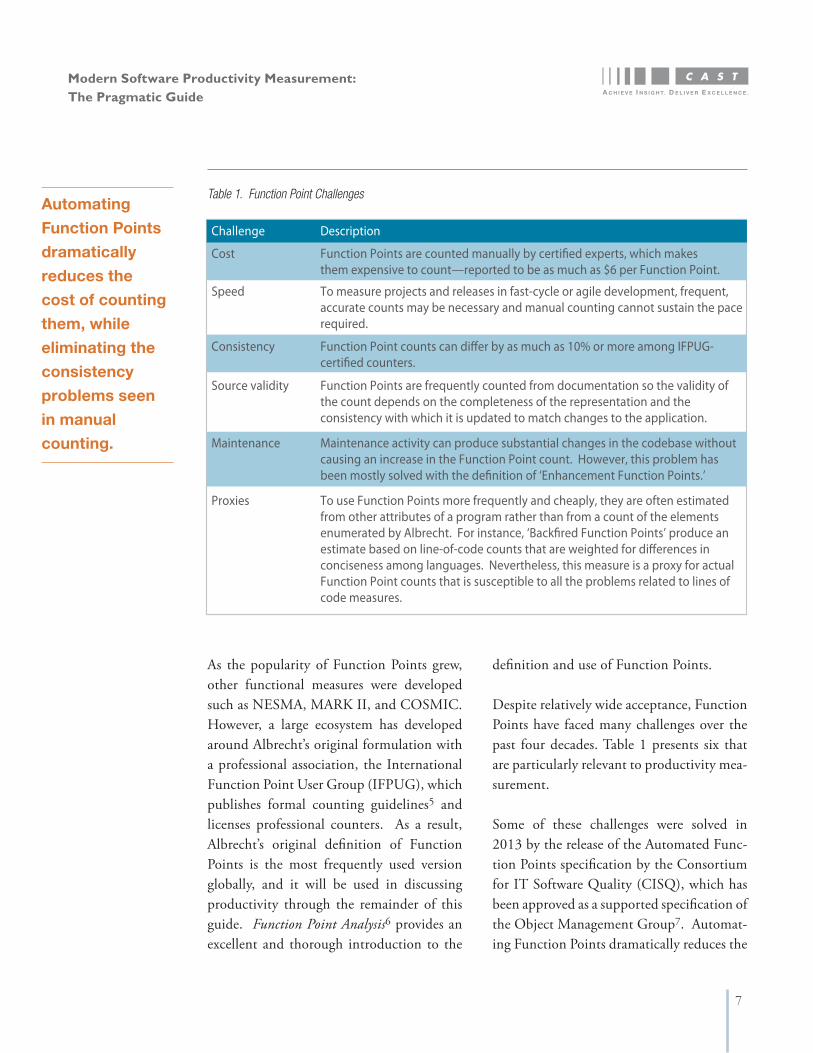
Despite relatively wide acceptance, Function Points have faced many challenges over the past four decades. Table 1 presents six that are particularly relevant to productivity mea-surement.
Some of these challenges were solved in 2013 by the release of the Automated Func-tion Points specification by the Consortium for IT Software Quality (CISQ), which has been approved as a supported specification of the Object Management Group7. Automat-ing Function Points dramatically reduces the
Table 1. Function Point Challenges
Challenge Description TotalCost
Speed
Consistency
Source validity
Maintenance
Proxies
Function Points are counted manually by certi�ed experts, which makes them expensive to count—reported to be as much as $6 per Function Point.
To measure projects and releases in fast-cycle or agile development, frequent, accurate counts may be necessary and manual counting cannot sustain the pace required.
Function Point counts can di�er by as much as 10% or more among IFPUG-certi�ed counters.
Function Points are frequently counted from documentation so the validity of the count depends on the completeness of the representation and the consistency with which it is updated to match changes to the application.
Maintenance activity can produce substantial changes in the codebase without causing an increase in the Function Point count. However, this problem has been mostly solved with the de�nition of ‘Enhancement Function Points.’
To use Function Points more frequently and cheaply, they are often estimated from other attributes of a program rather than from a count of the elements enumerated by Albrecht. For instance, ‘Back�red Function Points’ produce an estimate based on line-of-code counts that are weighted for di�erences in conciseness among languages. Nevertheless, this measure is a proxy for actual Function Point counts that is susceptible to all the problems related to lines of code measures.
Automating
Function Points
dramatically
reduces the
cost of counting
them, while
eliminating the
consistency
problems seen
in manual
counting.

8
Modern Software Productivity Measurement: The Pragmatic Guide
cost of counting them, while eliminating the consistency problems seen in manual count-ing. Although this measure was initially de-fined for counting from source code, it can be computed from any digital representation of a program that has a formal syntax and semantics and represents the data files and transaction paths in the application.
Maintenance activities such as correcting defects or deleting dead code often consume substantial staff time and resources without increasing the number of Function Points. As a result, Enhancement Function Points were developed to count the number of functional elements in software components that have been enhanced, modified, or deleted during maintenance.
The analysis of Enhancement Function Points provides a size measure that avoids penalizing release productivity on applica-tions where a traditional Function Point count may not have changed as a result of maintenance work. (An addendum will be developed by CISQ for OMG’s Automated Function Point specification that defines counting rules for Automated Enhancement Function Points.)
Function Point measures can be integrated into standard use as early as a formal representation of the data files and transaction paths are available in the development cycle. At this stage, the validity of the Function Point count will depend on the completeness, accuracy, and currency of the documentation. Automating size measures enables application managers to measure size frequently during development or maintenance in order to compare actual results with original estimates and determine if project schedules and budgets are on target.
3.2 Effort Measures
Although most of the debate in productivity measurement has focused on size measures, the greatest source of inaccuracy usually comes from effort measures. There are three main sources of inaccuracy:1. After-the-fact estimates2. Intentional underreporting3. Lack of normalization
3.2.1 After-the-fact estimates: Too many IT organizations fail to capture accurate effort data. Developers loathe to record their time and if required frequently do so long after the work was performed. Consequently, productivity is calculated with rough estimates of the effort spent on individual projects, and such estimates are subject to bias, especially when developers know the data will be used to assess productivity. Further, individuals who are split across several projects rarely know how much time
•Recommendation: Use Automated Function Points as a measure of size for new development work.
•Recommendation: Use Automated Enhancement Function Points as a measure of size for activities that enhance, modify, or delete code.
9
Modern Software Productivity Measurement: The Pragmatic Guide
was devoted to each application. Faced with poor effort reporting, many organizations assume all developers worked a 40-hour week and multiply that figure by the number of staff members assigned to a project.
3.2.2 Intentional underreporting: While underreporting can sometimes occur in-nocently as a consequence of after-the-fact estimating, more frequently it occurs when contractors intentionally ‘manage’ cost or productivity data. To meet cost or productiv-ity targets contractors knowingly report only a fixed number of hours per week regardless of the number of hours worked. Underre-porting is less frequent on regulated con-tracts where accurate, sometimes daily, time recording is legally enforced.
One of the greatest threats to the accuracy of effort data is the fear that it will be used in individual performance appraisals or for comparison of individuals in relation to personnel actions. Using productivity data for individual performance management
is an absolute worst practice and should be avoided under all circumstances. Managers have other sources of information available for appraising performance and should not risk the gaming of their productivity data by using it as a substitute for developing a more complete understanding of individual contributions. Even when individual effort data can be gathered or validated automati-cally, they should still not be used for per-formance appraisals since developers can find ingenious ways to distort the results.
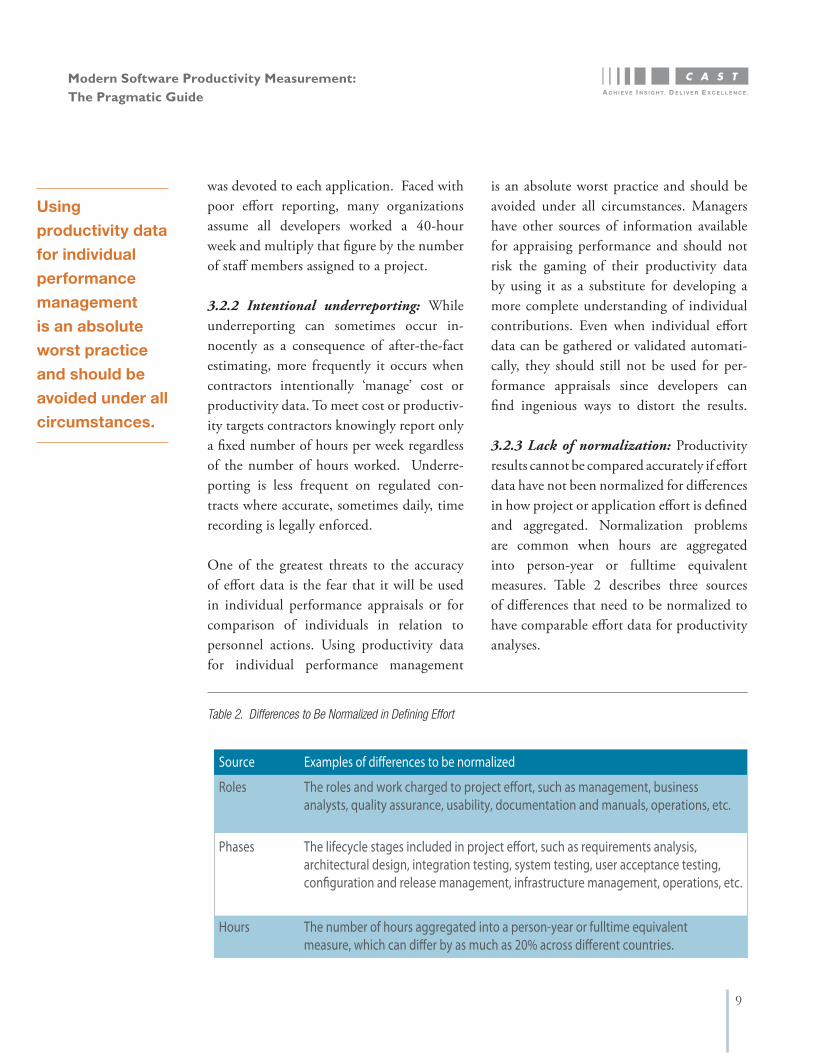
3.2.3 Lack of normalization: Productivity results cannot be compared accurately if effort data have not been normalized for differences in how project or application effort is defined and aggregated. Normalization problems are common when hours are aggregated into person-year or fulltime equivalent measures. Table 2 describes three sources of differences that need to be normalized to have comparable effort data for productivity analyses.
Using
productivity data
for individual
performance
management
is an absolute
worst practice
and should be
avoided under all
circumstances.
Table 2. Differences to Be Normalized in Defining Effort
Source Examples of di�erences to be normalized TotalRoles
Phases
Hours
The roles and work charged to project e�ort, such as management, business analysts, quality assurance, usability, documentation and manuals, operations, etc.
The lifecycle stages included in project e�ort, such as requirements analysis, architectural design, integration testing, system testing, user acceptance testing, con�guration and release management, infrastructure management, operations, etc.
The number of hours aggregated into a person-year or fulltime equivalent measure, which can di�er by as much as 20% across di�erent countries.
10
Modern Software Productivity Measurement: The Pragmatic Guide
Accurate productivity comparisons or benchmarks can only be conducted with datasets that have been normalized for these and related factors. Repositories with data that have been collected through questionnaire submissions from different companies are difficult, and sometimes impossible to normalize for accurate benchmarking. Productivity benchmarks with public and commercial repositories of software data are only as valid as the extent to which these repositories have reliable and sufficient information that allows for normalization to other datasets.
•Recommendation: Use an effort
measure based on person-hours that has been normalized for differences in project roles, lifecycle stages, fulltime equivalent person-years, and other dif-ferences in accounting for project time.
•Recommendation: Have developers report their actual hours worked at least weekly, if not more often, in an auto-mated system.
3.3 Quality Measures
Software quality can be divided into:1. Functional quality (it does what the
customer wants) 2. Structural quality (the engineering is structurally sound)
Traditional testing primarily finds functional defects since test cases are most often based on the functional requirements. Structural quality, which is often referred to as non-functional quality, has become increasingly
important as the methods for detecting and measuring it have improved during the 2000s, and its impact on operational problems such as outages and security breaches has become more visible.
3.3.1 Functional quality measures: Functional quality is most frequently measured by the density of functional defects remaining in the application at release divided by the size of the application. The majority of defects found during testing are functional rather than structural since test cases are derived from user requirements that are usually stated as functions to be implemented. Since functional defects are primarily found through testing against the functional requirements, the value of this measure depends on the completeness with which functional requirements are covered by test cases, as well as the discipline with which testing is performed.
The impact of functional quality on the cur-rent release is usually already factored into release productivity since the rework effort to fix functional defects injected and found during the current release is included in the current release effort. However, functional defects that are not fixed prior to release or that are discovered after the release represent carry-forward defects whose remediation will require effort charged to future releases, which will be discussed in more detail in Section 4.
Productivity
benchmarks with
public and com-
mercial reposito-
ries of software
data are only
as valid as the
extent to which
these reposito-
ries have reliable
and sufficient
information that
allows for norma-
lization to other
datasets.
11
Modern Software Productivity Measurement: The Pragmatic Guide
3.3.2 Structural quality measures: Non-functional or structural quality has traditionally been evaluated by detecting violations of good architectural and coding practice either through formal peer reviews and inspections, or more recently through static and dynamic analysis. These violations can be categorized to produce measures for many of the software quality characteristics listed in ISO/IEC 25010 such as reliability, performance efficiency, security, and maintainability. Structural quality analysis must be conducted at the system-level on the full application to detect architectural flaws.
Structural quality affects productivity in two ways. First, like carry-forward functional defects, the effort and associated cost of fixing these defects is wasteful rework that could have been used instead to produce new or modified functions. Second, poor architectural or coding practices can make software more complex, harder to understand, and more difficult to modify—a major source of productivity degradation across releases. The impact of structural quality on the productivity of future releases can be estimated from measures taken in the current release and used as an adjustment to account for productivity decline.
• Recommendation: Develop measures of functional quality based on the results of disciplined testing activities.
• Recommendation: Develop measures of structural quality based on system-level static analysis, peer reviews, and other methods of detecting violations of good architectural and coding practice.
3.4 Application Demographics
Application demographics incorporate characteristics of application projects and work that have significant effect on productivity. For instance, the productivity of implementing complex algorithms in real-time embedded software is much lower than the productivity of modifying tables in a simple business application. If these applications are included in the same productivity analysis, the variation in results will be large, and a more talented team assigned to the algorithmic embedded software will be judged to be not as effective as a less skilled team modifying tables. Consequently, data regarding important differences in projects or applications is critical for making useful comparisons.
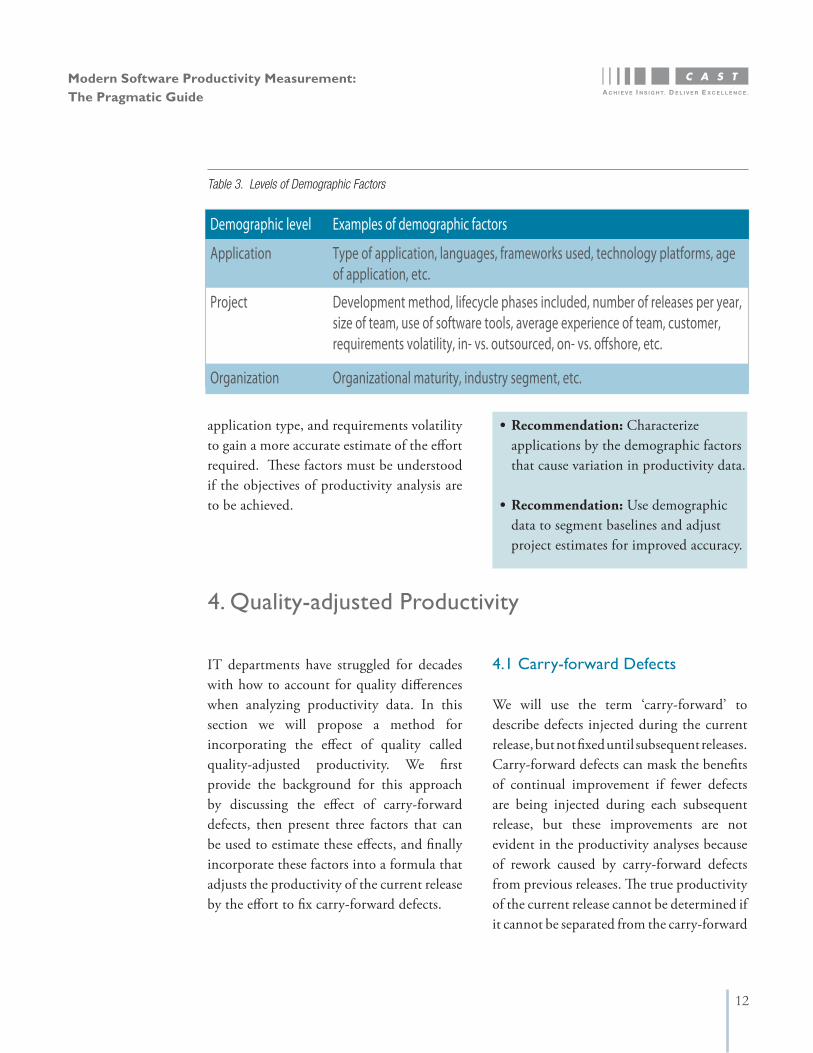
Application demographic information should be recorded by a project or applica-tion manager at the beginning of each re-lease cycle and validated for accuracy at time of release. As presented in Table 3, at least three levels of demographic information are important for analyzing productivity data.
Application demographics are also important for improving estimation accuracy, and most software cost estimating methods incorporate demographics as critical information for adjusting estimates. These methods usually begin with a basic relationship between effort and size, in essence a productivity relationship describing the effort required to build applications of different sizes. The relationships are then adjusted by demographic factors such as team capability,
12
Modern Software Productivity Measurement: The Pragmatic Guide
application type, and requirements volatility to gain a more accurate estimate of the effort required. These factors must be understood if the objectives of productivity analysis are to be achieved.
IT departments have struggled for decades with how to account for quality differences when analyzing productivity data. In this section we will propose a method for incorporating the effect of quality called quality-adjusted productivity. We first provide the background for this approach by discussing the effect of carry-forward defects, then present three factors that can be used to estimate these effects, and finally incorporate these factors into a formula that adjusts the productivity of the current release by the effort to fix carry-forward defects.
4.1 Carry-forward Defects
We will use the term ‘carry-forward’ to describe defects injected during the current release, but not fixed until subsequent releases. Carry-forward defects can mask the benefits of continual improvement if fewer defects are being injected during each subsequent release, but these improvements are not evident in the productivity analyses because of rework caused by carry-forward defects from previous releases. The true productivity of the current release cannot be determined if it cannot be separated from the carry-forward
Table 3. Levels of Demographic Factors
Demographic level Examples of demographic factors TotalApplication
Project
Organization
Type of application, languages, frameworks used, technology platforms, age of application, etc.
Development method, lifecycle phases included, number of releases per year, size of team, use of software tools, average experience of team, customer, requirements volatility, in- vs. outsourced, on- vs. o�shore, etc.
Organizational maturity, industry segment, etc.
4. Quality-adjusted Productivity
•Recommendation: Characterize applications by the demographic factors that cause variation in productivity data.
•Recommendation: Use demographic data to segment baselines and adjust project estimates for improved accuracy.
13
Modern Software Productivity Measurement: The Pragmatic Guide
rework caused by less mature practices in earlier releases.
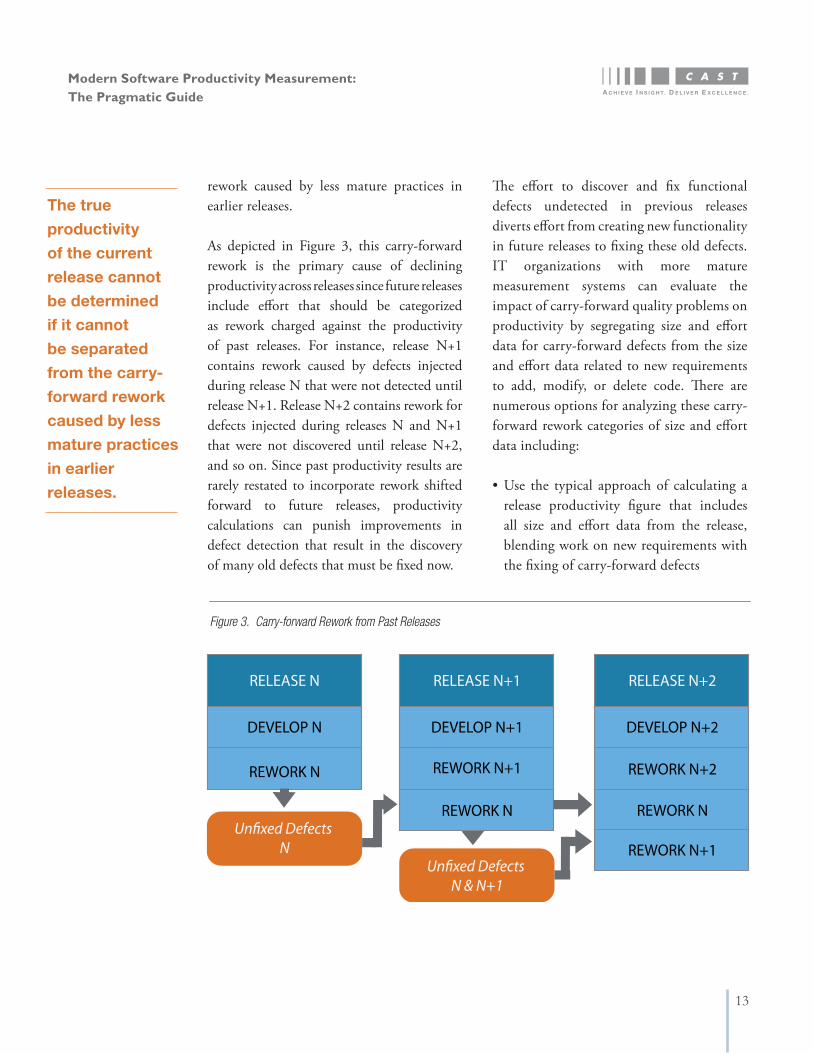
As depicted in Figure 3, this carry-forward rework is the primary cause of declining productivity across releases since future releases include effort that should be categorized as rework charged against the productivity of past releases. For instance, release N+1 contains rework caused by defects injected during release N that were not detected until release N+1. Release N+2 contains rework for defects injected during releases N and N+1 that were not discovered until release N+2, and so on. Since past productivity results are rarely restated to incorporate rework shifted forward to future releases, productivity calculations can punish improvements in defect detection that result in the discovery of many old defects that must be fixed now.
The effort to discover and fix functional defects undetected in previous releases diverts effort from creating new functionality in future releases to fixing these old defects. IT organizations with more mature measurement systems can evaluate the impact of carry-forward quality problems on productivity by segregating size and effort data for carry-forward defects from the size and effort data related to new requirements to add, modify, or delete code. There are numerous options for analyzing these carry-forward rework categories of size and effort data including:
•Use the typical approach of calculating a release productivity figure that includes all size and effort data from the release, blending work on new requirements with the fixing of carry-forward defects
Figure 3. Carry-forward Rework from Past Releases
The true
productivity
of the current
release cannot
be determined
if it cannot
be separated
from the carry-
forward rework
caused by less
mature practices
in earlier
releases.
RELEASE N
DEVELOP N
REWORK N
Un�xed Defects N
RELEASE N+1
DEVELOP N+1
REWORK N+1
REWORK N
Un�xed Defects N & N+1
RELEASE N+2
DEVELOP N+2
REWORK N+2
REWORK N
REWORK N+1
Demographic level Examples of demographic factors TotalApplication
Project
Organization
Type of application, languages, frameworks used, technology platforms, age of application, etc.
Development method, lifecycle phases included, number of releases per year, size of team, use of software tools, average experience of team, customer, requirements volatility, in- vs. outsourced, on- vs. o�shore, etc.
Organizational maturity, industry segment, etc.
14
Modern Software Productivity Measurement: The Pragmatic Guide
•Add the rework effort for each carry-for-ward defect back to the release in which it was injected and then restate the produc-tivity of previous releases
•Calculate two productivity values—the release productivity of the current release that does not include carry-forward re-work, and a carry-forward productivity value that includes only the size and effort data related to carry-forward defects
Carry-forward size and effort data are difficult to collect without development practices that are sufficiently mature to distinguish carry-forward effort and code from effort and code data related to new enhancements or modifications. This is another reason that productivity analysis data should not be used in personnel-related matters, since the data are often contaminated by carry-forward rework that may not have been caused by current developers or teams. In any event, the density of functional defects that are not detected in the release when they were injected degrades future productivity and highlights the importance of improving early phase defect detection.
4.2 Quality Adjustment Factors
There is no generally accepted standard for adjusting productivity figures to account for the effect of functional or structural quality. While the effects of quality on productivity have been known for decades, the idea of adjusting productivity equations using quality parameters has only recently gathered
momentum. Three adjustment factors were suggested in previous discussions of functional and structural quality that can be included in parameterized formulas for quality adjusted productivity: 1. Carry-forward should-fix functional defects2. Carry-forward should-fix structural
defects3. Maintainability deficits
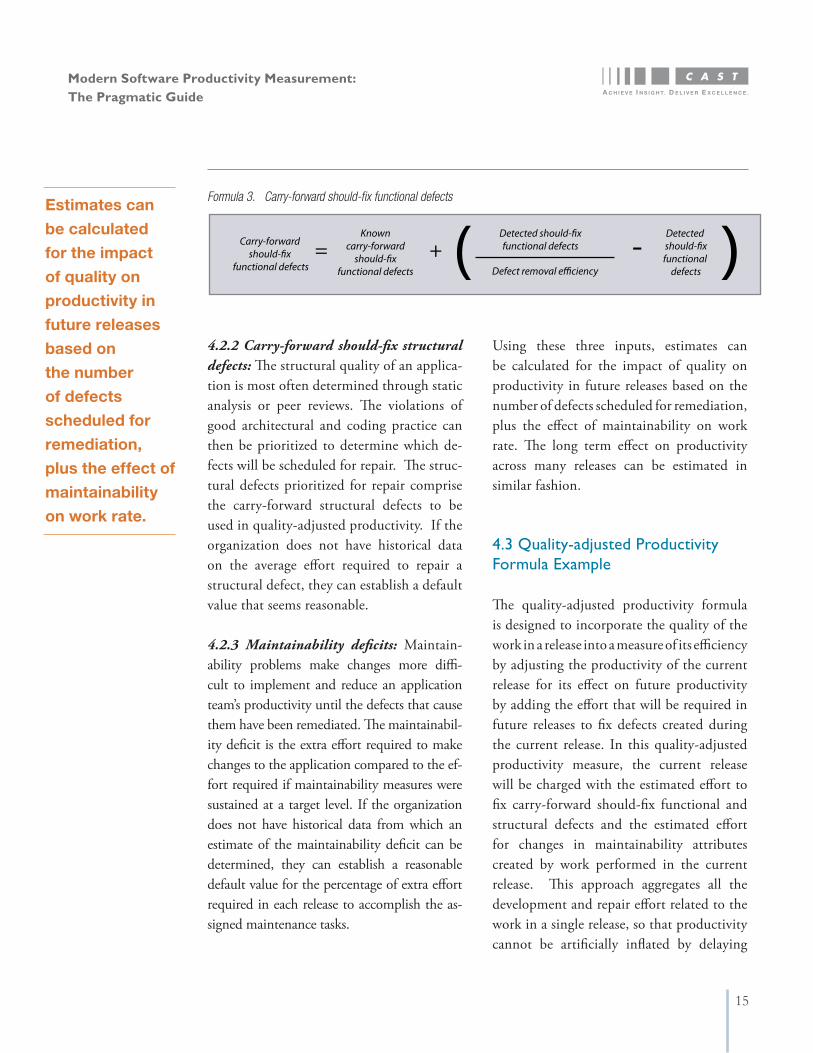
4.2.1 Carry-forward should-fix functional defects: There are three inputs for estimat-ing the number of carry-forward should-fix functional defects—the number of known functional defects from failed test cases or peer review reports that should be fixed, the number of known should-fix functional de-fects that have not been fixed in the current release, and the defect removal efficiency. The defect removal efficiency is the percent-age of defects injected during a release that are detected and removed prior to releasing the software. As shown in Formula 3, with these inputs the number of defects being car-ried forward into future releases that should be fixed can be estimated.
The functional defects prioritized for repair comprise the carry-forward functional defects to be used in quality-adjusted productivity. This calculation is similar to the method developed by Curtis, Sappidi, and Szynkarski8 for estimating the principal of technical debt without dollarizing the result. If the organization does not have historical data on the average effort required to repair a functional defect, they can establish a default value that seems reasonable.
15
Modern Software Productivity Measurement: The Pragmatic Guide
4.2.2 Carry-forward should-fix structural defects: The structural quality of an applica-tion is most often determined through static analysis or peer reviews. The violations of good architectural and coding practice can then be prioritized to determine which de-fects will be scheduled for repair. The struc-tural defects prioritized for repair comprise the carry-forward structural defects to be used in quality-adjusted productivity. If the organization does not have historical data on the average effort required to repair a structural defect, they can establish a default value that seems reasonable.
4.2.3 Maintainability deficits: Maintain-ability problems make changes more diffi-cult to implement and reduce an application team’s productivity until the defects that cause them have been remediated. The maintainabil-ity deficit is the extra effort required to make changes to the application compared to the ef-fort required if maintainability measures were sustained at a target level. If the organization does not have historical data from which an estimate of the maintainability deficit can be determined, they can establish a reasonable default value for the percentage of extra effort required in each release to accomplish the as-signed maintenance tasks.
Using these three inputs, estimates can be calculated for the impact of quality on productivity in future releases based on the number of defects scheduled for remediation, plus the effect of maintainability on work rate. The long term effect on productivity across many releases can be estimated in similar fashion.
4.3 Quality-adjusted Productivity Formula Example
The quality-adjusted productivity formula is designed to incorporate the quality of the work in a release into a measure of its efficiency by adjusting the productivity of the current release for its effect on future productivity by adding the effort that will be required in future releases to fix defects created during the current release. In this quality-adjusted productivity measure, the current release will be charged with the estimated effort to fix carry-forward should-fix functional and structural defects and the estimated effort for changes in maintainability attributes created by work performed in the current release. This approach aggregates all the development and repair effort related to the work in a single release, so that productivity cannot be artificially inflated by delaying
Formula 3. Carry-forward should-fix functional defects
Carry-forward should-�x
functional defects
Knowncarry-forward
should-�xfunctional defects
= + ( Detected should-�xfunctional defects
Defect removal e�ciency
-Detected should-�xfunctional
defects )Estimates can
be calculated
for the impact
of quality on
productivity in
future releases
based on
the number
of defects
scheduled for
remediation,
plus the effect of
maintainability
on work rate.
16
Modern Software Productivity Measurement: The Pragmatic Guide
repair effort to future releases. However, if carry-forward defects are reduced and maintainability scores are increased during a release, this formula can increase the release productivity score as a reward for improving future productivity outcomes.
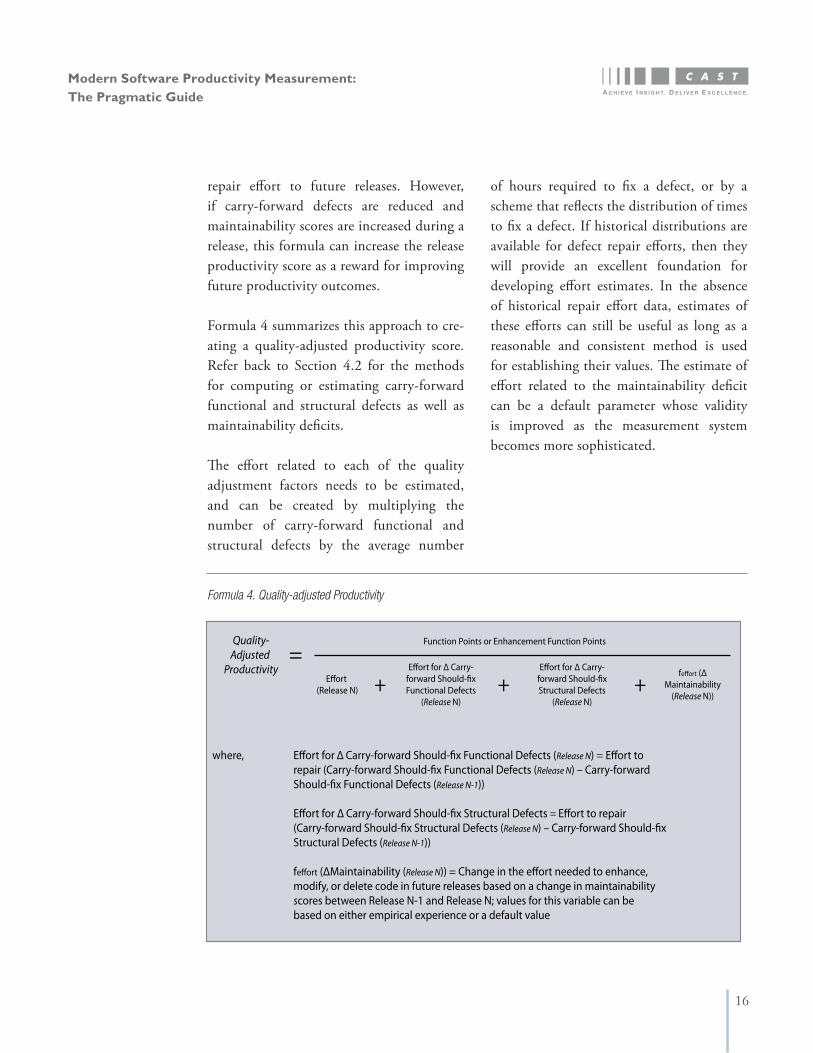
Formula 4 summarizes this approach to cre-ating a quality-adjusted productivity score. Refer back to Section 4.2 for the methods for computing or estimating carry-forward functional and structural defects as well as maintainability deficits.
The effort related to each of the quality adjustment factors needs to be estimated, and can be created by multiplying the number of carry-forward functional and structural defects by the average number
of hours required to fix a defect, or by a scheme that reflects the distribution of times to fix a defect. If historical distributions are available for defect repair efforts, then they will provide an excellent foundation for developing effort estimates. In the absence of historical repair effort data, estimates of these efforts can still be useful as long as a reasonable and consistent method is used for establishing their values. The estimate of effort related to the maintainability deficit can be a default parameter whose validity is improved as the measurement system becomes more sophisticated.
Formula 4. Quality-adjusted Productivity
Quality-Adjusted
Productivity=
Function Points or Enhancement Function Points
E�ort (Release N) +
E�ort for Δ Carry-forward Should-�xFunctional Defects
(Release N)
E�ort for Δ Carry-forward Should-�xStructural Defects
(Release N)+
fe�ort (ΔMaintainability
(Release N))+
where, E�ort for Δ Carry-forward Should-�x Functional Defects (Release N) = E�ort to repair (Carry-forward Should-�x Functional Defects (Release N) – Carry-forward Should-�x Functional Defects (Release N-1))
E�ort for Δ Carry-forward Should-�x Structural Defects = E�ort to repair (Carry-forward Should-�x Structural Defects (Release N) – Carry-forward Should-�x Structural Defects (Release N-1)) fe�ort (ΔMaintainability (Release N)) = Change in the e�ort needed to enhance, modify, or delete code in future releases based on a change in maintainability scores between Release N-1 and Release N; values for this variable can be based on either empirical experience or a default value
17
Modern Software Productivity Measurement: The Pragmatic Guide
Although we are charging estimated future rework effort back to the current release, in practice future rework will be included in the effort entered into release productivity calculations for future releases. The intent of the quality-adjusted productivity measure is to better understand the full impact on productivity of work in the current release, rather than to establish a complicated charge-back system where years of productivity results are constantly being recalculated. If used judiciously, this measure can motivate developers to improve the quality of their work and their defect removal efficiency.
A productivity measurement and analysis program provides information that helps identify and select improvement opportu-nities and track progress in pursuing them. This section presents a collection of 11 best practices for productivity analysis arranged by their order in the analysis process, as pre-sented in Figure 4, with a repeating cycle for Practices 5 to 11. Productivity analysis should be integrated into any software mea-surement or improvement programs that the organization is conducting.
In practice, all three of the quality-adjustment factors included in this formula may not be available. However, even if only one or two are available, the approach can be useful to get a sense of how the quality of the current release work will affect future releases. This formula is a suggested approach, and IT organizations are encouraged to adapt it as necessary to their data and the maturity of their measurement system.
•Recommendation: Use a quality-adjusted productivity score to account for the effect quality of the work in the current release will have on future rework and future release productivity.
5.1 Establish executive leadership
The primary reason measurement and improvement programs fail is lack of executive support. Executives must clearly state the objectives for productivity analysis and expect periodic reports on progress and results, as well as hold managers accountable for acting on these results. Momentum for productivity measurement and analysis can only be sustained if the development staff sees executives actively use analysis results to make decisions, allocate resources, and promote improvement.
5. Best Practices to Conduct a Productivity Analysis Program
Momentum for
productivity
measurement and
analysis can only
be sustained if the
development staff
sees executives
actively use
analysis results to
make decisions,
allocate
resources,
and promote
improvement.

18
Modern Software Productivity Measurement: The Pragmatic Guide
5.2 Form measurement group
Productivity analysis programs should be conducted by experienced professionals with measurement expertise. At least one member of the team should be experienced in statis-tics. The measurement group must take re-sponsibility for providing clear data defini-tions and guidelines for collection, as well as consulting on how to collect and use produc-tivity data. The measurement group should be integrated into an overall improvement program with at least one person who has change management experience.
Figure 4. Best Practices for Productivity Analysis
The first responsibility of the measurement group is to develop a plan to initiate and manage the measurement program and integrate it with other improvement initiatives. The early stages of the plan should be conservative since the quality of the data will improve as the organization’s development processes and measurement experience mature. An excellent source of guidance for initiating a software measurement program is described in Practical Software Measurement9.
Establishexecutiveleadership
Form measure-ment group
Automatedatacollection
Seek measureconsensus
Checkdata validity
Enforce data manage-ment
Inspectdata distributions
Segmentapplications
Iterateanalyses
Pre-briefanalyses
Structure�nal results
12
3
4 5
6
7
89
10
11
19
Modern Software Productivity Measurement: The Pragmatic Guide
5.3 Automate data collection
Software measurement has languished and initiatives often fail because the manual effort to collect data is perceived to exceed the benefit derived from analyzing it. Recent advances in integrated Application Lifecycle Management technologies and the tools that populate them have reduced the manual overhead of collecting data. Consequently, automated data collection should be a critical criterion when selecting software development and maintenance tools and environments.
5.4 Seek measure consensus
To achieve organizational goals, productivity and quality measures must be defined in the context of the entire organization since no single individual or group will know all of the issues that need to be considered. The measurement team should seek inputs from those affected by the measures and offer opportunities for review before finalizing the definitions. In particular, they should use this input to identify guidelines for adapting productivity measures to the situations in which they will be applied such as new development versus legacy modernization, or single versus multiple technology applications. It is impossible to produce perfect measures, and difficult decisions will need to be made that do not please everyone, but gaining consensus can help to avoid at least some traps and misinterpretations in the final measure definitions.
5.5 Check data validity
Even when data collection is automated, data validity needs to be checked frequently. Mistakes in how data are gathered or measures are computed plague even the most automated systems. Analysts need to know all the details of how measures are computed to identify and analyze anomalies in the results. It is not uncommon for 10% or more of the data initially offered for productivity analysis to be inaccurate. One of the most effective validity checks is to investigate consistency among the measures within a release with questions such as, “If it’s this big, why does it have so little of that?”
5.6 Enforce data management
Software is not the only medium that needs to be kept under strict version and change control. Repositories for productivity data should be managed as critical corporate databases, and the productivity program should engage people with strong data management skills to ensure that data are managed, updated, and audited with appropriate discipline and access control. Three critical aspects of data management are:1. Application boundary definition2. Measure normalization3. Productivity baseline control
Even when data
collection is
automated, data
validity needs
to be checked
frequently.
20
Modern Software Productivity Measurement: The Pragmatic Guide
5.6.1 Application boundary definition: One of the biggest challenges in developing accurate and consistent counts of Function Points, as well as other size measures, has been clarifying the boundaries of the application to be sized and finding all of the source code or documentation within these boundaries. The definition of these boundaries and artifacts that constitute them need to be maintained under configuration control to provide a stable base for measuring all the variables such as quality or effort that can be affected by them.
5.6.2 Measure normalization: Even with data collected through automated tools, the methods, algorithms, and calculations within these tools frequently change over time. Thus, it is critical for productivity data to be tagged by the version of the tool from which it was collected, analyzed, or calculated. Comparing productivity data across releases and time periods often requires recalculating past data to account for changes in the technology or algorithms used in its collection. For instance, systems that evaluate the structural quality of software are being constantly updated with new types of structural flaws. Comparing quality across releases may require either reanalyzing an application, or standardizing the analysis on algorithms in a previous version of the technology.
5.6.3 Productivity baseline control: Rules should be defined for computing quarterly or annual baselines, and the data to be entered into these baselines need to be frozen on an agreed date. For instance, what year is used if a release occurs on January 2 rather than
December 31? The baseline data and tools used to collect each application’s data needs to be kept under version control in case the baseline needs to be recomputed in the future.
5.7 Inspect data distributions
Prior to beginning statistical analyses, the distributions for all data items to be entered into the analyses should be inspected. Beyond standard validity checks, data analysts should check for outliers and distributional characteristics that will affect the interpretation of results. For instance, outliers can strongly affect the mean of a distribution, but not so much its median. Highly skewed or multi-modal distributions may violate the assumptions of some statistical techniques so severely that others should be used. Distributional problems such as a restriction on the range of a variable can mask the existence of a significant correlation. These issues should be identified long before executives ask questions trying to understand the results.
5.8 Segment applications
Many factors affect productivity results, such as the application, project, and organizational factors listed in the description of demographic data in Section 3.4. For instance, the productivity of working on large legacy systems will typically differ from the productivity of working on newer, smaller web-based applications. In addition, the

21
Modern Software Productivity Measurement: The Pragmatic Guide
factors that should be addressed to improve productivity may differ substantially between these categories of applications. When productivity baselines differ significantly between segments, aggregating productivity results across segments makes the average productivity value susceptible to variations in the number of applications in the sample from each segment. These variations in sampling rates from different segments can lead to misinterpretations of the productivity results, even indicating occasional productivity declines when productivity is actually improving.
5.9 Iterate analyses
The results of analyses should be reviewed to ensure they make sense, look free from mistakes, and can be easily explained. If the results are surprising, check the distributions to see if there is an anomaly such as extreme skewing that can explain the unexpected results. After reviewing the initial results, the measurement team can choose to run additional or alternative analyses that provide a more accurate representation of productivity trends in the organization. Data analyses frequently proceeds through several cycles as new observations lead to additional questions, and this should be an iterative process to ensure the best understanding of the data and the factors affecting productivity is presented.
5.10 Pre-brief results
Before presenting the final results to senior management, it is often best to pre-brief application managers so that they can correct mistakes, offer explanations, or prepare for unexpected or disappointing outcomes. This is also an excellent time to explore the data for guidance on improvements. Application managers should not see their productivity results for the first time during an executive review.
5.11 Structure final results
After pre-briefing the results individually with application managers and gathering their insights, the measurement team is prepared to present and explain the results to senior management. The team should structure the presentation to highlight the most important messages in the data, as well as the results that will affect decisions, and should anticipate the questions they will be asked. The best way to prepare for questions is to interview executives about what they want to know from the data and how they will use it in making decisions. After a few briefings, a standard template should emerge for reporting productivity data in a form that can be readily digested by management.
Variations in sam-
pling rates from
different segments
can lead to misin-
terpretations of
the productivity
results, even indi-
cating occasional
productivity decli-
nes when produc-
tivity is actually
improving.

22
Modern Software Productivity Measurement: The Pragmatic Guide
We will conclude with a discussion of how the measures and practices described in previous sections can be used to achieve the objectives of productivity analysis. In pursuing these objectives there are a collection of analysis pitfalls to be avoided, four of which will be described. We will then discuss how productivity analysis can be integrated into productivity improvement programs, estimation, benchmarking, and vendor management.
6.1 Challenges in Developing Productivity Baselines
When initiating a productivity measure-ment program, most organizations want to establish productivity baselines against which to measure progress. These baselines can then be compared over time to under-stand trends. However, there are at least four problems that can threaten the validity of baseline measures, mask improvements, and degrade insight into factors controlling IT costs:1. Misreporting2. Outliers3. Demographic variance4. Sample shifts
6.1.1 Misreporting: Since the measurement of application size is now automated, the measure with the greatest error rate is typically effort, which is usually under-reported. For instance, if developers are working 60 hours per week but only recording 40 hours for billing purposes, productivity improvement that reduces effort by 1/3 will not be
detected in the baseline data. Consequently, IT should implement a system that makes time recording easy, and management should eliminate conditions that motivate developers to over- or under-record their hours. Otherwise productivity analysis will be unable to achieve its objectives due to erroneous measures.
6.1.2 Outliers: Productivity scores that lie at the outer extremes of the distribution of productivity values can pull the mean of a distribution far away from the median or mode, and give a distorted view of the central tendency of the baseline. Unless these outliers are removed from the analysis, the median is the better choice as an indicator of the central tendency of the baseline. However, outlying scores may also contain valuable information regarding factors that can exert strong influences on project or application performance. In many cases they will be transient conditions that should not be allowed to affect the baseline unless they become more frequent.
6.1.3 Demographic variance: As previously detailed, many demographic attributes of applications can affect productivity. If pro-ductivity figures are not segregated among the categories within a demographic factor, such as among different application types or programming languages, critical insights into productivity improvement opportu-nities and progress can remain hidden. In addition to an overall productivity baseline, separate baselines should be developed for applications segmented into categories on demographic factors that affect productivity.
6. Productivity Measurement Objectives
Separate
baselines should
be developed
for applications
segmented into
categories on
demographic
factors that affect
productivity.
23
Modern Software Productivity Measurement: The Pragmatic Guide
One method for segmenting applications is to test for differences in the means and variances among the different categories of a demographic variable. For instance, it would not be surprising to find large productivity differences between web-based applications written in Java or .NET, process control applications written in C++, and legacy mainframe applications written in COBOL. Mixing these results on the same baseline can mask large differences in the types of improvements that will be most effective in each environment and the rate at which these improvements can show results. Without sensible segmentation, the insight to be gained from Deming’s ‘profound knowledge’ is lost.
6.1.4 Sample shifts: One of the most common problems in comparing productivity baselines over time is substantial changes in the types of applications included in the sample for each baseline. For instance, if there are significant variations in productivity for four different categories of a demographic variable such as development language, and the relative percentage of the sample comprised by each of these categories is reasonably consistent across baselines, then the results are comparable even if they mask productivity insights specific to each category. However, in most IT organizations the percentage of the sample accounted for by each demographic category usually shifts significantly across quarters or years. Under these circumstances the baselines are not comparable, occasionally to the extent of being misleading.
In fact, instances have been reported where productivity was increasing across all categories, but because the category with the lowest productivity suddenly accounted for a much larger percentage of a subsequent sample, overall productivity appeared to decrease. When productivity results vary widely and constantly change directions between reporting periods, it is likely that significant shifts are occurring in the makeup of subsequent samples, creating noise and even misleading trends in the analysis of productivity. To avoid anomalous results, the makeup of the sample for each baseline should be examined before reporting final results so that applications can be segmented by demographic categories that differ in productivity outcomes.
Solutions for managing these and other pro-ductivity analysis challenges require far more space than available in this guide. The im-portant lesson is that productivity measure-ment requires hard analytical thinking if the resulting statistics are to produce the insight necessary to identify improvement oppor-tunities and accurately track their progress when implemented. Segmented baselines avoid some sampling problems and provide the best insight for making cost-based de-cisions about applications. When develop-ing productivity baselines it is always good to heed Prime Minister Benjamin Disraeli’s warning that, “There are lies, damned lies, and statistics.”
Unreasonable
productivity
targets lead
to gaming the
measures and
ultimately discredit
the improvement
program.
24
Modern Software Productivity Measurement: The Pragmatic Guide
6.2 Productivity Improvement
Numerous books have been written about conducting productivity improvement pro-grams, and many of the best discuss meth-ods in the context of conducting a CMM/CMMI-based improvement program10,11. From two decades of experience we have identified the following as being among the best practices:1. Set reasonable improvement targets2. Stage improvement program rollout3. Conduct launch workshops4. Perform periodic audits5. Avoid misuse of productivity data
6.2.1 Set reasonable improvement targets: A consistent trait of low maturity organizations is that the development staff scrambles to meet unachievable project commitments and unreasonable improvement goals. These types of unreasonable productivity targets lead to gaming the measures and ultimately discredit the improvement program. Productivity targets should be based on existing baseline data, and most importantly, the baseline data must be segmented to accurately characterize the conditions affecting productivity in each application. During program initiation, especially in low maturity organizations, productivity progress should be compared across releases within each application rather than across applications. As the measurement program matures and greater consistency is achieved in the collection of measures across applications, the validity of cross-application comparisons will improve.
6.2.2 Stage improvement program rollout: Big bang startups often work poorly for pro-ductivity improvement programs. The most effective implementations involve rollouts staged across applications one at a time. Lessons learned launching measures with one application can be carried forward to future rollouts on other applications. Thus, measures and practices are improved incre-mentally across application rollouts rather than waiting for the next big bang release of measurement definitions and processes.
6.2.3 Conduct launch workshops: The best practice to initiate measurement and improvement programs using the staged rollout approach is to conduct project launch workshops at the initiation of releases. These workshops should be organized around the planning and launch of an upcoming release, and measures should be introduced as a way to estimate, plan, and manage the release and its quality. In these workshops, application managers and senior technical staff learn the details of the measures and develop an approach that best adapts the measures to specific application conditions. Often IT organizations delay the development of baselines for at least one cycle of releases to allow application teams to become used to collecting and using the measures.
6.2.4 Perform periodic audits: A member of the measurement group should periodically follow up with each application project or release owner to discuss the implementation of improvements and use of measures to identify and remediate problems. These audits can be informal and should be conducted
Performance
management
is best served
if developers
embrace
productivity
measures as
personal tools for
self-improvement.
25
Modern Software Productivity Measurement: The Pragmatic Guide
as follow-up or mentoring sessions rather than as enforcement activities since their primary purpose is to assist improvement. Measurement must become a tool in the service of improvement rather than an end in itself. In the most effective programs, application teams embrace the measures used in productivity analysis as a tool for self-improvement and react to the data long before they are incorporated in baselines.
6.2.5 Avoid misuse of productivity data: Measures that support continual improvement will be embraced, while measures used in personnel activities will corrupt the productivity measurement program. Managers have many sources of information other than productivity measures to assess individual performance. Especially in low maturity organizations, a lack of trust will motivate developers to game the numbers if they believe productivity measures will be used in performance appraisals. Performance management is best served if developers embrace productivity measures as personal tools for self-improvement.
6.3 Estimation
Function Points have been attractive as a size measure because they can be estimated from information developed early in a project or release, long before code is available. To use Automated Function Points in estimation, a high-level representation of the requirements or design of the program must be available in a formal language that can be parsed such as UML. Unfortunately, the percentage of
applications whose requirements or design information is represented in a formal notation is very small, and the percentage of applications whose staffs maintain the completeness and accuracy of this documentation throughout the early phases of development is even smaller. As a result, most early use of Function Points has been rough estimating from inexact information.
Under these circumstances an organization’s repository of Automated Function Point data collected from analyses of earlier releases provides a critical source of information for improving estimates. The results of early estimates, even from inexact information, can now be compared to accurate, consistent counts of Function Points from the application to calibrate the relationship. Over several releases, the measurement group will learn which information collected early in a project calibrates most effectively with the final size and effort.
The demographic information used in segmenting applications during productivity baseline analysis should also be used for adjusting estimates. In fact, this is how most software cost estimating models work. They begin with a basic relationship between size and effort, in essence a productivity relationship, and then adjust it using demographic variables that have strong effects on productivity such as language and technology platform, application complexity, experience of the development team, and other factors. In this way, improved estimating is a natural follow-on to productivity baselines and analyses.
An organization’s
repository of Au-
tomated Function
Point data collec-
ted from analyses
of earlier releases
provides a critical
source of informa-
tion for improving
estimates.

26
Modern Software Productivity Measurement: The Pragmatic Guide
6.4 Benchmarking
Benchmarking is a natural use of productiv-ity baselines. Most often executives want to benchmark the productivity of their IT organization with others in same industry sector such as financial services, telecom-munications, or government. The problem with these benchmark comparisons is that the baselines in public or private repositories may not have been collected using similar definitions or discipline. The data is most frequently collected on questionnaires and validity checks are limited. Consequently, measurement errors and related issues make these benchmarks questionable, even if an executive only wants an ‘in-the-ballpark’ comparison.
The most effective and valuable benchmarks are typically internal to the organization. If the measurement process is automated to the extent possible and good measurement discipline is practiced across the organiza-tion, internal benchmarks are reliable and valuable. These benchmarks can be used in the service of tracking improvement prog-ress and identifying the conditions and pro-cesses that are most conducive to rapid and sustained improvement. As the organization matures, the importance of external bench-marks will decline rapidly as the focus shifts from an external reference to an internal reference that provides insight and guidance for future improvements.
6.5 Vendor Management
External benchmarking can be useful in the selection of external sources for application development and maintenance. However, the critical lesson in benchmarking potential vendors is ‘caveat emptor’, let the buyer beware. The acquiring organization should conduct its own due diligence of benchmark data and methods, as well as conduct a site visit with each of the final bidders. If benchmark productivity data cannot be validated, and this is often difficult when bidders or third parties provide the productivity values, then benchmarks should be given much lower weight in the selection process.
Once external sources have been selected, productivity benchmarks can play a critical role in managing and governing sourcing relationships. Productivity improvement targets can be set with performance bonuses built into a contract, since experience has taught that performance penalties in contracts usually damage the relationship and bonuses are more effective. The quality data used for calculating quality-adjusted productivity measures can also be used in quality gates as criteria for accepting externally supplied software into the operational environment.
The most effective
and valuable
benchmarks are
typically internal to
the organization.

27
Modern Software Productivity Measurement: The Pragmatic Guide
Software productivity measurement is crucial for guiding and tracking productivity and quality improvement programs. However, the quality of guidance provided by these measures depends on the discipline with which they are collected and analyzed. The objectives for using the mea-sures need to be clearly stated by executive management. At least four types of measures should be collected—size, effort, quality, and demographics. These measures need to be carefully de-fined based on the conditions for collection and the purposes for which they will be used. Many best practices for collecting, analyzing, and using productivity data have been identified and they should be organized into a disciplined process for implementing a productivity analy-sis and improvement program. Similarly much has been explained about implementing effec-tive productivity improvement programs, including how practices are rolled out incrementally across applications rather than in organization-wide big bangs. The end result of successful productivity measurement and analysis programs should be improvements in productivity, quality, estimating, benchmarking, and managing sourced work.
7. Summary
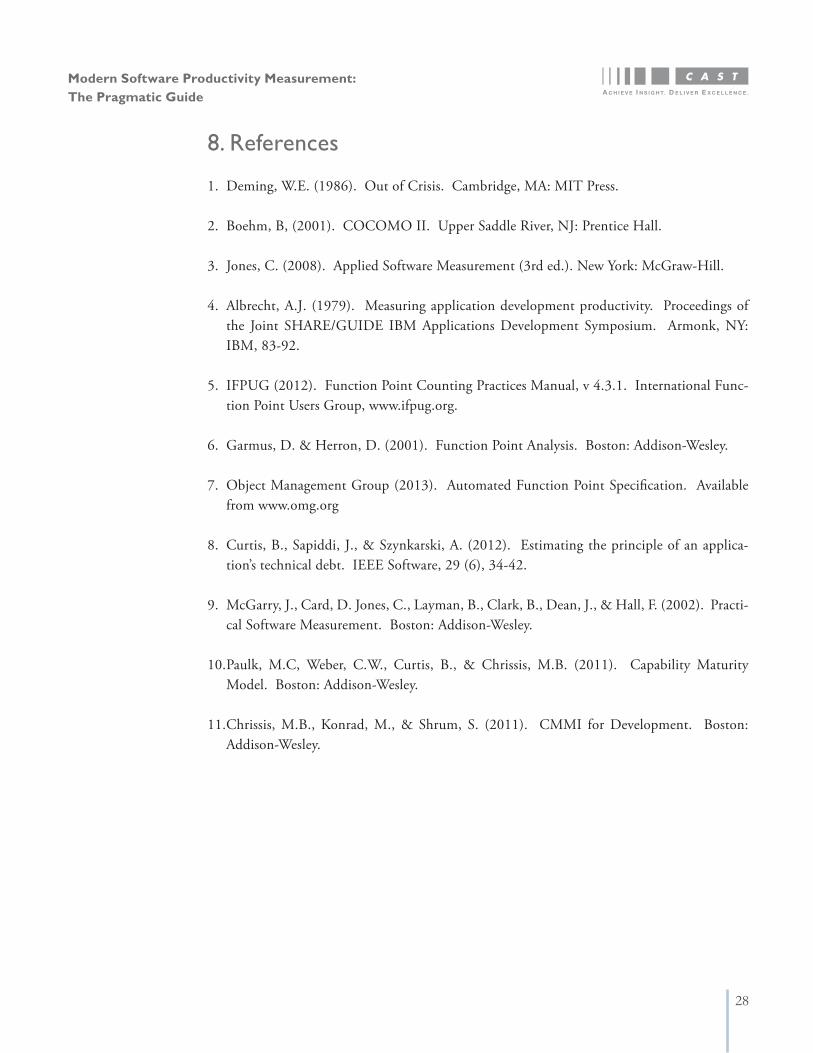
28
Modern Software Productivity Measurement: The Pragmatic Guide
1. Deming, W.E. (1986). Out of Crisis. Cambridge, MA: MIT Press.
2. Boehm, B, (2001). COCOMO II. Upper Saddle River, NJ: Prentice Hall.
3. Jones, C. (2008). Applied Software Measurement (3rd ed.). New York: McGraw-Hill.
4. Albrecht, A.J. (1979). Measuring application development productivity. Proceedings of the Joint SHARE/GUIDE IBM Applications Development Symposium. Armonk, NY: IBM, 83-92.
5. IFPUG (2012). Function Point Counting Practices Manual, v 4.3.1. International Func-tion Point Users Group, www.ifpug.org.
6. Garmus, D. & Herron, D. (2001). Function Point Analysis. Boston: Addison-Wesley.
7. Object Management Group (2013). Automated Function Point Specification. Available from www.omg.org
8. Curtis, B., Sapiddi, J., & Szynkarski, A. (2012). Estimating the principle of an applica-tion’s technical debt. IEEE Software, 29 (6), 34-42.
9. McGarry, J., Card, D. Jones, C., Layman, B., Clark, B., Dean, J., & Hall, F. (2002). Practi-cal Software Measurement. Boston: Addison-Wesley.
10. Paulk, M.C, Weber, C.W., Curtis, B., & Chrissis, M.B. (2011). Capability Maturity Model. Boston: Addison-Wesley.
11. Chrissis, M.B., Konrad, M., & Shrum, S. (2011). CMMI for Development. Boston: Addison-Wesley.
8. References

29
Modern Software Productivity Measurement: The Pragmatic Guide
About the Author
Dr. Bill Curtis is an industry luminary who is responsible for influencing CAST’s scientific and strategic direction, as well as helping CAST educate the IT market to the importance of managing and measuring the quality of its software. He is best known for leading the develop-ment of the Capability Maturity Model (CMM) which has become the global standard for evaluating the capability of software development organizations.
Prior to joining CAST, Dr. Curtis was a Co-Founder of TeraQuest, the global leader in CMM-based services, which was acquired by Borland. Prior to TeraQuest, he directed the Software Process Program at the Software Engineering Institute (SEI) at Carnegie Mellon University. Prior to the SEI he directed research on intelligent user interface technology and the software design process at MCC, the fifth generation computer research consortium in Austin, Texas. Before MCC he developed a software productivity and quality measurement system for ITT, managed research on software practices and metrics at GE Space Division, and taught statistics at the University of Washington.
Dr. Curtis holds a Ph.D. from Texas Christian University, an M.A. from the University of Texas, and a B.A. from Eckerd College. He was recently elected a Fellow of the Institute of Electrical and Electronics Engineers for his contributions to software process improvement and measurement. In his free time Dr. Curtis enjoys traveling, writing, photography, helping with his daughter’s homework, and University of Texas football.