Modern Quasar SEDs Zhaohui Shang ( Tianjin Normal University ) Kunming, Feb. 2009.
32
Modern Quasar SEDs Zhaohui Shang ( Tianjin Normal University ) Kunming, Feb. 2009
-
Upload
alisha-king -
Category
Documents
-
view
228 -
download
0
Transcript of Modern Quasar SEDs Zhaohui Shang ( Tianjin Normal University ) Kunming, Feb. 2009.
Modern Quasar SEDs
Zhaohui Shang
( Tianjin Normal University)
Kunming, Feb. 2009
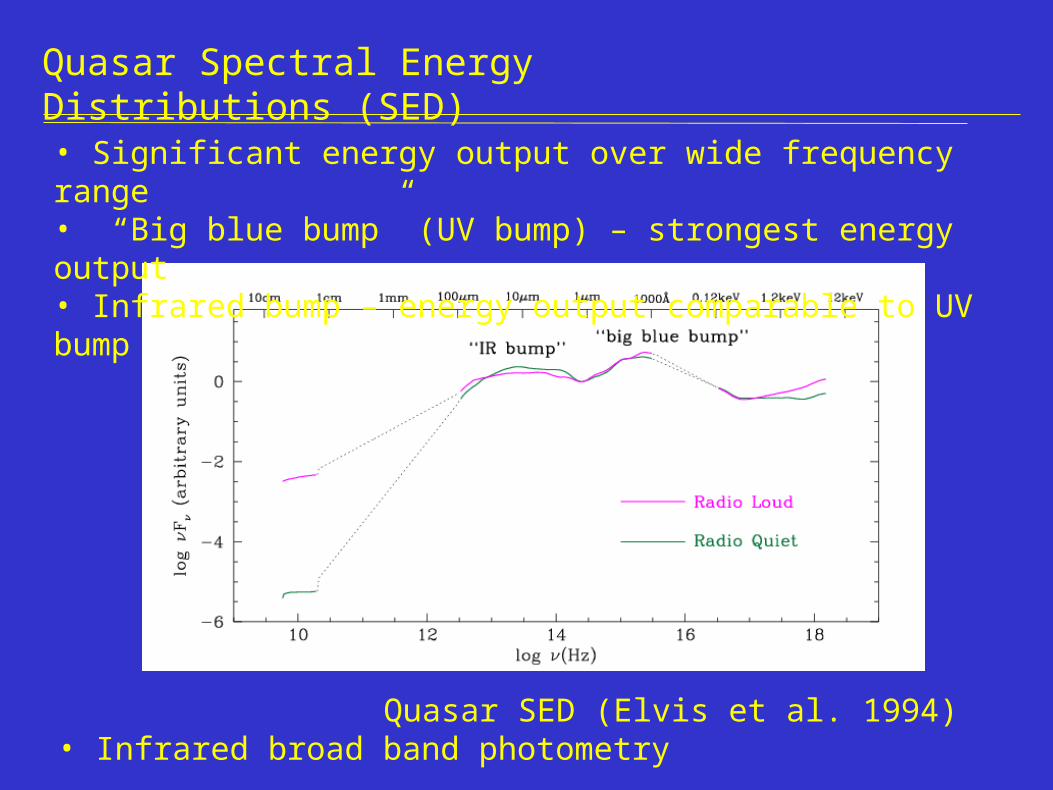
Quasar Spectral Energy Distributions (SED)
• Significant energy output over wide frequency range• “Big blue bump” (UV bump) – strongest energy output• Infrared bump – energy output comparable to UV bump
Quasar SED (Elvis et al. 1994)• Infrared broad band photometry
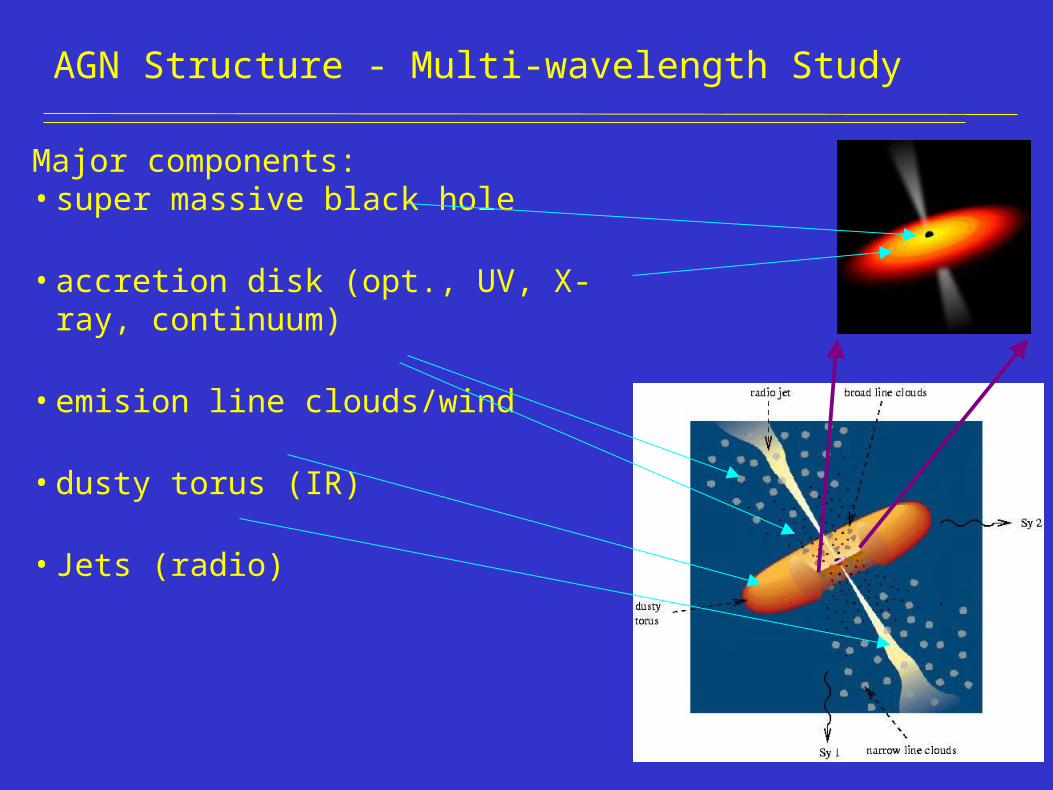
AGN Structure - Multi-wavelength Study
Major components:• super massive black hole
• accretion disk (opt., UV, X-ray, continuum)
• emision line clouds/wind
• dusty torus (IR)
• Jets (radio)
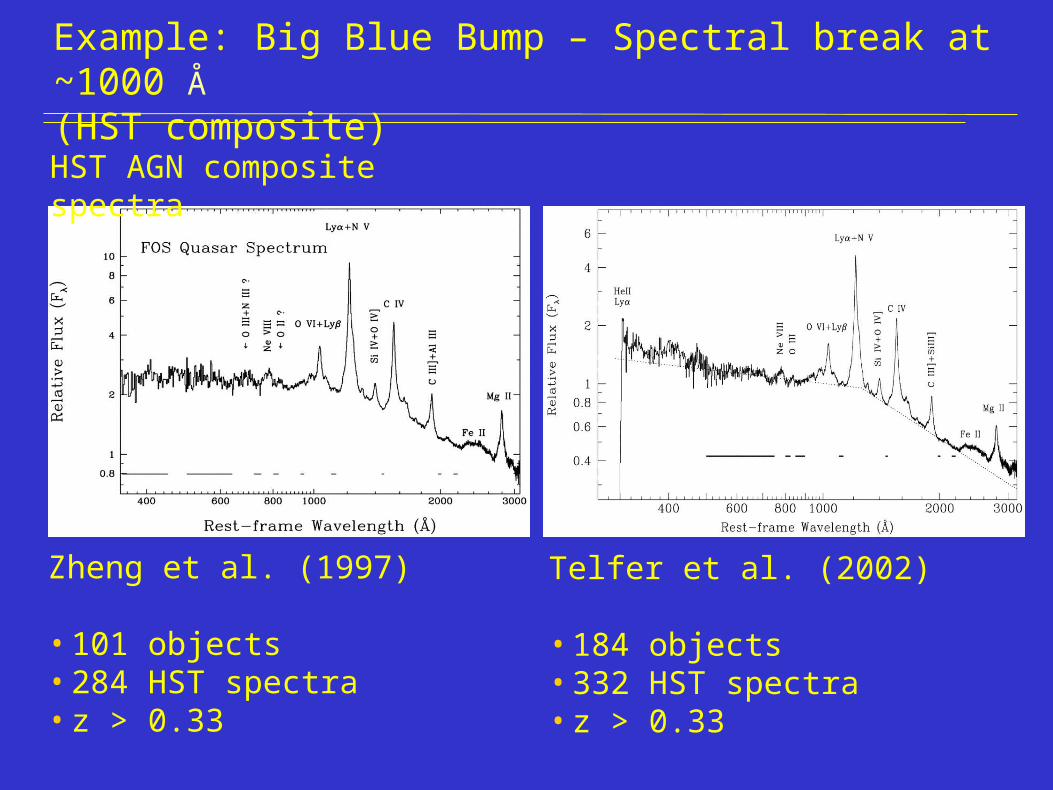
Example: Big Blue Bump – Spectral break at ~1000 Å (HST composite)
Telfer et al. (2002)
• 184 objects• 332 HST spectra• z > 0.33
Zheng et al. (1997)
• 101 objects• 284 HST spectra• z > 0.33
HST AGN composite spectra
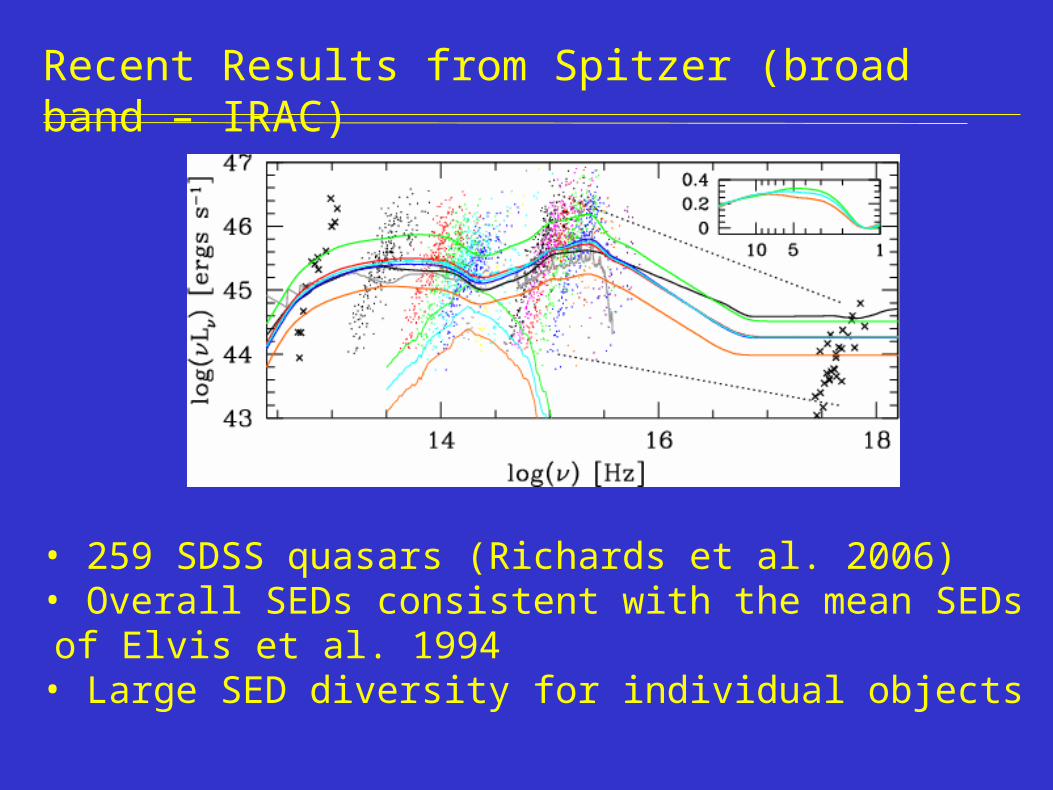
Recent Results from Spitzer (broad band – IRAC)
• 259 SDSS quasars (Richards et al. 2006)• Overall SEDs consistent with the mean SEDs of Elvis et al. 1994• Large SED diversity for individual objects
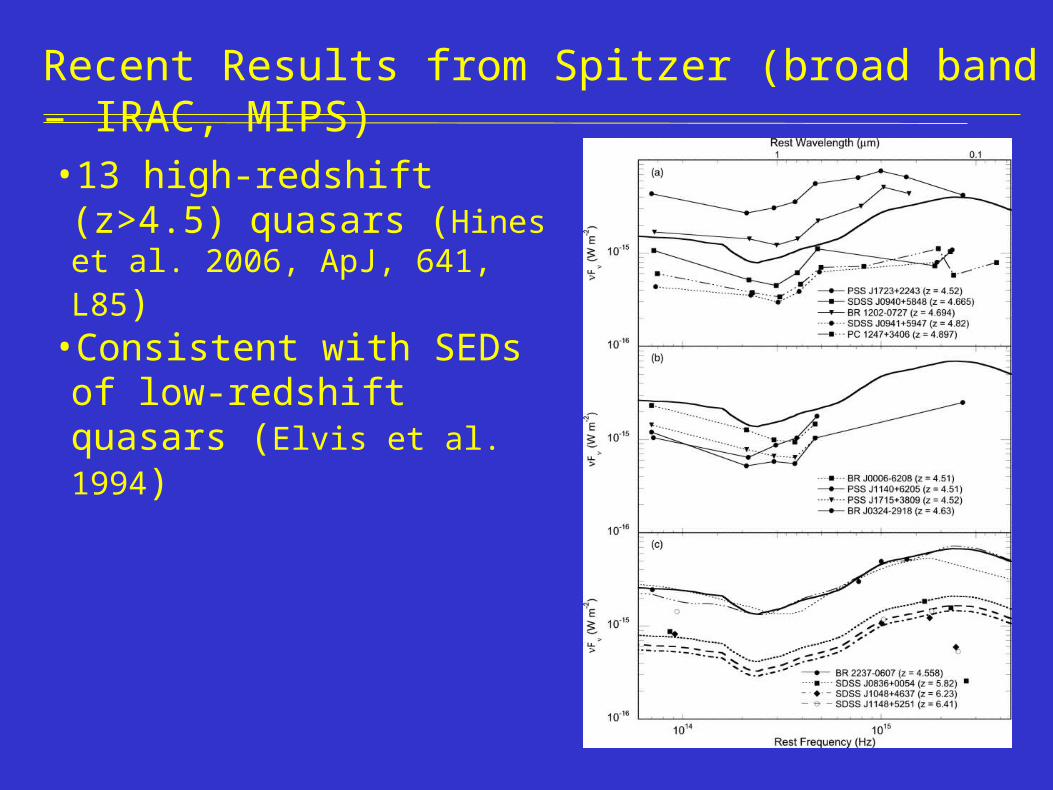
Recent Results from Spitzer (broad band – IRAC, MIPS)
•13 high-redshift (z>4.5) quasars (Hines et al. 2006, ApJ, 641, L85)
•Consistent with SEDs of low-redshift quasars (Elvis et al. 1994)
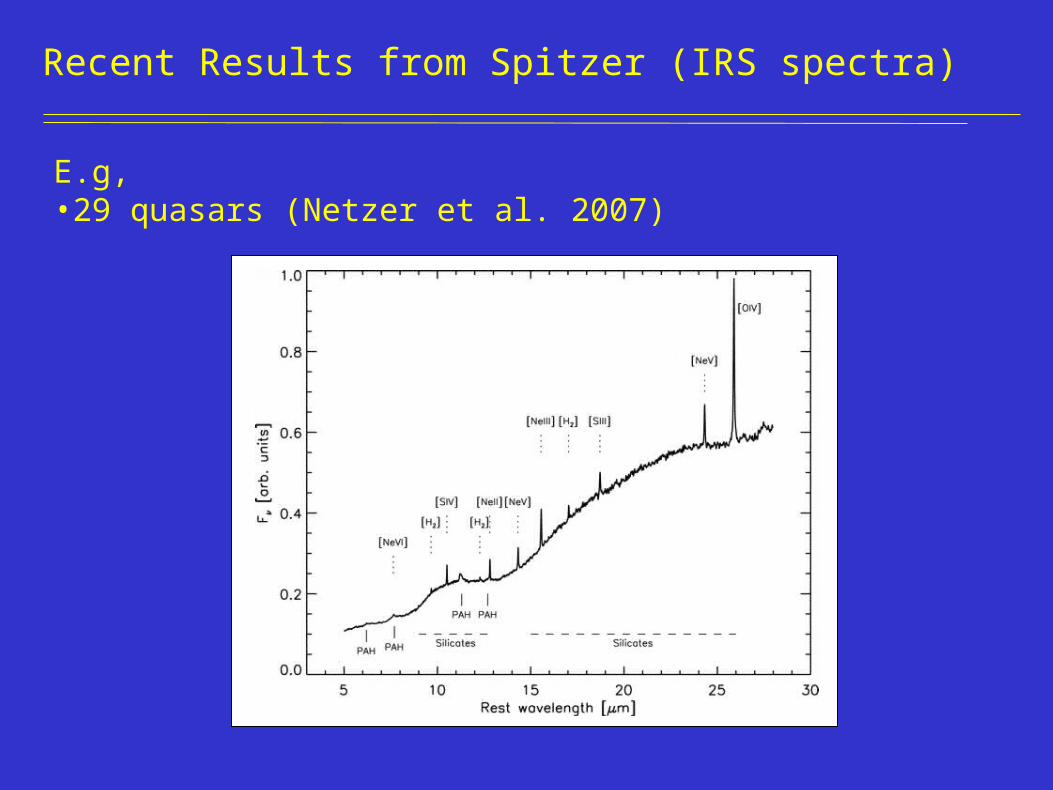
Recent Results from Spitzer (IRS spectra)
E.g,• 29 quasars (Netzer et al. 2007)
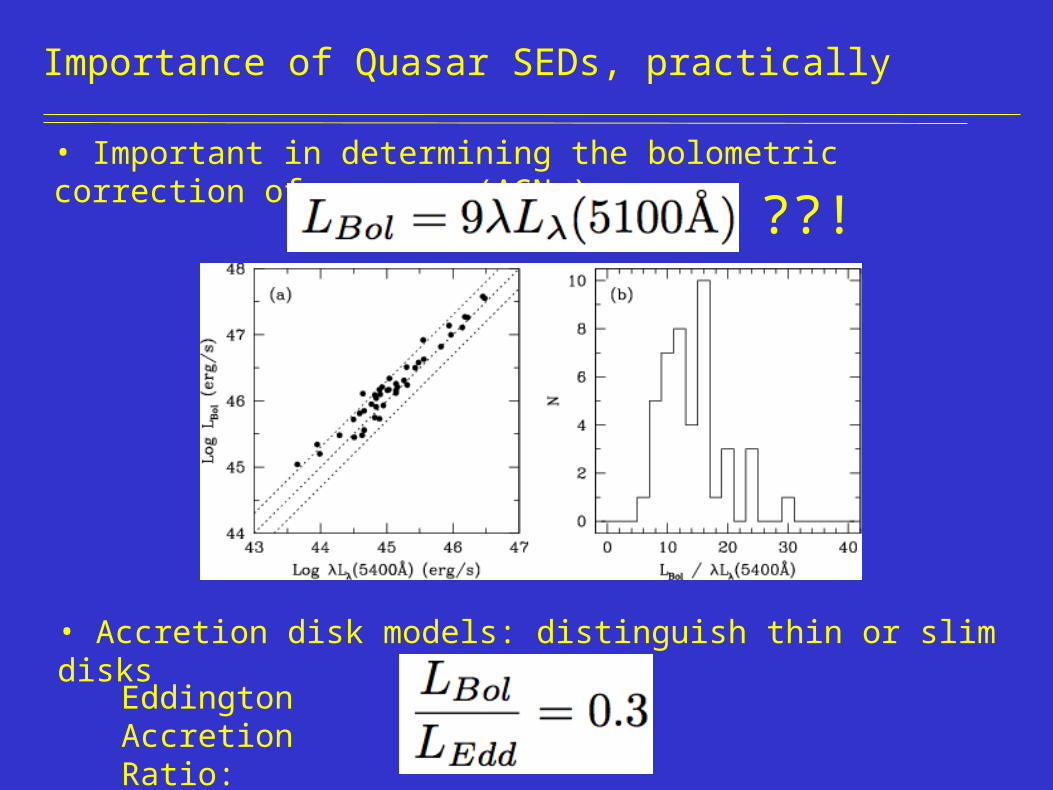
Importance of Quasar SEDs, practically
• Important in determining the bolometric correction of quasars (AGNs)
• Accretion disk models: distinguish thin or slim disks
??!
Eddington Accretion Ratio:
Modern Quasar SED
Our project• SEDs from radio to X-ray utilizing best data from both
ground and space telescopes• Update Elvis et al. 1994• Better estimate of bolometric luminosity and correction• Multi-wavelength study of quasar physics
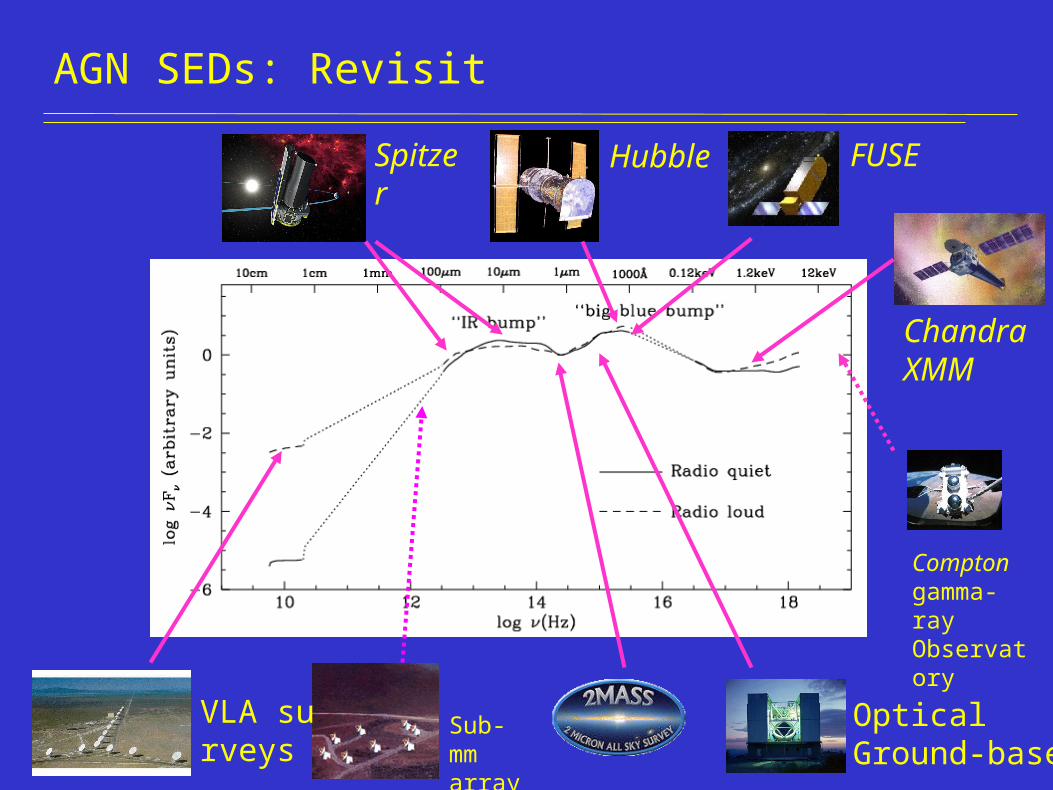
AGN SEDs: Revisit
Comptongamma-ray Observatory
ChandraXMM
Hubble
Sub-mmarray
VLA surveys
OpticalGround-based
Spitzer
FUSE
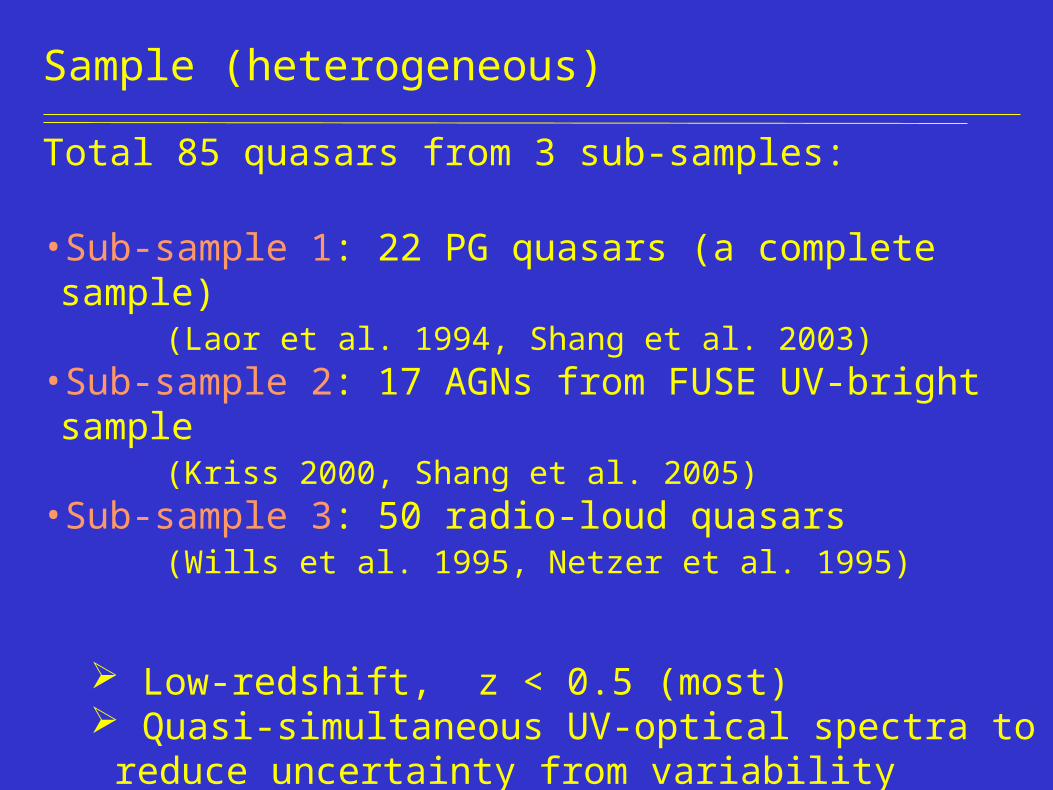
Sample (heterogeneous)
Total 85 quasars from 3 sub-samples:
•Sub-sample 1: 22 PG quasars (a complete sample)(Laor et al. 1994, Shang et al. 2003)
•Sub-sample 2: 17 AGNs from FUSE UV-bright sample (Kriss 2000, Shang et al. 2005)
•Sub-sample 3: 50 radio-loud quasars (Wills et al. 1995, Netzer et al. 1995)
Low-redshift, z < 0.5 (most) Quasi-simultaneous UV-optical spectra to reduce uncertainty
from variability
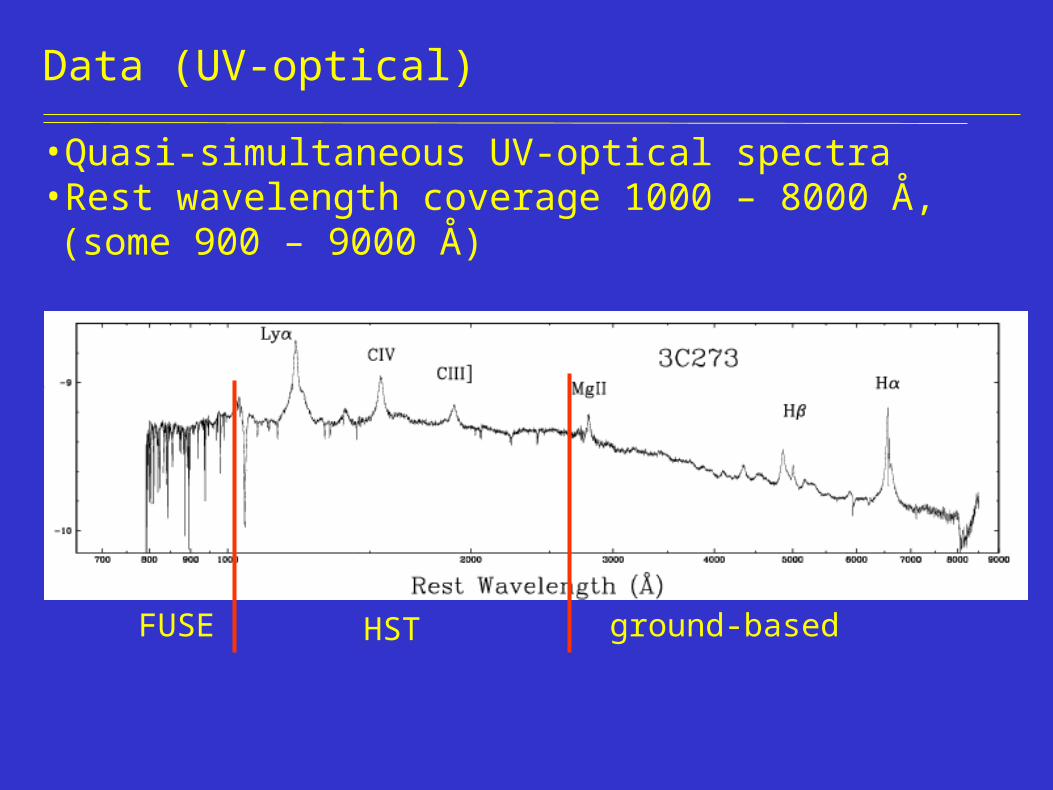
Data (UV-optical)
•Quasi-simultaneous UV-optical spectra•Rest wavelength coverage 1000 – 8000 Å, (some 900 – 9000 Å)
FUSE HST ground-based
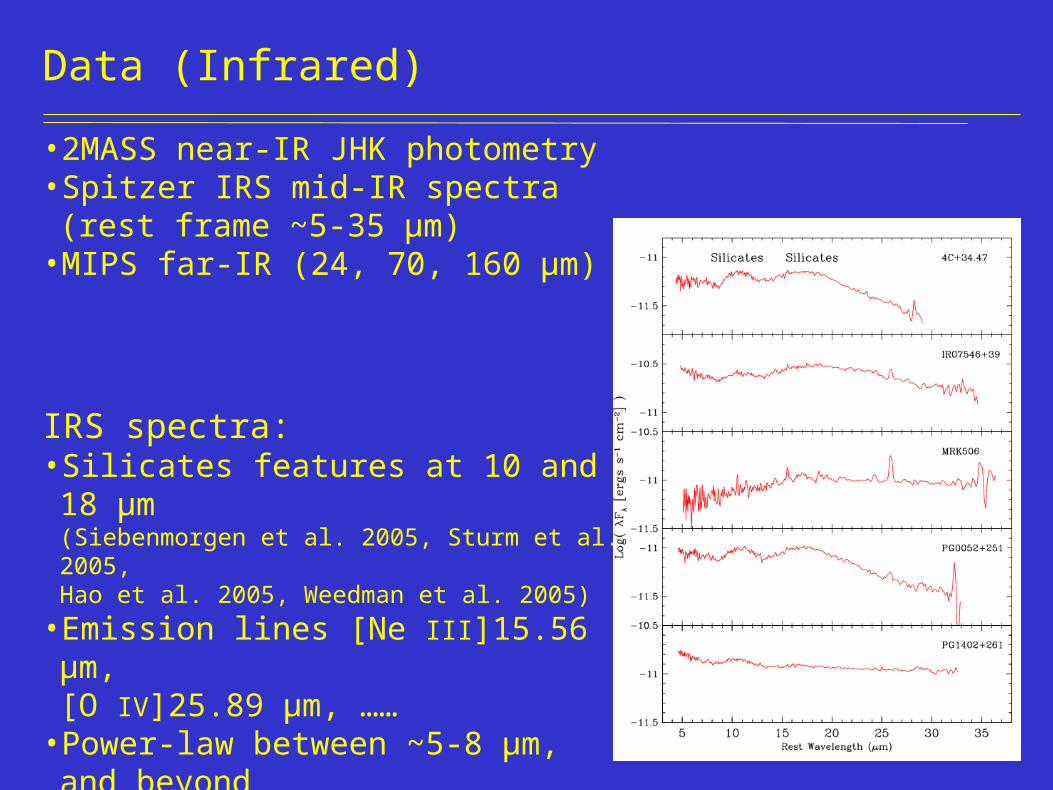
Data (Infrared)
• 2MASS near-IR JHK photometry• Spitzer IRS mid-IR spectra
(rest frame ~5-35 µm) • MIPS far-IR (24, 70, 160 µm) photometry
IRS spectra:• Silicates features at 10 and 18 µm
(Siebenmorgen et al. 2005, Sturm et al. 2005, Hao et al. 2005, Weedman et al. 2005)
• Emission lines [Ne III]15.56 µm, [O IV]25.89 µm, ……
• Power-law between ~5-8 µm, and beyond
Data (Radio, X-ray)
Radio•Surveys from 74MHz to 15GHz, including 4C, VLSS, WENSS, Texas, FIRST, NVSS, GB6, and some GHz surveys
•Higher resolution allows to separate the real cores for some objects
X-ray•Chandra + XMM archive data/literature•Higher resolution and sensitivity
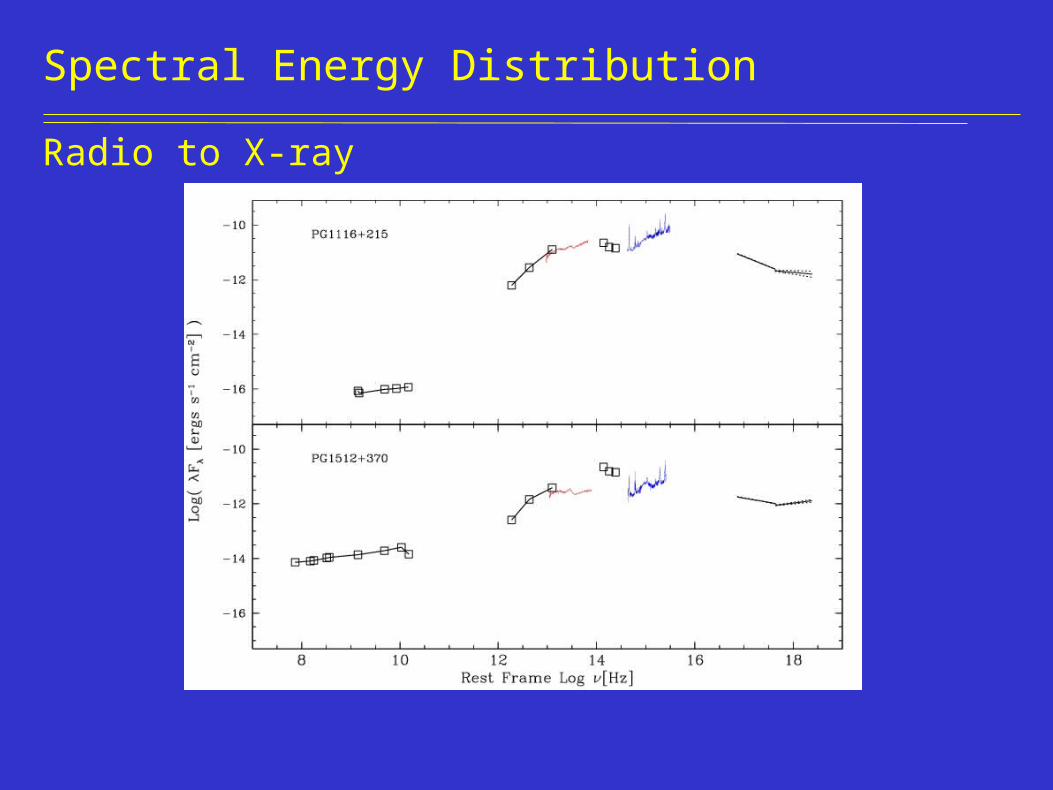
Spectral Energy Distribution
Radio to X-ray
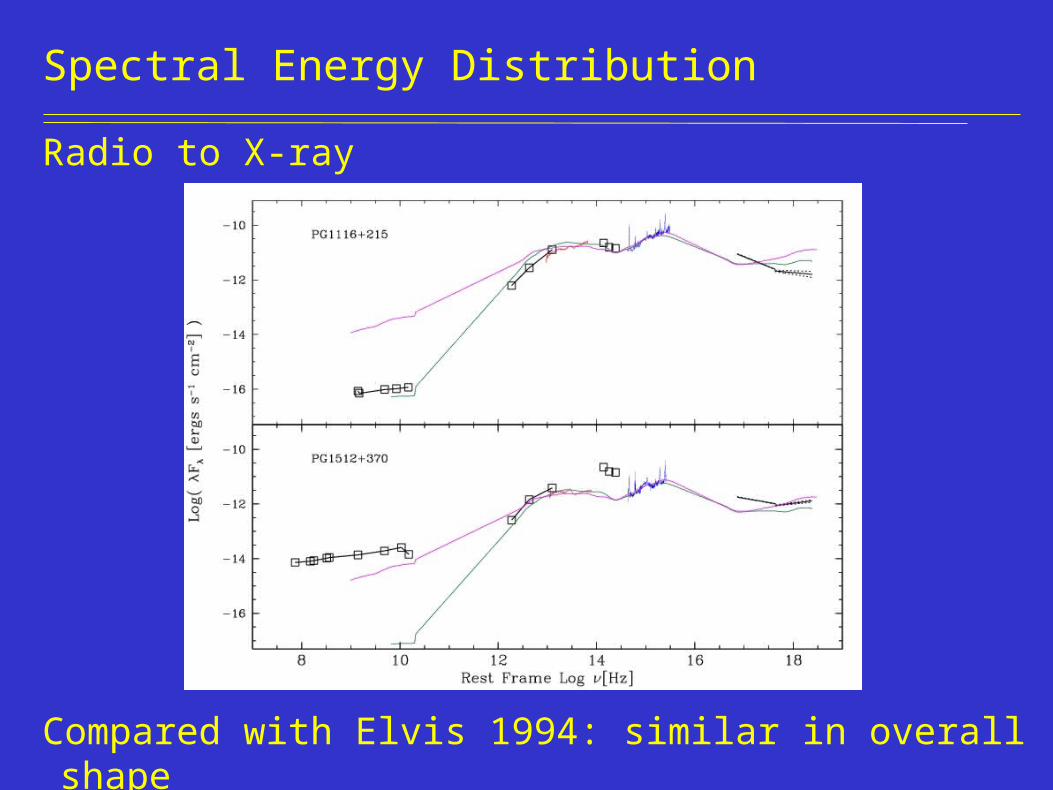
Spectral Energy Distribution
Radio to X-ray
Compared with Elvis 1994: similar in overall shape
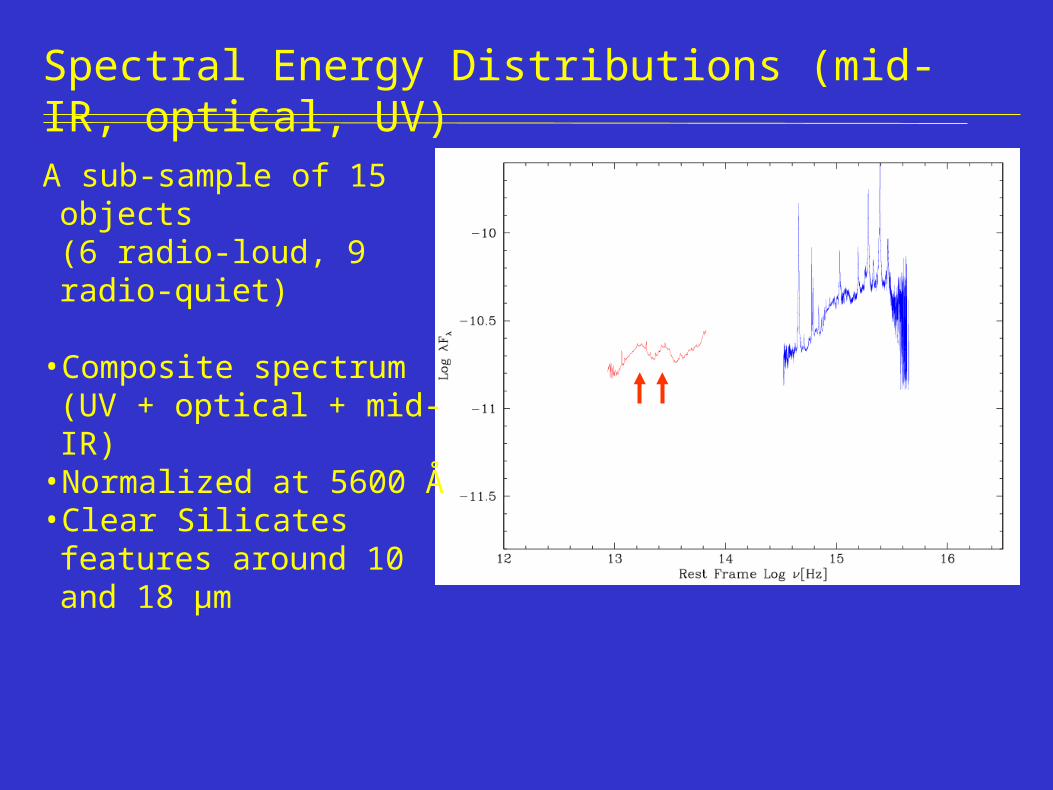
Spectral Energy Distributions (mid-IR, optical, UV)
A sub-sample of 15 objects(6 radio-loud, 9 radio-quiet)
• Composite spectrum (UV + optical + mid-IR)
• Normalized at 5600 Å• Clear Silicates features
around 10 and 18 µm
A sub-sample of 15 objects(6 radio-loud, 9 radio-quiet)
• Composite spectrum (UV + optical + mid-IR)
• Normalized at 5600 Å• Clear Silicates features
around 10 and 18 µm
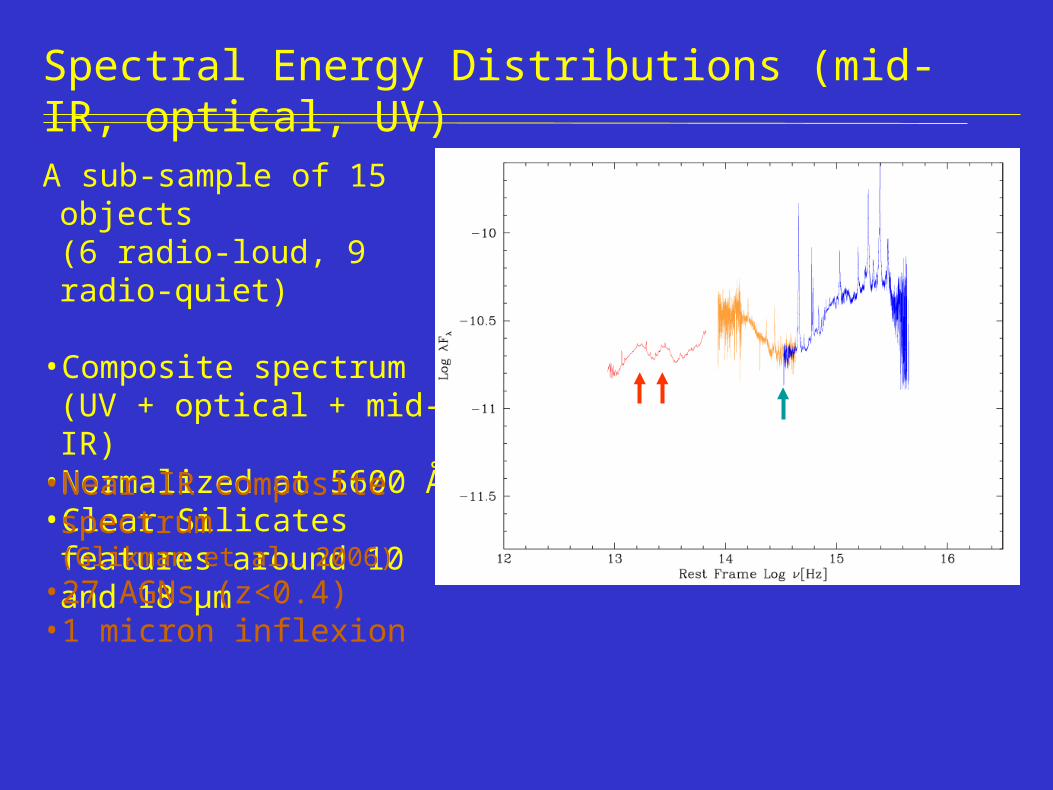
Spectral Energy Distributions (mid-IR, optical, UV)
• Near-IR composite spectrum (Glikman et al. 2006)
• 27 AGNs (z<0.4)• 1 micron inflexion
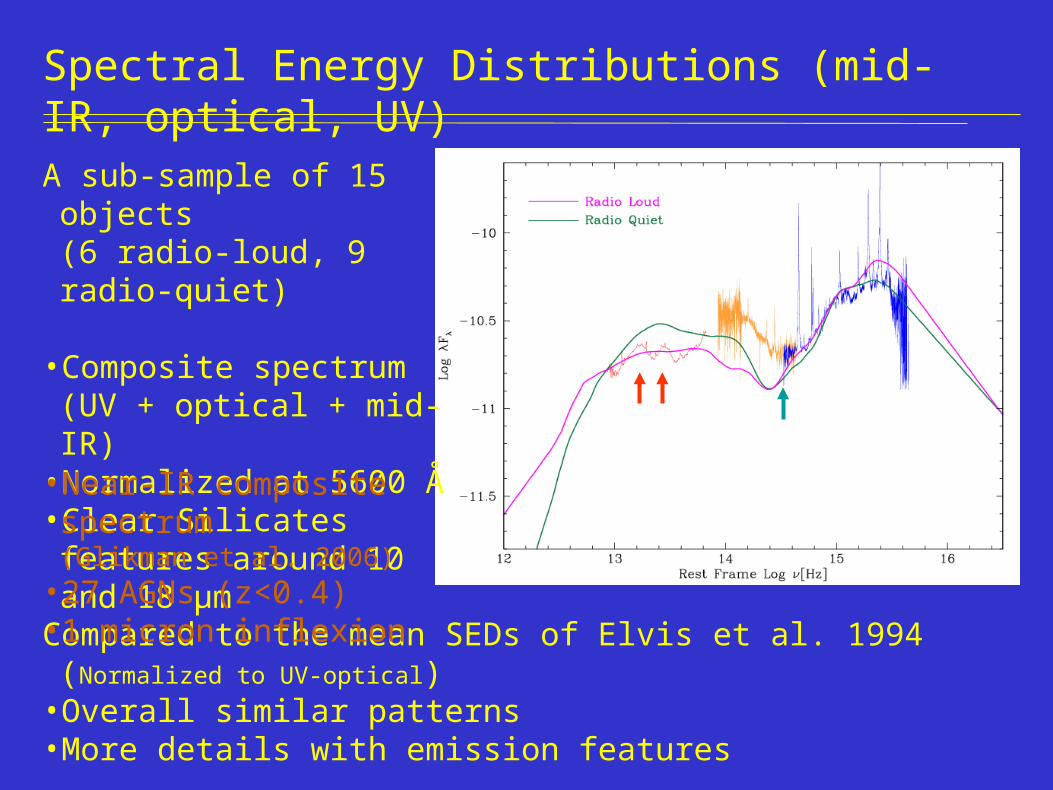
Spectral Energy Distributions (mid-IR, optical, UV)
Compared to the mean SEDs of Elvis et al. 1994 (Normalized to UV-optical)• Overall similar patterns• More details with emission features
A sub-sample of 15 objects(6 radio-loud, 9 radio-quiet)
• Composite spectrum (UV + optical + mid-IR)
• Normalized at 5600 Å• Clear Silicates features
around 10 and 18 µm• Near-IR composite spectrum
(Glikman et al. 2006)• 27 AGNs (z<0.4)• 1 micron inflexion
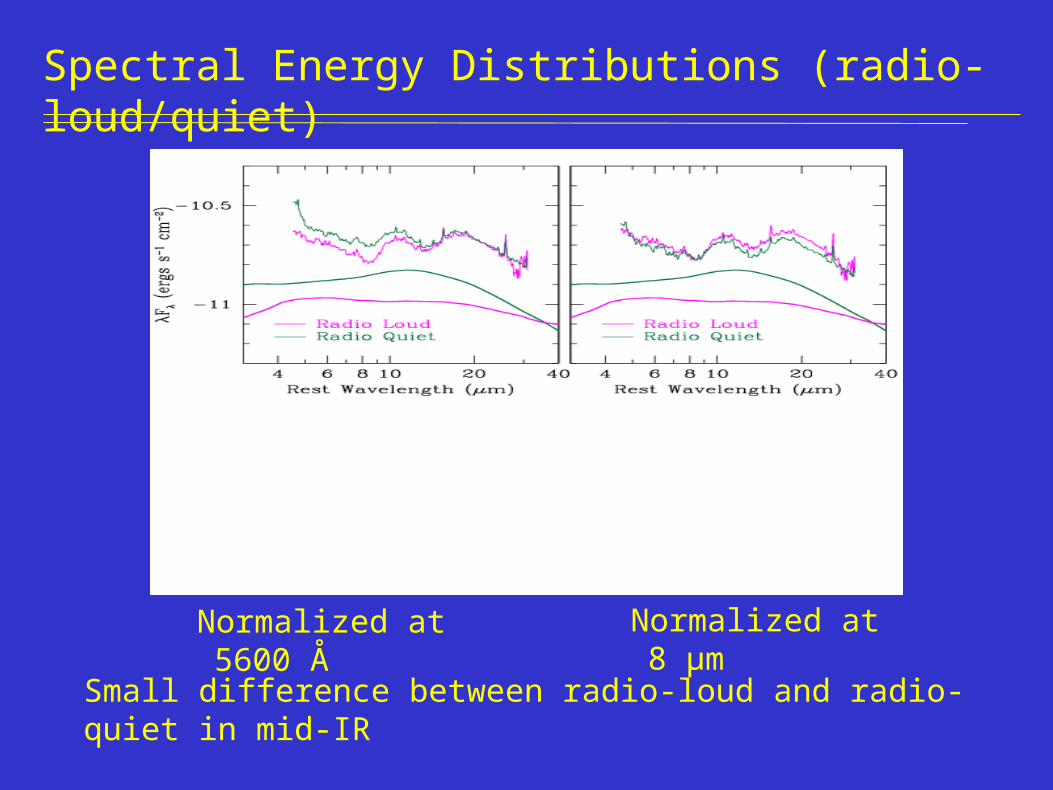
Spectral Energy Distributions (radio-loud/quiet)
Normalized at 5600 Å Normalized at 8 µm
Small difference between radio-loud and radio-quiet in mid-IR
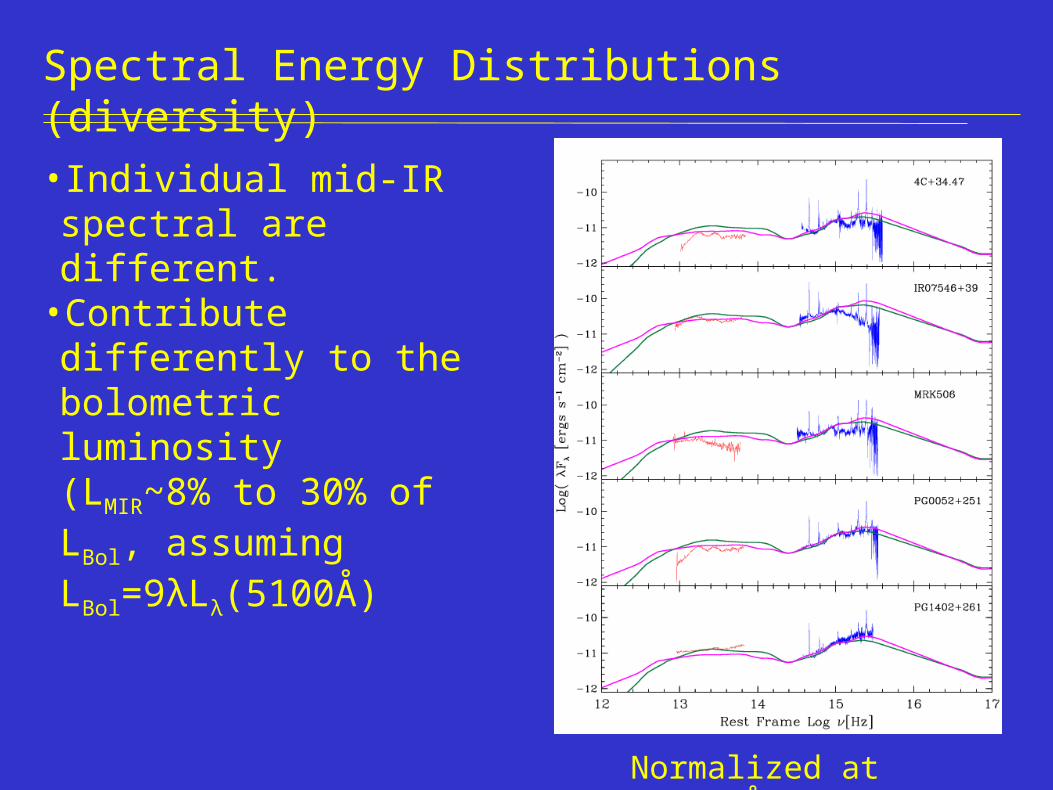
Spectral Energy Distributions (diversity)
Normalized at 5600 Å
Normalized at 8 µm
• Individual mid-IR spectral are different.
•Contribute differently to the bolometric luminosity(LMIR~8% to 30% of LBol, assuming LBol=9λLλ(5100Å)
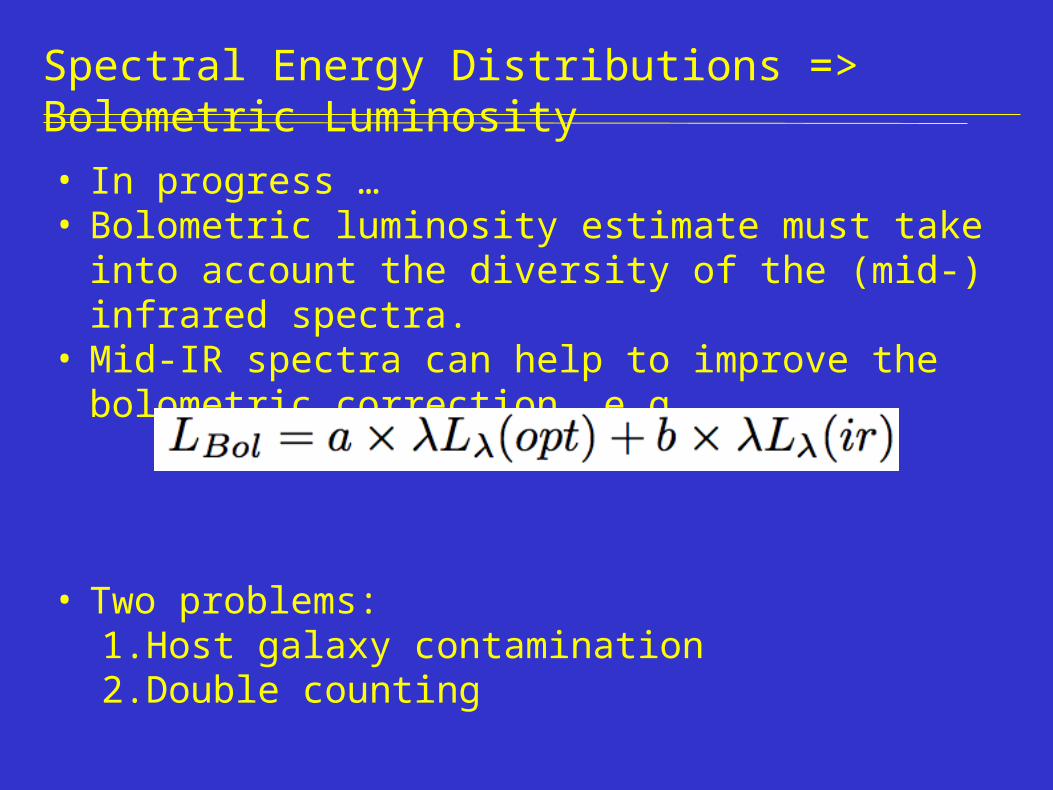
Spectral Energy Distributions => Bolometric Luminosity
• In progress …• Bolometric luminosity estimate must take into account the
diversity of the (mid-) infrared spectra.• Mid-IR spectra can help to improve the bolometric
correction, e.g.,
• Two problems:1. Host galaxy contamination2. Double counting
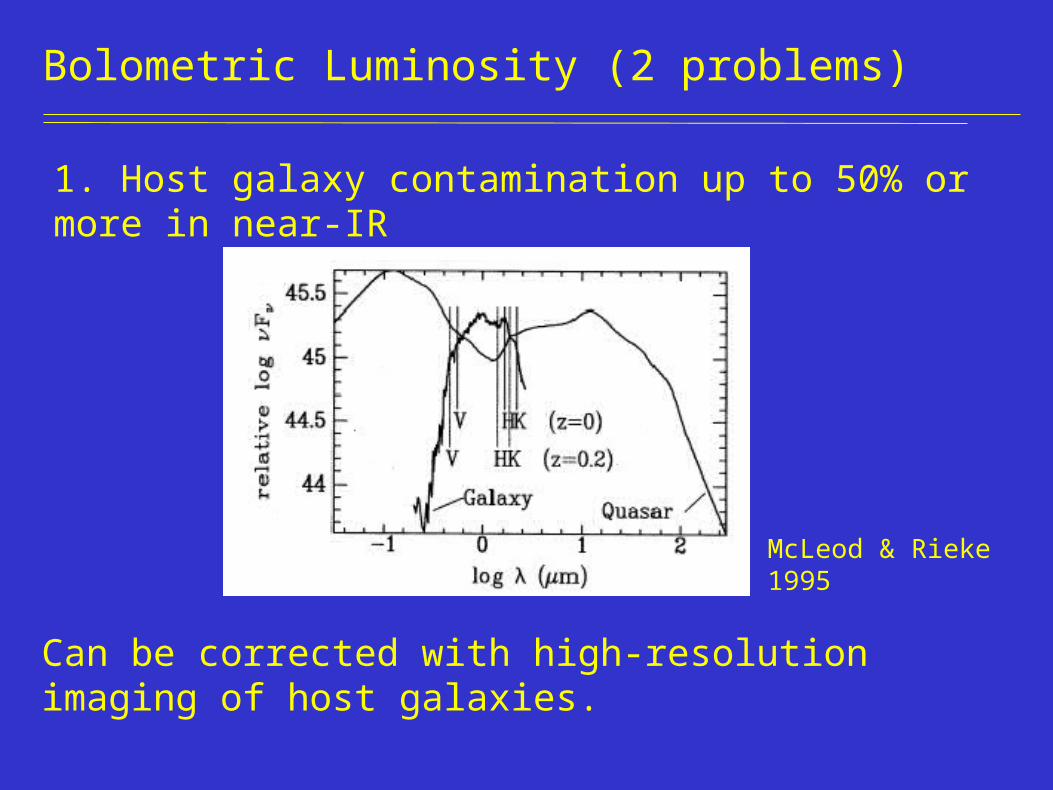
Bolometric Luminosity (2 problems)
1. Host galaxy contamination up to 50% or more in near-IR
Can be corrected with high-resolution imaging of host galaxies.
McLeod & Rieke 1995
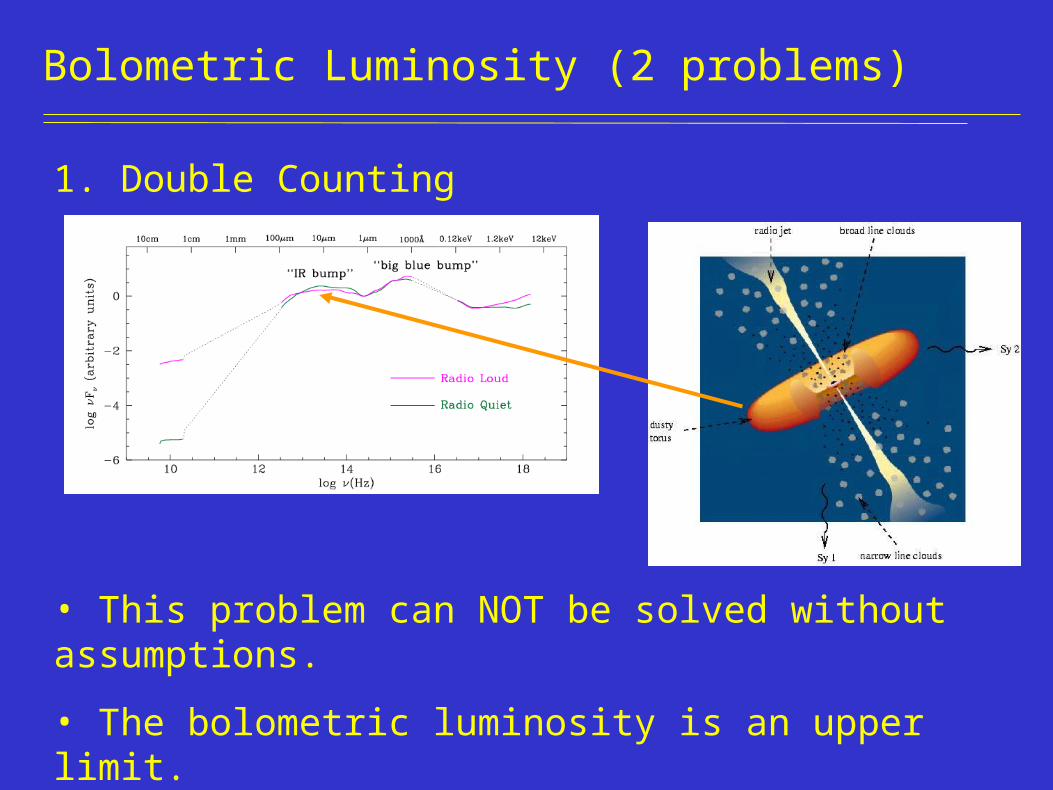
Bolometric Luminosity (2 problems)
1. Double Counting
• This problem can NOT be solved without assumptions.
• The bolometric luminosity is an upper limit.
Conclusions
• Quasar SEDs, bolometric luminosity and bolometric corrections are important.
• It is hard to do.
• We must do it.
Thank you !

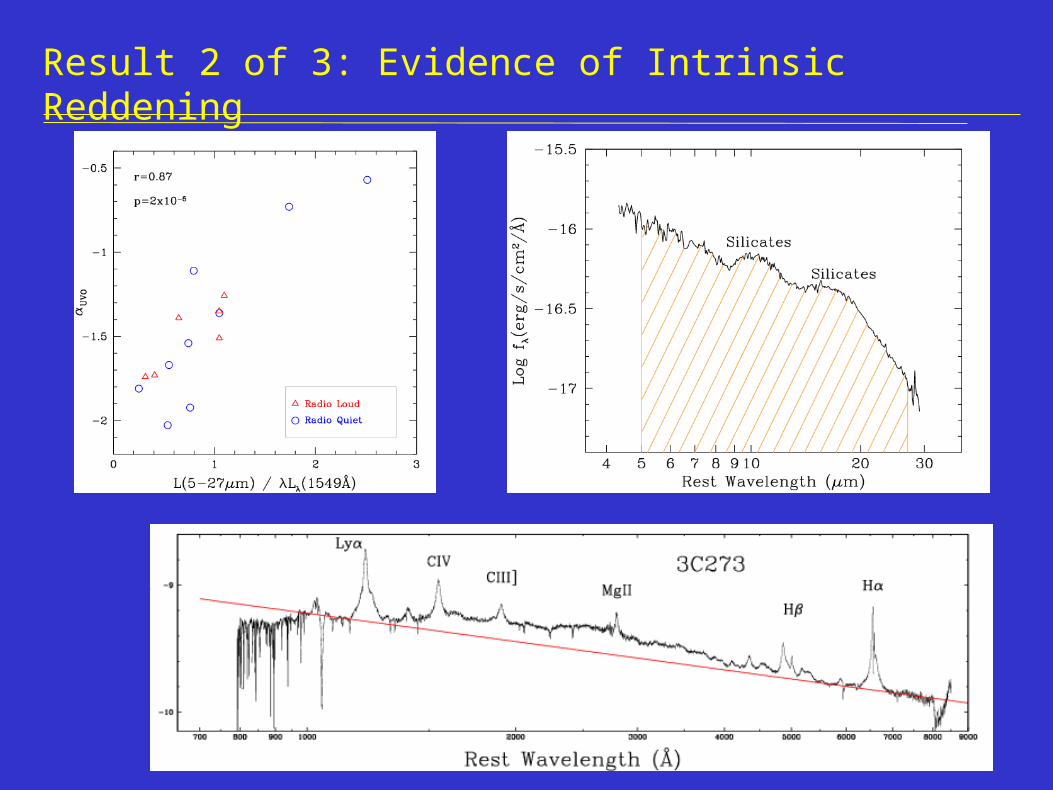
Result 2 of 3: Evidence of Intrinsic Reddening
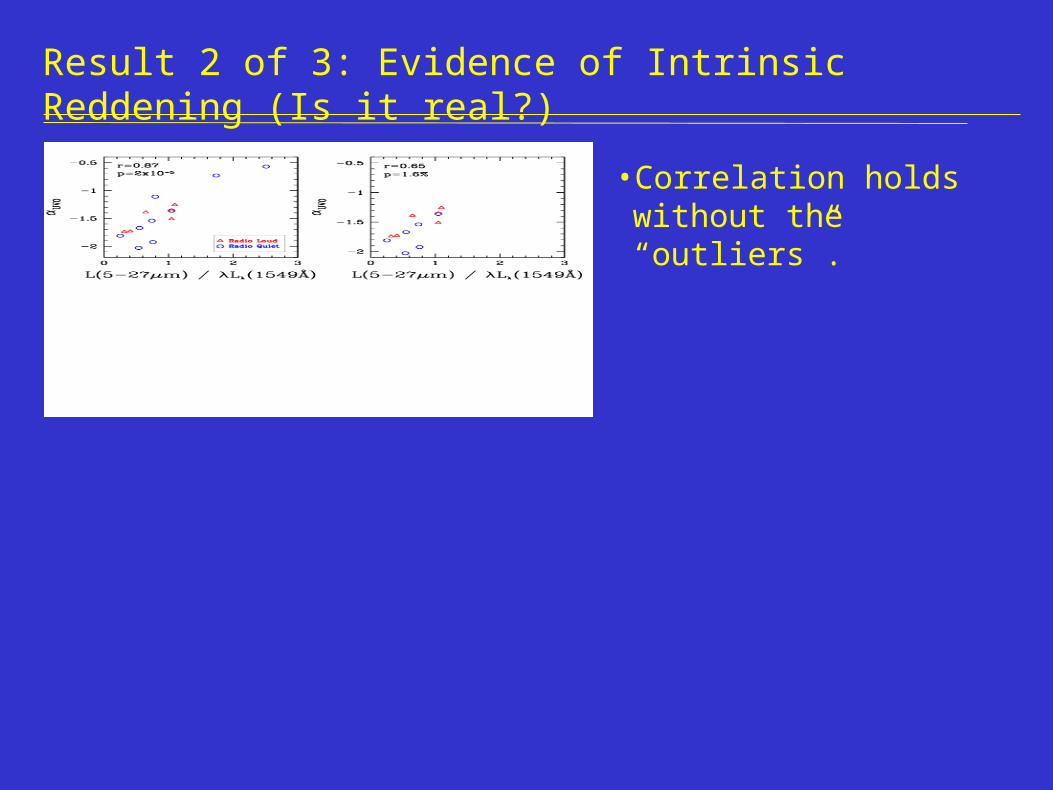
Result 2 of 3: Evidence of Intrinsic Reddening (Is it real?)
• Correlation holds without the “outliers”.
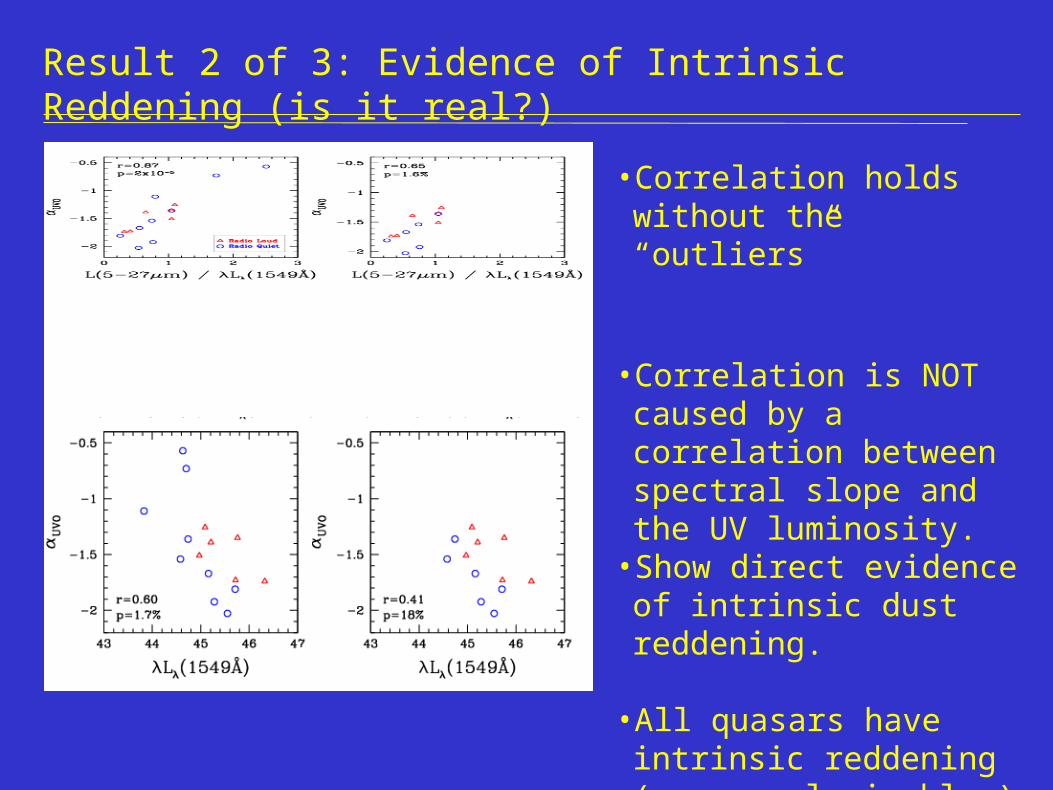
Result 2 of 3: Evidence of Intrinsic Reddening (is it real?)
• Correlation holds without the “outliers”
• Correlation is NOT caused by a correlation between spectral slope and the UV luminosity.
• Show direct evidence of intrinsic dust reddening.
• All quasars have intrinsic reddening (our sample is blue).
• Mid-IR + UV-optical info could lead to good estimate of intrinsic reddening.
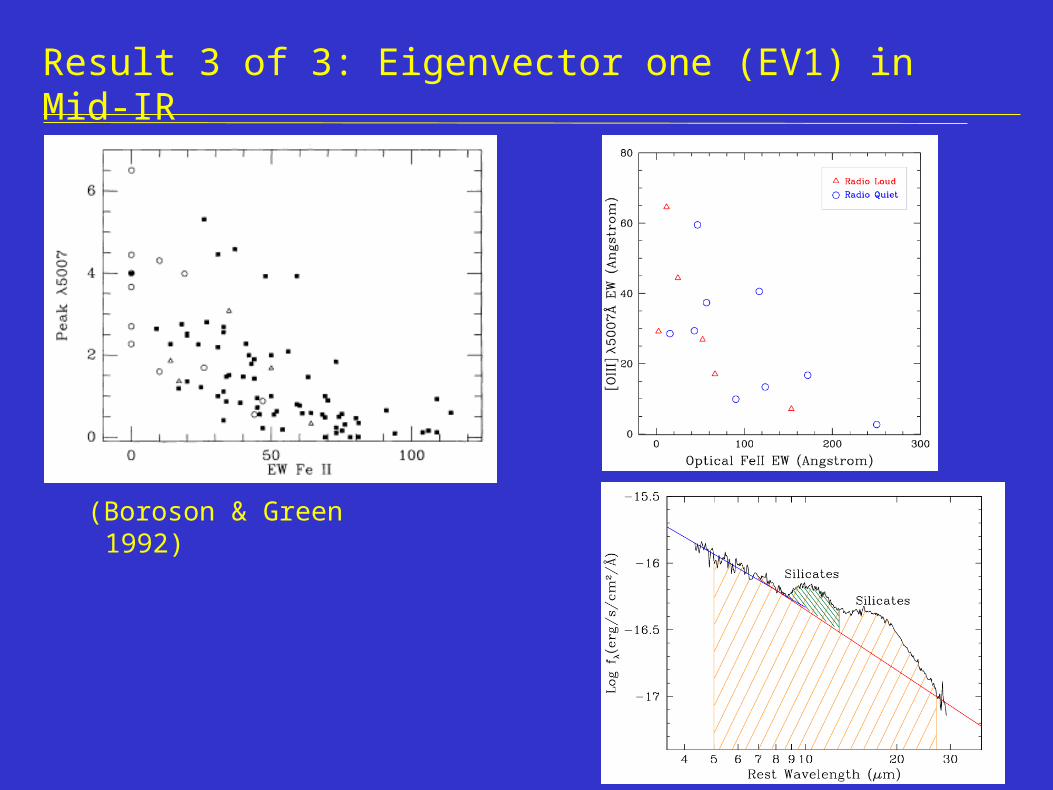
Result 3 of 3: Eigenvector one (EV1) in Mid-IR
(Boroson & Green 1992)
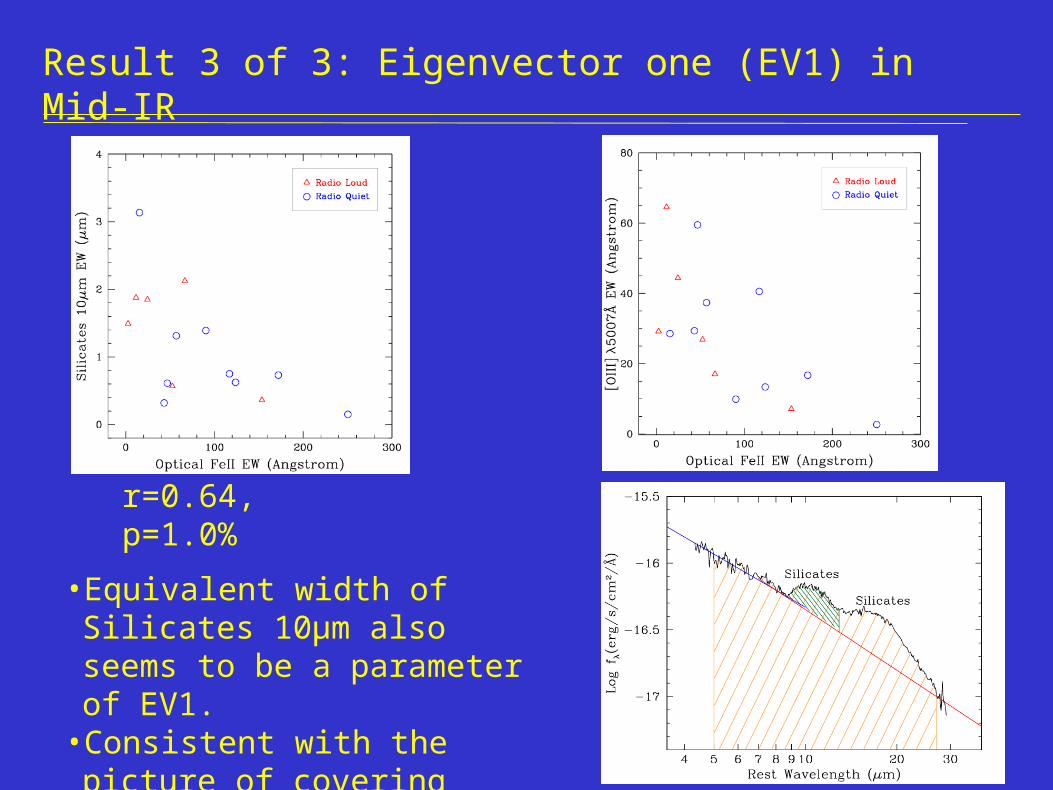
Result 3 of 3: Eigenvector one (EV1) in Mid-IR
• Equivalent width of Silicates 10µm also seems to be a parameter of EV1.
• Consistent with the picture of covering factor.
r=0.64, p=1.0%

Summary
• We constructed the UV-optical and mid-IR composite spectra of low-redshift broad-line (type I) quasars from a sub-sample.
• Unlike borad-band SEDs, the composites show detailed mid-IR features.• Mid-IR spectra needs to be considered in estimating a better bolometric
luminosity.
• All quasars seem to have intrinsic dust reddening.• Mid-IR and UV-optical information may be used to estimate the intrinsic
reddening.
• Silicates 10µm feature is a parameter in the Eigenvector 1 relationships.• This agrees with the UV-optical results.