Modern Dry Bulk Terminal Design - Beltcon · MODERN DRY BULK TERMINAL DESIGN G. Lodewijks, D.L....
18
Copyright is vested with IMHC 1 MODERN DRY BULK TERMINAL DESIGN G. Lodewijks, D.L. Schott, J.A. Ottjes SUMMARY Due to the high demand for energy and mineral resources many dry bulk terminals around the world are expanding and seriously increasing their capacity. One approach to expansion can simply be copying the existing facilities until the required capacity is reached. In this way however the terminal does not only loose the opportunity to utilize the developments made over the last decades on terminal design, it will also end up with a costly operation. In addition it may not be able to reach the environmental restrictions imposed on terminal operations nearby environmentally sensitive areas. This paper discusses a modern design approach of dry bulk terminals. It starts with the description of a typical dry bulk terminal. It further discusses the application of discrete event simulation as a tool to determine the best operational control of the terminal and the required number of equipment and their capacity related to the requested service level for the terminals customers. It finally discusses new approaches to terminal maintenance, dust and sound emission control methods. 1. INTRODUCTION – A TYPICAL BULK TERMINAL Dry bulk terminals are used worldwide as a buffer between either international or intercontinental transportation and inland or domestic transportation or the other way around. An example of a dry bulk terminal is shown in Figure 1. This figure shows the iron ore exporting terminal of the port of Chennai (previously called Madras) in India. Figure 2 schematically shows the lay-out of that terminal. The port was first commissioned in 1977 [1]. The plant is capable of receiving, stockpiling, reclaiming, weighing, sampling and shiploading 8 million of iron ore per annum. Bulk carriers of sizes 150,000 DWT can be loaded at a rate of 8,000 MTPH. The ore stock yard has a capacity of about 800,000 tons and can cater 4 different grades of iron ore. The ore handling facilities consist of receiving lines and shipping lines. In the receiving lines there are two rotary wagon tipplers (Tippler 1&2), four belt conveyors (C1, C2, C3, & C4), and two rail mounted stackers (ST1 & ST2).
Transcript of Modern Dry Bulk Terminal Design - Beltcon · MODERN DRY BULK TERMINAL DESIGN G. Lodewijks, D.L....

Copyright is vested with IMHC 1
MODERN DRY BULK TERMINAL DESIGN G. Lodewijks, D.L. Schott, J.A. Ottjes
SUMMARY Due to the high demand for energy and mineral resources many dry bulk terminals around the world are expanding and seriously increasing their capacity. One approach to expansion can simply be copying the existing facilities until the required capacity is reached. In this way however the terminal does not only loose the opportunity to utilize the developments made over the last decades on terminal design, it will also end up with a costly operation. In addition it may not be able to reach the environmental restrictions imposed on terminal operations nearby environmentally sensitive areas. This paper discusses a modern design approach of dry bulk terminals. It starts with the description of a typical dry bulk terminal. It further discusses the application of discrete event simulation as a tool to determine the best operational control of the terminal and the required number of equipment and their capacity related to the requested service level for the terminals customers. It finally discusses new approaches to terminal maintenance, dust and sound emission control methods. 1. INTRODUCTION – A TYPICAL BULK TERMINAL Dry bulk terminals are used worldwide as a buffer between either international or intercontinental transportation and inland or domestic transportation or the other way around. An example of a dry bulk terminal is shown in Figure 1. This figure shows the iron ore exporting terminal of the port of Chennai (previously called Madras) in India. Figure 2 schematically shows the lay-out of that terminal. The port was first commissioned in 1977 [1]. The plant is capable of receiving, stockpiling, reclaiming, weighing, sampling and shiploading 8 million of iron ore per annum. Bulk carriers of sizes 150,000 DWT can be loaded at a rate of 8,000 MTPH. The ore stock yard has a capacity of about 800,000 tons and can cater 4 different grades of iron ore. The ore handling facilities consist of receiving lines and shipping lines. In the receiving lines there are two rotary wagon tipplers (Tippler 1&2), four belt conveyors (C1, C2, C3, & C4), and two rail mounted stackers (ST1 & ST2).

.
Copyright is vested with IMHC 2
Figure 1: Arial view of the iron ore exporting terminal in the port of Chennai, India.
Figure 2: Lay-out of the iron ore exporting terminal in the port of Chennai, India.

.
Copyright is vested with IMHC 3
The shipping line comprises two rail mounted bucket wheel reclaimers (RE1 & RE2), six belt conveyors (S1, S2, S3, S4, S5, & S6), and two rail mounted shiploaders (SL1 & SL2). The conveyors and equipment in both the receiving and shipping lines are grouped to form two streams, which are capable of functioning independent of each other as interconnected systems. It is not possible to by-pass the stockyard. The rotary wagon tipplers have a capacity of 2,000 MTPH each. They tipple a maximum of 40 wagons each carrying about 100 tons (wagon plus ore) per hour. One tippling cycle takes about 90 seconds, including 17 seconds to tipple a wagon and 20 seconds to put the wagons back to their normal position. During each tippling cycle each tippler can empty one wagon. The receiving conveyors (R1 – R4) all have a capacity of 2,000 MTPH running at 2.2 m/s. Belt conveyor R1 can unload on both conveyor R3 as well as on belt conveyor R4. A similar arrangement is available for conveyor R2 to feed R3 or R4 if necessary. The belt width is 1,200 mm for all conveyors, the trough angle 35 degrees. The conveyors connecting the tipplers with the yard conveyors (R1 & R2) have a length of 150 m. The yard conveyors (R3 & R4) have a length of about 545 m. The stackers also have a capacity of 2,000 MTPH. The length of the stockyard travel is about 440 m. With a boom of 35 m the stackers can stack at both sides. The minimum stacking discharge height is 2.5 m, the maximum 13.5 m. The speed of the stacking belt is 3.3 m/s. Like the receiving yard belts the belt conveyor in the stacker has a belt width of 1,200 mm and a trough angle of 35 degrees. The reclaimers have a capacity of 4,000 MTPH. The belt conveyor in the stackers also have a capacity of 4,000 MTPH and utilize a 1,400 mm wide belt running at 2.6 m/s with a trough angle of 35 degrees. With a 31 m boom the reclaimers can operate on both sides of the shipping conveyors. The bucket wheel, each containing 8 buckets with a volume of 920 liters, operates at a slewing speed of 30.5 m/min with a minimum reclaiming height of - 1.5 m and a maximum of 9 m. Also see Figure 3. The shipping conveyors (S1-S6) all have a capacity of 4,000 MTPH and are running at 4.0 m/s. The belt width and trough angles are 1,200 mm and 35 degrees respectively. The yard conveyors have a length of about 530 m, the cross conveyors (S3 & S4) have a length of about 155 m and the wharf conveyors (S5 & S6) have a length of about 300 m. Both conveyor S1 and S2 can discharge on conveyor S3 or S4. Conveyors S3 and S4 can discharge both onto conveyors S5 or S6, allowing both shipping lines to serve either shiploader. The shiploaders, see Figure 4, are both of the rail mounted traversing portal type and have a capacity of 4,000 MTPH. They can operate both on the same ship if the ship‟s dewatering facilities permit. The traveling distance on the quay is 200 meters and the boom has a length of 25 meters allowing the shiploaders to operate between 21.9 and 12.1 meters from the tender face. The longitudinal traveling speed varies between the 5 and 20.5 m/min. The shuttle conveyor finally has a width of 1524 mm and a belt speed of 3.3 m/s with a trough
angle of 35 degrees.

.
Copyright is vested with IMHC 4
Figure 3: Stacker ST1 (left hand side) and reclaimer RE1 (right hand side).
Figure 4: Shiploader 1 and 2 loading vessel AOYAMA.
The iron ore handling facility of the port of Chennai, India can be characterized by the following, when compared to other terminal around the world:
- There is no by-pass option. Some terminals have bypass facilities whereby the dry bulk can be transported directly from the incoming side (here the train side) to the outgoing side (here the exporting vessels). This not only physically not possible (no bypass conveyors) also the capacities of the incoming and outgoing side are not matched.
- According to the harbor records it takes about 40 hours to load a 150,000 DWT vessel. In theory loading a 150,000 DWT vessel can take less than 20 hours if the maximum shiploader and shipping belt conveyor capacity is reached. Due to operational issues the average capacity in this case is about 46% of the maximum capacity. This is typical for iron ore handling bulk terminals. Worldwide the average

.
Copyright is vested with IMHC 5
capacity of shiploading equipment varies between 40% and 55%. This is not only due to operational/maintenance problems. The average capacity is calculated with respect to the total time a shiploader is available. In general it can be said that the utilization percentage of dry bulk handling equipment normally is less than 50%, where the operational availability is normally around the 80%.
- The terminal uses separate shiploaders and separate reclaimers. Other terminals show only combined stacker/reclaimers or a combination of both separate and combined. The choice for either separate machines or combined machines obviously affects the reliability and accessibility of the stock yard.
- The terminal does only use one-way belt conveyors. Comparison between the availability of one-way versus two way conveyors shows that the availability of one way conveyors is significantly higher than that of two way conveyors. The same holds for conveyors using a fixed head pulley versus conveyors using a movable head. The reliability of the first is significantly higher than the reliability of the latter. In general it can be said that the more mechanical components a piece of equipment contains the lower its availability is.

.
Copyright is vested with IMHC 6
2. TERMINAL EXPANSION OR REDESIGN In the previous section the iron ore exporting terminal in Chennai was used as a typical example of a dry bulk terminal. If that terminal had to be designed today, would the design have been different? Alternatively, if the terminal decides to expand, would they keep the same design or would they adopt a different design philosophy? These questions are not so easy to answer. In this section some of the design considerations will be discussed. One of the most important design considerations is trying to increase the utilization of the terminal equipment. Where today utilizations of about 40% to 50% seem to be quite normal as mentioned in the previous section, this obviously means that all the machines have a much higher capacity than required if better utilization is possible. This significantly increases the costs of the terminal equipment. Another design aspect is the amount of storage area used by the terminal. Where in the industry a possible stock of about 10% of the annual throughput seems to be accepted, as is also the case with the terminal discussed in the previous section, this obviously costs square meters in an area where square meters are scarce and therefore expensive. Previous studies have shown that a significant reduction is possible, sometimes even to 3% to 4% of the annual throughput. The key-factor here is the number of products (different grades and sizes) stored on the terminal. In general it can be said that the more products a terminal handles the more storage area it needs. Another aspect here is whether the terminal can decide where to store products or that a third party, a mine for example, determines storage positions for specific products. In general it can be said that the less influence a terminal has over the storage locations the more storage area they need. This is even more so if not one but more third parties decide on where to store what.
Figure 5: Alternative terminal design option 1 with bypass option through the stackers.
The two above aspects can hardly be affected by the physical terminal design. Although the number of products does determine the number of required routes to different areas of the terminal, to ensure that each area is assessable from all input and output locations, the logistic control of the terminal and its maintenance in this case determine its success. The same holds for increasing the utilization of the terminal machines. Also in that case the logistic control of the terminal drives its success. To determine whether the foreseen logistic
.
Copyright is vested with IMHC 7
control of the terminal leads to the expected results or not discrete event simulation can be used as a design tool. This will be discussed in the next section. Previous studies have shown that changing the logistic control of a terminal (excluding arrival times of vessels and trains) increases the utilization of the terminal machines from 40%/50% to 80%/85%. This means that machines can have half the capacity. Even though the logistic control is the driving factor in the success of a terminal in terms of optimizing the use of land and machines, the physical design of the lay-out also plays an important role. This will be discussed by looking at three alternatives to the lay-out shown in Figure 2. It should be noted that the designs considered here are not considered by the port of Chennai. They are just shown for discussion purposes. One of the characteristics of the Chennai terminal mentioned in the previous section is the absence of by-pass options. In other words, it is not possible to transport iron ore straight from the tipplers to the shiploaders. This means that the incoming stream and the outgoing stream of bulk material are decoupled. By-passing is an aspect that many terminals consider in an attempt to reduce the required storage area and to increase utilization of their equipment. Although the success of the by-pass option entirely depends on the possibilities the terminal management has to control and synchronize the incoming stream of bulk and the outgoing stream of bulk, if the terminal does not have physical by-pass options then it can not be implemented. Figure 5 shows basically the same terminal lay-out as shown in Figure 2 but with a by-pass option through the stackers. With this feature sixteen by-pass routes are created: R1-R3-S3-S5, R1-R3-S3-S6, R1-R3-S4-S5, R1-R3-S4-S6, R1-R4-S3-S5, R1-R4-S3-S6, R1-R4-S4-S5, R1-R4-S4-S6, R2-R3-S3-S5, R2-R3-S3-S6, R2-R3-S4-S5, R2-R3-S4-S6, R2-R4-S3-S5, R2-R4-S3-S6, R2-R4-S4-S5, R2-R4-S4-S6. For this specific terminal it is not possible to load a vessel at a rate of 8,000 MTPH by-passing the stockyard since the tipplers only have a capacity of 2,000 MTPH each. This shows that balancing the incoming stream and the outgoing stream in terms of capacity is required to optimize the by-pass option effectively. If a vessel on this terminal needs to be loaded with 4,000 MTPH then two by-pass routes have to be used simultaneously and both shiploaders will only operate at 50% of there rated capacity. In practice it can be said that the more products a terminal has the more difficult by-passing will be. Typically by-pass percentages in terms of annual throughput are less than 5% where terminals normally would like to go up to about 20%. Another design decision that has to be made is whether to go for single purpose machines on the stockyard (stackers and separate reclaimers like used in Chennai) or to use combined machines (stacker/reclaimers). Although this decision seems an easy one, since one combined machine is cheaper than two separate machines; it also has some operational implications that should be considered carefully. If in the original design for example stacker ST1 is malfunctioning, then reclaimer RE1 can still be used to reclaim material on the west side of the terminal. This is not the case in the alternative design shown in Figure 6. This off course can be solved by using more combined machines, either by doubling the routes and put two more stacker/reclaimers in or by putting in a third between the two shown, but this has a cost implication and may be a more expensive solution. If a specific area can be stacked or reclaimed by more than one machine then this area has machine redundancy. In general it can be said the more products a terminal handles the more important machine redundancy is. In practice it should be ensured that parts of the terminal that store the most important products, in terms of throughput, have machine redundancy. Whether the whole terminal requires machine redundancy or not depends on the logistic lay-out of the terminal and the options terminal management has to control this. In general it can be said that if the incoming stream of the terminal and the outgoing stream are decoupled then machine redundancy becomes more of an issue since bypassing is not possible.

.
Copyright is vested with IMHC 8
Figure 6a&b: Alternative terminal design option 2 with combined stacker reclaimers and one-way belt conveyors (option 2a with multiple shared routes, option 2b with dedicated conveyor
routes). Finally, during the design stage it should be decided whether to use one-way conveyors, like shown in the previous designs, or to go for two-way conveyors like shown in the lay-out shown in Figure 7. In general it can be said that bi-way conveyors show a lower availability than one-way conveyors due to the fact that they are more complex (more mechanical components, tracking of the belt becomes more of an issue). Also the transfer points have to be designed more carefully due to the fact that more transfers have to be installed in a certain area. One advantage of using bi-way conveyors is that the total length of the conveyors on the terminal is less compared to the case when only one-way conveyors are used in cases where by-passing is possible. Both the alternative lay-outs shown in the Figures 6 and 7 show an option a) where routes are shared between conveyors and an option b) where dedicated routes are used. In general shared routes are recommended unless there is a specific reason to use dedicated routes.
Figure 7a&b: Alternative terminal design option 3 with combined stacker reclaimers and bi-way belt conveyors (option 2a with multiple shared routes, option 2b with dedicated conveyor
routes).

.
Copyright is vested with IMHC 9
3. DISCRETE EVENT SIMULATION AS A MODERN DESIGN TOOL As stated in the previous section proper logistic control of a terminal is essential to ensure its optimization in terms of utilization of equipment and land. To study the effect of different control philosophies discrete event simulation can be used as a modern design tool. This section will describe an example of using discrete event simulation to design a coal terminal. Here the focus is on sea transportation and defining customer service in terms of waiting time of ships that collect the product, in this case coal. Conveyor systems in the dry bulk material handling industry consist of serial and parallel connections of equipment. Equipment may be mining equipment, belt conveyors, train load-out stations, tipplers, stacking and reclaiming equipment and (ship) loading equipment. Some stages in the transportation chain are uncoupled by a stockpile or redundantly implemented. Besides redundancy, another reason for a decoupling conveyor system often is the difference in system dynamics [2]. The overall reliability of a dry bulk handling system is composed of the individual reliabilities of all equipment. Reliability is defined as the average percentage of time the material flow is guaranteed. System reliability determines the service rate that can be offered to customers. Customers in this case are buyers of the minerals quarried in the mine. They collect the product by train or ship. In some cases the customer is a power plant that is directly connected to the mine. Apart from the characteristics of the loading system, the arrival pattern of ships plays an important role as well. Statistical analysis of such a system is intractable. Simulation offers a flexible way of analyzing complex systems. A model was presented in [3]. In this paper a case will be worked out to illustrate the use of the model. The model has been used in practice already for design and tender purposes. The case itself and the data used are fictitious. In the case the focus is on the determination of the stockpile size and on the effect of the system‟s reliability on ship waiting times. 3.1 CASE DESCRIPTION An inland coal mine is connected to a ship loading facility by means of a conveyor system. Figure 8 shows a schematic drawing of the terminal system. The material flow can be directed either to a stockpile via a stacker system or can be bypassed for direct loading into a ship. Stacking is done if there is no ship available or if the downstream line is blocked by disturbances of the downstream equipment. A reclaimer may add its reclaim flow to the load flow as long as there is a ship to be loaded, as long as the stockpile is not empty, and as long as the combined flow does not exceed the capacity of the ship loader. The load flow is further directed via a jetty conveyor to a ship loader.
Figure 8a&b: Lay-out of the considered terminal (left hand side) and a similar jetty in use at the Kaltim Prima Coal mine in Indonesia (right hand side). T he overland and jetty conveyors usually are several

.
Copyright is vested with IMHC 10
kilometers in length. The dotted conveyor in the figure denotes a redundancy or by-pass conveyor. This conveyor was not modeled.
3.2 DESIGN ISSUES In this section the global design process using the model discussed in [3] will be discussed. The role of equipment reliability is essential in this example. It is assumed that the availability is only approximately known because the system is intended to function in a hostile ambient environment with a lack of skilled maintenance personnel. In a real case the design process would start with an expert estimate of the availability and operation of each piece of equipment.
The equipment work-down cycle time tc is defined as
)(daysttt dwc
in which tw depicts the average undisturbed working time and td the average down time in one cycle. I t is assumed that down time occurrences of the equipment are independent within the system boundaries. Table 1 shows a fictitious model input with definitions of the distributions of working periods of each system component. or the stacker for example, it means that the undisturbed working periods are normally distributed with an average of 20 days and a standard deviation of 5 days. After a working period a down period follows. The average length of this period (td) depends on the availability and the average undisturbed working period. The relationship is given in the next equation.
)()1100
( daysa
tt wd
where a represents the availability. The availability data shown in Table 1 is used and for all equipment a negative exponential distribution with average 21 days for the working time period.
Table 1: Typical model input for capacity and availability of system components.
Equipment name Capacity MTPH
Availability %
Work Time Distribution (days)
Overland conveyor 1,200 97 Exponential(14)
StockPile Conveyor 1,200 97 Exponential(21)
Jetty Conveyor 3,600 97 Exponential(21)
Shiploader 3,600 97 Uniform(1,5)
Stacker 1,200 90 Normal(20,5)
Reclaimer 2,400 85 Table(2,0,6,70,45,100)
The down time is taken to be uniformly distributed between 0.5 td and 1.5 td. This configuration is called “reference case”. Planned overhaul is not included in the analyses. Improving maintenance however may be a means to improve system performance. Prior to the system analysis the standard run length is determined. To that end a number of runs have been performed with the reference input but different random streams for the distributions used. I t appears that with a run length of 10 years the standard deviation with respect to the average ship waiting times amounts to 5%. The standard run length is set to 10 years.

.
Copyright is vested with IMHC 11
Entries 1576 90% Quantile 100.3Mean 36.5 Std.Deviation 45.1
0
10
20
30
40
50
0 100 200 300
Waiting Time(h)
%
Entries 8759 90% Quantile 283.3 Mean 177.7 Std.Deviation 82.2
0
5
10
15
20
25
30
35
0 100 200 300
Contents (kTon)
%
Figure 9a: Distribution of Ship Waiting Times. Reference Run with Stock Pile Capacity of
350,000 ton.
Figure 9b: Distribution of Stock Pile Contents. Reference Run with Stock Pile
Capacity of 350,000 ton.
The individual runs with the model provide distributions of ship waiting times and stock pile contents. Figures 9a and 9b show examples of that. These statistical data are used to further carry out the analysis. First the order of magnitude of the required stockpile capacity is to be determined. This is done by measuring the ship-waiting times under variation of the stockpile capacity. The results are shown in Figure 10. Both the average ship-waiting times are plotted and the 90% percentiles of the waiting times. A certain point on the 90% percentile curve means that 90% of the waiting times were lower than the corresponding waiting time value. From this graph it was concluded that a ´safe´ stockpile capacity would be 700,000 Ton. Next the sensitivity of that choice for variations in the equipment availability is evaluated. By varying the equipment availability around the reference values in Table 1 in steps of 1%, Figure 11 is obtained. It shows the percentage of time the stockpile has been empty and consequently could not function well. It appears that the reference availability values have some margin of 1 % left.
0
24
48
72
96
120
144
168
192
216
0 200 400 600 800 1000
Stock Pile Capacity (kTon)
Waitin
g T
ime S
hip
s (
h)
Average
90% percentile
0
2
4
6
8
10
12
14
16
-5 -4 -3 -2 -1 0 1 2 3
% variation availability on reference case
% t
ime s
tock p
ile e
mpty
Figure 10: Ship-waiting times as a function of
the stockpile capacity. Figure 11: Percentage of time the stockpile
was empty as a function of varying equipment availability.

.
Copyright is vested with IMHC 12
0
24
48
72
96
120
144
168
192
-6 -4 -2 0 2 4 6
% variation of availability; reference case=0
Waitin
g T
ime S
hip
s (
h)
Average
90% Percentile
Figure 12: Ship-waiting times as a function of varying equipment availability.
Finally the influence of availability variations on the ships waiting times is determined. The results are given in Figure 12 showing that the average ship waiting time for the reference case will be about 36 hours. A demand on the customer service may be that the average waiting time of ship before loading should not exceed 36 hours If this demand for example would be 24 hours, a way to reduce the waiting times down to 24 hours is to improve the availability by improving maintenance, or to increase the capacity of the system components. Several other ways to find methods for tuning the system and improving the overall performance are possible but not further discussed in this paper. Some are:
Investigating the influence of each piece of equipment separately.
Determination of the influence of ship-arrival time deviations. One way of improvement could be the coordination of the ships-arrivals.
Varying the shape and parameters of the down-time distributions and down time distributions that are based on measurements and experience from practice.
4. NEW APPROACHES TO TERMINAL MAINTENANCE Besides the logistic control of a terminal as discussed in the sections 2 and 3, also the way the dry bulk material handling systems are maintained plays a crucial role in the operational availability of equipment. To gain some insight in the way maintenance is organized on a modern Western European dry bulk terminal and to determine the effect of maintenance on the operational performance of equipment, a study was performed at a Dutch dry bulk terminal. On the basis of hands-on experience on other terminals it is believed that the results of this study are worthwhile implementing to increase the operational availability of terminal equipment. Installed equipment on the terminal is being maintained by a mechanical engineering (ME) and an electrical engineering (EE) maintenance departments with a condition-based maintenance philosophy, in pursuit of the operational goal: to timely complete the handling of the bulk materials and to minimize the waiting and berthing times of bulk carriers and barges. The research question in this project was: what are possibilities for the terminal to further improve the maintenance behavior of the installed equipment on the iron ore terminal, which reduce the performance losses and maintenance costs? The research project started with identifying analysis techniques and setting up a framework for analyzing and improving the terminal‟s maintenance system and her performance. The maintenance system itself was structured and investigated on the basis of its main elements and business factors affecting maintenance. The analysis of the maintenance performance included the analysis of the maintenance behavior of all the equipment installed and a detailed root cause analysis on a stacker/reclaimer. The results of this analysis were used to formulate conclusions and recommendations for the terminal to further improve the maintenance behavior. The main findings with respect to the analysis of the terminal‟s maintenance system were:

.
Copyright is vested with IMHC 13
Different business factors are affecting the maintenance behavior of the equipment installed, including legislation, the use profile and the operation;
Both maintenance departments ME and EE lacks a performance indicator for system‟s operational reliability;
The work process „failure elimination‟ is organized in a fuzzy way. Sometimes it is uncertain with maintenance department is the „problem owner‟ to prevent failures.
The main findings with respect to the analysis of the maintenance behavior on the basis of the maintenance workload and the maintenance related performance losses, were:
With respect to the structuring of the maintenance behavior of equipment, the evaluation and analysis is limited by the set-up of the ERP registration software used;
The maintenance behavior of the grap shipunloaders is relatively unfavorable, followed by the stacker/reclaimers, the barge loaders and the belt conveyors respectively;
The total share of the corrective maintenance in proportion to the total workload of the terminal maintenance workload is 26%.
With respect to improving the maintenance behavior, the main findings and other analysis results indicate that the maintenance system has not been fully optimized. Secondly, the nature of the imperfections and the dimensions of the corrective maintenance workload indicate that part of the performance losses and the maintenance cost can be avoided. The main recommendations for the terminal on improving the maintenance behavior of the equipment installed are:
Explicitly include the work process failure elimination in the terminal‟s internal quality handbook. In this way it becomes clear: who is the „process owner‟, which personnel will be involved and what is the relevant information supply.
Consider centralizing the „problem owner‟ with respect to the reliability and availability of the equipment installed;
Centralize the responsibility of the administration of maintenance programs and create reference books.
Add the operational reliability as a performance indicator for both maintenance departments; secondly, improve the value of standards in using performance indicators by periodically reporting and timely evaluating them.
Perform and repeat root cause analyses;
Consider ERP registration software as a maintenance evaluation system, not as a maintenance registration system. Restructuring has to be focused on:
o Application of functionally oriented system classifications per equipment to allocate the work orders to subsystems;
o Application of an unambiguous work type classification in which distinction has been made in maintenance tasks and other mechanical activities, in preventive, condition-based and corrective maintenance;
o Application and completion of the maintenance cost classification wages, spares and outsourcing for all work orders, for creating the possibility of setting up a cost analysis.
Register failures by means of the causal failure chain of Smit [4]. 5. ENVIRONMENTAL ISSUES The social interest in the environmental impact of industrial facilities has shown a strong increase over the last years. The Rotterdam Port Authorities for example, have launched a Plan for the year 2020, in which is strived for a cleaner harbor. That means: less noise, cleaner water, better air quality, but also equality in environmental measures and preservation for the ports in Europe. This is not only regarding the better life environment but also to strengthen the competitive position of regions and countries. An example of the influence of imperative legislations in the Netherlands is the idling of a construction site in 2005. The reason for that was exceeding the reference values for fine dust concentration [5].

.
Copyright is vested with IMHC 14
Increasingly compelling legislation threatens the working conditions of important industries in countries. Furthermore, there is also an economical need for reducing the amount of fugitive material. The costs depend on:
the value of the cargo
the cleaning of the property, quay, jetty, ship and equipment
the measures taken to prevent dust and spillage
the additional wear and maintenance caused by spilled material Here, the environmental impact and ongoing research on three aspects will be discussed: areas: dust, spillage and noise. 5.1 Dust Dust emissions, see Figure 13, are a common problem in many forms of industry: dry bulk terminals, construction, agriculture, mining. In the foreseeable future the generation of dust will be hazardous for health, the environment as well as industry all over the world [6][7][8]. The result of progressive medical knowledge will lead to increasing legislations. The overall challenge is therefore to reduce dust emissions in among others bulk materials handling, also see Figure 14.
Figure 13: Dust emissions.

.
Copyright is vested with IMHC 15
Figure 14: Environmental protective measures at a Dutch bulk terminal.
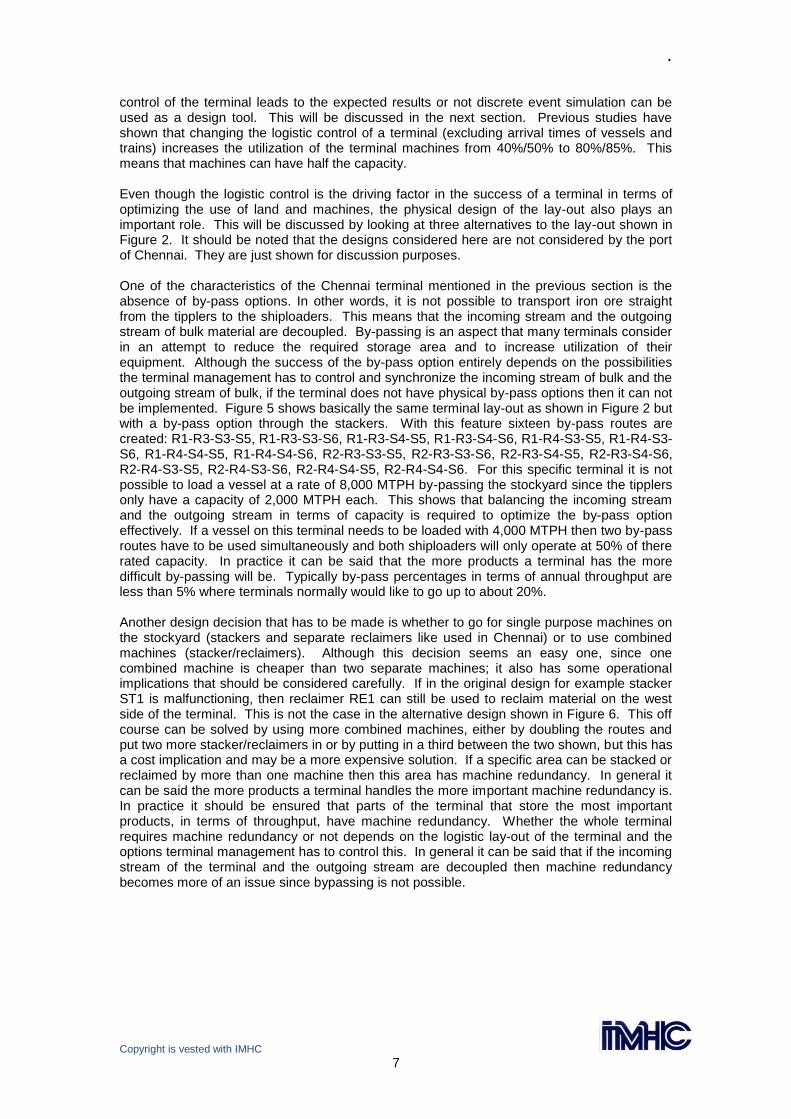
The increasing requirements in EU legislations for „dust free‟ operations results mostly in secondary measures, that means basically treatment of the symptoms. The challenge is to develop primary measures i.e. prevention of the generation of dust during handling of particulate materials. That can be done only under one condition: a validated tool that integrally takes into account the bulk material behavior and the dust generation both in interaction with the equipment. That makes it possible to develop new or adapted handling equipment where dust generation is taken into account explicitly. Furthermore, it becomes possible for both the industry and the legislator to evaluate existing equipment on „dust free performance‟. For the general public this means eventually that the environmental and health pressure will decrease. Understanding of dust production mechanisms will be beneficial for all other dust related research sectors and industry. It assists the development and improvement of mitigation and monitoring techniques, it will help health and safety as well as environmental authorities to produce more realistic and accurate guidelines and standards. In addition, it will facilitate industries to implement a dust assessment plan that fits to their particular characteristics. One common way to reduce the amount of dusts generated by handling dry bulk is by adding water to it. Obviously the water content can not be too high since this will have a significant economic effect as one is not only shipping water but in some cases the bulk material needs to be dried as well before use. On some terminals a sophisticated air monitoring system is in operation that is used to control the amount of water sprayed on the bulk material. Figure 15 shows such an air quality monitoring system in use at Port Hedland iron ore exporting terminal in Australia.
.
Copyright is vested with IMHC 16
Figure 15: Air quality monitoring system in Port Hedland, Australia.
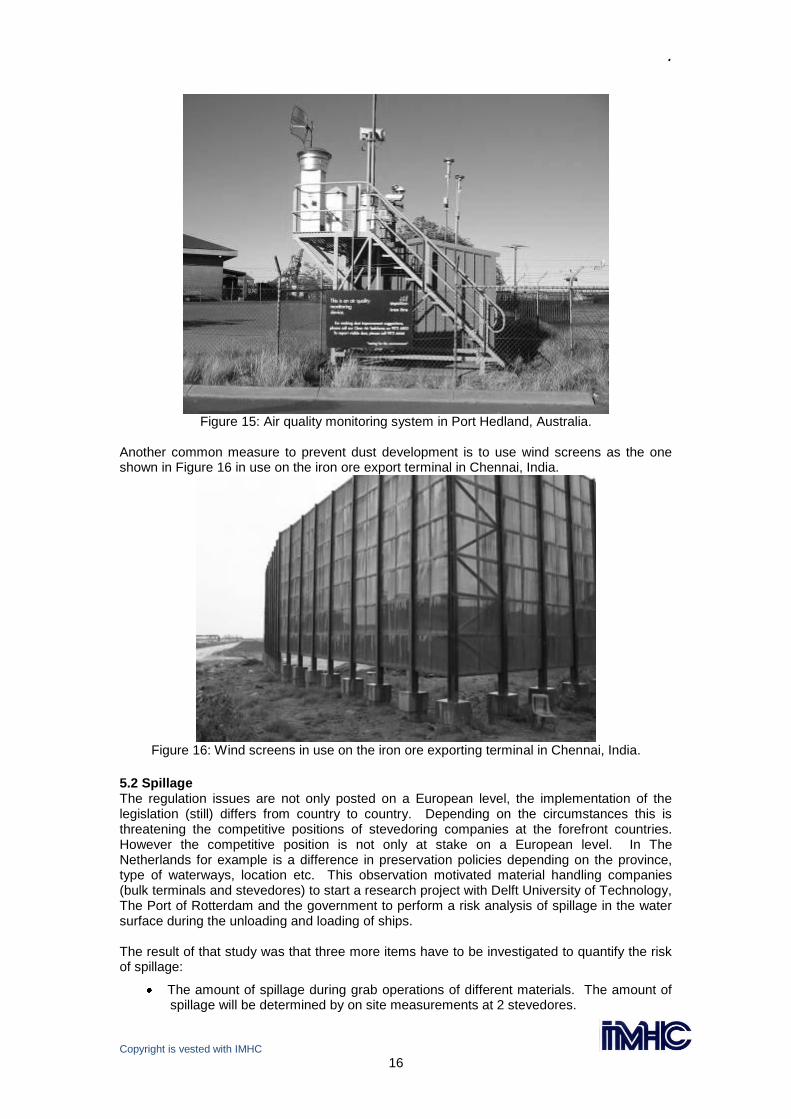
Another common measure to prevent dust development is to use wind screens as the one shown in Figure 16 in use on the iron ore export terminal in Chennai, India.
Figure 16: Wind screens in use on the iron ore exporting terminal in Chennai, India.
5.2 Spillage The regulation issues are not only posted on a European level, the implementation of the legislation (still) differs from country to country. Depending on the circumstances this is threatening the competitive positions of stevedoring companies at the forefront countries. However the competitive position is not only at stake on a European level. In The Netherlands for example is a difference in preservation policies depending on the province, type of waterways, location etc. This observation motivated material handling companies (bulk terminals and stevedores) to start a research project with Delft University of Technology, The Port of Rotterdam and the government to perform a risk analysis of spillage in the water surface during the unloading and loading of ships. The result of that study was that three more items have to be investigated to quantify the risk of spillage:
The amount of spillage during grab operations of different materials. The amount of spillage will be determined by on site measurements at 2 stevedores.

.
Copyright is vested with IMHC 17
The harmfulness of each bulk solid material for the surface water. A study will be performed to investigate the impact of e.g. a kilogram of coal on the chemical and ecological water quality. This is an extension of available information on the maximum allowed concentration of chemical elements in water.
The costs and the effectiveness of each measure. Also insight has to be gained in the costs and effectiveness of various measures that can be applied in theory. In addition also the influence of measures on the operational conditions should be kept in mind.
For designing terminals, choices on flexibility or multifunctionality have to be made. Often continuous loaders or unloaders are promoted because of their dust and spillage free operations. However, the applicability of continuous loaders or unloaders are depending on the material properties of the material, but as well on the flexibility required. Grabs are popular because they are energy-efficient, flexibility is high for floating or mobile cranes, and their efficiency is less dependent on material properties. The generated amount of spillage or dust depends on the material properties.
5.3 Noise Noise pollution will play a very important role as well in the near future. Having a clean environment should not be the only reason for taking environmental measures. Noise pollution for example is getting more critical as the urbanization comes closer and closer to the ports, due to the scarceness of land. On the other hand, protection of the personnel is important as well from a personnel point of view. The mechanical operations existing of systems and subsystems with moving parts might be noisy, especially when the equipment gets older and is worn out. The reduction of noise could is therefore closely related to the maintenance strategies. Finally, this means that choice of equipment is not only a matter of loading and unloading capacities, but also on the requirements for the terminal, the type of material and its surroundings. 6. CONCLUSIONS This paper focused on the design of modern dry bulk terminals. It discussed a number of aspects and showed the relevance to the design of modern dry bulk terminals:
- the physical lay-out of the terminal and their equipment selection, either for new terminals or upgraded terminals,
- the use of discrete event simulation as a design tool,
- the importance of a proper logistic control of the terminal,
- the relation between maintenance of a dry bulk material handling system, its operational performance and ways to improve the maintenance,
- the impact of environmental issues on the design and operation of dry bulk terminals, It is believed that the design process of new or upgraded modern dry bulk terminals should account for these aspects and therefore should be carried out by a multi-disciplinary team. This paper gave some practical guide lines for that purpose. 7. REFERENCES
[1] Mechanized ore handling plant Madras harbor, brochure Chennai Port Authorities.
[2] Lodewijks, G. (2001), “Two decades dynamics of belt conveyors”, Proceedings of the Beltcon 11 conference, Randburg, Republic of South Africa, 31 July – 2 August, 2001, pp.1-18.
[3] Lodewijks, G. and Ottjes, J.A. (2003), “Reliability of Large Scale Bulk Material Handling Systems”, Bulk Solids & Powder Science & Technology 1, pp. 9-17, ISSN 1613-4370.
[4] Smit, K. (1996), Het gebruik van onderhoudsbesturings-systemen – Mogelijkheden en werkelijkheid, Leiderdorp, Lansa Publishing.
[5] Brabants Dagblad, http://www.brabantsdagblad.nl/fijnstof/, 2005 (consulted: 21/04/2007).

.
Copyright is vested with IMHC 18
[6] Kunzli, N., Kaiser, R., Medina, S., Studnicka, M., Chanel, O., Filliger, P., Herry, Jr, M., Horak, F., Puybonnieux-Texier,V., Quenel, P., Schneider, J., Seethaler, R., Vergnaud, J-C. and Sommer, H. (2000), “Public-health impact of outdoor and traffic-related air pollution: a European assessment”, The Lancet 356, Issue 9232, pp 795-801.
[7] Trade Union Congress, Hazards at work – TUC guide to health and safety, United Kingdom, 2001
[8] Department of the Environment-Australian Government, Sustainable Minerals – Dust Control, Australia, 2005
[9] Wirth, S. (2006), “Theoretical and experimental noise examinations on the RopeCon conveyor systems”, Proceedings of the BulkEurope2006 conference, Barcelona, Spain, 16-17 October, 2006.
AUTHORS’ CV AND CONTACT DETAILS Gabriel Lodewijks is professor of transport engineering and logistics at the faculty of mechanical, maritime and materials engineering (3mE) of Delft University of Technology and head of the department of Marine and Transport Technology. He is further president of Conveyor Experts B.V. Address: Mekelweg 2, 2628 CD, Delft The Netherlands. E-mail: [email protected] or [email protected]. Dingena L. Schott is assistant professor in the transport engineering and logistics group at the faculty of mechanical, maritime and materials engineering (3mE) of Delft University of Technology. Address: Mekelweg 2, 2628 CD, Delft The Netherlands. E-mail: [email protected]. Jaap A. Ottjes is associated professor in the transport engineering and logistics group at the faculty of mechanical, maritime and materials engineering (3mE) of Delft University of Technology. Address: Mekelweg 2, 2628 CD, Delft The Netherlands. E-mail: [email protected].