MODELS FOR THERMO-MECHANICAL RELIABILITY TRADE-OFFS …
202
MODELS FOR THERMO-MECHANICAL RELIABILITY TRADE-OFFS FOR BALL GRID ARRAY AND FLIP CHIP PACKAGES IN EXTREME ENVIRONMENTS Except where reference is made to the work of others, the work described in this thesis is my own or was done in collaboration with my advisory committee. This thesis does not include proprietary or classified information. __________________________________________ Ganesh Hariharan Certificate of Approval: ____________________________ __________________________ Jeffrey C. Suhling Pradeep Lall, Chair Quina Distinguished Professor Thomas Walter Professor Mechanical Engineering Mechanical Engineering ___________________________ __________________________ Roy W. Knight Joe F. Pittman Assistant Professor Interim Dean Mechanical Engineering Graduate School
Transcript of MODELS FOR THERMO-MECHANICAL RELIABILITY TRADE-OFFS …

MODELS FOR THERMO-MECHANICAL RELIABILITY TRADE-OFFS FOR
BALL GRID ARRAY AND FLIP CHIP PACKAGES
IN EXTREME ENVIRONMENTS
Except where reference is made to the work of others, the work described in this thesis is
my own or was done in collaboration with my advisory committee. This thesis does not
include proprietary or classified information.
__________________________________________
Ganesh Hariharan
Certificate of Approval:
____________________________ __________________________
Jeffrey C. Suhling Pradeep Lall, Chair
Quina Distinguished Professor Thomas Walter Professor
Mechanical Engineering Mechanical Engineering
___________________________ __________________________
Roy W. Knight Joe F. Pittman
Assistant Professor Interim Dean
Mechanical Engineering Graduate School

MODELS FOR THERMO-MECHANICAL RELIABILITY TRADE-OFFS FOR
BALL GRID ARRAY AND FLIP CHIP PACKAGES
IN EXTREME ENVIRONMENTS
Ganesh Hariharan
A Thesis
Submitted to
the Graduate Faculty of
Auburn University
in Partial Fulfillment of the
Requirement for the
Degree of
Master of Science
Auburn, Alabama May 10, 2007

iii
MODELS FOR THERMO-MECHANICAL RELIABILITY TRADE-OFFS FOR
BALL GRID ARRAY AND FLIP CHIP PACKAGES
IN EXTREME ENVIRONMENTS
Ganesh Hariharan
Permission is granted to Auburn University to make copies of this thesis at its discretion, upon the request of individuals or institutions at their expense. The author reserves all
publication rights.
___________________________ Signature of Author
___________________________ Date of Graduation

iv
VITA
Ganesh Hariharan, son of Mr.Hariharan Mahadevan and Smt. Lakshmi.
Hariharan, was born on September 05, 1982, in Mumbai, Maharashtra, India. He
graduated in 2004 with a Bachelor of Engineering degree in Mechanical Engineering
from University Of Madras, Chennai, India. In the pursuit of enhancing his academic
qualification he joined the M.S. Program at Auburn University in the Department of
Mechanical Engineering in fall, 2004. Ever since he enrolled for the M.S. program at
Auburn University, he has worked for Center for Advanced Vehicle Electronics (CAVE)
as a Graduate Research Assistant in the area of harsh environment electronic packaging
reliability.

v
THESIS ABSTRACT
MODELS FOR THERMO-MECHANICAL RELIABILITY TRADE-OFFS FOR
BALL GRID ARRAY AND FLIP CHIP PACKAGES
IN EXTREME ENVIRONMENTS
Ganesh Hariharan
Master of Science, May 10, 2007 (B.E. Mechanical Engineering, University Of Madras, India, 2004)
Typed Pages 202
Directed by Pradeep Lall
In the current work, decision-support models for deployment of various ball grid
array devices and flip chip electronics under various harsh thermal environments have
been presented. The current work is targeted towards government contractors, OEMs, and
3rd party contract manufacturers who intend to select part architectures and board designs
based on specified mission requirements. In addition, the mathematical models presented
in this paper provide decision guidance for smart selection of BGA and Flip Chip
packaging technologies and for perturbing presently-deployed product designs for
minimal risk insertion of new materials and architectures. The models serve as an aid for
understanding the sensitivity of component reliability to geometry, package architecture,
material properties and board attributes to enable educated selection of appropriate device
formats.

vi
Modeling tools and techniques for assessment of component reliability in extreme
environments are scarce. Previous studies have focused on development of modeling
tools at sub-scale level. The tools are often available only in an offline manner for
decision support and risk assessment of advanced technology programs. There is need
for a turn key approach, for making trade-offs between geometry and materials and
quantitatively evaluating the impact on reliability. Application of BGA and Flip Chip
assemblies in benign office environments and wireless applications is not new, however
their reliability in extreme environments is still not very well understood.
Multiple linear regression, principal components regression and power law based
modeling methodologies have been used for developing prediction models that enables
higher-accuracy prediction of characteristic life by perturbing known accelerated-test
data-sets using models, using factors which quantify the sensitivity of reliability to
various design material, architecture and environmental parameters. The multiple linear
regression approach uses the potentially important variables from stepwise regression
methods, and the principal components regression uses the principal components
obtained from the eigen values and eigen vectors of correlation matrix for model
building. The power law modeling is a non regression based approach that uses the
method of maximum likelihood for developing power law relationship between
characteristic life and the package parameters. Convergence between statistical model
sensitivities and failure mechanics based model sensitivities has been demonstrated.
Predictions of sensitivities have also been validated against the experimental test data.

vii
ACKNOWLEDGEMENTS
The author would like to thank his advisor Dr. Pradeep Lall, Dr.Jeffrey .C.
Suhling and other committee members for their invaluable guidance and help during the
course of this study. The author acknowledges and extends gratitude for financial support
received from the NSF Center for Advanced Vehicle Electronics (CAVE).
Author would like to express his deep gratitude and gratefulness to his father Mr.
Hariharan for being a constant source of inspiration and motivation, mother Mrs.Lakshmi
for her enduring love and immense moral support and family members Mahadevan,
Sirisha and Samhita. The author wishes to acknowledge his colleagues for their
friendship, help and all the stimulating discussions.

viii
Style manual or journal used: Guide to Preparation and Submission of Theses and
Dissertations
Computer software used: Microsoft Office 2003, Minitab 13.1, Ansys 7.0,
Matlab 7.0.1, SAS 9.1

ix
TABLE OF CONTENTS
LIST OF FIGURES……………………………………………………………...........
xiv
LIST OF TABLES…………………………………………………………………….
xvii
CHAPTER 1 INTRODUCTION……………………………………………………... 1
CHAPTER 2 LITERATURE REVIEW……………………………………………… 11
2.1 Physics of failure Based Models……………...…………………………… 11
2.2 Statistical Prediction Models………………………….………………......... 13
2.3 Finite Element Models……………………………………………..……….. 16
2.4 Solder Joint Constitutive Equations………………………………………… 19
2.5 Solder Joint Fatigue Modeling……………………………………………… 21
2.6 Experimental Methods……………………………………………………… 23
CHAPTER 3 STATISTICS BASED CLOSED FORM MODELS FOR FLEX-BGA PACKAGES…………............................................... 26
3.1 Overview…………………………………………………………………… 26
3.2 Flex-BGA Package Architecture…………………………………………... 27
3.3 Data Set…………………………………………………………………....... 27
3.4 Model Input Selection………………………………………………………. 29
3.5 Multiple Linear Regression………………………………………………… 33
3.6 Hypothesis Testing…………………………………………………………. 37
3.7 Model Adequacy Checking………………………………………………… 38
x
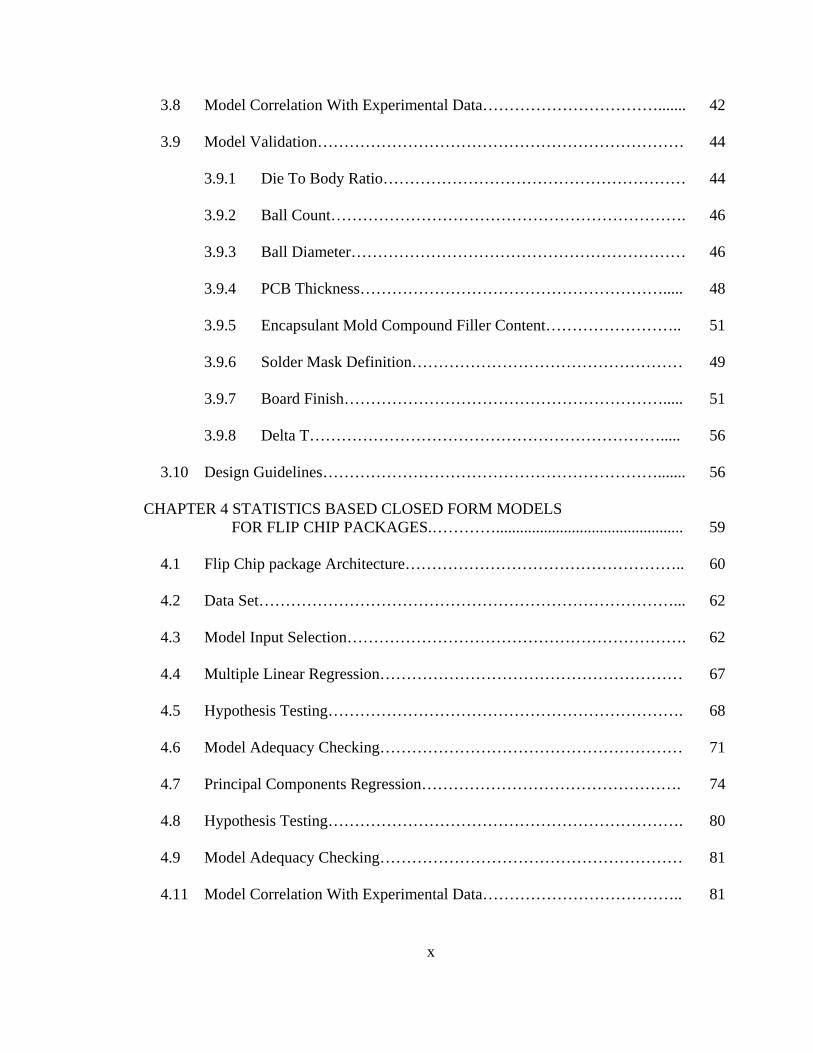
3.8 Model Correlation With Experimental Data……………………………....... 42
3.9 Model Validation…………………………………………………………… 44
3.9.1 Die To Body Ratio………………………………………………… 44
3.9.2 Ball Count…………………………………………………………. 46
3.9.3 Ball Diameter……………………………………………………… 46
3.9.4 PCB Thickness…………………………………………………..... 48
3.9.5 Encapsulant Mold Compound Filler Content…………………….. 51
3.9.6 Solder Mask Definition…………………………………………… 49
3.9.7 Board Finish……………………………………………………..... 51
3.9.8 Delta T…………………………………………………………..... 56
3.10 Design Guidelines………………………………………………………....... 56
CHAPTER 4 STATISTICS BASED CLOSED FORM MODELS FOR FLIP CHIP PACKAGES.…………............................................... 59
4.1 Flip Chip package Architecture…………………………………………….. 60
4.2 Data Set……………………………………………………………………... 62
4.3 Model Input Selection………………………………………………………. 62
4.4 Multiple Linear Regression………………………………………………… 67
4.5 Hypothesis Testing…………………………………………………………. 68
4.6 Model Adequacy Checking………………………………………………… 71
4.7 Principal Components Regression…………………………………………. 74
4.8 Hypothesis Testing…………………………………………………………. 80
4.9 Model Adequacy Checking………………………………………………… 81
4.11 Model Correlation With Experimental Data……………………………….. 81

xi
4.10 Model Validation…………………………………………………………… 82
4.11.1 Die Length………………………………………………………… 86
4.11.2 Solder Joint Diameter……………………………………………... 87
4.11.3 Solder Joint Height………………………………………………... 87
4.11.4 Solder Modulus…………………………………………………… 90
4.11.5 Ball Pitch………………………………………………………...... 90
4.11.6 Underfill Modulus………………………………………………… 92
4.11.7 Delta T…………………………………………………………...... 95
4.11.8 Undercover Area………………………………………………….. 95
4.11 Design Guidelines…………………………………….…………………….. 98
CHAPTER 5 STATISTICS BASED CLOSED FORM MODELS FOR CBGA PACKAGES..…………………………………………………………. 101
5.1 CBGA Package Architecture……………………………………………….. 102
5.2 Data Set..……………………………………………………………………. 102
5.3 Model Input Selection………………………………………………………. 105
5.4 Multiple Linear Regression Models………………………………………... 106
5.5 Hypothesis Testing…………………………………………………………. 107
5.6 Model Adequacy Checking………………………………………………… 109
5.7 Model Correlation With Experimental Data……………………………....... 112
Model Validation…………………………………………………………… 114
5.7.1 Diagonal Length…………………………………………………... 114
5.7.2 Substrate Thickness……………………………………………...... 115
5.7.3 Ball Count…………………………………………………………. 118

xii
5.7.4 Ceramic CTE……………………………………………………… 118
5.7.5 Solder CTE………………………………………………………... 120
5.7.6 Solder Joint Diameter…………………........................................... 123
5.7.7 Underfill Modulus………………………………………………… 123
5.7.8 Underfill CTE……………………………………………………... 126
5.7.9 PCB Thickness…………………………………............................. 126
5.7.10 Delta T…………………………………………………………...... 129
5.8 Design Guidelines…………………………………………………………... 129
CHAPTER 6 STATISTICS BASED CLOSED FORM MODELS FOR CCGA PACKAGES…………................................................................ 132
6.1 Data Set…………………………………………………………………....... 134
6.2 Model Input Selection………………………………………………............. 134
6.3 Multiple Linear Regression………………………………………………… 136
6.4 Hypothesis Testing…………………………………………………………. 137
6.5 Model Adequacy Checking………………………………………………… 139
6.6 Model Correlation With Experimental Data……………………………...... 142
6.7 Model Validation…………………………………………………………… 144
6.7.1 Substrate Area…………………………………………………….. 144
6.7.2 Substrate Thickness……………………………………………...... 145
6.7.3 Ball Height………………………………………………………… 148
6.7.4 Solder Volume…………………………………………………...... 148
6.7.5 Delta T…………………………………………………………...... 151
6.8 Design Guidelines………………………………………………………....... 153

xiii
CHAPTER 7 POWER DEPENDENCY OF PREDICTOR VARIABLES…………... 154
7.1 Box Tidwell Power Law Modelling………………………………………... 154
7.2 Power Law Dependency Of Flip Chip Predictor Variables………………. 156
7.3 Power Law Dependency Of CBGA Predictor Variables………………… 159
7.4 Power Law Dependency Of CCGA Predictor Variables………………… 160
7.5 Power Law Dependency Of Flex-BGA Predictor Variables…………….. 160
CHAPTER 8 SUMMARY AND CONCLUSION………………………………….. 165
BIBLIOGRAPHY…………………………………………………………………... 168
APPENDIX LIST OF SYMBOLS………………………………………………….. 179

xiv
LIST OF FIGURES 1.1: Cross-sectional view of PBGA package. …………………………………………….3 1.2: Cross-Sectional View of Flex-BGA Package………………………………………...5 1.3: Cross- Sectional view of CBGA Package…………………………………………..7 1.4: Cross Sectional View of Flip-Chip BGA…………………………………….……....8 1.5: Solder joint fatigue failure due to thermal cycling………………………………….10
3.1: Cross-Section of Flex BGA Package……………………..…………………………28
3.2: Layered View Of Flex-BGA Package………...……………….……………………28
3.3: Residual plot of Flex-BGA multiple linear regression model………………………40
3.4 Effect of die to body ratio on thermal fatigue reliability of Flex-BGA package…….45
3.5: Effect of ball count on thermal fatigue reliability of CBGA packages……………..47
3.6: Effect of ball diameter on thermal fatigue reliability of Flex-BGA packages………49
3.7 Effect of PCB thickness on thermal fatigue reliability of Flex-BGA packages……..50
3.8: Effect of EMC filler content on thermal fatigue reliability of Flex-BGA package…52
3.9 : Effect of solder mask definition on thermal fatigue reliability of
Flex-BGA Packages……………………………………………………………………...54
3.10 : Effect of board finish on thermal fatigue reliability of Flex-BGA packages……..55
3.11: Effect of Delta T on thermal fatigue reliability of Flex-BGA packages…………..57
4.1: Cross Section of Flip Chip BGA Package…………………………………………..61
4.2: Residual plots of log transformed flip chip prediction model………………….…...72

xv
4.3: Scree plot for selecting the number of principal components………………………76
4.4 : Residual plot of principal components regression model…………………………..83
4.5 : Chi Square plot of principal components regression model……………………….84
4.6: Q-Q plot of principal components regression model………………………………..84
4.7: Effect of die length on thermal fatigue reliability of encapsulated flip-chip with
Sn37Pb solder joints……………………………………………………………………..88
4.8 Effect of solder joint diameter on thermal fatigue reliability of flip-chip packages
subjected to thermal cycling of -550C to 1250C………………………………………...89
4.9: Effect of ball height on thermal fatigue reliability of flip-chip packages…………...91
4.10: Effect of solder modulus on thermal fatigue reliability of flip-chip packages…….93
4.11: Effect of ball pitch on thermal fatigue reliability of flip-chip packages…………...94
4.12: Effect of underfill modulus on thermal fatigue reliability of flip-chip packages….96
4.13: Effect of Delta T on thermal fatigue reliability of flip-chip packages. ……………97
4.14 : Effect of under cover area on thermal fatigue reliability of flip-chip packages…..99
5.1: Motorola CBGA Cross-Section View……………………………………………..103
5.2: Residual plot of CBGA multiple linear regression model…………………………110
5.3 :Effect of diagonal length on thermal fatigue reliability of CBGA packages………116
5.4: Effect of substrate thickness on thermal fatigue reliability of CBGA packages…..117
5.5: Effect of ball count on thermal fatigue reliability of CBGA packages……………119
5.6: Effect of ceramic CTE on thermal fatigue reliability of CBGA packages………...121
5.7: Effect of solder CTE on thermal fatigue reliability of CBGA packages…………..122
5.8: Effect of ball diameter on thermal fatigue reliability of CBGA packages………...124
5.9: Effect of underfill modulus on thermal fatigue reliability of CBGA packages……125

xvi
5.10: Effect of underfill CTE on thermal fatigue reliability of CBGA packages………127
5.11: Effect of PCB thickness on thermal fatigue reliability of CBGA packages……...128
5.12: Effect of Delta T on thermal fatigue reliability of CBGA packages……………..130
6.1: Layered View of IBM CCGA Package……………………………………………133
6.2: Column Grid Arrays of IBM CCGA Package……………………………………..133
6.3: Residual plots of CCGA multiple linear regression model………………………..140
6.4: Effect of substrate area on thermal fatigue reliability of CCGA packages………..146
6.5 Effect of substrate thickness on thermal fatigue reliability of CCGA packages…...147
6.6: Effect of ball height on thermal fatigue reliability of CCGA packages…………...149
6.7: Effect of solder volume on thermal fatigue reliability of CCGA package………...150
6.8: Effect of DeltaT on thermal fatigue reliability of CCGA packages……………….152

xvii
LIST OF TABLES
3.1: Scope of accelerated test database…………………………………………………..30 3.2: Stepwise regression of Flex-BGA predictor variables……………………………..32 3.3 Multiple linear regression model of Flex-BGA package…………………………….36 3.4: Analysis of variance of Flex-BGA multiple linear regression model………………36 3.5: Pearson’s correlation matrix of Flex-BGA predictor variables……………………..41 3.6: Single factor analysis of variance…………………………………………………...43 3.7: Sensitivity of the package reliability to die to body ratio and comparison
of model predictions with actual failure data…………………………………………….45
3.8: Sensitivity of the package reliability to ball count and comparison of model predictions with actual failure data………………………………………………………47 3.9: Sensitivity of the package reliability to ball count and comparison of model predictions with actual failure data………………………………………………………49 3.10: Sensitivity of the package reliability to PCB thickness and comparison of
model predictions with actual failure data………………………………………………50
3.11: Sensitivity of the package reliability to encapsulant mold compound filler
content and comparison of model predictions with actual failure data……………….....52
3.12: Sensitivity of the package reliability to pad configuration and comparison
of model predictions with actual failure data……………………………………………54

xviii
3.13: Sensitivity of the package reliability to board finish and comparison of model predictions with actual failure data………………………………………………………55 3.14: Sensitivity of the package reliability to Delta T and comparison of model predictions with actual failure data………………………………………………………57 4.1 Scope of accelerated test database…………………………………………………...63 4.2: Stepwise Regression of Flip-Chip Predictor Variables……………………………..66 4.3 Pearson’s correlation matrix of flip chip predictor variables………………………...69 4.4: Multiple linear regression model of Flip-Chip package using natural log
transformed flip chip predictor variables………………………………………………...70
4.5 : Analysis of variance of log transformed flip chip prediction model……….………70 4.6: Pearson’s correlation matrix of log transformed flip chip predictor variables……...73 4.7: Multiple linear regression model using principal components of flip chip
predictor variables………………………………………………………………………..78
4.9: Analysis of variance of multiple linear regression model with principal
components as variables…………………………………………………………..…......78
4.9: Principal component regression model using original flip chip
predictor variables………………………………………………………………………..79
4.10: Single Factor Analysis of Variance………………………………………………..85 4.11 : Pair-wise T Test…………………………………………………………………...85 4.12: Sensitivity of the package reliability to the die length and comparison of model predictions with actual failure data………………………………………………………88 4.14: Sensitivity of the package reliability to the solder joint diameter and comparison
of model predictions with actual failure data…………………………………………….89

xix
4.15: Sensitivity of the package reliability to the solder joint height and
comparison of model predictions with actual failure data…………………….…………91
4.16: Sensitivity of the package reliability to the solder modulus and comparison of
model predictions with actual failure data……………………………………………....93 4.17: Sensitivity of the package reliability to ball pitch and comparison of model predictions with actual failure data………………………………………...…………….94 4.18 : Sensitivity of the package reliability to underfill modulus and comparison of
model predictions with actual failure data……………….………………………………96
4.19 : Sensitivity of the package reliability to Delta T and comparison of model predictions with actual failure data………………………………………………………97 4.20: Sensitivity of the package reliability to undercover area and comparison of
model predictions with actual failure data………………………………………….……99
5.1: Scope of accelerated test database…………………………………………………104 5.2: Multiple linear regression model of CBGA package……………………………...108 5.3: Analysis of variance of CBGA multiple linear regression model…………………111 5.4: Pearson’s correlation matrix of CBGA predictor variables………………………..113 5.5: Single factor analysis of variance………………………………………………….116 5.6: Sensitivity of the package reliability to diagonal length and comparison of
model predictions with actual failure data……………………………………….……..116
5.7: Sensitivity of the package reliability to substrate thickness and comparison of
model predictions with actual failure data………………………….…………………..117
5.8: Sensitivity of the package reliability to ball count and comparison of model

xx
predictions with actual failure data………………………………………………...…..119 5.9: Sensitivity of the package reliability to ceramic CTE and comparison of
model predictions with actual failure data……………………………………………...121
5.10: Sensitivity of the package reliability to Solder CTE and comparison of
model predictions with actual failure data……………………………………..……….122
5.11: Sensitivity of the package reliability to ball diameter and comparison of
model predictions with actual failure data……….……………………………………..124
5.12: Sensitivity of the package reliability to underfill modulus and comparison of
model predictions with actual failure data……….……………………………………..125
5.13: Sensitivity of the package reliability to underfill CTE and comparison of
model predictions with actual failure data……………………………………………..127
5.14: Sensitivity of the package reliability to PCB thickness and comparison of
model predictions with actual failure data……………………………………………..128
5.15: Sensitivity of the package reliability to Delta T and comparison of model predictions with actual failure data...…………………………………………………..130 6.1: Accelerated test database…………………………………………………………..135 6.2: Multiple linear regression model for characteristic life prediction of
CCGA package ………….……………………………………………………………..138
6.3: Analysis of variance of CCGA multiple linear regression model…………………138 6.4: Pearson’s correlation matrix of CCGA predictor variables………………………..141 6.5: Single factor analysis of variance………………………………………………….143 6.6: Sensitivity of the package reliability to Delta T and comparison of
model predictions with actual failure data………………………………..…………….146

xxi
6.7: Sensitivity of the package reliability to die length and comparison of model predictions with actual failure data……………………………………………………..147 6.8: Sensitivity of the package reliability to ball height and comparison of model predictions with actual failure data……………………………………………………..149 6.9: Sensitivity of the package reliability to solder volume and comparison of
model predictions with actual failure data………………………….…………………..150
6.10: Sensitivity of the package reliability to Delta T and comparison of model predictions with actual failure data……………………………………………………..152 7.1: Power law dependency of flip chip predictor variables……………………………158 7.2: Power law dependency of CBGA predictor variables……………………………..162 7.3: Power law dependency of CCGA predictor variables……………………………..163 7.4: Power law dependency of Flex-BGA predictor variables…………………………164

1
CHAPTER 1
INTRODUCTION
The emergence of microelectronics industry [Suhir, 2000] has revolutionized
telecommunication, information and engineering industries of the 20th
century leaving a
dramatic, pervasive and beneficial influence on our everyday living. Electronic packaging
may be understood as the technology of packaging electronic equipments which includes
the interconnection of electronic components into printed wiring board (PWB), and
printed wiring boards into electronic assembly. The role of electronic packaging in a
device includes, providing interconnections for signal and power distribution, structural
integrity for protection from environment loads and stresses and heat dissipation.
The major trends in microelectronics industry are driven by constant need for
smaller, faster, more reliable and less expensive IC’s. The need for cramming more
number of devices onto a silicon chip has given life for small scale integration (SSI),
medium scale integration (MSI), large scale integration (LSI) and very large scale
integration (VLSI). In today’s VLSI era, when a typical chip contains 10 million devices,
the perimeter of the device alone is not sufficient to accommodate all of the input- output
interconnections (I/Os), driving the need for area array interconnection.

2
Ball-grid array (BGA) is an area array interconnection technology with an array of
balls on the bottom of the package used for making interconnection with the printed
wiring board. Since the BGA provides interconnection of an area instead of the
perimeter, high interconnection densities are achievable [McKewon, 1999]. Also, with no
leads to bend, and self centered solders, BGA’s offer reduced co-planarity and minimized
handling and placement problems. In addition BGA packages offer better electrical
performance and can be extended to multi chip modules easily. BGA’s are available in a
variety of types, ranging from plastic over molded BGA’s called PBGA’s, flex tape
BGA’s called FlexBGA or FTBGA, ceramic substrate BGA’s named CBGA and CCGA
and flip chip BGA’s with wire-bonds replaced with flip chip interconnects.
A plastic ball grid array consists of silicon chip die mounted on to a
Bismaleimide Triazine (BT) substrate using a die attach adhesive. The BT substrate is
used over standard FR4 laminate for its high glass transition temperature and heat
resistance. Electrical signal from the chip are carried by gold wire bonds which is then
bonded to the substrate. Traces from the wire-bond pads take the signals to the via’s
which then carry them to the bottom side of the substrate and then to the solder pads. An
encapsulant is provided covering the chip, wires and the substrate wire-bond pads for
protection from environment. PBGA packages are found in applications requiring
improved portability, form factor and high performance such as cellular phones, laptop
pc’s, video cameras, wireless PCMCIA cards, automotive under-hood components and
other similar products. A cross section of PBGA package is given by Figure 1.1

3
Figure 1.1: Cross-sectional view of PBGA package.

4
Flex tape ball grid array package is a cavity down package that uses a flex tape as
a substrate. The presence of a nickel plated copper heat spreader in Flex BGA’s improve
the thermal and electrical performance and reliability making them a better choice for
extreme conditions than their plastic counterparts [Karnezos 1996]. The die is attached
beneath the stiff metal heat spreader with silver filled epoxy to provide thermal
conductivity to the heat spreader and wire bonded to the tape traces with gold wire.
Encapsulation is provided in the bottom to protect the die and the wire bonds from the
environment. Flex BGA packages are used in hard drives, PDA’s, global positioning
systems, ASICs, controllers, Flash Memory, digital consumer electronics, wireless
telecommunications, and various other portable products.
Ceramic ball grid array (CBGA) packages [Figure 1.3] are an extension of
controlled collapsed chip connection (C4) and use a co-fired alumina ceramic substrate
[Lau 1995]. The multilayered ceramic substrates are chosen for their superior electrical
performance such as option for multiple power and ground planes and the ability to
choose the signal, power and ground locations within the column array locations. Also,
the low difference coefficients of thermal expansions of ceramic (6.7 ppm/C) and silicon
(2.7ppm/C) increases the component level reliability [Burnette 2000], making ceramic
substrates a good choice for flip chip applications. Ceramic column grid array packages
are very similar to ceramic ball grid array but use a solder column instead of a solder ball
for improved thermal fatigue resistance. The solder column consists of wires of high lead
(90Pb/10Sn) solder attached to the substrate with eutectic (63Sn/37Pb) solder. CBGA
and CCGA packages find a wide range of applications in high end microprocessors

5
Figure 1.2: Cross-Sectional View of Flex-BGA Package

6
personnel computer microprocessors [Master 1998], telecommunication products [Lau
2003], workstations and avionic products.
Flip chip is not a specific package type like CBGA or PBGA, but a method of
electrically connecting the die to the package carrier. In flip chip packaging the die is
inverted face down directly onto a package or a printed wired board, by means of solder
bumps typically deposited on the integrated circuit or wafer and bonded to the package or
PWB. A typical flip chip on board (FCOB) is shown in Figure 1.4. Flip chip packages
offer the advantages of high I/O, shortest electrical connection and hence improved
electrical performance, low cost and high speed production. An underfill is used in flip
chip packages for distributing the stresses in the solder thereby increasing the thermo-
mechanical reliability of solder joints. Flip chip packaging has been implemented in wide
variety of applications including portable consumer electronics like cellular phones
[Sillanpaa et al. 2004], laptops [Pascariu et al. 2003], under-the-hood electronics [Jung et
al. 1998], microwave applications [Bedinger 2000], system in package (SIP) [Van den
Crommenacker, 2003], high-end workstations [Ray et al., 1997], and other high
performance applications.
Thermo-mechanical failures are caused by stresses and strains generated within an
electronic package due to significant difference in coefficients of thermal expansion of
silicon chip and organic-laminate substrate. The coefficient of thermal expansion of
organic PWB is significantly higher than that of the silicon. When the chip heats up
through the electronic operation or environment, the PWB will heat up and expand a
great deal more than the silicon. When the temperature decreases, due to cessation of the

7
Figure 1.3: Cross- Sectional view of CBGA Package

8
Figure 1.4: Cross Sectional View Of Flip-Chip BGA
Solder Joint (24.0ppm/°C)
Passivation
Printed Circuit Board (16.0ppm/°C)
Copper Pad (16.0ppm/°C)
Solder Mask Silicon Chip (2.0ppm/°C) Underfill (35-70ppm/°C)

9
operation or environment, the PWB will contract. The expansion and contraction
introduces shear strains and shear stresses in the solder joint. High shear stress can cause
delamination of various interfaces like UBM/intermetallic, solder/underfill etc. Apart
from delamination, the repeated heating and cooling can eventually cause fatigue of the
solder joints. The high shear stresses would enhance the fatigue initiation making solder
interconnect more susceptible to such fatigue failures [Figure 1.5]. Hence evaluation of
stresses at the joints has become critical to predict the reliability of the assembly.
Increasing the I/O distributes the shear stress among large number of solder
interconnects, increasing the life of the joint. Also, increasing the ball height and ball
diameter reduces the stress concentration and increases the crack propagation path
leading to improved reliability of the joint. However, increasing the I/O leads to
decreasing the bump diameter and height. Thus reliability is improved by increasing ball
count, ball diameter and ball height, but how much it increases for an increase in ball
count and a parallel decrease in ball height has to be explored. Also, there is a growing
need for understanding the effect of various other parameters including die size, underfill
properties, solder properties, solder properties, environmental conditions, etc, and their
individual effects and coupled effects on thermo-mechanical reliability. This research
aims at accomplishing the same.

10
Figure 1.5: Solder joint fatigue failure due to thermal cycling
L
h At Stress Free Temperature (T)
At Temperature T2 (T2<T)
At Temperature T1 (T1>T)
Silicon
PCB

11
CHAPTER 2
LITERATURE REVIEW
Demands on package miniaturization, high density and reliability are driving the
need for predictive methodologies for maintaining high levels of reliability and
performing thermo-mechanical trade-offs. A reliability assessment numerical model that
could take into account the geometric details of the package, the material properties of
the widely used material and the operating conditions could be of great help in obtaining
the failure modes such as die cracking, solder joint fatigue failure, de-lamination etc.
Solder joint fatigue failure being a dominant failure mode contributing 90% of all
structural and electrical failures [Tummala 1997] demands greater focus for improving
the mechanical reliability of the package. In this section, traditional approaches for solder
joint reliability prediction, including physics of failure based models, statistical models,
finite element models and experimental techniques have been discussed.
2.1 PHYSICS OF FAILURE BASED MODELS
Manson and Coffin [1965, 1954] developed an equation that related plastic strain
∆εp, with number of cycles to failure N. Goldmann [1969] analyzed a controlled collapse
joint with spherical dimensions for developing an equation that related the plastic strain
of a joint with relative thermal expansion coefficients of chip to substrate, distance from
chip neutral point to substrate, height of the solder, volume of solder, radius of the cross
section under consideration and exponent from plastic shear stress strain relationship. The

12
plastic strain obtained from Goldmann formulation can be substituted in Coffin- Manson
equation for predicting the number of cycles for fatigue failure. Norris and Landzberg
[1969] studied the effect of cycling frequency and maximum temperature of cycling on
fatigue failure of solder joints and added an empirical correction factor for time
dependent and temperature dependent effects for the thermal fatigue model.
Solomon [1986] analyzed the fatigue failure of 60Sn/40Pb solder for various
temperatures and developed an isothermal low cycle fatigue equation that correlated the
number of cycles to failure with applied shear strain range. Solomon also studied the
influence of frequency, and temperature changes and added corrections that account for
temperature changes, cycling wave shape and joint geometries.
Engelmaier [1990] developed a surface mount solder joint reliability prediction
model containing all the parameters influencing the shear fatigue life of a solder joint due
to shear displacement caused by thermal expansion mismatch between component and
substrate. Engelmaier developed separate equation for stiff solder joints and compliant
solder joints. The parameters of the model include effective solder joint area, solder joint
height, diagonal flexural stiffness, distance from neutral point and thermal coefficient
mismatch thermal cycling conditions, degree of completeness of stress relaxation and
slope of weibull distribution.
Knecht and Fox [1991] developed a strain based model using creep shear strain as
damage metric to determine the number of cycles to failure. The creep shear strain
included creep of component due to matrix creep alone ignoring the plastic work. The
equation was applicable to both 60Sn40Pb and 63Sn37Pb solder joints.

13
Vandevelde [1998] developed thermo-mechanical models for evaluating the
solder joint forces and stresses. Barker et al [2002] synthesized the Vandevelde models
for calculating the solder joint shear forces in ceramic and plastic ball grid array
packages. Clech [1996] developed a solder reliability solutions model for leadless and
leaded eutectic solder assemblies and extended it to area array and CSP packages. Clech
obtained the inelastic strain energy density from area of solder joint hysteresis loop and
developed a prediction equation correlating inelastic strain energy density with number of
cycles to failure.
Singh [2006] developed failure mechanics based models for solder joint life
prediction of ball array and flip chip packages. He calculated the maximum shear strain a
using a simplified DNP formula which was then used for initiating a hysteresis loop
iteration for both global and local thermal mismatch. Inelastic strain energy was then
calculated from the area of the hysteresis loop for both the thermal mismatch cases. The
number of cycles for failure was determined using Lall [2003] model.
2.2 STATISTICAL PREDICTION MODELS
Statistical prediction models developed include cumulative failure distribution
functions for expressing the experimental failure data as a probability function of time to
failure for any failure distribution. Weibull distribution and Log normal distribution have
been most widely used failure distribution functions. Log normal distributions [Muncy
2004] have widely been used for modeling failure due to slow degradation such as
chemical reactions and other corrosions and weibull distributions have been used for
modeling failures due to weak link propagations such as solder joint failure.
14
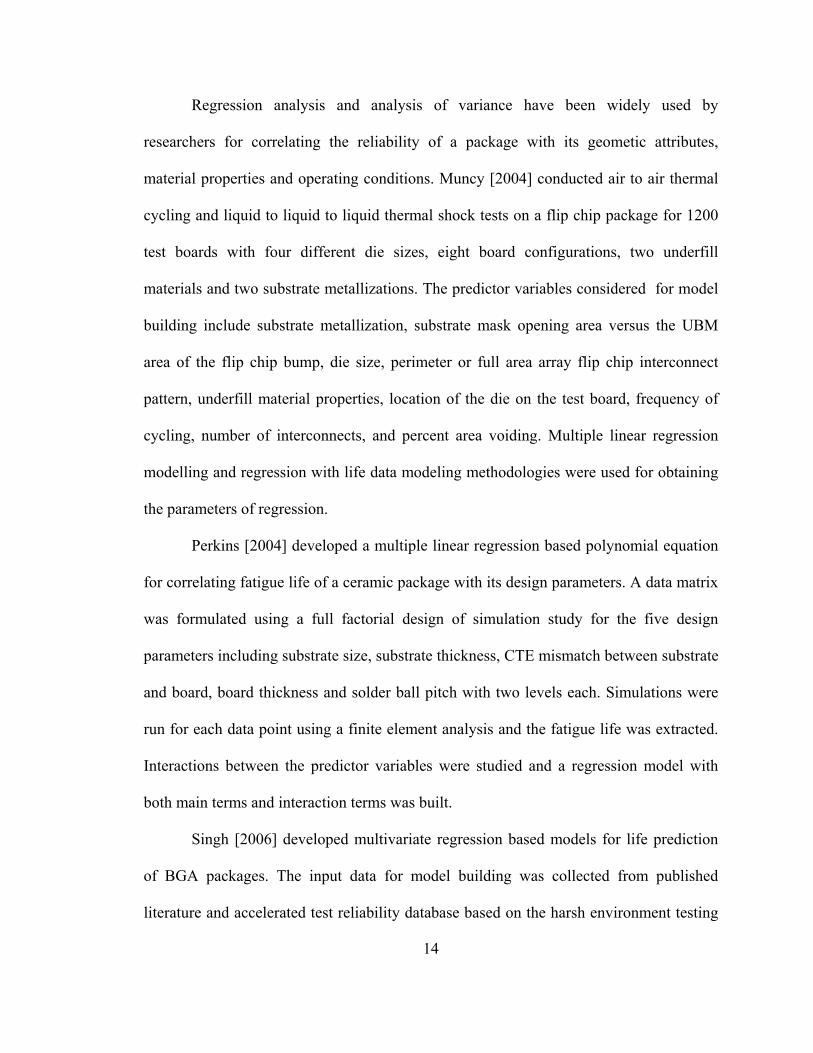
Regression analysis and analysis of variance have been widely used by
researchers for correlating the reliability of a package with its geometic attributes,
material properties and operating conditions. Muncy [2004] conducted air to air thermal
cycling and liquid to liquid to liquid thermal shock tests on a flip chip package for 1200
test boards with four different die sizes, eight board configurations, two underfill
materials and two substrate metallizations. The predictor variables considered for model
building include substrate metallization, substrate mask opening area versus the UBM
area of the flip chip bump, die size, perimeter or full area array flip chip interconnect
pattern, underfill material properties, location of the die on the test board, frequency of
cycling, number of interconnects, and percent area voiding. Multiple linear regression
modelling and regression with life data modeling methodologies were used for obtaining
the parameters of regression.
Perkins [2004] developed a multiple linear regression based polynomial equation
for correlating fatigue life of a ceramic package with its design parameters. A data matrix
was formulated using a full factorial design of simulation study for the five design
parameters including substrate size, substrate thickness, CTE mismatch between substrate
and board, board thickness and solder ball pitch with two levels each. Simulations were
run for each data point using a finite element analysis and the fatigue life was extracted.
Interactions between the predictor variables were studied and a regression model with
both main terms and interaction terms was built.
Singh [2006] developed multivariate regression based models for life prediction
of BGA packages. The input data for model building was collected from published
literature and accelerated test reliability database based on the harsh environment testing

15
of BGA packages by the researchers at the NSF Center for Advanced Vehicle Electronics
(CAVE). The predictor variables considered for model building included die, die to body
ratio, ball count, ball diameter, solder mask definition, printed circuit board surface finish
printed circuit board thickness, encapsulant mold compound filler content and deltaT.
Dummy variables were used for categorical variables like borad finish, encapsulant mold
compound filler content and solder mask definition. Linear, modified linear and non-
linear models were developed using regression analysis and analysis of variance and
validated with experimental data.
Iyer [2005] correlated the reliability of a flip chip package with its properties of
underfill and flux using a regression and back propagation neural networks based models.
Data from accelerated life testing of flip chip package with 95 different underfill flux
combinations was used for model building. The underfill parameters for model building
included modulus of elasticity, coefficient of thermal expansion, glass transition
temperature and filler content. The flux parameters studied include acid number and
viscosity. The regression models and the neural network models were validated using a
test data set and the neural networks model was found to outperform the regression model
owing to minimum residual mean square errors.
Stoyanov [2002] used a design of experiments and response surface modeling
methodology for building a quadratic equation that related underfill modulus, underfill
CTE, stand off height and substrate thickness with number of cycles to failure for a flip
chip package. The data for model building was collected from a finite element analysis of
a flip chip package. Residual analysis, analysis of variance and statistical efficiency
measure were used for validating the models. Taguchi optimization technique was used

16
by Lai [2005] for optimizing the thermo-mechanical reliability of a package on package
for various design parameters. The package parameters considered for optimization
included die thickness, package size, mold thickness, substrate thickness and solder joint
stand off.
Jagarkal, et al. [2004] developed an optimization based solder joint reliability
prediction model for a board level generic electronic package. Finite element analysis
was conducted on the package and PWB in- plane young’s modulus, PWB in- plane
coefficient of thermal expansion, PWB core thickness and solder joint stand-off height
were found to the most important design parameters using built in optimization module
of ANSYS. Optimization models using sub-approximation, design of experiment and
central composite design based response surface methodology were developed for
studying the sensitivity of design parameters on thermo-mechanical reliability.
2.3 FINITE ELEMENT ANALYSIS
Numerical techniques such as finite element analysis can be employed for
assessing the fatigue failure of a solder joint. Finite element analysis techniques extract a
damage parameter such as plastic work, creep strain, plastic strain etc and map them into
an experimentally obtained data or empirical relationship between fatigue life and
number of cycles to failure to predict the expected service life of a solder joint. Darveaux
[1991] developed a liner-non linear analysis method in which he used a linear finite
element analysis for calculating the assembly stiffness and the imposed strain’s on the
solder joints. A one dimensional non linear analysis was then performed for calculating

17
the strain energy density accumulated per cycle. Coffin- Manson relation was used for
calculating the number of cycles to failure.
Corbin [1991] developed a micro-macro approach for solder joint reliability
prediction. A coarse macro model with thin plate elements was used for modeling the
ceramic module and the FR4 board and a group beam elements were used for modeling a
coupling the between card and the module. The beam element was used for determining
the major thermal deformation modes which were then input to the more detailed micro
level solder joint as boundary conditions. Linear elastic properties have been used for the
macro model and visco-plastic properties for the micro model. Plastic strain was
extracted from the micro model and the fatigues life was calculated using coffin-manson
equation.
Darveaux [1996] developed a three dimensional non-linear slice model with
accumulated strain energy density as the damage metric for solder joint reliability
predictions. Solder joint was modeled as visco-plastic solid, printed circuit board as
orthotropic linear elastic and rest of the material as linear elastic. The model was imposed
with symmetric boundary conditions on the slice plane coinciding with true symmetry
plane. The extracted plastic work accumulated per unit volume per thermal cycle was
used for crack growth correlations. Volume averaging was applied to reduce the
sensitivity of strain energy to meshing.
Riebling [1996] developed a global local modeling approach with plastic work as
damage parameter for solder joint reliability predictions. An octant of the packaged
device with linear material behavior was modeled as the global model and a single solder
joint with PCB and all the package parameters and non linear material behavior was

18
modeled as the local model. The model was imposed with symmetric boundary
conditions on the slice plane coinciding with true symmetry plane. The global model was
subjected to a one degree temperature change, providing displacement fields on a per
degree basis. The scaled displacement fields in accordance with the thermal cycling was
used as the boundary conditions for the local model of the critical joint. Plastic work was
extracted from the solder joint and Darveaux’s crack growth correlations have been used
for determining the number of cycles to failure.
Pang, et al. [2001] developed an elastic plastic creep analysis for solder joint
reliability prediction of a ceramic ball grid array package. In this method the temperature
was allowed to ramp from low tempearature to high temperature and elastic plastic
analysis was conducted for every 50C increment. The model was then held at dwell high
temperature and a creep analysis was performed. The temperature was again ramped
down from high temperature to low temperature and elastic plastic analysis was
conducted for every 50C increment. The model was then held at dwell low temperature
and a creep analysis was performed. The temperature cycling pattern was repeated thrice
and the complete equivalent stress and strain were obtained which was then used for
fatigue and creep life prediction.
Werner, et al [2004] integrated a finite element stress module within a CFD
module to predict the solder joint life of a resistor package using finite element and finite
volume codes. Hong [1998], Farooq, et al[2003] developed finite element models for
studying the thermo-mechanical fatigue reliability of lead free CBGA packages. The lead
free alloys for CBGA packages were found to perform better than the traditional dual
alloy Sn/Pb alloys. Perkins, et al. [2004] conducted Coffin-Manson based non linear

19
finite element analysis on CBGA packages for various combinations of substrate size,
substrate thickness, board thickness, CTE mismatch and ball pitch.
Braun, et al. [2005] conducted thermo-mechanical simulations for studying the
solder joint reliability of SnAg solder bumps mounted on high Tg FR4 substrate with
immersion Sn and Ni/Au finishes. Pang, et al. [2004] analyzed 96.5Sn-3.5Ag solder
joints for flip chip application using elastic plastic creep finite element analysis. The flip
chip packages were subjected to both thermal cycling and thermal shock conditions.
Gonzalez, et al. [2005] studied the advantages, challenges and limitations of using finite
element prediction model for lead free solder joint prediction of flip chip packages.
Cheng [2004] studied the effect of underfill on flip-chip packages with different ball
diameters and stand-off height’s.
2.4 SOLDER JOINT CONSTITUTIVE EQUATIONS
Since the solder material has a high homologous temperatures of about 0.65 even
at room temperature, creep process are expected to dominate its deformation kinetics
giving rise to complex behavior. Constitutive models have used explicit creep equations
or unified viscoplastic models for modeling the rate dependent behavior of the solder
material. The creep models developed include power law creep models [Ju et al, 1994],
Harper Dorn creep models and hyperbolic creep models [Garafalo, 1965]. Since the
unified visco-plastic model combines the rate dependent plasticity and creep, they are
highly desired as the use of explicit creep equation would require the addition of rate
dependent plasticity in the material model.

20
A unified visco-plastic model for 60Sn/40Pb taking into account the measured
stress-dependence of the activation energy and the strong Bauschinger effect exhibited by
the solder was developed by Busso, et al. [1992]. Qian, et al. [1997] described the
transient stage of a stress/strain curve through back stress for building a unified
constitutive model for tin lead solder. Skioper, et al. [1996] developed constitutive
models for 63Sn/37Pb eutectic solders using unified Bodner-Partom model. Yi et al
[2002] developed a constitutive model based on a combination of grain boundary sliding
and matrix dislocation deformation mechanisms. Most of the above mentioned models
require user defined subroutine codes for representing the non linear rate dependent stress
strain relations in a finite element package.
Anand [1985] and Brown [1989] developed a set of constitutive equations for
large isotropic, visco-plastic deformation and small elastic deformation using a single
scalar internal variable model. This model presented the advantage of easy
implementation in commercially available finite element packages such as ANSYS.
Daveaux and Banerji [1992] determined the material parameters of the Anand’s model
for 62Sn36Pb2Ag, 60Sn40Pb, 96.5Sn3.5Ag, 97Pb3Sn and 95Pb5Sn solder joints from
experimental results. Wang, et al.[2001] determined the material parameters of the
constitutive relations for 62Sn36Pb2Ag, 60Sn40Pb, 96.5Sn3.5Ag, and 97.5Pb2.5Sn
solders from separate constitutive relations and experimental results and tested for
constant strain rate testing, steady-state plastic flow and stress/strain responses under
cyclic loading. Amagai, et al. [2002] conducted material characterization tests of Sn-Pb
based and Sn-Ag based lead-free solders (63Sn37Pb, 62Sn36Pb2Ag, Sn3.5Ag0.75Cu,
Sn2.0Ag0.5Cu), and fitted the data to the Anand’s constitutive model which unifies both

21
rate-dependent creep and rate independent plasticity via viscoplastic flow equation and
evolution equation.
2.5 SOLDER JOINT FATIGUE MODELLING
Solder joint fatigue models are used for determining the number of cycles that the
package would survive before the solder joint fails. Several of the physics of failure
models [Engelmeir, Knecht and Fox, Duan ] can be used in conjunction with finite
element analysis for predicting the fatigue failure of solder joints. Ostergren [1979]
formulated an energy based method for fatigue life prediction of solder joints. A damage
function that incorporated both stress and inelastic strain energy was used as a damage
proxy for low cycle fatigue damage at elevated temperatures. The number of cycles to
failure was then calculated by replacing the plastic strain of Coffin-manson relation with
the damage function. Vayman [1989] studied the effect of strain range, ramp time, hold
time and temperature on isothermal fatigue failure of tin lead solder joints and developed
a strain range partitioning model that partitioned the inelastic strain energy into time
dependent plasticity and time dependent creep to include the effects of ramp and hold
time on fatigue failure of solder joints. Duan [1988] synthesized the strain range
partitioning and the damage function and developed a strain energy partitioning method
for low cycle fatigue life prediction of heat resistant alloys.
Darveaux [1997] developed an energy based model that used accumulated plastic
strain energy as damage metric for finding the number of cycles to failure. Darveaux
conducted extensive thermal cycling experiments on CBGA samples and measured the
crack length in the solder ball during thermal cycling for developing a model that related

22
laboratory measurements of low cycle fatigue crack initiation and crack growth rates with
inelastic work of the solder. Anand’s constitutive model was used for modeling the solder
material. The model used inelastic strain energy density extracted from finite element
analysis, along with crack growth data, for determining the number of cycles for crack
initiation and number of cycles for crack propagation along the solder joint.
Amagai [1998] developed a visco-plastic constitutive model for analyzing the
thermally induced creep and plastic deformation for chip scale packages and multi layer
ball grid array packages on printed circuit boards. Fusaro [1997] analyzed a copper base
plate attachment to a power module using visco-plastic properties of eutectic solder joint.
Dougherty [1997] developed solder joint reliability models for micro miniature electronic
packages. Johnson [1999] studied Darveaux’s model and identified key parameters
affecting solder joint reliability. Pitarressi [2000] developed fatigue models for solder
joint reliability prediction of multiple ball grid array packages. Zahn [2000] developed a
comprehensive solder fatigue and thermal characterization model for a multi chip module
package. Goetz et al [2000] developed a solder joint fatigue model for a silicon based
system in package. Shi, et al. [2000] developed a strain based model that uses plastic
strain range as a damage proxy for predicting the number of cycles to failure. The model
considered the effect of both temperature and frequency on low cycle fatigue life of
eutectic solder joint. Lall, et al. [2003] modified Darveaux’s model for PBGA and CSP
packages for harsh environments. Syed [2004] developed creep strain and strain energy
density based thermal fatigue life prediction model for lead free solder joints.

23
2.6 EXPERIMENTAL METHODS
Temperature cycling is a widely method for solder joint reliability predictions. In
this method the component is exposed to a series of low and high temperatures
accelerating the failure modes caused by cyclic stresses. The thermal cycling uses a
single air chamber in which the temperature ramp can be controlled carefully. Thermal
shock tests like thermal cycling are used for accelerated life testing of solder joints.
Thermal shock testing is a liquid-liquid test in which two liquid chambers at different
temperatures are used. Thermal shock tests generate very high ramp rates.
Master, et al. [1998] conducted accelerated thermal cycling tests on CBGA
packages for various body size and assembly parameters to study the effect of package
thickness and card pad design on reliability of the package. Master, et al. [1995] studied
the effect of column length on fatigue life of solder joint for two different thermal
profiles using accelerated thermal cycling tests. Gerke, et al. [1995] studied the reliability
of high I/O CBGA packages used in computer environment using accelerated thermal
cycling tests for two different thermal profiles. Kang [2004] evaluated the thermal fatigue
life and failure mechanism of Sn-Ag-Cu solder joints with reduced Ag contents for a
CBGA package. Hong [1998] predicted the mean fatigue life of CBGA packages with
lead free (Sb5-Sn95, Ag3.5-Sn96.5, Zn9-Sn91) solder fillets and found the lead free
joints outperform the leaded ones. Ingallas [1998] conducted accelerated thermal cycling
tests on CCGA packages for two different ball pitch, to study the effect of solder ball
pitch on solder joint reliability of the package. He found the 1mm pitch to be providing
significant improvement in solder joint reliability of CCGA package.

24
Zhang, et al. [2001] evaluated the reliability of SnCu0.7, SnAg3.8Cu0.7 and
SnAg3.5 solder joints on both NiP and Cu under bump metallurgies for flip-chip
application. Peng, et al. [2004] analyzed the sensitivity of reliability of flip chip package
to solder joint geometric parameters such as stand-off height, lower and upper contact
angles, and solder joint profile using accelerated thermal cycling tests. Wang, et al.
[2001] assessed the reliability of flip chip packages with no flow underfills using liquid to
liquid thermal shock tests. Hou, et al. [2001] conducted liquid to liquid thermal shock
tests for reliability assessment of flip chip packages with SnAgAu joints. He found the
leaded solder joints perform better than the lead free ones. Teo, et al. [2000] conduated
accelerated thermal cycling tests for investigating the effect of under bump metallurgy
solder joint reliability of flip chip packages. Braun, et al. [2005] studied the high
temperature potential of flip chip assemblies for automotive applications. Darveaux, et al
[2000] studied the impact of design and material choice on solder joint fatigue life of
various BGA packages including PBGA, FlexBGA, tape array BGA and mBGA.
Moire interferometry is an optical method which provides whole field contour
maps of in-plane displacements with sensitivity as low as 0.417µm [Tunga 2004]. Moire
Interferometry technique has been increasing employed in mapping thermally induced
deformation of electronic packages. Meng [1997] applied this technique for solder joint
reliability prediction of BGA, CSP and flip chip packages. He subjected the packages to a
temperature cycling and extracted the accumulated thermal deformations for reliability
predictions. Zhu [1997] studied the reliability of OMPAC BGA and a flip chip BGA
using moiré interferometry technique. Zhu also studied the effect of bonding,

25
encapsulation, soldering and geometry on the reliability of both the packages and using
the same technique.

26
CHAPTER 3
STATISTICS BASED CLOSED FORM MODELS FOR FLEX-BGA PACKAGES
Multiple linear regression is a method of developing a prediction equation that
predicts the value of a response variable Y given the values of predictor variables X.
Multiple linear regression has been used for developing models for characteristic life
prediction of Flex-BGA packages given its geometric aspects, material properties and its
operating conditions. The developed prediction models have been validated for
underlying statistical assumptions of model building and correlated with physics of
failure to develop more meaningful closed form statistical models for flex-BGA package
reliability predictions. The prediction ability of the closed form models have been
validated by correlating the prediction results of the closed form models with actual
experimental failure data.
3.1 OVERVIEW
This section presents multiple linear regression based statistical models for life
prediction of Flex-BGA packages in harsh environments. The models act as a tool for fast
track reliability prediction for a given component architecture and serve as an aid for
understanding the sensitivity of component reliability to geometry, package architecture,
material properties and board attributes to enable educated selection of appropriate device

27
formats. In addition, categorical variables such as solder mask definition and board finish
can be incorporated in this model.
3.2 FLEX-BGA PACKAGE ARCHITECTURE
Flex-BGA packages are a family of cavity down BGA’s that have the die, the flex
tape and the solder balls attached to the bottom side of a metallic heat spreader. The
nickel plated copper heat spreader is the stiffest member and is used for handling the
package during assembly, test and reflow on the mother board. The interconnect circuit is
flexible copper/polyimide tape with one or two metal layers and has solder mask on the
metal layer that carries the solder balls. It is laminated to the heat spreader using a
pressure sensitive adhesive. The die is attached into the cavity with silver filled die attach
epoxy to provide thermal conductivity to the heat spreader. The die is wire bonded to the
tape traces and the heat spreader with gold wire. Encapsulation protects the die and wire
bonds and fills the cavity.
3.3 DATASET
The dataset used for model building has been accumulated from an extensive
Flex-BGA accelerated test reliability database based on the harsh environment testing by
the researchers at the NSF Center for Advanced Vehicle Electronics (CAVE). This
database has also been supplemented with the various datasets published in the literature.
Each data point in the database is based on the characteristic life of a set of Flex-BGA
devices of a given configuration tested under harsh thermal cycling or thermal shock
conditions. The range of data collected in each case is given by Table 3.1.

28
Figure 3.1: Cross-Section of Flex BGA Package
Figure 3.2: Layered View of Flex-BGA package

29
3.4 MODEL INPUT SELECTION
Model input variables have been chosen by defining all predictors that are known
and then selecting a subset of predictors to optimize a predefined goodness-of-fit
function. From a mathematical point of view, the featured selection problem can be
formulated as a combinatorial optimization problem. Efforts have been made to trade-off
accuracy and bias to find the “best” set of predictors for a model. Increasing the number
of variables increases the model-information, at the expense of increased variance and
model-complexity. Reduction in the number of variables reduces error-variance, but it
biases the least square estimators and error variances. Let k denote the number of
potential predictors for a model. If each variable either enters the model or is excluded
from it, the total number of possible configurations is in the order O(2k), making it a
complex combinatorial problem Stepwise regression based on forward selection
performance optimization and method of best substes has been used for automatic search
and identification of the best subset of predictor variables [Malthouse 2002, Dwinnell
1998, Cevenini 1996, McCray 2004, Mendes 2002, Kitchenham 2002]. Other methods
studied include, Simulated Annealing (SA) [Brooks 2003], Principal Component
Analysis (PCA) [King 1999] and Neural Network based Radial Basis Function (RBF)
[Swanson 1995]. Stepwise Regression, which is a combination of forward selection and
backward elimination process, has been selected because of availability in standard
statistical packages. This search method develops a sequence of regression models, at
each step adding or deleting a predictor variable. The criterion for adding or deleting a

30
Parameter Data Range
Body Size 7.5 mm to 16 mm
Die to Body Ratio 0.3 to 0.81
Ball Count 40 to 280
Ball Pitch 0.5 mm to 1 mm
Ball Diameter 0.3 mm to 0.5 mm
Substrate Type 2L tape, 3L Tape
PCB Thickness 0.8 mm to 1.6 mm
PCB Surface Finish OSP, HASL & Ni/Au
EMC Filler Content Low, High
Solder Mask Definition SMD, NSMD
THigh, Accelerated Test 100°C, 125°C, 150°C
TLow, Accelerated Test -55°C, -40°C, 0°C
Table 3.1: Scope of accelerated test database

31
predictor variable can be stated equivalently in terms of error sum of square reduction,
coefficient of partial-correlation, t-statistic or f-statistic.
Forward search is initiated by trying all possible models that use a single input.
The best single input is retained and a search begins on the remaining candidate inputs to
become the second input. The input that most improves the model is kept and so on. This
process ends either when the model ceases to improve or we run out of candidate inputs.
A backward search works exactly like a forward search, except that it moves in the other
direction. Backward searching begins with a model that uses all the inputs and then
removes input variables one at a time.
The stepwise regression amounts to selecting of subset of q ≤ p candidate variable
to be included in the model. Let set { }p........,3,2,1⊂ψ contains the indices of the
variables selected. Each possible subset of variables is associated with one model. The
scoring model associated with a particular subset ψ will be denoted by Fψ. The objective
function is based on method of least squares. For a linear functional form,
∑ψ∈
ψ +=k
kk xbaF
where a and ( )ψ∈kbk are estimated using method of least squares. The stepwise
regression initializes with 0=ψ , i.e. begins with no variables in the model and attempts
to find the variable, which yields the maximum improvement.
Die to body ratio was identified as a potentially important and hence was selected
as the first variable. A regression equation was fit with characteristic life as response
variable and die to body ratio as predictor variable and the criteria’s for model selection
were studied. Die to body ratio was found to explain large proportion of variation at the
cost of minimum mean square residual and bias values and hence was retained in the
32
Step 1 2 3 4 5 6 7 8 9 10 Constant 2964.7
2275.4 1372.1 606.9 1004.2 817.8 870.8 367.0
255.9 330.7
DieToBody -2845
-3155 -2899 -2940 -2959 -2999 -3076 -2937
-2802 -2896
T- Statistic
-6.47
-7.91 -7.96 -9.07 -9.71 -10.9 -11.75 -11.19
-10.69 -11.54
P Value
0.000 0.000 0.000 0.000 0.000 0.000 0.000 0.000 0.000 0.000
MaskDefID 928
861 934 820 838 873 878
751 827
T- Statistic 3.63
3.75 4.55 4.14 4.69 5.15 5.37
4.42 5.23
P Value 0.001
0.001
0.000 0.000 0.000 0.000 0.000 0.000 0.000
Dwell Time 52
52 53 50 47 47
50 48
T- Statistic 3.43
3.91 4.20 4.36 4.40 4.52
4.94 4.79
P Value 0.001
0.000 0.000 0.000 0.000 0.000 0.000 0.000
BodySizeSqMM 57
60 67 67 46
-74
T- Statistic 3.47
3.83 4.73 4.98 2.68
-1.17
P Value 0.001 0.000 0.000 0.000 0.011
0.248
PCBThicknessMM -264
-379 -380 -412
-421 -415
T- Statistic -2.54
-3.77 -4.01 -4.43
-4.70 -4.62
P Value 0.015
0.001 0.000 0.000 0.000 0.000
EMCFillID 332
359 334
387 363
T- Statistic 3.18
3.62 3.46
4.00 3.82
P Value 0.003
0.001 0.001
0.000 0.000
BoardFinishID -225
-237
-210 -224
T- Statistic -2.39
-2.60
-2.36 -2.53
P Value 0.022
0.013
0.024 0.016
BallDiaMM 1690
3719 2384
T- Statistic 1.96
2.80 3.47
P Value 0.058
0.008 0.001
BallCount 4.16
1.76
T- Statistic 1.97
3.18
P Value 0.057
0.003
S 390
346 309 275 258 233 220 212
205 206
R-Sq 48.73
60.75 69.34 76.31 79.61 83.82 85.93 87.25
88.04 88.49
Table 3.2: Stepwise regression of Flex-BGA predictor variables

33
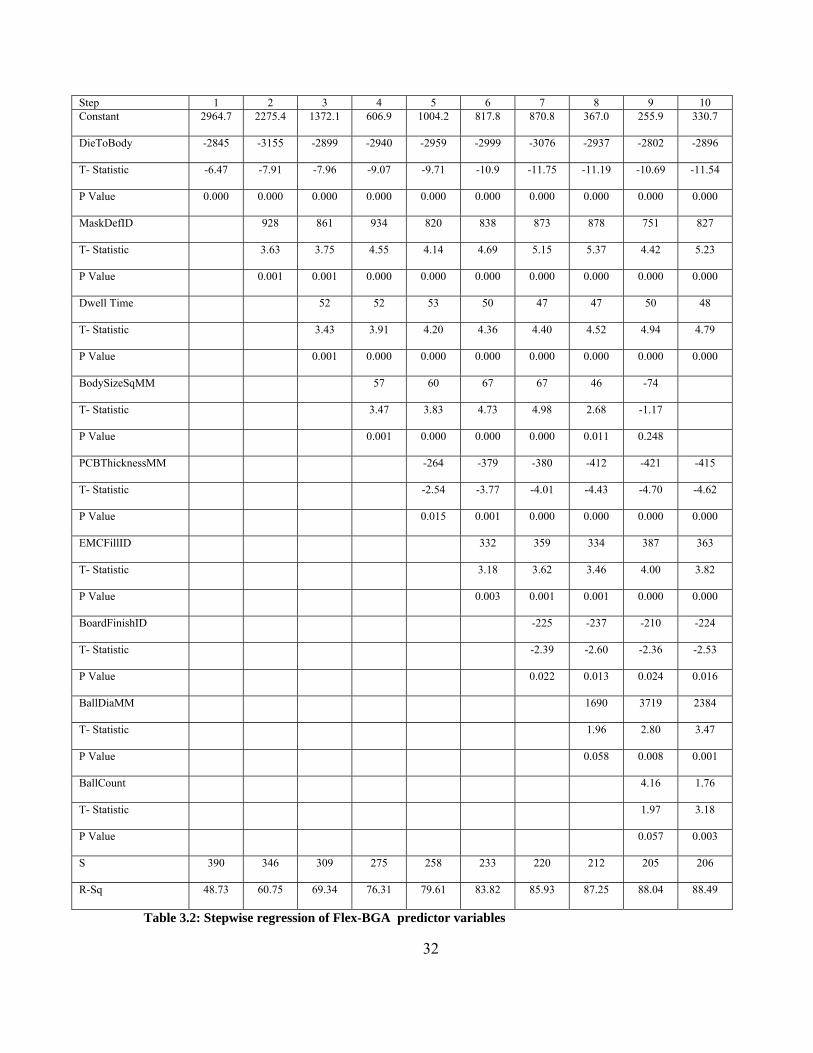
model. Solder-mask definition was identified as the next potentially important variable
and a regression equation with characteristic life as response variable and die to body
ratio and solder mask definition as predictor variable was fit. Addition of solder mask
definition yielded an increase in the coefficient of determination and reduction in residual
mean square and hence was retained. DeltaT and body size were identified as next
potentially important variables. With addition of dwell time there was substantial increase
in coefficient of determination which was not the same with body size. Body size was
thus dropped from the model.
Predictor variable were added in succession, regression equation was fit,
criteria’s of model selection were studied and decision for retention and drop of the
variable was made. The best subset of variables from stepwise regression method
includes die to body ratio, solder mask definition, DeltaT, PCB thickness, encapsulant
mold compound filler content, board finish, solder ball diameter, substrate type and ball
count. The results of stepwise regression method are given by Table 3.2
3.5 MULTIPLE LINEAR REGRESSION MODEL
Multiple linear regression attempts to model the relation between two or more
predictor variables and a response variable. The relationship is expressed as an equation
that predicts a response variable from a function of predictor variables and parameters.
The parameters are adjusted so that a measure of fit is optimized. The prediction
equations is given by Equation 3.1
∑=
+=n
kkk fbat
10%2.63 Eq 3.1

34
The response variable t63.2% on the left hand side of the equation represents the
characteristic life of three-parameter Weibull distribution for the flex-BGA package when
subjected to accelerated thermo-mechanical stresses. The parameters on the right hand
side of the equation are the predictor variables of the various parameters that influence
the reliability of the package. The coefficient of each of the parameter is the indicator of
the relative influence of that parameter on the characteristic life of the package.
Multiple linear regression estimates the coefficients of regression using the
method of least squares. Because, the method of least squares assumes the errors to be
normally, independently distributed with zero mean and constant variance, the developed
models have to be validated for normality, hetroskedasticity and multi-collinearity.
Residual analysis has been performed for validating normality and constant variance
assumptions and Pearson’s correlation analysis and variance inflation factor have been
used for checking multi-collinearity.
Multiple linear regression models have been developed using commercially
available statistical software, MINITABTM. The predictor variables for model building
include the best subset of variables obtained from stepwise methods. Characteristic life of
the package has been used as the response variable. Continuous variables such as ball
count and ball diameter have been input in their original form. Categorical variables such
as board finish, encapsulant mold compound filler content and solder mask definition
have been input in binary form. Categorical variables with two and three levels have been
modeled with one and two dummy variables respectively. Each level toggles between 0
and 1.In the case of a categorical variable with three levels, two dummy variables taking

35
the values 0-0, 1-0 and 0-1 for the levels 1, 2 and 3 respectively have been used. When
both the dummy variables are input zero, both of the are knocked out from the prediction
equation, modifying the equation for level one of the categorical variable. When 1 and 0
are input for first and second dummy variable the first dummy variable alone gets added
to the equation, modifying the equation for level two of the categorical variable. When 0
and 1 are input for first and second dummy variable the first variable is knocked off and
the second variable is added to the equation modifying the prediction equation for level 3
of the categorical variable.
The output of multiple linear regression is given by Table 3.3. The output of the
multiple linear regression has been used in building a mathematical prediction equation
that correlates the sensitivities of predictor variables with characteristic life of the
package. The prediction equation has been used as a tool for prediction and comparision
of characteristic life of Flex-BGA packages with different design and material attributes
when subjected to different extreme environments. This prediction equation provides
higher accuracy than any first order closed form model, and also allows the user to
analyze the interaction effects of the various parameters on the package reliability, which
are often ignored in the various first order closed form modeling methodologies and
addressed only using finite element models or experimental accelerated test data The
prediction equation is given by Equation 3.2
)(318.11)2(7.656)1(53.9)(8.832)(
30.341)(37.372)(4.2216)(8433.1)(5.29469.2968%63
DeltaThIDBoardFinishIDBoardFinisMaskDefIDEMCFillID
ssMMPCBThickneBallDiaMMBallcountatioDieToBodyRN
×−×−×+×+
×+×−×+×+×−=
Eq 3.2

36
Predictor Coeff (bk)
SE Coeff
T
P-Value
Constant
2968.9
525 5.66 0.000
DieToBodyRatio
-2946.5
244 -12.06 0.000
BallCount
1.8433
0.5385 3.42 0.002
BallDiaMM
2216.4
673.4 3.29 0.002
PCBThicknessMM
-372.37
90.15 -4.72 0.000
EMCFillerID
341.30
95.34 3.81 0.001
MaskDefID
832.8
159.0 5.15 0.000
BoardFinishID1
9.53
152 2.49 0.952
BoardFinishID2
-656.7 208 -3.15 0.003
DeltaT
-11.318
2.370 4.93 0.000
Table 3.3 Multiple linear regression model of Flex-BGA package
Source D.F SS MS F P
Regression 9 11642392 1293599 32.32 0.00
Residual Error 36 1440911 40025
Total 45 13083303
Table 3.4: Analysis of variance of Flex-BGA multiple linear regression model

37
3.6 HYPOTHESIS TESTING
Hypothesis testing aids in testing the overall adequacy of the multiple linear
regression model and determining the significance of individual regression coefficients.
The hypothesis tests assume normality, independence and constant variance of errors.
The test of overall adequacy of the model tests the linear dependence of
characteristic life and any of the geometric, material properties and environmental
conditions. The null hypothesis assumes changes in geometric, material properties and
environmental condition do not affect the characteristic life of the Flex BGA package.
Rejection of the null hypothesis implies there is at least one geometric, material property
or environmental condition is contributing significant in predicting the characteristic life
of the Flex-BGA package.
Analysis of variance (ANOVA), which provides information about levels of
variability within a regression model, has been used for testing the overall adequacy of
the model. The values of the ANOVA table, F statistic and P value are given by Table
3.4. The p-value in the ANOVA table indicates the statistical significance of the
regression equation. A P value of less than 0.05 is a rejection of the null hypothesis
signifying the presence of linear relationship between characteristic life and at least one
of the geometric, material properties and environmental conditions. Thus the prediction
equation was verified to be adequate.
Coefficient of determination, R2, which determine the percentage of variation of
the response variable explained by the predictor variables, has been used for assessing the
overall adequacy of the prediction model. A high R2 value suggests the ability of the
prediction equation in explaining most of the variations in characteristic life. The R2

38
value of 0.90 suggests the developed prediction is adequate for prediction purposes.
Since, R2 increases for every additional predictor variable, adjusted R2, which is a
modification of R2, that accounts of addition of new predictor variable has also been
studied. An adjusted R2 value of 87% of the prediction equation reconfirms the overall
adequacy of the model.
Presence of unwanted predictor variable, which do not contribute significantly for
prediction purpose, increases the residual mean square thereby, decreasing the prediction
ability of the model. T tests on individual regression coefficients have been performed for
determining the importance of each predictor variable for retaining in the model. The p-
value of a parameter in Table 3.3 indicates the statistical significance of that parameter
and the parameter with p-value less than 0.05 is considered to be statistically significant
and expected to have a significant effect on the reliability of the package, with confidence
level of more than 95.0%. All the predictor variables in Table 3.3 are statistically
significant with p-values in the neighborhood of 0 to 5%.
3.7 MODEL ADEQUACY CHECKING
Model appropriateness for application has been checked using any one or
combination of the several of the features of the model, such as linearity, normality,
variance which may be violated. In this section, methods for determination of the
appropriateness of the model have been discussed. Model residuals have been studied to
measure the variability in the response variable not explained by the regression model.
Residuals realized or observed values of the model errors any departures from the model
errors show up in the residuals.

39
Residual plots studied include, the normal probability plot, histogram plot of
residuals, plot of residuals against fitted values, plot of residual against regressor and plot
of residual in time sequence. Departures from normality, and the resultant effect on t-
statistic or f-statistic and confidence and prediction intervals have been studied using
normal probability plots. A straight line variation for the multiple linear regression
model (Figure 3.) indicates a cumulative normal distribution. The histogram plot of
residuals has also been used to study non-normality. Plots of residuals against fitted
values and plots of residuals against the regressors have been used to check for constant-
variance. Existence of residuals within the normal band indicates constant variance for
the multiple linear regression model. Violation of assumptions may have been indicated
by inward and outward funneling. The plot of residual in time sequence is used to study
correlation between model errors at different time periods. Patterns in the plot of
residuals in time sequence have been studied to determine if the errors are auto-
correlated. Random distribution of errors shows the absence of any auto-correlation
problems.
Multi-collinearity is the near linear dependence of predictor variables. Multiple
linear regression modeling assumes the predictor variables to be independent of each
other. The presence of multi-collinearity can cause inflated variance and regression
coefficients with wrong signs. Pearsons correlation matrix and variance inflation factor
values have been used for studying multi-collinearity. The absence of high values in the
Pearsons correlation matrix, given by Table 3.5, shows the absence of multi-collinearity
problems.

40
Figure 3.3: Residual plot of Flex-BGA multiple linear regression model.

41
Dieto Body Ratio
Bal1 Count
BallDia MM
PCB Thickness
EMC FillerID
Mask DefID
Board Finish ID1
Board Finish ID2
DeltaT
DieToBodyRatio
1.000 0.073 -0.224 -0.077 -0.009 0.213 -0.092 -0.115 0.181
BallCount
0.073 1.000 0.302 -0.043 -0.268 0.035 -0.097 -0.058 0.083
BallDiaMM
-0.224 0.302 1.000 0.243 0.079 -0.156 0.059 0.035 -0.050
PCBThicknessMM
-0.077 -0.043 0.243 1.000 0.356 -0.242 0.020 0.169 -0.031
EMCFillerID
-0.009 -0.268 0.079 0.356 1.000 -0.090 0.105 0.063 -0.090
MaskDefID
0.213 0.035 -0.156 -0.242 -0.090 1.000 0.052 -0.031 -0.045
BoardFinishID1
-0.092 -0.097 0.059 0.0206 0.105 0.052 1.000 0.031 0.052
BoardFinishID2
-0.115 0.083 0.035 0.169 0.063 -0.031 0.031 1.000 0.031
DeltaT
0.181 0.083 -0.050 -0.031 -0.090 -0.045 0.052 0.031 1.000
Table 3.5: Pearson’s correlation matrix of Flex-BGA predictor variables.

42
3.8 MODEL CORRELATION WITH EXPERIMENTAL DATA
Characteristic life predicted by statistical model have been validated against the
actual values from the experimental database to asses the prediction ability of the
statistical model. A single factor design of experiment study has been used for comparing
the mean characteristic life predicted by both the methods at a 95% confidence interval.
The objective of the design study is to determine the influence of the factor on the output
response of the system. Prediction method with experiment and statistical model as its
two levels has been investigated as the factor and the predicted characteristic life is
considered as the response of the system. In other words the design of experiment study
analyzes the influence of prediction method on predicted characteristic life.
Analysis of variance has been used for testing the equality of mean predicted life.
The data set for analysis contains characteristic life as the response variable input in a
continuous form and prediction method as the influencing factor, input in binary form. A
value of zero is input for experimental method and one is input for statistical method. For
every value of the characteristic life a zero or a one is input for the prediction method
depending on the method by which the characteristic life has been obtained. Generalized
linear model function of MINITABTM has been used for testing the equality of means.
The generalized linear model was used primarily because the data set was unbalanced.
The null hypothesis of the test assumes equality of mean predicted characteristic
life. The generalized linear model uses an F statistic for testing the equality of means.
The results of analysis of variance are given by Table 3.6. High P values of ANOVA
Table 3.6 shows a clear acceptance of the null hypothesis. Thus it can be concluded as

43
Source DF SeqSS
Adj SS Adj MS F Statistic P value
Prediction Method
1 44550 44550 44550 0.09 1.000
Error 90 24725672 24725672 274730
Total 91 24725672
Table 3.6: Single factor analysis of variance

44
no significant difference in the characteristic life predicted by the statistical models and
experimental methods.
3.9 MODEL VALIDATION
The effect of various design parameters on the thermal reliability of package have
been presented in this section. Multiple linear regression based sensitivity factors,
quantifying the effect of design, material, architecture and environmental parameters on
thermal fatigue reliability, have been used to compute life. The sensitivity study can be
used in building confidence during trade-off studies by arriving at consistent results in
terms of reliability impact of changes in material, configuration and geometry using
different modeling approaches. The predictions from the statistical model have also been
compared with the experimental data
3.9.1 DIE TO BODY RATIO
The Thermo-mechanical reliability of flex-BGA packages reduces with increase
in diagonal length. Multiple linear regression models have been used for evaluating the
sensitivity of solder joint reliability to diagonal length. The cycles for 63.2% failure from
the experimental data and multiple linear regression models have been plotted against the
die to body ratio of various devices. The predicted values from the prediction model
follow the experimental values quite accurately and show the same trend (Figure 3.).
Flex BGA packages with die to body ratio of 0.34, 0.53 and 0.79 have been used
for the comparison of multiple linear regression model predictions with the actual test
failure data. All the three packages had different ball count, ball diameter and PCB
thickness. Thus, the model is being tested for its ability to predict both single and coupled

45
0200400600800
100012001400160018002000
0.34 0.53 0.79
Die To Body Ratio
Cha
ract
eris
tic L
ife(C
ycle
s)
Predicted
Experimental
Figure 3.4 Effect of die to body ratio on thermal fatigue reliability of Flex-BGA packages.
Die To Body Ratio
Ball Count
Ball Diameter
Experiment MLR Sensitivity Factor For
Die To Body Ratio
0.34 40 0.45 1855 1749
0.53 132 0.45 1238 1359
0.79 132 0.45 940 872
-2946.5
Table 3.7: Sensitivity of the package reliability to die to body ratio and comparison of
model predictions with actual failure data

46
effects. A negative sensitivity has been computed for the effect of die to body ratio. A
negative sensitivity factor indicates that the characteristic life of a Flex BGA package
decreases when the die to body ratio increases.
3.9.2 BALL COUNT
The effect of ball count on thermo-mechanical reliability has been shown in Figure 3..
A trend of increase in the reliability with the increase in the ball count is visible, which is
also supported by the failure mechanics theory. With the increase in the ball count the
shear stress generated in the solder joints due to the thermal mismatch gets distributed,
thus reducing the stress in the individual joint and increasing the life of the solder joint.
Since this failure mechanics is only applicable in the case where the failure mode is
solder joint cracking, so the trend might be different for other failure modes such as
underfill delamination or copper trace cracking. Flex-BGa packages with ball counts 96,
132 and 280 have been used to validate the effect of ball count on the thermo-mechanical
reliability predicted by the model. The characteristic life predicted by the model lies in
close proximity to the actual characteristic life from the experimental thermal cycling
test. The sensitivity factor indicates an increase in characteristic life of FlexBGA
package by 2 cycles for ever addition of a solder ball.
3.9.3 BALL DIAMETER
The solder joint diameter has a direct influence on thermo-mechanical reliability
of Flex BGA packages. The thermo0mechanical reliability of the device increases with
increase in the ball diameter. This trend is supported by failure mechanics theory as,

47
0
500
1000
1500
2000
2500
96 132 280
Ball Count
Cha
ract
eris
tic L
ife (C
ycle
s)
Experimental
Predicted
Figure 3.5: Effect of ball count on thermal fatigue reliability of CBGA packages.
Ball Count
Die To Body Ratio
Ball Diameter
PCB Thickness
Experiment MLR Sensitivity Factor For Ball Count
96 0.65 0.3 0.85 780 886
132 0.53 0.45 0.85 1238 1359
280 0.53 0.45 0.85 1862 1911.26
1.8433
Table 3.8: Sensitivity of the package reliability to ball count and comparison of model
predictions with actual failure data

48
solder joints with larger ball diameter have lower stress concentration and longer crack
propagation path in the solder interconnects, thus adding to the thermo-mechanical
reliability of the device. Since this failure mechanics is only applicable in the case where
the failure mode is solder joint cracking, so the trend might be different for other failure
modes such as underfill delamination or copper trace cracking. Flex BGA packages with
solder joint diameter of 0.3 mm, 0.45 mm and 0.5 mm have been used for demonstrating
this trend [Figure 3.]. A positive sensitivity factor indicates the characteristic life of flex
BGA packages increases with increase in solder joint diameter. Model predictions show
good correlation with experimental data.
3.9.4 PCB THICKNESS
The effect of PCB thickness on thermo-mechanical reliability of FlexBGA
packages is given by Figure 3. . Thermo-mechanical reliability of FlexBGA packages
decreases with increase in PCB thickness. This trend has been demonstrated for
FlexBGA packages with PCB thickness of 0.85 mm and 1.6 mm. This trend is consistent
from failure mechanics point of view as increased PCB thickness leads to higher
assembly stiffness, which leads to increases stress levels in the interconnect. Sensitivity
of thermo-mechanical reliability on PCB thickness has been determined using multiple
linear regression method. The sensitivity factor indicates that for every unit increase of
PCB thickness keeping all other parameters constant the characteristic life of the
FlexBGA package decreases by 372 cycles. Model predictions show good correlation
with experimental data.

49
0
200
400
600
800
1000
1200
1400
1600
0.3 0.45 0.5
Ball Diameter
Cha
ract
eris
tic L
ife (C
ycle
s)
Experimental
Predicted
Figure 3.6: Effect of ball diameter on thermal fatigue reliability of Flex-BGA packages.
Ball Diameter
Die To Body Ratio
Ball Count
Delta T Experiment MLR Sensitivity Factor For
Ball Diameter
0.3 0.65 96 165 780 886
0.45 0.72 280 165 1058 1009.72
0.5 0.53 132 165 1408 1470
2216.4
Table 3.9 : Sensitivity of the package reliability to ball diameter and comparison of model
predictions with actual failure data

50
0
500
1000
1500
2000
2500
0.85 1.6
PCB Thickness
Cha
ract
eris
tic L
ife (C
ycle
s)
Experimental
Predicted
Figure 3.7 Effect of PCB thickness on thermal fatigue reliability of Flex-BGA packages
PCB Thickness
Die To Body Ratio
Ball Count
Ball Diameter
Experiment MLR Sensitivity Factor For
PCB Thickness
0.85 0.53 280 0.45 1862 1911
1.6 0.63 208 0.45 1215 1204
-372.37
Table 3.10: Sensitivity of the package reliability to PCB thickness and comparison of
model predictions with actual failure data

51
3.9.5 ENCAPSULANT MOLD COMPOUND FILLER CONTENT
The silicon die of the FlexBGA is encapsulated in a mold compound to protect it
from the external environment. Filler contents such as silica, with low CTE are added to
reduce the CTE of the mold compound. The thermo-mechanical reliability of the device
decreases with increase in the mold compound filler content. This is supported by failure
mechanics as addition of filler content reduces the CTE of the material and increases the
elastic modulus of the mold compound. Higher modulus of elasticity makes the package
stiffer, therefore higher stresses are transmitted to the solder joint. Also, the lower CTE
increases the local and global thermal mismatch. This trend has been demonstrated for
two levels of mold compound filler content, high and low. A binary variable has been
used for describing the two levels. A value of 1 has been assigned for low mold
compound filler content and 0 for high mold compound filler content. This trend has been
demonstrated in Figure 3. for die to body ratio of 0.63 and 0.72 respectively.
3.9.6 SOLDER MASK DEFINITION
The thermo-mechanical reliability of FlexBGA packages is higher for solder
joints with NSMD pad configuration than SMD pad configuration. This trend has been
demonstrated for Flex BGA package with a die to body ratio of 0.54, subjected to thermal
cycling of -400C to 1250C. This is supported by failure mechanics theory as SMD pad
configuration can introduce stress concentrations near the solder mask overlap region that
can result in solder joint cracking under extreme fatigue conditions. However, in a
NSMD pad configuration the solder is allowed to wrap around the sides of the metal pads

52
0
200
400
600
800
1000
1200
1400
Low High
EMC Filler Content
Cha
ract
eris
tic L
ife (C
ycle
s)
Experimental
Predicted
Figure 3.8: Effect of EMC filler content on thermal fatigue reliability of Flex-BGA
packages.
EMC Filler ID
Die To Body Ratio
Ball Count
Ball Diameter
Experiment MLR Sensitivity Factor For
EMC Filler ID
Low 0.63 208 0.45 1215 1204
High 0.72 280 0.45 1058 1009
341.30
Table 3.11: Sensitivity of the package reliability to encapsulant mold compound filler
content and comparison of model predictions with actual failure data
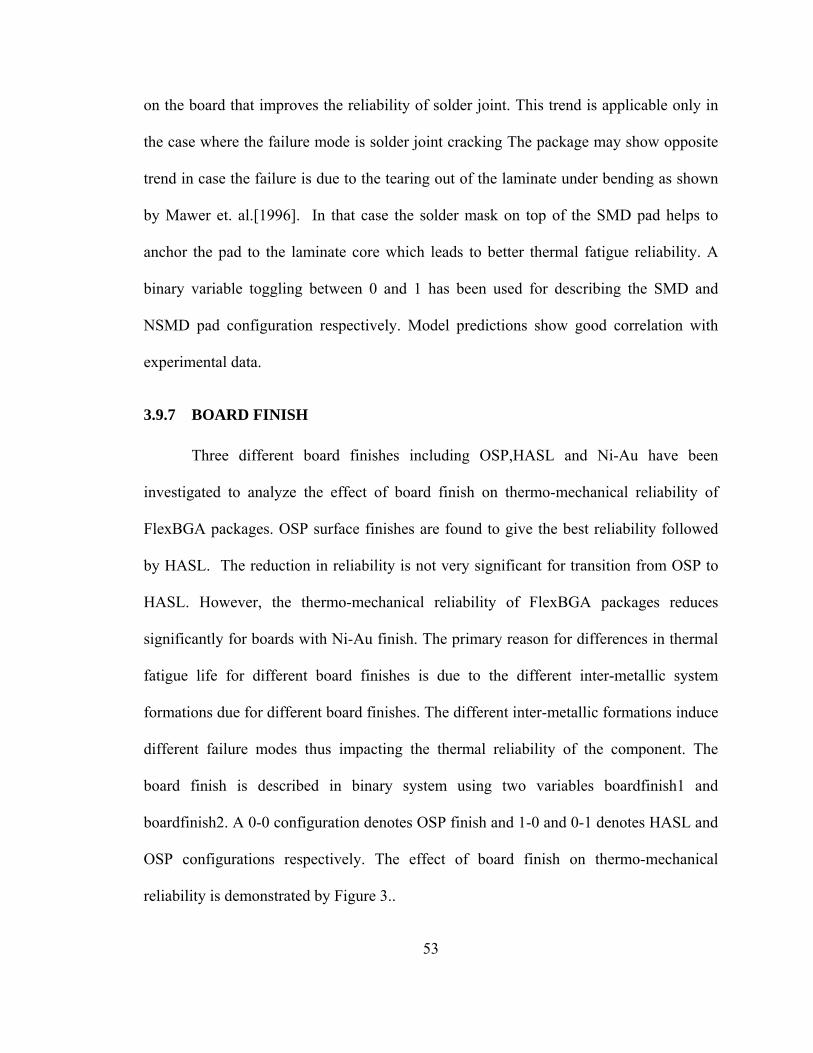
53
on the board that improves the reliability of solder joint. This trend is applicable only in
the case where the failure mode is solder joint cracking The package may show opposite
trend in case the failure is due to the tearing out of the laminate under bending as shown
by Mawer et. al.[1996]. In that case the solder mask on top of the SMD pad helps to
anchor the pad to the laminate core which leads to better thermal fatigue reliability. A
binary variable toggling between 0 and 1 has been used for describing the SMD and
NSMD pad configuration respectively. Model predictions show good correlation with
experimental data.
3.9.7 BOARD FINISH
Three different board finishes including OSP,HASL and Ni-Au have been
investigated to analyze the effect of board finish on thermo-mechanical reliability of
FlexBGA packages. OSP surface finishes are found to give the best reliability followed
by HASL. The reduction in reliability is not very significant for transition from OSP to
HASL. However, the thermo-mechanical reliability of FlexBGA packages reduces
significantly for boards with Ni-Au finish. The primary reason for differences in thermal
fatigue life for different board finishes is due to the different inter-metallic system
formations due for different board finishes. The different inter-metallic formations induce
different failure modes thus impacting the thermal reliability of the component. The
board finish is described in binary system using two variables boardfinish1 and
boardfinish2. A 0-0 configuration denotes OSP finish and 1-0 and 0-1 denotes HASL and
OSP configurations respectively. The effect of board finish on thermo-mechanical
reliability is demonstrated by Figure 3..

54
0200
400600800
100012001400
16001800
SMD NSMD
Solder mask Defanition
Cha
ract
eris
tic L
ife (C
ycle
s)
Experimental
Predicted
Figure 3.9: Effect of solder mask definition on thermal fatigue reliability of Flex-BGA
packages
Pad Configuration
Ball Count
PCB Thickness
DeltaT Experiment MLR Sensitivity Factor For
Pad Configuration
SMD 160 1.6 165 805 807
NSMD 132 1.6 165 1597 1636
832.8
Table 3.12: Sensitivity of the package reliability to pad configuration and comparison of
model predictions with actual failure data

55
0200400600800
100012001400160018002000
OSP HASL NiAu
Board Finish
Cha
ract
eris
tic L
ife (C
ycle
s)
Experimental
Predicted
Figure 3.10: Effect of board finish on thermal fatigue reliability of Flex-BGA packages Board Finish
Die To Body Ratio
Ball Count
DeltaT Experiment MLR Sensitivity Factor For
Board Finish
OSP 0.34 40 165 1855 1749
HASL 0.54 132 165 1597 1636
NiAu 0.54 132 165 673 673
-656.7
Table 3.13: Sensitivity of the package reliability to board finish and comparison of model
predictions with actual failure data
56
3.9.8 DELTA T
The environment or testing condition the package is subjected to has a great
influence on thermo-mechanical reliability Flex-BGA packages. The characteristic life of
the package decreases with the increase in the temperature range of the ATC. This trend
has been demonstrated for two different cycling conditions including 0 t0 1000C and -40
to 1250C. Temperature cycle magnitude has a negative sensitivity factor, indicated by
decrease in thermo-mechanical reliability with increase in temperature cycle magnitude.
The predicted values for characteristic life calculated based multiple linear regression
model match the experimental values from the ATC test very accurately.
3.10 DESIGN GUIDELINES
The statistical models presented in this section have been used for providing
design guidelines for smart selection of a flip chip technologies. The sensitivities from
the statistical models have been used to analyze the effect of various parameters on the
solder joint reliability of the Flex-BGA packages
• Thermo-mechanical reliability of Flex-BGA packages decreases with increase in
die to body ratio. This effect has been demonstrated for various board finishes and
solder pad configuration.
• The solder joint reliability of Flex-BGA package increases with increase in ball
count.
• Increase in ball diameter increases the solder joint reliability of Flex-BGA
package.

57
0
500
1000
1500
2000
2500
3000
100 165
DeltaT
Cha
ract
eris
tic L
ife (C
ycle
s)
Experimental
Predicted
Figure 3.11: Effect of Delta T on thermal fatigue reliability of Flex-BGA packages
Delta T
Die To Body Ratio
Ball Count
Ball Diameter
Experiment MLR Sensitivity Factor For
Delta T
100 0.53 132 0.45 2497 2374
165 0.72 280 0.45 923 1009
-11.318
Table 3.14 : Sensitivity of the package reliability to Delta T and comparison of model
predictions with actual failure data.

58
• PCB thickness has a negative sensitivity on solder joint reliability. Increasing the
thickness of PCB decreases the thermo-mechanical reliability of Flex-BGA
packages.
• Increasing the filler content of the encapsulant mold compound decreases the
solder joint reliability of Flex-BGA packages.
• Solder joints with NSMD pad configuration have better reliability than solder
joints with SMD pad configuration.
• HASL and OSP pad finishes are significantly more reliable than Ni-Au for
FlexBGA packages, and OSP gives better thermo-mechanical reliability than
HASL.
• Thermo-mechanical reliability of the solder joint in a Flex-BGA package is
inversely proportional to the temperature differential through which the package
under goes thermal cycling.

59
CHAPTER 4
STATISTICS BASED CLOSED FORM MODELS FOR FLIP CHIP PACKAGES
Increased utilization of flip chip packages in a wide variety of applications
including portable consumer electronics like cellular phones [Sillanpaa et al. 2004],
laptops [Pascariu et al. 2003], under-the-hood electronics [Jung et al. 1998], microwave
applications [Bedinger 2000], system in package (SIP) [Van den Crommenacker, 2003],
high-end workstations [Ray et al., 1997], and other high performance applications has
driven the need for predictive methodologies for maintaining high levels of reliability and
performing thermo-mechanical trade-offs. The reliability of flip chips has been found to
depend on various factors including underfill material and process, moisture, flux, solder
mask and solder mask opening design, chip passivation, chip and substrate thickness, gap
between chip and substrate, and solder joint layout.[ Borgensen, et al.] Solder joint
fatigue due to difference in coefficients of thermal expansion of silicon chip and organic
laminate substrate is a dominant failure mechanism [Lau, 1996].
In this section, a perturbation approach to prediction of reliability of flip-chip
devices in harsh environments has been investigated. The proposed approach has been
shown to achieve a much higher accuracy compared to traditional first-order models by
perturbing known accelerated-test data-sets using models, using factors which quantify
the sensitivity of reliability to various design, material, architecture and environmental
parameters. The models are based on a combination of statistics, failure mechanics, and

60
finite element methods. The proposed approach has the potential of predicting both
single and coupled factor effects on reliability, which are often ignored in closed form
models.
Multiple linear regression models and principal components regression models
have been used for relating characteristic life to various geometric aspects and material
properties. Previous studies have developed multivariate regression models to study the
influence of these parameters on thermal reliability [Lall et al 2005].Previous analyses
reported in the literature were confined to satisfying basic model assumptions however
failed to cope with multi-collinearity problem. This section presents the results of an
investigation on robust modeling methodologies for studying the effect of material and
geometric parameters on the thermo-mechanical reliability of underfilled flip-chip
devices on various substrates including organic laminate, and metal-backed flex.
4.1 FLIP CHIP PACKAGE ARCHITECTURE
Flip chip is a method of attaching the bumped chip on to a substrate. In flip chip
packaging the die is inverted face down directly onto a package or a printed wired board,
by means of solder bumps typically deposited on the integrated circuit or wafer and
bonded to the package or PWB. A typical flip chip on board (FCOB) is shown in. Flip
chip packages offer the advantages of high I/O, shortest electrical connection and hence
improved electrical performance, low cost and high speed production. An underfill is
used in flip chip packages for distributing the stresses in the solder thereby increasing the
thermo-mechanical reliability of solder joints.

61
Figure 4.1: Cross Section of Flip Chip BGA Package
Solder Joint (24.0ppm/°C)
Passivation
Printed Circuit Board (16.0ppm/°C)
Copper Pad (16.0ppm/°C)
Solder Mask Silicon Chip (2.0ppm/°C) Underfill (35-70ppm/°C)

62
4.2 DATA SET
The dataset used for model building has been accumulated from an extensive flip-
chip accelerated test reliability database based on the harsh environment testing by the
researchers at the NSF Center for Advanced Vehicle Electronics (CAVE). This database
has also been supplemented with the various datasets published in the literature. Each
data point in the database is based on the characteristic life of a set of flip-chip devices of
a given configuration tested under harsh thermal cycling or thermal shock conditions.
The model parameters are based on failure mechanics of flip-chip assemblies subjected to
thermo-mechanical stresses. The material properties and the geometric parameters
investigated include die thickness, die size, ball count, ball pitch, bump metallurgy,
underfill types (capillary-flow, reflow encapsulant), underfill glass transition temperature
(Tg), solder alloy composition (SnAgCu, SnPbAg), solder joint height, bump size, and
printed circuit board thickness. Range of data collected in each case is shown in Table 4.1
. The database is fairly diverse in terms of materials and geometry parameters.
4.3 MODEL INPUT SELECTION
Predictor variables for model building have been selected by developing a super-
set of variables that are known to influence the characteristic life of an area array package
and then selecting the potentially important variables using stepwise regression and
method of best subsets. Coefficient of multiple determination, adjusted R2, residual mean
squares and induced bias has been used as criteria for variable selection. Coefficient of
multiple determination (R2), given by equation 1, measures the overall adequacy of the
regression model and variables that create a significant increase in coefficient of multiple

63
Parameter Data Range
Die Size 2.5 mm to 10 mm
Ball Count 24 to 184
Ball Pitch 0.2 mm to 0.457 mm
Ball Diameter 0.08 mm to 0.178 mm
Ball Height 0.06 mm to 0.13 mm
Solder Composition Sn63Pb37, Sn96.5Ag3.5, 95.5Sn3.5Ag1.0Cu,
Sn99.3Cu0.7, Sn95.8Ag3.5Cu0.7
PCB Thickness 0.5 mm to 1 mm
THigh, Accelerated Test 100°C, 125°C, 150°C
TLow, Accelerated Test -55°C, -40°C, 0°C
Table 4.1 Scope of accelerated test database

64
determination are retained in the model. As coefficient of multiple determination
increases marginally for every newly added variable, adjusted R2, given by equation 2,
has been used for studying the overall adequacy of the model and variables that create
significant increase in adjusted R2 are retained in the model.
Total
sidual
SS
SSR Re2 = Eq 4.1
( )22 11
1 pAdj Rpn
nR −
−
−−= Eq 4.2
Residual mean square, given by Equation 3, is a measure of model errors .The
residual mean square is calculated for all possible subset of variables and the subset that
minimizes residual mean square is selected for model building. Mallow’s Cp statistic,
given by equation 4, determines the induced bias for a model with p variables and n data
points. The Cp statistic is related to the mean square error of the fitted value and subset of
variables with minimum Cp value also minimizes residual mean square. Potentially
important variables are the ones that describe maximum information content in the data
set with minimum variance and bias. Since there cannot be an optimum value for all the
criteria, decision is based on satisfactory values. Stepwise regression and method of best
subsets have been used for arriving at best set of predictor variables.
pn
SSMS s
s−
= ReRe Eq 4.3
pnSS
C sp 2
2
Re +−=σ
Eq 4.4

65
Flip chip model variables have been selected by defining all the variables that are
known to influence the characteristic life of a flip-chip device. Die length was identified
as a potentially important and hence was selected as the first-variable. A regression
equation was fit with characteristic life as response variable and die length as predictor
variable and the criteria’s for model selection were studied. Die length was found to
explain large proportion of variation and the residual mean square and Cp values were
quiet close model with all the variables. Diagonal length was selected as the next variable
and a regression equation with die length and diagonal length as predictor variables was
fit. Addition of diagonal length need not increase the coefficient of determination
substantially as did die length and hence was dropped from the model. Underfill modulus
was identified as the next potentially important variable and a regression equation with
characteristic life as response variable and underfill modulus and die length as predictor
variables was fit. Addition of underfill modulus yielded an increase in the coefficient of
determination and reduction in residual mean square and hence was retained. Predictor
variable were added in succession, regression equation was fit, criteria’s of model
selection were studied and decision for retention and drop of the variable was made. The
best subset of flip chip predictor variables obtained include die length, underfill modulus,
ball pitch, ball diameter, ball height, undercover area and Delta T. The results of stepwise
regression are given by Table 4.2.

66
Step 1 2 3 4 5 6 7
Constant
2494.3 1783.9 2669.1 1088.2 910.2 3080.6 4438.8
DieLengthMM -147
-115 -87 -87 -296 -543 -665
T-Statistic -3.24
-2.59 -2.13 -2.30 -2.23 -3.59 -4.03
P-Value 0.002
0.013 0.039 0.026 0.031 0.001 0.000
UnderfillEGpa 56
136 158 144 128 110
T-Statistic 2.53
4.42 5.37 4.77 4.46 3.67
P-Value 0.015
0.000 0.000 0.000 0.000 0.001
BallPitchMM -6555
-8877 -8351 -7227 -6925
T-Statistic -3.41
-4.56 -4.31 -3.93 -3.83
P-Value 0.001
0.000 0.000 0.000 0.000
BallDiaMM 22923
29754 31895 32913
T-Statistic 2.94
3.41 3.93 4.13
P-Value 0.005
0.001 0.000 0.000
UndercoverAreaSqMM 19
43 53
T-Statistic 1.63
3.16 3.63
P-Value
0.110
0.003 0.001
BallHeightMM -19650
-18387
T-Statistic -2.83
-2.69
P-Value 0.007
0.010
DeltaT -6.9
T-Statistic -1.67
P-Value 0.102
R-Sq 18.28
28.27 43.00 52.37 55.16 62.33 64.74
R-Sq(Adj) 16.54
25.16 39.20 48.04 49.94 56.94 58.72
C-P 46.5
37.3 22.8 14.3 13.2 7.2 6.5
Table 4.2: Stepwise Regression of Flip-Chip Predictor Variables

67
4.4 MULTIPLE LINEAR REGRESSION
Multiple linear regression has been used for developing a linear relationship
between characteristic life and best set of variables obtained from model input selection.
The relationship is expressed as an equation that predicts a response variable from a
function of predictor variables and parameters. The parameters are adjusted so that a
measure of fit is optimized.
Multiple linear regression models were created using the potentially important
variable’s. Diagnosis of multicollinearity using Pearson’s correlation coefficient, given
by Table 4.3, revealed serious correlation between dielength and undercover area,
suggesting suggesting that only one of the variables can be used in the multiple
regression model. In the case of some models, removal of either predictor variables may
result in significant drop in the coefficient of determination and in such cases, the original
variables have been transformed using natural log, power and square root transformations
and multiple linear regression has been carried out on the transformed variables. The
prediction model based on natural log transformation, given by Table 4.4 displayed good
model parameters with correct trends and hence has been chosen for prediction purposes.
The natural log transformed prediction equation is given by Equation 4.5
diaglen
BallhtpitchDeltaTSolderDiasolderE
UndCTEundEUndareasticlifecharacteri
ln216.68
ln645.2ln800.0813.4ln805.1ln665.0
ln292.0ln481.0ln088.34924.66ln
×−
×+×−×−×+×−
×−×+×+=
Eq 4.5

68
4.5 HYPOTHESIS TESTING
The overall adequacy of the regression model and significance of individual
regression coefficients have been tested using hypothesis testing methods. ANOVA table
given by Table 4.5 has been used for testing the overall adequacy of the model. The p-
value in the ANOVA table indicates the statistical significance of the regression equation.
A P value of less than 0.05 is a rejection of the null hypothesis signifying the presence of
linear relationship between characteristic life and at least one of the geometric, material
properties and environmental conditions.
Coefficient of determination, R2, which determine the percentage of variation of
the response variable explained by the predictor variables, has also been used for
assessing the overall adequacy of the prediction model. An R2 value of 0.96 suggests the
predictor variables describe almost 96% of variation in characteristic life proving the
overall adequacy of the model. Since, R
2 increases for every additional predictor variable,
adjusted R2, which is a modification of R
2, that accounts of addition of new predictor
variable has also been studied. An adjusted R2 value of 95% of the prediction equation
reconfirms the overall adequacy of the model.
T tests on individual regression coefficients have been performed for determining
the importance of each predictor variable for retaining in the model. The p-value of a
parameter in Table 4.4 indicates the statistical significance of that parameter and the
parameter with p-value less than 0.05 is considered to be statistically significant and
expected to have a significant effect on the reliability of the package, with confidence
level of more than 95.0%. All the predictor variables in Table 4.4 are statistically
significant with p-values in the neighborhood of 0 to 5%.

69
DielengthMM UndAreaSqMM BallPitchMM BallDiaMM BallheightMM UnderfillEGpa DeltaTDegC
DielengthMM 1 0.94287 -.06288 0.18536 0.20931 -0.27463 -0.12668
UndAreaSqMM 0.94287 1 -.08799 -.06426 0.40774 -0.21080 0.03898
BallPitchMM -.06288 -.08799 1 0.22462 0.01424 0.77619 -0.27825
BallDiaMM 0.18536 -.06426 0.22462 1 -.36201 0.11882 -0.44602
BallheightMM 0.20931 0.40774 0.01424 -.36201 1 0.02007 0.36292
UnderfillEGpa -0.27463 -0.21080 0.77619 0.11882 0.02007 1 -0.24482
DeltaTDegC -0.12668 0.03898 -0.27825 -0.44602 0.36292 -0.24482 1
Table 4.3 Pearson’s correlation matrix of flip chip predictor variables

70
Predictors
(ln a0, fk)
Coeff
(bk)
SE
Coeff T P-Value
Constant (ln a0) 66.924 19.565 3.421 0.002
lnUndCovSqmm 34.088 10.841 3.144 0.004
lnUndEGpa 0.481 0.219 2.195 0.035
lnUndCTEppm -0.292 0.102 -2.862 0.007
lnSolderEGpa -0.665 0.283 -2.352 0.025
lnSolderDiaMM 1.805 0.867 2.082 0.045
lnDeltaTdegC -4.813 2.342 -2.055 0.048
lnPitchMM -0.800 0.366 -2.184 0.036
lnBallHgtMM 2.645 0.794 3.331 0.002
lnDiagLenMM -68.216 21.645 -3.152 0.003
Table 4.4: Multiple linear regression model of Flip-Chip package using natural log
transformed flip chip predictor variables
Source D.F SS MS F P
Regression 9.00 39.6757 4.4084 80.93 0.000000
Residual Error 29.00 1.5798 0.0545
Total 38.00 41.2555
Table 4.5 : Analysis of variance Of log transformed flip chip prediction model.

71
4.6 MODEL ADEQUACY CHECKING
Model appropriateness for application has been checked using any one or
combination of the several of the features of the model, such as linearity, normality,
variance which may be violated. Model residuals which measure deviation between data
and fit have been studied and plotted to check model appropriateness and violation of
assumptions. Residual plots studied include, the normal probability plot, histogram plot
of residuals, plot of residuals against fitted values, plot of residual against regressor and
plot of residual in time sequence (Figure 4.2). Departures from normality and the
resultant effect on t-statistic or f-statistic and confidence and prediction intervals have
been studied using normal probability plots. A straight line variation indicates a
cumulative normal distribution. Plots of residuals against fitted values and plots of
residuals against the regressors have been used to check for constant-variance. Existence
of residuals within the normal band indicates constant variance.
Multi-collinearity has been checked using Pearson’s correlation matrix and
variance inflation factor values. Although the natural log transformation corrected the
wrong sign of coefficients in the regression equation, multi-collinearity problem did not
cease to exist. This is evident from the large values in the Pearson’s correlation matrix.
However, since the natural log transformed model has a high coefficient of determination
and conforms to model assumptions it can very well be used for prediction purposes.
Advanced multivariate techniques have been discussed for coping with multi-collinearity
problem.

72
Figure 4.2: Residual plots of log transformed flip chip prediction model

73
LnUndcover
Area
Ln
UnderfillE
Ln
Underfill
CTE
Ln
SolderE
Ln
Solder
CTE
Ln
DeltaT
Ln
Pitch
Ln
Ball
Height
Ln
Diagonal
Length
LnUnder
coverArea
1.00000 -0.14587 -0.18018 0.29163 -0.03948 -0.13070 -0.27052 0.00672 0.99892
Ln
UnderfillE
-0.14587 1.00000 0.86323 0.13244 0.57261 0.81460 -0.41973 0.57967 -0.18489
Ln
Underfill
CTE
-0.18018 0.86323 1.00000 0.09936
0.65041 -0.87380 -0.22910 0.51306 -0.21992
Ln
SolderE
0.29163 0.13244 0.09936 1.00000 -0.05906 0.06497 -0.23586 0.16766 0.28708
Ln
Solder
CTE
-0.03948 0.57261 0.65041 -0.05906 1.00000 0.40160 -0.43848 0.19506 -0.01841
Ln
DeltaT
-0.13070 0.81460 0.87380 0.06497 -0.40160 1.00000 0.00583 0.60647 -0.17461
Ln
Pitch
-0.27052 - -0.41973 -0.22910 -0.23586 0.43848 0.00583 1.00000 -0.08005 -0.26502
Ln
Ball
Height
0.00672 0.57967 0.51306 0.16766 -0.19506 0.60647 -0.08005 1.00000 -0.01616
Ln
Diagonal
Length
0.99892 0.18489 -0.21992 0.28708 -0.01841 -0.17461 -0.26502 -0.01616 1.00000
Table 4.6: Pearson’s correlation matrix of log transformed flip chip predictor variables

74
4.7 PRINCIPAL COMPONENTS REGRESSION
Multiple linear regression methods assume the predictor variables to be
independent of each other. Linearly dependent variables result in multi-collinearity,
instability and variability of the regression coefficients [Cook et al. 1977]. Principal
components models have been used for dealing with multi-collinearity and producing
stable and meaningful estimates for regression coefficients [Fritts et al 1971]. The
principal components technique determines a linear transformation for transforming the
set of X predictor variables into new set Z predictor variables known as the principal
components. The set of new Z variables are uncorrelated with each other and together
account for much of variation in X. The principal components correspond to the principal
axes of the ellipsoid formed by scatter of simple points in the n dimensional space having
X as a basis. The principal component transformation is thus a rotation from the original
x coordinate system to the system defined by the principal axes of this ellipsoid [Massay
1965].
The principal component transformation ranks the new orthogonal principal
components in the order of their importance. Scree plots, eigen values and proportion of
total variance explained by each principal component are then used to eliminate the least
important principal components. Multiple linear regression is then performed with the
original response variable and reduced set of principal components and the parameters of
regression are obtained using method of least squares. The principal components
estimators are then transformed back to original predictor variables using the same linear
transformation. Since the ordinary least square method has been used on principal

75
components, which are pairwise independent, the new set of predictor coefficients are
more reliable.
The matrix of original correlated variables X, has been created from the flip chip
dataset.A principal component analysis has been performed on this original predictor
variable matrix X and its eigen values and corresponding eigen vectors have been
extracted. The first four eigen vectors explained more than 85% of the original matrix
and had eigen values greater than 1. A kink in the scree plot (Figure 4.3) supports the
selection of first four eigen vectors. A transformation matrix, V has been created with
first four eigen vectors.
X =
V =
2005.60.1100.0800.2006.2502.50
- - - - - - -
- - - - - - -
1805.60.1100.0800.300100.010.00
1005.60.1100.0800.30025.005.00
1805.60.1100.0800.3006.2502.50
16510.70.1110.1120.20026.015.10
0.504- 0.444 0.371- 0.230
0.228 0.415 0.332 0.423-
0.190- 0.621 0.116 0.300
0.802- 0.345- 0.302 0.233-
0.089- 0.299 0.475 0.387-
0.075 0.021 0.434 0.512
0.022 0.190- 0.484 0.460

76
Figure 4.3: Scree plot for selecting the number of principal components

77
The original predictor variable matrix X has then been transformed into principal
component scores Z using the transformation
Z = X × V
Each score of principal component or Z is a linear combination of the original flip chip
predictor variables and can be used as an independent variable for model building. The
first principal component score. Z1 is given by Equation 4.6
DeltaTUNderfillEBallheighterBallDiamet
ballpitcherareaUnderDielengthz
×+×−×+
×−×−×+×=
230.0423.0300.0
233.0387.0cov512.0460.01 Eq 4.6
A multiple linear regression analysis has been performed with characteristic life
as response variable and the four principal components as predictor variables. The
regression equation of the principal components is given by Table 4.7. An Alpha matrix
with coefficients of principal components is then created.
Alpha =
The coefficients of regression of the original variables are obtained by transforming the
coefficients of regression of the principal components using the transformation,
Beta = V × Alpha
Beta =
where, beta is a matrix of regression coefficients of original variables. The prediction
equation with original variables is given by Table 4.9. The prediction equation is given
by Equation 4.7
DeltaTUnderfillEBallheighterBalldiamet
BallpitchUnderareaDielengthsticlifeCharacteri
×−×+×+×
+×−×+×−=
9.86.462125.2507
9.8551.623.367%63Eq 4.7
[ ]8.9- 46.6 212 2507.5 855.9- 21.6 367.3- 4389
[ ]2055.5 825.2 1286.4- 797.6

78
Predictor Coeff (bk) SECoeff T value P value
Constant 4389 1354 3.24 0.002
Z1 797.6 322.6 2.47 0.017
Z2 -1286.4 504.6 -2.55 0.014
Z3 825.2 292.5 2.82 0.007
Z4 2055.5 780.7 2.63 0.012
Table 4.7: Multiple linear regression model using principal components of flip chip
predictor variables
Source D.F SS MS F P
Regression 9.00 39.6757 4.4084 80.93 0.000000
Residual Error 29.00 1.5798 0.0545
Total 38.00 41.2555
Table 4.8: Analysis of variance of multiple linear regression model with principal
components as variables

79
Predictors
(a0, fk)
Coeff
(bk)
SE
Coeff
T Statistic P-Value
Constant 4389 1354 3.24 0.002
DeilengthMM -367.3 48.313 7.60 0.000
UndercoverAreaSqMM 21.6 4.5798 4.72 0.000
BallPitchMM -855.9 500.32 1.71 0.001
BallDiaMM 2507.5 946.80 2.64 0.000
Ball HeightMM 212 59.324 3.57 0.000
UnderfillEGpa 46.6 5.5540 8.30 0.000
DeltaDegC -8.9 7.2452 1.22 0.0043
Table 4.9: Principal component regression model using original flip chip predictor
variables

80
4.8 HYPOTHESIS TESTING
The overall adequacy of the model has been tested using ANOVA table given by
Table 4.8. Small P value of the ANOVA table rejects the null hypothesis proving the
overall adequacy of the model. Individual T tests on the coefficients of regression of
principal components yielded very small P values indicating the statistical significance of
all the four variables.
The individual T test values of principal components regression components are
then used for conducting individual T test on the coefficients of regression of original
variables. The test statistic proposed by Mansfield et al.[1997] and Gunst et al. [1980] for
obtaining the significance of coefficients of regression of original variables is given by
Equation 4.8
2
1
1
21
,
×
=
∑=
−l
m
jmm
pcj
vMSE
bt
λ
Eq 4.8
Where bj,pc is the coefficient of regression of the jth
principal component, MSE is the
mean square error of the regression model with l principal components as its predictor
variables, vjm is the jth
element of the eigen vector vm and λm is its corresponding eigen
value. M takes the values from 1 to l, where l is the number of principal components in
the model. The test statistic follows a students T distribution with (n-k-1) degrees of
freedom. The P values of individual T tests given by Table 4.9 are very small proving the
statistical significance of individual regression coefficients of original predictor variables.

81
4.9 MODEL ADEQUACY CHECKING
The principal components regression model has been checked for underlying
model assumptions such as normality, constant variance and independence. Residual
plots have been used for studying the violations of model assumptions. The residual plots
studied include normal probability plot, histogram plot of residuals, plot of residuals
against fitted values, plot of residual against regressor and plot of residual in time
sequence. Straight line variation of normal probability plot shows cumulative normal
distribution. Presence of residuals in a horizontal band shows no violation of constant
variance assumption. Since each principal component is a linear combination of original
predictor variables, they become multivariate variables. Multivariate normality of each
principal component has been checked using Chi-Square plots and Q-Q plot. Straight line
variation of both the plots shows cumulative multivariate normal distribution.
Multicollinearity of the principal component variables has been studied using
Pearson’s correlation matrix and variance inflation values. Since the principal
components are orthogonal to each other the multi-collinearity problem ceased to exist.
Addition of fifth principal component however created serious multi-collinearity
problems justifying the decision of retaining only first four variables.
4.10 MODEL CORRELATION WITH EXPERIMENTAL DATA
The predicted characteristic life of the statistical model has been compared with
the actual characteristic life to asses the prediction ability of the statistical models. A
single factor design of experiment study with prediction method as the factor and
multiple linear regression, principal components regression and experimental results as

82
its three levels has been used for correlating the statistical model results with
experimental results. Analysis of variance has been used for testing the equality of mean
predicted characteristic life. The null hypothesis of the test is that the mean characteristic
life of all the prediction methods is the same. The alternate hypothesis is there is at least
one method with predicted characteristic life different from the others. High P values of
ANOVA table [Table 4.10] shows a clear acceptance of the null hypothesis. Thus it can
be concluded that there is no significant difference in the characteristic life predicted by
the statistical models and experimental methods. T tests [Table 4.11] have been used for
comparing the individual pairs of means. High P values of both the paired T tests shows
that the predicted characteristic life of MLR and PCR methods is same as that of
experimental values.
4.11 MODEL VALIDATION
The statistical modeling methodology presented in this section has been validated
against the experimental accelerated test failure data. Statistical model predictions have
been done by using multiple linear regression models and principal components
regression models. Statistics and failure mechanics based sensitivity factors quantifying
the effect of design, material, architecture, and environment parameters on thermal
fatigue reliability have been used to compute life. The predictions from the statistical
model have also been compared with the experimental data. The effect of the various
design parameters on the thermal reliability of the package has been presented. The
sensitivity study can be used in building confidence during trade-off studies by arriving at

83
Figure 4.4 : Residual plot of principal components regression model

84
Figure 4.5 : Chi Square plot of principal components regression model
Figure 4.6: Q-Q plot of principal components regression model

85
Source DF SeqSS
Adj SS Adj MS F Statistic P value
Prediction
Method
2 121420582
121420582
60710291
1.10
0.336
Error 92 5055826106
5055826106
54954632
Total 94 5177246688
Table 4.10: Single Factor Analysis of Variance
Prediction
Method
Diff Of Means SE Of
Difference
T Statistic P value
MLR &
Experimental
2721.4 1941 1.4019 0.4929
PCR &
Experimental
354.9 1772 0.2003 1.0000
Table 4.11 : Pair-wise T Test

86
consistent results in terms of reliability impact of changes in material, configuration and
geometry using different modeling approaches.
4.11.1 DIE LENGTH
The thermo-mechanical reliability of flip-chip devices generally decreases with
increase in the die length. This effect has been demonstrated in flip-chip devices
soldered to both FR4-substrate and BT-substrates. Multiple linear regression and
principal components regression models have been used to evaluate sensitivity to die
length. The cycles for 63.2% failure from the experimental data and multiple linear
regression and principal components model’s have been plotted against the die length of
various devices. The predicted values from the prediction model follow the experimental
values quite accurately and show the same trend (Figure 4.7). This trend is also
consistent from the failure mechanics standpoint, as the solder joints with larger die
length are subjected to much higher strains due to the increased distance from the neutral
point, thus having lower reliability.
Encapsulated flip-chip packages with die length of 6.3mm and 10mm have been
used for the comparison of the principal components regression and multiple linear
regression model predictions with the actual test failure data. Both the packages had
eutectic (Sn37Pb) solder joints of different ball diameter, pitch and pad definition and
were subjected to different air-to-air thermal cycles (ATC) including thermal cycle of–
40°C to 125°C, and –55°C to 125°C. Thus, the model is being tested for its ability to
predict both single and coupled effects. A negative sensitivity has been computed for the
effect of die length. A negative sensitivity factor indicates that the characteristic life of a

87
flip-chip decreases when the die length increases and all the other parameters remaining
constant. The characteristic life of both the packages is plotted in Figure 4.7
4.11.2 SOLDER JOINT DIAMETER
The thermo-mechanical reliability of the flip-chip devices is also influenced by
the solder joint or bump diameter. Flip-chip with bigger bump size usually gives higher
reliability for the device. This trend is supported by the characteristic life plot for the
flip-chip device for two different ball diameters. Flip-chip with larger bumps has lower
stress concentration and longer crack propagation path in the solder interconnects, thus
adding to the thermo-mechanical reliability of the device. The encapsulated flip-chip
used for the validation had ball diameter of 0.08 mm and 0.112 mm respectively. A
positive sensitivity factor indicates the characteristic life of flip chip increases with
increase in bump size.
4.10.2 SOLDER JOINT HEIGHT
The effect of solder height on thermo-mechanical reliability of flip chip has been
presented in Figure 4.9. The increase in the thermo-mechanical reliability of the device
with increase in the ball height is demonstrated by both multiple linear and principal
components regression models. This trend is supported by failure mechanics theory, as
taller solder joints have longer crack propagation length. Encapsulated flip- chip
packages with ball height of .08mm and .11mm, die size 10 and 5.1 respectively have
been used for the comparison of the principal components regression and multiple linear
regression model predictions with the actual test failure data. A positive sensitivity factor

88
0
500
1000
1500
2000
2500
6.3 10
Die Length
Ch
ara
cte
risti
c L
ife
(C
yc
les)
Experiment
MLR
PCR
Figure 4.7: Effect of die length on thermal fatigue reliability of encapsulated flip-chip
with Sn37Pb solder joints.
Die Length
(mm)
Ball
Pitch
(mm)
Ball
Dia
(mm)
Experiment MLR PCR Sensitivity
Factor For
Die length
6.3 0.457 0.178 2050 1829
2378
14.14 0.2 0.08 1800 1575
1558
-367.3
Table 4.12: Sensitivity of the package reliability to the die length and comparison of
model predictions with actual failure data.

89
0
500
1000
1500
2000
2500
3000
3500
4000
0.08 0.112
Solder Joint Diameter
Ch
ara
cte
risti
c L
ife
(C
yc
les
)
Experiment
MLR
PCR
Figure 4.8 Effect of solder joint diameter on thermal fatigue reliability of flip-chip
packages subjected to thermal cycling of -550C to 125
0C
Solder
Joint
Diameter
(mm)
Diagonal
Length
(mm)
Ball
Pitch
(mm)
Ball
Height
(mm)
Ball
Dia
(mm)
Experiment MLR PCR Sensitivity
Factor
For
Solder
Joint
Diameter
0.08 8.50 0.2 0.094 0.08 2250 1985
1525
0.112 7.21 0.2 0.112 0.111 3485 2240 2727
2507.5
Table 4.13: Sensitivity of the package reliability to the solder joint diameter and
comparison of model predictions with actual failure data

90
indicates the characteristic life of flip chip increases with increase in bump height when
all other parameters are remaining constant.
4.11.3 SOLDER MODULUS
The elastic modulus of the solder joint is found to have a great influence on the
thermo-mechanical reliability of Flip chip packages. The thermo-mechanical reliability of
the device decreases with increase in the solder joint modulus. This is supported by the
failure mechanics theory that increase in elastic modulus leads to higher stress conditions
resulting in higher hysteresis loops with more dissipated energy per cycle. Flip chip
packages with leaded and lead free solder joints of elastic modulus 35 and 37.91 Gpa
respectively [Figure 4.10] have been used for the comparison of the principal components
regression and multiple linear regression model predictions with the actual test failure
data. A negative sensitivity factor indicates the characteristic life of flip chip decreases
with increase in solder modulus.
4.11.4 BALL PITCH
The effect of ball pitch on thermo-mechanical reliability has been shown in Figure
4.11. Encapsulated flip chip packages with ball pitch of 0.2 mm and 0.3 mm have been
used for the comparison of the principal components regression and multiple linear
regression model predictions with the actual test failure data. Ball pitch is inversely
proportional to ball count for constant die size. A trend of increase in the reliability with
the decrease in the ball pitch is predicted by the multiple linear regression and principal
components regression models and supported by experimental data.

91
0
500
1000
1500
2000
2500
3000
3500
4000
0.08 0.11
Solder Joint Height
Ch
ara
cte
ris
tic L
ife
(C
ycle
s)
Experiment
MLR
PCR
Figure 4.9: Effect of ball height on thermal fatigue reliability of flip-chip packages
Solder
Joint
Height
(mm)
Ball
Dia
(mm)
Diagonal
Length
(mm)
Ball
Pitch
(mm)
Delta
T
Experiment MLR PCR Sensitivity
Factor For
Solder Joint
Height
0.08 0.08 14.14 0.2 180 2350 1698
1796
0.11 0.112 7.21 0.2 165 3485 2240 2727
212
Table 4.14: Sensitivity of the package reliability to the solder joint height and comparison
of model predictions with actual failure data.

92
This is consistent with a negative coefficient for ball-pitch for the prediction models in
Table 4.4. The trend is also supported by failure mechanics theory. The shear stress
under thermo-mechanical loads is distributed over a larger number of solder
interconnects, with the decrease in the ball pitch. The reduction in load reduces the stress
in the individual joint and increases the life of the solder joint. The predicted effect of
ball count is only applicable in the case where the failure mode is solder joint cracking.
The trend might be different for other failure modes such as underfill-delamination or
trace-cracking.
4.11.5 UNDERFILL MODULUS
Flip-chip devices with underfill show very high thermo-mechanical reliability as
compared to the flip-chip devices without underfill. This trend has been shown to hold
true for both eutectic (63Sn37Pb) and lead-free flip-chip devices mounted on both rigid-
organic, e.g. BT and FR-4 substrates and metal-backed flex substrates The main reason
for this trend from thermo-mechanics standpoint is that the underfill material provides a
mechanical support and shares the shear stresses generated in the solder joints due to the
thermal mismatch between the chip and the board. Also, the presence of underfill
redistributes the displacement fields within a joint thereby reducing the extreme local
strains concentrations that occur in the joint. The elastic modulus of the underfill is found
to have a great significance in determining the thermo-mechanical reliability of flip chip
packages. Stiffer underfill’s with higher elastic modulus are found to share greater shear
loads reducing the inelastic strain sustained by the solder thus enhancing the solder life.
Underfilled flip chip packages with elastic modulus 6.8 and 10 Gpa respectively have

93
0
500
1000
1500
2000
2500
3000
3500
4000
35 37.91
Solder Modulus
Ch
ara
cte
ris
tic
Lif
e (
Cy
cle
s)
Experiment
MLR
PCR
Figure 4.10: Effect of solder modulus on thermal fatigue reliability of flip-chip packages.
Solder
Modulus
(Gpa)
Ball
Dia
(mm)
Ball
Height
(mm)
Ball
Pitch
(mm)
Experiment MLR PCR Sensitivity
Factor For
Solder
Modulus
35 0.2 0.111 0.112 3485 2240
2727
37.91 0.3 0.13 0.08 1550 1711 1098
-0.82
Table 4.15: Sensitivity of the package reliability to the solder modulus and comparison of
model predictions with actual failure data.

94
0
500
1000
1500
2000
2500
3000
3500
4000
0.2 0.3
Ball Pitch
Ch
ara
cte
ris
tic
Lif
e (
Cy
cle
s)
Experiment
MLR
PCR
Figure 4.11: Effect of ball pitch on thermal fatigue reliability of flip-chip packages.
Ball Pitch
(mm)
Experiment MLR PCR Sensitivity Factor
For
Ball Pitch
35 3485 2240
2727
37.91 1550 1711 1098
-855.9
Table 4.16: Sensitivity of the package reliability to ball pitch and comparison of model
predictions with actual failure data.

95
been used for the comparison of the principal components regression and multiple linear
regression model predictions with the actual test failure data [Figure 4.12]. A positive
sensitivity factor indicates the characteristic life of flip chip increases with increase in
underfill modulus when all other parameters are remaining constant. However this trend
is reversed for the case where the failure mode is trace cracking, because the application
of underfill leads to much higher stresses on the Cu traces and has a peeling effect.
4.11.6 DELTA T
The thermo-mechanical life of the flip-chip devices, similar to other package
architectures, is a function of the environment or the testing condition to which it is
subjected. Magnitude of the temperature range experienced during the accelerated test is
an influential parameter. The characteristic life of the package decreases with the increase
in the temperature range of the ATC [Figure 4.13]. Temperature cycle magnitude has a
negative sensitivity factor, indicated by decrease in thermo-mechanical reliability with
increase in temperature cycle magnitude. Data presented includes coupled effects of
other parameter variations such as, die size, ball diameter, ball count and cycle time. The
predicted values for characteristic life calculated based on the principal components and
multiple linear regression model match the experimental values from the ATC test very
accurately.
4.11.7 UNDERCOVER AREA
Flip chip devices with larger undercover area are found to exhibit better thermo-
mechanical reliability. This is supported by failure mechanics theory as larger undercover
areas provide scope of filling more underfill reducing the shear stress on the solder joints.

96
0
500
1000
1500
2000
2500
3000
3500
5.6 10
Underfill Modulus
Ch
ara
cte
ris
tic
Lif
e (
Cy
cle
s)
Experiment
MLR
PCR
Figure 4.12: Effect of underfill modulus on thermal fatigue reliability of flip-chip
packages.
Underfill
Modulus
(Gpa)
Diagonal
Length
(mm)
Ball
Pitch
(mm)
Ball
Dia
(mm)
Experiment MLR PCR Sensitivity
Factor For
Underfill
Modulus
5.6 14.14 0.2 0.08 1800 1369
1558
10 4.24 0.2 0.08 3243 2715 2273
46.6
Table 4.17 : Sensitivity of the package reliability to underfill modulus and comparison of
model predictions with actual failure data

97
0
500
1000
1500
2000
2500
3000
3500
4000
165 180
Delta T
Ch
ara
cte
ris
tic
Lif
e (
Cy
cle
s)
Experiment
MLR
PCR
Figure 4.13: Effect of Delta T on thermal fatigue reliability of flip-chip packages.
Delta T Ball
Dia
(mm)
Ball
Pitch
(mm)
Diagonal
Length
(mm)
Experiment MLR PCR Sensitivity
Factor For
Delta T
165 0.112 0.2 7.21 3485 2240
2727
180 0.178 0.45 8.90 2050 1829 2378
-8.9
Table 4.18 : Sensitivity of the package reliability to Delta T and comparison of model
predictions with actual failure data

98
The effect has been shown in Figure 4.14 for encapsulated flip chip packages with under
cover area of 35.84 sqmm and 39.69 sqmm for the comparison of the principal
components regression and multiple linear regression model predictions with the actual
test failure data. A positive sensitivity factor indicates the characteristic life of flip chip
increases with increase in undercover area.
4.12 DESIGN GUIDELINES
The statistical models presented in this section have been used for providing
design guidelines for smart selection of a flip chip technologies. The sensitivities from
the statistical models have been used to analyze the effect of various parameters on the
solder joint reliability of the flip chip packages.
• The solder joint reliability of Flip-Chip packages decreases with increase in the
die length. This effect has been demonstrated for both leaded and lead free solder
joints.
• Thermo-mechanical reliability of solder joints increases with increase in solder
ball diameter of Flip chip packages.
• Increase in the solder ball height increases the solder joint reliability of Flip chip
packages.
• Ball pitch is found to have a negative sensitivity on solder joint reliability. The
reliability of solder joint decreases with increase in the ball pitch.
• Leaded solder joints with smaller elastic modulus are found to be more reliable
than lead free solder joints with higher elastic modulus.

99
0
500
1000
1500
2000
2500
35.84 39.69
Undercover Area
Ch
ara
cte
ris
tic
Lif
e (
Cy
cle
s)
Experiment
MLR
PCR
Figure 4.14 : Effect of under cover area on thermal fatigue reliability of flip-chip packages.
Undercover
Area
(Sqmm)
Ball
Dia
(mm)
Ball
Pitch
(mm)
Ball
Height
(mm)
Experiment MLR PCR Sensitivity
Factor For
Undercover
Area
35.84 0.178 0.457 0.112 2050 1829
2378
39.69 0.086 0.203 0.094 2250 1985 1525
21.6
Table 4.19: Sensitivity of the package reliability to undercover area and comparison of
model predictions with actual failure data

100
• Stiffer underfills with higher elastic modulus are found to improve the solder
joints reliability of flip chip packages.
• Thermo-mechanical reliability of the solder joint in a Flip Chip package is
inversely proportional to the temperature differential through which the package
under goes thermal cycling.
• Increasing the area of undercover is found to increase the thermo-mechanical
reliability of Flip chip packages.

101
CHAPTER 5
STATISTICS BASED CLOSED FORM MODELS FOR CBGA PACKAGES
Ceramic ball grid array (CBGA) packages are high density, high performance
surface mount (SMT) packages. The broadening of application space of ceramic
packages to be included in the high volume market of personnel computer
microprocessors [Master 1998], telecommunication products [Lau et al 2004],
workstations and avionic products has necessitated the need for understanding the
package design and assembly influence on reliability. In this section, decision support
models for prediction of thermo-mechanical reliability of ceramic ball grid array and
ceramic column grid array packages have been presented. Multiple linear regression
modeling methodologies has been used for the model building.
The models presented in this section, aid in understanding effect of design and
material parameters towards thermo-mechanical reliability and provide decision guidance
for smart selection of component packaging technologies and perturbing product designs
for minimal risk insertion of new packaging technologies. In addition, parameter
interaction effects, which are often ignored in closed form modeling, have been
incorporated in this work. Convergence of statistical models with experimental data has
been demonstrated using a single factor design of experiment study.

102
5.1 CBGA PACKAGE ARCHITECTURE
Ceramic ball grid array (CBGA) packages [Figure 5.1] are an extension of
controlled collapsed chip connection (C4) and use a co-fired alumina ceramic substrate
[Lau 1995]. The multilayered ceramic substrates are chosen for their superior electrical
performance such as option for multiple power and ground planes and the ability to
choose the signal, power and ground locations within the column array locations. Also,
the low difference coefficients of thermal expansions of ceramic (6.7 ppm/C) and silicon
(2.7ppm/C) increases the component level reliability [Burnette 2000], making ceramic
substrates a good choice for flip chip applications.
5.2 DATA SET
The dataset used for model building has been accumulated from an extensive
CBGA accelerated test reliability database based on the harsh environment testing by the
researchers at the NSF Center for Advanced Vehicle Electronics (CAVE). This database
has also been supplemented with the various datasets published in the literature. Each
data point in the database is based on the characteristic life of a set of CBGA devices of a
given configuration tested under harsh thermal cycling or thermal shock conditions. The
model parameters are based on failure mechanics of CBGA assemblies subjected to
thermo-mechanical stresses. The material properties and the geometric parameters
investigated include die size, substrate CTE, substrate thickness, ball count, ball pitch,
solder alloy composition (SnAgCu, SnPbAg), solder joint height, underfill modulus,
underfill CTE, bump size, and printed circuit board thickness. The range of data collected
in each case is given by Table 5.1.
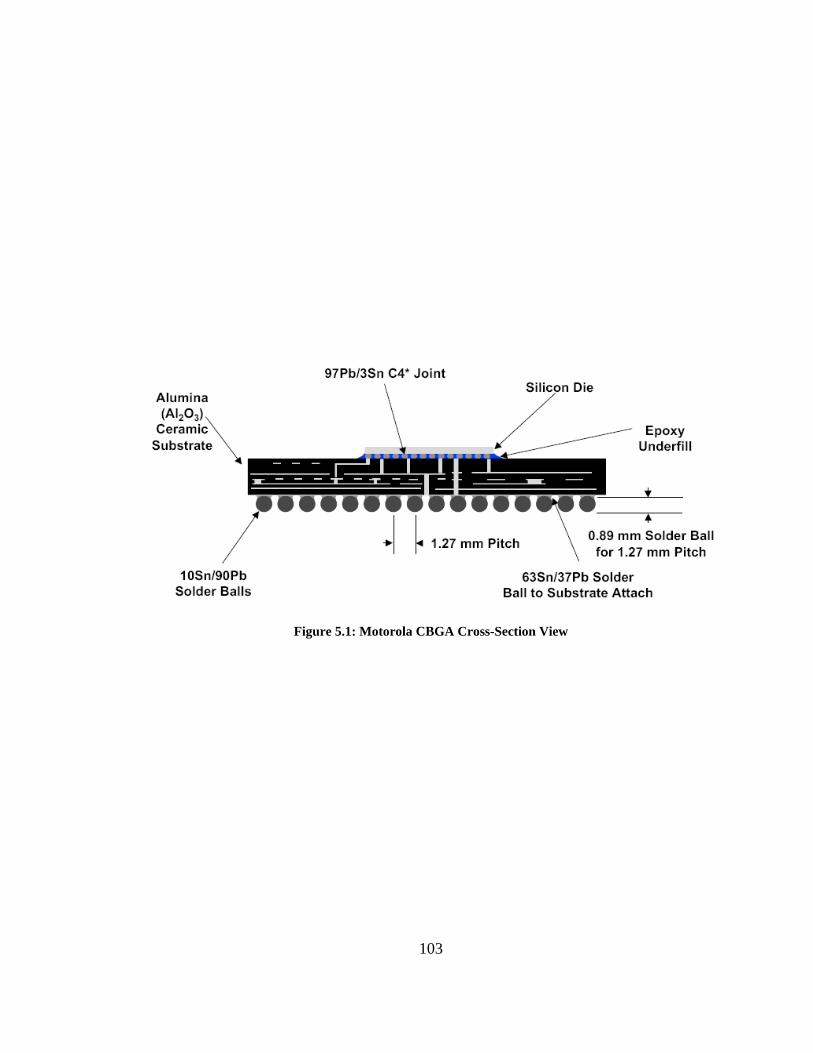
Figure 5.1: Motorola CBGA Cross-Section View
103

104
Parameter CBGA
Die Size 4mm to 42mm
Number of I/O 64 to 1657
Ball Pitch 1mm to 1.27mm
Ball Diameter 0.508mm to 0.195mm
Solder Composition Sn63Pb37, 95.5Sn3.5Ag1.0Cu
Ceramic CTE 6.8PPM/°C, 12.3PPM/°C
Underfill Modulus 2.6Gpa to 8.5Gpa, No Underfill
Underfill CTE 26PPM/°C to 75PPM/°C, No underfill
Ceramic Thickness 0.635MM to 2.9MM
PCB Thickness 1.27mm to 2.8mm
Thigh in ATC 90°C, 100°C, 125°C
Tlow in ATC -55°C, -40°C,-15°C, 0°C
Table 5.1: Scope of accelerated test database
105
5.3 MODEL INPUT SELECTION
A superset of predictor variables including all the variables that are known to
influence the characteristic life has been created. This set included all the geometric
properties, material properties and thermal cycling conditions including die length,
diagonal length, package area, under cover area, die thickness, ball count, bump diameter,
bump height, solder modulus, solder CTE, underfill modulus, underfill CTE, PCB type,
PCB thickness, pad diameter, pad type, substrate CTE, substrate thickness and thermal
cycling conditions. Model input selection involves selecting a subset of variables that are
just enough for model building. The criteria for variable selection are based on
maximization of coefficient of determination and Adj R2 and minimization of residual
mean squares and induced bias. The potentially important variables selected are the ones
that describe maximum information content in the data set with minimum variance and
bias.
Substrate CTE was found to be the most influential factor and a regression
equation with characteristic life as response and substrate CTE alone as predictor variable
was built. Underfill modulus was identified as the next most influential observation and a
regression equation with underfill modulus and substrate CTE as predictor variables and
characteristic life as response variable was fit. Inclusion of underfill modulus increased
the coefficient of determination (R2) and reduced the residual errors and hence was
retained in the model. Substrate thickness, solder CTE, DeltaT respectively were found
to be the next most influential variables and were added in steps and the criteria's for
model selection were studied. The variables satisfied the selection criteria and hence were
retained. Ball pitch and die length were identified as important variables, however the

inclusion of these variables did not increase the coefficient of determination significantly
and hence were dropped. Predictor variables from the super set were added in subsequent
steps and their effect on variable selection criteria was studied for decision making on
variable addition.The best subset of input variables include substrate CTE, underfill
modulus, Solder CTE, substrate thickness, Delta T, PCB thickness, underfill CTE, ball
diameter, ball count and diagonal length.
5.4 MULTIPLE LINEAR REGRESSION MODELS
Prediction equations for solder joint reliability prediction of CBGA packages have
been built with characteristic life as response variable and best subset variables as
predictor variables. All of the model variables have been modeled in continuous form.
Categorical variables such as solder type, underfill type and ceramic type have been input
as continuous variables by taking into consideration the elastic modulus and coefficient
of thermal expansion of the corresponding material. In case of no underfill, a zero is input
for both Young’s modulus and CTE. Multiple linear regression models are built using
MINITABTM statistical software. The model is given by Table 5.2. The model [Equation
5.1] indicates an increase in reliability with increase in underfill elastic modulus, ball
count and ball diameter. The model also indicates a reduction in reliability with increase
in temperature cycle magnitude, chip diagonal-length, substrate thickness, underfill
coefficient of thermal expansion, solder elastic modulus and PCB thickness.
DeltaTssPWBThickneTEUnderfillCUnderfillEBalldiaSolderCTECeramicCTEBallcount
hicknessSubstrateTngthDiagonalLesticLifeCharacteri
×−×−×−×+×+×+×+×
+×−×−−=
458.164.245697.1933.5476.259486.12596.4786131.1
87.58206.719.1694%63
Eq 5.1
106
107
5.5 HYPOTHESIS TESTING
The overall adequacy of the prediction model has been tested using ANOVA table
given by Table 5.3 . Small P value in the table signifies the overall adequacy of the model
rejecting the null hypothesis. This means that there is at least one predictor variable that
is contributing significantly towards prediction of characteristic life of the package.
Coefficient of determination, R2, which determine the percentage of variation of the
response variable explained by the predictor variables, has also been used for assessing
the overall adequacy of the prediction model. A coefficient of determination value of
92% for the model suggests that the predictor variables together account for 92% of
variation in characteristic life. Since coefficient of determination is dependent on number
of predictor variable the Adj R2 parameter has also been studied. An Adj R2 of 91%
reconfirms the overall adequacy of the model. Thus the model is adequate for prediction
purposes.
T tests on individual regression coefficients have been performed for determining
the statistical significance of each predictor variable for retaining in the model. The p-
value of a parameter in Table 5.2 indicates the statistical significance of that parameter
and the parameter with p-value less than 0.05 is considered to be statistically significant
and expected to have a significant effect on the reliability of the package, with confidence
level of more than 95.0%. All the predictor variables in Table 5.2 are statistically
significant with p-values in the neighborhood of 0 to 5%.

108
Predictor Coefficient SE Coeff T Statistic P Value
Constant -1694.9 766.6 -2.21 0.030
Diag-Length -71.06 18.00 -3.95 0.000
Substrate Thk -582.87 64.32 -9.06 0.000
Ball Count 1.6131 0.4294 3.76 0.000
Ceramic CTE 478.96 27.20 17.61 0.000
Solder CTE 125.86 20.09 6.26 0.000
Ball Dia 2594.6 784.7 3.31 0.001
Underfill E 547.33 65.26 8.39 0.000
Underfill CTE -19.697 7.780 -2.53 0.013
PWB Thk -245.4 116.6 -2.11 0.038
Delta T -16.458 2.243 -7.35 0.000
Table 5.2 : Multiple linear regression model of CBGA package.
Source D.F SS MS F P
Regression 10 199337887 19933789 89.08 0.00
Residual Error 84 18797042 223774
Total 94 218134929
Table 5.3: Analysis of variance of CBGA multiple linear regression model.

109
5.6 MODEL ADEQUACY CHECKING
Residuals which are realized or observed values of the model errors indicate any
violations from model assumptions. Residual plots have been used for studying the
conformance of model with underlying assumptions including linearity, normality,
constant variance and independence. Residual plots (Figure 5.2) studied include, the
normal probability plot, histogram plot of residuals, plot of residuals against fitted values,
plot of residual against regressor and plot of residual in time sequence. Departures from
normality and the resultant effect on t-statistic or f-statistic and confidence and prediction
intervals have been studied using normal probability plots. A straight line variation of
normal probability plot (Figure 5.2) indicates a cumulative normal distribution. The
histogram plot of residuals has also been used to study non-normality. Plots of residuals
against fitted values and plots of residuals against the regressors have been used to check
for constant-variance. Existence of residuals within the normal band indicates constant
variance of regression model. Violation of assumptions may have been indicated by
inward and outward funneling. The plot of residual in time sequence is used to study
correlation between model errors at different time periods. Patterns in the plot of
residuals in time sequence have been studied to determine if the errors are auto-
correlated. Absence of any visible pattern indicates no violation of independence
assumptions. Pearson’s correlation matrix (Table 5.4) has been studied for checking the
linear dependence of predictor variables. Absence of large values in correlation matrix
confirms the absence of any multi-collinearity problems.

Figure 5.2: Residual plot of CBGA multiple linear regression model.
110
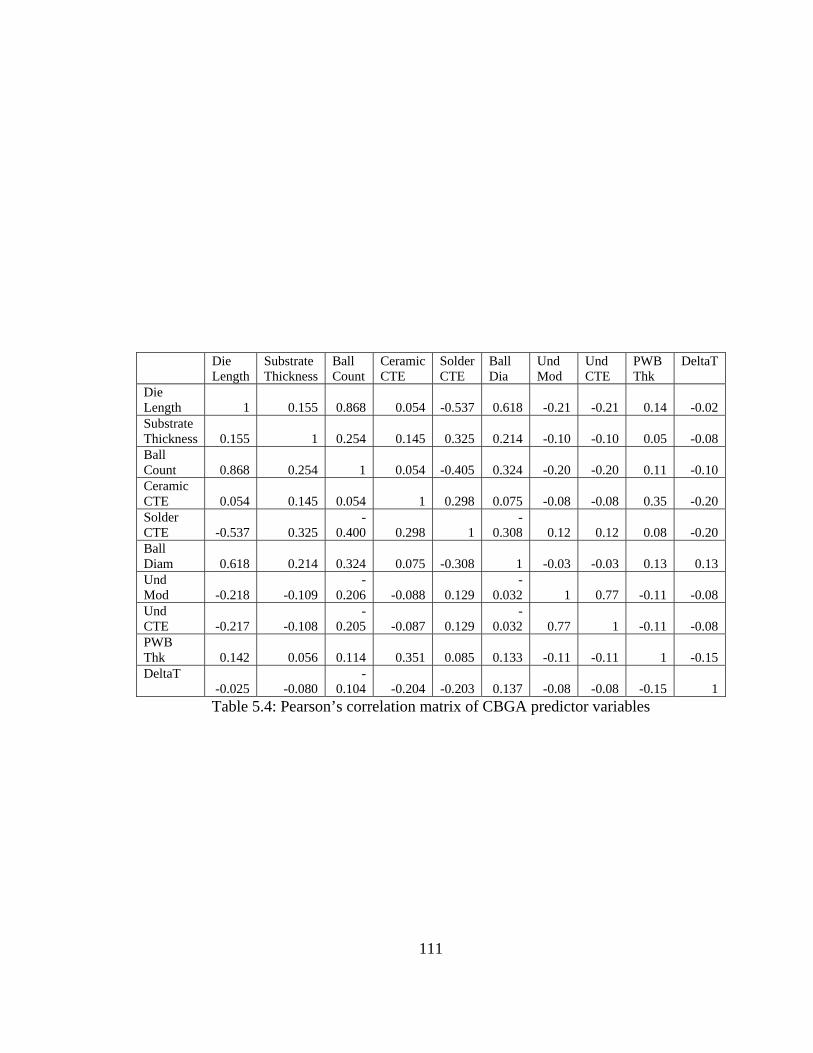
111
Die
Length Substrate Thickness
Ball Count
Ceramic CTE
Solder CTE
Ball Dia
Und Mod
Und CTE
PWB Thk
DeltaT
Die Length 1 0.155 0.868 0.054 -0.537 0.618 -0.21 -0.21 0.14 -0.02 Substrate Thickness 0.155 1 0.254 0.145 0.325 0.214 -0.10 -0.10 0.05 -0.08 Ball Count 0.868 0.254 1 0.054 -0.405 0.324 -0.20 -0.20 0.11 -0.10 Ceramic CTE 0.054 0.145 0.054 1 0.298 0.075 -0.08 -0.08 0.35 -0.20 Solder CTE -0.537 0.325
-0.400 0.298 1
-0.308 0.12 0.12 0.08 -0.20
Ball Diam 0.618 0.214 0.324 0.075 -0.308 1 -0.03 -0.03 0.13 0.13 Und Mod -0.218 -0.109
-0.206 -0.088 0.129
-0.032 1 0.77 -0.11 -0.08
Und CTE -0.217 -0.108
-0.205 -0.087 0.129
-0.032 0.77 1 -0.11 -0.08
PWB Thk 0.142 0.056 0.114 0.351 0.085 0.133 -0.11 -0.11 1 -0.15 DeltaT
-0.025 -0.080 -
0.104 -0.204 -0.203 0.137 -0.08 -0.08 -0.15 1 Table 5.4: Pearson’s correlation matrix of CBGA predictor variables

112
5.7 MODEL CORRELATION WITH EXPERIMENTAL DATA
Characteristic life predicted by the multiple linear regression models have been
correlated with experimental values using a single factor design of experiment study for
assessing the prediction ability of the statistical models. Prediction method with multiple
linear regression and experimental method has been used as the factor and predicted
characteristic life corresponding to each method is used as the response variable.
Analysis of variance has been used for testing the equality of mean predicted life. The
null hypothesis of the test is that the mean characteristic life of all the prediction methods
is the same. The alternate hypothesis is there is at least one method with predicted
characteristic life different from the others.
The analysis was conducted using commercially available statistical software
MINITABTM. The equality of means has been studied using the generalized linear model
function. The characteristic life which is used as response variable contains values of
predicted characteristic life obtained from both statistical and experimental method. The
prediction method which is used a model variable, uses a binary variable to describe the
type of method. A value of zero is assigned for experimental method and a value of 1 is
assigned for statistical method.
High P values of ANOVA table [Table 5.5] shows a clear acceptance of the null
hypothesis. Thus it can be concluded that there is no significant difference in the
characteristic life predicted by the statistical models and experimental methods. Since the
factor has only two levels the ANOVA table in itself becomes a paired T test eliminating
the need for a separate T test.

113
Source DF SeqSS
Adj SS Adj MS F Statistic P value
Prediction Method
1 57231
57231
57231
0.02
0.877
Error 188 444844550
444844550
2366194
Total 189 444901781
Table 5.5: Single factor analysis of variance

114
5.8 MODEL VALIDATION
The effect of various design parameters on the thermal reliability of package have
been presented in this section. Multiple linear regression based sensitivity factors,
quantifying the effect of design, material, architecture and environmental parameters on
thermal fatigue reliability, have been used to compute life. The sensitivity study can be
used in building confidence during trade-off studies by arriving at consistent results in
terms of reliability impact of changes in material, configuration and geometry using
different modeling approaches. The predictions from the statistical model have also been
compared with the experimental data
5.8.1 DIAGONAL LENGTH
The Thermo-mechanical reliability of flip chip packages reduces with increase in
diagonal length. This effect has been demonstrated on CBGA packages with both low
CTE and High CTE ceramic substrates. Multiple linear regression models have been
used for evaluating the sensitivity of solder joint reliability to diagonal length. The cycles
for 63.2% failure from the experimental data and multiple linear regression models have
been plotted against the diagonal lengths of various devices. . The predicted values from
the prediction model follow the experimental values quite accurately and show the same
trend (Figure 5.2). This trend is also consistent from the failure mechanics standpoint, as
the solder joints with larger diagonal length are subjected to much higher strains due to
the increased distance from the neutral point, thus having lower reliability.
Ceramic ball grid array packages with diagonal length 29.69mm, 35.35mm and
45.96mm have been used for the comparison of multiple linear regression model

115
predictions with the actual test failure data. Both the packages had different ball diameter,
pitch and pad definition and were subjected to different air-to-air thermal cycles (ATC)
of 0°C to 100°C. Thus, the model is being tested for its ability to predict both single and
coupled effects. A negative sensitivity has been computed for the effect of diagonal
length. A negative sensitivity factor indicates that the characteristic life of a CBGA
package decreases when the diagonal length increases and all the other parameters
remaining constant. The characteristic life of the three packages plotted in the Figure 5.3.
5.8.2 SUBSTRATE THICKNESS
Thickness of substrate material has a great influence on thermo-mechanical
reliability of ceramic packages. Ceramic ball grid array packages with thinner substrates
have higher cycles to failure than thicker substrates. This trend is consistent from failure
mechanics point of view as increased substrate thickness leads to higher assembly
stiffness, which leads to increases stress levels in the interconnect.. This effect has been
demonstrated for ceramic substrates of 0.8 mm, 1mm and 2.65mm substrate thickness
[Figure 5.2]. A negative sensitivity factor indicates the characteristic life of CBGA
packages decreases with increase in substrate thickness. Sensitivity has been calculated
using multiple linear regression modeling for substrate thickness in the range of 0.635mm
to 3.7mm for CBGA packages including 0.635mm, 0.8mm, 1mm, 1.65mm, 2.4mm,
2.9mm and 3.7mm thick substrates. Model predictions show good correlation with
experimental data.

0
1000
2000
3000
4000
5000
6000
29.69 35.35 45.96
Diagonal Length MM
Char
acte
rist
ic L
ife (C
ycle
s)
Experimental
Predicted
Figure 5.3 :Effect of diagonal length on thermal fatigue reliability of CBGA packages
Diagonal Length (mm)
Ball Count
Ball Diameter
PCB Thickness
Experiment MLR Sensitivity Factor For Diagonal
length
29.69 552 0.8 2.8 5060 4921
35.35 361 0.89 1.57 4091 4063
45.96 932 0.8 2.8 2302 2293
-71.06
Table 5.6 : Sensitivity of the package reliability to diagonal length and comparison of
model predictions with actual failure data
116
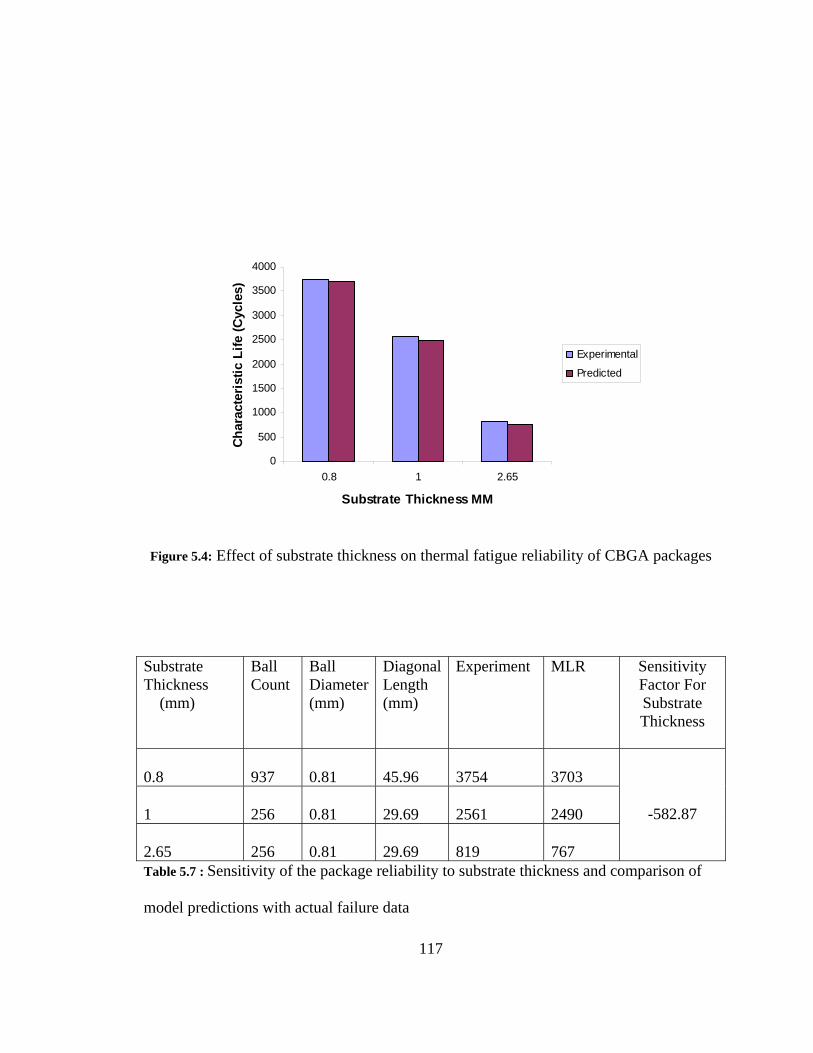
0
500
1000
1500
2000
2500
3000
3500
4000
0.8 1 2.65
Substrate Thickness MM
Char
acte
ristic
Life
(Cyc
les)
Experimental
Predicted
Figure 5.4: Effect of substrate thickness on thermal fatigue reliability of CBGA packages
Substrate Thickness (mm)
Ball Count
Ball Diameter(mm)
Diagonal Length (mm)
Experiment MLR Sensitivity Factor For Substrate Thickness
0.8 937 0.81 45.96 3754 3703
1 256 0.81 29.69 2561 2490
2.65 256 0.81 29.69 819 767
-582.87
Table 5.7 : Sensitivity of the package reliability to substrate thickness and comparison of
model predictions with actual failure data
117

118
5.8.3 BALL COUNT
The effect of ball count on thermo-mechanical reliability has been shown in Figure
5.5. A trend of increase in the reliability with the increase in the ball count is visible,
which is also supported by the failure mechanics theory. With the increase in the ball
count the shear stress generated in the solder joints due to the thermal mismatch gets
distributed, thus reducing the stress in the individual joint and increasing the life of the
solder joint. Since this failure mechanics is only applicable in the case where the failure
mode is solder joint cracking, so the trend might be different for other failure modes such
as underfill delamination or copper trace cracking. CBGA packages with ball counts 256,
552 and 625 have been used to validate the effect of ball count on the thermo-mechanical
reliability predicted by the model. The characteristic life predicted by the model lies in
close proximity to the actual characteristic life from the experimental thermal cycling
test. The sensitivity factor indicates an increase in cycles to failure of CBGA package by
2 cycles for every additional solder ball.
5.8.4 CERAMIC CTE
The CTE of the ceramic is found to have a direct relationship with thermo-
mechanical reliability of CBGA packages. The thermo-mechanical reliability of CBGA
packages increases with increase in CTE of the ceramic substrate which is inline with the
failure mechanics theory. Increasing the CTE of the ceramic substrate decreases the
difference in coefficients of thermal expansion between the substrate and the board there

0
500
1000
1500
2000
2500
3000
256 552 625
Ball Count
Cha
ract
eris
tic L
ife (C
ycle
s)
Experimental
Predicted
Figure 5.5: Effect of ball count on thermal fatigue reliability of CBGA packages Ball Count Diagonal
Length (mm)
Ball Dia (mm)
Substrate Thickness(mm)
Experiment MLR Sensitivity Factor For Ball Count
256 29.69 0.81 2.9 819
761
552 35.35 0.81 1.65 2240
2258
625 45.91 0.81 0.8 2654
2595
1.6131
Table 5.8 : Sensitivity of the package reliability to ball count and comparison of model
predictions with actual failure data
119

120
by reducing stresses induced due thermal mismatch. Since this failure mechanics is only
applicable in the case where the failure mode is solder joint cracking, so the trend might
be different for other failure modes such as underfill delamination or copper trace
cracking. Ceramic substrates with CTE of 6.8 PPM/0C and 12.3 PPM/0C have been used
to validate the effect of ceramic on the thermo-mechanical reliability predicted by the
model. A positive sensitivity factor indicates the characteristic life of CBGA packages
increases with increase in substrate CTE. Model predictions show good correlation with
experimental data.
5.8.5 SOLDER CTE
The solder joints of CBGA packages have a high lead solder ball with eutectic or lead
free solder fillets. The thermo-mechanical reliability of solder joints is found to depend
on the Coefficient of thermal expansion of the solder fillet. Solder joints with higher CTE
fillets are more flexible leading to reduced stress conditions thereby reducing the amount
of dissipated energy per cycle. Ceramic ball grid array packages with solder joint CTE of
17.6 PPM/0C and 25.5 PPM/0C have been used for demonstrating the effect of solder
CTE on thermo-mechanical reliability [Figure 5.7]. Sensitivity of thermo-mechanical
reliability on solder joint CTE have been determined using multiple linear regression
method. The sensitivity factor indicates that for every unit increase of solder joint CTE
keeping all other parameters constant the characteristic life of the CBGA package
increases by 125 cycles. A positive sensitivity indicates the characteristic life of CBGA
packages increases with increase in solder CTE. Model prediction shows good correlation
with experimental data.

0
500
1000
1500
2000
2500
3000
3500
4000
4500
6.8 12.3
Ceramic CTE PPM/DegC
Cha
ract
eris
tic L
ife (C
ycle
s)
Experimental
Predicted
Figure 5.6: Effect of ceramic CTE on thermal fatigue reliability of CBGA packages Ceramic CTE (PPM/0C)
Substrate Thickness (mm)
Ball Dia (mm)
Ball Count (mm)
Experiment MLR Sensitivity Factor For
Ceramic CTE
6.8 2.9 0.81 552 1503
1567
12.3 2.9 0.89 361 4063
4091
478.96
Table 5.9 : Sensitivity of the package reliability to ceramic CTE and comparison of model
predictions with actual failure data
121

0
500
1000
1500
2000
2500
3000
17.6 25.5
Solder CTE PPM/DegC
Cha
ract
eris
tic L
ife (C
ycle
s)
Experimental
Predicted
Figure 5.7: Effect of solder CTE on thermal fatigue reliability of CBGA packages Solder CTE (PPM/0C)
Ball Dia (mm)
Ball Count
Substrate Thickness(mm)
Experiment MLR Sensitivity Factor For
Solder CTE
17.6 0.89 625 0.8 1408
1235
25.5 0.89 361 1.2 2561
2490
125.86
Table 5.10 : Sensitivity of the package reliability to Solder CTE and comparison of
model predictions with actual failure data
122

123
5.8.6 SOLDER JOINT DIAMETER
The thermo-mechanical reliability of the CBGA devices is also influenced by the
solder joint or bump diameter. CBGA packages with bigger bump size usually give
higher reliability for the device. This trend is supported by the characteristic life plot for
the CBGA device for three different ball diameters. CBGA packages with larger bumps
have lower stress concentration and longer crack propagation path in the solder
interconnects, thus adding to the thermo-mechanical reliability of the device. This trend
has been demonstrated for CBGA packages with solder joint diameter of 0.5mm, 0.81mm
and 0.89mm. A positive sensitivity factor indicates the characteristic life of CBGA
packages increases with increase in bump size and all other parameters are remaining
constant. Model predictions show good correlation with experimental data.
5.8.7 UNDERFILL MODULUS
The elastic modulus of underfill material is found to have a positive sensitivity on
thermo-mechanical reliability of CBGA packages. The trend has been demonstrated for n
CBGA packages with no underfills and underfilled CBGA packages with underfill elastic
modulus of 2.6 Gpa and 5.6 Gpa. The main reason for this trend from thermo-mechanics
standpoint is that the underfill material provides a mechanical support and shares the
shear stresses generated in the solder joints due to the thermal mismatch between the chip
and the board. Also, the presence of underfill redistributes the displacement fields within
a joint thereby reducing the extreme local strains concentrations that occur in the joint.
Increasing the elastic modulus of the underfills makes it stiffer and hence share’s greater

0
500
1000
1500
2000
2500
3000
0.5 0.81 0.89
Ball Diameter MM
Cha
ract
eris
tic L
ife (C
ycle
s)
Experimental
Predicted
Figure 5.8: Effect of ball diameter on thermal fatigue reliability of CBGA packages
Ball Diameter (mm)
Ball Count (mm)
Substrate CTE
Substrate Thickness(mm)
Experiment MLR Sensitivity Factor For
Ball Diameter
0.5 381 6.8 2.9 1944 1831
0.81 625 6.8 0.8 2293 2302
0.89 361 6.8 1.2 2462 2493
2594.6
Table 5.11 : Sensitivity of the package reliability to ball diameter and comparison of model
predictions with actual failure data
124
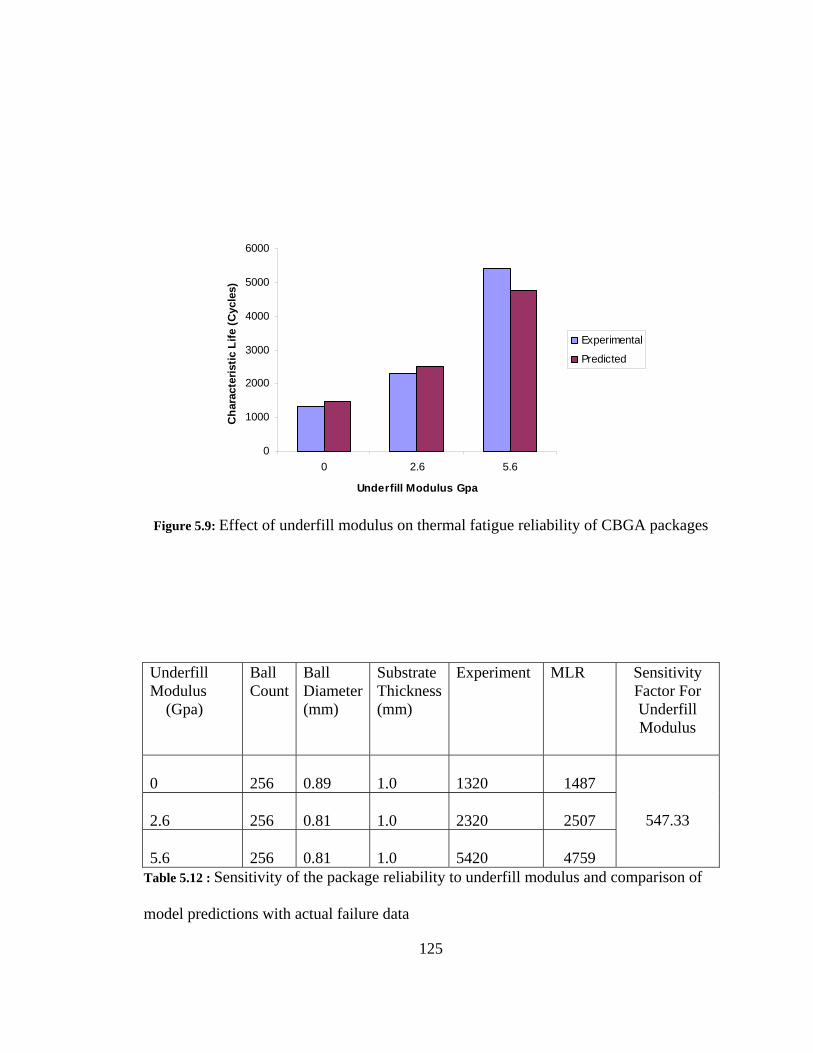
0
1000
2000
3000
4000
5000
6000
0 2.6 5.6
Underfill Modulus Gpa
Cha
ract
eris
tic L
ife (C
ycle
s)
Experimental
Predicted
Figure 5.9: Effect of underfill modulus on thermal fatigue reliability of CBGA packages
Underfill Modulus (Gpa)
Ball Count
Ball Diameter(mm)
Substrate Thickness(mm)
Experiment MLR Sensitivity Factor For Underfill Modulus
0 256 0.89 1.0 1320
1487
2.6 256 0.81 1.0 2320
2507
5.6 256 0.81 1.0 5420
4759
547.33
Table 5.12 : Sensitivity of the package reliability to underfill modulus and comparison of
model predictions with actual failure data
125

126
part of shear loads caused by thermal mismatches reducing the inelastic strain sustained
by the solder thereby improving the thermo-mechanical reliability of solder joints.
5.8.8 UNDERFILL CTE
Coefficient of thermal expansion of the underfill material has an inverse
relationship on thermo-mechanical reliability of solder joint. The thermo-mechanical
reliability of CBGA packages decreases with increase in CTE of the underfill material,
which is inline with the failure mechanics theory. With increase in underfill CTE, the
underfill modulus decreases and the underfill becomes more flexible. This reduces the
shear load on the underfill thereby increasing the shear load on the solder joint causing
reduction in thermo-mechanical reliability of the joint. This trend has been demonstrated
for underfilled CBGA packages [Figure 5.9] with underfill CTE of 44PPM/0C and 75
PPM/0C. A positive sensitivity factor indicates the characteristic life of CBGA packages
increases with increase in bump size and all other parameters are remaining constant.
Model predictions show good correlation with experimental data.
5.8.9 PCB THICKNESS
Thermo-mechanical reliability of CBGA packages decreases with increase in
PCB thickness. This trend has been demonstrated for CBGA packages with PCB
thickness of 1.57 mm, 1.8mm and 2.8 mm. This trend is consistent from failure
mechanics point of view as increased PCB thickness leads to higher assembly stiffness,
which leads to increases stress levels in the interconnect. Sensitivity of thermo-
mechanical reliability on PCB thickness has been determined using multiple linear
regression method. The sensitivity factor indicates that for every unit increase of PCB

0
1000
2000
3000
4000
5000
6000
75 44
Underfill CTE PPM/DegC
Cha
ract
eris
tic L
ife (C
ycle
s)
Experimental
Predicted
Figure 5.10: Effect of underfill CTE on thermal fatigue reliability of CBGA packages
Underfill CTE (PPM/0C)
Ball Count
Ball Dia (mm)
Substrate Thickness(mm)
Experiment MLR Sensitivity Factor For
Underfill CTE
75 256 0.81 1.0 2320 2597
44 256 0.81 1.0 5420 4759
-19.697
Table 5.13: Sensitivity of the package reliability to underfill CTE and comparison of
model predictions with actual failure data
127

0
200
400
600
800
1000
1200
1400
1600
1.57 1.8 2.8
PCB Thickness MM
Char
acte
ristic
Life
(Cyc
les)
Experimental
Predicted
Figure 5.11: Effect of PCB thickness on thermal fatigue reliability of CBGA packages
PCB Thickness (mm)
Substrate Thickness
(mm)
Ball Count
Ball Dia
(mm)
Experiment MLR Sensitivity Factor For
PCB Thickness
1.57 2.9 361 0.89 1511 1429
1.8 0.8 625 0.89 1212 1234
2.8 2.9 625 0.89 1013 800
-245.4
Table 5.14 : Sensitivity of the package reliability to PCB thickness and comparison of
model predictions with actual failure data
128

129
thickness keeping all other parameters constant the characteristic life of the CBGA
package decreases by 245 cycles. Model predictions show good correlation with
experimental data.
5.8.10 DELTA T
The environment or testing condition the package is subjected to has a great
influence on thermo-mechanical reliability CBGA packages. The characteristic life of the
package decreases with the increase in the temperature range of the ATC. This trend has
been demonstrated for two different cycling conditions including 0 t0 1000C and -40 to
1250C. Temperature cycle magnitude has a negative sensitivity factor, indicated by
decrease in thermo-mechanical reliability with increase in temperature cycle magnitude.
Data presented includes coupled effects of other parameter variations such as, die size,
ball diameter, ball count and cycle time. The predicted values for characteristic life
calculated based multiple linear regression model match the experimental values from the
ATC test very accurately.
5.9 DESIGN GUIDELINES
The statistical models presented in this section have been used for providing
design guidelines for smart selection of CBGA technologies. The sensitivities from the
statistical models have been used to analyze the effect of various parameters on the solder
joint reliability of the flip chip packages.
• Solder joint reliability of CBGA packages decreases with increase in diagonal
length. This effect has been demonstrated on both high CTE and low CTE
ceramic substrates.

0
500
1000
1500
2000
2500
3000
100 165
Delta T DegC
Cha
ract
eris
tic L
ife (C
ycle
s)
Experimental
Predicted
Figure 5.12: Effect of Delta T on thermal fatigue reliability of CBGA packages
Delta T
Ball Count
Ball Dia
(mm)
Substrate Thickness
(mm)
Experiment MLR Sensitivity Factor For
DeltaT
100 256 0.81 1.0
2561
2490
165 361 0.89 2.9
819
767
-16.458
Table 5.15: Sensitivity of the package reliability to Delta T and comparison of model
predictions with actual failure data
130

131
• Thermo-mechanical reliability of CBGA packages increases with increase in
substrate thickness.
• Ball count has a positive sensitivity on solder joint fatigue life. Increasing the ball
count increases the thermo-mechanical reliability of CBGA packages.
• Increasing the CTE of the ceramic substrate increases the solder joint reliability of
CBGA packages.
• Increasing the CTE of the solder joint fillet increases the solder joint reliability of
CBGA packages.
• Thermo-mechanical reliability of CBGA packages increases with increase in
solder joint diameter.
• Solder joint reliability increases with increase in elastic modulus of the underfill
and decrease in CTE of the underfill.
• Thicker printed circuit boards are less reliable than thinner printed circuit boards.
• Thermo-mechanical reliability of the solder joint in a CBGA package is inversely
proportional to the temperature differential through which the package under goes
thermal cycling.

132
CHAPTER 6
STATISTICS BASED CLOSED FORM MODELS FOR CCGA PACKAGES
Ceramic column grid array (CCGA) packages are an extension of ceramic ball
grid array packages and use a column instead of a high melt ball to create higher standoff,
more flexible interconnection, and to achieve significant increase in reliability. [Figure
6.1, Figure 6.2 ].The broadening of application space of ceramic packages to be included
in the high volume market of personnel computer microprocessors [Master 1998],
telecommunication products [Lau et al 2004], workstations and avionic products has
necessitated the need for understanding the package design and assembly influence on
reliability. In this section, a reliability assessment numerical model that could take into
account the geometric details of a CCGA package, the material properties of the widely
used material and the operating conditions has been developed help in understanding the
influence of design and material parameters on thermo-mechanical reliability of CCGA
packages.
Multiple linear regression has been used for model building. Parameter interaction
effects, which are often ignored in closed form modeling, have been incorporated in this
work. In addition, categorical variables such as solder volume have been incorporated in
this model. Convergence of statistical models with experimental data has been
demonstrated using a single factor design of experiment study.

133
Figure 6.1: Layered View of IBM CCGA Package
Figure 6.2: Column Grid Arrays of IBM CCGA Package

134
6.1 DATA SET
The dataset used for model building has been accumulated from an extensive
CCGA accelerated test reliability database based on the harsh environment testing by the
researchers at the NSF Center for Advanced Vehicle Electronics (CAVE). This database
has also been supplemented with the various datasets published in the literature. Each
data point in the database is based on the characteristic life of a set of CCGA devices of a
given configuration tested under harsh thermal cycling or thermal shock conditions. The
model parameters are based on failure mechanics of CCGA assemblies subjected to
thermo-mechanical stresses.
The material properties and the geometric parameters investigated include
substrate length, substrate area, substrate thickness, die length, ball count, ball pitch,
solder type, solder ball height, solder ball volume, PCB surface finish, PCB thickness,
PCB pad diameter deltaT, ramp rate, and dwell time. The range of data collected in each
case is given by Table 6.1 .
6.2 MODEL INPUT SELECTION
All the predictor variables that are known to influence the characteristic life of
CCGA package have been selected from the data set. The best subset of variables for
model building has been selected based on the criteria of maximization of coefficient of
determination and adjusted R2
at the cost of minimum variance and bias. Ball height was
found to be the most influential factor and a regression equation with characteristic life as
response and ball height alone as predictor variable was built. Substrate area was

135
Parameter CCGA
Die Size 32mm to 42.5mm
Number of I/O 1024 to 1806
Ball Pitch 1mm to 1.27mm
Ball Height 0.89mm to 2.2mm
Solder Composition Sn63Pb37, 95.5Sn3.5Ag1.0Cu,
Solder Volume Low, Nominal, High
Substrate Thickness 0.8mm to 3.75mm
PCB thickness 1.5mm to 2.8mm
Thigh in ATC 100°C, 110°C, 125°C
Tlow in ATC -55°C, 0°C
Table 6.1: Accelerated test database

136
identified as the next most influential observation and a regression equation with
substrate area and ball height as predictor variables and characteristic life as response
variable was fit. Inclusion of substrate area increased the coefficient of determination
(R2) and reduced the residual errors and hence was retained in the model. Substrate
thickness, solder volume, DeltaT respectively were found to be the next most influential
variables and were added in steps and the criteria's for model selection were studied. The
variables satisfied the selection criteria and hence were retained. Ball pitch, ball diameter
and die length were identified as important variables, however the inclusion of these
variables did not increase the coefficient of determination significantly and hence were
dropped. Predictor variables from the super set were added in subsequent steps and their
effect on variable selection criteria was studied for decision making on variable addition.
The process was repeated by changing the first selected variable and subsequently adding
and dropping variables forming new subset of predictor variables. The subset that best
optimized the variable selection criteria was used for model building. The best subset of
input variables includes ball height, substrate thickness, substrate area, solder volume and
delta T.
6.3 MULTIPLE LINEAR REGRESSION
Multiple linear regression has been used for developing a relation between
characteristic life of CCGA package with its geometric details, material properties and
operating conditions. The best subset of variables obtained from stepwise methods has
been used as predictor variables and 63% characteristic life has been used as the response
variable. All predictor variables except solder volume have been input in continuous

137
form. Solder volume with two levels, nominal and high has been input in binary form
using a binary variable, soldervolume. A zero state represents a case of nominal solder
volume and one state represents high solder volume. When soldervolume is input zero,
the term is knocked out of the equation and the prediction equation modifies itself for
nominal solder volume. When a one is input for soldervolume , the effect of high solder
volume is added to the equation. Since transition from nominal solder volume to low
solder volume does not create a significant increase in the characteristic life it has not
been included in the model building. MINITABTM
statistical software has been used for
model building. The multiple linear regression models are given by Table 6.2. The
prediction equation is given by Equation 6.1
DeltaTmeSolderVoluBallHeight
hicknessSubstrateTreaSubstrateAsticLifeCharacteri
×−×−×+
×−×−=
439.499.8146.2790
79.352247.18.6271%63
Eq 6.1
6.4 HYPOTHESIS TESTING
Analysis of variance has been used for testing the overall adequacy of the model.
Small P value in the ANOVA table given by Table 6.3 shows the overall adequacy of the
model signifying, the presence of at least one variable that is contributing significantly
towards life prediction. Coefficient of determination, R2, which determine the percentage
of variation of the response variable explained by the predictor variables, has also been
used for assessing the overall adequacy of the prediction model. A coefficient of
determination value of 89% for the model suggests that the predictor variables together
account for 89% of variation in characteristic life. Since coefficient of determination is

138
Predictors
(ln a0, fk)
Coeff
(bk) SE
Coeff T P-Value
Constant 6271.8
808.3 7.76 0.000
SubAreaSqMM -1.2479
0.3454 -3.61 0.001
SubThkMM -352.79
95.80 -3.68 0.001
BallHtMM 2790.6
301.7 9.25 0.000
SolderVolume -814.9
285.7 -2.85 0.007
DeltaT -49.439
3.558 -13.89 0.000
Table 6.2: Multiple linear regression model for characteristic life prediction of CCGA package.
Source D.F SS MS F P
Regression
6 131084172 21847362 55.05 0.000
Residual Error
42 16666954 396832
Total
48 Table 6.3: Analysis of variance of CCGA multiple linear regression model.

139
dependent on number of predictor variable the Adj R2 parameter has also been studied.
An Adj R2
of 88% reconfirms the overall adequacy of the model. Thus the model is
adequate for prediction purposes.
T tests on individual regression coefficients have been performed for determining
the statistical significance of each predictor variable for retaining in the model. The p-
value of a parameter in Table 6.2 indicates the statistical significance of that parameter
and the parameter with p-value less than 0.05 is considered to be statistically significant
and expected to have a significant effect on the reliability of the package, with confidence
level of more than 95.0%. All the predictor variables in Table 6.2 are statistically
significant with p-values in the neighborhood of 0 to 5%.
6.5 MODEL ADEQUACY CHECKING
Model appropriateness for application has been checked using any one or
combination of the several of the features of the model, such as linearity, normality,
variance which may be violated. Model residuals which measure deviation between data
and fit have been studied and plotted to check model appropriateness and violation of
assumptions. Residual plots studied include, the normal probability plot, histogram plot
of residuals, plot of residuals against fitted values, plot of residual against regressor and
plot of residual in time sequence (Figure 6.3). Departures from normality and the
resultant effect on t-statistic or f-statistic and confidence and prediction intervals have
been studied using normal probability plots. A straight line variation indicates a
cumulative normal distribution. Plots of residuals against fitted values and plots of
residuals against the regressors have been used to check for constant-variance. Existence

140
Figure 6.3: Residual plots of CCGA multiple linear regression model.
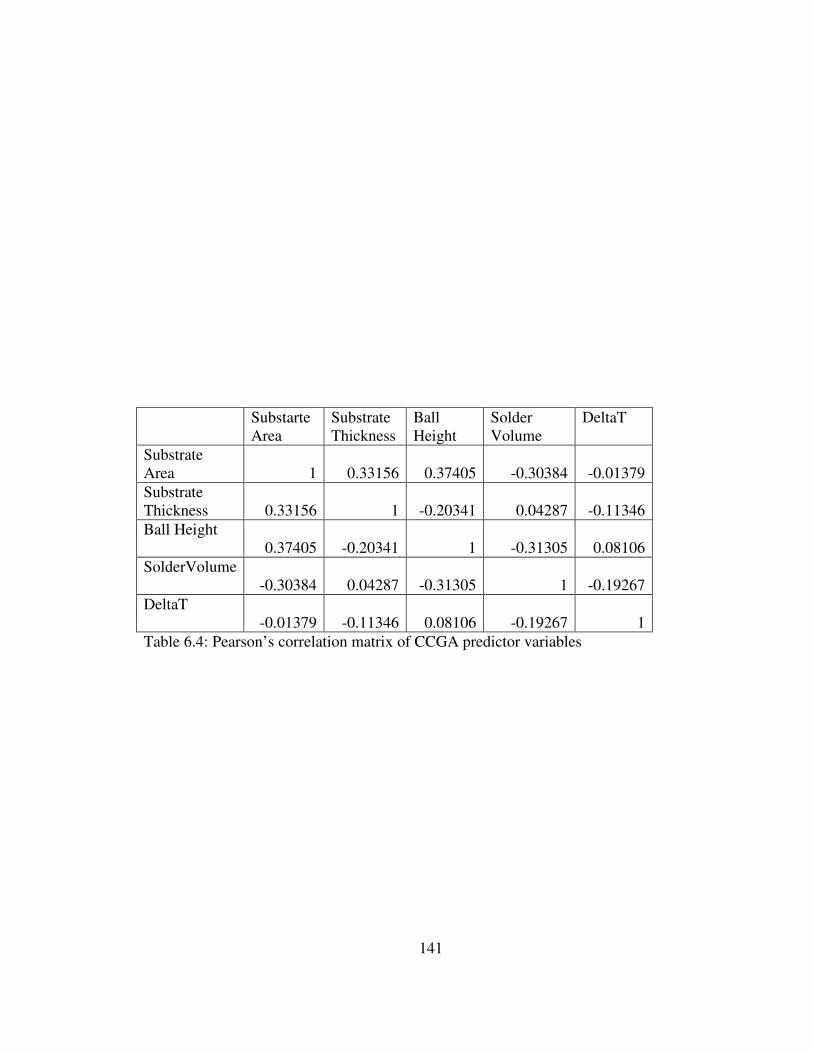
141
Substarte
Area
Substrate
Thickness
Ball
Height
Solder
Volume
DeltaT
Substrate
Area 1 0.33156 0.37405 -0.30384 -0.01379
Substrate
Thickness 0.33156 1 -0.20341 0.04287 -0.11346
Ball Height
0.37405 -0.20341 1 -0.31305 0.08106
SolderVolume
-0.30384 0.04287 -0.31305 1 -0.19267
DeltaT
-0.01379 -0.11346 0.08106 -0.19267 1
Table 6.4: Pearson’s correlation matrix of CCGA predictor variables

142
of residuals within the normal band indicates constant variance. Multi-collinearity has
been checked using Pearson’s correlation matrix (Table 6.4) and variance inflation factor
values. Absence of any large values in the Pearson’s correlation matrix shows absence of
any multi-collinearity problems.
6.6 MODEL CORRELATION WITH EXPERIMENTAL DATA
The predicted characteristic life of the statistical model have been compared with
the actual characteristic life using a single factor design of experiment study to asses the
prediction ability of the statistical models. 63% characteristic life has been used as
response variable and prediction method, used for obtaining the characteristic life, with,
experimental method and statistical method as its two levels, has been used as the factor
of study. The objective of the study is to analyze if the characteristic life predicted by
both the methods for any given test case is the same under 95% confidence level.
Analysis of variance has been used for testing the equality of mean predicted life.
The null hypothesis of the test is that the mean characteristic life prediction by all the
methods is the same. The alternate hypothesis is that, there is at least one method with
predicted characteristic life different from the others. The analysis was conducted using
commercially available statistical software MINITABTM
. The equality of means has been
studied using the generalized linear model function. The characteristic life, which is used
as response variable contains values of predicted characteristic life obtained from both
statistical and experimental method. The prediction method which is used a model
variable, uses a binary variable to describe the type of method. A value of zero is
assigned for experimental method and a value of 1 is assigned for statistical method.

143
Source DF SeqSS
Adj SS Adj MS F Statistic P value
Prediction
Method
2 2420582
2420582
710291
1.10
1.000
Error 96 278835298
278835298
2904534
Total 97 278835298
Table 6.5: Single factor analysis of variance

144
High P values of ANOVA table [Table 6.5] shows a clear acceptance of the null
hypothesis. Thus it can be concluded that there is no significant difference in the
characteristic life predicted by the statistical models and experimental methods. Since the
factor has only two levels the ANOVA table in itself becomes a paired T test eliminating
the need for a separate T test.
6.7 MODEL VALIDATION
The statistical modeling methodology presented in this section has been validated
against the experimental accelerated test failure data. Statistical model predictions have
been done by using multiple linear regression models. Statistics based sensitivity factors
quantifying the effect of design, material, architecture, and environment parameters on
thermal fatigue reliability have been used to compute life. The sensitivity study can be
used in building confidence during trade-off studies by arriving at consistent results in
terms of reliability impact of changes in material, configuration and geometry using
different modeling approaches. The effect of various design parameters on the thermal
reliability of package have been presented in this section. The predictions from statistical
model have also been compared with the experimental statistical data.
6.7.1 SUBSTRATE AREA
The thermo-mechanical reliability of ceramic column grid array packages
decreases with increase in substrate area. Multiple linear regression models have been
used for evaluating the sensitivity of thermo-mechanical reliability to substrate area. The
cycles for 63.2% failure from the experimental data and multiple linear regression models
have been plotted against the die length of various devices. The predicted values from

145
the prediction model follow the experimental values quite accurately and show the same
trend (Figure 6.4). This trend is also consistent from the failure mechanics standpoint, as
the solder joints with larger substrate area are subjected to much higher strains due to the
increased distance from the neutral point, thus having lower reliability.
Encapsulated CCGA packages with substrate area of 1024 Sqmm, 1764 Sqmm
and 1806Sqmm have been used for comparing the multiple linear regression model
predictions with the actual test failure data (Figure 6.4). All the three packages had high
lead solder joints of different ball pitch and substrate thickness and were subjected to
different air-to-air thermal cycles (ATC) including thermal cycle of –55°C to 125°C, and
0°C to 100°C. Thus, the model is being tested for its ability to predict both single and
coupled effects. A negative sensitivity has been computed for the effect of substrate area.
A negative sensitivity factor indicates that the characteristic life of a CCGA package
decreases when the die length increases and all the other parameters remaining constant.
6.7.2 SUBSTARTE THICKNESS
Substrate thickness has a great influence on the thermo-mechanical reliability of
CCGA packages. Increasing the thickness of the ceramic substrate decreases the thermo-
mechanical reliability of solder joints. This trend is also consistent from the failure
mechanics standpoint, as thicker substrates tend to be rigid increasing the overall
assembly stiffness thereby inducing great stresses on the solder joints. Ceramic column
grid array packages with substrate thickness of 0.8 mm, 2.9 mm and 3.75 mm have been
used for demonstrating this effect [Figure 6.5]. Sensitivity of thermo-mechanical
reliability on substrate thickness has been determined using multiple linear regression.

146
0
1000
2000
3000
4000
5000
6000
1024 1764 1806
Substrate Area SqMM
Ch
ara
cte
ris
tic
Lif
e(C
yc
les
)
Experimental
Predicted
Figure 6.4: Effect of substrate area on thermal fatigue reliability of CCGA packages
Substrate
Area
(mm)
Substrate
Thickness
(mm)
Ball
Height
(mm)
Solder
Volume
Experiment MLR Sensitivity
Factor For
Substrate
Area
1024 2.9 2.21 Nominal 5010
5194
1764 1.4 2.21 Nominal 3874
3957
1806 3.75 2.21 Nominal 3417
3761
-1.2479
Table 6.6: Sensitivity of the package reliability to Delta T and comparison of model
predictions with actual failure data

147
0
1000
2000
3000
4000
5000
6000
7000
0.8 2.9 3.75
Substrate Thickness MM
Ch
ara
cte
ris
tic
Lif
e (
Cy
cle
s)
Experimental
Predicted
Figure 6.5 Effect of substrate thickness on thermal fatigue reliability of CCGA packages
Substrate
Thickness
(mm)
Substrate
Area
(Sqmm)
Ball
Height
DeltaT Experiment MLR Sensitivity
Factor For
Substrate
Thickness
0.8 1056.25 2.21 100 6056
5894
2.9 1764 2.21 100 3874
3957
3.75 1806 2.21 100 3185
3103
-352.79
Table 6.7: Sensitivity of the package reliability to die length and comparison of model
predictions with actual failure data

148
method. The sensitivity factor indicates that for every unit increase of substrate thickness
keeping all other parameters constant the characteristic life of the CCGA package
decreases by 352 cycles. The characteristic life predicted by the model lies in close
proximity to the actual characteristic life from the experimental thermal cycling test.
6.7.3 BALL HEIGHT
The height of the solder joint has direct influence on the thermo-mechanical
reliability of CCGA packages. The thermo-mechanical reliability increases with increase
in the solder joint height. This is supported by failure mechanics theory as, taller solder
joints have longer crack propagation length leading giving more time for the joint to fail.
This trend has been demonstrated for CCGA packages with ball heights of 0.89 mm, 1.27
mm and 2.21 mm [Figure 6.6]. Sensitivity of thermo-mechanical reliability on substrate
thickness has been determined using multiple linear regression method. The sensitivity
factor indicates that for every unit increase of solder ball height keeping all other
parameters constant the characteristic life of the CCGA package increases by 2790
cycles. Model predictions show good correlation with experimental data.
6.7.4 SOLDER VOLUME
The effect of solder joint volume on thermo-mechanical reliability has been
shown [Figure 6.7]. The decrease in the thermo-mechanical reliability of the device with
increase in the solder volume is demonstrated by both multiple linear regression model
and experimental data. This trend is supported by failure mechanics theory as increasing
the solder volume make the solder joint very stiff leading to higher stress conditions
resulting in higher hysteresis loops with more dissipated energy per cycle. Ceramic ball

149
0
500
1000
1500
2000
2500
3000
3500
4000
4500
5000
0.89 1.27 2.21
Ball Height MM
Ch
ara
cte
ris
tic
Lif
e (
Cy
cle
s)
Experimental
Predicted
Figure 6.6: Effect of ball height on thermal fatigue reliability of CCGA packages
Ball
Height
(mm)
Substrate
Area
(Sqmm)
Substrate
Thickness
(mm)
Solder
Volume
Experiment MLR Sensitivity
Factor For
Ball Height
0.89 1056.25 2.9 Nominal 400
655
1.27 1056.25 2.9 Nominal 1700
1715
2.21 1764 1.4 Nominal 4629
4747
2790.6
Table 6.8: Sensitivity of the package reliability to ball height and comparison of model
predictions with actual failure data
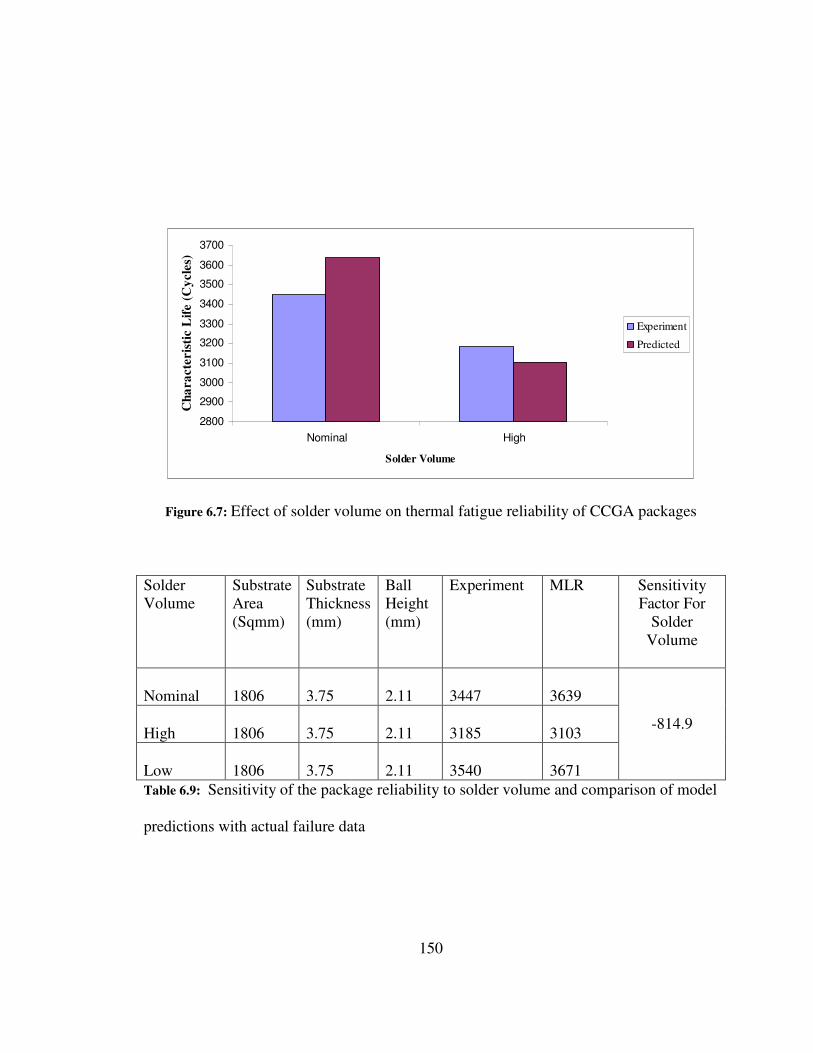
150
2800
2900
3000
3100
3200
3300
3400
3500
3600
3700
Nominal High
Solder Volume
Ch
ara
cte
ris
tic L
ife (
Cy
cle
s)
Experiment
Predicted
Figure 6.7: Effect of solder volume on thermal fatigue reliability of CCGA packages
Solder
Volume
Substrate
Area
(Sqmm)
Substrate
Thickness
(mm)
Ball
Height
(mm)
Experiment MLR Sensitivity
Factor For
Solder
Volume
Nominal 1806 3.75 2.11 3447
3639
High 1806 3.75 2.11 3185
3103
Low 1806 3.75 2.11 3540
3671
-814.9
Table 6.9: Sensitivity of the package reliability to solder volume and comparison of model
predictions with actual failure data

151
grid array packages with nominal, low and high solder volumes have been for comparing
multiple linear regression model predictions with the actual test failure data. A negative
sensitivity factor indicates the characteristic life of CCGA package decreases with
increase in solder volume. Model predictions show good correlation with experimental
data.
6.7.5 DELTA T
The thermo-mechanical life of the CCGA devices, similar to other package
architectures, is a function of the environment or the testing condition to which it is
subjected. Magnitude of the temperature range experienced during the accelerated test is
an influential parameter. The characteristic life of the package decreases with the increase
in the temperature range of the ATC [Figure 6.8] . Temperature cycle magnitude has a
negative sensitivity factor, indicated by decrease in thermo-mechanical reliability with
increase in temperature cycle magnitude. Data presented includes coupled effects of
other parameter variations such as, die size, ball diameter, ball count and cycle time.
Sensitivity of thermo-mechanical reliability on DeltaT has been determined using
multiple linear regression method. The sensitivity factor indicates that for every unit
increase of DeltaT keeping all other parameters constant the characteristic life of the
CCGA package decreases by 49 cycles. The predicted values for characteristic life
calculated based on multiple linear regression model matches the experimental values
from the ATC test very accurately.

152
0
500
1000
1500
2000
2500
3000
3500
100 165 180
DeltaT
Ch
ara
cte
ris
tic
Lif
e(C
yc
les
)
Experimental
Predicted
Figure 6.8: Effect of DeltaT on thermal fatigue reliability of CCGA packages
DeltaT
Substrate
Area
(mm)
Substrate
Thickness
(mm)
Ball
Height
(mm)
Experiment MLR Sensitivity
Factor For
DeltaT
100 1806 3.75 2.11 3185
3103
165 1806 3.75 2.11 1139
1304
180 1024 2.9 2.21 1060
1239
-49.439
Table 6.10: Sensitivity of the package reliability to Delta T and comparison of model
predictions with actual failure data

153
6.8 DESIGN GUIDELINES
The statistical models presented in this section have been used for providing
design guidelines for smart selection of CBGA technologies. The sensitivities from the
statistical models have been used to analyze the effect of various parameters on the solder
joint reliability of the flip chip packages.
• Solder joint reliability of CCGA packages decreases with increase in substrate
area.
• CCGA packages with thinner ceramic substrate’s yield higher reliability than
CCGA packages with thicker ceramic substrates.
• Thermo-mechanical reliability of CCGA packages decreases with increase in
solder volume.
• Solder joint height has a positive sensitivity on solder joint reliability. Increasing
the height of the solder joint increases the solder joint reliability of CCGA
packages.
• Thermo-mechanical reliability of the solder joint in a CCGA package is inversely
proportional to the temperature differential through which the package under goes
thermal cycling

154
CHAPTER 7
POWER LAW DEPENDENCY OF PREDICTOR VARIABLES
Power law relationship of predictor variables with 63 % characteristic life have
been developed for various area array packages including flip chip BGA, Flex BGA,
CBGA and CCGA packages. These power law relationships form the basis of reliability
models in determining the appropriate family of transformations for linearizing the
predictor variables for building robust multiple linear regression models that describe the
data more efficiently . The power law relationship also help determining the appropriate
transformation of predictor variables for coping with multi-collinearity, non normality
and hetro-skedasticity. The power law dependence of predictor variables have been
obtained using Box-Tidwell power law modelling and compared with traditional failure
mechanics values.
7.1 BOX TIDWELL POWER LAW MODELLING
Box-Tidwell power law model attempts to model the power law dependence
between predictor variable and a response variable. The relationship is expressed as an
equation that predicts a response variable from a function of predictor variables and
parameters. The parameter is adjusted so that residual sum of squares is minimized. The
prediction equation is of the form given by Equation 7.1
( )∏=
=n
k
kkfat
1
0%2.63
λ Eq 7.1

155
Where, parameter t63.2% on the left hand side of the equation represents the characteristic
life of three-parameter Weibull distribution for the flip-chip package when subjected to
accelerated thermo-mechanical stresses. The parameters on the right hand side of the
equation are the predictor variables or the various parameters that influence the reliability
of the package and the parameter λk is the power law value obtained from box Tidwell
method.
The Box-Tidwell method has been used to identify a transformation from the
family of power transformations on predictor variables. Box, et. al. [1962] described an
analytical procedure for determining the form of the transformation on regressor
variables, so that the relation between the response and the transformed regressor
variables can be determined. Assume that the response variable t, is related to a power of
the regressor,
( ) ( ) ξβ+β=ββξ= 1010 ,,ftE Eq 7.2
Where,
=α
≠α=ξ
α
0,xln
0,x ,
Eq 7.3
and βo , β1, α are unknown parameters. Suppose that αo is the initial guess of the constant
α. Usually the first guess is 10 =α , so that xx 0
0 ==ξα
, or that no transformation at all is
applied in the first iteration. Expanding about the initial uses in Taylor series,
0
0d
),(df)(),(f)t(E ,0
01,0
α=αξ=ξ
α
ββξα−α+ββξ= +
0
0
2
,0
22
0
d
),(fd
!2
)(
α=αξ=ξ
α
ββξα−α +
Eq 7.4
0
0
3
,0
33
0
d
),(fd
!3
)(
α=αξ=ξ
α
ββξα−α + ……….. +
0
0
n
,0
nn
0
d
),(fd
!n
)(
α=αξ=ξ
α
ββξα−α

156
and ignoring terms of higher than first order gives,
0
0d
),(df)(),(f)t(E ,0
01,0
α=αξ=ξ
α
ββξα−α+ββξ=
0
0d
),(df)1(x
,0
10
α=αξ=ξ
α
ββξ−α+β+β= Eq 7.5
Now if the terms in braces in Equation (B) were known, it could be treated as an
additional regressor variable, and it would be possible to estimate the parameters βo , β1,
and α by method of least squares. This way the value necessary to linearize the regressor
variable can be determined.
This procedure has been carried out for all the four devices for each of its
predictor variable and the results are tabulated and compared with power law dependence
values obtained from failure mechanics method. The power law dependence values
obtained from Box-Tidwell method are found be very close to the power law dependence
values obtained from failure mechanics models.
7.2 POWER LAW DEPENDENCY OF FLIP CHIP PREDICTOR VARIABLES
The power law dependency of predictor variables of flip chip package have been
obtained using Box-Tidwell power law modeling. The predictor variables obtained from
model input selection method has been used for power law dependency studies. The
predictor and response variables are transformed using a natural log transformation and a
regression analysis using the transformed variables has been conducted in order to obtain
the initial guess value of alpha for each predictor variable. The predictor variables are

157
then power transformed using their corresponding alpha value’s obtained from initial
guess and the residual sum of squares is obtained which is then fitted into Equation 7.5.
Equation 7.5 represents a multiple linear regression model and the parameters of the
equation including α and β have been obtained using method of least squares. The
predictor variables are again power transformed using the newly obtained alpha value and
the residual sum of squares is extracted. The residual sum of squares is again fitted into
Equation 7.5and the next alpha value is obtained using method of least squares. This
iteration is continued until the residual sum of squares is minimized. The procedure for
power law modeling has been coded in commercial statistical software SASTM
.
Power law dependency of flip chip predictor variables is given by Table 7.1. The
table gives an alpha value of 2.08 for solder ball diameter which matches very closely
with failure mechanics value of 2.3. Also, alpha values of -2.55 for Delta T and 3.7 for
ball height match closely with failure mechanics values of 2.3 and 2.7 respectively.
Apart from magnitude the sensitivity trends of power law dependency values are found to
conform to experimental data and statistical models. Trends of positive sensitivity for
under cover area, solder ball diameter, underfill modulus and ball height and negative
sensitivity for die length, solder modulus, underfill CTE are very much inline with
experimental data and statistical model predictions. The power law dependency values
can be used for developing generalized linear model with appropriate distributions
corresponding to the power law dependency values of each predictor variables. Also, the
power law dependence values can be used for adding correcting terms for addition for
extra variables in the traditional failure mechanics model for more accurate reliability
prediction of flip chip packages

158
Parameter Box-
Tidwell
[Norris Landzberg
1998]
[Coffin-
Manson
1954]
[Goldmann 1969]
Die Length -69.31
Undercover
Area
34.625
Solder
Modulus
-0.827
Underfill CTE -0.202
Solder
Ball Dia
2.0827 4 2.3 5.44
Ball Pitch -2.9369
Delta T -2.55
-2 -2.3 -2
Ball Height 3.741
2.7 2.3 2
Underfill
Modulus
0.5009
Table 7.1: Power law dependency of flip chip predictor variables
Chr
VTlN
n
rel =
∇
+
β
βπα
1
12
( ) CNn
p =∆εm
m
fuTfAV
hrTKN
∏=
+
δ
ββ 112

159
7.3 POWER LAW DEPENDENCE OF CBGA PREDICTOR VARIABLES
The power law dependency of CBGA predictor variables with characteristic life is
given by Table 7.2. The variables for power law dependency have been selected from
model input selection. The power law relations have been obtained using Box-Tidwell
power law modeling in a manner similar to that of flip chip variables. The initial alpha
value for each variable has been obtained using a regression analysis on natural log
transformed data and the residual sum of squares have extracted. The residual sum of
squares is then substitutes in Equation 7.5 and the next alpha value is obtained. The
iteration has been continued until the residual sum of squares has been minimized.
The Box Tidwell method yields an alpha value of -2.147 which matches closely
with failure mechanics values of -2 and -2.3. The power dependency value of -1.209 for
diagonal length is also very close with failure mechanics value of -2. Also, the power law
dependence values of underfill CTE, underfill modulus and solder modulus match closely
for CBGA and Flip chip BGA. This gives scope for adding correction factors for the
inclusion of material properties in the traditional failure mechanics models which are
based more on geometric aspects of the package. The sensitivity trends of power law
values are found to be inline with sensitivity trends of statistical model and experimental
data. A trend of positive sensitivity for ball count, ball diameter, underfill modulus and
ceramic CTE and negative sensitivity for Delta T, PCB thickness, underfill CTE, solder
modulus, substarte thickness and diagonal length is in good conformance with sensitivity
trend of experimental data and statistical prediction model. Power law dependence values
show good correlation with failure mechanics values.

160
7.4 POWER LAW DEPENDENCE OF CCGA PREDICTOR VARIABLES
The power law dependence value of CCGA predictor variable has been obtained
using Box-Tidwell power law modeling. The power law dependence of predictor
variables are given by Table 7.3. The power law dependence value of 2.4 for ball height
is found to match closely with failure mechanics values of 2.3. The power law
dependency values of -2.8 and -0.14 are found to match closely with failure mechanics
value of -2.3 and -.152 respectively. A trend of positive sensitivity for ball height and
solder diameter and negative sensitivity for substrate area, substrate thickness, solder
volume and delta T is inline with sensitivity trends of experimental data and statistical
prediction models.
7.5 POWER LAW DEPENDENCE OF Flex-BGA PREDICTOR VARIABLES
The power law dependency of Flex BGA predictor variables with characteristic life is
given by Table 7.4. The power law dependence values have been obtained in a manner
similar to that of Flip chip, CBGA and CCGA packages. The sensitivity trends of power
law values are found to be inline with sensitivity trends of statistical model and
experimental data. A trend of positive sensitivity for ball count, ball diameter and
encapsulant mold compound filler content and negative sensitivity for die to body ratio,
PCB thickness, delta T and board finish is well in conformance with sensitivity trend of
experimental data and statistical prediction models. The power law dependency values of
ball diameter and Delta T are roughly in the range of failure mechanics values however
not very close. However, values in correct sensitivity and rough range indicates

161
convergence with failure mechanics can be achieved by expanding the data set and
increasing the number of iterations.

162
Parameter Box-
Tidwell
[Norris Landzberg
1998]
[Coffin-
Manson
1954]
[Goldmann 1969]
Ball Count 0.2501
Delta T -2.147 -2 -2.3 -2
PCB
Thickness
-0.255
Ball
Diameter
0.667 4 2.3 5.44
Underfill
CTE
-0.3172
Underfill
Modulus
0.6498
Solder CTE -0.571
Ceramic CTE 0.93
Substrate
Thickness
-0.41
Diagonal
Length
-1.029 -2.3 -2 -2
Table 7.2: Power law dependency of CBGA predictor variables
Chr
VTlN
n
rel =
∇
+
β
βπα
1
12
( ) CNn
p =∆εm
m
fuTfAV
hrTKN
∏=
+
δ
ββ 112

163
Parameter Box-
Tidwell
[Norris Landzberg
1998]
[Coffin-
Manson
1954]
[Goldmann 1969]
Substrate
Area
-0.61
Substrate
Thk
-0.22
Ball Height 2.4096 2.7 2.3 2
Delta T -2.862 -2 -2.3 -2
Solder
Volume
-0.1485 -0.152 -0.175
Solder Dia 0.3027 4 2.3 5.44
Table 7.3: Power law dependency of CCGA predictor variables
Chr
VTlN
n
rel =
∇
+
β
βπα
1
12
( ) CNn
p =∆εm
m
fuTfAV
hrTKN
∏=
+
δ
ββ 112

164
Parameter Box-
Tidwell
[Norris Landzberg
1998]
[Coffin-
Manson
1954]
[Goldmann 1969]
Die To Body
Ratio
-1.739
Ball Count 0.4162
Ball
Diameter
0.9485 4 2.3 5.44
PCB
Thickness
-0.5322
Delta T -0.9454 -2 -2.3 -2
EMC Filler
ID
0.1913
Board Finish
ID
-0.0779
Table 7.4: Power law dependency of Flex-BGA predictor variables
Chr
VTlN
n
rel =
∇
+
β
βπα
1
12
( ) CNn
p =∆εm
m
fuTfAV
hrTKN
∏=
+
δ
ββ 112

165
CHAPTER 8
SUMMARY AND CONCLUSION
A perturbation modeling methodology based on multiple linear regression,
principal components regression and power law modeling has been presented in this
paper. The method provides an extremely cost effective and time effective solution for
doing trade-offs and the thermo-mechanical reliability assessment of various BGA
packages including Flex-BGA, CBGA, CCGA and Flip-chip BGA subjected to extreme
environments. This methodology also allows the user to understand the relative impact
of the various geometric parameters, material properties and thermal environment on the
thermo-mechanical reliability of the different configurations of BGA packages with
leaded as well as lead-free solder joints.
The model predictions from both statistics and failure mechanics based models
have been validated with the actual ATC test failure data. The convergence between
experimental results and the model predictions with higher order of accuracy than
achieved by any first order closed form models has been demonstrated, which develops
the confidence for the application of the models for comparing the reliability of the
different BGA packages for various parametric variations. The current approach allows
the user to analyze independent as well as coupled effects of the various parameters on
the package reliability under harsh environment. It is recommended to use these models

166
for analyzing the relative influence of the parametric variations on the thermo-mechanical
reliability of the package instead of using them for absolute life calculations.
Power law relationship of predictor variables with 63 % characteristic life have
been developed for various area array packages including flip chip BGA, Flex BGA,
CBGA and CCGA packages. These power law relationships form the basis of reliability
models in determining the appropriate family of transformations for linearizing the
predictor variables for building robust multiple linear regression models that describe the
data more efficiently. The power law values show good conformance with failure
mechanics values for most of the variables. Convergence of power law values can best be
achieved by expanding the existing data set. Advanced power law models can then be
developed by transforming each predictor variable with its appropriate power law
transformation and then conducting a linear regression analysis. Such power law
transformed linear regression models can describe the data more efficiently and resulting
in better prediction models. Also, the power law lamda values can be used for adding
correction factors to existing first order failure mechanics models and building power law
based models.
Parameter interactions, their effect on reliability and model optimization can be
considered for an extension of this work. Parameter interaction effects can be studied
using factor plots and factorial study. If interaction between two variables is found to be
significant, an interaction term as a product of the original variables can be added to
existing model the effect of interaction can be studied. Polynomial regression models can
be used for model building as multiple linear regression can fail due to multi-collinearity
of original and interaction variable. Response surface methodologies can be used for

167
visualizing the sensitivity of parameter to reliability and optimization of parameter for
maximizing the reliability.

168
BIBLIOGRAPHY
Anand, L., “Constitutive Equations for Hot-Working of Metals”, International Journal of Plasticity, Vol. 1, pp. 213-231, 1985.
Amagai, M., Watanabe, M. Omiya, M. Kishimoto, K and Shibuya, T., “Mechanical
Characterization of Sn-Ag Based Lead-Free Solders”, Transactions on Microelectronics Reliability, Vol. 42, pp. 951-966, 2002.
Amagai, M., Nakao, M., “Ball Grid Array (BGA) Packages with the Copper Core Solder
Balls” Proceedings of Electronic Components and Technology Conference, Seattle, WA, pp. 692-701, May 25-28, 1998.
Banks, D. R., Burnette, T. E. Gerke, R.D. Mammo, E. Mattay, S., “ Reliability
Comparision of Two Mettalurgies for Ceramic Ball Grid Array”, IEEE Transactions on Components, Packaging and Manufacturing Technology, Part B, Vol. 18, No. 1, February 1995.
Barker, D. B., Mager, B. M. And Osterman, M. D., “Analytic Characterization of Area
Array Interconnect Shear Force Bahavios”, Proceedings of ASME International Mechanical Engineering Congress and Exposition, New Orleans, LA, pp. 1-8, November 17-22, 2002.
Bedinger, J. M., “Microwave Flip Chip and BGA Technology”, IEEE MTT-S
International Microwave Symposium Digest, v 2, pp 713-716, 2000. Box, G. E. P., Cox, D, R., “An analysis of transformations revisited, rebutted”, Journal
of American Statistical Association, vol. 77, no. 377, pp. 209-210, March 1982.
Box, G. E. P., Tidwell, P. W., “Transformation of the independent variables” Technometrics, vol. 4, no. 4, pp.531-550, Nov.1962.
Braun, T., Becker, K.F. Sommer, J.P. Löher, T. Schottenloher, K. Kohl, R. Pufall, R.
Bader, V. Koch, M. Aschenbrenner, R.Reichl, H.,” High Temperature Potential of Flip Chip Assemblies for Automotive Applications” Proceedings of the 55th Electronic Components and Technology Conference, Orlando, Florida, pp. 376-383, May 31-June 3, 2005.

169
Brooks, S. P., N. Friel, R. King, Classical Model Selection via Simulated Annealing, Journal of the Royal Statistical Society, Vol. 65, No. 2, pp. 503, May 2003.
Brown, S. B., Kim, K. H. and Anand, L., “An Internal Variable Constitutive Model for
Hot Working of Metals”, International Journal of Plasticity, Vol. 5, pp. 95-130, 1989. Burnettel, T., Johnson, Z. Koschmieder, T. and Oyler, W., “Underfilled BGAs for
Ceramic BGA Packages and Board-Level Reliability”, Proceedings of the 50th Electronic and Components Technology Conference, Las Vegas, NV, pp. 1221-1226, May 23-26, 2000.
Busso, E. P., and Kitano, M., “A Visco-Plastic Constitutive Model for 60/40 Tin-Lead
Solder Used in IC Package Joints,” ASME Journal of Engineering Material Technology, Vol. 114, pp. 331-337, 1992.
Cheng, Z., “Lifetime of Solder Joint and Delamination in Flip Chip Assemblies”,
Proceedings of 2004 International Conference on the Business of Electronic Product Reliability and Liability, Shangai, China, pp. 174- 186, April 27-30, 2005.
Clech, Jean-Paul, “Solder Reliability Solutions: A PC based design-for-reliability tool”,
Proceedings of Surface Mount International Conference, San Jose, CA, pp. 136-151, Sept. 8-12, 1996.
Clech, Jean-Paul, “Tools to Assess the Attachment Reliability of Modern Soldered
Assemblies”, Proceedings of NEPCON West ’96, Anaheim, CA, pp.35-45, February 23-27, 1997
Clech, Jean-Paul, “Flip-Chip/CSP Assembly Reliability and Solder Volume Effects”, Proceedings of Surface Mount International Conference, San Jose, CA, pp. 315-324, August 23-27, 1998.
Coffin, L. F., “A Study of the Effects of Cyclic Thermal Stresses on a Ductile Metal”, Transactions of ASME, Vol. 76, pp. 931-950, 1954.
Corbin, J.S., “Finite element analysis for Solder Ball Connect (SBC) structural design Optimization”, IBM Journal of Research Development, Vol. 37, No. 5 pp. 585-596, 1991.
Darveaux, R., and Banerji, K., “Fatigue Analysis Of Flip Chip Assemblies Using
Thermal Stress Simulations and Coffin-Manson Relation” Proceedings of 41st Electronic Components and technology Conference, pp. 797-805, 1991.
Darveaux, R., “How to use Finite Element Analysis to Predict Solder Joint Fatigue Life”, Proceedings of the VIII International Congress on Experimental Mechanics, Nashville, Tennessee, June 10-13, pp. 41-42, 1996.

170
Darveaux, R., and Banerji, K., “Constitutive Relations for Tin-Based Solder Joints,” IEEE Transactions on Components, Hybrids and Manufacturing Technology, Vol. 15, No. 6, pp. 1013-1024, 1992.
Darveaux, R., Banerji, K., Mawer, A., and Dody, G., “Reliability of Plastic Ball Grid Array Assembly”, Ball Grid Array Technology, J. Lau, ed., McGraw-Hill, Inc. New York, pp. 379-442, 1995.
Darveaux, R., “Effect of Simulation Methodology on Solder Joint Crack Growth Correlation,” Proceedings of the 50th Electronic Components and Technology Conference, Las Vegas, Nevada, pp.1048-1058, May 21-24, 2000.
Darveaux, R., and Banerji, K., “Constitutive Relations for Tin-Based Solder Joints,” IEEE Transactions on Components, Hybrids and Manufacturing Technology, Vol. 15, No. 6, pp. 1013-1024, 1992.
Doughetry, D., Fusaro, J. and Culbertson, D., “ Reliability Model For Micro Miniature Electronic Packages” Proceedings of International Symposium On Microelectronics, Singapore, pp. 604-611, 23-26 June 1997.
Duan, Z., He, J., Ning, Y. and Dong, Z., “Strain Energy Partitioning Approach andIts Application to Low-Cycle Fatigue Life Prediction for Some Heat-Resistant Alloys,” Low-Cycle Fatigue, ASTM STP 942, H. D. Solomon, G. R. Halford, L. R. Kaisand, and B. N. Leis, Eds., ASME, Philadelphia, pp.1133-1143, 1988.
Dwinnell, W., Modeling Methodology, PCAI Magazine, Vol. 12, No. 1, pp. 23-26, Jan.
1998.
Engelmaier, W., “Fatigue life of leadless chip carrier solder joints during power cycling,” IEEE Transactions on Components, Hybrids, Manufacturing Technology, Vol. 6, pp. 52–57, September, 1983.
Engelmaier, W., “Functional Cycles and Surface Mounting Attachment Reliability”, ISHM Technical Monograph Series, pp. 87-114, 1984.
Engelmaier, W., “The Use Environments of Electronic Assemblies and Their Impact on Surface Mount Solder Attachment Reliability” IEEE Transactions on Components, Hybrids, and Manufacturing Technology, Vol. 13, No. 4, pp. 903-908, December 1990.
Farooq, M., Gold, L. Martin, G. Goldsmith, C. Bergeron, C., “Thermo-Mechanical
Fatigue Reliability of Pb-Free Ceramic Ball Grid Arrays: Experimental Data and Lifetime Prediction Modeling”, Proceedings of the 52nd Electronic Components and Technology Conference, New Orleans, LA, pp. 827-833, May 27-30, 2003.
Fusaro, J. M., and Darveaux, R., ‘‘Reliability of Copper Base-plate High Current Power
Modules’’, Int. Journal Of Microcircuits Electronic Packaging, Vol. 20, No. 2, pp. 81–88, 1997.

171
Garofalo, F., Fundamentals of Creep and Creep-Rupture in Metals, The Macmillan Company, New York, NY, 1965.
Gerke, R.D., Kromann, G.B., “Solder Joint Reliability of High I/O Ceramic-Ball-Grid
Arrays and Ceramic Quad-Flat-Packs in Computer Environments: The PowerPC 603TM and PowerPC 604TM Microprocessors”, IEEE Transactions on Components and Packaging Technology, Vol. 22, No. 4, December 1999.
Goetz, M., Zahn, B.A., “ Solder Joint Failure Analysis Using FEM Techniques of a
Silicon Based System-In-Package”, Proceedings of the 25th IEEE/CPMT International Electronics Manufacturing Symposium,pp. 70-75 October 2000.
Goldmann, L.S., “Geometric Optimization of Controlled Collapse Interconnections”,
IBM Journal of Research Development, Vol. 13, pp. 251-265, 1969. Gonzalez, M., Vandevelde, M. Vanfleteren, J. and Manessis, D., “Thermo-Mechanical
FEM Analysis of Lead Free and Lead Containing Solder for Flip Chip Applications” Proceedings of 15th European Microelectronics and Packaging Conference, Brugge, Belgium, pp. 440-445, June 12-15, 2005.
Hong, B.Z., Yuan, T.D, “Integrated Flow-Thermo-mechanical and Reliability Analysis of
a Densely Packed C4/CBGA Assembly” Proceedings of 1998 Inter Society Conference on Thermal Phenomena, Seattle, WA, pp. 220-228, May 27-30, 1998.
Hong, B.Z., “Thermal Fatigue Analysis of a CBGA Package with Lead-free Solder
Fillets”, Proceedings of 1998 Inter Society Conference on Thermal Phenomena, Seattle, WA, pp. 205-211, May 27-30, 1998
Hou, Z., Tian, G. Hatcher, C. Johnson, R.W., “Lead-Free Solder Flip Chip-on-Laminate
Assembly and Reliability”, IEEE Transactions on Components and Packaging Technology, Vol. 24, No. 4, pp. 282-292, October 2001.
Ingalls, E.M., Cole, M. Jozwiak, J. Milkovich, C. Stack, J., “Improvement in Reliability
with CCGA Column Density Increase to lmm Pitch”, Proceedings of the 48th Electronic and Components Technology Conference, Seattle, WA, pp. 1298-1304, May 25-28, 1998.
Interrante, M., Coffin, J. Cole, M. Sousa, I.D. Farooq, M. Goldmann, L., “Lead Free
Package Interconnections for Ceramic Grid Arrays”, Proceedings of IEEE/CPMT/SEMI 28th International Electronics Manufacturing Technology Symposium, San Jose, CA, pp. 1-8, July 16-18, 2003.

172
Iyer, S., Nagarur, N. Damodaran, P., “Model Based Approaches For Selecting Reliable Underfill Flux Combinations for Flip- Chip Packages”,Proceedings Of 2005 Surface Mount Technology Association (SMTA 05), Rosemont, IL, Sep. 25‐29 2005, pp. 488‐493.
Jagarkal, S.G., M. M.Hossain, D. Agouafer, “Design Optimization and Reliability of
PWB Level Electronic Package” Proceedings of 2004 Inter Society Conference on Thermal Phenomena, Las Vegas, NV, p.p. 368-376, June 1-4,2004.
Johnson, Z., “Implementation of and Extension to Darveaux’s Approach to Finite
Element Simulation of BGA Solder Joint Reliability”, Proceedings Of 49th Electronic Components and Technology Conference”, pp. 1190-1195, June 1999
Ju, S.H., Kuskowski, S. Sandor, B. and Plesha, M.E., “Creep- Fatigue Damage Analysis
of Solder Joints”, Proceedings of Fatigue of Electronic Materials, ASTM STP 1153, American Society for Testing and Materials, Philadelphia, PA, pp. 1-21, 1994.
Jung, E. Heinricht, K. Kloeser, J. Aschenbrenner, R. Reichl, H., Alternative Solders
for Flip Chip Applications in the Automotive Environment, IEMT-Europe, Berlin, Germany, pp.82-91, 1998.
Kang, S.K., Lauro, P. Shish, D.Y., “Evaluation of Thermal Fatigue Life and Failure
Mechanisms of Sn-Ag-Cu Solder Joints with Reduced Ag Contents”, Proceedings of 54th Electronic Components & Technology Conference, Las Vegas, NV, pp. 661-667, June 1-4, 2004.
Karnezos, M., M. Goetz, F. Dong, A. Ciaschi and N. Chidambaram, “Flex Tape Ball Grid
Array”, Proceedings of the 46th Electronic and Components Technology Conference, Orlando, FL, pp. 1271-1276, May 28-31, 1996.
King, J. R., D. A. Jackson, Variable selection in large environmental data sets using
principal component analysis, Environmetrics Magazine, Vol 10, No. 1, pp. 66-77, Feb. 1999
Kitchenham, B., E. Mendes, Further comparison of cross-company and within- company
effort estimation models for web Applications, 10th International Symposium on Software Metrics, Chicago, IL, USA, pp. 348-357, Sep 14-16, 2004
Kutner, M.H., Nachtsheim, C.J., Neter, J., Applied Linear Regression Models, McGraw-Hill, New York, 2000.
173
Knecht, S., and L. Fox, “Integrated matrix creep: application to accelerated testing and lifetime prediction”, Chapter 16, Solder Joint Reliability: Theory and Applications, ed. J. H. Lau, Van Nostrand Reinhold, pp. 508-544, 1991.
Lai, Y.S., T.H Wang, C.C.Wang, C.L.Yeh, “Optimal Design in Enhancing Board-level
Thermomechanical and Drop Reliability of Package-on-Package Stacking Assembly”, Proceedings of 2005 Electronics Packaging Technology Conference, Singapore, p.p. 335-341, December 7-9 2005.
Lall, P., N. Islam, J. Suhling and R. Darveaux, “Model for BGA and CSP Reliability in Automotive Underhood Applications”, Proceedings of 53rd Electronic Components and Technology Conference, New Orleans, LA, pp.189 –196, May 27-30, 2003.
Lall, P.; Islam, M. N. , Singh, N.; Suhling, J.C.; Darveaux, R., “Model for BGA and CSP
Reliability in Automotive Underhood Applications”, IEEE Transactions on Components and Packaging Technologies, Vol. 27, No. 3, p 585-593, September 2004.
Lau, J. H. and Dauksher, W., “Reliability of an 1657CCGA (Ceramic Column Grid
Array) Package with Lead-Free Solder Paste on Lead-Free PCBs (Printed Circuit Boards)”, Proceedings of the 54th Electronic and Components Technology Conference, Las Vegas, NV, pp. 718-725, June 1-4, 2004.
Lau, J. H., Ball Grid Array Technology, McGraw-Hill, New York, 1995.
Lau, J. H., Shangguan, D., Lau, D. C. Y., Kung, T. T. W. and Lee, S. W. R., “Thermal-Fatigue Life Prediction Equation for Wafer-Level Chep Scale Package (WLCSP) Lead-Free Solder Joints on Lead-Free Printed Circuit Board (PCB)”, Proceedings of 54th Electronic Components & Technology Conference, IEEE, Las Vegas, NV, pp. 1563-1569, June 1-4, 2004.
Manson, S.S. and Hirschberg, M.H., Fatigue: An Interdisciplinary Approach, Syracuse University Press, Syracuse, NY, pp. 133, 1964.
Master, R. N., and T. P. Dolbear, “Ceramic Ball Grid Array for AMD K6 Microprocessor
Application”, Proceedings of the 48th Electronic and Components Technology Conference, Seattle, WA, pp. 702-706, May 25-28, 1998

174
Master, R. N., Cole, M.S. Martin, G.B., “Ceramic Column Grid Array for Flip Chip Application”, Proceedings of the Electronic and Components Technology Conference,pp. 925-929, May 1995.
Malthouse, E. C., Performance Based Variable Selection for Scoring Models, Journal Of
Interactive Marketing, Vol. 16, No. 4, pp. 37-50, Oct. 2002. McCray, A. T., J. McNames, D. Abercromble, Stepwise Regression for Identifying
Sources of Variation in a Semiconductor Manufacturing Process, Advanced Semiconductor Manufacturing Conference, Boston, MA, USA, pp. 448-452, May 4-6, 2004.
Meiri, R., J. Zahavi , And the Winner is Stepwise Regression, Tel Aviv University, Urban Science Application. Mendes, E., N. Mosley, Further Investigation into the use of CBR and Stepwise
Regression to Predict Development Effort for Web Hypermedia Applications, International Symposium on Empirical Software Engineering, Nara, Japan, pp. 69-78, Oct 3-4, 2002.
Meng, H.H., Eng, O.K., Hua, W.E., beng, L.T., “Application of Moire Interferometry in
Electronics Packaging”, IEEE Proceedings of Electronic Packaging and Technology Conference, pp. 277-282, October 8-10, 1997.
Montgomery, D.C., Peck, E.A., Vining, G.G., “Introduction to Linear Regression
Analysis”, Wiley, New York, 2000.
Muncy, J. V. and Baldwin, D. F., “A Component Level Predictive Reliability Modeling Methodology”, Proceedings of 2004 SMTA International Conference, Chicago, IL, pp. 482-490, September 26-30, 2004.
Muncy, J. V., Lazarakis, T. and Baldwin, D. F., “Predictive Failure Model of Flip Chip on Board Component Level Assemblies”, Proceedings of 53rd Electronic Components & Technology Conference, IEEE, New Orleans, LA, May 27-30, 2003.
Muncy, J. V., Predictive Failure Model For Flip Chip On Board Component Level Assemblies, Ph. D. Dissertation, Georgia Institute of Technology, Atlanta, GA, January, 2004
Norris, K.C., Landzberg, A.H, “Reliability of Controlled Collapse Interconnections”,
IBM Journal of Research Development, Vol. 13, pp. 266-271, 1969.

175
Ostergren, W., and Krempl, E., “A Uniaxial Damage Accumulation Law for Time-Varying Loading Including Creep-Fatigue Interaction,” Transactions of ASME, Journal of Pressure Vessel Technology, Vol. 101, pp. 118-124, 1979.
Pang, H. L. J., Kowk, Y.T. and SeeToh, C. W., “Temperature Cycling Fatigue Analysis of Fine Pitch Solder Joints”, Proceedings of the Pacific Rim/ASME International Intersociety Electronic and Photonic Packaging Conference, INTERPack ‘97,Vol. 2, pp. 1495-1500, 1997.
Pang, J. H. L., Prakash, K. H. And Low, T. H., “Isothermal and Thermal Cycling Aging on IMC Growth Rate in Pb-Free and Pb-Based Solder Interfaces”, Proceedings of 2004 Inter Society Conference on Thermal Phenomena, Las Vegas, NV, pp. 109-115, June 1-4, 2004.
Pang, J. H. L., Chong, D. Y. R, “Flip Chip on Board Solder Joint Reliability Analysis Using 2-D and 3-D FEA Models”, IEEE Transactions On Advanced Packaging, Vol. 24, No. 4, pp. 499-506, November 2001.
Pang, J. H. L., Xiong, B. S. and Che, F. X., “Modeling Stress Strain Curves for Lead-Free 95.5Sn-3.8Ag-0.7Cu Solder”, Proceedings of 5th International Conference on Thermal and Mechanical Simulation and Experiments in Microelectronics and Microsystems, pp. 449-453, 2004.
Pang, J. H. L., Xiong, B. S. and Low, T. H., “Creep and Fatigue Characterization of Lead Free 95.5Sn-3.8Ag-0.7Cu Solder”, Proceedings of 2004 Inter Society Conference on Thermal Phenomena, Las Vegas, NV, pp. 1333-1337, June 1-4, 2004
Pascariu G., Cronin P, Crowley D, “Next-generation Electronics Packaging Using Flip
Chip Technology”, Advanced Packaging, Nov.2003. Peng, C.T., Liu, C.M. Lin, J.C. Cheng, H.C., “Reliability Analysis and Design for the
Fine-Pitch Flip Chip BGA Packaging”, IEEE Transactions on Components and Packaging Technology, Vol. 27, No. 4, pp. 684-693, December 2004.
Pendse, R., Afshari, B. Butel, N. Leibovitz, J. “New CBGA Package with Improved 2”d
Level Reliability” Proceedings of the 50th Electronic Components and Technology Conference, Las Vegas, Nevada, pp.1189-1197, May 21-24, 2000.
Perkins, A., and Sitaraman, S. K., “Predictive Fatigue Life Equations for CBGA Electronic Packages Based on Design Parameters”, Proceedings of 2004 Inter Society Conference on Thermal Phenomena, Las Vegas, NV, pp. 253-258, June 1-4, 2004.
Perkins, A., and Sitaraman, S.K., “Thermo-Mechanical Failure Comparison and Evaluation of CCGA and CBGA Electronic Packages” Proceedings of the 52nd Electronic Components and Technology Conference, New Orleans, LA, pp. 422-430, May 27-30, 2003.
176
Pitarresi, J.M., Sethuraman, S. and Nandagopal, B., “ Reliability Modelling Of Chip
Scale Packages”, Proceedings of 25th IEEE/CPMT International Electronics Manufacturing Technology Symposium, pp. 60-69,October 2000.
Qian, Z., and Liu, S., ‘‘A Unified Viscoplastic Constitutive Model for Tin-Lead Solder
Joints,’’ Advances in Electronic Packaging, ASME EEP-Vol.192, pp. 1599–1604, 1997.
Ray, S.K., Quinones, H., Iruvanti, S., Atwood, E., Walls, L., “Ceramic Column Grid
Array (CCGA) Module for a High Performance Workstation Application”, Proceedings - Electronic Components and Technology Conference, pp 319-324, 1997.
Riebling, J., “Finite Element Modelling Of Ball Grid Array Components”, Masters
Thesis, Binghamton University, Binghamton, NY, 1996.
Shi, X. Q., Pang, H. L. J., Zhou, W. and Wang, Z. P., “A Modified Energy-Based Low Cycle Fatigue Model for Eutectic Solder Alloy”, Journal of Scripta Material, Vol. 41, No. 3, pp. 289-296, 1999.
Shi, X. Q., Pang, H. L. J., Zhou, W. and Wang, Z. P., “Low Cycle Fatigue Analysis of Temperature and Frequency Effects in Eutectic Solder Alloy”, International Journal of Fatigue, pp. 217-228, 2000
Sillanpaa, M., Okura, J.H., “Flip chip on board: assessment of reliability in cellular
phone application”, IEEE-CPMT Vol.27, Issue:3, pp. 461 – 467, Sept.2004. Singh, N.C., “Thermo-Mechanical Reliability Models for Life Prediction Of Area Array
Packages”, Masters Dissertation, Auburn University, Auburn, AL, May 2006. Skipor, A. F., et al., ‘‘On the Constitutive Response of 63/37 Sn/Pb Eutectic Solder,’’
ASME Journal of Engineering Material Technology, 118, pp. 1–11, 1996. Solomon, H.D., “Fatigue of 60/40 Solder”, IEEE Transactions on Components, Hybrids,
and Manufacturing Technology”, Vol. No. 4, pp. 423-432, December 1986. Stoyanov, S., C. Bailey, M. Cross, “Optimisation Modelling for Flip-Chip Solder Joint
Reliability”, Journal of Soldering & Surface Mount Technology, Vol. 14, No 1, p.p. 49-58, 2002.
Suhir, E., “Microelectronics and Photonics-the Future”, Proceedings of 22nd
International Conference On Microelectronics (MIEL 2000), Vol 1, NIS, SERBIA, pp. 3-17, 14- 17 MAY, 2000.

177
Swanson, N. R., H. White, A Model Selection Approach to Real-Time Macroeconomic Forecasting Using Linear Models and Artificial Neural Networks, International Symposium on Forecastors, Stockholm, Sweden, pp. 232-246, Mar. 1994.
Syed, A. R., “Thermal Fatigue Reliability Enhancement of Plastic Ball Grid Array (PBGA) Packages”, Proceedings of the 46th Electronic Components and Technology Conference, Orlando, FL, pp. 1211-1216 May 28-31, 1996.
Syed, A. R., “Thermal Fatigue Reliability Enhancement of Plastic Ball Grid Array (PBGA) Packages”, Proceedings of the 46th Electronic Components and Technology Conference, Orlando, FL, pp. 1211-1216, May 28-31, 1996.
Syed, A., “Factors Affecting Creep-Fatigue Interaction in Eutectic Sn/Pb Solder Joints”, Proceedings of the Pacific Rim/ASME International Intersociety Electronic and Photonic Packaging Conference, INTERPack ‘97,Vol. 2, pp. 1535-1542, 1997.
Syed, A., “Predicting Solder Joint Reliability for Thermal, Power and Bend Cycle within 25% Accuracy”, Proceedings of 51st Electronic Components & Technology Conference, IEEE, Orlando, FL, pp. 255-263, May 29-June 1, 2001.
Syed, A., “Accumulated Creep Strain and Energy Density Based Thermal Fatigue Life
Prediction Models for SnAgCu Solder Joints”, Proceedings of 54th Electronic Components & Technology Conference, Las Vegas, NV, pp. 737-746, June 1-4, 2004.
Teo, P.S., Huang, Y.W. Tung, C.H. Marks, M.R. Lim, T.B. “Investigation of Under Bump
Metallization Systems for Flip-Chip Assemblies”, Proceedings of the 50th Electronic Components and Technology Conference, Las Vegas, Nevada, pp.33-39, May 21-24, 2000.
Teng, S.Y., Brillhart, M., “ Reliability Assessment of a High CTE CBGA for high
Availability Systems”, Proceedings of 52nd Electronic and Components Technology Conference, San Diego, CA, pp. 611-616, May 28-31, 2002.
Tummala, R. R., Rymaszewski, E. J. and Klopfenstein, A. G., Microelectronics Packaging Handbook Technology Drivers Part 1, Chapman and Hall, New York, 1997.
Tunga, K.R., “Experimental and Theoretical Assessment of PBGA Reliability in Conjuction With Field Use Conditions”, Masters Dissertation, Georgia Institute of Technology, Atlanta, GA, April, 2004.
Van den Crommenacker, J., “The System-in-Package Approach”, IEEE Communications Engineer, Vol 1, No. 3, pp. 24-25, June/July, 2003.
Vandevelde, B., Christiaens F., Beyne, Eric., Roggen, J., Peeters, J., Allaert, K., Vandepitte, D. and Bergmans, J., “Thermomechanical Models for Leadless Solder

178
Interconnections in Flip Chip Assemblies”, IEEE Transactions on Components, Packaging and Manufacturing Technology, Part A, Vol.21, No. 1, pp.177-185, March 1998.
Vandevelde, B., Gonzalez, M., Beyne, E., Zhang, G. Q. and Caers, J., “Optimal Choice of the FEM Damage Volumes for Estimation of the Solder Joint Reliability for Electronic Package Assemblies”, Proceedings of 53rd Electronic Components and Technology Conference, New Orleans, LA, pp.189 –196, May 27-30, 2003.
Vandevelde, B, Beyne, E., Zhang, K. G. Q., Caers, J. F. J. M., Vandepitte, D. and Baelmans, M., “Solder Parameter Sensitivity for CSP Life-Time Prediction Using Simulation-Based Optimization Method”, IEEE Transactions on Electronic Packaging Manufaturing, Vol. 25, No. 4, pp. 318-325, October 2002.
Vayman, S., “Energy Based Methodology for The fatigue Life Prediction Of Solder Materials”, IEEE Transactions on Components, Hybrids, and Manufacturing Technology, Vol. 16, No. 3, pp. 317-322, 1993.
Wang, G.Z., Cheng, Z.N. Becker, K. Wilde. J., “Applying Anand Model to Represent the Viscoplastic Deformation Behavior of Solder Alloys”, ASME Journal Of Electronic Packaging, Vol. 123, pp. 247-253, September 2003
Wang, L., Kang, S.K. Li, H., “Evaluation of Reworkable Underfils for Area Array Packaging Encapsulation”, International Symposium on Advanced Packaging Materials, Braseltopn, GA, pp. 29-36, March -11-14, 2001
Warner, M., Parry, J., Bailey, C. and Lu, H., “Solder Life Prediction in a Thermal Analysis Software Environment”, Proceedings of 2004 Inter Society Conference on Thermal Phenomena, Las Vegas, NV, pp. 391-396, June 1-4, 2004
Yi, S., Luo, G. Chian, K.S., “A Viscoplastic Constitutive Model for 63Sn37Pb Eutectic Solders”, ASME Journal Of Electronic Packaging, Vol. 24, pp. 90 -96, June 2002.
Zahn, B.A., “Comprehensive Solder Fatigue and Thermal Characterization of a Silicon Based Multi-Chip Module Package Utilizing Finite Element Analysis Methodologies”, Proceedings of the 9th International Ansys Conference and Exhibition, pp. 274 -284, August 2000.
Zhang, C., Lin, J.K. Li, L., “Thermal Fatigue Properties of Lead-free Solders on Cu and
NiP”, Proceedings of 51st Electronic Components & Technology Conference, IEEE, Orlando, FL, pp. 464-470, May 29-June 1, 2001.
Zhu, J., Zou, D. Liu, S., “High Temperature Deformation of Area Array Packages by
Moire Interferometry/FEM Hybrid Method”, Proceedings of Electronic Components and Technology Conference, pp. 444-452, May 18-21, 1997.

179
APPENDIX
List of Symbols
α Coefficient of thermal expansion
δ Displacement of chip relative to substrate
αrel Relative thermal coefficient of chip to substrate
β Exponent from plastic shear stress-shear strain relationship
∆T Temperature cycle range
BGA Ball grid array
Ballcount Number of I/O on area array device.
BoardFinishID Binary variable for board finish.
CBGA Ceramic Ball Grid Array CCGA Ceramic Column Grid Array CeramicCTEppm Coefficient of thermal expansion of ceramic substrate in parts per
million per degree centigrade
Coeff Regression Coefficient
C-P Mallows statistic for bias estimation
DeltaTDegC Temperature cycle range
DF Degrees of freedom

180
DiagLenMM Chip diagonal length in millimeter
DielenMM Chip-length in millimeter
DieToBody Ratio of Die Size to Body size
EMCFillerID Binary variable for encapsulant mold compound filler content
f (mean square of residual error) / (mean square of regression error)
Flex-BGA Flex Ball Grid Array H height of the solder in millimeter
l Distance from chip neutral point to interconnection in millimeter
m Coffin Manson coefficient
MS Mean Square Error
MaskDefID Binary variable for solder mask definition
NSMD Non-solder mask defined
PBGA Plastic Ball Grid Array P Value Singinificance value of null hypothesis
PCB Printed circuit board
PCBThkMM Thickness of printed circuit board in millimeter
PitchMM Area array device I/O in millimeter
R radius of the cross section under consideration
R-sq Multiple coefficient of determination
R-sq(adj) R-sq adjusted for degrees of freedom
S Standard deviation
SE Coeff Standard Error coefficient.

181
SMD Solder Mask Defined.
SolderDiaMM Diameter of solder joint in millimeter
SolderEGpa Solder joint elastic modulus in giga pascal
SolderVolume Volume of the solder joint
SS Error Sum of Squares
SubThkMM Thickness of substrate in millimeter
t-stat t-statistic of the coefficient
UndCovSqMM Underfilled area in Square Millimeter
UndCTEppm Coefficient of thermal expansion of underfill in parts per million
per degree centigrade
UnderfillE Elastic modulus of underfill in giga pascal
V volume of the solder
63.2% Characteristic life
ao Regression constant
bk Regression coefficient
kd Diagonal flexural stiffness of unconstrained non soldered corner
most solder joint