Modelling urban expansion scenarios in Beijing, China ...
33
Seminar in Thailand , Jan 16, 2009 Dr. Chunyang He Modelling urban expansion scenarios in Beijing, China under the restriction of the water resource and land use policy College of Resources Science & Technology, Beijing Normal University, the People’s Republic of China, Beijing, 100875, China http://www.beijing-2008.org http://www.bnu.edu.cn http://www.irs.bnu.edu.cn
Transcript of Modelling urban expansion scenarios in Beijing, China ...

Seminar in Thailand , Jan 16, 2009
Dr. Chunyang He
Modelling urban expansion scenarios in Beijing, China under the restriction of the
water resource and land use policy
College of Resources Science & Technology, Beijing Normal University, the People’s Republic of China, Beijing, 100875, China
http://www.beijing-2008.org http://www.bnu.edu.cn http://www.irs.bnu.edu.cn

Outline1. Research Background2. Description of our newly developed UES
model3. Implementation of the UES model for
Beijing 4. Discussion and conclusion
Beijing, China’s capital
48
5
6
17 2
3
Yanqing
HuairouMiyun
ChangpingShunyi
Pinggu
Mengtougou
FangshanDaxing
Tongzhou
Legend
Ringroad
Highway
Sub-center
city
1
2
3
4
Xicheng
Dongcheng
Xuanwu
Chongwen
5
6
7
8
Haidian
Chaoyang
Shijingshan
Fengtai
Longitudes:115°25′ - 117°30′ E Latitudes: 39°28′- 41°25′ NArea: 16800 Km2
GDP(2004): 428.3 billion RMBPopulation(2004):14.93 million

Beijing experienced fast development since 1978
Population GDP
1979 8.97 12.01 56.86 4.30 70.92 24.78
2004 14.93 428.33 73.50 2.40 37.60 60.00
(million person) (billion Yuan)Urbanization
Level(%)Year Agriculture(%)
Industry(%)
Service(%)

1
2
1
2
1
2
1
2
1
2
1
2
MSS (May 5, 1975) TM (Oct. 2, 1984) TM (May 6, 1991)
TM (May. 15, 1997) ETM+ (May 19, 2001) TM (May. 19, 2004)
Forbidden City1 2 Summer Palace
Beijing’s problem: continuous city expansion to form a “big pancake” by encroaching good cultivated land and green space in the
urban/rural fringe area

“Mam, I only wanta little clean water”
Beijing’s problem: Water shortage is obvious in Beijing
Only 19.2% of the national average
We are thirsty!
Only 3.5% of the world average

1 Research background and Objective
Question:
How to plan Beijing’s development under the restriction of land resource and water resource?Objective:
(1)Develop a new urban expansion Scenarios (UES ) model by coupling a System Dynamic (SD) model and a Cellular Automata (CA) model
(2)Modelling urban expansion scenarios in Beijing, China under the restriction of the water resource and land use policy

Seminar in Thailand , Jan 16, 2009
2 Description of our newly developed UES model

Seminar in Thailand , Jan 16, 2009
UES is one urban expansion scenarios model developed by us.UES is one convenient tool that can spatially and explicitly model the urban expansion patterns under the different “what-if” scenarios of urban land planning policies.UES tries to contribute to the need for planning-based visualization and decision-support tools.
What’s UES?

Seminar in Thailand , Jan 16, 2009
The basic idea of UES is to couple system dynamics (SD) model and CA (Cellular automata) model to represent the urban expansion process.
Basic ideas of UES
Socio-economicforces at macro scales
Land use suitability, neighborhood effect and inheritance at local facotrs
Complexity of driving forces at macro scales
SD model
Complexity of Land pattern evolution at local scales
CA model
UESUrban expansionprocess
Urban Land use area
Urban Land use Location
Urban expansionprocess
Urban Land use area
Urban Land use Location
Urban expansionprocess
Urban expansionprocess
Urban Land use area
Urban Land use Location

Seminar in Thailand , Jan 16, 2009
The general structure of UES
Urban Land supply
SD modelCA
Urban Land locationUrban land area
Demand-supply balanceurban land demand Scenarios
Scenarios urban land pattern
Technology
Population
Economy
Market
Land policy
Local factors
National/regional factors
Suitability
Neighborhood effect
Constraint of natural resource
Environmental constraint
Planning constraint
Inherited attribute
Driving forces resistant forces

The urban land demand scenario module based on a SD model
Framework of land use SD model
Land for population
Land demand of urban expansion
Population increasing rate Resident
population+
Water resource
Land for public service
Industrial production
-
+
+
Land for industry
+
-
Urbanization
+
+
Industrial water use efficiency
Technology advancement
++
+
GDP increasing rate
- +
+
+Floating
population
++
-+
+
Maximum carrying capacity to industry
Maximum carrying capacity to population
-
- +
+

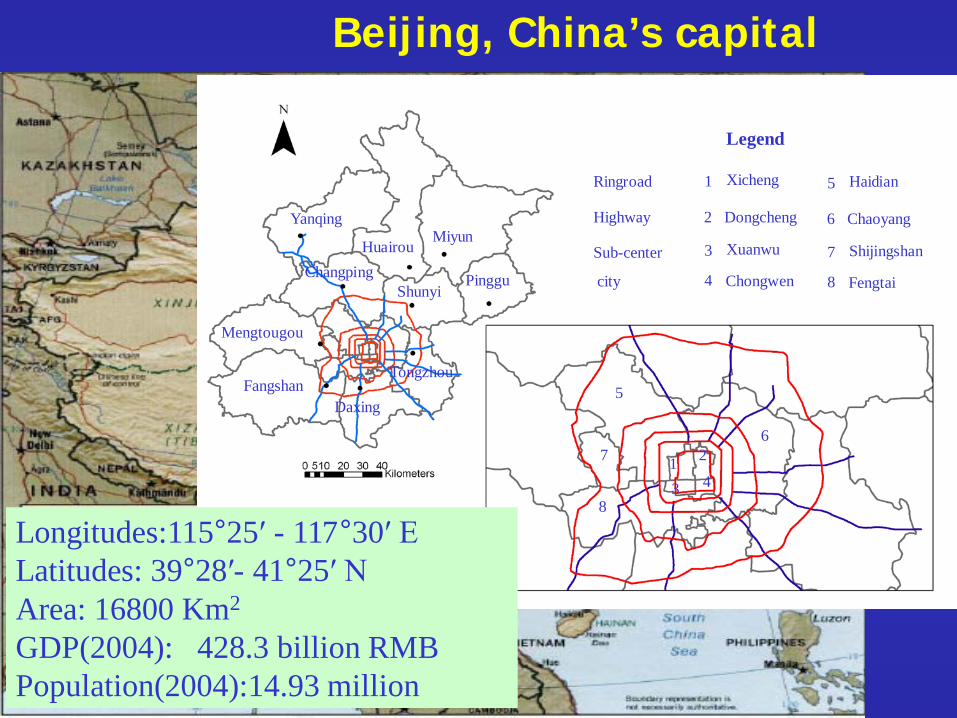
The urban land allocation module based on a CA model
Driving Forces (DF) Stochastic Perturbation (SP)Resistant Forces (RF)
The probability that cell (x,y) with land use type K is occupied byurban expansion at time t , is a function of the driving forces , theresistant forces and a stochastic perturbation . It can be expressed as:
)3(),,( ,,,,, yxt
yxt
yxt
yxKt VRDfP =
RF
SP
DF
Urban land pattern allocation by CA model
Probability
=
Time Loop&
Stochastic perturbation
0 0.5 1
[ ]( )αrandvt ln1 −+=Allocation Rule
The cell with the highest possibility is selected as that would be
occupied by urban expansion .
Suitability Inherited attribute
Neighborhood
)7()( ,1 1
,,,,
2
1,,,1,,,, yx
t
r lyxl
tyxr
tm
iyxK
tmyx
tmyxi
ti
tyxK
t VPCECIWNWSWP ××××−×+×= ∏ ∏∑= =
−
=−
Environmental constraints Land policy
Urban exapnsionat time T
Urban expansionat time T+1

Seminar in Thailand , Jan 16, 2009
3 Implementation of the UES model for Beijing

0 40 Kilometers1 Yanqing
2004
31
2
45
611
10
9
7
8
1997
31
2
45
611
10
9
7
8
1991
31
2
45
611
10
9
7
8
High density urban landLow density urban land
Cultivated land
Water areaForest land
Shrub land
2000
31
2
45
611
10
9
7
8
2 Huairou 3 Miyun 4 Pinggu 5 Changping
6 Shunyi 7 Mengtougou 8 Fangshan 9 Daxing 10 Tongzhou 11 Capital city
Land use/cover change in Beijing from 1991 to 1997 based on remotely
sensed data

(a) Simulated urban (Kappa 0.73)
(b) Actual urban pattern
(c) Simulated urban (Kappa 0.76)
(d) Actual urban pattern
(e) Simulated urban (Kappa 0.80)
(f) Actual urban pattern
Expressway Ringroad Administrative boundary Urban area0 40 Kilometers0 - 184 m 184 – 441 m 441 - 717 m 717 - 1075 m 1075 - 2219 m
Urban growth simulation in Beijing from 1991 to 2004
1997
1997
2000
2000
2004
2004

Predictions of water supply and the selected scenarios of water resources limitation to urban development in Beijing till 2020
Table 2 Predictions of water supply in Beijing till 2020
Year Surface Water
(SW)(108m3)
Utilized rate of SW(%)
Available Groundwater
(AGW)(108m3)
Utilized rate of AGW (%)
Recycling utilized water
(108m3)
Diverted water
(108m3)
Available water supply (108m3)
Data source
2000 13.25 65.08 27.15 156.76 3.52 0.00 43.92 ① 2020 15.26 75.00 18.32 105.77 5.10 11.07 49.75 ① 2020 15.26 75.00 18.32 105.77 5.10 12.44 51.12 ② 2020 15.26 75.00 18.32 105.77 5.10 16.32 55.00 ② Note: ① represents the data from Run, et al.(2004). ② represents the data from Beijing Municipal Government (2005).
Scenario A:slightly limited with 55*108 m3 water supplied in 2020; Scenario B: limited with 51.12*108 m3 water supplied in 2020; Scenario C: obviously limited with 49.75*108 m3 water supplied in 2020.
Three scenarios :

Historical urban land changes from 1991 to 2004 and the urban land demand scenarios under the different restrictions of water shortage
in Beijing till 2020
Year Scenario A (km2) Scenario B (km2) Scenario C (km2)
1991 1206.47 1206.47 1206.47
1997 1870.79 1870.79 1870.79
2000 2331.88 2331.88 2331.88
2004 2726.66 2726.66 2726.66
2007 3073.84 2995.87 2874.74
2010 3452.34 3332.31 3207.10
2015 3659.88 3515.64 3284.53
2020 3895.01 3732.36 3380.82
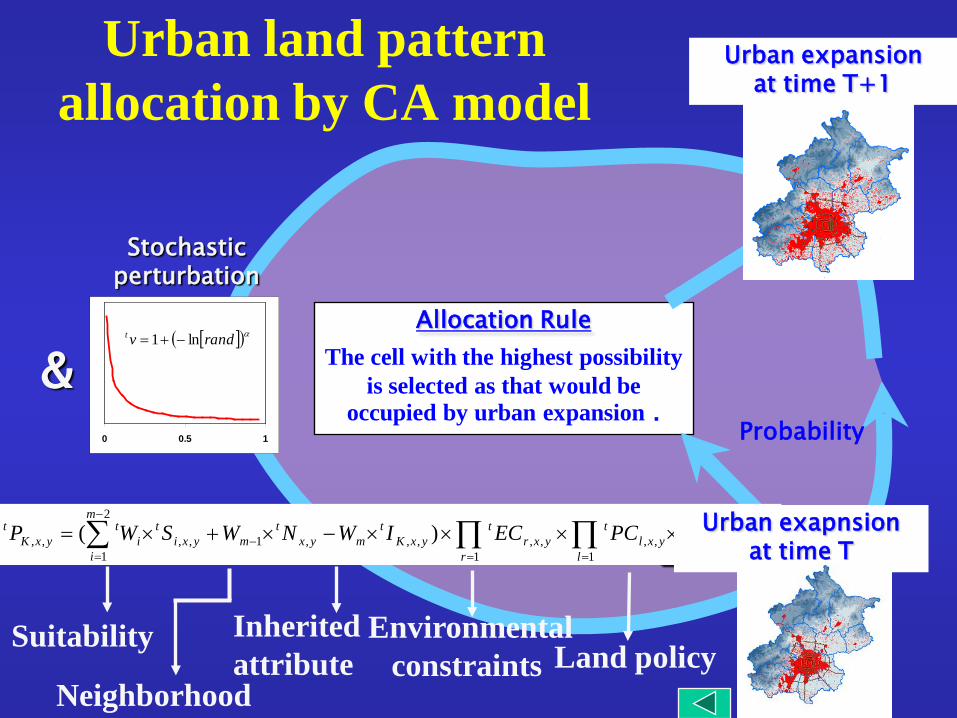
2007
2010 2015 2020
0 40Kilometers
Expressway Ringroad Administrative boundary
Urban area
0 - 184 m 184 – 441 m 441 - 717 m 717 - 1075 m
1075 - 2219 m
Urban expansion scenario in Beijing from 2007 to 2020 without the
restriction of urban planning policy

0 40Kilometers
Expressway Ringroad Administrative boundary
Urban area
0 - 184 m 184 – 441 m 441 - 717 m 717 - 1075 m
1075 - 2219 m
Urban expansion scenario in Beijing from 2007 to 2020 under the
restriction of high-yield farmland protection area
2007
2010 2015 2020

0 40Kilometers
Expressway Ringroad Administrative boundary
Urban area
0 - 184 m 184 – 441 m 441 - 717 m 717 - 1075 m
1075 - 2219 m
Urban expansion scenario in Beijing from 2007 to 2020 under the
restriction of the “green belt”
2007
2010 2015 2020

0 40Kilometers
Expressway Ringroad Administrative boundary
Urban area
0 - 184 m 184 – 441 m 441 - 717 m 717 - 1075 m
1075 - 2219 m
Urban expansion scenario in Beijing from 2007 to 2020 under the restriction of both the “green belt” and high-yield
farmland protection area
2007
2010 2015 2020

Seminar in Thailand , Jan 16, 2009
4 Conclusion and Discussion

Conclusion and discussion
(1)The UES model can not only reflect the complicated factors influencing urban expansion at the macroscopic scale but also possess the strong ability to represent land use evolution at the local scale.
(2)AS a tool that aims at implementing “what-if” scenario analysis of urban expansion, it is convenient for the UES model to simulate the many urban expansion scenarios in the near future.
The UES model contributes to the need for planning-based visualization and decision-support tools

Urban land planning policies that focus on only the areas within the administrative boundary of Beijing are limited in their capabilities.
It may be time for Beijing to transfer part of its economic responsibility to the neighbor cities according to the jointly regional development of the macroscopic region of Beijing, Tianjin and Hebei province.
Conclusion and discussionThere exists a big dilemma of the continuous urban expansion versus
limited water resources and environment deterioration in Beijing
Conclusion and discussion
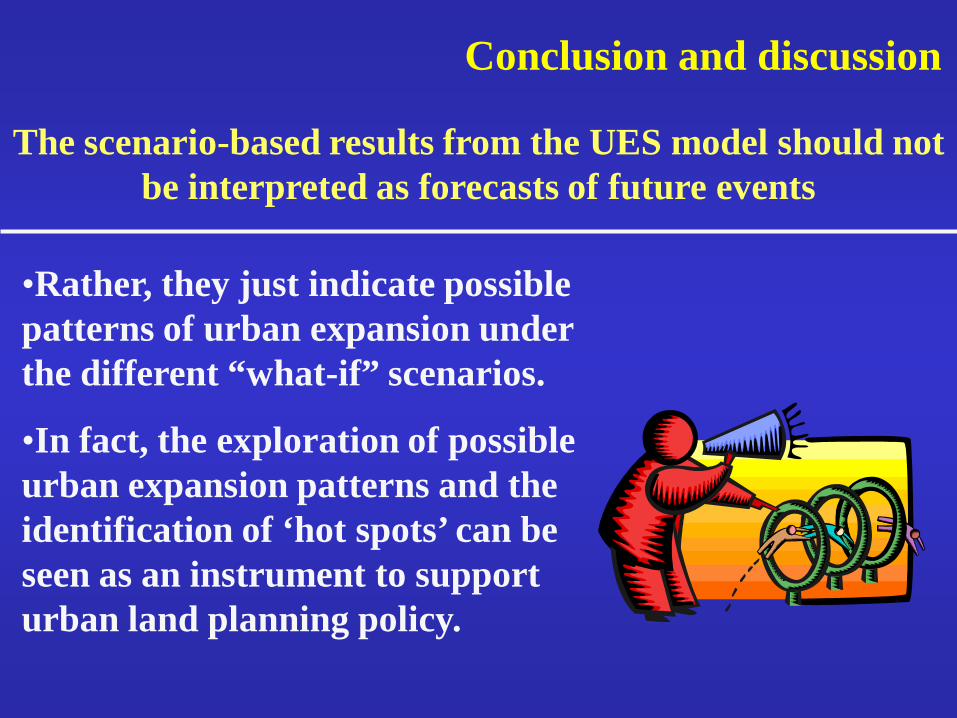
The scenario-based results from the UES model should not be interpreted as forecasts of future events
•Rather, they just indicate possible patterns of urban expansion under the different “what-if” scenarios.
•In fact, the exploration of possible urban expansion patterns and the identification of ‘hot spots’ can be seen as an instrument to support urban land planning policy.

Thank you!!
Happy Chinese New Year !

1 What’s Beijing’s dilemma?
The population of China will increase from 1.2 billion to 1.6 billion with the urbanization level from current 30.9% up to about 50% in 2050, which means over 0.4 billion people, about total population of current of Japan and U.S.A, will move from rural area to urban area in China in next 50 years (Chen et al, 1999).
China’s fast urbanization is challenging not only herself but also the world
Food security Energy consumption
Environment deterioration

Seminar in Thailand , Jan 16, 2009
The general introduction of CA model
Transition rule
Sijt+1Nij
tSij
t
F,T
CA (Cellular Automata) model is one dynamics model with the local interaction to reflect evolution of the whole system, which can represent spatial pattern of land use in a very realistic way.
Where, is the situation in t+1 of the cell ij, is the situation in t of the cell ij, is the neighbor effect of the cell ij and T is the transition rule.
),,(1 TNSfS tij
tij
tij =+
tijN
Sijt+1 Sij
t
But as one “bottom-up” model, CA’s ability to represent well those macro-scale political, economic and cultural driving forces is limited

Seminar in Thailand , Jan 16, 2009
The general introduction of SD model
System dynamics (SD) model can not only describe the complicated connections among each element in different levels, but also can deal with dynamical processes with feedback. But SD model’s ability to represent the spatial process is weak

Calibrated weights for the periods of 1991-1994, 1997-2000 and 2000-2004
Factors of driving forces /resistant forces
Weights for 1991-1997 simulation
Weights for 1997-2000 simulation
Weights for 2000-2004 simulation
Distance to expressway 3 4 5
Distance to Ring Roads 9 12 13
Distance to railway 2 3 3
Distance to highway 3 3 3
Distance to airport 2 2 3
Distance to central city 17 14 13
Distance to sub-cities 6 8 9
Slope 2 3 5
Neighborhood effect 52 46 40
Inherited attribute of the occupied land 4 5 6

Seminar in Thailand , Jan 16, 2009
Basic Hypothesis of UES
Urban expansionprocess
Urban Land use area
Urban Land use Location
Socio-economicforces at macro scales
Land use suitability, neighborhood effect and inherited attribute at local scales
Basic Hypothesis of UES