Modelling of the Neves Corvo Area 11 -...
31
11 Modelling of the Neves Corvo Area C. Inverno, C. Rosa, J. Matos, J. Carvalho, J.M. Castello-Branco, M.J. Batista, I. Granado, J.T. Oliveira, V. Araújo, Z. Pereira, P. Represas, A.R. Solá and P. Sousa Abstract 3D, 4D and predictive geological modelling, including all known geo- scientific data, were applied to the 100 × 25 km large Neves Corvo project area located in the Portuguese part of the Iberian Pyrite Belt. The lowermost unit in the area is the Givetian to Famennian-Strunian Phyllite- Quartzite Group (PQG), which is overlain by three SE-plunging volcanic axes with the Strunian to Visean Volcanic Sedimentary Complex (VSC), hosting in its lower sequence the Neves Corvo VHMS giant deposit. The VSC is covered with mid late Visean and Serpukhovian to Bashkirian flysch rocks [Mértola and Mira formations of the Baixo Alentejo Flysch Group (BAFG), respectively]. Six NE-SW deep 2D reflection seismic profiles acquired by LNEG between Neves Corvo mine and the Spanish border (60 km to the SE) during the ProMine project, allowed to extend a 3D-model of the Neves Corvo main thrust (that brings VSC rocks onto Mértola Fm. very close to VHMS ores) throughout the eastern part of the area. NE-SW to ENE-WSW (sinistral) and N-S to NNW-SSE (dextral) late Variscan strike-slip oblique faults (a few >5 km deep) displaced all former geological units and structures, as shown by the 3D models. In late Variscan time, small vein-type Cu (and other metals) deposits were emplaced along them. C. Inverno (&) Á J. Carvalho Á M.J. Batista I. Granado Á J.T. Oliveira Á P. Represas Á A.R. Solá Laboratório Nacional de Energia e Geologia (LNEG), Estrada Portela—Zambujal, Apartado 7586, 2610-999 Alfragide, Portugal e-mail: [email protected] C. Rosa Empresa de Desenvolvimento Mineiro SA (EDM), Rua Sampaio e Pina 1 3 DTO, 1070-248 Lisboa, Portugal J. Matos Á P. Sousa LNEG, Rua Frei Amador Arrais, 39 r/c, Apartado 104, 7801-902 Beja, Portugal J.M. Castello-Branco Geology and Geotechnics Consultores Lda., Rua Cunha Júnior, 41b Sala 1.6, 4250-186 Porto, Portugal V. Araújo Rua Sub-carreira, 575, 4815-517 Vizela, Portugal Z. Pereira LNEG, Rua da Amieira, Apartado 1089, 4466-901 S. Mamede Infesta, Portugal © Springer International Publishing Switzerland 2015 P. Weihed (ed.), 3D, 4D and Predictive Modelling of Major Mineral Belts in Europe, Mineral Resource Reviews, DOI 10.1007/978-3-319-17428-0_11 231
Transcript of Modelling of the Neves Corvo Area 11 -...
11Modelling of the Neves Corvo Area
C. Inverno, C. Rosa, J. Matos, J. Carvalho,J.M. Castello-Branco, M.J. Batista, I. Granado,J.T. Oliveira, V. Araújo, Z. Pereira, P. Represas,A.R. Solá and P. Sousa
Abstract
3D, 4D and predictive geological modelling, including all known geo-scientific data, were applied to the 100 × 25 km large Neves Corvo projectarea located in the Portuguese part of the Iberian Pyrite Belt. Thelowermost unit in the area is the Givetian to Famennian-Strunian Phyllite-Quartzite Group (PQG), which is overlain by three SE-plunging volcanicaxes with the Strunian to Visean Volcanic Sedimentary Complex (VSC),hosting in its lower sequence the Neves Corvo VHMS giant deposit.The VSC is covered with mid late Visean and Serpukhovian to Bashkirianflysch rocks [Mértola and Mira formations of the Baixo Alentejo FlyschGroup (BAFG), respectively]. Six NE-SW deep 2D reflection seismicprofiles acquired by LNEG between Neves Corvo mine and the Spanishborder (60 km to the SE) during the ProMine project, allowed to extend a3D-model of the Neves Corvo main thrust (that brings VSC rocks ontoMértola Fm. very close to VHMS ores) throughout the eastern part of thearea. NE-SW to ENE-WSW (sinistral) and N-S to NNW-SSE (dextral)late Variscan strike-slip oblique faults (a few >5 km deep) displaced allformer geological units and structures, as shown by the 3D models. In lateVariscan time, small vein-type Cu (and other metals) deposits wereemplaced along them.
C. Inverno (&) � J. Carvalho � M.J. BatistaI. Granado � J.T. Oliveira � P. Represas � A.R. SoláLaboratório Nacional de Energia e Geologia(LNEG), Estrada Portela—Zambujal, Apartado7586, 2610-999 Alfragide, Portugale-mail: [email protected]
C. RosaEmpresa de Desenvolvimento Mineiro SA (EDM),Rua Sampaio e Pina 1 3 DTO, 1070-248 Lisboa,Portugal
J. Matos � P. SousaLNEG, Rua Frei Amador Arrais, 39 r/c, Apartado104, 7801-902 Beja, Portugal
J.M. Castello-BrancoGeology and Geotechnics Consultores Lda., RuaCunha Júnior, 41b Sala 1.6, 4250-186 Porto,Portugal
V. AraújoRua Sub-carreira, 575, 4815-517 Vizela, Portugal
Z. PereiraLNEG, Rua da Amieira, Apartado 1089, 4466-901S. Mamede Infesta, Portugal
© Springer International Publishing Switzerland 2015P. Weihed (ed.), 3D, 4D and Predictive Modelling of Major Mineral Belts in Europe,Mineral Resource Reviews, DOI 10.1007/978-3-319-17428-0_11
231
The 4Dmodel enabled to establish a clear age sequence of mineralizationtypes, inferring also that VHMS mineralization may possibly exist at depthbetween the Neves Corvo mine and the Alcoutim sector (near the Spanishborder). The 3D predictive model, constructed exclusively for the restrictedarea of the Neves Corvomine, pinpoints, both through the 3D-density (fromgravity inversion) and the % Cu-drill hole-based block diagrams, not onlythe known Neves Corvo orebodies, but also other possible extensions. Theregional extension of the Neves Corvo model increases significantly theoverall exploration potential of the whole IPB region in this study.
11.1 Introduction
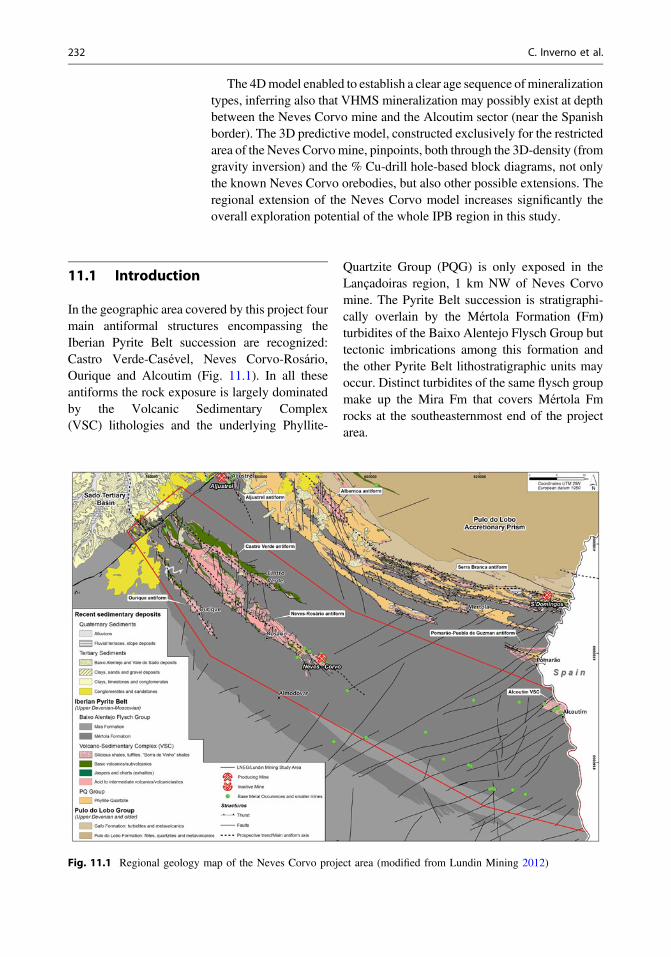
In the geographic area covered by this project fourmain antiformal structures encompassing theIberian Pyrite Belt succession are recognized:Castro Verde-Casével, Neves Corvo-Rosário,Ourique and Alcoutim (Fig. 11.1). In all theseantiforms the rock exposure is largely dominatedby the Volcanic Sedimentary Complex(VSC) lithologies and the underlying Phyllite-
Quartzite Group (PQG) is only exposed in theLançadoiras region, 1 km NW of Neves Corvomine. The Pyrite Belt succession is stratigraphi-cally overlain by the Mértola Formation (Fm)turbidites of the Baixo Alentejo Flysch Group buttectonic imbrications among this formation andthe other Pyrite Belt lithostratigraphic units mayoccur. Distinct turbidites of the same flysch groupmake up the Mira Fm that covers Mértola Fmrocks at the southeasternmost end of the projectarea.
Fig. 11.1 Regional geology map of the Neves Corvo project area (modified from Lundin Mining 2012)
232 C. Inverno et al.
The existing geological knowledge of theseantiforms is very different from one another:while the Neves Corvo mine area at the SE ter-mination of the Neves Corvo—Rosário antiformhas been studied in detail, the knowledge of theremaining areas is still limited. As such, we willbriefly describe the geology of these remainingareas of the antiforms and will later describe theNeves Corvo mine region.
The stratigraphy of all the antiforms is com-posed of three main groups of lithologies, allbelonging to the VSC: felsic volcanic rocks (Vα),mafic volcanic rocks (Vβ) and dark shales andfine volcanogenic sedimentary rocks (XV) inwhich the volcanic rocks are interbedded.
The felsic volcanic rocks are dominant in theNeves Corvo—Rosário antiform where they formthe outcropping core of this tectonic structure.Rhyolites, rhyodacites and felsic volcaniclasticsrepresent the dominant rock types. The same types ofvolcanic rocks occur in the Castro Verde—Casévelantiform but are absent in the Ourique antiform.
The mafic volcanic rocks comprise mostlybasalts and dolerites and tend to occupy astratigraphic position high in the VSC succession.Pillow lavas and hyaloclastites are common. Rarelimestone lenses at the top of these volcanicscontain conodonts of late Visean age (Oliveira1983).
The XV lithologies comprise dark and blackshales, thin-bedded siltstones, siliceous shalesand fine volcanogenic sediments and purpleshales. Siliceous, manganese oxides, phosphateand siderite nodules can be found dispersed in allthese shales. The XV lithotypes are dominant inthe Alcoutim antiform and represent an importantproportion in the Ourique antiform.
The Mértola Formation consists of classicturbidites characterized by packages of greywackebeds of variable thickness and grain size alternatingwith bands of shales and siltstones. The greywackebeds show the typical sedimentary structures thatare common in deep water gravity clasticsedimentation (turbidites s. l.). The thickness givenby exposed sections and drill cores is variable,depending on the tectonic blocks, and may reach1500 m. Fossils of Posidonia becheri, ammonoidsand palynomorphs indicate a late Visean age
(Oliveira 1983; Korn 1997; Oliveira et al. 2004).This unit outcrops in about 70% of the project areaand the investigation of the sector situated betweenthe Neves Corvo mine and the Portuguese/Spanishborder is one of the main goals in the presentproject. TheMira Fm, outcropping in the vicinity ofthe border, is 1000–2500 m thick and made up offine-grained greywackes, siltstones and shales ofSerpukhovian age (several species of the OrderGoniatitida; Oliveira and Wagner-Genthis 1983).
All the stratigraphic units are affected by NW-trending folds and associated cleavage dipping60–70° towards NE. Folds styles vary from iso-clinal in the VSC and PQG units to asymmetricalfolds with long normal limbs and short reverselimbs in the Mértola and Mira formations and allshow vergence towards SW. The VSC mayexhibit an earlier cleavage, also NW-trending,not as penetrative as the main cleavage. Thrustfaults parallel to the main cleavage may occur, afew extending continuously throughout the pro-ject area, as well as late near-vertical faultsgrouped in two main families, NW-SE, dextraland NE-SW, sinistral.
Metamorphism in the Pyrite Belt units is syn- tolate-orogenic and characterized by the prehnite-pumpellyite—lower greenschist facies (Munhá1983a, b). The volcanic rocks and the rockshosting the massive sulphides ores are also affectedby a pre-orogenic hydrothermal metamorphismunderlined by the development of calcite, sericiteand chlorite (Munhá 1990). The Mértola and Miraformations turbidites are metamorphosed in theprehnite-pumpellyite/zeolite and zeolite facies,respectively (Munhá 1983a).
Mapping carried out in the larger NevesCorvo mine region (Leca et al. 1983) comple-mented by logging of dozens of drill cores bymine geologists, palynostratigraphic research(Oliveira et al. 1997; Pereira et al. 2003; Oliveiraet al. 2004) and recent research on the SE part ofthe Neves Corvo-Rosário antiform (Rosa et al2008; Oliveira et al. 2013) identified the regionalstratigraphic sequence described below.
The Phyllite-Quartzite Group is representedby the dark shales with siliceous lenses andnodules of the Barrancão member, which areoverlain by shales, siltstones and quartz-
11 Modelling of the Neves Corvo Area 233
sandstones of the Phyllite-Quartzite Formation.The unit’s thickness as awhole is in excess of 100m(base not seen). Palynomorphs indicate a lateFamennian age for the Barrancão member and aStrunian (latest Famennian) age for the Phyllite-Quartzite Fm (Oliveira et al. 2004, 2006, 2013;Pereira et al. 2008).At theMonte FornodaCal farmand at depth, the top of the Phyllite-QuartziteGroupis overlain by a tens of meters thick shale bandwith interbedded limestone lenses and nodules.The latter yielded conodonts of upper Famennianage (Boogaard and Schermerhorn 1981).
The VSC has been divided into two mainsequences that appear separated by a stratigraphicgap marked by the absence of Tournaisiansedimentary rocks (Oliveira et al. 2004). TheLower VSC sequence is composed of rhyolites,rhyodacites, volcaniclastic sedimentary rocks,basalts and dolerite sills. Its thickness variesdepending on the distribution of the volcanic faciesand may reach 500 m. Shales interbedded in thesevolcanic rocks yielded palynomorphs of Strunianage (Oliveira et al 2004; Pereira et al. 2008). Themassive sulphides occur at the top of the felsicvolcanic rocks usually associatedwith black shales.Deep in the mine area, this lower sequence isunconformably overlain by greywackes and shalesof the Mértola Fm (Mt2) which thickness is vari-able, from a few meters to several tens of meters,depending on the sea floor paleotopography.Fossils of ammonoids and palynomorphs show thatthese turbidites are of upper Visean age (Oliveiraet al. 2004; Pereira et al. 2008). The time gapbetween these turbidites and the underlying VSCrocks has been related to submarine erosion thatremoved the Tournaisian sediments (palynomorphreworked assemblages are found in the overlyingyounger units; Oliveira et al. 2004).
The Upper VSC sequence is composed of theGrandaços Fm (dark shales with phosphatenodules, cherts and fine volcanogenic sedimentaryrocks), “Borra de Vinho” purple shales Fm andGodinho Fm (shales, siliceous shales and felsicvolcaniclastic rocks), 300 m thick altogether. Inthe Neves Corvo mine, this lithostratigraphicsuccession has been dated as lower upper Visean,based on palynomorphs (Oliveira et al. 2004).At depth in the mine area, drill cores have shown
that gray siliceous and black shales rich inphosphate nodules (Graça Formation) occurbelow the Godinho Fm. This unit has locallyintercalations of felsic volcanic rocks. The blackshales contain palynomorphs of lower Visean age(Oliveira et al. 2004). The recently mapped—150 m thick—Ribeira de Cobres Fm (Oliveiraet al. 2013), with shales, siltstones and finevolcaniclastic rocks, may represent a lateral faciesvariation of the Graça Fm. Above the Godinho Fmdark shales and thin-bedded greywackes of theBrancanes Formation that make the transition tothe Mértola Fm flysch turbidites (Mt1) occur. Bothunits have an upper Visean age given bypalynomorphs and ammonoids (Oliveira et al. 2004).
The thrust of Upper VSC/Mt2 flysch rocks isparticularly relevant as a tectonic marker at theNeves Corvo mine site, since it is very close tomassive sulphide ore and serves in the area as aguide to Neves Corvo VHMS ore position.
Recent U–Pb dating of zircons recovered fromfelsic rocks in the SE region of the Neves Corvo-Rosario antiform indicated five episodes of felsicvolcanism at 384, 373, 365, 359 and 354 Marespectively (Oliveira et al. 2013). This indicatesthat a high heat flow was operative for 30 Ma andmay have had an important role in the formationof convective cells that lead to the genesis of themassive sulphides.
Correlations from drill cores in the mine areashow that mostly the Upper VSC sequence, butin many places the Lower VSC sequence as well,is stacked in tectonic sheets that were transportedover the lower Mértola Fm turbidites (Mt2)(Fig. 4 in Oliveira et al. 2004) during the Variscanorogeny. This structural arrangement proved to beof fundamental importance for the interpretationof the deep seismic profiles that were performedin this project between the Neves Corvo mine andthe Spanish border.
11.2 Methodology
The modelling of the Neves Corvo project areawas done using geological data from surface andexploration drill holes, and seismic, gravity,
234 C. Inverno et al.
magnetic and electromagnetic data. This infor-mation was compiled from pre-existing dataavailable at LNEG and from Lundin Mining,complemented with new data acquired during thePROMINE project to fill data gaps. The pre-existing data were acquired by LNEG in regionalsurveys, and by exploration companies that hadexploration licenses relative to parts of the pro-ject area. All geological and geophysical infor-mation have been compiled throughout time andhomogenised at LNEG, which is an essentialprocedure to integrate data from different sourcesand therefore draw the interpretations required tomodel the project area. Nevertheless, and giventhe large geographic extent of the Neves Corvoproject area, the type of information availableand its detail was quite variable. Surface geo-logical information was available for the wholeregion. However, geological information at depthwas difficult to obtain since exploration drillholes occur in clusters (concentrated over geo-physical anomalies) and have a variable distri-bution. Additionally, the distribution of differentgeophysical surveys and methods is also vari-able, and mainly conditioned by the surfacegeology, implying that the project area turned outnot to be entirely surveyed by one single method.Therefore, and according to the extent and vari-ability of the available data, the modelling of theproject area was done in three phases.
The NW sector of the project area was mod-elled by surface geological maps, geological loganalyses of relatively shallow (up to 1000 m)drill holes, and TEM, gravity, magnetic andradiometric data. The modelling of the centralpart of the area, that concerns Neves Corvo mineand surroundings, was based on geological logsfrom deep (up to 1900 m) drill holes, surface andunderground geology from the mine, combinedwith detailed seismic, gravity and TEM data.The SE sector (including Alcoutim) of the projectarea was mainly modelled by seismic dataacquired under the Promine project, combinedwith TEM data and geological logs from fewrelatively deep (up to 1300 m) drill holes. Theintegration of the wide, variable and extensiveinformation available was made using gOcad andGIS software. The models for the near Neves
Corvo mine area were produced by LundinMining that currently exploits the massivesulphide deposits of Neves Corvo and wereincluded in gOcad as well. The scarcity ofgeological and geophysical data for the areabetween Neves Corvo mine and Alcoutim (SEsector of the project area) and the great depth ofthe top of the VSC complex were the motivationto conduct a seismic reflection survey in thisarea. Seismic reflection data are an essential toolto obtain structural and physical propertiesinformation of the subsurface at great depth.It has long been employed to study tectonic andsedimentary evolution of sedimentary basins,where impedance contrast is generally strongenough to allow imaging of the subsurface basedon reflections. In the last decades, due to theadvances in electronics such as 24 bit A/D con-verters and processing techniques, the seismicreflection method has gained a dramatic increasein the number of applications to hard-rockexploration (e.g. Kim et al. 1994; Radzeviciusand Pavlis 1999; Eaton 2003). The miningindustry is one of the fields where the seismicreflection method has shown great utility tocomplement the more generally applied gravi-metric, magnetic, electrical and electromagneticmethods in VSC.
Metallic ore deposits such as the VHMSdeposits of the IPB are commonly associated withhigh-angle structures, strong deformation andmetamorphism, which prevented in past the use ofseismic methods to locate them. Recent develop-ments in migration algorithms and the surge ofnewmethods which increased coverage and signalto noise ratio in poor reflectivity areas, such as thecommon reflection surface (CRS) method or 3Dseismics (e.g. Hubral 1999; Cordsen et al. 2000),have changed the scenario. The seismic reflectionmethod has now the capability of providingimportant structural information that coupled withthe potential methods used in mineral explorationcan become an important asset. Both 3D and 2Dseismic methods have provided successful casehistories in the mining industry. In the Portuguesemainland, the first seismic reflection profilesacquired for this purpose inAlentejo byCompagnieGénérale de Géophysique (CGG) were supported
11 Modelling of the Neves Corvo Area 235
bySomincor in1991and1996. The resultswere notconclusive and theywere soon forgotten. Notmuchafter the last CGG survey, the first deep seismicreflection profile started in the Spanish part of theIPB, close to the Portuguese border (e.g. Simancaset al. 2003; Carbonell et al. 2004). In Portugal,useful results were obtained using seismicreflection and gravimetric modelling for shallowmassive sulphides exploration, under a relativelythin Tertiary cover that occurs in the NWpart of theIPB (Oliveira et al. 1998;Carvalho et al. 2011).Dueto the superior resolution and depth penetration theseismic reflection method was the most suited forthe purpose of geologicalmodelling of the IPB.Themechanical soundings generally do not exceed2–3 km, while potential-field data give informationat various wavelengths that are originated atdifferent depths. Short wavelengths are usuallyattributed to shallow sources in the upper crustwhile long wavelength anomalies originate atgreater depth. Gravimetric data has been useful tolocate massive ore bodies at depths above 1 km.Aeromagnetic data has been less useful to locatesulphide deposits since these are associated withfelsic volcanic rocks (that have lower magneticsusceptibilities than mafic volcanic rocks) and dueto the greater sensitivity of the magnetic field tolithological changes when compared with thegravimetric field. Electrical and electromagneticmethods often applied in the area are useful to locateore bodies also up to 1–2 km depth, but they do notprovide accurate structural information such as thelocation of major thrust planes and faults.
Therefore, six 2D seismic profiles strikingapproximately SW-NE, perpendicular to themain geological structures, and totalling 82 kmwere planned and carried out by LNEG for theNeves Corvo mine—Alcoutim sector (seeSect. 11.3.2). Due to the depth penetrationrequired (4–5 km), the seismic equipment avail-able at LNEG was not adequate for this purposeand it was necessary to rent equipment from alarge geophysical services company. Prospectiunicompany (Romania) was already working inPortugal and had wireless seismic equipment thatallowed greater flexibility in data acquisition.Villages, roads, small rivers could be easilycrossed and the initial design of the profiles could
be followed more closely. The system used wasthe state of the art cable-less Sercel 428, E-UniteFull with 480 active channels, six in-line geo-phones per channel, a channel spacing of 25 mand a source interval of 50 m, resulting in 120 fullfold data. The source used was provided by threesynchronised ION AHV-IV vibroseis trucks of28.5 tons each. A linear up sweep 16 s long with afrequency varying between 10 to 90 Hz was usedto allow recording information from shallow anddeeper reflections. Two or three vibrations pervibration point were carried out. Finally, SG10 Hz receivers were employed to record theseismic wave field, which was sampled at 2 msrate during six seconds.
Several processing sequences were attemptedfor each profile. A standard processing sequencewith Pre-Stack Time Migration (PSTM) andpost-stack migration, and a second processingsequence with the common-reflection surfacemethod (CRS; Mann et al. 1999) also coupledwith PSTM and post-stack migration. All pro-cessing sequences included geometry introduc-tion (crooked line geometry for lines 3, 4, 5 and6), trace editing, first break and bottom muting,refraction statics computations (weathering zonevelocity of 1 km/s and replacement velocity of 4–5 km/s) and conversion to flat datum, FK filter,spherical divergence correction, spiking decon-volution (zero phase with 240 ms operatorlength), bandpass frequency filtering (8–12–70–80 Hz), automatic gain control (AGC, 500 mswindow length), two iterations of velocity anal-ysis and residual statics calculations and, finally,the normal moveout (NMO) correction.
From this point the standard and PSTM pro-cessing sequences diverged. The CDP gathers wereeither stacked and post-stack F-X deconvolutionand AGC applied, or/and prepared for PSTM. Inthe first case, Steep Dip Explicit Finite DifferenceTime Migration was applied to the stackedsections, while in the second the CDP gathers wereprepared for PSTM. A 2D Kirchoff time migrationalgorithm with an aperture of 3–5 km was appliedto the gathers. To conclude the processingsequence, CDP stacking and some post-stackfiltering was applied. The CRS processingsequence was identical to the previous one until the
236 C. Inverno et al.
pre-PSTM gathers and before NMO correction,after which FX-deconvolution, creation of CRSgathers and stacking were carried out. From thispoint onwards, the standard and PSTM sequenceswere applied to the CRS gathers.
Migration was essential to image appropri-ately these profiles due to the steep dips present.The CRS stacked sections resulted in a clearimprovement of the signal to noise ratio. PSTMsections show a better coherency of the reflectorsand a clear improvement in the conflicting dipsaffecting all profiles that resulted from the 3Dnature of the geological structures but someartefacts were introduced anyhow in the stackedsections. For the final interpretation, it was anadvantage to have both processing sequences andnon-migrated stacks.
The seismic reflectors observed in the seismicprofiles were interpreted and correlated with thegeology, based on the geological informationobtained from exploration drill holes locatedclose to the profiles and also from the knowledgeof the regional geology. The integration of alldata sets was georeferenced and integrated ingOcad, which was a complex task, due to thedistinct investigation depths. Gravimetric, aero-magnetic, radiometric and TEM data were alsoused to interpret each profile, to aid the study oflateral variations of VS units, locate igneousstructures (e.g. several dykes associated with lateVariscan faults) and the interpretation of deeperunits. Information from the Iberseis profiles(Simancas et al. 2003; Carbonell et al. 2004) wasused for this. When all the profiles wereinterpreted, we checked the consistency of theinterpretation with gravimetric and aeromagneticdata that covered almost all the study area.
11.3 3D Modelling of ProjectArea
11.3.1 Area in and Around NevesCorvo Mine
A detailed drill hole-based 3D geological modelcovering the total extent of Neves Corvo VHMS
deposit (see Fig. 11.2) and its immediate NW andSE along strike extensions was developed byLundin Mining within the scope of their explo-ration activities in the IPB Portuguese sector.Geophysical data were also used in the model-ling. 2D and 3D seismic reflection profiles indi-cated the location of several thrusts, faults, andpossible lithological contacts and in places thepresence of some massive sulphide orebodies(e.g., Lombador and Semblana; Fig. 11.3). TEMand gravity data were also extensively acquiredto locate the presence of VHMS deposits.Together with geological outcrop and drill holedata, the geophysical dataset provided valuableinformation between drill holes and, in particular,seismic data with its greater depth penetrationallowed modelling up to several kilometers.
The main objective was to define explorationvectors for targeting by modelling the spatialdistribution of specific “marker-horizons” of theknown stratigraphic sequence in order to outlinetrends and favourable areas where lateral anddown dip extensions of the prospective orehorizon might potentially occur.
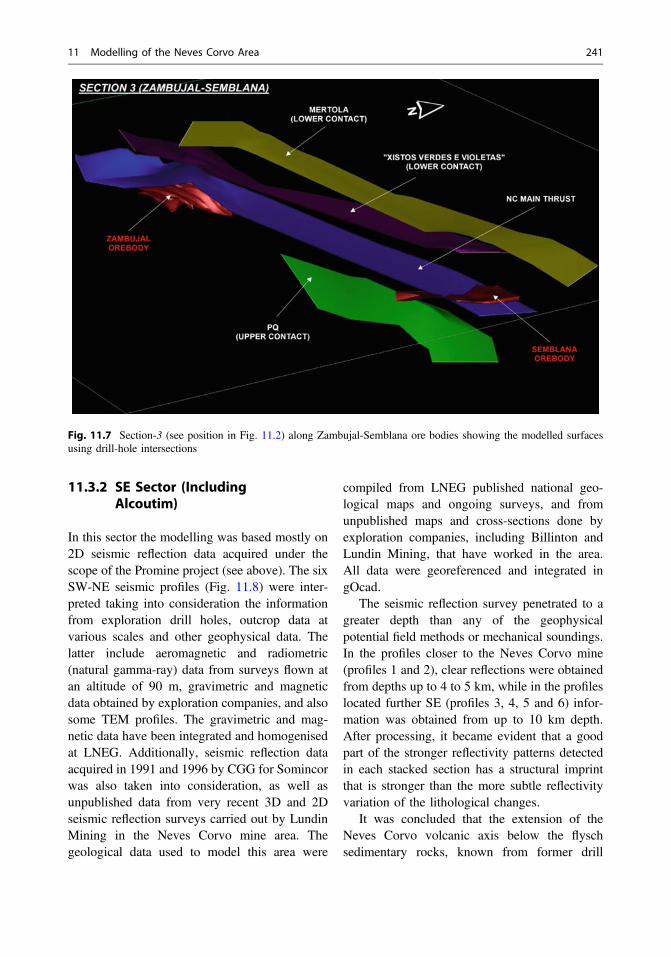
Detailed 3D modelling was done usingGemcom software, version 6.4. The model cov-ered an area of approximately 68 km2, on whicha total of 4165 combined underground (from theNeves Corvo mine) and surface drill holes havebeen considered. Interpretation was made alongparallel 50–250-m laterally spaced NE-SW ori-ented sections, where nearly 3000 drill holeintersects have been selected to model thehorizons by creating best-fit surfaces. A total ofthree horizons were modelled, namely the lowercontacts of the turbititic upper Mértola Fm., theVSC Xistos Verdes e Violetas Fm. (“Borra deVinho” green and purple shales), as well as thetop of the PQG (Figs. 11.5, 11.6 and 11.7). TheNeves Corvo massive sulphide lenses, Neves,Corvo, Graça, Zambujal and Lombador, andthe new Semblana orebody were integrated inthe model (data from Lundin Mining/ Somincorand AGC companies). The Neves Corvo minegeological sequence (Oliveira et al. 2006;Relvas et al. 2006a; Pereira et al. 2008) was alsoused as the reference model applied to the projectarea.
11 Modelling of the Neves Corvo Area 237
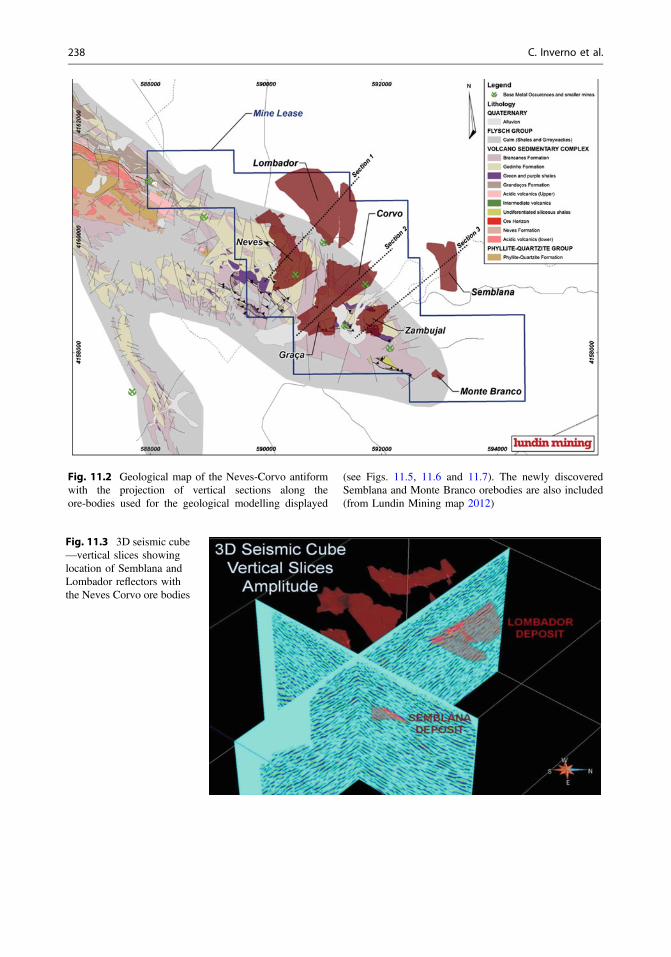
Fig. 11.2 Geological map of the Neves-Corvo antiformwith the projection of vertical sections along theore-bodies used for the geological modelling displayed
(see Figs. 11.5, 11.6 and 11.7). The newly discoveredSemblana and Monte Branco orebodies are also included(from Lundin Mining map 2012)
Fig. 11.3 3D seismic cube—vertical slices showinglocation of Semblana andLombador reflectors withthe Neves Corvo ore bodies
238 C. Inverno et al.
Based on geologic outcrop, drill hole andsome geophysical (TEM, gravity and magnetics)data, LNEG extended the Lundin Mining 3Dmodel, more centered on Neves Corvo mine andsurroundings, to a zone some 7 km to the NW,but still within this central area of the project.The modelling of this extension was done in amore simplified way, with the exclusion of thehorizon of top of the “Borra de Vinho” green andpurple shales Fm. of VSC. The same horizon wasnot considered for the modelling of the SE andNW sectors (see Sects. 11.3.2 and 11.3.3) either.
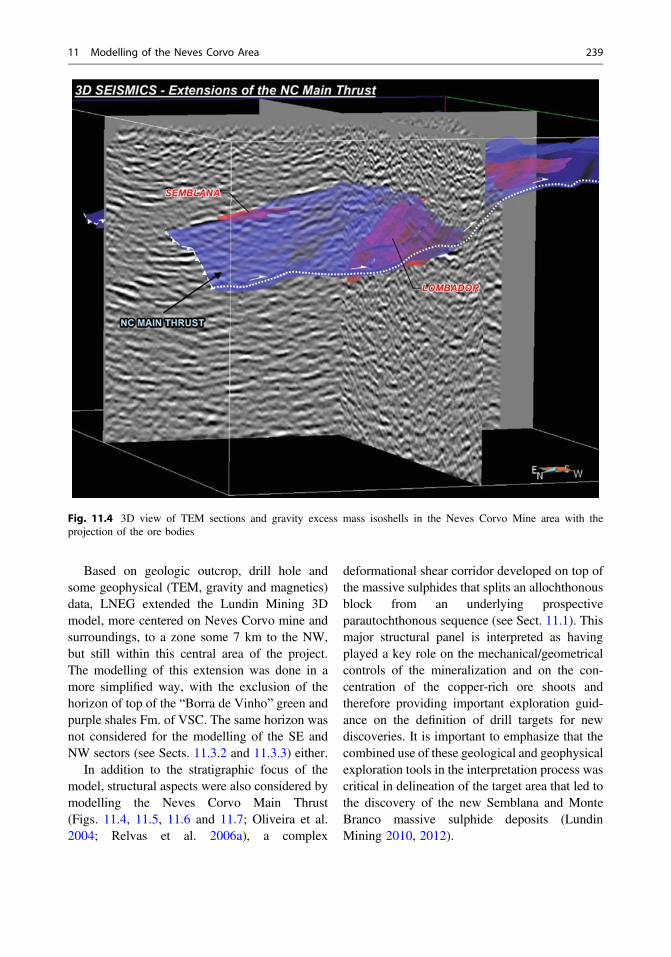
In addition to the stratigraphic focus of themodel, structural aspects were also considered bymodelling the Neves Corvo Main Thrust(Figs. 11.4, 11.5, 11.6 and 11.7; Oliveira et al.2004; Relvas et al. 2006a), a complex
deformational shear corridor developed on top ofthe massive sulphides that splits an allochthonousblock from an underlying prospectiveparautochthonous sequence (see Sect. 11.1). Thismajor structural panel is interpreted as havingplayed a key role on the mechanical/geometricalcontrols of the mineralization and on the con-centration of the copper-rich ore shoots andtherefore providing important exploration guid-ance on the definition of drill targets for newdiscoveries. It is important to emphasize that thecombined use of these geological and geophysicalexploration tools in the interpretation process wascritical in delineation of the target area that led tothe discovery of the new Semblana and MonteBranco massive sulphide deposits (LundinMining 2010, 2012).
Fig. 11.4 3D view of TEM sections and gravity excess mass isoshells in the Neves Corvo Mine area with theprojection of the ore bodies
11 Modelling of the Neves Corvo Area 239
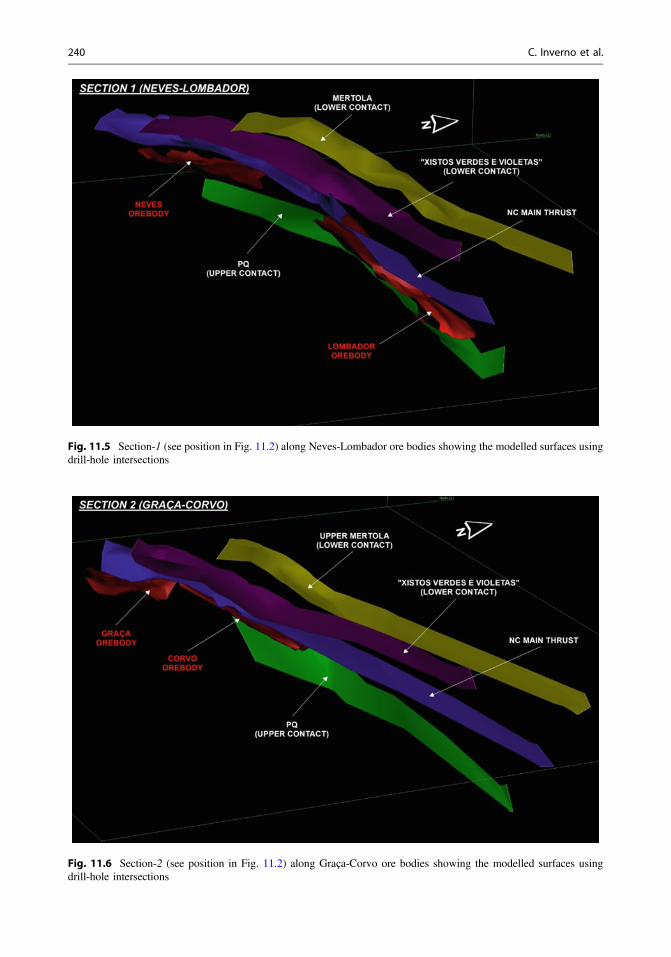
Fig. 11.5 Section-1 (see position in Fig. 11.2) along Neves-Lombador ore bodies showing the modelled surfaces usingdrill-hole intersections
Fig. 11.6 Section-2 (see position in Fig. 11.2) along Graça-Corvo ore bodies showing the modelled surfaces usingdrill-hole intersections
240 C. Inverno et al.
11.3.2 SE Sector (IncludingAlcoutim)
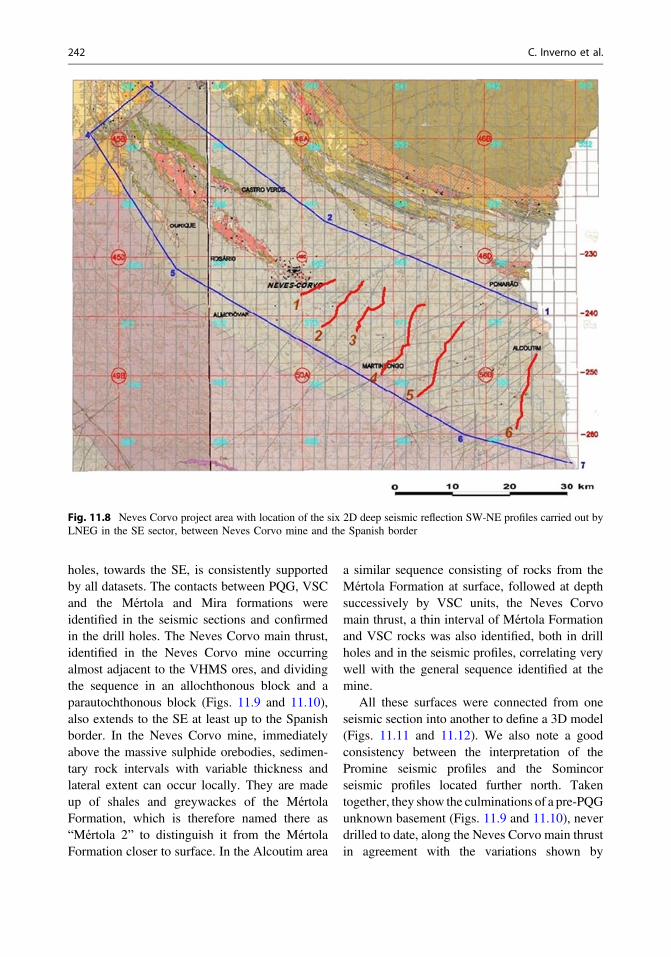
In this sector the modelling was based mostly on2D seismic reflection data acquired under thescope of the Promine project (see above). The sixSW-NE seismic profiles (Fig. 11.8) were inter-preted taking into consideration the informationfrom exploration drill holes, outcrop data atvarious scales and other geophysical data. Thelatter include aeromagnetic and radiometric(natural gamma-ray) data from surveys flown atan altitude of 90 m, gravimetric and magneticdata obtained by exploration companies, and alsosome TEM profiles. The gravimetric and mag-netic data have been integrated and homogenisedat LNEG. Additionally, seismic reflection dataacquired in 1991 and 1996 by CGG for Somincorwas also taken into consideration, as well asunpublished data from very recent 3D and 2Dseismic reflection surveys carried out by LundinMining in the Neves Corvo mine area. Thegeological data used to model this area were
compiled from LNEG published national geo-logical maps and ongoing surveys, and fromunpublished maps and cross-sections done byexploration companies, including Billinton andLundin Mining, that have worked in the area.All data were georeferenced and integrated ingOcad.
The seismic reflection survey penetrated to agreater depth than any of the geophysicalpotential field methods or mechanical soundings.In the profiles closer to the Neves Corvo mine(profiles 1 and 2), clear reflections were obtainedfrom depths up to 4 to 5 km, while in the profileslocated further SE (profiles 3, 4, 5 and 6) infor-mation was obtained from up to 10 km depth.After processing, it became evident that a goodpart of the stronger reflectivity patterns detectedin each stacked section has a structural imprintthat is stronger than the more subtle reflectivityvariation of the lithological changes.
It was concluded that the extension of theNeves Corvo volcanic axis below the flyschsedimentary rocks, known from former drill
Fig. 11.7 Section-3 (see position in Fig. 11.2) along Zambujal-Semblana ore bodies showing the modelled surfacesusing drill-hole intersections
11 Modelling of the Neves Corvo Area 241
holes, towards the SE, is consistently supportedby all datasets. The contacts between PQG, VSCand the Mértola and Mira formations wereidentified in the seismic sections and confirmedin the drill holes. The Neves Corvo main thrust,identified in the Neves Corvo mine occurringalmost adjacent to the VHMS ores, and dividingthe sequence in an allochthonous block and aparautochthonous block (Figs. 11.9 and 11.10),also extends to the SE at least up to the Spanishborder. In the Neves Corvo mine, immediatelyabove the massive sulphide orebodies, sedimen-tary rock intervals with variable thickness andlateral extent can occur locally. They are madeup of shales and greywackes of the MértolaFormation, which is therefore named there as“Mértola 2” to distinguish it from the MértolaFormation closer to surface. In the Alcoutim area
a similar sequence consisting of rocks from theMértola Formation at surface, followed at depthsuccessively by VSC units, the Neves Corvomain thrust, a thin interval of Mértola Formationand VSC rocks was also identified, both in drillholes and in the seismic profiles, correlating verywell with the general sequence identified at themine.
All these surfaces were connected from oneseismic section into another to define a 3D model(Figs. 11.11 and 11.12). We also note a goodconsistency between the interpretation of thePromine seismic profiles and the Somincorseismic profiles located further north. Takentogether, they show the culminations of a pre-PQGunknown basement (Figs. 11.9 and 11.10), neverdrilled to date, along the Neves Corvo main thrustin agreement with the variations shown by
Fig. 11.8 Neves Corvo project area with location of the six 2D deep seismic reflection SW-NE profiles carried out byLNEG in the SE sector, between Neves Corvo mine and the Spanish border
242 C. Inverno et al.
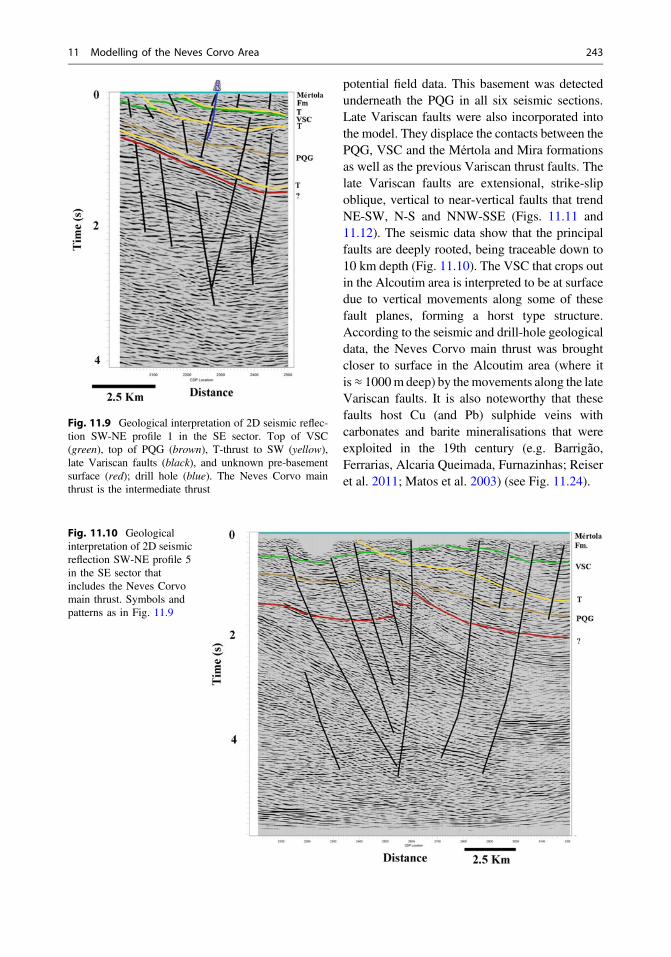
potential field data. This basement was detectedunderneath the PQG in all six seismic sections.Late Variscan faults were also incorporated intothe model. They displace the contacts between thePQG, VSC and the Mértola and Mira formationsas well as the previous Variscan thrust faults. Thelate Variscan faults are extensional, strike-slipoblique, vertical to near-vertical faults that trendNE-SW, N-S and NNW-SSE (Figs. 11.11 and11.12). The seismic data show that the principalfaults are deeply rooted, being traceable down to10 km depth (Fig. 11.10). The VSC that crops outin the Alcoutim area is interpreted to be at surfacedue to vertical movements along some of thesefault planes, forming a horst type structure.According to the seismic and drill-hole geologicaldata, the Neves Corvo main thrust was broughtcloser to surface in the Alcoutim area (where itis≈ 1000m deep) by themovements along the lateVariscan faults. It is also noteworthy that thesefaults host Cu (and Pb) sulphide veins withcarbonates and barite mineralisations that wereexploited in the 19th century (e.g. Barrigão,Ferrarias, Alcaria Queimada, Furnazinhas; Reiseret al. 2011; Matos et al. 2003) (see Fig. 11.24).
Fig. 11.9 Geological interpretation of 2D seismic reflec-tion SW-NE profile 1 in the SE sector. Top of VSC(green), top of PQG (brown), T-thrust to SW (yellow),late Variscan faults (black), and unknown pre-basementsurface (red); drill hole (blue). The Neves Corvo mainthrust is the intermediate thrust
Fig. 11.10 Geologicalinterpretation of 2D seismicreflection SW-NE profile 5in the SE sector thatincludes the Neves Corvomain thrust. Symbols andpatterns as in Fig. 11.9
11 Modelling of the Neves Corvo Area 243
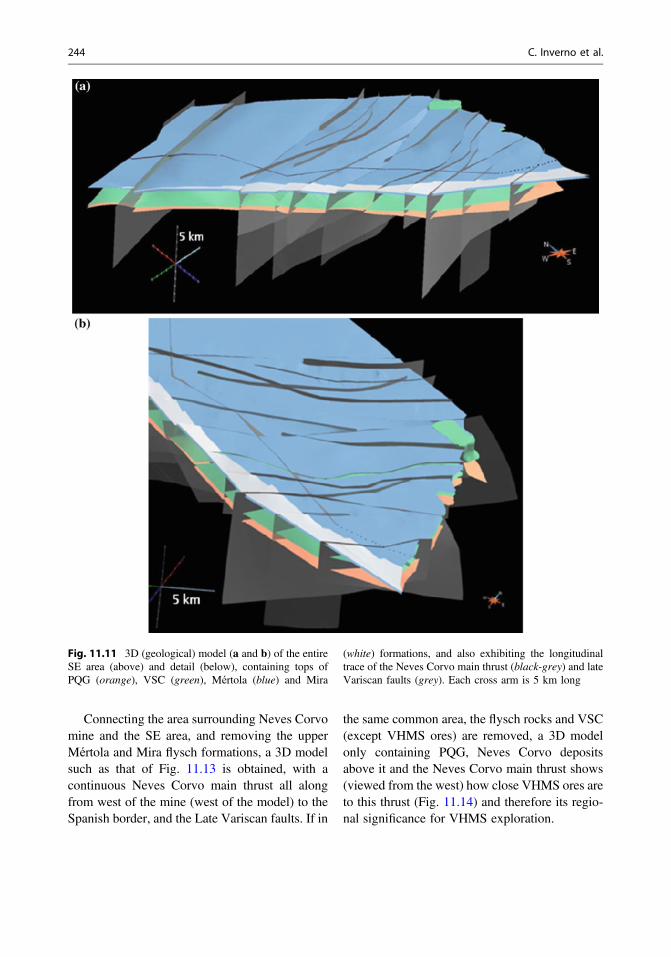
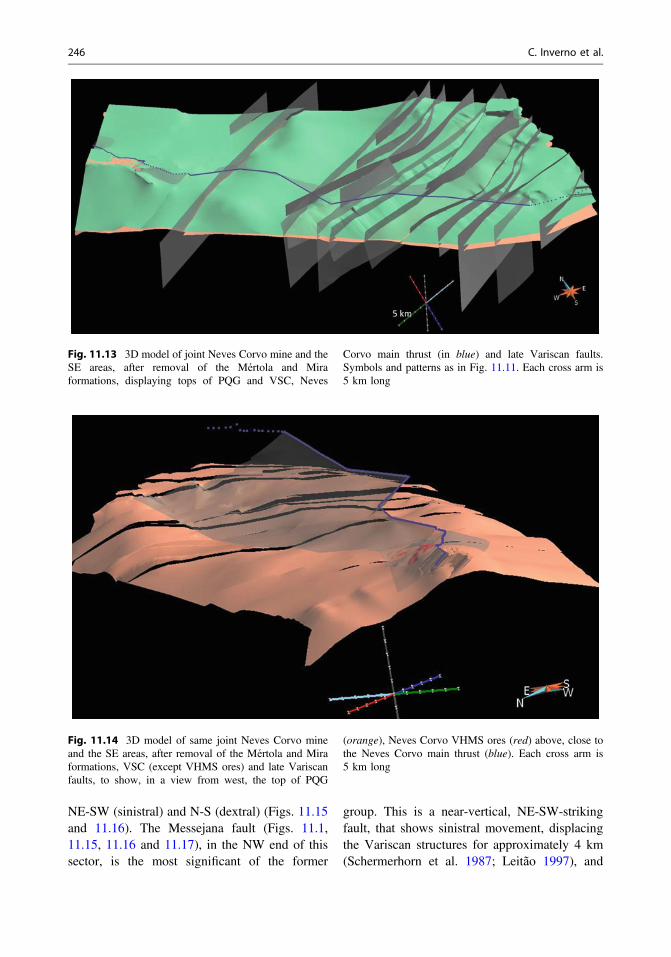
Connecting the area surrounding Neves Corvomine and the SE area, and removing the upperMértola and Mira flysch formations, a 3D modelsuch as that of Fig. 11.13 is obtained, with acontinuous Neves Corvo main thrust all alongfrom west of the mine (west of the model) to theSpanish border, and the Late Variscan faults. If in
the same common area, the flysch rocks and VSC(except VHMS ores) are removed, a 3D modelonly containing PQG, Neves Corvo depositsabove it and the Neves Corvo main thrust shows(viewed from the west) how close VHMS ores areto this thrust (Fig. 11.14) and therefore its regio-nal significance for VHMS exploration.
Fig. 11.11 3D (geological) model (a and b) of the entireSE area (above) and detail (below), containing tops ofPQG (orange), VSC (green), Mértola (blue) and Mira
(white) formations, and also exhibiting the longitudinaltrace of the Neves Corvo main thrust (black-grey) and lateVariscan faults (grey). Each cross arm is 5 km long
244 C. Inverno et al.
11.3.3 The NW Sector
The NW sector corresponds to the sectorbetween the Neves Corvo Mine and the NW endof the project area. The area is characterized bythe presence of the VSC rocks in the Castro
Verde, Rosário and Ourique (from NE to SW)antiform structures (Fig. 11.1; Oliveira et al.2006). The VSC units are formed by sedimentaryrocks and felsic and mafic volcanic rocks.The IPB rocks are affected by significant lateVariscan strike-slip oblique faults striking
(a)
(b)
5 km
5 km
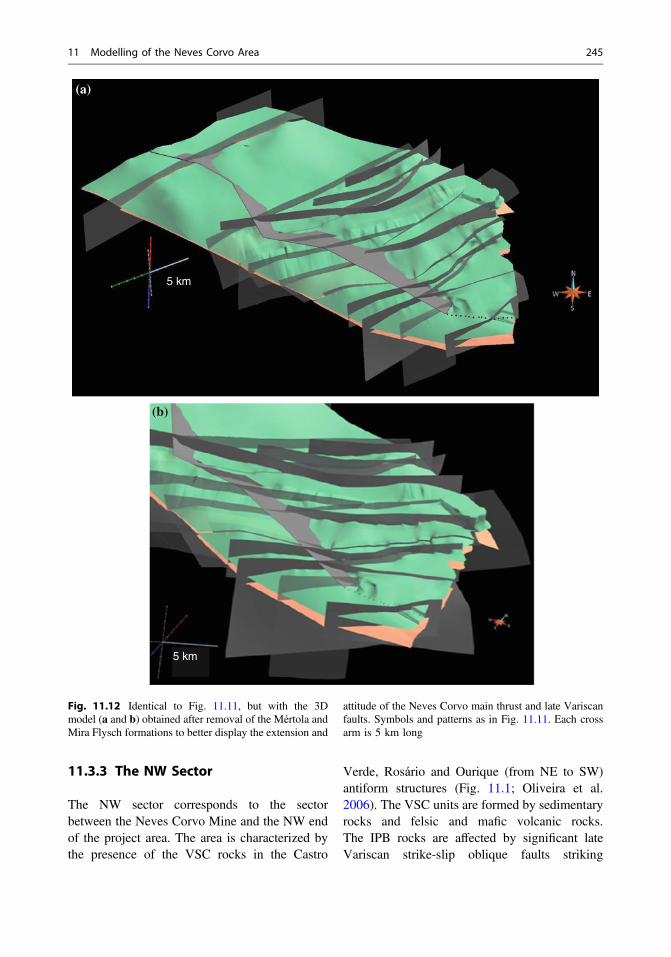
Fig. 11.12 Identical to Fig. 11.11, but with the 3Dmodel (a and b) obtained after removal of the Mértola andMira Flysch formations to better display the extension and
attitude of the Neves Corvo main thrust and late Variscanfaults. Symbols and patterns as in Fig. 11.11. Each crossarm is 5 km long
11 Modelling of the Neves Corvo Area 245
NE-SW (sinistral) and N-S (dextral) (Figs. 11.15and 11.16). The Messejana fault (Figs. 11.1,11.15, 11.16 and 11.17), in the NW end of thissector, is the most significant of the former
group. This is a near-vertical, NE-SW-strikingfault, that shows sinistral movement, displacingthe Variscan structures for approximately 4 km(Schermerhorn et al. 1987; Leitão 1997), and
Fig. 11.13 3D model of joint Neves Corvo mine and theSE areas, after removal of the Mértola and Miraformations, displaying tops of PQG and VSC, Neves
Corvo main thrust (in blue) and late Variscan faults.Symbols and patterns as in Fig. 11.11. Each cross arm is5 km long
Fig. 11.14 3D model of same joint Neves Corvo mineand the SE areas, after removal of the Mértola and Miraformations, VSC (except VHMS ores) and late Variscanfaults, to show, in a view from west, the top of PQG
(orange), Neves Corvo VHMS ores (red) above, close tothe Neves Corvo main thrust (blue). Each cross arm is5 km long
246 C. Inverno et al.
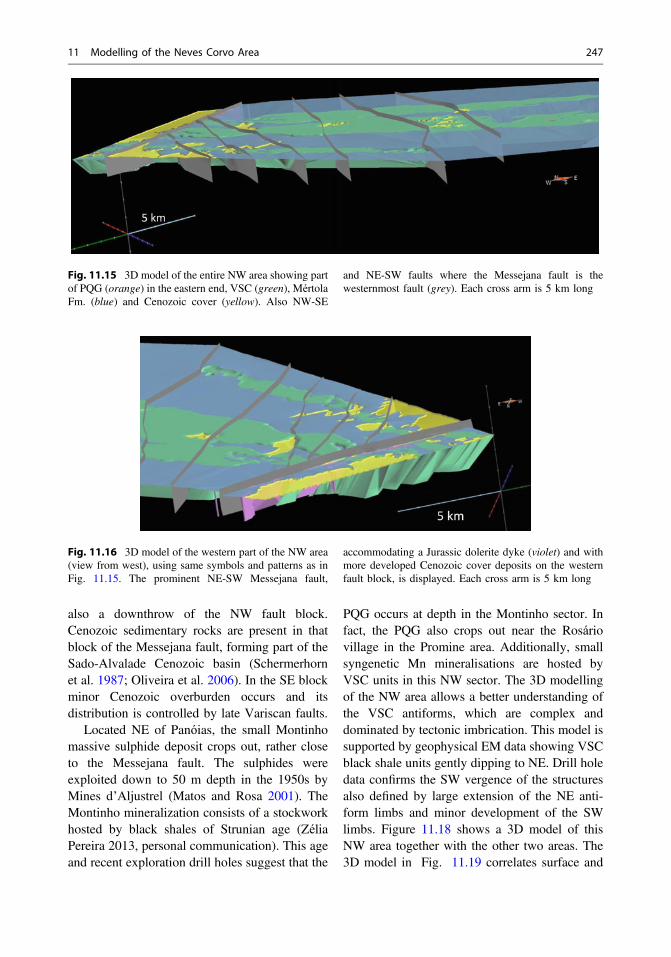
also a downthrow of the NW fault block.Cenozoic sedimentary rocks are present in thatblock of the Messejana fault, forming part of theSado-Alvalade Cenozoic basin (Schermerhornet al. 1987; Oliveira et al. 2006). In the SE blockminor Cenozoic overburden occurs and itsdistribution is controlled by late Variscan faults.
Located NE of Panóias, the small Montinhomassive sulphide deposit crops out, rather closeto the Messejana fault. The sulphides wereexploited down to 50 m depth in the 1950s byMines d’Aljustrel (Matos and Rosa 2001). TheMontinho mineralization consists of a stockworkhosted by black shales of Strunian age (ZéliaPereira 2013, personal communication). This ageand recent exploration drill holes suggest that the
PQG occurs at depth in the Montinho sector. Infact, the PQG also crops out near the Rosáriovillage in the Promine area. Additionally, smallsyngenetic Mn mineralisations are hosted byVSC units in this NW sector. The 3D modellingof the NW area allows a better understanding ofthe VSC antiforms, which are complex anddominated by tectonic imbrication. This model issupported by geophysical EM data showing VSCblack shale units gently dipping to NE. Drill holedata confirms the SW vergence of the structuresalso defined by large extension of the NE anti-form limbs and minor development of the SWlimbs. Figure 11.18 shows a 3D model of thisNW area together with the other two areas. The3D model in Fig. 11.19 correlates surface and
Fig. 11.15 3D model of the entire NW area showing partof PQG (orange) in the eastern end, VSC (green), MértolaFm. (blue) and Cenozoic cover (yellow). Also NW-SE
and NE-SW faults where the Messejana fault is thewesternmost fault (grey). Each cross arm is 5 km long
Fig. 11.16 3D model of the western part of the NW area(view from west), using same symbols and patterns as inFig. 11.15. The prominent NE-SW Messejana fault,
accommodating a Jurassic dolerite dyke (violet) and withmore developed Cenozoic cover deposits on the westernfault block, is displayed. Each cross arm is 5 km long
11 Modelling of the Neves Corvo Area 247
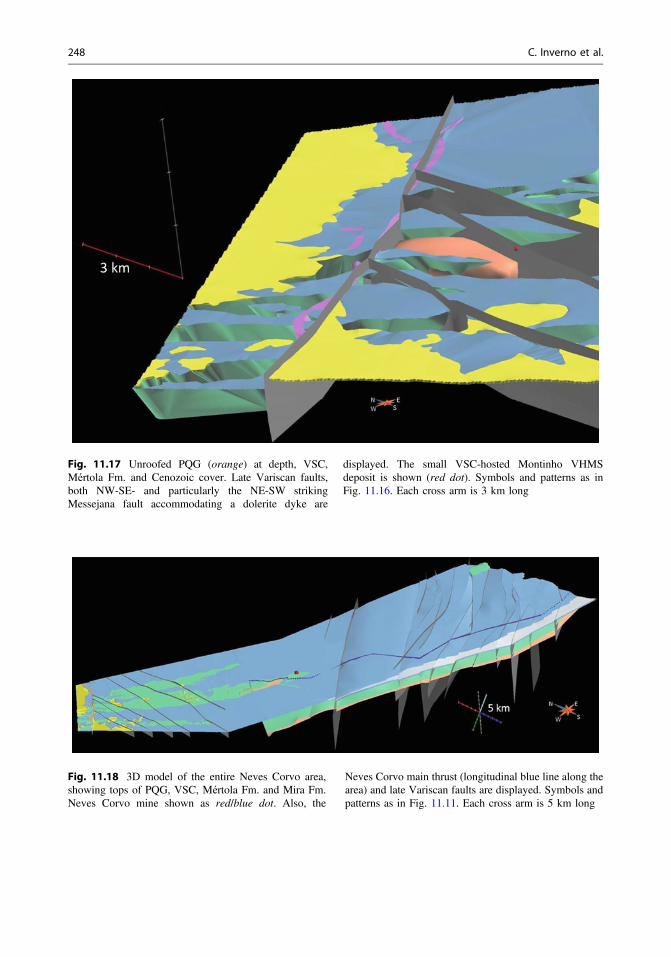
Fig. 11.17 Unroofed PQG (orange) at depth, VSC,Mértola Fm. and Cenozoic cover. Late Variscan faults,both NW-SE- and particularly the NE-SW strikingMessejana fault accommodating a dolerite dyke are
displayed. The small VSC-hosted Montinho VHMSdeposit is shown (red dot). Symbols and patterns as inFig. 11.16. Each cross arm is 3 km long
Fig. 11.18 3D model of the entire Neves Corvo area,showing tops of PQG, VSC, Mértola Fm. and Mira Fm.Neves Corvo mine shown as red/blue dot. Also, the
Neves Corvo main thrust (longitudinal blue line along thearea) and late Variscan faults are displayed. Symbols andpatterns as in Fig. 11.11. Each cross arm is 5 km long
248 C. Inverno et al.
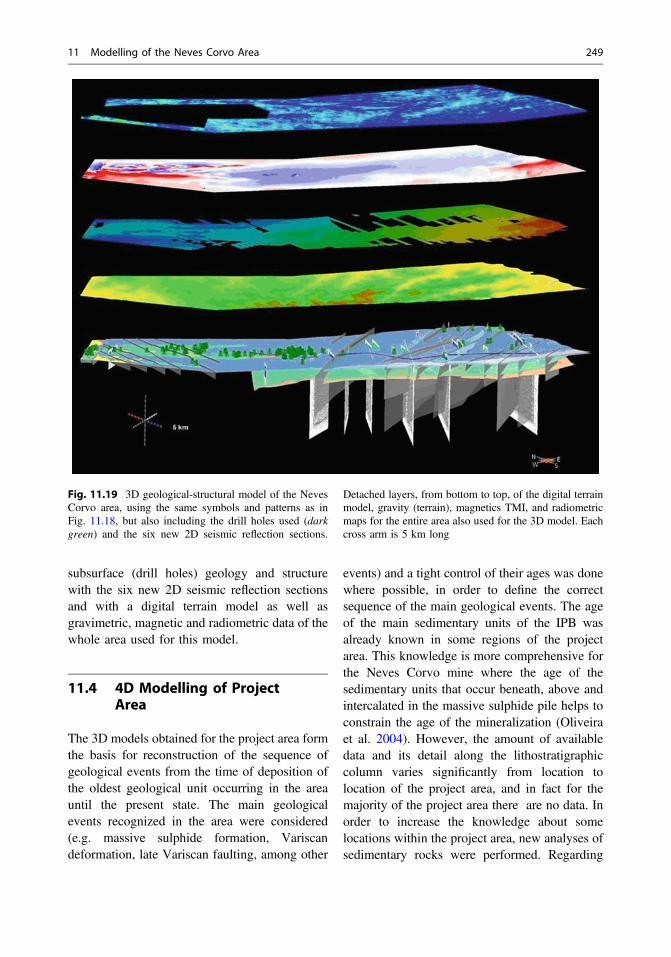
subsurface (drill holes) geology and structurewith the six new 2D seismic reflection sectionsand with a digital terrain model as well asgravimetric, magnetic and radiometric data of thewhole area used for this model.
11.4 4D Modelling of ProjectArea
The 3D models obtained for the project area formthe basis for reconstruction of the sequence ofgeological events from the time of deposition ofthe oldest geological unit occurring in the areauntil the present state. The main geologicalevents recognized in the area were considered(e.g. massive sulphide formation, Variscandeformation, late Variscan faulting, among other
events) and a tight control of their ages was donewhere possible, in order to define the correctsequence of the main geological events. The ageof the main sedimentary units of the IPB wasalready known in some regions of the projectarea. This knowledge is more comprehensive forthe Neves Corvo mine where the age of thesedimentary units that occur beneath, above andintercalated in the massive sulphide pile helps toconstrain the age of the mineralization (Oliveiraet al. 2004). However, the amount of availabledata and its detail along the lithostratigraphiccolumn varies significantly from location tolocation of the project area, and in fact for themajority of the project area there are no data. Inorder to increase the knowledge about somelocations within the project area, new analyses ofsedimentary rocks were performed. Regarding
Fig. 11.19 3D geological-structural model of the NevesCorvo area, using the same symbols and patterns as inFig. 11.18, but also including the drill holes used (darkgreen) and the six new 2D seismic reflection sections.
Detached layers, from bottom to top, of the digital terrainmodel, gravity (terrain), magnetics TMI, and radiometricmaps for the entire area also used for the 3D model. Eachcross arm is 5 km long
11 Modelling of the Neves Corvo Area 249
the volcanic rocks that constitute a significantpart of the VSC, few absolute ages from zirconwere available and only a few others wereobtained during the project. The age of the lateVariscan faults and of the mineralizations thatthey contain is more dubious, since there are nodata available regarding the time of their forma-tion. However, the field relations of these struc-tures with the enclosing geological units and withstructures are informative enough to confidentlyplace their formation in relative time.
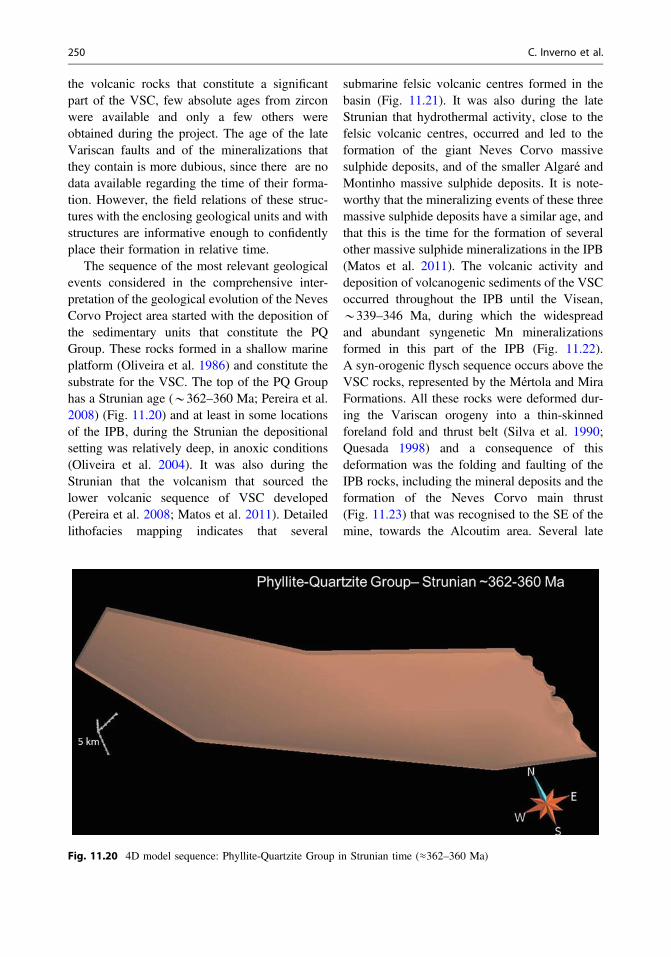
The sequence of the most relevant geologicalevents considered in the comprehensive inter-pretation of the geological evolution of the NevesCorvo Project area started with the deposition ofthe sedimentary units that constitute the PQGroup. These rocks formed in a shallow marineplatform (Oliveira et al. 1986) and constitute thesubstrate for the VSC. The top of the PQ Grouphas a Strunian age (*362–360 Ma; Pereira et al.2008) (Fig. 11.20) and at least in some locationsof the IPB, during the Strunian the depositionalsetting was relatively deep, in anoxic conditions(Oliveira et al. 2004). It was also during theStrunian that the volcanism that sourced thelower volcanic sequence of VSC developed(Pereira et al. 2008; Matos et al. 2011). Detailedlithofacies mapping indicates that several
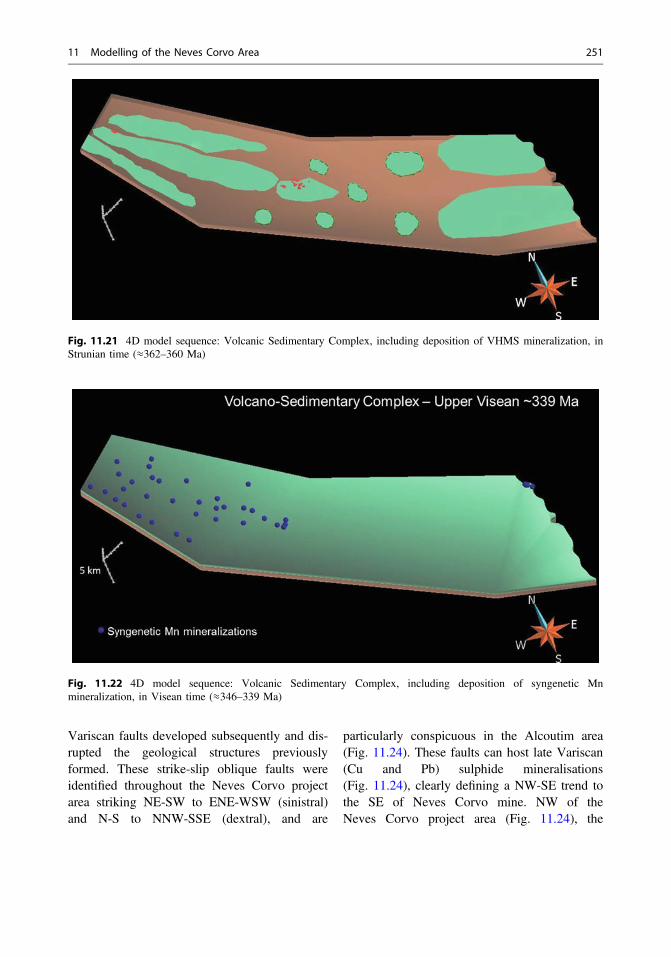
submarine felsic volcanic centres formed in thebasin (Fig. 11.21). It was also during the lateStrunian that hydrothermal activity, close to thefelsic volcanic centres, occurred and led to theformation of the giant Neves Corvo massivesulphide deposits, and of the smaller Algaré andMontinho massive sulphide deposits. It is note-worthy that the mineralizing events of these threemassive sulphide deposits have a similar age, andthat this is the time for the formation of severalother massive sulphide mineralizations in the IPB(Matos et al. 2011). The volcanic activity anddeposition of volcanogenic sediments of the VSCoccurred throughout the IPB until the Visean,*339–346 Ma, during which the widespreadand abundant syngenetic Mn mineralizationsformed in this part of the IPB (Fig. 11.22).A syn-orogenic flysch sequence occurs above theVSC rocks, represented by the Mértola and MiraFormations. All these rocks were deformed dur-ing the Variscan orogeny into a thin-skinnedforeland fold and thrust belt (Silva et al. 1990;Quesada 1998) and a consequence of thisdeformation was the folding and faulting of theIPB rocks, including the mineral deposits and theformation of the Neves Corvo main thrust(Fig. 11.23) that was recognised to the SE of themine, towards the Alcoutim area. Several late
Fig. 11.20 4D model sequence: Phyllite-Quartzite Group in Strunian time (≈362–360 Ma)
250 C. Inverno et al.
Variscan faults developed subsequently and dis-rupted the geological structures previouslyformed. These strike-slip oblique faults wereidentified throughout the Neves Corvo projectarea striking NE-SW to ENE-WSW (sinistral)and N-S to NNW-SSE (dextral), and are
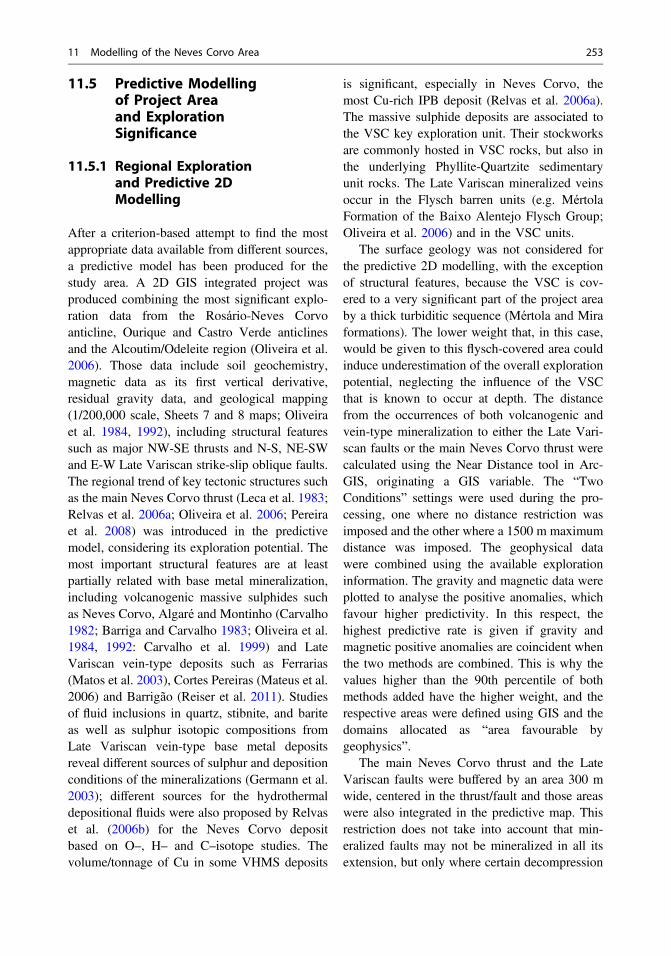
particularly conspicuous in the Alcoutim area(Fig. 11.24). These faults can host late Variscan(Cu and Pb) sulphide mineralisations(Fig. 11.24), clearly defining a NW-SE trend tothe SE of Neves Corvo mine. NW of theNeves Corvo project area (Fig. 11.24), the
Fig. 11.21 4D model sequence: Volcanic Sedimentary Complex, including deposition of VHMS mineralization, inStrunian time (≈362–360 Ma)
Fig. 11.22 4D model sequence: Volcanic Sedimentary Complex, including deposition of syngenetic Mnmineralization, in Visean time (≈346–339 Ma)
11 Modelling of the Neves Corvo Area 251
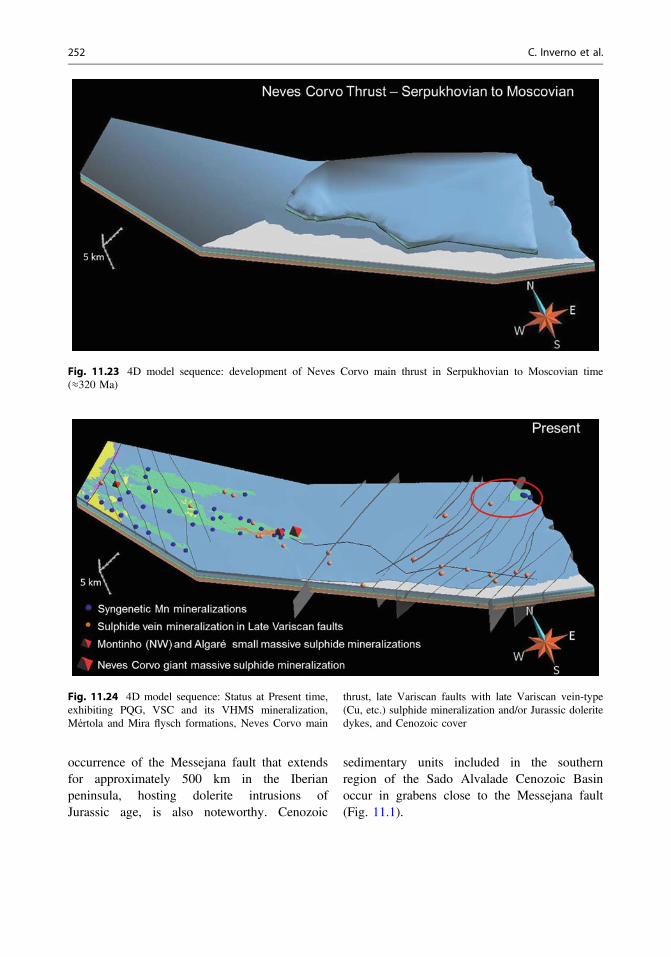
occurrence of the Messejana fault that extendsfor approximately 500 km in the Iberianpeninsula, hosting dolerite intrusions ofJurassic age, is also noteworthy. Cenozoic
sedimentary units included in the southernregion of the Sado Alvalade Cenozoic Basinoccur in grabens close to the Messejana fault(Fig. 11.1).
Fig. 11.23 4D model sequence: development of Neves Corvo main thrust in Serpukhovian to Moscovian time(≈320 Ma)
Fig. 11.24 4D model sequence: Status at Present time,exhibiting PQG, VSC and its VHMS mineralization,Mértola and Mira flysch formations, Neves Corvo main
thrust, late Variscan faults with late Variscan vein-type(Cu, etc.) sulphide mineralization and/or Jurassic doleritedykes, and Cenozoic cover
252 C. Inverno et al.
11.5 Predictive Modellingof Project Areaand ExplorationSignificance
11.5.1 Regional Explorationand Predictive 2DModelling
After a criterion-based attempt to find the mostappropriate data available from different sources,a predictive model has been produced for thestudy area. A 2D GIS integrated project wasproduced combining the most significant explo-ration data from the Rosário-Neves Corvoanticline, Ourique and Castro Verde anticlinesand the Alcoutim/Odeleite region (Oliveira et al.2006). Those data include soil geochemistry,magnetic data as its first vertical derivative,residual gravity data, and geological mapping(1/200,000 scale, Sheets 7 and 8 maps; Oliveiraet al. 1984, 1992), including structural featuressuch as major NW-SE thrusts and N-S, NE-SWand E-W Late Variscan strike-slip oblique faults.The regional trend of key tectonic structures suchas the main Neves Corvo thrust (Leca et al. 1983;Relvas et al. 2006a; Oliveira et al. 2006; Pereiraet al. 2008) was introduced in the predictivemodel, considering its exploration potential. Themost important structural features are at leastpartially related with base metal mineralization,including volcanogenic massive sulphides suchas Neves Corvo, Algaré and Montinho (Carvalho1982; Barriga and Carvalho 1983; Oliveira et al.1984, 1992: Carvalho et al. 1999) and LateVariscan vein-type deposits such as Ferrarias(Matos et al. 2003), Cortes Pereiras (Mateus et al.2006) and Barrigão (Reiser et al. 2011). Studiesof fluid inclusions in quartz, stibnite, and bariteas well as sulphur isotopic compositions fromLate Variscan vein-type base metal depositsreveal different sources of sulphur and depositionconditions of the mineralizations (Germann et al.2003); different sources for the hydrothermaldepositional fluids were also proposed by Relvaset al. (2006b) for the Neves Corvo depositbased on O–, H– and C–isotope studies. Thevolume/tonnage of Cu in some VHMS deposits
is significant, especially in Neves Corvo, themost Cu-rich IPB deposit (Relvas et al. 2006a).The massive sulphide deposits are associated tothe VSC key exploration unit. Their stockworksare commonly hosted in VSC rocks, but also inthe underlying Phyllite-Quartzite sedimentaryunit rocks. The Late Variscan mineralized veinsoccur in the Flysch barren units (e.g. MértolaFormation of the Baixo Alentejo Flysch Group;Oliveira et al. 2006) and in the VSC units.
The surface geology was not considered forthe predictive 2D modelling, with the exceptionof structural features, because the VSC is cov-ered to a very significant part of the project areaby a thick turbiditic sequence (Mértola and Miraformations). The lower weight that, in this case,would be given to this flysch-covered area couldinduce underestimation of the overall explorationpotential, neglecting the influence of the VSCthat is known to occur at depth. The distancefrom the occurrences of both volcanogenic andvein-type mineralization to either the Late Vari-scan faults or the main Neves Corvo thrust werecalculated using the Near Distance tool in Arc-GIS, originating a GIS variable. The “TwoConditions” settings were used during the pro-cessing, one where no distance restriction wasimposed and the other where a 1500 m maximumdistance was imposed. The geophysical datawere combined using the available explorationinformation. The gravity and magnetic data wereplotted to analyse the positive anomalies, whichfavour higher predictivity. In this respect, thehighest predictive rate is given if gravity andmagnetic positive anomalies are coincident whenthe two methods are combined. This is why thevalues higher than the 90th percentile of bothmethods added have the higher weight, and therespective areas were defined using GIS and thedomains allocated as “area favourable bygeophysics”.
The main Neves Corvo thrust and the LateVariscan faults were buffered by an area 300 mwide, centered in the thrust/fault and those areaswere also integrated in the predictive map. Thisrestriction does not take into account that min-eralized faults may not be mineralized in all itsextension, but only where certain decompression
11 Modelling of the Neves Corvo Area 253
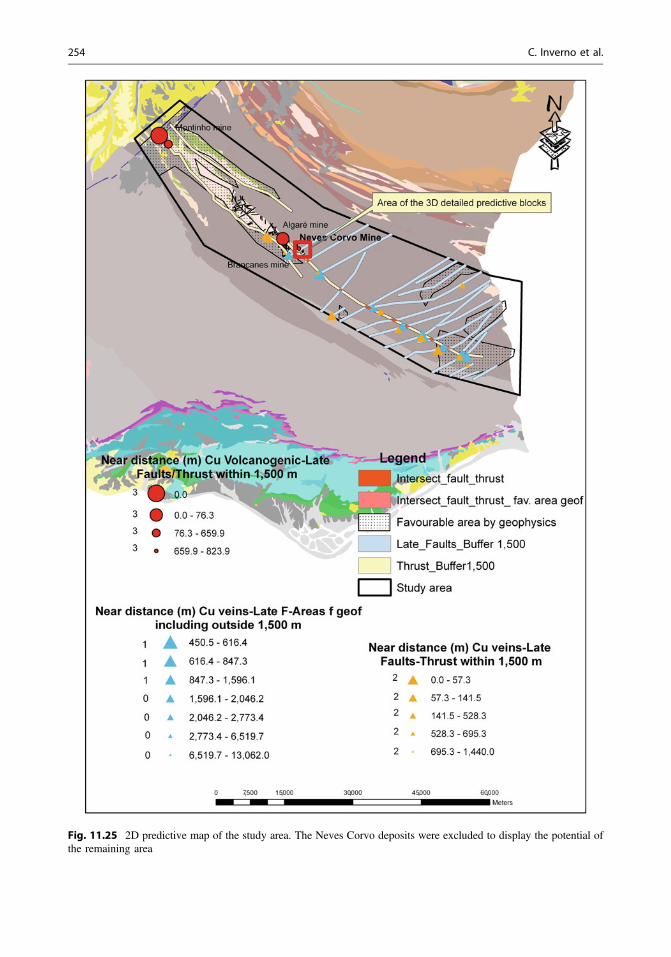
Fig. 11.25 2D predictive map of the study area. The Neves Corvo deposits were excluded to display the potential ofthe remaining area
254 C. Inverno et al.
conditions occurred and with that type of faultingpresent locally in the host rock. The intersectionareas among “areas favourable by geophysics”,Late Variscan faults and Neves Corvo thrustwere also integrated in the predictive map, andare referred to as “intersection” below. The neardistance (within 1500 m) from the volcanogenicdeposits and the intersection of the previousreferred to areas and thrust/faults were calculatedand given the higher predictability rate. The neardistance (within 1500 m) between the LateVariscan vein type deposits plus the areafavoured by geophysics, thrust and faults, weredetermined and given a median rate. The neardistance (including outside the 1500 m) betweenthe Late Variscan vein-type deposits and thefavourable areas given by geophysics, thrustsand faults, was determined and given the lowerrate. Table 11.1 shows the variables used incalculation of the predictive map, Table 11.2shows the weight criteria that defined the pre-dictive area of focus for the exploration of Cu.
Geochemistry was used to trace the naturalpathfinders, with Cu taken as the main com-modity mined in Neves Corvo and the mostimportant commodity in the historical mining ofthe region, characterized by small Cu veinexploitations in the 19th century down to 200 mdepth and by modern massive sulphide exploi-tation down to 900 m depth at the Neves Corvo
mine (Somincor mining project, with productionsince 1987).
The deficient spatial distribution of the geo-chemical data at the scale of the study area pre-cluded its use for the 2D predictive modelling.However, because of its great exploration sig-nificance, it is taken in consideration in the finaldecision. Therefore, with the available informationfrom different geochemical campaigns that wereperformed in the NW-SE Neves Corvo-Rosáriovolcanic axis/structure, a factorial analysis withvarimax rotation was applied and the Kaiser (1960)criteria used. Table 11.3 shows the results and thevariation in the superficial pathfinders (Cu andrelated elements) along that volcanic axis/structurefrom the Montinho area, extending to the SE intothe Garronchal, Zambujeira and finally into theNeves Corvo area. The results are stronglydependent on the chemical elements analysed,which restricts greatly any possible conclusionsthat can be drawn.
Based on the available information the NevesCorvo thrust and the alignment of the outcrop-ping axis/structure at the surface, are the mostimportant guides for mineral exploration in thestudy area. The highly predictive areas forVHMS deposits were coincident with thisalignment. A special conclusion is the fact thatthe extension of the Neves Corvo thrust, obtainedin the 3D modelling and applied in the predictive
Table 11.1 Selected variables for predictive modelling
Methods Conditions
Favourable area given by geophysicsGravimetry+magneticsGravimetry-magnetics
From above 90 ‰ positive when addingand negative when subtracting
Late Variscan faults Buffer 1500 m
Thrusts Buffer 1500 m
Nearest distance from volcanogenic deposits and intersection ofthrusts and Late Variscan faults
Within 1500 m distance
Nearest distance from vein type deposits and intersection of thrustsand Late Variscan faults
Within 1500 m distance
Nearest distance from vein type deposits and intersection of thrustsand Late Variscan faults and favourable area given by geophysics
Within the 1500 m distance
Nearest distance from vein type deposits and intersection of thrustsand Late Variscan faults and favourable area given by geophysics
Outside the 1500 m range
11 Modelling of the Neves Corvo Area 255
maps, coincides spatially with the main align-ment of the Cu mineralizations identified by theauthors as vein-type late Variscan mineralisa-tions. Also, the intersection of the Neves Corvothrust and the late Variscan faults is sometimesnot far from these mineral occurrences. Sulphideremobilization during late Variscan deformationmust be properly understood, considering themineral dispersion from a giant sulphide deposit(Neves Corvo) or from other possible hiddenVHMS ores. These results, combined in the 2Dpredictive map, seem to be of great explorationimportance (Fig. 11.25).
11.5.2 3D Predictive Modellingof Neves Corvo Mine Area
The previously produced 2D predictive mapneeds further developments at depth. Becausemost of the area is covered by the thick flysch ofthe Mértola Fm., it is appropriate to go over thedata location and information available relativeto VSC below that formation. The explorationdrill hole data show a variable distribution of theVSC, controlled by late Variscan faults andregional folds. Because different formations havedifferent densities and the massive sulphides
Table 11.2 Predictive weights
Methods Weight
Nearest distance from volcanogenic deposits and intersection of thrusts and LateVariscan faults
Within 1500 mdistance
3
Nearest distance from vein type deposits and intersection of thrusts and LateVariscan faults
Within 1500 mdistance
2
Nearest distance from vein type deposits and intersection of thrusts and LateVariscan faults and favourable area given by geophysics
Within the 1500 mdistance
1
Nearest distance from vein type deposits and intersection of thrusts and LateVariscan faults and favourable area given by geophysics
Outside the 1500 mrange
0
3 the higher weight; 2 medium weight, 1 lower weight, 0 no influence in predictivity
Table 11.3 Factorial analysis of PC extraction and representation of the Cu probable pathfinders in the area,considering the elements used in the calculation
Area (% variance explained in the 1st 2axis)
Total elements used in PCA Correlated with the occurrence ofCu (>0.7) and PC extraction usingKaiser (1960) criteria
Moitinhos (62 %) As, Ba, Co, Cr, Cu, Fe, Mg,Mn, Ni, P, Pb, Rb, S, Sc, V,Zn
(Axis 2) As, Cu, Pb, Zn
Garrochal (54 %) Cu, Pb, Zn, Ni, Co, As, Fe,Mn, Ba, Cr, V, Al, Sr, Nb, Sc
(Axis 1) Cu, Ni, Co, Fe, Mn, V, Al
Zambujeira (64 %) Cu, Pb, Zn, Ni, Co, As, Fe,Mn, Ba, Cr, V, Al, Nb
(Axis 1) Cu, Zn, Ni, As, Fe, Cr, Al
Neves Corvo (samples from 1998) (60 %) Cu, Pb, Zn, Ni, Co, Mn, Fe,As, V, Ca, P, Cr, Mg, Ba, Ti,Al, Na, Sn, Nb, Sc
(Axis 2) Cu, Pb, Zn, As, Sn
Neves Corvo area before start of mineproduction (archived samples from the70s analysed recently) (56 %)
Cu, Pb, Zn, Ni, Co, Mn, Fe,As, V, Cr, Mg, Ba, Ti, Nb
(Axis 2) Cu, Pb, Zn, Co
256 C. Inverno et al.
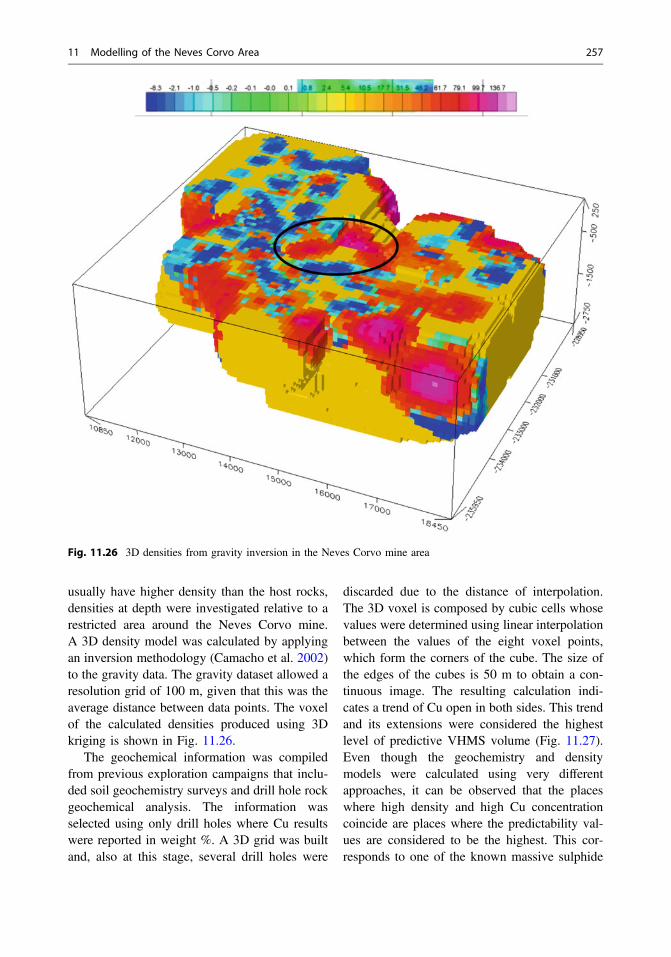
usually have higher density than the host rocks,densities at depth were investigated relative to arestricted area around the Neves Corvo mine.A 3D density model was calculated by applyingan inversion methodology (Camacho et al. 2002)to the gravity data. The gravity dataset allowed aresolution grid of 100 m, given that this was theaverage distance between data points. The voxelof the calculated densities produced using 3Dkriging is shown in Fig. 11.26.
The geochemical information was compiledfrom previous exploration campaigns that inclu-ded soil geochemistry surveys and drill hole rockgeochemical analysis. The information wasselected using only drill holes where Cu resultswere reported in weight %. A 3D grid was builtand, also at this stage, several drill holes were
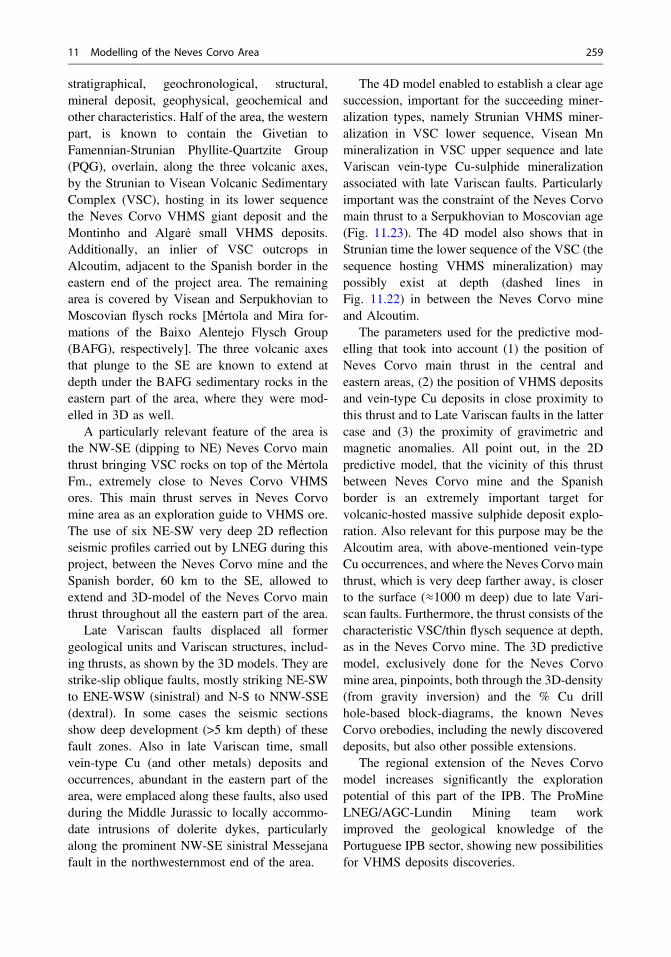
discarded due to the distance of interpolation.The 3D voxel is composed by cubic cells whosevalues were determined using linear interpolationbetween the values of the eight voxel points,which form the corners of the cube. The size ofthe edges of the cubes is 50 m to obtain a con-tinuous image. The resulting calculation indi-cates a trend of Cu open in both sides. This trendand its extensions were considered the highestlevel of predictive VHMS volume (Fig. 11.27).Even though the geochemistry and densitymodels were calculated using very differentapproaches, it can be observed that the placeswhere high density and high Cu concentrationcoincide are places where the predictability val-ues are considered to be the highest. This cor-responds to one of the known massive sulphide
Fig. 11.26 3D densities from gravity inversion in the Neves Corvo mine area
11 Modelling of the Neves Corvo Area 257
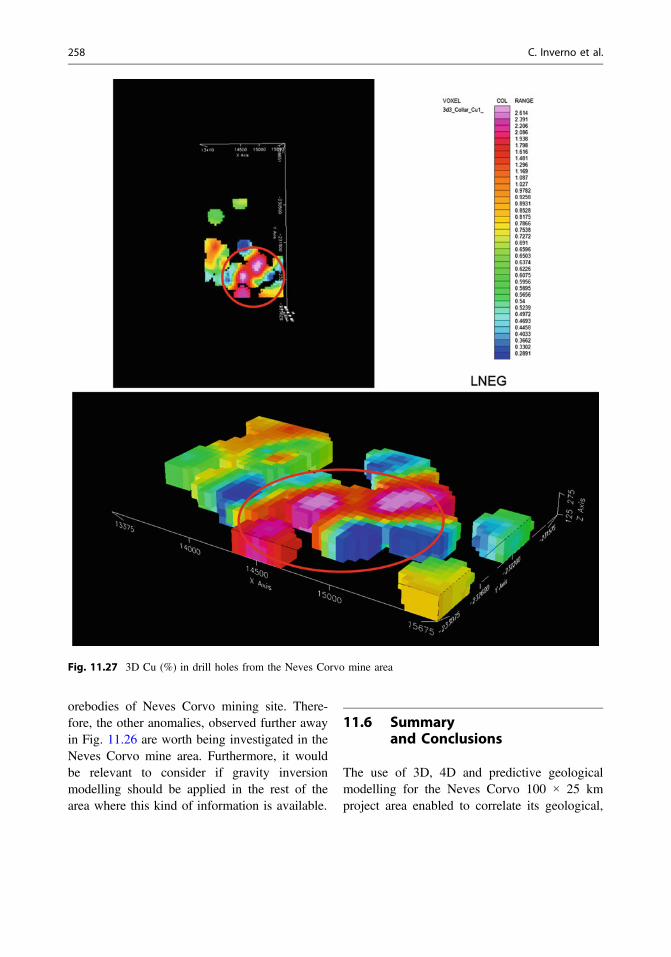
orebodies of Neves Corvo mining site. There-fore, the other anomalies, observed further awayin Fig. 11.26 are worth being investigated in theNeves Corvo mine area. Furthermore, it wouldbe relevant to consider if gravity inversionmodelling should be applied in the rest of thearea where this kind of information is available.
11.6 Summaryand Conclusions
The use of 3D, 4D and predictive geologicalmodelling for the Neves Corvo 100 × 25 kmproject area enabled to correlate its geological,
Fig. 11.27 3D Cu (%) in drill holes from the Neves Corvo mine area
258 C. Inverno et al.
stratigraphical, geochronological, structural,mineral deposit, geophysical, geochemical andother characteristics. Half of the area, the westernpart, is known to contain the Givetian toFamennian-Strunian Phyllite-Quartzite Group(PQG), overlain, along the three volcanic axes,by the Strunian to Visean Volcanic SedimentaryComplex (VSC), hosting in its lower sequencethe Neves Corvo VHMS giant deposit and theMontinho and Algaré small VHMS deposits.Additionally, an inlier of VSC outcrops inAlcoutim, adjacent to the Spanish border in theeastern end of the project area. The remainingarea is covered by Visean and Serpukhovian toMoscovian flysch rocks [Mértola and Mira for-mations of the Baixo Alentejo Flysch Group(BAFG), respectively]. The three volcanic axesthat plunge to the SE are known to extend atdepth under the BAFG sedimentary rocks in theeastern part of the area, where they were mod-elled in 3D as well.
A particularly relevant feature of the area isthe NW-SE (dipping to NE) Neves Corvo mainthrust bringing VSC rocks on top of the MértolaFm., extremely close to Neves Corvo VHMSores. This main thrust serves in Neves Corvomine area as an exploration guide to VHMS ore.The use of six NE-SW very deep 2D reflectionseismic profiles carried out by LNEG during thisproject, between the Neves Corvo mine and theSpanish border, 60 km to the SE, allowed toextend and 3D-model of the Neves Corvo mainthrust throughout all the eastern part of the area.
Late Variscan faults displaced all formergeological units and Variscan structures, includ-ing thrusts, as shown by the 3D models. They arestrike-slip oblique faults, mostly striking NE-SWto ENE-WSW (sinistral) and N-S to NNW-SSE(dextral). In some cases the seismic sectionsshow deep development (>5 km depth) of thesefault zones. Also in late Variscan time, smallvein-type Cu (and other metals) deposits andoccurrences, abundant in the eastern part of thearea, were emplaced along these faults, also usedduring the Middle Jurassic to locally accommo-date intrusions of dolerite dykes, particularlyalong the prominent NW-SE sinistral Messejanafault in the northwesternmost end of the area.
The 4D model enabled to establish a clear agesuccession, important for the succeeding miner-alization types, namely Strunian VHMS miner-alization in VSC lower sequence, Visean Mnmineralization in VSC upper sequence and lateVariscan vein-type Cu-sulphide mineralizationassociated with late Variscan faults. Particularlyimportant was the constraint of the Neves Corvomain thrust to a Serpukhovian to Moscovian age(Fig. 11.23). The 4D model also shows that inStrunian time the lower sequence of the VSC (thesequence hosting VHMS mineralization) maypossibly exist at depth (dashed lines inFig. 11.22) in between the Neves Corvo mineand Alcoutim.
The parameters used for the predictive mod-elling that took into account (1) the position ofNeves Corvo main thrust in the central andeastern areas, (2) the position of VHMS depositsand vein-type Cu deposits in close proximity tothis thrust and to Late Variscan faults in the lattercase and (3) the proximity of gravimetric andmagnetic anomalies. All point out, in the 2Dpredictive model, that the vicinity of this thrustbetween Neves Corvo mine and the Spanishborder is an extremely important target forvolcanic-hosted massive sulphide deposit explo-ration. Also relevant for this purpose may be theAlcoutim area, with above-mentioned vein-typeCu occurrences, and where the Neves Corvo mainthrust, which is very deep farther away, is closerto the surface (≈1000 m deep) due to late Vari-scan faults. Furthermore, the thrust consists of thecharacteristic VSC/thin flysch sequence at depth,as in the Neves Corvo mine. The 3D predictivemodel, exclusively done for the Neves Corvomine area, pinpoints, both through the 3D-density(from gravity inversion) and the % Cu drillhole-based block-diagrams, the known NevesCorvo orebodies, including the newly discovereddeposits, but also other possible extensions.
The regional extension of the Neves Corvomodel increases significantly the explorationpotential of this part of the IPB. The ProMineLNEG/AGC-Lundin Mining team workimproved the geological knowledge of thePortuguese IPB sector, showing new possibilitiesfor VHMS deposits discoveries.
11 Modelling of the Neves Corvo Area 259
Acknowledgments The authors thank LNEG andLundin Mining for supporting this study and allowing thepublication of its results. Augusto Filipe (LNEG) isthanked for improving and editing several figures.
References
Barriga, F., Carvalho, D., 1983. Carboniferous volcanogenicsulphidemineralizations in south Portugal (Iberian PyriteBelt). Memórias dos Serviços Geológicos de Portugalv. 29, pp. 99–113.
Boogaard, M.V., Schermerhorn, L.J.G., 1981. Conodontfaunas from Portugal and Southwestern Spain, Part 6-A Lower Famennian faunas at Monte Forno da Cal(South Portugal). Scripta Geologica, 63,1–16.
Camacho, A.G., Montesinos, F.G., Vieira, R., 2002. A 3-D gravity inversion tool based on exploration ofmodel possibilities. Computers & Geosciences, 28,191–204.
Carbonell, R., Simancas, F., Juhlin, C., Pous, J., Pérez-Estaún, A., González-Lodeiro, F., Muñoz, G., Heise,W., Ayarza, P., 2004. Geophysical evidence of amantle derived intrusion in SW Iberia. GeophysicalResearch Letters 31, L11601,.
Carvalho, D., 1982. New paths to massive sulphideexploration in the Iberian Pyrtite Belt. ComunicaçõesServiços Geológicos Portugal, 68 (2), 149–162
Carvalho D, Barriga F J A S, Munhá J., 1999. Bimodal-siliciclastic systems—the case of the Iberian Pyrite Belt.In: Barrie, C.T., Hannington, M.D. (eds.), Volcanic-Associated Massive Sulphide Deposits: Processes andExamples in Modern and Ancient Settings, ReviewsEconomic Geology, 8, 375–408.
Carvalho, J., Sousa, P., Matos, J., Pinto, C., 2011. Oreprospecting in the Iberian Pyrite Belt using seismicand potential-field data. Journal of Geophysics andEngineering 8 (2), 142–153.
Cordsen, A., Galbraith, M., Peirce, J.,2000. PlanningLand 3-D Seismic Surveys. SEG Geophysical Devel-opment Series No. 9, Tulsa, Oklahoma (OK), USA,204 p
Eaton, David W., 2003. Hardrock Seismic Exploration.SEG Geophysical Development Series Nº 10, Tulsa,OK, USA, 270 p.
Germann, K., Luders V., Banks, D.A., Simon K., Hoefs,J., 2003. Late Hercynian polymetallic vein-type base-metal mineralization in the Iberian Pyrite Belt: fluid-inclusion and stable-isotope geochemistry (S–O–H–Cl). Mineralium Deposita, 38: 953–967.
Hubral, P. (ed.), 1999. Macro model independent seismicreflection imaging. Journal of Applied Geophysics, 42(3-4) – Special issue on Karlsruhe Workshop onmacro model independent seismic reflection imaging.
Kaiser, H. F., 1960. The application of electroniccomputers to factor analysis. Educational andPsychological Measurement, 20, 141–151.
Kim, J. S., Moon, W. M., Lodha, G., Serzu, M.,Soonavvala, N., 1994. Imaging of reflection seismicenergy for mapping shallow fracture zones in crystal-line rocks, Geophysics, 59, 753–765.
Korn, D., 1997. The Palaeozoic ammonoids of the SouthPortuguese Zone. Memórias do Instituto Geológico eMineiro, 33, 131 p..
Leca, X; Ribeiro, A; Oliveira, T.; Brandão Silva, J.;Albouy, P.; Carvalho, P.; Merino, H., 1983. CadreGéologique des Mineralisations de Neves Corvo,Baixo-Alentejo, Portugal, Litostratigraphie, Paléogéog-raphie et Tectonique”: Mémoire du Bureau de Recher-ches Géologiques et Minières, Orléans, nº 121, 79 p.
Leitão, J., 1997. Geology of the Aljustrel massivesulphide deposits, in Barriga, F.J.A.S., Carvalho, D.,eds., Geology and VMS deposits of the Iberian PyriteBelt: Society of Economic Geologists Field TripGuidebook Series, v. 27, p. 82–97.
Lundin Mining, 2010. Management’s discussion andanalysis for the year ended December 31, 2010 –
Lundin Mining Press Release, www.lundinmining.comLundin Mining, 2012. Third Quarter 2012 Exploration
Update press release, http://www.lundinmining.com/s/ExplorationUpdate.asp?ReportID=555171.
Mann, J., Hubral, P., Hocht, G., Jaeger, R., Mueller, T.,1999. Applications of the common-reflection-surfacestack:, in 69th Annual International Meeting of theSociety of Exploration Geophysicists, 1829–1832.
Mateus, A. Munhá, J., Andráš, P., Matos, J.X., 2006.Geoquímica isotópica do chumbo em mineralizaçõeshidrotermais antimoníferas do Sul de Portugal. VIICongresso Nacional de Geologia. Universidade deÉvora, Livro de Resumos, v. 3, p. 1039–1042.
Matos, J.X., Rosa, C., 2001. Diagnóstico Preliminar deMinas Abandonadas – Área Sul. Relatório Interno,Instituto Geológico e Mineiro, 276 pp (in Portuguese).
Matos, J. X., Martins, L. P., Rosa, C., 2003. ParqueMineiro da Cova dos Mouros - IGM contribute for thesustainable development of the mining park. IGME,Cuadernos del Museo Geominero, nº 2, 487–494.
Matos, J., Pereira, Z., Rosa, C., Rosa, D. N, Oliveira, J. T.,Relvas, J., 2011. A key time frame for VMS depositexploration in the Iberian Pyrite belt. SGA 2011, 11th
Biennial Meeting, Antofagasta, Chile, 790–792.Munhá J., 1983a. Low grade regional metamorphism in
the Iberian Pyrite Belt: Comunicações ServiçosGeológicos de Portugal, 69,3-35.
Munhá J., 1983b. Hercynian magmatism in the IberianPyrite Belt. In: Sousa M J L, Oliveira JT. (eds.), TheCarboniferous of Portugal, Memórias ServiçosGeológicos Portugal 29: 39–81.
Munhá, J., 1990. Metamorphic evolution of the SouthPortuguese/Pulo do Lobo Zone. In: Dallmeyer, R.D.,Martinez-Garcia, E. (eds.), Pre-Mesozoic geology ofIberia. Berlin, Springer-Verlag, 363–368.
Oliveira, JT., 1983.The marine Carboniferous of SouthPortugal: a stratigraphic and sedimentologicalapproach. In: Sousa M J L, Oliveira JT (eds), The
260 C. Inverno et al.
Carboniferous of Portugal, Memórias ServiçosGeológicos Portugal 29, 3–37.
Oliveira, J.T., Wagner-Genthis, C., 1983, The Mértolaand Mira formations boundary between Doguedo andAlmada do Ouro, marine Carboniferous of SouthPortugal. In: Lemos de Souda,M.J. (ed.), Contributionsto the Carboniferous Geology and Palaeontology of theIberian Península. Porto, Univ. Porto – Faculdade deCiências, 1–39.
Oliveira, J. T., Monteiro, J. H., Zbyszewski G., Manup-pella, G., Oliveira V., 1984. Carta Geológica dePortugal, 1/200 000, Folha 7 and Notícia Explicativa.Lisboa, Serviços Geológicos de Portugal (inPortuguese).
Oliveira, J.T., Garcia-Alcaide, J., Liñan, E., Truyols, J.,1986. The Famennian of the Iberian Peninsula. An.Soc. Géologique Belgique, 109, 159–174.
Oliveira, J. T., Oliveira, V.,Manuppella, G., Zbyszewski G.,Monteiro, J. H., 1992. Carta Geológica de Portugal,1/200 000, Folha 8 and Notícia Explicativa. Lisboa,Serviços Geológicos de Portugal (in Portuguese).
Oliveira, JT, Pacheco, N, Carvalho, P, Ferreira, A., 1997.The Neves Corvo Mine and the Paleozoic Geology ofSouthwest Portugal. In: F JAS Barriga and D.Carvalho, eds : Geology and VMS Deposits of theIberian Pyrite belt. SEG Neves Corvo Field Confer-ence, 1997, Field trip # 1. Guidebook Series Volume27. Society of Economic Geologists, p. 21–71.
Oliveira, V., Matos, J.X., Bengala, M., Silva, N., Sousa, P. eTorres, L., 1998. Geology and Geophysics as SuccessfulTools in the Discovery of the Lagoa Salgada Orebody(Sado Tertiary Basin - Iberian Pyrite Belt), Grândola,Portugal. Mineralium Deposita, 33: 170–187.
Oliveira JT, Pereira Z, Carvalho P, Pacheco N, Korn D.,2004. Stratigraphy of the tectonically imbricatedlithological succession of the Neves Corvo mine area,IPB, Portugal. Mineralium. Deposita 39, 422–436.
Oliveira JT, Relvas JMRS, Pereira Z, Matos JX, Rosa CJ,Rosa D,Munhá J, Jorge R, Pinto A., 2006. OComplexovulcano-sedimentar da Faixa Piritosa: estratigrafia,vulcanismo, mineralizações associadas e evoluçãotectono-estratigráfica no contexto da zona Sul-Portuguesa: In Dias R, Araújo A, Terrinha P,Kulberg JC (eds) Geologia de Portugal no contextoda Ibéria: VII Cong. Nac. Geologia, Universidade deÉvora, Portugal: 207–244.
Oliveira JT, Rosa C, Pereira Z, Rosa D,Matos J, Inverno C,Andersen T., 2013. Geology of the Rosário - NevesCorvo antiform, Iberian Pyrite Belt, Portugal: newinsights from physical volcanology, palynostratigra-phy and isotope geochronology studies. MineraliumDeposita, 48, 749–766.
Pereira Z, Pacheco N, Oliveira JT., 2003. A case of appliedpalynology: dating the lithological succession of theNeves-Corvo Mine, Iberian Pyrite Belt, Portugal. In:Wong TE (ed) Proceedings of the XVth InternationalCongress on Carboniferous and Permian Stratigraphy.R. D. Academy Arts and Sciences, Utrecht, TheNetherlands, pp 345–354.
Pereira Z, Matos J X, Fernandes P, Oliveira J T, 2008.Palynostratigraphy and systematic palynology of theDevonian and Carboniferous successions of the SouthPortuguese Zone, Portugal. Memórias Geológicas doINETI, 34, 181 p.
Pereira, Z., Matos, J., Fernandes, P., Jorge; R., Oliveira. J.T., 2009. A new Lower Givetian age Miospores of thePhyllite Quartzite Group (S. Francisco da SerraAnticline, Iberian Pyrite Belt, Portugal). In: AbstractsCimpfaro’09. Fernandes, P., Pereira, Z., Oliveira, J.T.,Clayton, C & Wicander, R. (eds)., pp. 75–78.
Quesada, C., 1998. A reappraisal of the structure of theSpanish segment of the Iberian Pyrite Belt. Minera-lium Deposita, 33: 31–44.
Radzevicius, S. J., Pavlis, G. L., 1999. High-frequencyreflections in granite? Delineation of the weatheringfront in granodiorite at Piñon Flat, California, Geo-physics, 64, 1828–1835.
Reiser, F. K. M., Rosa, D.R. N., Pinto, Á.M. M.,Carvalho, J.R. S., Matos, J´.X., Guimarães, F.M. G.,Alves, L.C. and de Oliveira, D. P. S., 2011. Miner-alogy and geochemistry of tin- and germanium-bearing copper ore, Barrigão re-mobilized veindeposit, Iberian Pyrite Belt, Portugal, InternationalGeology Review, 53 (10), 1212–1238.
Relvas, J.M.R.S., Barriga, F.J.A.S., Ferreira, A., Noiva, P.C., Pacheco, N., Barriga, G., 2006a. Hydrothermalalteration and mineralization in the Neves-Corvovolcanic-hosted massive sulphide deposit, Portugal:I. Geology, mineralogy, and geochemistry. EconomicGeology, 101: 791–804.
Relvas, J.M.R.S., Barriga, F.J.A.S., Longstaffe, F.J.,2006b. Hydrothermal alteration and mineralization inthe Neves-Corvo volcanic-hosted massive sulphidedeposit, Portugal: II. Oxygen, hydrogen, and carbonisotopes. Economic Geology, 101: 753–790.
Rosa C, McPhie J, Relvas J, Pereira Z, Oliveira T,Pacheco N., 2008. Facies analyses and volcanicsetting of the giant Neves Corvo massive sulphidedeposit, Iberian Pyrite Belt, Portugal. MineraliumDeposita, 43: 449–466.
Schermerhorn, L.J.G., Zbyszewski, G., Veiga Ferreira, O.,1987. Notícia Explicativa da Folha 42-D (Aljustrel),Carta Geológica de Portugal, escala 1:50,000: Lisboa,Serviços Geológicos de Portugal, 55 p. (in Portuguese).
Silva, J.B., Oliveira, J.T., Ribeiro, A., 1990. SouthPortuguese Zone. Part VI. Structural outline. In:Dallmeyer, R.D., Martínez García, E. (eds.). Pre-Meso-zoic Geology of Iberia. Springer, Berlin, 348–362.
Simancas, J.F., Carbonell, R., González Lodeiro, F., PérezEstaún, A., Juhlin, C., Ayarza, P., Kashubin, A., Azor,A., Martínez Poyatos, D., Almodóvar, G.R., Pascual,E., R. Sáez, R., Expósito, I., 2003. Crustal structure ofthe transpressional Variscan orogen of SW Iberia: SWIberia deep seismic reflection profile (IBERSEIS).Tectonics, 22 (6), TC1062, 1–11—1–19
11 Modelling of the Neves Corvo Area 261