Modelling of Reinforced Concrete Beams · Behaviour of Reinforced Concrete Frames ... Concrete...
24
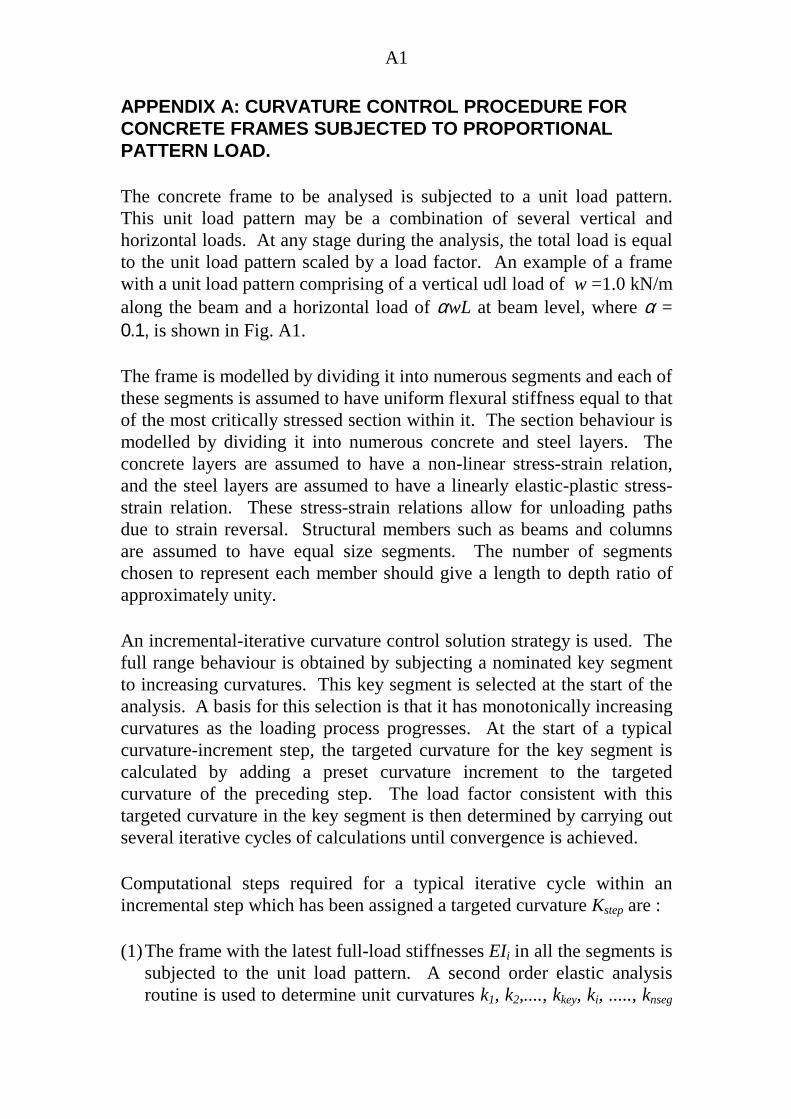
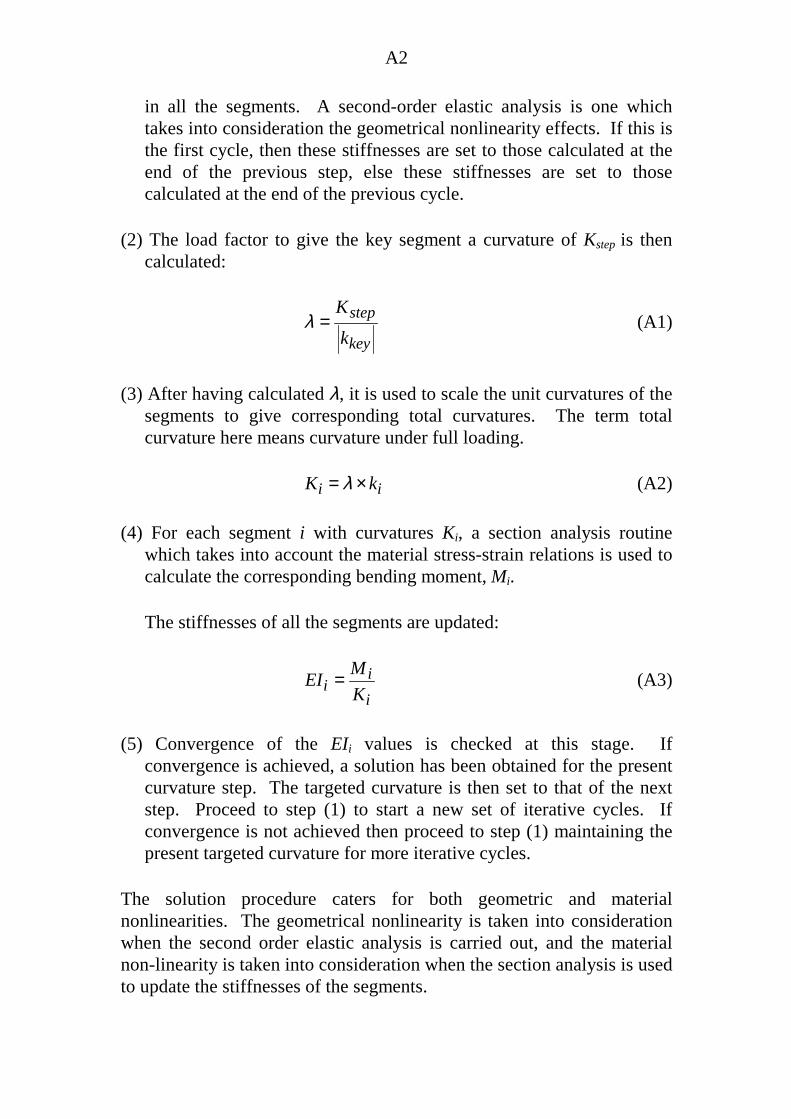
Behaviour of Reinforced Concrete Frames under Non-proportional Loadings by K W Wong R F Warner Research Report No. R 146 February 1997 ISBN 0 86396 416 8
Transcript of Modelling of Reinforced Concrete Beams · Behaviour of Reinforced Concrete Frames ... Concrete...
Behaviour of Reinforced Concrete Framesunder Non-proportional Loadings
by
K W Wong
R F Warner
Research Report No. R 146February 1997ISBN 0 86396 416 8
BEHAVIOUR OFREINFORCED CONCRETE FRAMES
UNDERNON-PROPORTIONAL LOADINGS
by
K W WongR F Warner
Department of Civil and Environmental EngineeringThe University of Adelaide
Research Report No. R 146February 1997
i
BEHAVIOUR OF REINFORCED CONCRETE FRAMES UNDERNON-PROPORTIONAL LOADINGS
K W Wong R F WarnerResearch Fellow Professor
Department of Civil and Environmental EngineeringUniversity of Adelaide
ABSTRACT: This report gives details of a study of the overloadbehaviour and strength of concrete framed structures when subjected tonon-proportional loadings. A special analytic procedure was developedto simulate the overload behaviour and collapse of a concrete framewhen subjected to vertical and horizontal loads which are applied insequence.
Comparisons were made of the effects of applying loads sequentially andsimultaneously to a variety of structural systems. It is concluded thatload capacity for sequentially applied loads can be predicted with goodaccuracy by using an equivalent proportional load system.
ii
TABLE OF CONTENTS
Section Page
ABSTRACT i
TABLE OF CONTENTS ii
LIST OF FIGURES iii
1. INTRODUCTION 1
2. METHOD OF ANALYSIS 2
3. FREE-STANDING COLUMN 7
4. PORTAL FRAMES 9
5. THREE STOREY FRAME 13
6. CONCLUDING REMARKS 15
7. REFERENCES 15
APPENDIX A: CURVATURE CONTROL PROCEDURE FOR CONCRETEFRAMES SUBJECTED TO PROPORTIONAL PATTERN LOAD A1
iii
LIST OF FIGURES
Page
1 Diagrams showing the various loading paths 2
2 Free-standing Column 7
3 Interaction diagram for free-standing column 8
4 Portal Frame 9
5 Strength interaction diagram for 4m tall portal frame 10
6 Horizontal load versus sway deflection for case ααααmax = 10 11
7 Vertical load factor versus sway deflection for case ααααmax = 10 11
8 Strength interaction diagram for 8m tall portal frame 12
9 Strength interaction diagram for 12m tall portal frame 12
10 Configuration of 3-storey frame 14
11 Load versus Sway Deflection Plots for Multi-storey Frames 14
A1 Diagram showing the scaling of the unit load pattern to give full loads. A3
1
1. INTRODUCTION
Concrete structures are designed to resist various combinations of loads,which act both vertically and horizontally. To simplify the designcalculations, it is always assumed that the loads comprising any onecombination are applied simultaneously and proportionally, and the loadeffects are usually evaluated by means of linear elastic frame analysis.
In reality, the loads always occur in sequence. For example, the verticalloads due to self weight and dead and live loads preceding the horizontalloads due to wind or earthquake. Furthermore, concrete structuresbehave in a highly non-linear manner, even under working loadconditions. Although non-linear analysis packages are graduallybecoming available commercially, they usually predict structuralbehaviour under conditions of a progressively increasing, butproportional, system of loads.
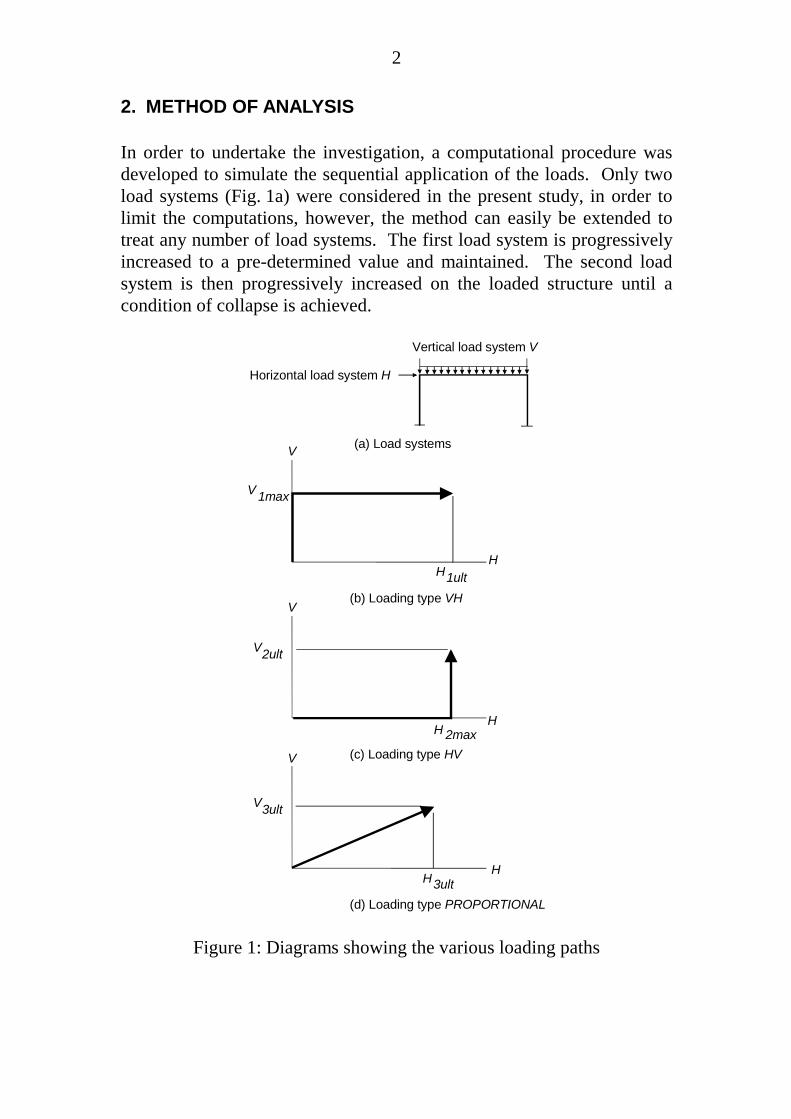
This paper reports on an investigation of concrete structural behaviourunder non-proportional loading. The aim of the study was to evaluatethe effect of the sequence of loading on the load capacity of concreteframes. The situation to be investigated is illustrated in Fig. 1.
In Fig. 1a, a simple frame is considered with a vertical load system V anda horizontal load system H. Three load sequences are considered. In thefirst sequence, Fig. 1b, the vertical load is increased to a valuerepresented by V1max and the horizontal load is then progressivelyincreased until collapse occurs at the value H1ult. In the second sequence,Fig. 1c, the horizontal load is first increased to a maximum value ofH2max, which is chosen to be equal to H1ult, and the vertical load is thenincreased until failure occurs at V2ult. In the third case, Fig. 1d, thevertical and horizontal loads are applied simultaneously. They areproportionally increased in the ratio V1max :H1ult until failure occurs atloads of V3ult and H3ult. Clearly, the load combinations at collapse are notnecessarily the same in these three cases. Unfortunately, very littleresearch has been undertaken on the effects of load sequences and non-proportional loading (Kenyon and Warner, 1993), and the purpose of thepresent study was to obtain the quantitative estimates of the effect ofload sequence on load carrying capacity.
2
2. METHOD OF ANALYSIS
In order to undertake the investigation, a computational procedure wasdeveloped to simulate the sequential application of the loads. Only twoload systems (Fig. 1a) were considered in the present study, in order tolimit the computations, however, the method can easily be extended totreat any number of load systems. The first load system is progressivelyincreased to a pre-determined value and maintained. The second loadsystem is then progressively increased on the loaded structure until acondition of collapse is achieved.
Vertical load system V
Horizontal load system H
(a) Load systems V
H
(b) Loading type VHV
H
(c) Loading type HVV
H
(d) Loading type PROPORTIONAL
V
H1ult
1max
V
2maxH
2ult
V3ult
H3ult
Figure 1: Diagrams showing the various loading paths
3
The simulation program is part of an ongoing study of the non-linearbehaviour of concrete structures (Warner, 1975; Warner and Yeo, 1984a,1984b; Wong, Yeo and Warner, 1988, 1990; Wong and Warner, 1988,1990). Non-linear analysis can be undertaken using deformation control,load control, or a combined load-deformation control. Load-controlmethods tend to have convergence problems when used to determineload capacity, although methods have been devised to deal with peakloads and post failure decreasing loads. Deformation control procedureshave been developed which use curvature control in a local region(Wong, Yeo and Warner, 1988), and deflection control at a suitable point(Kawano and Warner, 1995). An early application of the combined load-deformation control is the approach of Crisfield (1983), which is veryeffective although computationally intensive in dealing with peak loadbehaviour. While the deformation control and load-deformation controlmethods are both suitable for determining the behaviour of the structureat collapse under proportional loading, the curvature control method wasfound in the present study to provide a simple and efficient basis for theanalysis of non-proportional loading. In a previous preliminary study,Kenyon and Warner (1993) used load control for the first load systemand the first part of the second load application and then changed over todefomation control for the second part of the second load application tofailure. In the present study, the use of curvature control throughout hasgreatly simplified the computational procedure.
The computational procedure for using curvature control for proportionalanalysis is briefly describe in Appendix A. A more detailed descriptionof the procedure can be found in an earlier paper (Wong, Yeo andWarner, 1988). The extension of this procedure to non-proportionalanalysis will now be explained.
The two load systems are represented by two unit load patterns which areprogressively increased by means of scaling factors.
In Fig. 1a, the rectangular portal frame is subjected to a vertical loadsystem consisting of a uniformly distributed load of w kN/m and twopoint loads of αwL kN which act on each column. To represent variouslevels of loading, an initial value of w (eg 1.0 kN/m) is taken, and aprogressively increasing scaling factor λ1 is introduced. For thehorizontal load system, a unit load H (eg 1.0 kN) is scaled using λ2.
4
Load pattern 1 is applied in several steps by increasing the load factor λ1
in steps using curvature control until it reaches λ1max. From this stage on,λ1 is kept at this value while curvature control is used to increase λ2 untilcollapse occurs at λ2ult.
As in the proportional analysis described in Appendix A, the frame ismodelled by dividing it into numerous segments and each of thesesegments is assumed to have a uniform flexural stiffness equal to that ofthe most critically stressed section within it. The section behaviour ismodelled by dividing it into numerous concrete and steel layers. Theconcrete layers are assumed to have a non-linear stress-strain relation,and the steel layers are assumed to have a linearly elastic-plastic stress-strain relation. These stress-strain relations allow for unloading pathsdue to strain reversal. Structural members such as beams and columnsare assumed to have equal size segments. The number of segmentschosen to represent each member gives a length to depth ratio ofapproximately unity.
An incremental-iterative curvature control solution strategy is used. Thefull range behaviour is obtained by subjecting a nominated key segmentto increasing curvatures. This key segment is selected at the start of theanalysis. A basis for this selection is that it has monotonically increasingcurvatures as the loading process progresses, initially under the influenceof load pattern 1 and subsequently under the additional influence of loadpattern 2. At the start of a typical curvature-increment step, the targetedcurvature for the key segment is calculated by adding a preset curvatureincrement to the targeted curvature of the preceding step. The loadfactors λ1 and λ2, consistent with this targeted curvature in the keysegment, are then determined by carrying out several iterative cycles ofcalculations until convergence is achieved.
Computational steps required for a typical iterative cycle within anincremental step which has been assigned a targeted curvature Kstep are:
1. The frame with the latest full-load stiffnesses EIi in all the segments issubjected to the unit load pattern 1. A second order elastic analysisroutine is used to determine unit curvatures k11, k21, ...., kkey1, ki1, .....,knseg1 in all the segments. Similarly, the frame with the latest full-loadstiffnesses EIi in all the segments is subjected to the unit load pattern2. A second order elastic analysis routine is used also to determineunit curvatures k12, k22, ...., kkey2, ki2, ....., knseg2 in all the segments. If
5
this is the first cycle, then these stiffnesses are set to those calculatedat the end of the previous step, else these stiffnesses are set to thosecalculated at the end of the previous cycle.
2. The load factor λ1 to give the key segment a total curvature ( the termtotal curvature means curvature under full loading) of Kstep is thenestimated :
1
1key
stepk
K=λ (1)
where kkey1 is the curvature of key segment under unit load pattern 1.
3. If λ1 is less than or equal to λ1max, λ1 is taken to be the valuecalculated in step 2 above and λ2 is set to zero. Proceed to Step 5.
4. If λ1 exceeds λ1max the following steps are required:
• Estimate the full load curvature of the key segment under loadpattern 1 Kkey1 which will give a λ1 value equal to λ1max :
1max11 keykey kK ×= λ (2)
• Load factor λ 1 is then set to λ1max :
max11 λλ = (3)
• The required total curvature of the key segment for the framesubjected to load pattern 2 to give a total curvature of Kstepunder the combined application of the two load patterns iscalculated:
12 keystepkey KKK −= (4)
6
• The load factor λ2 to give the key segment a total curvature ofKkey2 is then calculated:
2
22
key
keyk
K=λ (5)
where kkey2 is the curvature of key segment under unit loadpattern 2.
5. After having calculated both λ1 and λ2, they are used to scale thecorresponding unit curvatures of the segments to give correspondingtotal curvatures. For a typical segment i, the principle ofsuperposition is then used to calculate the total curvature Ki:
( ) ( )2211 iii kkK ×+×= λλ (6)
where ki1 is the curvature of the ith segment under unit load pattern 1 andki2 is the curvature of the ith segment under unit load pattern 2. Notethat the simultaneous application of λ1 and λ2 in the above equationwill give a curvature of Kstep in the key segment.
6. For each segment i with curvatures Ki , a section analysis routinewhich takes account of the material stress-strain relations is used tocalculate the corresponding bending moment, Mi. The stiffnesses ofall the segments are updated:
ii
i KMEI = (7)
7. Convergence of the EIi values is checked at this stage. If convergenceis achieved, a solution has been obtained for the present curvaturestep. The targeted curvature is then set to that of the next step.Proceed to step (1) to start a new set of iterative cycles. Ifconvergence is not achieved then proceed to step (1) maintaining thepresent targeted curvature for more iterative cycles.
The solution procedure caters for both geometric and materialnonlinearities. The geometrical nonlinearity is taken into consideration
7
when the second order elastic analysis is carried out, and the materialnon-linearity is taken into consideration when the section analysis is usedto update the stiffnesses of the segments.
3. FREE-STANDING COLUMN
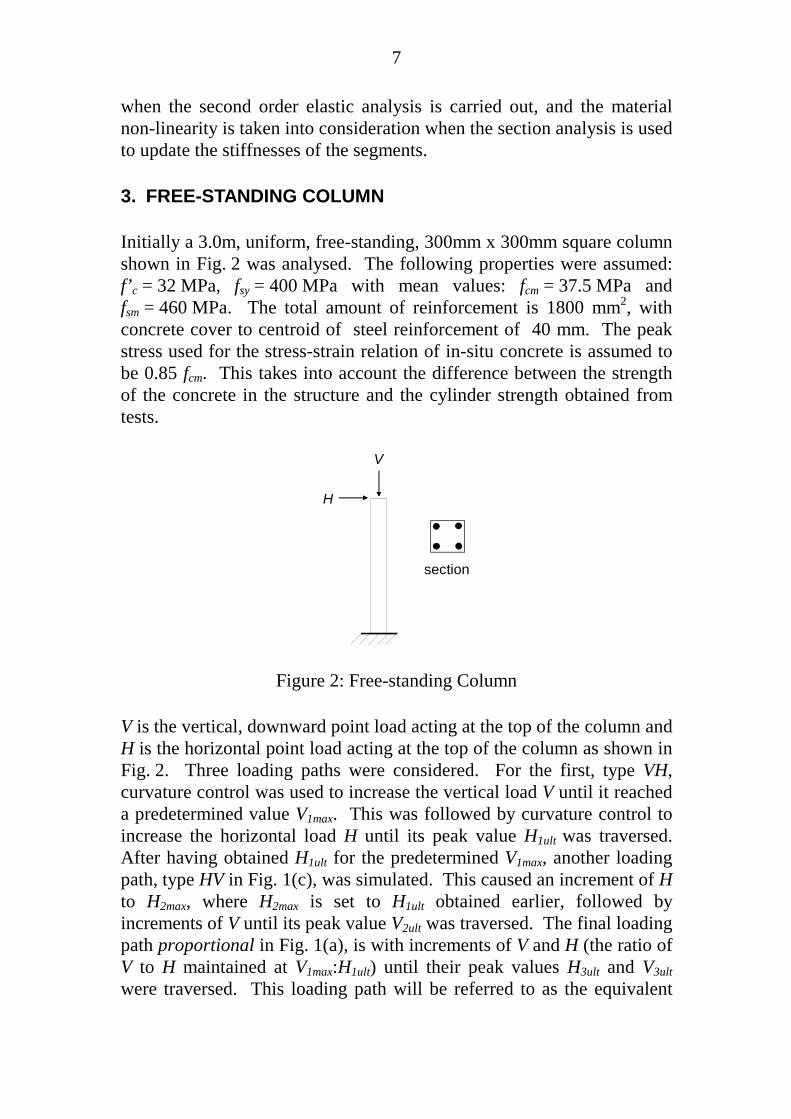
Initially a 3.0m, uniform, free-standing, 300mm x 300mm square columnshown in Fig. 2 was analysed. The following properties were assumed:f’c = 32 MPa, fsy = 400 MPa with mean values: fcm = 37.5 MPa andfsm = 460 MPa. The total amount of reinforcement is 1800 mm2, withconcrete cover to centroid of steel reinforcement of 40 mm. The peakstress used for the stress-strain relation of in-situ concrete is assumed tobe 0.85 fcm. This takes into account the difference between the strengthof the concrete in the structure and the cylinder strength obtained fromtests.
V
H
section
Figure 2: Free-standing Column
V is the vertical, downward point load acting at the top of the column andH is the horizontal point load acting at the top of the column as shown inFig. 2. Three loading paths were considered. For the first, type VH,curvature control was used to increase the vertical load V until it reacheda predetermined value V1max. This was followed by curvature control toincrease the horizontal load H until its peak value H1ult was traversed.After having obtained H1ult for the predetermined V1max, another loadingpath, type HV in Fig. 1(c), was simulated. This caused an increment of Hto H2max, where H2max is set to H1ult obtained earlier, followed byincrements of V until its peak value V2ult was traversed. The final loadingpath proportional in Fig. 1(a), is with increments of V and H (the ratio ofV to H maintained at V1max:H1ult) until their peak values H3ult and V3ultwere traversed. This loading path will be referred to as the equivalent
8
proportional load for the non-proportional loading type VH in thisreports.
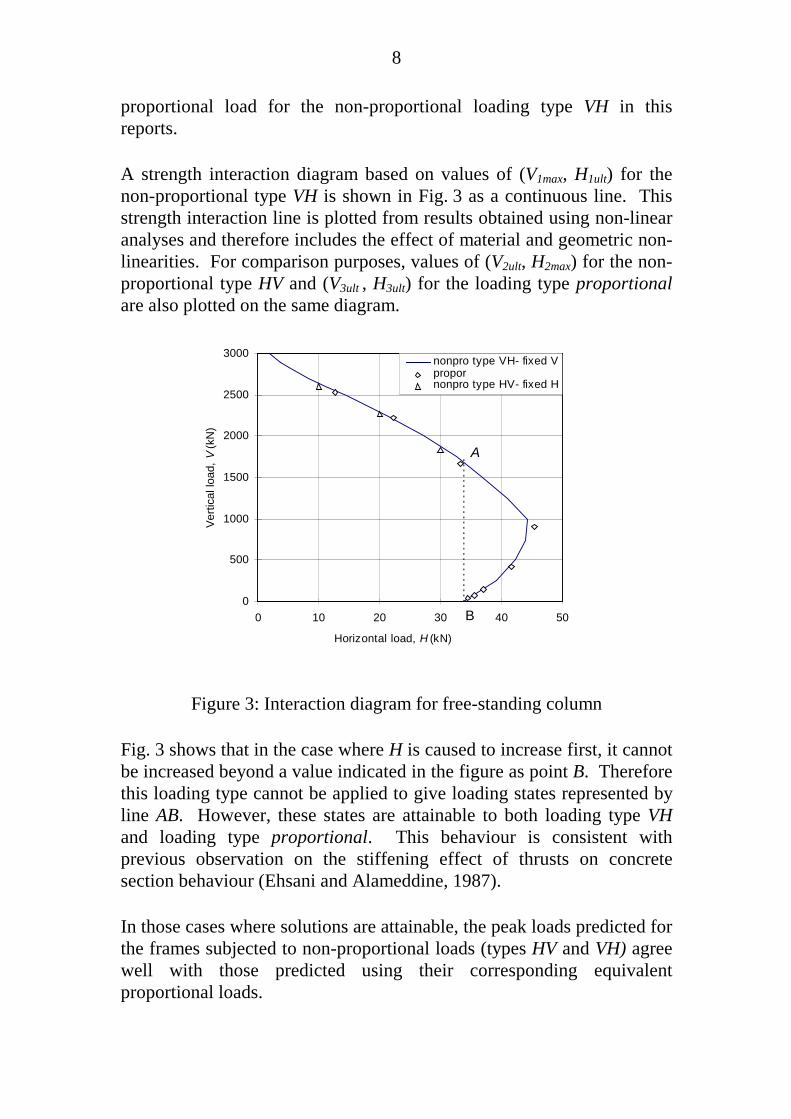
A strength interaction diagram based on values of (V1max, H1ult) for thenon-proportional type VH is shown in Fig. 3 as a continuous line. Thisstrength interaction line is plotted from results obtained using non-linearanalyses and therefore includes the effect of material and geometric non-linearities. For comparison purposes, values of (V2ult, H2max) for the non-proportional type HV and (V3ult , H3ult) for the loading type proportionalare also plotted on the same diagram.
0
500
1000
1500
2000
2500
3000
0 10 20 30 40 50
Horizontal load, H (kN)
Verti
cal l
oad,
V(k
N)
nonpro type VH- fixed Vpropornonpro type HV- fixed H
A
B
Figure 3: Interaction diagram for free-standing column
Fig. 3 shows that in the case where H is caused to increase first, it cannotbe increased beyond a value indicated in the figure as point B. Thereforethis loading type cannot be applied to give loading states represented byline AB. However, these states are attainable to both loading type VHand loading type proportional. This behaviour is consistent withprevious observation on the stiffening effect of thrusts on concretesection behaviour (Ehsani and Alameddine, 1987).
In those cases where solutions are attainable, the peak loads predicted forthe frames subjected to non-proportional loads (types HV and VH) agreewell with those predicted using their corresponding equivalentproportional loads.
9
4. PORTAL FRAMES
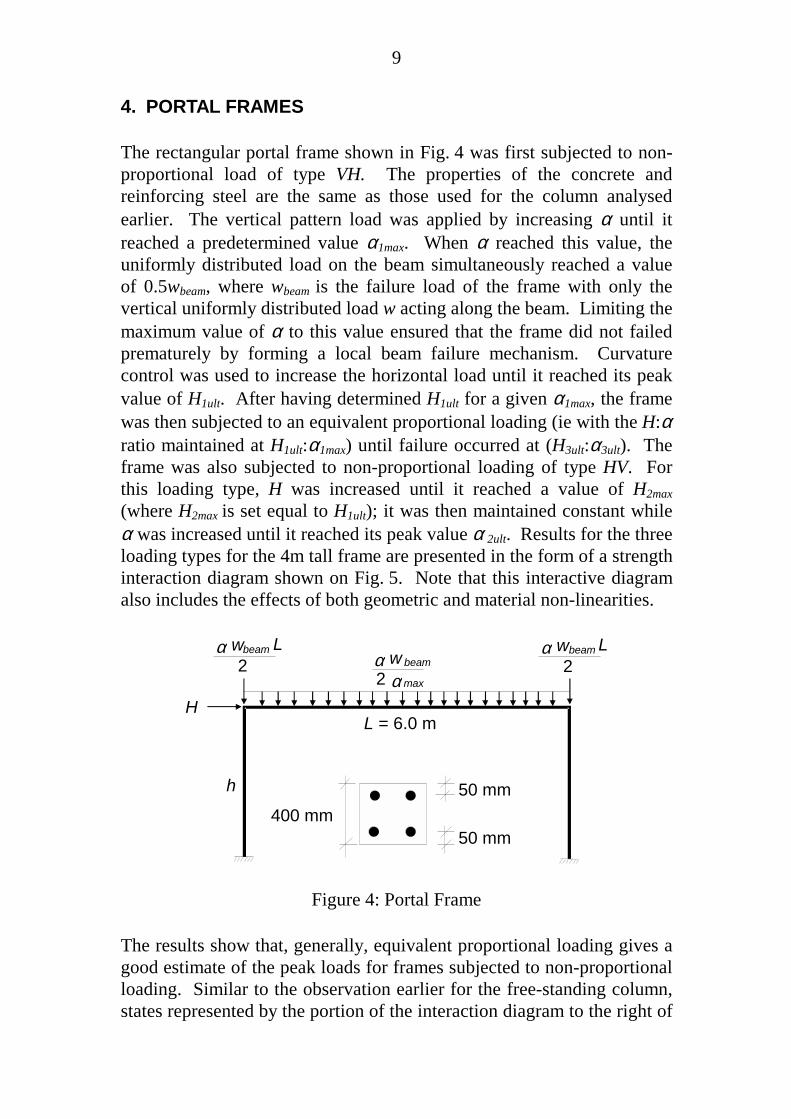
The rectangular portal frame shown in Fig. 4 was first subjected to non-proportional load of type VH. The properties of the concrete andreinforcing steel are the same as those used for the column analysedearlier. The vertical pattern load was applied by increasing α until itreached a predetermined value α1max. When α reached this value, theuniformly distributed load on the beam simultaneously reached a valueof 0.5wbeam, where wbeam is the failure load of the frame with only thevertical uniformly distributed load w acting along the beam. Limiting themaximum value of α to this value ensured that the frame did not failedprematurely by forming a local beam failure mechanism. Curvaturecontrol was used to increase the horizontal load until it reached its peakvalue of H1ult. After having determined H1ult for a given α1max, the framewas then subjected to an equivalent proportional loading (ie with the H:αratio maintained at H1ult:α1max) until failure occurred at (H3ult:α3ult). Theframe was also subjected to non-proportional loading of type HV. Forthis loading type, H was increased until it reached a value of H2max(where H2max is set equal to H1ult); it was then maintained constant whileα was increased until it reached its peak value α 2ult. Results for the threeloading types for the 4m tall frame are presented in the form of a strengthinteraction diagram shown on Fig. 5. Note that this interactive diagramalso includes the effects of both geometric and material non-linearities.
h
L = 6.0 m
400 mm 50 mm
50 mm
α w 2 α max
beamα w
2 beam Lα w
2 beam L
H
Figure 4: Portal Frame
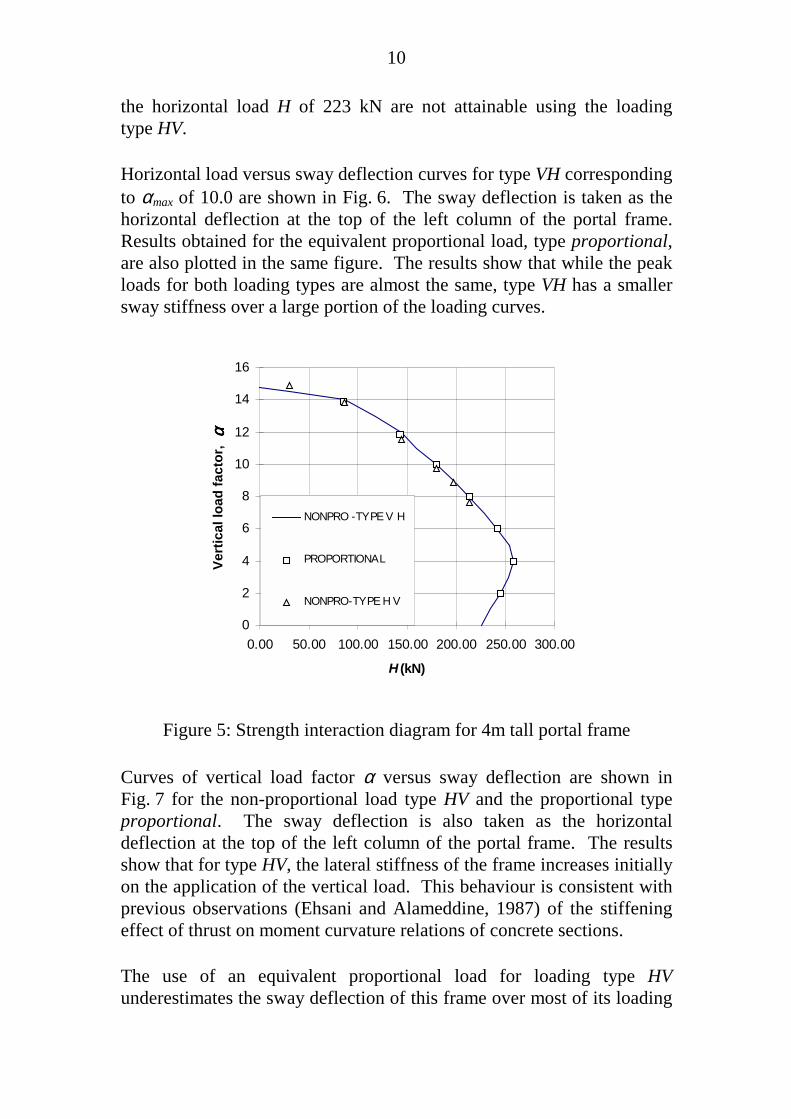
The results show that, generally, equivalent proportional loading gives agood estimate of the peak loads for frames subjected to non-proportionalloading. Similar to the observation earlier for the free-standing column,states represented by the portion of the interaction diagram to the right of
10
the horizontal load H of 223 kN are not attainable using the loadingtype HV.
Horizontal load versus sway deflection curves for type VH correspondingto αmax of 10.0 are shown in Fig. 6. The sway deflection is taken as thehorizontal deflection at the top of the left column of the portal frame.Results obtained for the equivalent proportional load, type proportional,are also plotted in the same figure. The results show that while the peakloads for both loading types are almost the same, type VH has a smallersway stiffness over a large portion of the loading curves.
0
2
4
6
8
10
12
14
16
0.00 50.00 100.00 150.00 200.00 250.00 300.00
H (kN)
Vert
ical
load
fact
or,
αα αα
NONPRO -TYPE V H
PROPORTIONAL
NONPRO-TYPE H V
Figure 5: Strength interaction diagram for 4m tall portal frame
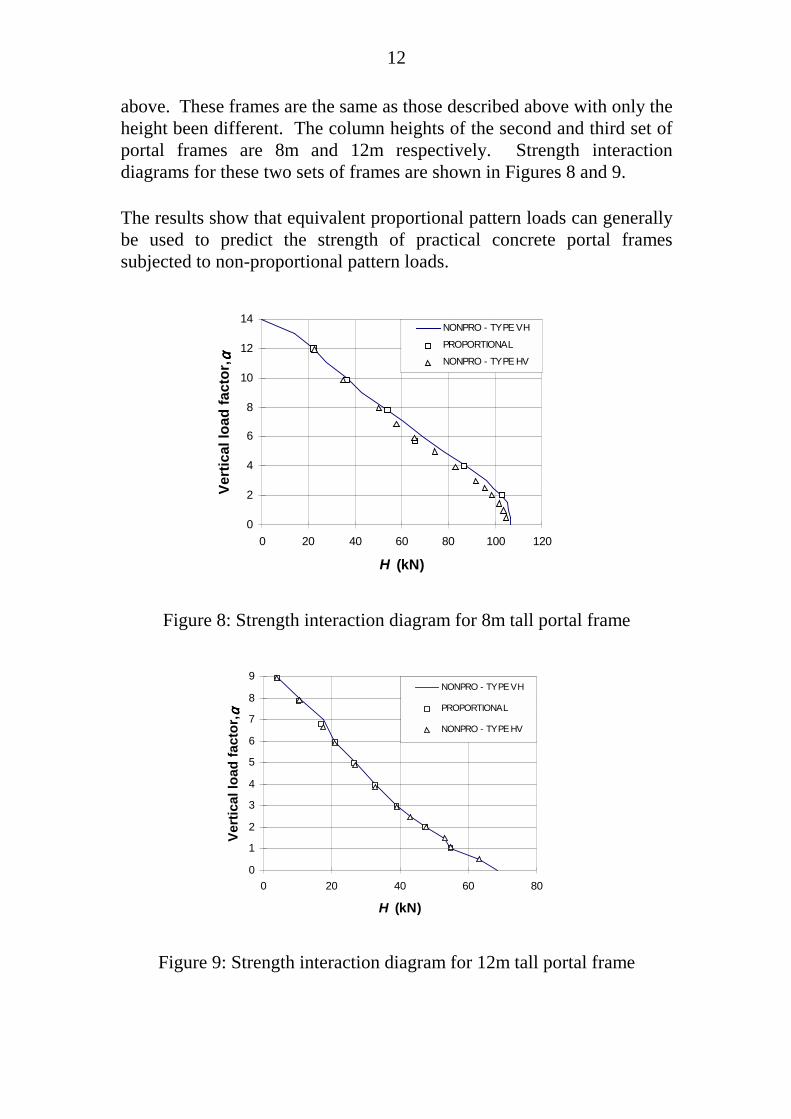
Curves of vertical load factor α versus sway deflection are shown inFig. 7 for the non-proportional load type HV and the proportional typeproportional. The sway deflection is also taken as the horizontaldeflection at the top of the left column of the portal frame. The resultsshow that for type HV, the lateral stiffness of the frame increases initiallyon the application of the vertical load. This behaviour is consistent withprevious observations (Ehsani and Alameddine, 1987) of the stiffeningeffect of thrust on moment curvature relations of concrete sections.
The use of an equivalent proportional load for loading type HVunderestimates the sway deflection of this frame over most of its loading
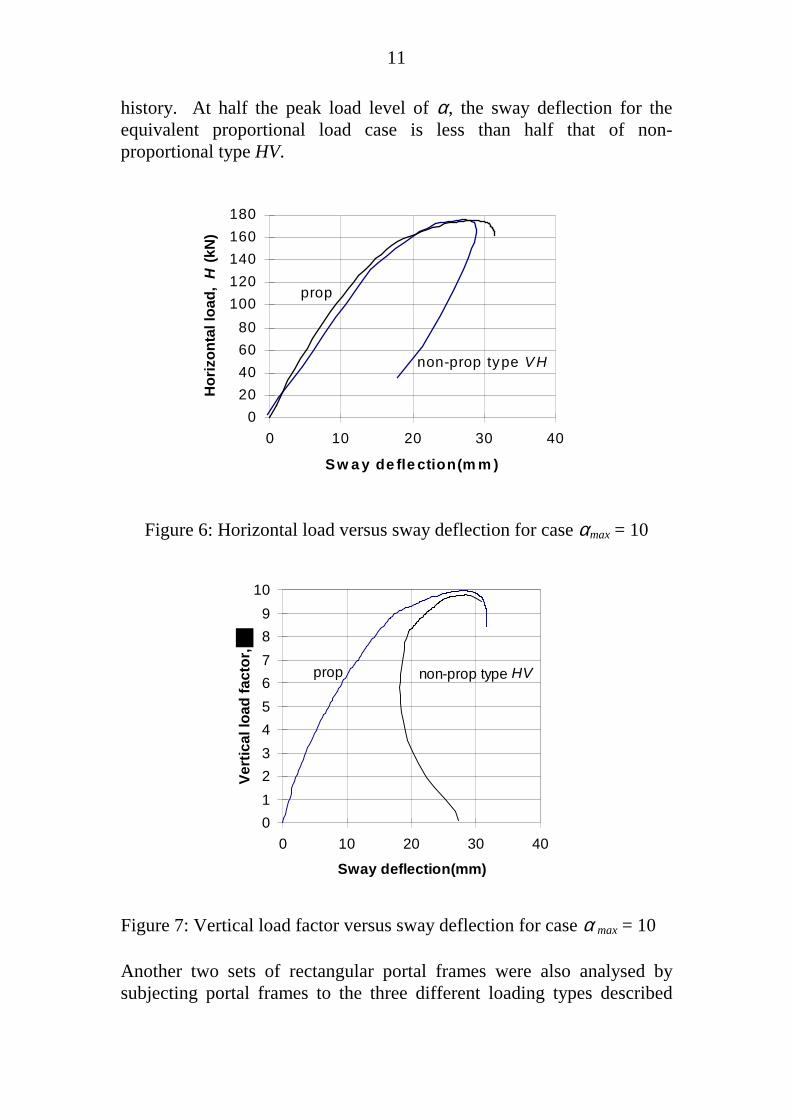
11
history. At half the peak load level of α, the sway deflection for theequivalent proportional load case is less than half that of non-proportional type HV.
020406080
100120140160180
0 10 20 30 40
Sw a y de fle ction(m m )
Hor
izon
tal l
oad,
H (k
N)
prop
non-prop type VH
Figure 6: Horizontal load versus sway deflection for case αmax = 10
0123456789
10
0 10 20 30 40
Sway deflection(mm)
Vert
ical
load
fact
or,
prop non-prop type HV
Figure 7: Vertical load factor versus sway deflection for case α max = 10
Another two sets of rectangular portal frames were also analysed bysubjecting portal frames to the three different loading types described
12
above. These frames are the same as those described above with only theheight been different. The column heights of the second and third set ofportal frames are 8m and 12m respectively. Strength interactiondiagrams for these two sets of frames are shown in Figures 8 and 9.
The results show that equivalent proportional pattern loads can generallybe used to predict the strength of practical concrete portal framessubjected to non-proportional pattern loads.
0
2
4
6
8
10
12
14
0 20 40 60 80 100 120
H (kN)
Vert
ical
load
fact
or, αα αα
NONPRO - TYPE VH
PROPORTIONAL
NONPRO - TYPE HV
Figure 8: Strength interaction diagram for 8m tall portal frame
0
1
2
3
4
5
6
7
8
9
0 20 40 60 80
H (kN)
Vert
ical
load
fact
or, αα αα
NONPRO - TYPE VH
PROPORTIONAL
NONPRO - TYPE HV
Figure 9: Strength interaction diagram for 12m tall portal frame
13
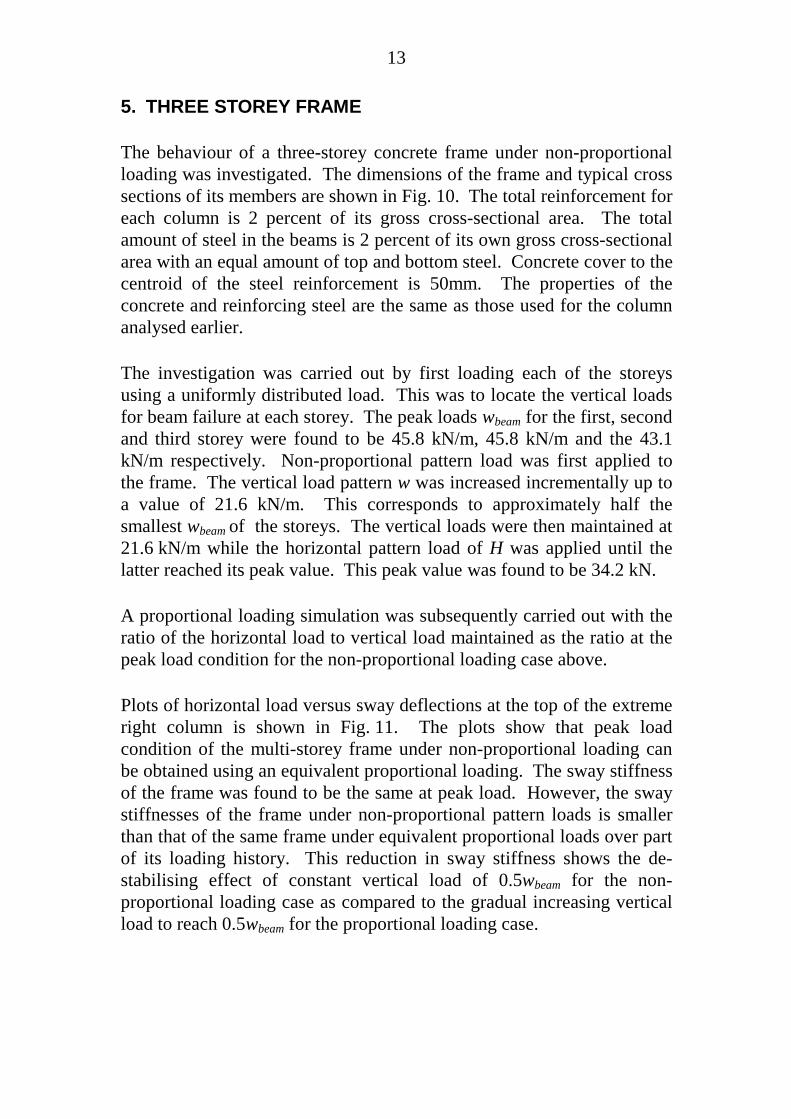
5. THREE STOREY FRAME
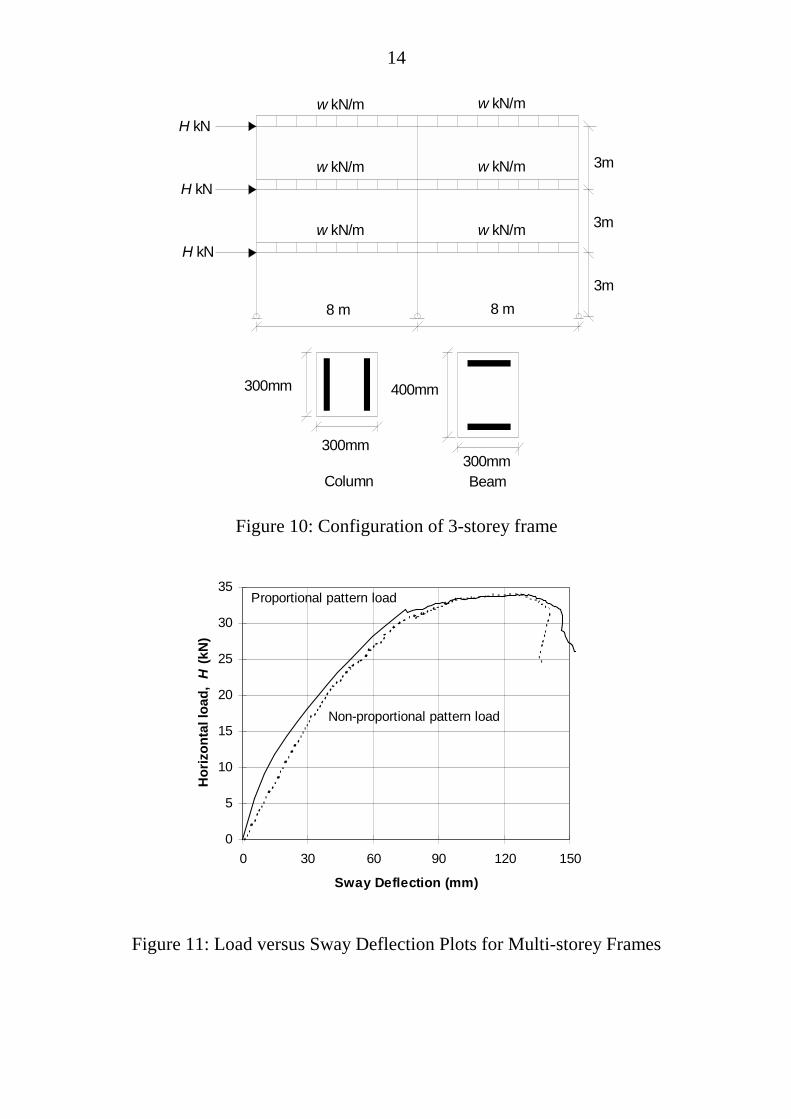
The behaviour of a three-storey concrete frame under non-proportionalloading was investigated. The dimensions of the frame and typical crosssections of its members are shown in Fig. 10. The total reinforcement foreach column is 2 percent of its gross cross-sectional area. The totalamount of steel in the beams is 2 percent of its own gross cross-sectionalarea with an equal amount of top and bottom steel. Concrete cover to thecentroid of the steel reinforcement is 50mm. The properties of theconcrete and reinforcing steel are the same as those used for the columnanalysed earlier.
The investigation was carried out by first loading each of the storeysusing a uniformly distributed load. This was to locate the vertical loadsfor beam failure at each storey. The peak loads wbeam for the first, secondand third storey were found to be 45.8 kN/m, 45.8 kN/m and the 43.1kN/m respectively. Non-proportional pattern load was first applied tothe frame. The vertical load pattern w was increased incrementally up toa value of 21.6 kN/m. This corresponds to approximately half thesmallest wbeam of the storeys. The vertical loads were then maintained at21.6 kN/m while the horizontal pattern load of H was applied until thelatter reached its peak value. This peak value was found to be 34.2 kN.
A proportional loading simulation was subsequently carried out with theratio of the horizontal load to vertical load maintained as the ratio at thepeak load condition for the non-proportional loading case above.
Plots of horizontal load versus sway deflections at the top of the extremeright column is shown in Fig. 11. The plots show that peak loadcondition of the multi-storey frame under non-proportional loading canbe obtained using an equivalent proportional loading. The sway stiffnessof the frame was found to be the same at peak load. However, the swaystiffnesses of the frame under non-proportional pattern loads is smallerthan that of the same frame under equivalent proportional loads over partof its loading history. This reduction in sway stiffness shows the de-stabilising effect of constant vertical load of 0.5wbeam for the non-proportional loading case as compared to the gradual increasing verticalload to reach 0.5wbeam for the proportional loading case.
14
w kN/m
w kN/m
w kN/m
w kN/m
w kN/mw kN/m
H kN
H kN
H kN
8 m
3m
8 m
3m
3m
300mm
300mm300mm
400mm
Column Beam
Figure 10: Configuration of 3-storey frame
0
5
10
15
20
25
30
35
0 30 60 90 120 150
Sway Deflection (mm)
Hor
izon
tal l
oad,
H (k
N)
Proportional pattern load
Non-proportional pattern load
Figure 11: Load versus Sway Deflection Plots for Multi-storey Frames
15
6. CONCLUDING REMARKS
A curvature-controlled based procedure has been developed which isefficient for tracing the full-range behaviour of non-linear reinforcedconcrete frames under non-proportional pattern loads. The superiority ofthe approach is that throughout the entire range, a key-segmentcurvature-controlled procedure is used. This approach is complementaryto an earlier approach developed to study concrete frames underproportional loading. Both are currently being used to study the non-linear behaviour of concrete frames with the ultimate aim of developing acomputer-based method for non-linear design of concrete structures.
Load versus deflection relations for columns and frames under non-proportional loading have been obtained. They were compared withthose obtained for corresponding frames under equivalent proportionalloadings. Results obtained show that an equivalent proportional patternload may be used to predict the peak loads for a structure subjected tonon-proportional load patterns.
Results obtained show that for unbraced practical frames designed tocarry predominantly vertical loads, the peak load is virtually independentof the loading paths taken.
7. REFERENCES
Crisfield, M.A. (1983), “An Arc-Length Method Including Line Searchesand Accelerations,” International Journal for Numerical Methods inEngineering, Vol.19, pp.1269-1289.
Ehsani, M.R. and Alameddine, F. (1987), “Refined Stiffness of SlenderCircular Reinforced Concrete Columns,” ACI Structural Journal,Vol.84, No.5, Sept.-Oct., pp.419-427.
Kawano, A. and Warner, R.F. (1995), “Nonlinear Analysis of the Time-Dependent Behaviour of Reinforced Concrete Frames,” ResearchReport No R125, Department of Civil and EnvironmentalEngineering, The University of Adelaide, January 1995, 41 pp.
16
Kenyon, J.M and Warner, R.F. (1993), “Refined Analysis of Non-LinearBehaviour of Concrete Structures,” Civil Engineering Transactions,Institution of Engineers Australia, Vol CE35, No 3, August 1993,pp.213-220.
Warner, R.F. (1975), “Segmental Analysis for Non-linear ConcreteFrames,” Fifth Australasian Conference on Mechanics of Structuresand Materials, University of Melbourne, pp.535-548.
Warner, R.F. and Yeo, M.F. (1984a) “Collapse Behaviour of ConcreteStructures with Limited Ductility,” Research Report No R61,Department of Civil Engineering, The University of Adelaide,January 1984, 41 pp.
Warner, R.F. and Yeo, M.F. (1984b), “Ductility Requirements forPartially Prestressed Concrete,” Proceedings of the NATO AdvancedResearch Workshop on ‘Partially Prestressing, From Theory toPractice’, Paris, France, June, pp.315-326.
Wong, K.W. and Warner, R.F.(1988), “Analysis and Design of SlenderConcrete Frames by Computer,” The Second InternationalConference on Computer Applications in Concrete, SingaporeConcrete Institute, March 1988, pp.I58-I66.
Wong, K.W. and Warner, R.F. (1990), “Middle Tier Analysis and Designof Slender Concrete Columns,” Twelfth Australiasian Conferenceon the Mechanics of Structures and Materials, QueenlandUniversity of Technology, pp.163-168.
Wong, K.W., Yeo, M.F. and Warner, R.F. ( 1988), “Non-linearBehaviour of Reinforced Concrete Frames,” Civil EngineeringTransactions, Institution of Engineers Australia, Vol CE30, No 2,July 1988, pp.57- 65.
Wong, K.W., Yeo, M.F. and Warner, R.F. (1990), “Collapse Behaviourand Strength of Slender Concrete Frames,” Proceedings, GeorgeSved Symposium, University of Adelaide, May, pp.394-408.
A1
APPENDIX A: CURVATURE CONTROL PROCEDURE FORCONCRETE FRAMES SUBJECTED TO PROPORTIONALPATTERN LOAD.
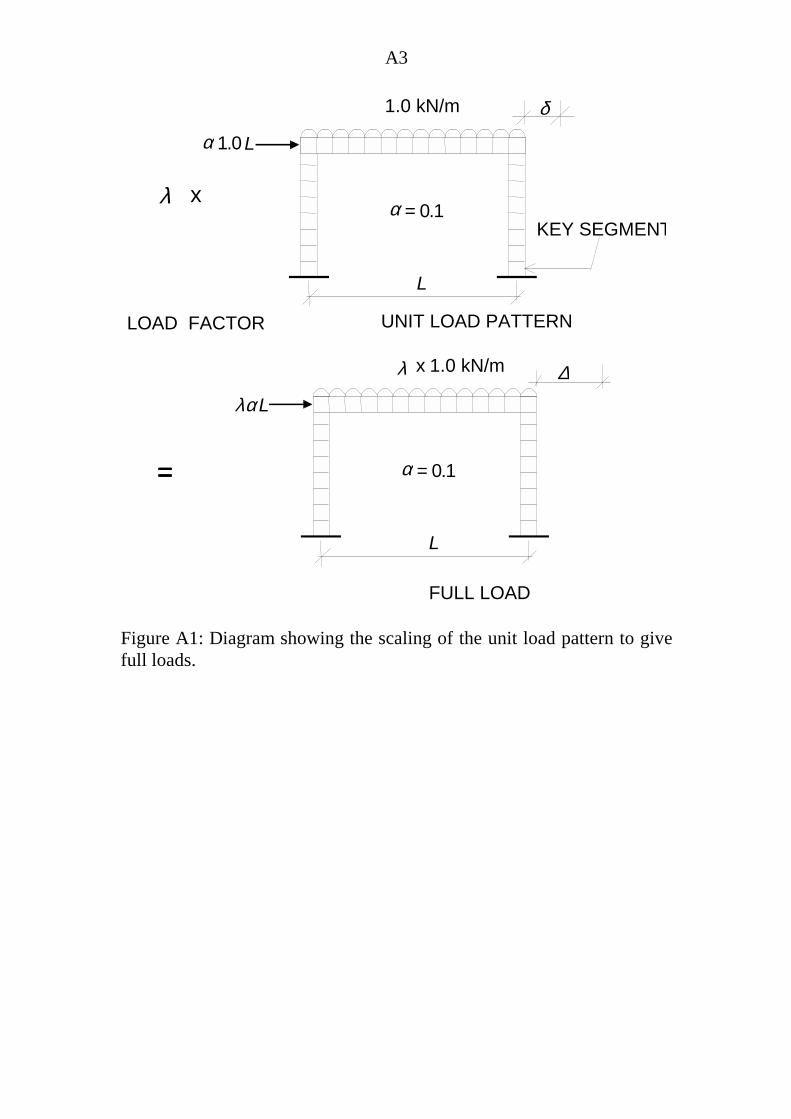
The concrete frame to be analysed is subjected to a unit load pattern.This unit load pattern may be a combination of several vertical andhorizontal loads. At any stage during the analysis, the total load is equalto the unit load pattern scaled by a load factor. An example of a framewith a unit load pattern comprising of a vertical udl load of w =1.0 kN/malong the beam and a horizontal load of αwL at beam level, where α =0.1, is shown in Fig. A1.
The frame is modelled by dividing it into numerous segments and each ofthese segments is assumed to have uniform flexural stiffness equal to thatof the most critically stressed section within it. The section behaviour ismodelled by dividing it into numerous concrete and steel layers. Theconcrete layers are assumed to have a non-linear stress-strain relation,and the steel layers are assumed to have a linearly elastic-plastic stress-strain relation. These stress-strain relations allow for unloading pathsdue to strain reversal. Structural members such as beams and columnsare assumed to have equal size segments. The number of segmentschosen to represent each member should give a length to depth ratio ofapproximately unity.
An incremental-iterative curvature control solution strategy is used. Thefull range behaviour is obtained by subjecting a nominated key segmentto increasing curvatures. This key segment is selected at the start of theanalysis. A basis for this selection is that it has monotonically increasingcurvatures as the loading process progresses. At the start of a typicalcurvature-increment step, the targeted curvature for the key segment iscalculated by adding a preset curvature increment to the targetedcurvature of the preceding step. The load factor consistent with thistargeted curvature in the key segment is then determined by carrying outseveral iterative cycles of calculations until convergence is achieved.
Computational steps required for a typical iterative cycle within anincremental step which has been assigned a targeted curvature Kstep are :
(1)The frame with the latest full-load stiffnesses EIi in all the segments issubjected to the unit load pattern. A second order elastic analysisroutine is used to determine unit curvatures k1, k2,...., kkey, ki, ....., knseg
A2
in all the segments. A second-order elastic analysis is one whichtakes into consideration the geometrical nonlinearity effects. If this isthe first cycle, then these stiffnesses are set to those calculated at theend of the previous step, else these stiffnesses are set to thosecalculated at the end of the previous cycle.
(2) The load factor to give the key segment a curvature of Kstep is thencalculated:
key
stepk
K=λ (A1)
(3) After having calculated λ, it is used to scale the unit curvatures of thesegments to give corresponding total curvatures. The term totalcurvature here means curvature under full loading.
ii kK ×= λ (A2)
(4) For each segment i with curvatures Ki, a section analysis routinewhich takes into account the material stress-strain relations is used tocalculate the corresponding bending moment, Mi.
The stiffnesses of all the segments are updated:
ii
i KMEI = (A3)
(5) Convergence of the EIi values is checked at this stage. Ifconvergence is achieved, a solution has been obtained for the presentcurvature step. The targeted curvature is then set to that of the nextstep. Proceed to step (1) to start a new set of iterative cycles. Ifconvergence is not achieved then proceed to step (1) maintaining thepresent targeted curvature for more iterative cycles.
The solution procedure caters for both geometric and materialnonlinearities. The geometrical nonlinearity is taken into considerationwhen the second order elastic analysis is carried out, and the materialnon-linearity is taken into consideration when the section analysis is usedto update the stiffnesses of the segments.
A3
1.0 kN/m
λ x
α 1.0 L
L
α = 0.1
====
λ x 1.0 kN/m
λα L
L
α = 0.1
δ
∆
FULL LOAD
LOAD FACTOR UNIT LOAD PATTERN
KEY SEGMENT
Figure A1: Diagram showing the scaling of the unit load pattern to givefull loads.