
startling effect of ball scats removal on sag mill performance
Upload
nenad-djordjevicCategory
view
218download
0
This article is also available online at:
www.elsevier.com/locate/mineng
Minerals Engineering 19 (2006) 1505–1516
Modelling comminution patterns within a pilot scale AG/SAG mill
Nenad Djordjevic a, Rob Morrison a,*, Brian Loveday b, Paul Cleary c
a Julius Kruttschnitt Mineral Research Centre, The University of Queensland, Brisbane, Australiab University of Kwa-Zulu Natal, Durban, South Africa
c CSIRO Mathematical and Information Sciences, Clayton, Australia
Received 11 May 2006; accepted 7 July 2006Available online 12 September 2006
Abstract
The patterns of rock comminution within tumbling mills, as well as the nature of forces, are of significant practical importance. Dis-crete element modelling (DEM) has been used to analyse the pattern of specific energy applied to rock, in terms of spatial distributionwithin a pilot AG/SAG mill. We also analysed in some detail the nature of the forces, which may result in rock comminution.
In order to examine the distribution of energy applied within the mill, the DEM models were compared with measured particle masslosses, in small scale AG and SAG mill experiments. The intensity of contact stresses was estimated using the Hertz theory of elasticcontacts. The results indicate that in the case of the AG mill, the highest intensity stresses and strains are likely to occur deep withinthe charge, and close to the base. This effect is probably more pronounced for large AG mills. In the SAG mill case, the impacts ofthe steel balls on the surface of the charge are likely to be the most potent. In both cases, the spatial pattern of medium-to-high energycollisions is affected by the rotational speed of the mill.
Based on an assumed damage threshold for rock, in terms of specific energy introduced per single collision, the spatial pattern ofproductive collisions within each charge was estimated and compared with rates of mass loss. We also investigated the nature of thecomminution process within AG vs. SAG mill, in order to explain the observed differences in energy utilisation efficiency, betweentwo types of milling. All experiments were performed using a laboratory scale mill of 1.19 m diameter and 0.31 m length, equipped with14 square section lifters of height 40 mm.� 2006 Elsevier Ltd. All rights reserved.
Keywords: Discrete element method; Autogenous and semi-autogenous milling; Breakage
1. Introduction
The purpose of this work is to compare 3D Discrete Ele-ment Modelling (DEM) predictions with experimentalmeasurements of the power draw and fines production ina pilot scale AG/SAG mill (Loveday, 2004), in order tofacilitate interpretation of the detailed experimental results.In this modelling study, we were interested in the influenceof the grinding media on the energy that is consumedthrough abrasion. We are also interested in estimatingthe intensity of stresses acting on the contact areas between
0892-6875/$ - see front matter � 2006 Elsevier Ltd. All rights reserved.
doi:10.1016/j.mineng.2006.07.003
* Corresponding author. Tel.: +61 7 3365 5843; fax: +61 7 3365 5999.E-mail address: [email protected] (R. Morrison).
‘‘rock’’ particles. These stresses were estimated using theHertz theory of elastic contacts. The simulation resultsallow us to test hypotheses for the observed differencesbetween abrasion rates of AG and SAG mills. The resultsalso suggest that the intensity of normal pressure whichexists at contacts between rock ball and steel ball, variesto a large extent.
The highest contact stresses occur between rock andsteel balls. The contact stresses between rock particles,and rock and liner, are of about the same intensity, butappreciably lower than for steel/rock. Modelling has beenperformed using Particle Flow Code 3D (PFC3D) (Itasca,1999), which simulates behaviour of spherical shapedparticles.

1506 N. Djordjevic et al. / Minerals Engineering 19 (2006) 1505–1516
2. Experimental work
Physical experiments were performed on gold ore wasterock and quartzite rock from a quarry in the Durban area,South Africa. The experiments were performed using arubber-lined pilot scale mill with an inside diameter of1.19 m and length of 0.31 m. The mill was fitted withsquare section metal lifters with a height of 40 mm. Therotational velocity of the mill was 3.14 rad/s (�70% of crit-ical). The mill is flushed with a controlled flow of waterduring each test to rapidly discharge fine progeny. The testmill with the front cover removed is shown in Fig. 1.
Earlier work by Loveday and Naidoo (1997) showedthat the relative loss of mass in any particular operating
Fig. 1. Interior of the Loveday test mill.
0
200
400
600
800
1000
1200
1400
1600
1800
0 5 10 15 20
kWh/t of
Mill
Po
wer
Dra
w (
W)
AGSAG
Fig. 2. Power utilisation vs. power draw for the case o
configuration was approximately constant (after the initialrounding process was complete) for particles between 20and 80 mm. Hence, Loveday proposed a specific wear rateRs, defined as the rate (in terms of time) of loss of rockmass per unit mass:
Rs ¼ �dMdt
� �1
M
� �
The concept can be applied to individual particles or to acomplete mill charge. In the case of the pilot AG mill,the measured rate of rock particle mass loss was muchlower than in the case of SAG. This rate of mass loss alsocorrelated well with the frictional energy absorbed by eachparticle over a range of mill charge conditions. This workhas been reported by Morrison et al. (2006).
The pilot scale work covered a wide range of AG/SAGoperation with coarse and medium size rocks used as millcharge, as narrow size distributions, or as a mixture to gen-erate a wide size distribution. The medium size rocks were70–100 mm in diameter with typical masses of 0.5–2 kg.Large rocks were 100–135 mm with typical masses of 2–5 kg. All of the SAG tests were at a total mill load (ballsand rocks) of 30%, while the AG tests ranged from 20 to30% mill load.
These operating conditions generated a wide range ofparticle wear rates in terms of the energy required per unitmass as shown in Fig. 2. The power draw is the averageover a 12-minute test run.
Note that this way of looking at the data relates to millthroughput. It does not consider that the size distributionof the progeny may also vary with different mill operatingconditions. Hence, the energy efficiency evaluation in thispaper pertains to the energy efficiency of generation ofthroughput – NOT the more usual energy efficiency gener-
25 30 35 40 45
Mass Loss
f small test mill operated in AG and SAG mode.

0
200
400
600
800
1000
1200
1400
1600
1800
0 100 200 300 400 500 600
kWh/t of product/Charge Rock Mass
Mill
Po
wer
Dra
w (
W)
AGSAG
Fig. 3. Comminution of mill charge for unit input of energy, scaled by the rock load in the mill.
N. Djordjevic et al. / Minerals Engineering 19 (2006) 1505–1516 1507
ation of new surface or fine particles. However, for manySAG mill installations, the ability to achieve throughputis the most important economic consideration. The secondstage of grinding controls the fineness of the product.
An interesting difference in operation emerges if weconsider the mass loss in terms of the rock mass withinthe mill load. The dominant factor between high andlow reduction of charge mass appears likely to be the millload particle size. Fig. 3 shows mass loss scaled by rockload. The cluster of values at 400–500 kWh/t of productdivided by rock charge is for coarse rocks alone or withballs.
3. Modelling approach
PFC3D code models the behaviour of particles, whichmay be enclosed within a finite volume by non-deformablewalls. The code keeps a record of individual particles, andtheir trajectories which are updated after any contact withother particles or walls. Each calculation step includesapplication of the laws of motion to a particle, a force-dis-placement law to each contact, and constant updating ofwall position (Cundall and Strack, 1979).
The PFC3D modelling approach is based on theassumption that the individual particles (balls and rocks)are treated as non-breakable bodies. At contacts, the parti-cles can overlap to a relatively small extent. The magnitudeof the overlap is related to the contact force. The contactforce vector between two balls, or ball and wall, is com-posed of normal and shear components. The normal con-tact force vector is calculated using the formula:
F n ¼ K�nU �nni
where Kn is the normal stiffness at the contact, Un the rel-ative contact displacement in the normal direction and ni isthe unit normal vector.
The incremental shear force is calculated using theformula:
DF s ¼ �K�s DU s
where Ks is the shear stiffness at contact and DUs is theincremental shear displacement at contact.
In this modelling approach, contact normal stiffness andshear stiffness are calculated using the Hertz–Mindlin con-tact model, based on an approximation of the theory ofMindlin and Deresiewicz (1953). The model is defined byshear modulus and Poisson ratio of each of the two con-tacting bodies. For ball-to-ball interaction, the elasticproperties are taken to be the mean values. For ball-to-wallinteraction, the wall is assumed to be rigid; therefore, elas-tic properties of the ball are used.
PFC3D also includes a slip model. The slip model isdefined by the friction coefficient at the contact, wherethe active relevant friction coefficient is taken to be theminimum friction coefficient of the two contacting entities.Each contact is checked for slip conditions, by calculatingthe maximum allowable shear contact force:
F sðmaxÞ ¼ l�absðF nÞ
where l is the friction coefficient and Fn is the normal force.Frictional work is defined as the total cumulative energy
dissipated by frictional sliding at all contacts. Consideringthat the shape of the particles is spherical, calculated fric-tional energy relates to the steady state part of the physicalabrasion mill testing. The power of the mill is calculated foreach instant of time by summing products of moments that
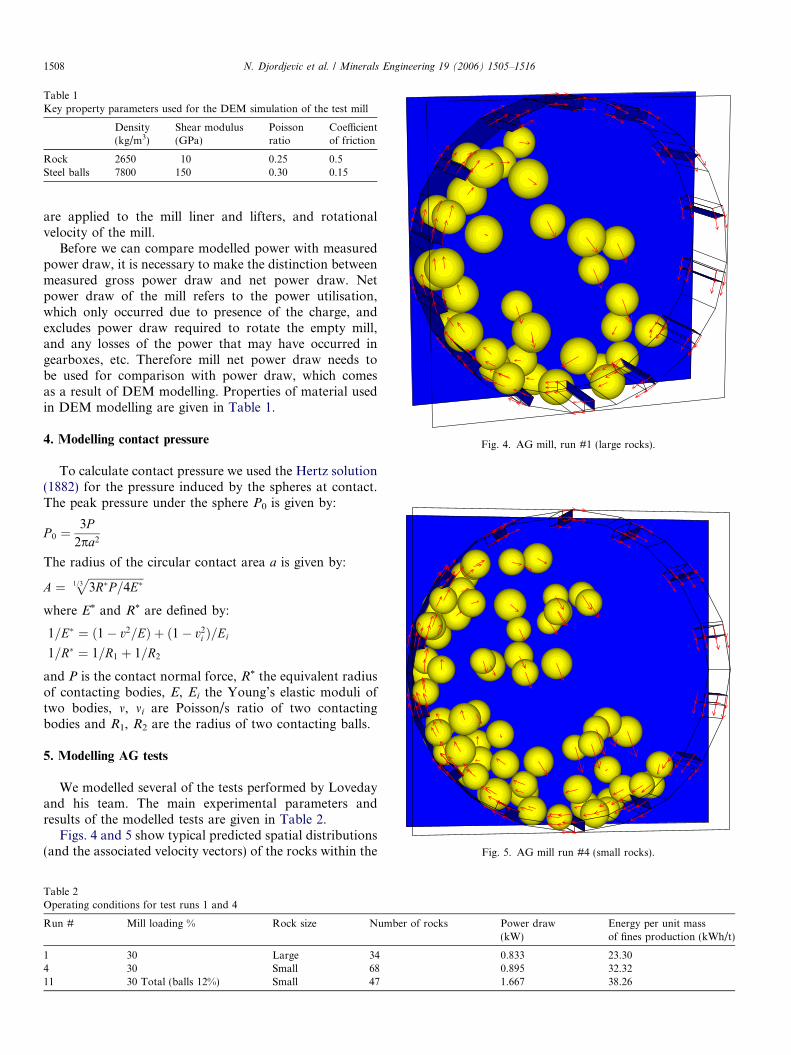
Table 1Key property parameters used for the DEM simulation of the test mill
Density(kg/m3)
Shear modulus(GPa)
Poissonratio
Coefficientof friction
Rock 2650 10 0.25 0.5Steel balls 7800 150 0.30 0.15
Fig. 4. AG mill, run #1 (large rocks).
Fig. 5. AG mill run #4 (small rocks).
1508 N. Djordjevic et al. / Minerals Engineering 19 (2006) 1505–1516
are applied to the mill liner and lifters, and rotationalvelocity of the mill.
Before we can compare modelled power with measuredpower draw, it is necessary to make the distinction betweenmeasured gross power draw and net power draw. Netpower draw of the mill refers to the power utilisation,which only occurred due to presence of the charge, andexcludes power draw required to rotate the empty mill,and any losses of the power that may have occurred ingearboxes, etc. Therefore mill net power draw needs tobe used for comparison with power draw, which comesas a result of DEM modelling. Properties of material usedin DEM modelling are given in Table 1.
4. Modelling contact pressure
To calculate contact pressure we used the Hertz solution(1882) for the pressure induced by the spheres at contact.The peak pressure under the sphere P0 is given by:
P 0 ¼3P
2pa2
The radius of the circular contact area a is given by:
A ¼ffiffiffiffiffiffiffiffiffiffiffiffiffiffiffiffiffiffiffiffi3R�P=4E�1=3
pwhere E* and R* are defined by:
1=E� ¼ ð1� v2=EÞ þ ð1� v2i Þ=Ei
1=R� ¼ 1=R1 þ 1=R2
and P is the contact normal force, R* the equivalent radiusof contacting bodies, E, Ei the Young’s elastic moduli oftwo bodies, m, mi are Poisson/s ratio of two contactingbodies and R1, R2 are the radius of two contacting balls.
5. Modelling AG tests
We modelled several of the tests performed by Lovedayand his team. The main experimental parameters andresults of the modelled tests are given in Table 2.
Figs. 4 and 5 show typical predicted spatial distributions(and the associated velocity vectors) of the rocks within the
Table 2Operating conditions for test runs 1 and 4
Run # Mill loading % Rock size Number of rocks Power draw(kW)
Energy per unit massof fines production (kWh/t)
1 30 Large 34 0.833 23.304 30 Small 68 0.895 32.3211 30 Total (balls 12%) Small 47 1.667 38.26

N. Djordjevic et al. / Minerals Engineering 19 (2006) 1505–1516 1509
pilot mill for mill charges of large and small rocks respec-tively. It is apparent that the smaller rocks are lifted a littlehigher than the large ones as their centres of mass are closerto the mill shell than the outer edge of the lifter bar. Thesmaller particles in Fig. 4 are within the size range for‘‘large’’ particles. The measured initial mass of each parti-cle is being modelled.
From the observed forces, material parameters and balldimensions, contact pressures were calculated. In Fig. 6,contact pressure between a selected particle and other par-ticles is presented as function of time. The maximum inten-sity of contact pressure is in the range of 200–500 MPa,which is higher than typical uniaxial compressive strengthof many rocks. Considering DEM used non-breakable,
0.0E+00
2.0E+08
4.0E+08
6.0E+08
8.0E+08
1.0E+09
0.0E+00 2.0E+00 4.0E+00 6.0E+00 8.0E+00 1.0E+01 1.2E+01time (sec)
aver
age
cont
act p
ress
ure
(Pa)
Fig. 6. Time history of average contact pressure between a sampled rockparticle and other particles for the case of AG test mill (run #4).
Fig. 7. Time history of average vertical stress within
elastic balls, in real life such high pressures will not occur,due to localised yielding (rock damage) at contact points,which will result in the increase of contact area anddecrease of contact pressure.
Based on the intensity and the character of forces thatare acting on a selected particle, the stress field within theparticle was calculated. Previous graphs described contactpressure. The average contact stress within particles is cal-culated from the contact forces and the size of the particle.Fig. 7 presents the time history of vertical stress within theselected particle. By convention, compressive stress isshown as negative and tensile stress is shown as positive.Fig. 7 shows that the selected particle experiences both ten-sile and compressive stresses. Usually, the compressivestresses are much larger – as might be expected – but occa-sionally the tensile stresses are of the same order ofmagnitude.
The relatively modest values of the dominant stresscomponent (�2 MPa in compression and about 0.1 MPain tension), are not unexpected considering the small sizeof the mill. This also suggests that the dominant mode ofsize reduction in small test mills, will result from localisedfailure at contact points, and not as the result of singularimpact inducing tensile cracking across the entire lengthof the particle. In the case of large mills with much higherimpact velocities (�10 m/s), much higher stresses withinparticles will be induced, probably resulting in fragmenta-tion of smaller particles.
the sample particle of the AG test mill (run #4).
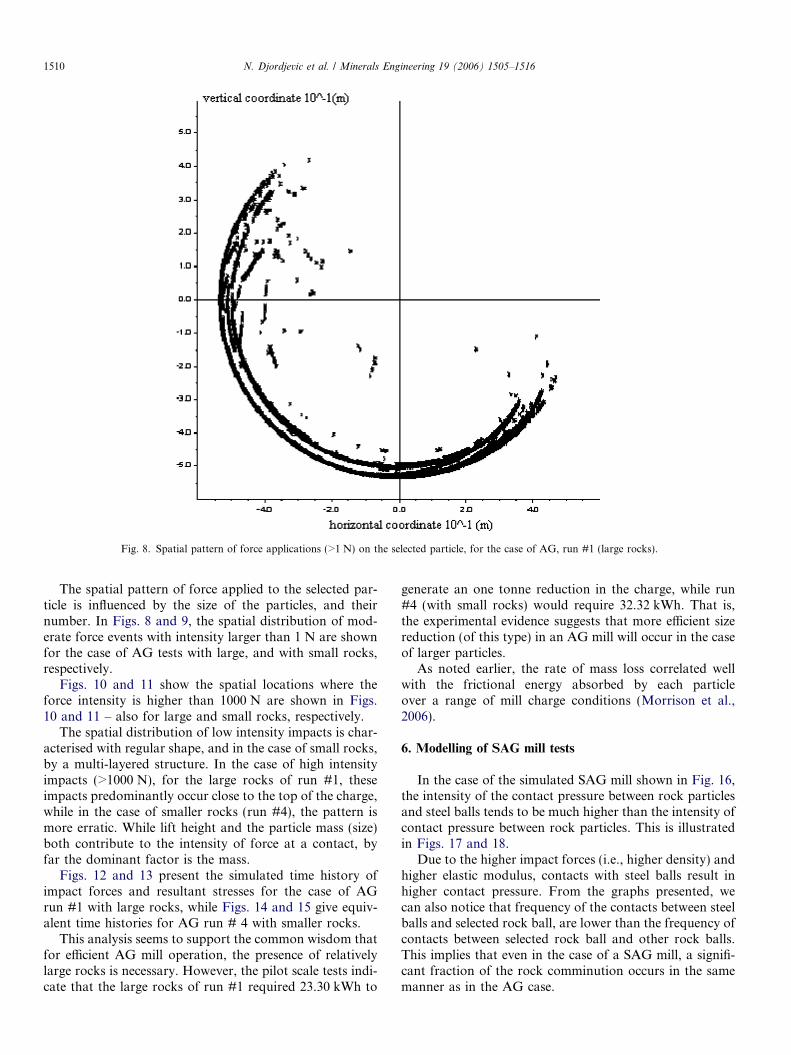
Fig. 8. Spatial pattern of force applications (>1 N) on the selected particle, for the case of AG, run #1 (large rocks).
1510 N. Djordjevic et al. / Minerals Engineering 19 (2006) 1505–1516
The spatial pattern of force applied to the selected par-ticle is influenced by the size of the particles, and theirnumber. In Figs. 8 and 9, the spatial distribution of mod-erate force events with intensity larger than 1 N are shownfor the case of AG tests with large, and with small rocks,respectively.
Figs. 10 and 11 show the spatial locations where theforce intensity is higher than 1000 N are shown in Figs.10 and 11 – also for large and small rocks, respectively.
The spatial distribution of low intensity impacts is char-acterised with regular shape, and in the case of small rocks,by a multi-layered structure. In the case of high intensityimpacts (>1000 N), for the large rocks of run #1, theseimpacts predominantly occur close to the top of the charge,while in the case of smaller rocks (run #4), the pattern ismore erratic. While lift height and the particle mass (size)both contribute to the intensity of force at a contact, byfar the dominant factor is the mass.
Figs. 12 and 13 present the simulated time history ofimpact forces and resultant stresses for the case of AGrun #1 with large rocks, while Figs. 14 and 15 give equiv-alent time histories for AG run # 4 with smaller rocks.
This analysis seems to support the common wisdom thatfor efficient AG mill operation, the presence of relativelylarge rocks is necessary. However, the pilot scale tests indi-cate that the large rocks of run #1 required 23.30 kWh to
generate an one tonne reduction in the charge, while run#4 (with small rocks) would require 32.32 kWh. That is,the experimental evidence suggests that more efficient sizereduction (of this type) in an AG mill will occur in the caseof larger particles.
As noted earlier, the rate of mass loss correlated wellwith the frictional energy absorbed by each particleover a range of mill charge conditions (Morrison et al.,2006).
6. Modelling of SAG mill tests
In the case of the simulated SAG mill shown in Fig. 16,the intensity of the contact pressure between rock particlesand steel balls tends to be much higher than the intensity ofcontact pressure between rock particles. This is illustratedin Figs. 17 and 18.
Due to the higher impact forces (i.e., higher density) andhigher elastic modulus, contacts with steel balls result inhigher contact pressure. From the graphs presented, wecan also notice that frequency of the contacts between steelballs and selected rock ball, are lower than the frequency ofcontacts between selected rock ball and other rock balls.This implies that even in the case of a SAG mill, a signifi-cant fraction of the rock comminution occurs in the samemanner as in the AG case.

Fig. 9. Spatial pattern of force applications (>1 N) on the selected particle, for the case of AG, run #4 (small rocks).
N. Djordjevic et al. / Minerals Engineering 19 (2006) 1505–1516 1511
The mass of each steel ball used in these experimentswas about 1.74 kg, which is significantly less than the aver-age mass of typical rock particles (�3.3 kg) (AG run #1).Also it is important to note that the friction coefficient ofsteel is lower than the friction coefficient of rock (inDEM modelling coefficient of friction of steel was 0.15,while coefficient of friction of rock is 0.5). Due to lowermass of the steel balls, maximum force that can be inducedby the steel ball must be lower than the average force thatcan be induced by the falling rock, under otherwise identi-cal conditions.
Considering that the average diameter of the rock,assuming spherical shape and density of 2650 kg/m3, is134 mm, and that the diameter of the steel balls is76 mm, it is reasonable to expect that lifting of the steelballs will be more efficient than lifting of the rocks (the lif-ter height 40 mm). Due to the higher drop off height, thefinal impact velocity of the steel balls will be higher thanthe impact velocity of a typical rock. However, due to smallsize (diameter 1.19 m) of the mill, a relatively small changein the drop heights cannot generate substantial differencesin the available impact energies.
Even considering that impact force will be quite similarin both cases, the shear forces at contact of rock–rock and
rock–steel will be different, due to the much lower coeffi-cient of friction of steel. Therefore, the abrasive work(modelled in DEM as cumulative slip work), will not bevery different. The larger impact velocities of the steel ballswill be to a large extent balanced by the lower coefficient offriction of steel.
What will be different will be the size of the contactarea between steel balls and rock vs. rock and rock.Due to the smaller dimension of the steel balls, andhigher elastic modulus, the contact area between themwill be significantly smaller in the case of rock–steel con-tact vs. rock–rock contact. This will mean that averageand maximum contact pressures within the contact area,will be significantly higher in the case of steel–rock con-tact than in the case rock–rock contact. Higher contactpressure will result in more efficient development oftensile cracks along the periphery of the contacts. Thesecracks may result in instant abrasion, or may facili-tate more efficient rock abrasion during subsequentcollisions.
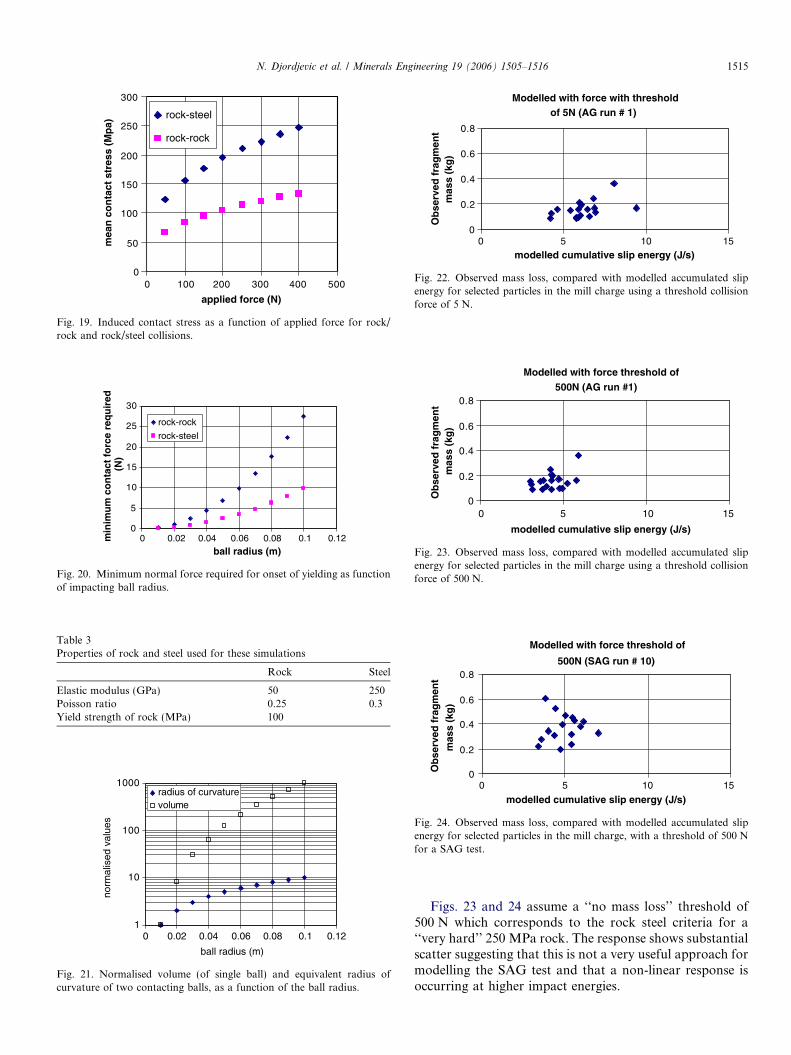
Based on the elastic properties of rock and steel, thecontact stress induced between average sized rocks andsteel balls varies as a function of the applied force as pre-sented in Fig. 19.
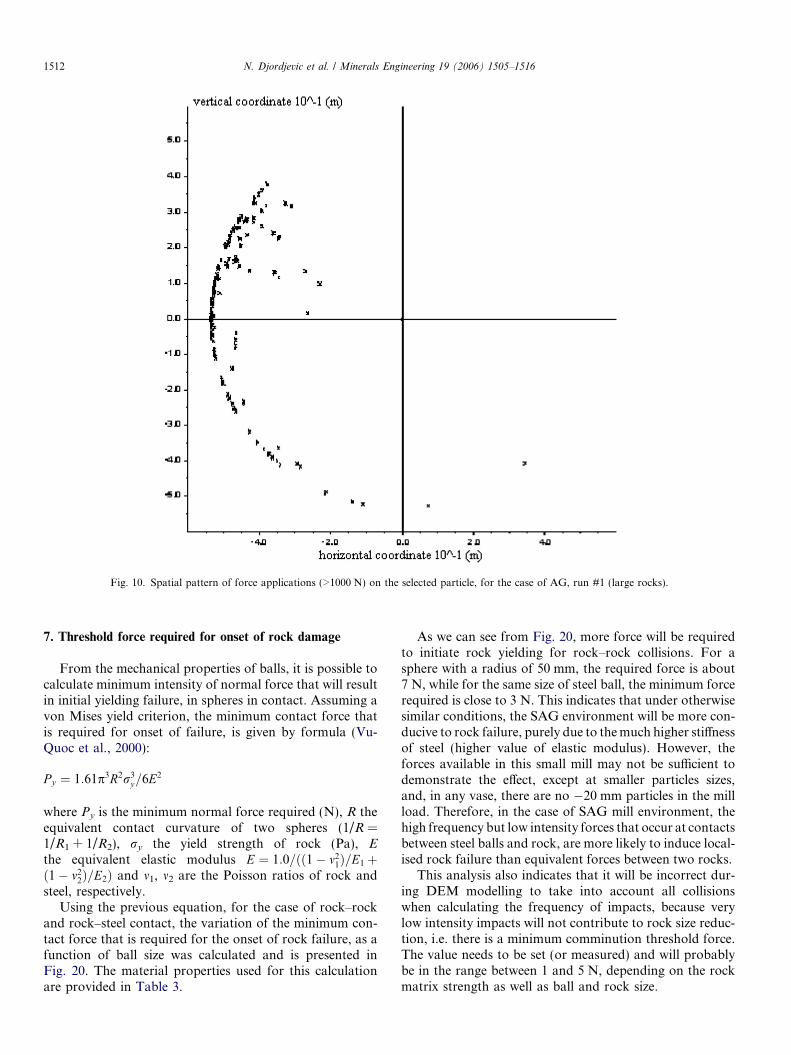
Fig. 10. Spatial pattern of force applications (>1000 N) on the selected particle, for the case of AG, run #1 (large rocks).
1512 N. Djordjevic et al. / Minerals Engineering 19 (2006) 1505–1516
7. Threshold force required for onset of rock damage
From the mechanical properties of balls, it is possible tocalculate minimum intensity of normal force that will resultin initial yielding failure, in spheres in contact. Assuming avon Mises yield criterion, the minimum contact force thatis required for onset of failure, is given by formula (Vu-Quoc et al., 2000):
P y ¼ 1:61p3R2r3y=6E2
where Py is the minimum normal force required (N), R theequivalent contact curvature of two spheres (1/R =1/R1 + 1/R2), ry the yield strength of rock (Pa), E
the equivalent elastic modulus E ¼ 1:0=ðð1� m21Þ=E1þ
ð1� m22Þ=E2Þ and m1, m2 are the Poisson ratios of rock and
steel, respectively.Using the previous equation, for the case of rock–rock
and rock–steel contact, the variation of the minimum con-tact force that is required for the onset of rock failure, as afunction of ball size was calculated and is presented inFig. 20. The material properties used for this calculationare provided in Table 3.
As we can see from Fig. 20, more force will be requiredto initiate rock yielding for rock–rock collisions. For asphere with a radius of 50 mm, the required force is about7 N, while for the same size of steel ball, the minimum forcerequired is close to 3 N. This indicates that under otherwisesimilar conditions, the SAG environment will be more con-ducive to rock failure, purely due to the much higher stiffnessof steel (higher value of elastic modulus). However, theforces available in this small mill may not be sufficient todemonstrate the effect, except at smaller particles sizes,and, in any vase, there are no �20 mm particles in the millload. Therefore, in the case of SAG mill environment, thehigh frequency but low intensity forces that occur at contactsbetween steel balls and rock, are more likely to induce local-ised rock failure than equivalent forces between two rocks.
This analysis also indicates that it will be incorrect dur-ing DEM modelling to take into account all collisionswhen calculating the frequency of impacts, because verylow intensity impacts will not contribute to rock size reduc-tion, i.e. there is a minimum comminution threshold force.The value needs to be set (or measured) and will probablybe in the range between 1 and 5 N, depending on the rockmatrix strength as well as ball and rock size.

Fig. 11. Spatial pattern of force applications (>1000 N) on the selected particle, for the case of AG, run #4 (small rocks).
0.E+00
1.E+04
2.E+04
3.E+04
4.E+04
5.E+04
6.E+04
0 4 10 12time (sec)
forc
e (N
)
2 6 8
Fig. 12. Time history of forces applied to the selected particle, AG run #1.
—3.0E+06
—2.5E+06
—2.0E+06
—1.5E+06
—1.0E+06
—5.0E+05
0.0E+00
5.0E+05
0 6 10 12time (sec)
vert
ical
str
ess
(Pa)
82 4
Fig. 13. Time history of vertical stress within the selected particle, AG run#1.
0.E+00
1.E+04
2.E+04
3.E+04
4.E+04
5.E+04
6.E+04
0 4 10 12time (sec)
forc
e (N
)
2 6 8
Fig. 14. Time history of forces applied to the selected particle, AG run #4.
N. Djordjevic et al. / Minerals Engineering 19 (2006) 1505–1516 1513
There is also likely to be an increase in the minimumforce required with any increase in the size of the spheres,due to the increased radius of curvature, and therefore sizeof the contact area. However, this will be more than com-pensated for by the increase of available force, due toincrease of the volume (mass) of contacting spheres, asshown in Fig. 21. Hence, larger balls, for a given impactvelocity, will be much more potent in rock damage, thansmaller balls.
This hypothesis can be related to the pilot scale testwork by comparing the accumulated slip energy (simu-lated) for each particle, with the measured mass loss fromeach particle (see Fig. 22).

Fig. 15. Time history of vertical stress within the selected particle, AG run #4.
Fig. 16. Model of SAG test mill (run #11, small rocks with steel balls).
0.0E+00
2.0E+08
4.0E+08
6.0E+08
8.0E+08
1.0E+09
1.2E+09
0 4 8 10 12time (sec)
con
tact
pre
ssu
re (
Pa)
2 6
Fig. 17. Time history of average contact pressure between sampled rockparticle and steel balls for the case of SAG test mill (run #11).
0.0E+00
2.0E+08
4.0E+08
6.0E+08
8.0E+08
1.0E+09
1.2E+09
0 4 8 10 12time (sec)
con
tact
pre
ssu
re (
Pa)
2 6
Fig. 18. Time history of average contact pressure between sampled rockparticle and other rock particles for the case of SAG test mill (run #11).
1514 N. Djordjevic et al. / Minerals Engineering 19 (2006) 1505–1516
Fig. 22 shows a comparison which assumes a ‘‘no massloss’’ threshold of 5 N. This corresponds to the requiredrock/rock force to initiate damage between 40 mm particlesas shown in Fig. 20. The response is not linear as reportedby Morrison et al. (2006) for the autogenous tests – but thetrend is still clear.
0
50
100
150
200
250
300
0 100 200 300 400 500
applied force (N)
mea
n c
on
tact
str
ess
(Mp
a)rock-steel
rock-rock
Fig. 19. Induced contact stress as a function of applied force for rock/rock and rock/steel collisions.
0
5
10
15
20
25
30
0 0.02 0.04 0.06 0.08 0.1 0.12ball radius (m)
min
imu
m c
on
tact
fo
rce
req
uir
ed(N
)
rock-rock
rock-steel
Fig. 20. Minimum normal force required for onset of yielding as functionof impacting ball radius.
Table 3Properties of rock and steel used for these simulations
Rock Steel
Elastic modulus (GPa) 50 250Poisson ratio 0.25 0.3Yield strength of rock (MPa) 100
1
10
100
1000
0 0.02 0.04 0.06 0.08 0.1 0.12
ball radius (m)
norm
alis
ed v
alue
s
radius of curvaturevolume
Fig. 21. Normalised volume (of single ball) and equivalent radius ofcurvature of two contacting balls, as a function of the ball radius.
Modelled with force with threshold of 5N (AG run # 1)
0
0.2
0.4
0.6
0.8
0 10 15modelled cumulative slip energy (J/s)
Ob
serv
ed f
rag
men
tm
ass
(kg
)
5
Fig. 22. Observed mass loss, compared with modelled accumulated slipenergy for selected particles in the mill charge using a threshold collisionforce of 5 N.
Modelled with force threshold of500N (AG run #1)
0
0.2
0.4
0.6
0.8
0 10 15
modelled cumulative slip energy (J/s)
Ob
serv
ed f
rag
men
tm
ass
(kg
)
5
Fig. 23. Observed mass loss, compared with modelled accumulated slipenergy for selected particles in the mill charge using a threshold collisionforce of 500 N.
Modelled with force threshold of
500N (SAG run # 10)
0
0.2
0.4
0.6
0.8
0 10 15
modelled cumulative slip energy (J/s)
Ob
serv
ed f
rag
men
tm
ass
(kg
)
5
Fig. 24. Observed mass loss, compared with modelled accumulated slipenergy for selected particles in the mill charge, with a threshold of 500 Nfor a SAG test.
N. Djordjevic et al. / Minerals Engineering 19 (2006) 1505–1516 1515
Figs. 23 and 24 assume a ‘‘no mass loss’’ threshold of500 N which corresponds to the rock steel criteria for a‘‘very hard’’ 250 MPa rock. The response shows substantialscatter suggesting that this is not a very useful approach formodelling the SAG test and that a non-linear response isoccurring at higher impact energies.

1516 N. Djordjevic et al. / Minerals Engineering 19 (2006) 1505–1516
8. Conclusions
The results presented in this paper can be summarised asfollows: The DEM simulations suggest that the contactpressure between particles could be several times higherthan the compressive strength of the rocks, even aftertaking into account the scale effect of rock strength withsize. In the case of the AG mill, the increased contactarea associated with larger rocks, is more than compen-sated for by the much larger mass, with the result thatinduced forces and stresses are significantly higher. Thespatial distribution patterns of force application showmore regularity in the case of a mill charge composed oflarger rocks.
In the case of the SAG mill tests, as might be expected,the average contact pressure between rocks and steel ballsis higher than average contact pressure between rocks.The frequency of rock–steel contacts in cases investigatedis significantly lower than frequency of rock–rock contacts.This indicates than even within SAG mills, a large fractionof the communication occurs in AG mode.
Analytical modelling results suggested that the thresholdforce is required for onset of rock damages is a function ofthe properties of the impactor. A steel impactor can inducerock damage with a lower force than a rock impactor.
This analysis seems to support the common wisdom thatfor efficient AG mill operation, the presence of relativelylarge rocks is necessary. However, the pilot scale tests indi-cate that the large rocks of run #1 required 23.30 kWh togenerate a one tonne reduction in the charge, while run#4 (with small rocks) would require 32.32 kWh.
The experimental evidence suggests that more efficientsize reduction (of this type) in an AG mill will occur inthe case of larger particles.
The detailed comparisons of particle mass losses sug-gests that low energy (AG operation) can be well relatedto cumulative slip (or friction/abrasion), while the higherenergy (mostly SAG) particle mass losses increase rapidlyat higher collision energies, and cannot simply be accumu-lated to estimate mass losses.
Acknowledgement
The DEM modelling work reported in this paper hasbeen partially funded by the Centre for Sustainable Re-source Processing.
References
Cundall, P.A., Strack, O.D.L., 1979. A discrete numerical model forgranular assembleies. Geotechnique 29 (1), 47–65.
Hertz, H., 1882. On the contact of rigid elastic solids and on hardness.Verhandlungen des Vereins zur Beforderung des Gewerbefleisses 61,pp. 449–469. In: Miscellaneous Papers (D.E. Jones, G.A. SchottEnglish translation), MacMillan, London (1896), pp. 163–183.
Loveday, B.K., 2004. The use of fag and sag batch tests for measurementof abrasion rates of full-size rocks. Minerals Engineering 17 (11–12),1093–1098.
Loveday, B.K., Naidoo, D., 1997. Rock abrasion in autogenous milling.Minerals Engineering 10 (6), 603–612.
Mindlin, R.D., Deresiewicz, H., 1953. Elastic spheres in contact underoblique forces. Journal of Applied Mechanics 20, 327–344.
Morrison, R., Loveday, B., Djordjevic, N., Cleary, P., Owen, P., 2006.Linking Discrete Element Modelling to Breakage in a Pilot Scale AG/SAG Mill. In: Kawatra (Ed.), SME Annual Conference St. Louis.Published SME, pp. 495–512.
PFC3D Particle Flow Code in 3 Dimensions, 1999. Itasca ConsultingGroup Inc., Minneapolis, Minnesota.
Vu-Quoc, L., Zhang, X., Lesburg, L., 2000. Normal force-displacementmodel for contacting spheres accounting for plastic deformation:force-driven formulation. Journal of Applied Mechanics, TransactionsASME 67 (2), 363–371.


